運動對於改善有妊娠糖尿病的懷孕婦女及其胎兒結果的作用
Abstract
Background
Gestational diabetes mellitus (GDM) is associated with both short‐ and long‐term complications for the mother and her baby. Exercise interventions may be useful in helping with glycaemic control and improve maternal and infant outcomes.
The original review on Exercise for diabetic pregnant women has been split into two new review titles reflecting the role of exercise for pregnant women with gestational diabetes and for pregnant women with pre‐existing diabetes.
Exercise for pregnant women with gestational diabetes for improving maternal and fetal outcomes (this review)
Exercise for pregnant women with pre‐existing diabetes for improving maternal and fetal outcomes
Objectives
To evaluate the effects of exercise interventions for improving maternal and fetal outcomes in women with GDM.
Search methods
We searched the Cochrane Pregnancy and Childbirth Group's Trials Register (27 August 2016), ClinicalTrials.gov, the WHO International Clinical Trials Registry Platform (ICTRP) (18th August 2016), and reference lists of retrieved studies.
Selection criteria
We included randomised controlled trials (RCTs) comparing an exercise intervention with standard care or another intervention in pregnant women diagnosed with gestational diabetes. Quasi‐randomised and cross‐over studies, and studies including women with pre‐existing type 1 or type 2 diabetes were not eligible for inclusion.
Data collection and analysis
All selection of studies, assessment of trial quality and data extraction was conducted independently by two review authors. Data were checked for accuracy.
Main results
We included 11 randomised trials, involving 638 women. The overall risk of bias was judged to be unclear due to lack of methodological detail in the included studies.
For the mother, there was no clear evidence of a difference between women in the exercise group and those in the control group for the risk of pre‐eclampsia as the measure of hypertensive disorders of pregnancy (risk ratio (RR) 0.31, 95% confidence interval (CI) 0.01 to 7.09; two RCTs, 48 women; low‐quality evidence), birth by caesarean section (RR 0.86, 95% CI 0.63 to 1.16; five RCTs, 316 women; I2 = 0%; moderate‐quality evidence), the risk of induction of labour (RR 1.38, 95% CI 0.71 to 2.68; one RCT, 40 women; low‐quality evidence) or maternal body mass index at follow‐up (postnatal weight retention or return to pre‐pregnancy weight) (mean difference (MD) 0.11 kg/m2, 95% CI ‐1.04 to 1.26; three RCTs, 254 women; I2 = 0%; high‐quality evidence). Development of type 2 diabetes, perineal trauma/tearing and postnatal depression were not reported as outcomes in the included studies.
For the infant/child/adult, a single small (n = 19) trial reported no perinatal mortality (stillbirth and neonatal mortality) events in either the exercise intervention or control group (low‐quality evidence). There was no clear evidence of a difference between groups for a mortality and morbidity composite (variously defined by trials, e.g. perinatal or infant death, shoulder dystocia, bone fracture or nerve palsy) (RR 0.56, 95% CI 0.12 to 2.61; two RCTs, 169 infants; I2 = 0%; moderate‐quality evidence) or neonatal hypoglycaemia (RR 2.00, 95% CI 0.20 to 20.04; one RCT, 34 infants; low‐quality evidence). None of the included trials pre‐specified large‐for‐gestational age, adiposity (neonatal/infant, childhood or adulthood), diabetes (childhood or adulthood) or neurosensory disability (neonatal/infant) as trial outcomes.
Other maternal outcomes of interest: exercise interventions were associated with both reduced fasting blood glucose concentrations (average standardised mean difference (SMD) ‐0.59, 95% CI ‐1.07 to ‐0.11; four RCTs, 363 women; I2 = 73%; T2 = 0.19) and a reduced postprandial blood glucose concentration compared with control interventions (average SMD ‐0.85, 95% CI ‐1.15 to ‐0.55; three RCTs, 344 women; I2 = 34%; T2 = 0.03).
Authors' conclusions
Short‐ and long‐term outcomes of interest for this review were poorly reported. Current evidence is confounded by the large variety of exercise interventions. There was insufficient high‐quality evidence to be able to determine any differences between exercise and control groups for our outcomes of interest. For the woman, both fasting and postprandial blood glucose concentrations were reduced compared with the control groups. There are currently insufficient data for us to determine if there are also benefits for the infant. The quality of the evidence in this review ranged from high to low quality and the main reason for downgrading was for risk of bias and imprecision (wide CIs, low event rates and small sample size). Development of type 2 diabetes, perineal trauma/tearing, postnatal depression, large‐for‐gestational age, adiposity (neonate/infant, childhood or adulthood), diabetes (childhood or adulthood) or neurosensory disability (neonate/infant) were not reported as outcomes in the included studies.
Further research is required comparing different types of exercise interventions with control groups or with another exercise intervention that reports on both the short‐ and long‐term outcomes (for both the mother and infant/child) as listed in this review.
PICO
淺顯易懂的口語結論
運動是否可以改善患有妊娠糖尿病的母親和其胎兒的結果?
研究宗旨
先前Cochrane文獻有一篇關於糖尿病懷孕婦女的運動 ,納入了孕前已有糖尿病的婦女及妊娠期糖尿病的婦女。這篇文獻現在被分為兩個部分:一個是運動對於患有妊娠糖尿病婦女的作用(本篇),及運動對於妊娠糖尿病病人的作用(另一篇新的主題)。
這兩個系統性文獻回顧的背景,方法和結果有相似之處。
妊娠期糖尿病 (GDM),或孕期糖尿病,對母親和胎兒都有短期和長期的併發症。患有妊娠期糖尿病的婦女在孕期出現高血壓、子癲前症、引產、剖腹產及會陰部外傷的機率增高。長期來看,將近一半的妊娠期糖尿病女性可能會發展為第2型糖尿病。胎兒在出生時面臨的風險會更高,包括胎齡過大,分娩時受傷和被送入新生兒重症加護病房等。他們在童年及之後的生活中也很有可能會發展為代謝症候群。
此議題的重要性?
運動可能有助於控制血糖水平,並改善母親和嬰兒的結果,可能帶來長期健康益處。此文獻的身體活動是指為提高身體素質而進行的有計畫、有組織、重複性的身體運動。
找到哪些證據?
我們在2016年8月檢索了隨機對照試驗。我們納入了11個試驗,涉及638位妊娠孕婦。這些試驗都是在中等或高收入國家進行。由於缺乏有關試驗如何進行的信息,我們認為試驗中的總體偏差風險不明確。使用GRADE方法,試驗證據的質量從高到低不等。降低證據質量的主要原因是在試驗中存在偏差風險,效果量不精確,事件發生率低以及參與者人數少。
對於母親來說,運動似乎並不能降低妊娠期高血壓疾病中子癲前症的風險(兩項試驗,48名婦女,低質量的證據 ),不能降低剖腹產風險(五項試驗,316名婦女,中質量證據 ),不能降低引產的風險(一項試驗,40名婦女,低質量證據)。在運動組和對照組中,母親在追蹤調查時的身體質量指數(BMI)相似(三項試驗,254名婦女,高質量的證據)。運動與較低的空腹血糖水平(四項試驗)和餐後血糖水平有關(三項試驗),但不同試驗之間的效果量存在差異。各項試驗的運動項目不同,包括運動時間長短和是否有人監督也有所不同。納入的試驗均未報告會陰外傷,產後憂鬱症或發展為第2型糖尿病的情況。
對於嬰兒來說,在出生前後沒有發生死亡(一項試驗,19名嬰兒,低質量證據),也没有證據表明健康不良(兩項試驗,169名嬰兒,中等質量證據)或低血糖水平(一項試驗,34名嬰兒,低質量證據)的風險有任何差異。沒有一項試驗報告大於胎齡兒或在兒童期或成年後繼續發展為糖尿病或在兒童期變得明顯的神經感覺失能的數量。
這代表什麼意義?
儘管運動似乎可以降低空腹血糖水平和餐後血糖水平,但我們沒有發現妊娠期糖尿病孕婦和其他結果有任何差異。目前的證據不足以建議或反對婦女參加運動計劃。即使運動在懷孕期間沒有任何益處,這種生活方式的改變可能在產後仍會持續,並有可能助於預防第2型糖尿病及其長期併發症。患有妊娠期糖尿病的孕婦若想要進行運動,不妨與醫療專業人員討論其選擇。需要更進一步研究比較不同類型的運動介入之間的差異(或者和對照组比較),並且報告短期和長期的結果(母親和嬰兒/兒童/成人)。
Authors' conclusions
Summary of findings
| Exercise compared to control for pregnant women with gestational diabetes for improving maternal outcomes | ||||||
| Patient or population: pregnant women with gestational diabetes | ||||||
| Outcomes | Anticipated absolute effects* (95% CI) | Relative effect | № of participants | Quality of the evidence | Comments | |
| Risk with control | Risk with exercise | |||||
| Hypertensive disorders of pregnancy (pre‐eclampsia) | 43 per 1000 | 13 per 1000 | RR 0.31 | 48 | ⊕⊕⊝⊝ | Event rates were very low with 0/25 in the exercise group and 1/23 in the control group. No data were reported for pregnancy‐induced hypertension or eclampsia. |
| Caesarean section | 319 per 1000 | 274 per 1000 | RR 0.86 | 316 | ⊕⊕⊕⊝ | |
| Development of type 2 diabetes ‐ not measured | ‐ | ‐ | ‐ | ‐ | ‐ | This outcome was not measured in any of the included studies in this review. |
| Perineal trauma/tearing ‐ not measured | ‐ | ‐ | ‐ | ‐ | ‐ | This outcome was not measured in any of the included studies in this review. |
| Postnatal weight retention or return to pre‐pregnancy weight (maternal BMI (follow‐up) kg/m2) | The mean maternal BMI (follow‐up) kg/m2 was 0 | MD 0.11 higher | ‐ | 254 | ⊕⊕⊕⊕ | |
| Postnatal depression ‐ not measured | ‐ | ‐ | ‐ | ‐ | ‐ | This outcome was not measured in any of the included studies in this review. |
| Induction of labour | 400 per 1000 | 552 per 1000 | RR 1.38 | 40 | ⊕⊕⊝⊝ | Event rates and sample size were low 11/20 in exercise group and 8/20 in control group. |
| *The risk in the intervention group (and its 95% confidence interval) is based on the assumed risk in the comparison group and the relative effect of the intervention (and its 95% CI). | ||||||
| GRADE Working Group grades of evidence | ||||||
| 1 Lack of clarity for most items related to risk of bias ‐ downgraded one level. 2 Wide confidence intervals crossing the line of no effect and low event rates with a small sample size are suggestive of imprecision ‐ downgraded one level. 3 Imprecision ‐ low event rates and small sample size ‐ downgraded one level. | ||||||
| Exercise compared to control for pregnant women with gestational diabetes for improving maternal and fetal outcomes | ||||||
| Patient or population: pregnant women with gestational diabetes Setting: USA, Italy | ||||||
| Outcomes | Anticipated absolute effects* (95% CI) | Relative effect | № of participants | Quality of the evidence | Comments | |
| Risk with control | Risk with exercise | |||||
| Large‐for‐gestational age ‐ not reported | ‐ | ‐ | ‐ | ‐ | ‐ | None of the included studies in this review reported data for this outcome. |
| Perinatal mortality (stillbirth and neonatal mortality) | 0 per 1000 | 0 per 1000 | not estimable | 19 | ⊕⊕⊝⊝ | There were no events in either the exercise or the control group and the sample size in only 19 infants. |
| Mortality and morbidity composite (variously defined by trials, e.g. perinatal or infant death, shoulder dystocia, bone fracture or nerve palsy) | 65 per 1000 | 36 per 1000 | RR 0.56 | 169 | ⊕⊕⊕⊝ | Event rates and sample size were low with 2/61 in the exercise group and 7/108 in the control group. |
| Neonatal hypoglycaemia | 59 per 1000 | 118 per 1000 | RR 2.00 | 34 | ⊕⊕⊝⊝ | Event rates and sample size were low with 2/17 in the exercise group and 1/17 in the control group. |
| Adiposity ‐ not reported | ‐ | ‐ | ‐ | ‐ | ‐ | None of the included studies in this review reported data for this outcome at any life stage. |
| Diabetes (type 1, type 2) ‐ not reported | ‐ | ‐ | ‐ | ‐ | ‐ | None of the included studies in this review reported data for this outcome at any life stage. |
| Neurosensory disability | ‐ | ‐ | ‐ | ‐ | ‐ | None of the included studies in this review reported data for this outcome. |
| *The risk in the intervention group (and its 95% confidence interval) is based on the assumed risk in the comparison group and the relative effect of the intervention (and its 95% CI). | ||||||
| GRADE Working Group grades of evidence | ||||||
| 1 There is a lack of clarity for most items associated with risk of bias ‐ downgraded one level. 2 Imprecision ‐ There are no events in either group and the sample size is only 19 infants ‐ downgraded one level. 3 Imprecision ‐ wide confidence intervals and low event rates ‐ downgraded one level. | ||||||
Background
The original review by Ceysens and colleagues Exercise for diabetic pregnant women (Ceysens 2006) has been split into two new review titles reflecting the role of exercise for pregnant women with gestational diabetes and for pregnant women with pre‐existing diabetes.
Exercise for pregnant women with gestational diabetes for improving maternal and fetal outcomes (this review)
Exercise for pregnant women with pre‐existing diabetes for improving maternal and fetal outcomes
There will be similarities in the background, methods and outcomes between these two systematic reviews. Portions of the methods section of this review are based on a standard template used by the Cochrane Pregnancy and Childbirth Review Group.
Description of the condition
Gestational diabetes mellitus (GDM) is defined as "glucose intolerance or hyperglycaemia (high blood glucose concentration) with onset or first recognition during pregnancy" (WHO 1999) that usually resolves around the time of birth. Diagnosis is usually made following an oral glucose tolerance test (OGTT) although various definitions of glucose intolerance and subsequently classification of GDM exist (ACOG 2013; Coustan 2010; HAPO 2008; IADPSG 2010; NICE 2015). Recent definitions of GDM exclude overt diabetes which may be detected for the first time during pregnancy (IADPSG 2010; WHO 2014).
Rates of GDM are increasing globally, and up to one third of pregnancies are now thought to be affected (Cundy 2014; Duran 2014; Ferrara 2007; NICE 2015; Tran 2013). The incidence of GDM is likely to increase in parallel with increasing rates of maternal obesity and associated type 2 diabetes (Bottalico 2007; Petry 2010), and between different diagnostic criteria (Cundy 2014).
Non‐modifiable risk factors associated with an increased chance of being diagnosed with GDM include: having a previous macrosomic infant (birthweight 4000 g or more) or having been diagnosed with GDM in a previous pregnancy (Petry 2010); older maternal age (Chamberlain 2013), ethnicity (e.g. South Asian, Middle Eastern), high parity, or having a first‐degree relative with a history of type 2 diabetes or polycystic ovarian syndrome (Cypryk 2008; Petry 2010). Maternal overweight/obesity (Kim 2010), physically inactivity (Chasan‐Taber 2008) and excessive gestational weight gain (Hedderson 2010) are modifiable risk factors that are associated with an increased chance of being diagnosed with GDM.
Throughout pregnancy maternal metabolism is altered (Lain 2007). The first trimester is associated with an increase in insulin secretion that enhances maternal nutrient storage for later fetal growth. During this stage of early pregnancy insulin sensitivity is stable or may even increase. The physiological demands of later pregnancy means that insulin sensitivity gradually decreases (Barbour 2007), and as a result, the fetus is able to increase glucose uptake for fetal growth. In non‐diabetic women, normal blood glucose levels are maintained through a process of increasing insulin secretion (Barbour 2007; Lain 2007). Reductions in insulin signalling in women with GDM result in glucose intolerance, which promotes fetal glucose uptake (Barbour 2007).
Adverse outcomes for women associated with gestational diabetes
Women with GDM are at an increased chance of developing hypertensive disorders of pregnancy, having their labour induced (Crowther 2005; Landon 2009), giving birth by caesarean section (Landon 2009), and having perineal trauma (Jastrow 2010). In the long term, up to half of women with GDM are likely to proceed to be diagnosed with type 2 diabetes (Kim 2002).
Short‐ and long‐term adverse outcomes for the neonate associated with gestational diabetes
Infants of mothers diagnosed with GDM are at an increased risk of being born large‐for‐gestational age (LGA) or macrosomic (Crowther 2005; Landon 2009), have respiratory distress syndrome, neonatal hypoglycaemia, hyperbilirubinaemia and being admitted to the neonatal intensive care unit (Metzger 2008; Reece 2009). These infants are also more likely to have a birth injury, including shoulder dystocia, bone fractures and/or nerve palsy (Esakoff 2009; Henriksen 2008), are more likely to have increased adiposity (Catalano 2003; Pettitt 1985; Pettitt 1993), and are more likely to develop metabolic syndrome in childhood and later life (Guerrero‐Romero 2010; Harder 2009). These inter‐generational health problems remain an important issue for public health policy.
Description of the intervention
The American College of Sports Medicine defines physical activity as any bodily movement that is produced as a result of the contraction of skeletal muscle and defines exercise as physical activity comprising planned, structured and repetitive body movements which are undertaken to improve one or more components of physical fitness (ACSM 2014).
Physical activity in pregnancy (in non‐diabetic women) has been shown to be beneficial, has not been shown to be harmful to the fetus, and can potentially lead to long‐term health benefits for the mother (Nascimento 2012). Benefits observed include cardio‐respiratory fitness, prevention of stress urinary incontinence, prevention of lumbar pain, decreased depression and control of weight gain during pregnancy (Nascimento 2012).
In women with type 2 diabetes, who were not pregnant, physical activity combined with diet and hypoglycaemic medication has been shown to be effective in maintaining glycaemic control (Tuomilehto 2001).
This evidence may not be generalisable to pregnant women with GDM, but it does suggest that mild exercise during pregnancy may have the potential to reduce the risk of complications associated with GDM.
The American College of Obstetricians and Gynecologists (ACOG) notes that physical activity in pregnancy appears to have benefits for most women and has few risks associated with it, although some adaptation may be required due to usual anatomical and physiological changes in pregnancy (ACOG 2015). ACOG 2015 also recommends that a clinical evaluation is conducted prior to undertaking an exercise programme during pregnancy to ensure that there are no medical contraindications to participation and that participation in aerobic and strength‐conditioning exercises should be encouraged in women before, during and after uncomplicated pregnancies.
Aerobic exercise during pregnancy is contraindicated in a number of medical conditions, including:
-
cardiac disease;
-
restrictive lung disease;
-
incompetent cervix/cerclage;
-
multiple gestation at risk of preterm birth;
-
persistent second or third trimester bleeding;
-
placenta praevia after 26 weeks' gestation;
-
preterm labour (current pregnancy);
-
ruptured membranes;
-
pre‐eclampsia or pregnancy‐induced hypertension;
-
severe anaemia (ACOG 2015).
Safe physical activities that are considered acceptable to continue with or initiate during an uncomplicated pregnancy, following medical advice include:
-
walking;
-
swimming;
-
stationary cycling;
-
low‐impact aerobics;
-
modified yoga (avoiding positions that result in decreased venous return);
-
modified Pilates;
-
racquet sports;
-
running or jogging;
-
strength training (ACOG 2015).
The latter two activities in the list above should be undertaken following consultation with an obstetric care provider (ACOG 2015). During pregnancy the duration, frequency and intensity of physical activity may have to be modified (Nascimento 2012).
A number of activities are recommended to be avoided during pregnancy, including:
-
contact sports (e.g. ice hockey, soccer, boxing);
-
activities with a high risk of falling (e.g. skiing, surfing, off‐road cycling);
-
scuba diving;
-
sky diving;
-
'hot yoga' or 'hot Pilates' (ACOG 2015).
How the intervention might work
Glycaemic control may be improved in those with diabetes (type 1, type 2 or GDM) by the amount of physical activity as a result of the interaction between insulin sensitivity and uptake of glucose by skeletal muscle (Asano 2014). Skeletal muscles use a process of diffusion to take up glucose using a glucose transporter type 4 (GLUT4). Increases in insulin receptor substrate, insulin receptor and phosphatidylinositol 3‐kinase (Chibalin 2000; Dela 1993; Hjeltnes 1998) following regular physical activity are associated with improvements in insulin sensitivity.
Why it is important to do this review
Rates of GDM continue to increase globally (NICE 2015) and are associated with both short‐ (Crowther 2005; Landon 2009; Reece 2009) and long‐term (Guerrero‐Romero 2010; Harder 2009) adverse effects for the woman and her infant. Identifying interventions for improving health outcomes for women with GDM and their infants is a priority. Exercise has been shown to have benefits for women without GDM (Tuomilehto 2001); the benefits and safety for women with GDM remains unclear.
Objectives
To evaluate the effects of exercise interventions for improving maternal and fetal outcomes in women with gestational diabetes mellitus (GDM).
Methods
Criteria for considering studies for this review
Types of studies
We included published or unpublished randomised controlled trials in full‐text or abstract format. Cluster‐randomised trials were eligible for inclusion but none were identified. Quasi‐randomised and cross‐over trials were not eligible for inclusion. Conference abstracts were handled in the same way as full‐text publications.
Types of participants
Pregnant women diagnosed with gestational diabetes mellitus (GDM) (as defined by trialist).
Women with known pre‐gestational diabetes (type 1 or type 2 diabetes) were excluded as this will be covered in a different Cochrane review on Exercise for pregnant women with pre‐existing diabetes for improving maternal and fetal outcomes.
Types of interventions
We included any type of exercise programme (+/‐ standard care) targeted at women with GDM at any stage of pregnancy compared with 1) standard care or 2) another intervention.
Types of outcome measures
Primary outcomes
Mother
-
Hypertensive disorders of pregnancy (as reported by trialists, including pre‐eclampsia, pregnancy‐induced hypertension, eclampsia)
-
Caesarean section
-
Development of type 2 diabetes
Neonatal/infant
-
Large‐for‐gestational age (≥ 4 kg)
-
Perinatal mortality (stillbirth and neonatal mortality)
-
Mortality or morbidity composite (variously defined by trials, e.g. perinatal or infant death, shoulder dystocia, bone fracture or nerve palsy)
-
Neurosensory disability
Secondary outcomes
Mother
-
Use of additional pharmacotherapy
-
Maternal hypoglycaemia (as defined by trialists)
-
Glycaemic control during/end of treatment (as defined by trialists)
-
Weight gain in pregnancy
-
Adherence to the intervention
-
Induction of labour
-
Placental abruption
-
Postpartum haemorrhage (as defined by trialists)
-
Postpartum infection
-
Perineal trauma/tearing
-
Breastfeeding at discharge, six weeks postpartum, six months or longer
-
Maternal mortality
-
Sense of well‐being and quality of life
-
Behavioural changes associated with the intervention
-
Views of the intervention
-
Relevant biomarker changes associated with the intervention (including adiponectin, free fatty acids, triglycerides, high‐density lipoproteins, low‐density lipoproteins, insulin)
Long‐term maternal outcomes
-
Postnatal depression
-
Postnatal weight retention or return to pre‐pregnancy weight
-
Body mass index (BMI)
-
GDM in a subsequent pregnancy
-
Type 2 diabetes
-
Impaired glucose tolerance
-
Cardiovascular health (as defined by trialists, including blood pressure, hypertension, cardiovascular disease, metabolic syndrome)
Neonatal/infant
-
Stillbirth
-
Neonatal death
-
Macrosomia (greater than 4000 g; or as defined by individual study)
-
Small‐for‐gestational age (as defined by trialists)
-
Birth trauma (shoulder dystocia, bone fracture, nerve palsy)
-
Gestational age at birth
-
Preterm birth (< 37 weeks’ gestation; and < 32 weeks' gestation)
-
Five‐minute Apgar < seven
-
Birthweight and z score
-
Head circumference and z score
-
Length and z score
-
Ponderal index
-
Adiposity (including skinfold thickness measurements (mm), fat mass)
-
Neonatal hypoglycaemia (as defined by trialists)
-
Respiratory distress syndrome
-
Neonatal jaundice (hyperbilirubinaemia) (as defined by trialists)
-
Hypocalcaemia (as defined by trialists)
-
Polycythaemia (as defined by trialists)
-
Relevant biomarker changes associated with the intervention (including insulin, cord c‐peptide)
Later infant and childhood secondary outcomes
-
Weight and z scores
-
Height and z scores
-
Head circumference and z scores
-
Adiposity (including BMI, skinfold thickness, fat mass)
-
Educational attainment
-
Blood pressure
-
Type I diabetes
-
Type 2 diabetes
-
Impaired glucose tolerance
-
Dyslipidaemia or metabolic syndrome
Child as an adult
-
Weight
-
Height
-
Adiposity (including BMI, skinfold thickness)
-
Cardiovascular health (as defined by trialists, including blood pressure, hypertension, cardiovascular disease, metabolic syndrome)
-
Employment, education and social status/achievement
-
Type 1 diabetes
-
Type 2 diabetes
-
Impaired glucose tolerance
Health service use
-
Number of antenatal visits or admissions
-
Number of hospital or health professional visits (including midwife, obstetrician, physician, dietician, diabetic nurse)
-
Admission to neonatal intensive care unit/nursery
-
Cost of maternal care
-
Cost of offspring care
-
Costs associated with the intervention
-
Costs to families associated with the management provided
-
Cost of dietary monitoring (e.g. diet journals, dietician, nurse visits, etc)
-
Costs to families ‐ change of diet, extra antenatal visits
-
Extra use of healthcare services (consultations, blood glucose monitoring, length and number of antenatal visits)
-
Women’s view of treatment advice
-
Duration of stay in neonatal intensive care unit or special care baby unit
-
Duration of maternal and neonatal hospital stay (antenatal, neonatal, postnatal)
Search methods for identification of studies
The following methods section of this review is based on a standard template used by Cochrane Pregnancy and Childbirth.
Electronic searches
We searched the Cochrane Pregnancy and Childbirth Group’s Trials Register by contacting their Information Specialist (27 August 2016).
The Register is a database containing over 23,000 reports of controlled trials in the field of pregnancy and childbirth. For full search methods used to populate Pregnancy and Childbirth’s Trials Register including the detailed search strategies for CENTRAL, MEDLINE, Embase and CINAHL; the list of handsearched journals and conference proceedings, and the list of journals reviewed via the current awareness service, please follow this link to the editorial information about the Cochrane Pregnancy and Childbirth in the Cochrane Library and select the ‘Specialized Register ’ section from the options on the left side of the screen.
Briefly, the Cochrane Pregnancy and Childbirth’s Trials Register is maintained by their Information Specialist and contains trials identified from:
-
monthly searches of the Cochrane Central Register of Controlled Trials (CENTRAL);
-
weekly searches of MEDLINE (Ovid);
-
weekly searches of Embase (Ovid);
-
monthly searches of CINAHL (EBSCO);
-
handsearches of 30 journals and the proceedings of major conferences;
-
weekly current awareness alerts for a further 44 journals plus monthly BioMed Central email alerts.
Search results are screened by two people and the full text of all relevant trial reports identified through the searching activities described above is reviewed. Based on the intervention described, each trial report is assigned a number that corresponds to a specific Pregnancy and Childbirth review topic (or topics), and is then added to the Register. The Information Specialist searches the Register for each review using this topic number rather than keywords. This results in a more specific search set which has been fully accounted for in the relevant review sections (Included studies; Excluded studies; Studies awaiting classification; Ongoing studies).
In addition, we searched ClinicalTrials.gov and the WHO International Clinical Trials Registry Platform (ICTRP) (18th August 2016) for unpublished, planned and ongoing trial reports. The search terms we used are given in Appendix 1.
Searching other resources
We searched the reference lists of retrieved studies. We did not apply any language or date restrictions.
Data collection and analysis
The following methods section of this review is based on a standard template used by Cochrane Pregnancy and Childbirth.
Selection of studies
Two review authors independently assessed for inclusion all the potential studies we identified as a result of the search strategy. We resolved any disagreement through discussion or, if required, we consulted a third person.
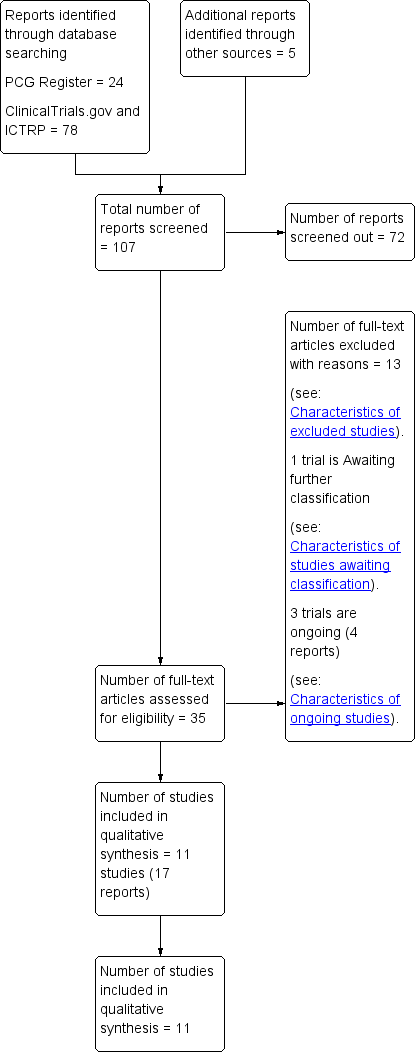
We created a study flow diagram to map out the number of records identified, included and excluded (Figure 1).

Study flow diagram.
Data extraction and management
We designed a form to extract data. For eligible studies, two review authors extracted the data using the agreed form. We resolved discrepancies through discussion or, if required, we consulted a third person. We entered data into Review Manager software (RevMan 2014) and checked for accuracy. When information regarding any of the above was unclear, we attempted to contact authors of the original reports to provide further details.
Assessment of risk of bias in included studies
Two review authors independently assessed risk of bias for each study using the criteria outlined in the Cochrane Handbook for Systematic Reviews of Interventions (Higgins 2011). We resolved any disagreement by discussion or by involving a third person.
The following sections refer to individually‐randomised trials.
(1) Random sequence generation (checking for possible selection bias)
We described for each included study the method used to generate the allocation sequence in sufficient detail to allow an assessment of whether it should produce comparable groups.
We assessed the method as:
-
low risk of bias (any truly random process, e.g. random number table; computer random number generator);
-
high risk of bias (any non‐random process, e.g. odd or even date of birth; hospital or clinic record number);
-
unclear risk of bias.
(2) Allocation concealment (checking for possible selection bias)
We described for each included study the method used to conceal allocation to interventions prior to assignment and assessed whether intervention allocation could have been foreseen in advance of, or during recruitment, or changed after assignment.
We assessed the methods as:
-
low risk of bias (e.g. telephone or central randomisation; consecutively numbered sealed opaque envelopes);
-
high risk of bias (open random allocation; unsealed or non‐opaque envelopes, alternation; date of birth);
-
unclear risk of bias.
(3.1) Blinding of participants and personnel (checking for possible performance bias)
We described for each included study the methods used, if any, to blind study participants and personnel from knowledge of which intervention a participant received. We considered that studies were at low risk of bias if they were blinded, or if we judged that the lack of blinding would be unlikely to affect results. We assessed blinding separately for different outcomes or classes of outcomes.
We assessed the methods as:
-
low, high or unclear risk of bias for participants;
-
low, high or unclear risk of bias for personnel.
(3.2) Blinding of outcome assessment (checking for possible detection bias)
We described for each included study the methods used, if any, to blind outcome assessors from knowledge of which intervention a participant received. We assessed blinding separately for different outcomes or classes of outcomes.
We assessed the methods used to blind outcome assessment as:
-
low, high or unclear risk of bias.
(4) Incomplete outcome data (checking for possible attrition bias due to the amount, nature and handling of incomplete outcome data)
We described for each included study, and for each outcome or class of outcomes, the completeness of data including attrition and exclusions from the analysis. We stated whether attrition and exclusions were reported and the numbers included in the analysis at each stage (compared with the total randomised participants), reasons for attrition or exclusion where reported, and whether missing data were balanced across groups or were related to outcomes. Where sufficient information was reported, or could be supplied by the trial authors, we re‐included missing data in the analyses.
We assessed the methods as:
-
low risk of bias (e.g. no missing outcome data; missing outcome data balanced across groups);
-
high risk of bias (e.g. numbers or reasons for missing data imbalanced across groups; ‘as treated’ analysis done with substantial departure of intervention received from that assigned at randomisation);
-
unclear risk of bias.
(5) Selective reporting (checking for reporting bias)
We described for each included study how we investigated the possibility of selective outcome reporting bias and what we found.
We assessed the methods as:
-
low risk of bias (where it is clear that all of the study’s pre‐specified outcomes and all expected outcomes of interest to the review have been reported);
-
high risk of bias (where not all the study’s pre‐specified outcomes have been reported; one or more reported primary outcomes were not pre‐specified; outcomes of interest were reported incompletely and so cannot be used; study fails to include results of a key outcome that would have been expected to have been reported);
-
unclear risk of bias.
(6) Other bias (checking for bias due to problems not covered by (1) to (5) above)
We described for each included study any important concerns we have about other possible sources of bias.
We assessed whether each study was free of other problems that could put it at risk of bias:
-
low risk of other bias;
-
high risk of other bias;
-
unclear whether there is risk of other bias.
(7) Overall risk of bias
We made explicit judgements about whether studies were at high risk of bias, according to the criteria given in the Handbook (Higgins 2011). With reference to (1) to (6) above, we assessed the likely magnitude and direction of the bias and whether we considered it is likely to impact on the findings. We explored the impact of the level of bias through undertaking sensitivity analyses ‐ seeSensitivity analysis.
Assessment of the quality of the evidence using the GRADE approach
We assessed the quality of the evidence using the GRADE approach as outlined in the GRADE handbook in order to assess the quality of the body of evidence relating to the following outcomes for the mother and for the infant for the main comparisons of 1) exercise versus standard care and 2) exercise versus another intervention.
Maternal
-
Hypertensive disorders of pregnancy (as reported by trialists, including pre‐eclampsia, pregnancy‐induced hypertension, eclampsia)
-
Caesarean section
-
Development of type 2 diabetes
-
Perineal trauma/tearing
-
Postnatal weight retention or return to pre‐pregnancy weight
-
Postnatal depression
-
Induction of labour
Child (as a fetus, neonate, child, adult)
-
Large‐for‐gestational age
-
Perinatal mortality (stillbirth and neonatal mortality)
-
Mortality and morbidity composite (variously defined by trials, e.g. perinatal or infant death, shoulder dystocia, bone fracture or nerve palsy)
-
Neonatal hypoglycaemia
-
Adiposity*
-
Diabetes (type 1, type 2)*
-
Neurosensory disability
We used the GRADEpro Guideline Development Tool to import data from Review Manager 5.3 (RevMan 2014) in order to create 'Summary of findings’ tables. A summary of the intervention effect and a measure of quality for each of the above outcomes was produced using the GRADE approach. The GRADE approach uses five considerations (study limitations, consistency of effect, imprecision, indirectness and publication bias) to assess the quality of the body of evidence for each outcome. The evidence can be downgraded from 'high quality' by one level for serious (or by two levels for very serious) limitations, depending on assessments for risk of bias, indirectness of evidence, serious inconsistency, imprecision of effect estimates or potential publication bias.
*These outcomes will be reported for each stage of life where data are reported.
Measures of treatment effect
Dichotomous data
For dichotomous data, we presented results as summary risk ratio with 95% confidence intervals.
Continuous data
For continuous data, we used the mean difference if outcomes were measured in the same way between trials. We used the standardised mean difference (SMD) to combine trials that measured the same outcome, but used different methods.
Unit of analysis issues
Cluster‐randomised trials
We did not identify any cluster‐randomised trials for inclusion in this review. In future updates, if cluster‐randomised trials are identified we will include them in the analyses along with individually‐randomised trials. We will make adjustments using the methods described in the Handbook [Section 16.3.4 or 16.3.6] using an estimate of the intra‐cluster correlation co‐efficient (ICC) derived from the trial (if possible), from a similar trial or from a study of a similar population. If we use ICCs from other sources, we will report this and conduct sensitivity analyses to investigate the effect of variation in the ICC. We will consider it reasonable to combine the results from both cluster‐randomised trials and individually‐randomised trials if there is little heterogeneity between the study designs and the interaction between the effect of intervention and the choice of randomisation unit is considered to be unlikely. If cluster‐randomised trials are included, we will seek statistical advice on appropriate analysis to enable inclusion of data in the meta‐analyses.
Other unit of analysis issues
Multiple pregnancy
There may be unit of analysis issues that arise when the women randomised have a multiple pregnancy. We presented maternal data as per woman randomised and neonatal data per infant.
Multiple‐arm studies
We identified one trial with multiple intervention arms (Bo 2014). We split the 'shared' group into two or more groups with smaller sample size and include two or more (reasonably independent) comparisons.
Dealing with missing data
For included studies, we noted levels of attrition. We explored the impact of including studies with high levels of missing data in the overall assessment of treatment effect by using sensitivity analysis.
For all outcomes, we carried out analyses, as far as possible, on an intention‐to‐treat basis, i.e. we attempted to include all participants randomised to each group in the analyses, and all participants were analysed in the group to which they were allocated, regardless of whether or not they received the allocated intervention. The denominator for each outcome in each trial was the number randomised minus any participants whose outcomes are known to be missing.
Assessment of heterogeneity
We assessed statistical heterogeneity in each meta‐analysis using the Tau², I² and Chi² statistics. We regarded heterogeneity as substantial if an I² was greater than 30% and either the Tau² was greater than zero, or there was a low P value (less than 0.10) in the Chi² test for heterogeneity.
Assessment of reporting biases
In future updates, if there are 10 or more studies in the meta‐analysis, we will investigate reporting biases (such as publication bias) using funnel plots. We will assess funnel plot asymmetry visually. If asymmetry is suggested by a visual assessment, we will perform exploratory analyses to investigate it.
Data synthesis
We carried out statistical analysis using the Review Manager software (RevMan 2014). We used fixed‐effect meta‐analysis for combining data where it was reasonable to assume that studies were estimating the same underlying treatment effect: i.e. where trials were examining the same intervention, and the trials’ populations and methods were judged sufficiently similar. If there was clinical heterogeneity sufficient to expect that the underlying treatment effects differed between trials, or if substantial statistical heterogeneity was detected, we used random‐effects meta‐analysis to produce an overall summary, if an average treatment effect across trials was considered clinically meaningful. The random‐effects summary was treated as the average of the range of possible treatment effects and we discussed the clinical implications of treatment effects differing between trials. If the average treatment effect was not clinically meaningful, we did not combine trials.
Where we used random‐effects analyses, the results were presented as the average treatment effect with 95% confidence intervals, and the estimates of Tau² and I².
Subgroup analysis and investigation of heterogeneity
Had we identified substantial heterogeneity, we planned to investigate it using subgroup analyses and sensitivity analyses. We considered whether an overall summary was meaningful, and if it was, used random‐effects analysis to produce it.
We planned to carry out the following subgroup analyses.
-
Group exercise versus individual exercise.
-
Low‐level exercise (cumulative duration of exercise at 50% VO2max (maximal oxygen consumption) of less than 180 minutes) versus high‐level exercise (cumulative duration of exercise at 50% VO2max of more than 180 minutes) intensity exercise.
The following outcomes were planned to be used in subgroup analysis where there were sufficient data.
Maternal outcomes
-
Hypertensive disorders of pregnancy (as reported by trialists, including pre‐eclampsia, pregnancy‐induced hypertension, eclampsia)
-
Caesarean section
-
Development of type 2 diabetes
Neonatal outcomes
-
Large‐for‐gestational age
-
Perinatal mortality (stillbirth and neonatal mortality)
-
Mortality or morbidity composite (variously defined by trials, e.g. perinatal or infant death, shoulder dystocia, bone fracture or nerve palsy)
-
Neurosensory disability
We were unable to conduct these subgroup analyses in the current review due to insufficient data. If sufficient data are included in future updates of this review, we will assess subgroup differences by interaction tests available within RevMan (RevMan 2014). We will report the results of subgroup analyses quoting the Chi2 statistic and P value, and the interaction test I² value.
Sensitivity analysis
If there was evidence of significant heterogeneity, we planned to explore this by using the quality of the included trials for the primary outcomes. We planned to compare trials that had low risk of bias for allocation concealment with those judged to be of unclear or high risk of bias, and to exclude conference abstracts from the meta‐analysis.
We also planned to investigate the effect of the randomisation unit (i.e. where we include cluster‐randomised trials along with individually‐randomised trials) but no cluster‐randomised trials were identified.
As there was no statistical heterogeneity observed for the primary outcomes of this review, we did not conduct any sensitivity analyses.
Results
Description of studies
Results of the search
The search of the Cochrane Pregnancy and Childbirth Group’s Trials Register retrieved 24 records, we found 78 records in ClinicalTrials.gov and the WHO International Clinical Trials Registry Platform (ICTRP) and also five potential studies from other sources. See: Figure 1.
We included 11 trials (17 reports) (Adam 2014; Avery 1997; Bambicini 2012; Bo 2014; Brankston 2004; Bung 1991; de Barros 2010; Halse 2014; Jovanovic‐Peterson 1989; Ramos 2015; Youngwanichsetha 2014) (Characteristics of included studies). One study is awaiting classification (Frias 2012) (Characteristics of studies awaiting classification). There are three ongoing studies (da Silva 2013; Kokic 2014; Shaw 2005).
Included studies
We included 11 trials (Adam 2014; Avery 1997; Bambicini 2012; Bo 2014; Brankston 2004; Bung 1991; de Barros 2010; Halse 2014; Jovanovic‐Peterson 1989; Ramos 2015; Youngwanichsetha 2014).
Design
All of the included trials were parallel randomised controlled trials (RCTs).
Sample sizes
Sample sizes ranged from a minimum of six women (Ramos 2015) to a maximum of 180 women (Youngwanichsetha 2014). Only the Youngwanichsetha 2014 trial had a sample size of more than 100 women.
Setting
All trials were conducted in middle‐ or high‐income countries. Three trials were conducted in the USA (Avery 1997; Bung 1991; Jovanovic‐Peterson 1989) and in Brazil (Bambicini 2012; de Barros 2010; Ramos 2015), two trials in Canada (Adam 2014; Brankston 2004), and one trial each in Italy (Bo 2014), Australia (Halse 2014) and Thailand (Youngwanichsetha 2014). One trial was conducted in the 1990s (Bung 1991) and two trials in the 2000s (Bo 2014; de Barros 2010). For the remaining trials (Adam 2014; Avery 1997; Bambicini 2012; Brankston 2004; Halse 2014; Jovanovic‐Peterson 1989; Ramos 2015; Youngwanichsetha 2014), no details were provided regarding timing of the trial.
Participants
All trials recruited pregnant women with a diagnosis of gestational diabetes mellitus (GDM).
Interventions and comparisons
The exercise interventions and comparisons were very varied and included the following.
-
A supervised, individualised follow‐up with a kinesiologist versus standard counselling for physical activity (Adam 2014).
-
Exercise using a cycle ergometer for 30 minutes duration, three to four times per week including both supervised and unsupervised sessions versus standard care with no additional exercise programme (Avery 1997). No details on the duration of the programme.
-
Aerobic activity (30 minutes brisk walking) or resistance exercises (30‐minutes circuit workout with elastic‐band exercises) versus a control group who remained seated for 30 minutes listening to explanations about Shantala exercises for the baby (Bambicini 2012).
-
All women were given an individually‐prescribed diet (carbohydrates 48% to 50%, proteins 18% to 20%, fats 30% to 35%, fibre 20% to 25 g/day, no alcohol). Women in the exercise intervention group were advised to walk briskly at least 20 minutes/day. Women in the behaviour group were given individual oral/written recommendations for helping with healthy dietary choices (i.e. lowering carbohydrate intake, strategies for out‐of‐home eating, healthy cooking and food shopping and related behavioural suggestions), and debunking false myths about diet in pregnancy and women in the control group who were given individually‐prescribed dietary recommendations only (n = 50) (Bo 2014). This study also included a combined behaviour and exercise group that was not included in this review.
-
The intervention group undertook a progressive physical conditioning program involving three supervised introductory sessions, and weekly contact with supervisor. Women were instructed to perform resistance training circuit‐type exercises three times per week. Women were instructed to exercise at a level that felt “somewhat hard”, and were taught to monitor their heart rate to ensure that it did not rise above 140 beats/min during exercise. All exercise sessions were recorded in a log book (n = 16). The control group received standard diabetic diet advice: 40% carbohydrate, 20% protein, 40% fat, calculated at 24 kcal/kg to 30 kcal/kg per day on the basis of the woman’s ideal pre‐pregnant body weight. Women were asked not to begin a structured exercise program for the remainder of the pregnancy (Brankston 2004).
-
The intervention group was provided with dietary advice and instructed to conduct a non‐sedentary lifestyle, and attend the exercise laboratory three times a week to exercise under medical supervision. Exercise was 45 minutes with two, five‐minute breaks, on a recumbent bicycle, at 50% of their last determined maximum aerobic capacity (classed as moderate exercise) versus standard care insulin therapy and diet (Bung 1991).
-
All women received dietary advice from a nutritionist. The program consisted of a circuit of eight resistance training exercises using an elastic band to work the main muscle groups (chest, back, biceps, triceps, deltoid, quadriceps, thigh and calf muscles). Women were instructed to perform 15 repetitions of each exercise three times a week (once a week under supervision in the clinic, and twice a week at home) from recruitment (between 24 and 34 weeks) until the end of gestation. Women were instructed to exercise at a "somewhat heavy" intensity. Women were contacted by telephone at least once a week to verify adherence to the program (n = 32). The control group received usual care, and were questioned as to whether they had started some type of physical activity (N = 32) (de Barros 2010).
-
In addition to usual care, the intervention group took part in five sessions per week of a home‐based exercise program (three supervised and two unsupervised) on an upright stationary cycle ergometer (continuous moderate intensity cycling, with intervals of varying intensity consisting of 15 to 60 seconds of higher intensity bouts every two minutes, interspersed with lower‐intensity recovery pedalling in between, tailored to a percentage of the woman's age‐predicted maximum heart rate). The intervention commenced at recruitment (between 26 and 30 weeks' gestation) until 34 weeks of gestation (n = 20). The comparison group had usual care (n = 20), which consisted of assessment of glycaemic control and counselling by a diabetes educator and dietician, and self‐monitoring of fasting and 120‐minute postprandial glucose levels (n = 20) (Halse 2014).
-
In addition to usual care, women in the intervention group participated in a six‐week exercise program that consisted of 20 minutes of supervised aerobic training on an arm ergometer, sufficient to maintain target heart rate in a training range (n = 10). The control group was managed with a standard diet consisting of 40% carbohydrate, 20% protein, and 40% fat calculated at 24 kcal/kg to 30 kcal/kg/24 hours of present pregnant weight, divided into three meals and three snacks. Women in the control group did not participate in any structured exercise program (n = 9) (Jovanovic‐Peterson 1989).
-
A 10‐week program of regular aerobic exercise of three 50‐minute sessions per week (no further details) (n = 2), versus 10 weeks of a 50‐minute stretching and relaxation session once a week (n = 4) (Ramos 2015).
-
Training in mindfulness eating, and yoga exercise in two 50‐minute sessions. Participants were provided with manuals and encouraged to continue mindfulness eating and yoga exercise at home five times a week for eight weeks (n = 90) versus standard diabetes care (n = 90) (Youngwanichsetha 2014).
Outcomes
Two trials reported hypertensive disorders of pregnancy (pre‐eclampsia) ‐ Avery 1997; Jovanovic‐Peterson 1989.
Five trials reported caesarean section ‐ Avery 1997; Bo 2014; Bung 1991; de Barros 2010; Halse 2014.
One trial reported perinatal mortality (stillbirth and neonatal mortality) ‐ Jovanovic‐Peterson 1989.
Two trials reported a mortality or morbidity composite ‐ Bo 2014; Jovanovic‐Peterson 1989.
Seven trials reported the use of additional pharmacotherapy ‐ Adam 2014; Avery 1997; Bo 2014; Brankston 2004; de Barros 2010; Halse 2014; Jovanovic‐Peterson 1989.
One trial reported maternal hypoglycaemia ‐ Bung 1991.
Five trials reported glycaemic control during/end of treatment ‐ Bo 2014; Bung 1991; Brankston 2004; Jovanovic‐Peterson 1989; Youngwanichsetha 2014.
Three trials reported weight gain in pregnancy ‐ Adam 2014; de Barros 2010; Halse 2014.
One trial reported adherence to the intervention ‐ Jovanovic‐Peterson 1989.
One trial reported induction of labour ‐ Halse 2014.
Two trials reported maternal mortality ‐ Avery 1997; Jovanovic‐Peterson 1989.
One trial reported on views of the intervention ‐ Halse 2014.
Three trials reported postnatal weight retention or return to pre‐pregnancy weight (maternal BMI at follow‐up) ‐ Bo 2014; de Barros 2010; Halse 2014.
One trial reported stillbirth ‐ Avery 1997.
Five trials reported macrosomia ‐ Avery 1997; Bo 2014; Bung 1991; de Barros 2010; Jovanovic‐Peterson 1989.
Four trials reported gestational age at birth ‐ Avery 1997; Bung 1991; de Barros 2010; Halse 2014.
Five trials reported preterm birth ‐ Avery 1997; Bo 2014; de Barros 2010; Halse 2014; Jovanovic‐Peterson 1989.
One trial reported five‐minute Apgar < seven ‐ Bung 1991.
Six trials reported birthweight ‐ Avery 1997; Bung 1991; de Barros 2010; Halse 2014; Jovanovic‐Peterson 1989; Ramos 2015.
One trial reported length at birth ‐ Bung 1991.
One trial reported neonatal hypoglycaemia ‐ Bung 1991.
One trial reported respiratory distress syndrome ‐ Bung 1991.
One trial reported hyperbilirubinaemia ‐ Bung 1991.
One trial reported hypocalcaemia ‐ Bung 1991.
No data were reported in the included trials for any of the other pre‐specified outcomes for this review listed below.
For the mother: placental abruption, postpartum haemorrhage, postpartum infection, perineal trauma/tearing, breastfeeding at discharge, six weeks postpartum, six months or longer, sense of well‐being and quality of life, behavioural changes associated with the intervention, relevant biomarker changes associated with the intervention, postnatal depression, postnatal weight retention or return to pre‐pregnancy weight, BMI, GDM in a subsequent pregnancy, type 2 diabetes, impaired glucose tolerance, cardiovascular health.
For the infant: neurosensory disability, small‐for‐gestational age, birth trauma (shoulder dystocia, bone fracture, nerve palsy), birthweight z score, head circumference and z score, length and z score, ponderal index, neonatal adiposity, polycythaemia, relevant biomarker changes associated with the intervention, childhood weight and z scores, height and z scores, head circumference and z scores, adiposity, educational attainment, blood pressure, type 1 diabetes, type 2 diabetes, impaired glucose tolerance, dyslipidaemia or metabolic syndrome.
For the child as an adult: weight, height, adiposity, cardiovascular health, employment, education and social status/achievement, type 1 diabetes, type 2 diabetes, impaired glucose tolerance.
Health service outcomes: number of antenatal visits or admissions, number of hospital or health professional visits, admission to neonatal intensive care unit/nursery, cost of maternal care, cost of offspring care, costs associated with the intervention, costs to families associated with the management provided, cost of dietary monitoring, costs to families, extra use of healthcare services, women’s view of treatment advice, duration of stay in neonatal intensive care unit or special care baby unit and duration of maternal and neonatal hospital stay.
Declarations of interest in the trial reports
Four publications clearly stated that there were no conflicts of interest (Adam 2014; Bo 2014; Halse 2014; Ramos 2015). Seven publications did not provide details on conflicts of interest (Avery 1997; Bambicini 2012; Brankston 2004; Bung 1991; de Barros 2010; Jovanovic‐Peterson 1989; Youngwanichsetha 2014).
Sources of trial funding
Three publications declared funding sources, none of which were associated with the pharmaceutical industry (Bo 2014; de Barros 2010; Halse 2014). One trial (Avery 1997) reported funding sources from multiple sources (academic, governmental and other) that also included funding from Boehringer Manheim Corporation. The type of funding from Boehringer Manheim Corporation was unclear. No details on sources of funding were provided by seven publications (Adam 2014; Bambicini 2012; Brankston 2004; Bung 1991; Jovanovic‐Peterson 1989; Ramos 2015; Youngwanichsetha 2014).
Excluded studies
Thirteen studies were excluded (Characteristics of excluded studies). Seven trials were excluded due to ineligible population (Barakat 2013; Chen 1997; Deshpande 2013; Fieril 2015; Melo 2008; Nobles 2015; Ong 2009). Five trials were of an ineligible trial design (Ehrlich 2016; Garcia‐Patterson 2001; Lesser 1996; Moholdt 2013; Yin 2014), and in one trial (Berry 2013), the intervention was ineligible.
Studies awaiting classification
One study remains in Characteristics of studies awaiting classification (Frias 2012). ClinicalTrials.gov stated this trial has been terminated due to recruitment issues. We will attempt to contact the responsible party for further information.
Risk of bias in included studies
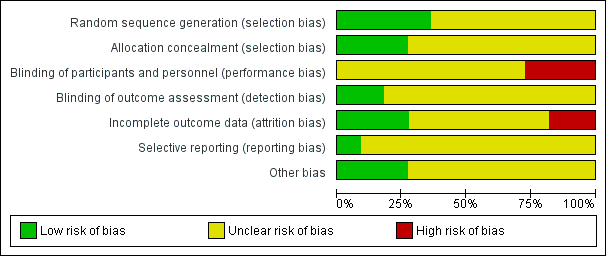
'Risk of bias' graph: review authors' judgements about each risk of bias item presented as percentages across all included studies.

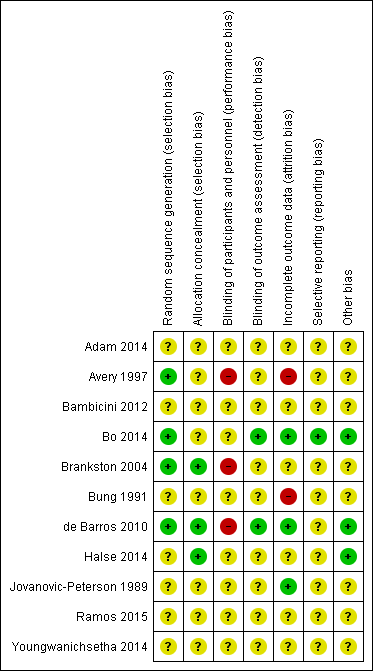
'Risk of bias' summary: review authors' judgements about each risk of bias item for each included study.
Allocation
Random sequence generation
Four trials were judged to be of low risk of bias. Avery 1997, Bo 2014, Brankston 2004 and de Barros 2010 reported using computer‐generated random number tables.
Seven trials were judged as unclear risk of bias due to lack of methodological details (Adam 2014; Bambicini 2012; Bung 1991; Halse 2014; Jovanovic‐Peterson 1989; Ramos 2015; Youngwanichsetha 2014).
Allocation concealment
Three trials were judged to be of low risk of bias. Brankston 2004, de Barros 2010 and Halse 2014 reported using sequentially numbered, opaque envelopes.
Eight trials were judged as unclear risk of bias due to lack of methodological details (Adam 2014; Avery 1997; Bambicini 2012; Bo 2014;Bung 1991; Jovanovic‐Peterson 1989; Ramos 2015; Youngwanichsetha 2014).
Blinding
Performance bias
Eight trials were judged as unclear risk of bias due to lack of methodological details (Adam 2014; Bambicini 2012; Bo 2014; Bung 1991; Halse 2014; Jovanovic‐Peterson 1989; Ramos 2015; Youngwanichsetha 2014). Bo 2014 reported that women were not blinded but dieticians and obstetricians who reported maternal/neonatal complications, and the laboratory personnel were blinded to the group assignment.
Three trials were judged as high risk of bias as they stated that the participants were not blinded (Avery 1997; Brankston 2004; de Barros 2010).
Detection bias
Two trials were judged to be of low risk of bias. Bo 2014 reported that outcome assessors including dietitians, obstetricians and laboratory personnel were blinded to allocation. de Barros 2010 also stated that obstetricians recording data were blinded to group allocation.
Nine trials were judged as unclear risk of bias due to lack of methodological details (Adam 2014; Avery 1997; Bambicini 2012; Brankston 2004; Bung 1991; Halse 2014; Jovanovic‐Peterson 1989; Ramos 2015; Youngwanichsetha 2014).
Incomplete outcome data
Three trials were judged to be of low risk of bias. Bo 2014, de Barros 2010, and Jovanovic‐Peterson 1989 reported that all women were analysed.
Five trials were judged as unclear risk of bias due to lack of methodological detail (Adam 2014; Bambicini 2012; Halse 2014; Ramos 2015; Youngwanichsetha 2014). Brankston 2004 was judged to be of unclear risk of bias as they had data missing for some women who did not record blood glucose concentrations.
Two trials were judged to be high risk of bias. Avery 1997 reported that “several subjects gave birth before the follow‐up exercise test”, however the number of women included in the measures at the end is unclear and home blood glucose levels were reported for 10/15 women in the exercise group, and 12/14 women in the control group. It is unclear why the other women are missing. Seven of 41 women in the Bung 1991 were not analysed and some of these may be attributed to the intervention.
Selective reporting
One trial was judged to be of low risk of bias. Bo 2014 had a trial protocol available and all pre‐specified outcomes were reported with the exception of birthweight.
Ten trials were judged as unclear risk of bias. Three due to the study being assessed from a brief conference abstract, without access to the study protocol (Adam 2014; Bambicini 2012; Ramos 2015). Six studies were assessed from a published report, without a protocol available (Avery 1997; Bung 1991; de Barros 2010; Halse 2014; Jovanovic‐Peterson 1989; Youngwanichsetha 2014), and Brankston 2004 reported that on results without providing absolute values for women in the treatment and control groups.
Other potential sources of bias
Three trials were judged to be of low risk of bias. Bo 2014 reported no evidence of differences at baseline between intervention and control groups. de Barros 2010 has no evidence of other bias. For Halse 2014, the sample size was calculated to detect differences in blood glucose based on previous study and pilot data.
Eight trials were judged as unclear risk of bias. Three were published as a conference abstract and lacked methodological detail (Adam 2014; Bambicini 2012; Ramos 2015). Some imbalances were detected between groups at baseline (Avery 1997). Brankston 2004 reported that analysis was done by intention‐to‐treat, but not all women were included in all analyses and there were some differences between groups at baseline. In the Bung 1991 trial, there were small discrepancies in the reporting of data, for example birthweight and number of babies with Apgar less than seven at five minutes. There was insufficient methodological detail provided in Jovanovic‐Peterson 1989 and Youngwanichsetha 2014 and these were judged as having an unclear risk of other bias.
Effects of interventions
See: Summary of findings for the main comparison Exercise compared to control for pregnant women with gestational diabetes for improving maternal outcomes; Summary of findings 2 Exercise compared to control for pregnant women with gestational diabetes for improving fetal outcomes
Exercise versus control
Primary outcomes
Mother
1.1 Hypertensive disorders of pregnancy (as reported by trialists, including pre‐eclampsia, pregnancy‐induced hypertension, eclampsia)
There was no clear evidence of a difference between women in the exercise group (0/25) and those in the control group (1/25) for the risk of pre‐eclampsia (risk ratio (RR) 0.31, 95% confidence interval (CI) 0.01 to 7.09; two RCTs, 48 women; low‐quality evidence). Data should be interpreted with caution due to low event rates and small sample size suggesting imprecision (Analysis 1.1). No data were reported for pregnancy‐induced hypertension or eclampsia.
1.2 Caesarean section
There was no clear evidence of a difference between women in the exercise and control groups for the risk of birth by caesarean section (RR 0.86, 95% CI 0.63 to 1.16; five RCTs, 316 women; I2 = 0%; moderate‐quality evidence) (Analysis 1.2).
None of the included trials pre‐specified development of type 2 diabetes as a trial outcome.
Neonatal/infant
1.3 Perinatal mortality (stillbirth and neonatal mortality)
A single small trial (Jovanovic‐Peterson 1989) including only 19 women reported data for perinatal mortality. There were no events in either the exercise intervention or control group (low‐quality evidence) (Analysis 1.3).
1.4 Mortality or morbidity composite (variously defined by trials, e.g. perinatal or infant death, shoulder dystocia, bone fracture or nerve palsy)
There was no clear evidence of a difference between groups for the risk of a mortality or morbidity composite outcome (RR 0.56, 95% CI 0.12 to 2.61; two RCTs, 169 infants; I2 = 0%; moderate‐quality evidence) (Analysis 1.4).
None of the included trials pre‐specified large‐for‐gestational age, or neurosensory disability (childhood) as trial outcomes.
Secondary outcomes
Mother
1.5 Use of additional pharmacotherapy
There was no clear evidence of a difference between groups found between exercise and control groups for the use of additional pharmacotherapy (RR 0.76, 95% CI 0.54 to 1.08; seven RCTs, 413 women; I2 = 5%) (Analysis 1.5).
1.6 Maternal hypoglycaemia
One small trial of 34 women (Bung 1991) reported no events of maternal hypoglycaemia in either the exercise intervention or control groups (Analysis 1.6).
1.7 Glycaemic control at end of treatment (mean)
Allocation to the control group was associated with a reduced blood glucose concentration at end of treatment compared with the exercise group (mean difference (MD) 0.28 mmol/L, 95% CI 0.04 to 0.52; one RCT, 34 women). It is unclear if a MD of 0.28 mmol/L is of clinical significance (Analysis 1.7).
1.8 Glycaemic control at end of treatment (fasting blood glucose concentration)
Exercise was associated with a reduced fasting blood glucose concentration compared with control (average standardised mean difference (SMD) ‐0.59, 95% CI ‐1.07 to 0.11; four RCTs, 363 women; I2 = 73%, T2 = 0.19) (Analysis 1.8). The heterogeneity may be attributable to differences in the interventions.
1.9 Glycaemic control at end of treatment (postprandial blood glucose concentration)
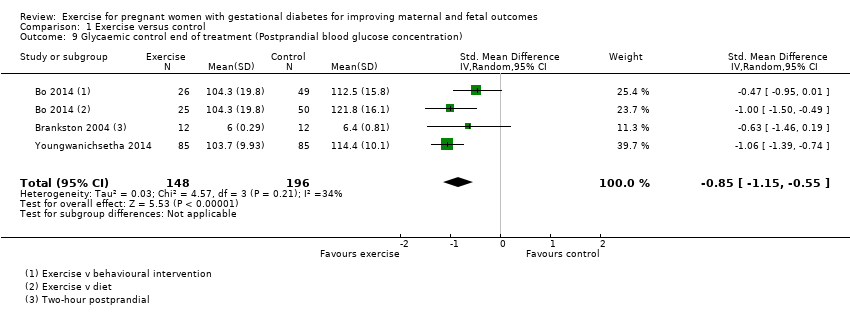
Exercise was associated with a reduced postprandial blood glucose concentration compared with control (average SMD ‐0.85, 95% CI ‐1.15 to ‐0.55; three RCTs, 344 women; I2 = 34%, T2 = 0.03) (Analysis 1.9). The heterogeneity may be attributable to differences in the interventions.
1.10 Glycaemic control at end of treatment (glycated haemoglobin (HbA1c))
There was no clear evidence of a difference in glycated haemoglobin (HbA1c) between exercise and control groups (MD ‐0.43 mmol/mol, 95% CI ‐0.51 to 0.35; two RCTs, 320 women; I2 = 0%; Analysis 1.10).
1.11 Glycaemic control at end of treatment (glucose tolerance test)
There was evidence of a reduced glucose tolerance test result at end of treatment for women in the exercise group compared with the control group (MD ‐81.60 mg/dl, 95% CI ‐96.03 to ‐67.17; one RCT, 19 women; Analysis 1.11).
1.12 Weight gain in pregnancy
There was no clear evidence of a difference between groups for weight gain in pregnancy (MD ‐0.34 kg, 95% CI ‐1.25 to 0.58; two RCTs, 104 women; I2 = 0%; Analysis 1.12). The increase in weight differs substantially between the two studies (Analysis 1.12). We cannot find an explanation for this and both studies reported weight in kg.
1.13 Weight gain in pregnancy (excessive)
There was no clear evidence of a difference between groups for excessive weight gain in pregnancy (RR 0.90, 95% CI 0.47 to 1.72; one RCT, 79 women; Analysis 1.13).
1.14 Adherence to the intervention
There was no clear evidence of a difference between groups for adherence to the intervention (RR 1.00, 95% CI 0.83 to 1.21; one RCT, 19 women; Analysis 1.14).
1.15 Induction of labour
There was no clear evidence of a difference between exercise and control groups for the risk of induction of labour (RR 1.38, 95% CI 0.71 to 2.68; one RCT, 40 women; low‐quality evidence;Analysis 1.15).
1.16 Maternal mortality
Two trials including a total of 48 women reported data on maternal mortality (Avery 1997; Jovanovic‐Peterson 1989). There were no events in either the exercise intervention or control group (Analysis 1.16).
1.17 Views of the intervention (favourable)
One trial (40 women) reported data on favourable views of the intervention (Halse 2014). The MD was inestimable (Analysis 1.17).
1.18 Postnatal weight retention or return to pre‐pregnancy weight (maternal BMI (follow‐up) kg/m2)
There was no clear evidence of a difference between groups for maternal BMI at follow‐up (MD 0.11 kg/m2, 95% CI ‐1.04 to 1.26; three RCTs, 254 women; I2 = 0%; high‐quality evidence;Analysis 1.18).
Neonatal/infant
1.19 Stillbirth
One trial reported stillbirth (n = 29; Avery 1997). There were no events in either the exercise intervention group or the control group (Analysis 1.19).
1.20 Macrosomia
There was no clear evidence of a difference in the risk of being born macrosomic between the exercise intervention and control groups (RR 0.69, 95% CI 0.35 to 1.35; five RCTs, 296 infants; I2 = 0%; Analysis 1.20).
1.21 Gestational age at birth
There was no clear evidence of a difference for gestational age at birth between exercise intervention and control groups (MD ‐0.01 weeks, 95% CI ‐0.40 to 0.38; four RCTs, 167 infants; I2 = 0%; Analysis 1.21).
1.22 Preterm birth
There was no clear evidence of a difference between exercise intervention and control groups for the risk of preterm birth (RR 0.95, 95% CI 0.39 to 2.36; five RCTs, 302 infants; I2 = 0%; Analysis 1.22).
1.23 Five‐minute Apgar score less than seven
There was no clear evidence of a difference for the five‐minute Apgar score less than seven between exercise intervention and control groups (RR 0.33, 95% CI 0.01 to 7.65; one RCT, 34 infants; Analysis 1.23).
1.24 Birthweight
There was no clear evidence of a difference between exercise intervention and control groups for birthweight (MD ‐61.50 g, 95% CI ‐195.21 to 72.20; six RCTs, 192 infants; I2 = 0%; Analysis 1.24).
1.25 Length at birth (cm)
There was no clear evidence of a difference between exercise intervention and control groups for length at birth (MD ‐1.70 cm, 95% CI ‐3.41 to 0.01; one RCT, 34 infants; Analysis 1.25).
1.26 Neonatal hypoglycaemia
There was no clear evidence of a difference between exercise and control groups (RR 2.00, 95% CI 0.20 to 20.04; one RCT, 34 infants; low‐quality evidence; Analysis 1.26).
1.27 Respiratory distress syndrome
There were no events of respiratory distress syndrome in either the exercise intervention or control groups reported in a single small trial of 34 infants (Bung 1991) (Analysis 1.27).
1.28 Neonatal jaundice (hyperbilirubinaemia)
There was no clear evidence of a difference between exercise intervention and control groups for hyperbilirubinaemia (RR 0.33, 95% CI 0.01 to 7.65; one RCT, 34 infants; Analysis 1.28).
1.29 Hypocalcaemia
There were no events of hypocalcaemia in either the exercise intervention or control groups reported in a single small trial of 34 infants (Bung 1991) (Analysis 1.29).
1.30 Duration of hospital stay
Duration of hospital stay more than four days was reported by Bo 2014. It is unclear if this is maternal, neonatal or both. The authors report 13/50 for the diet only group, 9/51 for the exercise only group, and 17/49 for the behavioural group. No data for mean duration of hospital stay were provided.
Secondary outcomes not reported in the included studies
The following secondary, long‐term, adulthood and health service use outcomes specified in this review were not included as prespecified trial outcomes in any of the included trials.
-
Mother ‐ placental abruption, postpartum haemorrhage, postpartum infection, perineal trauma/tearing, breastfeeding at discharge, six weeks postpartum, six months or longer, sense of well‐being and quality of life, behavioural changes associated with the intervention, relevant biomarker changes associated with the intervention.
-
Maternal long‐term outcomes ‐ postnatal depression, GDM in a subsequent pregnancy, type 2 diabetes, impaired glucose tolerance, cardiovascular health.
-
Neonatal/infant ‐ neonatal death, small‐for‐gestational age, birth trauma (shoulder dystocia, bone fracture, nerve palsy), birthweight z score, head circumference and z score, length z score, ponderal index, adiposity, polycythaemia, relevant biomarker changes associated with the intervention.
-
Later infant and childhood secondary outcomes ‐ weight and z scores, height and z scores, head circumference and z scores, adiposity, educational attainment, blood pressure, type 1 diabetes, type 2 diabetes, Impaired glucose tolerance, dyslipidaemia or metabolic syndrome.
-
Child as an adulthood ‐ weight, height, adiposity, cardiovascular health, employment, education and social status/achievement, type 1 diabetes, type 2 diabetes, impaired glucose tolerance.
-
Health service use ‐ number of antenatal visits or admissions, number of hospital or health professional visits, admission to neonatal intensive care unit/nursery, cost of maternal care, cost of offspring care, costs associated with the intervention, costs to families associated with the management provided, cost of dietary monitoring, costs to families ‐ change of diet, extra antenatal visits, extra use of healthcare services (consultations, blood glucose monitoring, length and number of antenatal visits), women’s view of treatment advice, duration of stay in neonatal intensive care unit or special care baby unit).
Discussion
Summary of main results
We included 11 randomised controlled trials involving 638 women that compared exercise interventions with a control group in women with gestational diabetes.
For the mother: we found no clear evidence of a difference for the risk of pre‐eclampsia, birth by caesarean section, the risk of induction of labour or maternal body mass index at follow‐up. Data for development of type 2 diabetes, perineal trauma/tearing and postnatal depression were not reported in the included studies (summary of findings Table for the main comparison). Exercise interventions were associated with a reduced fasting (Analysis 1.8) and postprandial blood (Analysis 1.9) glucose concentration compared with the control group. However, caution is advised in interpreting these data due to heterogeneity, which is most likely due to the variation in the content and methods associated with the interventions themselves.
For the infant/child: we found no clear evidence of a difference for a composite outcome of neonatal mortality and morbidity or neonatal hypoglycaemia. There were no events of perinatal mortality reported. There were no data reported for large‐for gestational age, adiposity, diabetes or neurosensory disability in childhood (summary of findings Table 2).
Both short‐ and long‐term outcomes of interest for this review were poorly reported in the included studies.
Overall completeness and applicability of evidence
There was a wide variation in the components of the exercise intervention, the duration of the intervention and whether the intervention was supervised or unsupervised. Short‐ and long‐term outcomes of interest for this review for the mother and for the infant/child were poorly reported. The sample sizes of the included studies were small, ranging from a minimum of six women (Ramos 2015) to a maximum of 180 women (Youngwanichsetha 2014). All of the included studies were conducted in middle‐or high‐income countries. The data lack overall completeness and are unlikely to be applicable to all settings.
Quality of the evidence
We judged the overall risk of bias of the included studies to be unclear due to lack of methodological details. Using GRADE methodology, the quality of evidence for the selected outcomes ranged from high to low quality (summary of findings Table for the main comparison; summary of findings Table 2). The main reason for the downgrading of evidence was for risk of bias and imprecision. Sample sizes and event rates were low and data were often associated with wide confidence intervals.
Potential biases in the review process
We believe that every effort was made to attempt to minimise biases in the review process. We conducted a systematic search of the literature for randomised controlled trial evidence, we did not use any restrictions for language or publication date. Where necessary, we attempted to make contact with authors of primary studies to obtain additional methodological and/or outcome data. We have adhered to Cochrane methodology for searching, data extraction and analysis.
Agreements and disagreements with other studies or reviews
A systematic review by Harrison 2016 reported a similar association between exercise interventions and lower fasting and postprandial blood glucose concentration compared with control. They had identified the same trials for inclusion as our review.
Study flow diagram.

'Risk of bias' graph: review authors' judgements about each risk of bias item presented as percentages across all included studies.
'Risk of bias' summary: review authors' judgements about each risk of bias item for each included study.

Comparison 1 Exercise versus control, Outcome 1 Hypertensive disorders of pregnancy (pre‐eclampsia).
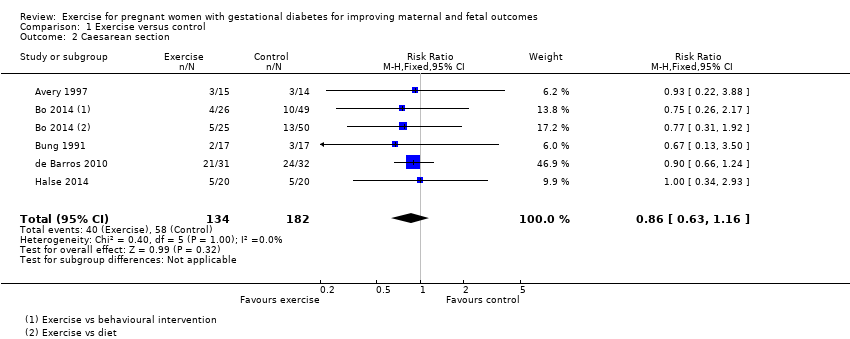
Comparison 1 Exercise versus control, Outcome 2 Caesarean section.

Comparison 1 Exercise versus control, Outcome 3 Perinatal mortality (stillbirth and neonatal mortality).
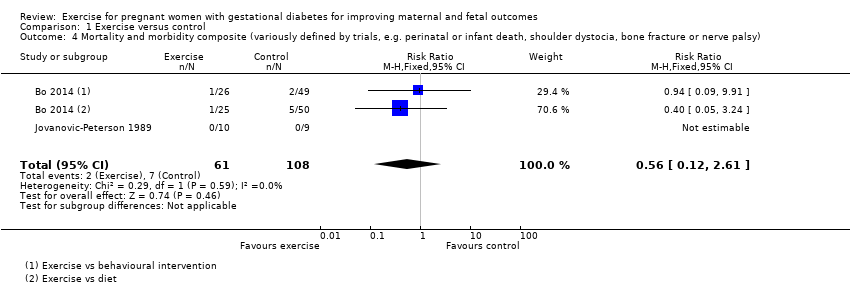
Comparison 1 Exercise versus control, Outcome 4 Mortality and morbidity composite (variously defined by trials, e.g. perinatal or infant death, shoulder dystocia, bone fracture or nerve palsy).
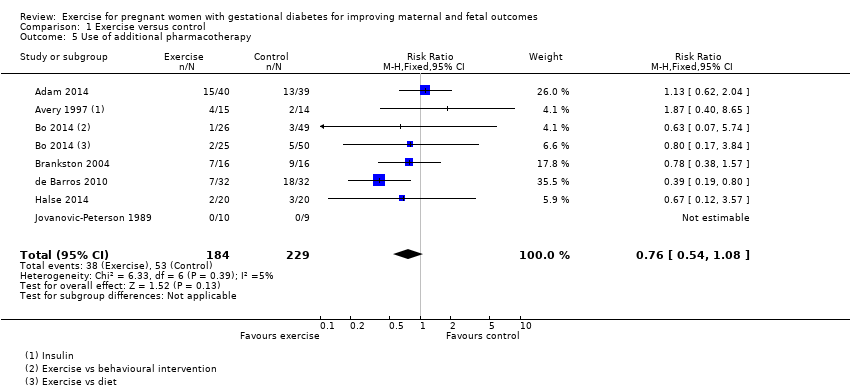
Comparison 1 Exercise versus control, Outcome 5 Use of additional pharmacotherapy.
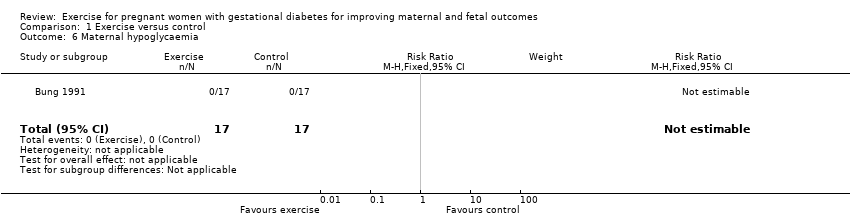
Comparison 1 Exercise versus control, Outcome 6 Maternal hypoglycaemia.

Comparison 1 Exercise versus control, Outcome 7 Glycaemic control end of treatment (Mean).
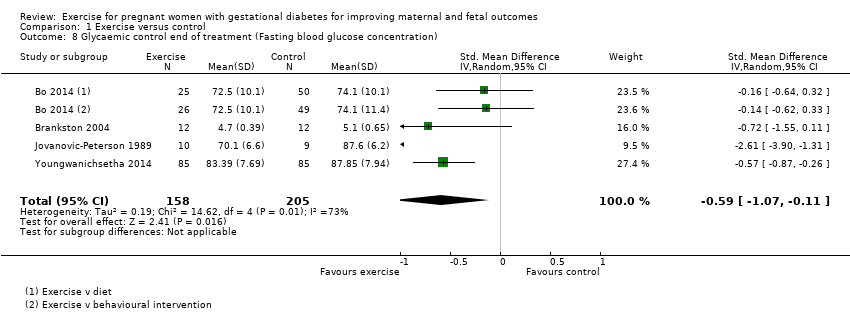
Comparison 1 Exercise versus control, Outcome 8 Glycaemic control end of treatment (Fasting blood glucose concentration).
Comparison 1 Exercise versus control, Outcome 9 Glycaemic control end of treatment (Postprandial blood glucose concentration).

Comparison 1 Exercise versus control, Outcome 10 Glycaemic control end of treatment (HbA1c).
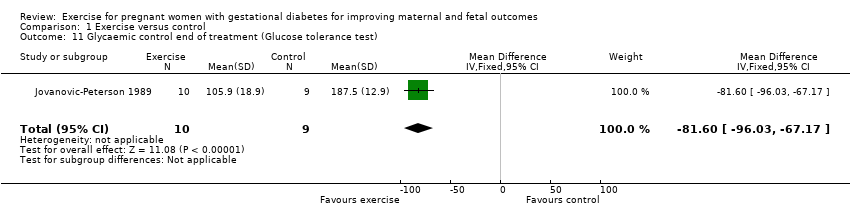
Comparison 1 Exercise versus control, Outcome 11 Glycaemic control end of treatment (Glucose tolerance test).

Comparison 1 Exercise versus control, Outcome 12 Weight gain in pregnancy.

Comparison 1 Exercise versus control, Outcome 13 Weight gain in pregnancy (Excessive).

Comparison 1 Exercise versus control, Outcome 14 Adherence to the intervention.
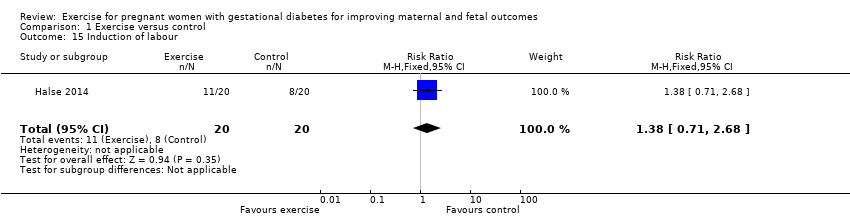
Comparison 1 Exercise versus control, Outcome 15 Induction of labour.
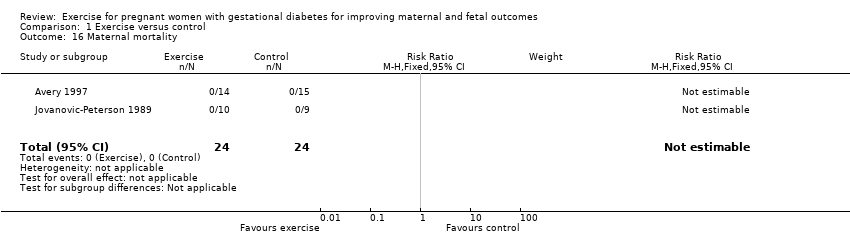
Comparison 1 Exercise versus control, Outcome 16 Maternal mortality.

Comparison 1 Exercise versus control, Outcome 17 Views of the intervention (favourable).
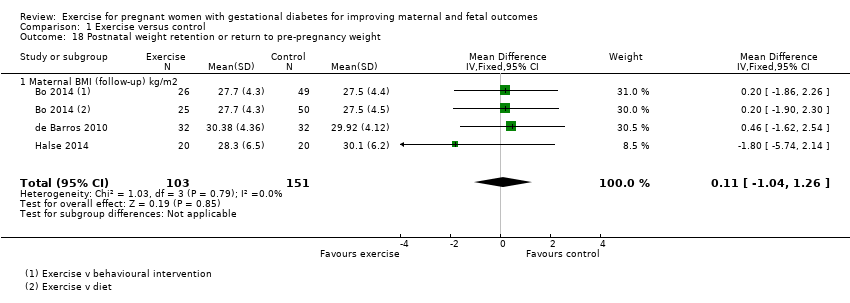
Comparison 1 Exercise versus control, Outcome 18 Postnatal weight retention or return to pre‐pregnancy weight.
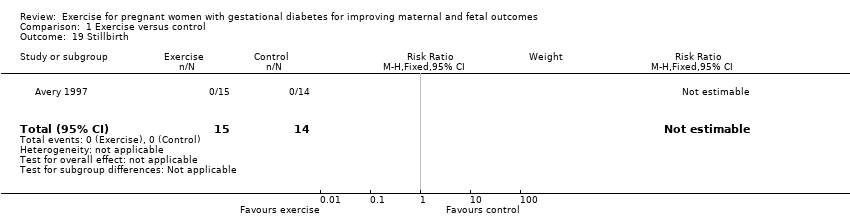
Comparison 1 Exercise versus control, Outcome 19 Stillbirth.

Comparison 1 Exercise versus control, Outcome 20 Macrosomia.

Comparison 1 Exercise versus control, Outcome 21 Gestational age at birth.
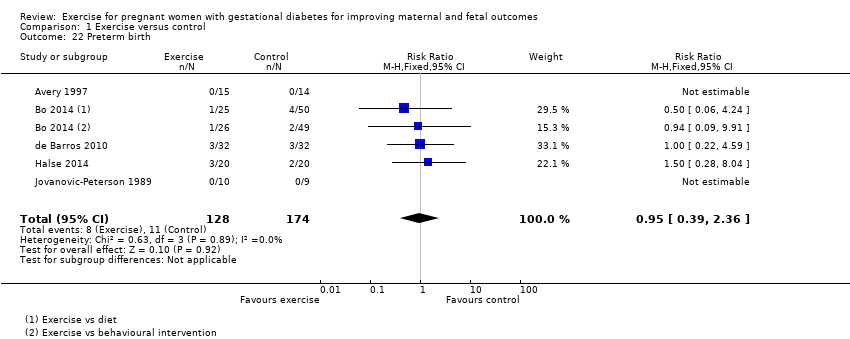
Comparison 1 Exercise versus control, Outcome 22 Preterm birth.

Comparison 1 Exercise versus control, Outcome 23 Five‐minute Apgar < seven.

Comparison 1 Exercise versus control, Outcome 24 Birthweight.

Comparison 1 Exercise versus control, Outcome 25 Length (cm) (at birth).

Comparison 1 Exercise versus control, Outcome 26 Neonatal hypoglycaemia.
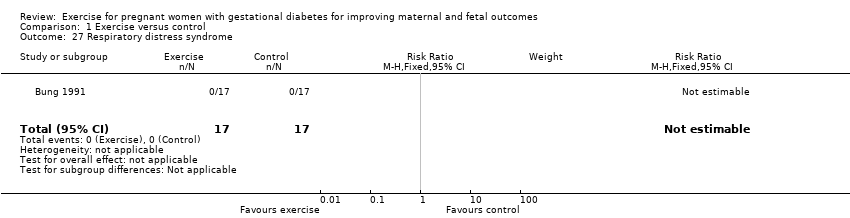
Comparison 1 Exercise versus control, Outcome 27 Respiratory distress syndrome.

Comparison 1 Exercise versus control, Outcome 28 Neonatal jaundice (hyperbilirubinaemia).

Comparison 1 Exercise versus control, Outcome 29 Hypocalcaemia.
| Exercise compared to control for pregnant women with gestational diabetes for improving maternal outcomes | ||||||
| Patient or population: pregnant women with gestational diabetes | ||||||
| Outcomes | Anticipated absolute effects* (95% CI) | Relative effect | № of participants | Quality of the evidence | Comments | |
| Risk with control | Risk with exercise | |||||
| Hypertensive disorders of pregnancy (pre‐eclampsia) | 43 per 1000 | 13 per 1000 | RR 0.31 | 48 | ⊕⊕⊝⊝ | Event rates were very low with 0/25 in the exercise group and 1/23 in the control group. No data were reported for pregnancy‐induced hypertension or eclampsia. |
| Caesarean section | 319 per 1000 | 274 per 1000 | RR 0.86 | 316 | ⊕⊕⊕⊝ | |
| Development of type 2 diabetes ‐ not measured | ‐ | ‐ | ‐ | ‐ | ‐ | This outcome was not measured in any of the included studies in this review. |
| Perineal trauma/tearing ‐ not measured | ‐ | ‐ | ‐ | ‐ | ‐ | This outcome was not measured in any of the included studies in this review. |
| Postnatal weight retention or return to pre‐pregnancy weight (maternal BMI (follow‐up) kg/m2) | The mean maternal BMI (follow‐up) kg/m2 was 0 | MD 0.11 higher | ‐ | 254 | ⊕⊕⊕⊕ | |
| Postnatal depression ‐ not measured | ‐ | ‐ | ‐ | ‐ | ‐ | This outcome was not measured in any of the included studies in this review. |
| Induction of labour | 400 per 1000 | 552 per 1000 | RR 1.38 | 40 | ⊕⊕⊝⊝ | Event rates and sample size were low 11/20 in exercise group and 8/20 in control group. |
| *The risk in the intervention group (and its 95% confidence interval) is based on the assumed risk in the comparison group and the relative effect of the intervention (and its 95% CI). | ||||||
| GRADE Working Group grades of evidence | ||||||
| 1 Lack of clarity for most items related to risk of bias ‐ downgraded one level. 2 Wide confidence intervals crossing the line of no effect and low event rates with a small sample size are suggestive of imprecision ‐ downgraded one level. 3 Imprecision ‐ low event rates and small sample size ‐ downgraded one level. | ||||||
| Exercise compared to control for pregnant women with gestational diabetes for improving maternal and fetal outcomes | ||||||
| Patient or population: pregnant women with gestational diabetes Setting: USA, Italy | ||||||
| Outcomes | Anticipated absolute effects* (95% CI) | Relative effect | № of participants | Quality of the evidence | Comments | |
| Risk with control | Risk with exercise | |||||
| Large‐for‐gestational age ‐ not reported | ‐ | ‐ | ‐ | ‐ | ‐ | None of the included studies in this review reported data for this outcome. |
| Perinatal mortality (stillbirth and neonatal mortality) | 0 per 1000 | 0 per 1000 | not estimable | 19 | ⊕⊕⊝⊝ | There were no events in either the exercise or the control group and the sample size in only 19 infants. |
| Mortality and morbidity composite (variously defined by trials, e.g. perinatal or infant death, shoulder dystocia, bone fracture or nerve palsy) | 65 per 1000 | 36 per 1000 | RR 0.56 | 169 | ⊕⊕⊕⊝ | Event rates and sample size were low with 2/61 in the exercise group and 7/108 in the control group. |
| Neonatal hypoglycaemia | 59 per 1000 | 118 per 1000 | RR 2.00 | 34 | ⊕⊕⊝⊝ | Event rates and sample size were low with 2/17 in the exercise group and 1/17 in the control group. |
| Adiposity ‐ not reported | ‐ | ‐ | ‐ | ‐ | ‐ | None of the included studies in this review reported data for this outcome at any life stage. |
| Diabetes (type 1, type 2) ‐ not reported | ‐ | ‐ | ‐ | ‐ | ‐ | None of the included studies in this review reported data for this outcome at any life stage. |
| Neurosensory disability | ‐ | ‐ | ‐ | ‐ | ‐ | None of the included studies in this review reported data for this outcome. |
| *The risk in the intervention group (and its 95% confidence interval) is based on the assumed risk in the comparison group and the relative effect of the intervention (and its 95% CI). | ||||||
| GRADE Working Group grades of evidence | ||||||
| 1 There is a lack of clarity for most items associated with risk of bias ‐ downgraded one level. 2 Imprecision ‐ There are no events in either group and the sample size is only 19 infants ‐ downgraded one level. 3 Imprecision ‐ wide confidence intervals and low event rates ‐ downgraded one level. | ||||||
| Outcome or subgroup title | No. of studies | No. of participants | Statistical method | Effect size |
| 1 Hypertensive disorders of pregnancy (pre‐eclampsia) Show forest plot | 2 | 48 | Risk Ratio (M‐H, Fixed, 95% CI) | 0.31 [0.01, 7.09] |
| 2 Caesarean section Show forest plot | 5 | 316 | Risk Ratio (M‐H, Fixed, 95% CI) | 0.86 [0.63, 1.16] |
| 3 Perinatal mortality (stillbirth and neonatal mortality) Show forest plot | 1 | 19 | Risk Ratio (M‐H, Fixed, 95% CI) | 0.0 [0.0, 0.0] |
| 4 Mortality and morbidity composite (variously defined by trials, e.g. perinatal or infant death, shoulder dystocia, bone fracture or nerve palsy) Show forest plot | 2 | 169 | Risk Ratio (M‐H, Fixed, 95% CI) | 0.56 [0.12, 2.61] |
| 5 Use of additional pharmacotherapy Show forest plot | 7 | 413 | Risk Ratio (M‐H, Fixed, 95% CI) | 0.76 [0.54, 1.08] |
| 6 Maternal hypoglycaemia Show forest plot | 1 | 34 | Risk Ratio (M‐H, Fixed, 95% CI) | 0.0 [0.0, 0.0] |
| 7 Glycaemic control end of treatment (Mean) Show forest plot | 1 | 34 | Mean Difference (IV, Fixed, 95% CI) | 0.28 [0.04, 0.52] |
| 8 Glycaemic control end of treatment (Fasting blood glucose concentration) Show forest plot | 4 | 363 | Std. Mean Difference (IV, Random, 95% CI) | ‐0.59 [‐1.07, ‐0.11] |
| 9 Glycaemic control end of treatment (Postprandial blood glucose concentration) Show forest plot | 3 | 344 | Std. Mean Difference (IV, Random, 95% CI) | ‐0.85 [‐1.15, ‐0.55] |
| 10 Glycaemic control end of treatment (HbA1c) Show forest plot | 2 | 320 | Mean Difference (IV, Fixed, 95% CI) | ‐0.43 [‐0.51, ‐0.35] |
| 11 Glycaemic control end of treatment (Glucose tolerance test) Show forest plot | 1 | 19 | Mean Difference (IV, Fixed, 95% CI) | ‐81.6 [‐96.03, ‐67.17] |
| 12 Weight gain in pregnancy Show forest plot | 2 | 104 | Mean Difference (IV, Fixed, 95% CI) | ‐0.34 [‐1.25, 0.58] |
| 13 Weight gain in pregnancy (Excessive) Show forest plot | 1 | 79 | Risk Ratio (M‐H, Fixed, 95% CI) | 0.9 [0.47, 1.72] |
| 14 Adherence to the intervention Show forest plot | 1 | 19 | Risk Ratio (M‐H, Fixed, 95% CI) | 1.0 [0.83, 1.21] |
| 15 Induction of labour Show forest plot | 1 | 40 | Risk Ratio (M‐H, Fixed, 95% CI) | 1.38 [0.71, 2.68] |
| 16 Maternal mortality Show forest plot | 2 | 48 | Risk Ratio (M‐H, Fixed, 95% CI) | 0.0 [0.0, 0.0] |
| 17 Views of the intervention (favourable) Show forest plot | 1 | 40 | Mean Difference (IV, Fixed, 95% CI) | 0.0 [0.0, 0.0] |
| 18 Postnatal weight retention or return to pre‐pregnancy weight Show forest plot | 3 | 254 | Mean Difference (IV, Fixed, 95% CI) | 0.11 [‐1.04, 1.26] |
| 18.1 Maternal BMI (follow‐up) kg/m2 | 3 | 254 | Mean Difference (IV, Fixed, 95% CI) | 0.11 [‐1.04, 1.26] |
| 19 Stillbirth Show forest plot | 1 | 29 | Risk Ratio (M‐H, Fixed, 95% CI) | 0.0 [0.0, 0.0] |
| 20 Macrosomia Show forest plot | 5 | 296 | Risk Ratio (M‐H, Fixed, 95% CI) | 0.69 [0.35, 1.35] |
| 21 Gestational age at birth Show forest plot | 4 | 167 | Mean Difference (IV, Fixed, 95% CI) | ‐0.01 [‐0.40, 0.38] |
| 22 Preterm birth Show forest plot | 5 | 302 | Risk Ratio (M‐H, Fixed, 95% CI) | 0.95 [0.39, 2.36] |
| 23 Five‐minute Apgar < seven Show forest plot | 1 | 34 | Risk Ratio (M‐H, Fixed, 95% CI) | 0.33 [0.01, 7.65] |
| 24 Birthweight Show forest plot | 6 | 192 | Mean Difference (IV, Fixed, 95% CI) | ‐61.50 [‐195.21, 72.20] |
| 25 Length (cm) (at birth) Show forest plot | 1 | 34 | Mean Difference (IV, Fixed, 95% CI) | ‐1.70 [‐3.41, 0.01] |
| 26 Neonatal hypoglycaemia Show forest plot | 1 | 34 | Risk Ratio (M‐H, Fixed, 95% CI) | 2.0 [0.20, 20.04] |
| 27 Respiratory distress syndrome Show forest plot | 1 | 34 | Risk Ratio (M‐H, Fixed, 95% CI) | 0.0 [0.0, 0.0] |
| 28 Neonatal jaundice (hyperbilirubinaemia) Show forest plot | 1 | 34 | Risk Ratio (M‐H, Fixed, 95% CI) | 0.33 [0.01, 7.65] |
| 29 Hypocalcaemia Show forest plot | 1 | 34 | Risk Ratio (M‐H, Fixed, 95% CI) | 0.0 [0.0, 0.0] |