درمان با داروهای تعدیل کننده بیماری در افراد مبتلا به نخستین حمله بالینی مطرح کننده مالتیپل اسکلروزیس
چکیده
پیشینه
درمان مالتیپل اسکلروزیس (multiple sclerosis; MS) در طول 20 سال گذشته تغییر کرده است. ظهور داروهای تعدیل کننده بیماری در اواسط دهه 1990 حاکی از یک دوره پیشرفت سریع در درک و مدیریت بالینی مالتیپل اسکلروزیس بوده است. با حمایت تصویربرداری رزونانس مغناطیسی، تشخیص زودهنگام این بیماری امکانپذیر است، و میتوان درمان را در زمان وقوع نخستین حمله بالینی آن آغاز کرد. از آنجا که بیشتر داروهای تعدیل کننده بیماری با عوارض جانبی همراه هستند، بیماران و پزشکان باید پیش از تصمیمگیری نهایی، به مزایا و بیخطری (safety) گزینههای درمانی مختلف زودهنگام توجه کامل را مبذول دارند.
اهداف
1. تخمین مزایا و بیخطری تجویز داروهای تعدیل کننده بیماری که در همه مطالعات (تصادفیسازی شده یا غیر تصادفیسازی شده) برای درمان نخستین حمله بالینی مطرح کننده MS، در مقایسه با دارونما (placebo) یا عدم درمان، ارزیابی شدند؛
2. ارزیابی اثربخشی و بیخطری نسبی تجویز داروهای تعدیل کننده بیماری براساس مزایا و بیخطری آنها؛
3. تخمین مزایا و بیخطری تجویز داروهای تعدیل کننده بیماری که در همه مطالعات (تصادفیسازی شده یا غیر تصادفیسازی شده) برای آغاز درمان پس از وقوع نخستین حمله («درمان زودهنگام»)، در مقایسه با آغاز درمان پس از وقوع حمله دوم یا در نقطه زمانی دیرتر («درمان تاخیری») ارزیابی شدند.
روشهای جستوجو
پایگاه ثبت کارآزماییهای گروه مالتیپل اسکلروزیس و بیماریهای نادر دستگاه سیستم عصبی مرکزی (CNS) در کاکرین؛ MEDLINE؛ Embase؛ CINAHL؛ LILACS؛ clinicaltrials.gov؛ پایگاه ثبت کارآزماییهای WHO، و گزارشهای سازمان غذا و داروی آمریکا (FDA)، و برای یافتن مطالعات منتشر نشده، را جستوجو کردیم (تا دسامبر 2016).
معیارهای انتخاب
مطالعات تصادفیسازی شده و مطالعات مشاهدهای را وارد کردیم که یک یا چند دارو را به صورت تک درمانی (monotherapy) در شرکتکنندگان بزرگسال و مبتلا به نخستین حمله بالینی مطرح کننده MS ارزیابی کردند. شواهد موجود را در مورد آلمتوزوماب (alemtuzumab)، آزاتیوپرین (azathioprine)، کلادریبین (cladribine)، داکلیزوماب (daclizumab)، دیمتیل فومارات (dimethyl fumarate)، فینگولیمود (fingolimod)، گلاتیرامر استات (glatiramer acetate)، ایمونوگلوبولینها (immunoglobulins)، اینترفرون بتا‐1b، اینترفرون بتا‐1a؛ (®Rebif®, Avonex)، لاکینیمود (laquinimod)، میتوکسانترون (mitoxantrone)، ناتالیزوماب (natalizumab)، اوکرلیزوماب (ocrelizumab)، اینترفرون بتا‐1a پگیله شده (pegylated interferon beta‐1a)، ریتوکسیماب (rituximab)، و تریفلونوماید (teriflunomide) در نظر گرفتیم.
گردآوری و تجزیهوتحلیل دادهها
دو تیم از سه نویسنده مستقلا مطالعات را انتخاب و دادهها را استخراج کردند. پیامدهای اولیه عبارت بودند از بدتر شدن ناتوانی، عود حملات، وقوع حداقل یک عارضه جانبی (AE) جدی و خارج شدن از مطالعه، یا توقف درمان به دلیل بروز AEها. زمان سپری شده تا تبدیل وضعیت بیمار به MS قطعی از نظر بالینی (clinically definite MS; CDMS) مطابق با معیارهای تشخیصی Poser، و احتمال توقف درمان یا خروج از روند درمان به هر علتی، به عنوان پیامدهای ثانویه در نظر گرفته شدند. دادههای مطالعه را با استفاده از متاآنالیزهای اثرات تصادفی (random‐effect) سنتز کرده و مقایسههای غیر مستقیم را میان داروها انجام دادیم. برای همه پیامدها، نسبت شانس (OR) و نسبت خطر (HR) را همراه با 95% فاصله اطمینان (CI) متناظر، محاسبه کردیم. تاثیرات مطلق درمان را فقط برای پیامدهای اولیه تخمین زدیم. اعتبار (credibility) شواهد را با استفاده از سیستم درجهبندی توصیه، ارزیابی، توسعه و ارزشیابی (Grading of Recommendations Assessment, Development and Evaluation; GRADE) ارزیابی کردیم.
نتایج اصلی
تعداد 10 کارآزمایی تصادفیسازی شده، هشت مطالعه تکمیلی برچسب‐باز (open‐label extension studies; OLEs) و چهار مطالعه کوهورت را وارد کردیم که بین 2010 و 2016 منتشر شدند. خطر سوگیری (bias) کلی در سطح بالایی قرار داشت و گزارشهای AEها به ندرت مشاهده شدند. سطح کیفیت شواهد مرتبط با نتایج، در محدوده پائین تا بسیار پائین قرار داشتند.
درمان زودهنگام در مقابل دارونما در طول 24 ماه نخست پیگیری
مزیت کوچک و غیر معنیداری از درمان زودهنگام در مقایسه با دارونما در بدتر شدن ناتوانی (6.4% کمتر (13.9 مورد کمتر تا 3 مورد بیشتر) شرکتکننده با بدتر شدن ناتوانی بیمار با اینترفرون بتا‐1a؛ (®Rebif) یا تریفلونوماید) و در زمینه عود (10% کمتر (20.3 مورد کمتر تا 2.8 مورد بیشتر) شرکتکننده با وقوع عود با تریفلونوماید) دیده شد. درمان زودهنگام با 1.6% شرکتکننده کمتر مبتلا به حداقل یک مورد AE جدی (3 مورد کمتر تا 0.2 مورد بیشتر) همراه بود. شرکتکنندگان در گروه درمان زودهنگام بهطور متوسط 4.6% مرتبه (0.3 مورد کمتر تا 15.4 مورد بیشتر) بیشتر احتمال داشت که به دلیل ابتلا به AEها از مطالعه خارج شوند. این نتیجه اغلب از مطالعاتی حاصل شد که روی اینترفرون بتا b‐1، گلاتیرامر استات و کلادریبین انجام شده و با خارج شدن قابلتوجه بیماران از گروه درمانی خود به دلیل وقوع AEها همراه بود. درمان زودهنگام خطر تبدیل وضعیت بیمار را به CDMS کاهش داد (HR: 0.53؛ 95% CI؛ 0.47 تا 0.60).
مقایسه مداخلات فعال در طول 24 ماه نخست پیگیری
مقایسه غیر مستقیم اینترفرون بتا‐1a یا ®Rebif با تریفلونوماید هیچ تفاوتی را در کاهش بدتر شدن ناتوانی بیماران (OR: 0.84؛ 95% CI؛ 0.43 تا 1.66) نشان نداد. هیچ تفاوتی را میان داروهای وارد شده، از نظر خطر تبدیل وضعیت بیمار به CDMS، نیافتیم. اینترفرون بتا‐ـ1a یا ®Rebif و تریفلونوماید در مقایسه با اینترفرون بتا‐1b، کلادریبین و گلاتیرامر استات، با خروج کمتر بیماران از مطالعه مرتبط با وقوع AEها همراه بودند (محدوده OR بین 0.03 و 0.29، با عدم قطعیت قابلتوجه).
درمان زودهنگام در مقابل درمان تاخیری
هیچ شواهدی را حاکی از وجود تفاوت میان درمان زودهنگام در مقابل درمان تاخیری برای بدتر شدن ناتوانی در حداکثر دوره پیگیری پنج سال نیافتیم (3% شرکتکننده کمتر با درمان زودهنگام (15 مورد کمتر تا 11.1 مورد بیشتر)). تنوع مهمی میان مداخلات وجود داشت؛ درمان زودهنگام با اینترفرون بتا‐1b بهطور قابلتوجهی شانس شرکتکنندگان را برای بدتر شدن ناتوانی در طول دوره پیگیری سه و پنج سال کاهش داد (OR: 0.52؛ 95% CI؛ 0.32 تا 0.84 و OR: 0.57؛ 95% CI؛ 0.36 تا 0.89). گروه درمان زودهنگام در مقایسه با درمان تاخیری در حداکثر دوره پیگیری پنج سال، 19.6% شرکتکننده کمتر با عود بیماری داشت (26.7 مورد کمتر تا 12.7 مورد کمتر) و درمان زودهنگام خطر تبدیل وضعیت بیمار را به CDMS در دورههای پیگیری تا 10 سال کاهش داد (یعنی، در طول بیش از پنج سال پیگیری، HR: 0.62؛ 95% CI؛ 0.53 تا 0.73). در مورد AEهای جدی طولانیمدت یا قطع درمان به دلیل بروز AEها نمیتوانیم نتیجهگیری داشته باشیم، زیرا دادههای موجود در مطالعات OLE و کوهورت ناکافی بودند.
نتیجهگیریهای نویسندگان
شواهدی با کیفیت بسیار پائین پیشنهاد میکند که مزیتی کوچک و نامطمئن با درمان زودهنگام در مقایسه با دارونما در کاهش میزان بدتر شدن ناتوانی و عود حملات دیده میشود. مزیت درمان زودهنگام در مقایسه با درمان تاخیری در زمینه بدتر شدن ناتوانی، بسته به داروی واقعی استفاده شده و براساس شواهدی با کیفیت بسیار پائین، هتروژن و ناهمگن بود. شواهدی با کیفیت پائین پیشنهاد میکند که شانس عود بیماری با درمان زودهنگام در مقایسه با درمان تاخیری، کمتر است. درمان زودهنگام در مقایسه با دارونما، عدم درمان یا درمان تاخیری، هم در پیگیری کوتاهمدت و هم طولانیمدت، خطر تبدیل وضعیت بیمار را به CDMS کاهش داد. شواهدی با کیفیت پائین پیشنهاد میکند که درمان زودهنگام در مقایسه با دارونما، با تعداد شرکتکننده کمتر مبتلا به حداقل یک عارضه جانبی جدی همراه است. شواهدی با کیفیت پائین پیشنهاد میدهد که، درمان زودهنگام در مقایسه با دارونما، منجر به خروج بیشتر بیماران از مطالعه یا قطع درمان در اثر بروز AEها میشود. تفاوت میان داروها در زمینه مزیت و بیخطری کوتاهمدت نامشخص بود، زیرا تعداد مطالعات اندک و فقط مقایسههای مستقیم در دسترس قرار داشتند. بیخطری طولانیمدت درمان زودهنگام نامشخص است، زیرا اطلاعات کافی در این زمینه موجود نیستند.
PICO
خلاصه به زبان ساده
استفاده از داروهای تعدیل کننده بیماری در درمان افراد مبتلا به نخستین حمله بالینی مطرح کننده مالتیپل اسکلروزیس
این خلاصه، اطلاعاتی را در مورد مزایا و عوارض جانبی برخی داروهای تعدیل کننده بیماری ارائه میدهد که در زمان تشخیص مالتیپل اسکلروزیس پس از نخستین حمله بالینی، تجویز میشوند. شواهد موجود را برای پاسخ دادن به این سه سوال مرور کردیم: 1) آیا درمان زودهنگام مفید و بیخطر است؟ 2) کدام دارو برای درمان زودهنگام بهترین گزینه است؟ 3) آیا درمان زودهنگام بهتر از درمان تاخیری است؟
دادههای کافی از 22 مطالعه در زمینه داروهای زیر در دسترس بودند: کلادریبین (Movectro)، گلاتیرامر استات (Copaxone)، اینترفرون بتا‐1b؛ (Betaferon)، اینترفرون بتا‐1a (Rebif؛ Avonex)، و تریفلونوماید (Aubagio).
پرسش نخست: آیا درمان زودهنگام مفید و بیخطر است؟
بدتر شدن ناتوانی
میان افراد دریافت کننده Aubagio یا Rebif، تعداد 28 بیمار از 100 مورد در طول دو سال درمان، در مقایسه با 34 مورد از میان 100 بیمار دریافت کننده دارونما (6% مزیت مطلق) با بدتر شدن ناتوانیهای خود مواجه شدند. سطح کیفیت کلی مطالعات وارد شده بسیار پائین بود، بنابراین اعتماد ما به این نتیجهگیری پائین است.
عود
درمان زودهنگام در مقایسه با افرادی که دارونما دریافت کردند، با نسبت کمتری از افرادی همراه بود که حمله دوم ‐ یعنی کسی که تشخیص MS داشت ‐ را در طول دو سال نخست درمان پشت سر گذاشتند. میان افراد درمان شده با Aubagio، تعداد 32 نفر از 100 بیمار، در مقایسه با 42 بیمار از 100 موردی که دارونما دریافت کردند، در طول دو سال نخست درمان، عودهای مجدد داشتند (10% مزیت مطلق). مجددا، سطح کیفیت کلی شواهد بسیار پائین است.
عوارض جانبی جدی
میان بیماران دریافت کننده Aubagio؛ Avonex؛ Betaferon؛ Copaxone؛ Movectro یا Rebif، در مقایسه با بیماران دریافت کننده دارونما، احتمالا تفاوتی اندک یا عدم تفاوت در وقوع عوارض جانبی جدی دیده میشود.
عوارض جانبی
میان بیماران درمان شده با Betaferon، تعداد 11 بیمار از 100 مورد، در مقایسه با یک نفر از 100 بیمار درمان شده با دارونما، دچار عوارض جدی شدند (10% آسیب مطلق). میان بیماران تحت درمان با Movectro، هفت بیمار از 100 مورد در مقایسه با دو مورد از 100 نفر دریافت کننده دارونما، با عوارض جانبی مواجه شدند (5% آسیب مطلق). میان بیماران دریافت کننده Copaxone، شش بیمار از 100 نفر در مقایسه با دو مورد از 100 بیمار درمان شده با دارونما، دچار یک عارضه جانبی شدند (4% آسیب مطلق).
پرسش دوم: کدام دارو برای درمان زودهنگام بهترین است؟
بدتر شدن ناتوانی
مقایسه غیر مستقیم Rebif با Aubagio هیچ تفاوتی را در کاهش بدتر شدن ناتوانی در طول دو سال درمان نشان نداد. به هر حال، مطالعات اندکی وجود داشتند و سطح کیفیت کلی شواهد بسیار پائین است.
عود
فقط یک مطالعه در مورد Aubagio موجود بود، بنابراین نمیتوانیم اثرات هر دارو را با دیگری مقایسه کنیم.
عوارض جانبی
دو داروی Rebif و Aubagio با تعداد کمتری از بیماران خارج شده از مطالعه همراه بودند، زیرا عوارض جانبی آنها در مقایسه با Betaferon؛ Copaxone؛ یا Movectro کمتر بودند.
پرسش سوم: آیا درمان زودهنگام بهتر از درمان تاخیری است؟
بدتر شدن ناتوانی
میان افرادی که با داروهای Avonex؛ Betaferon؛ Copaxone؛ یا Rebif تحت درمان زودهنگام قرار گرفتند، 37 بیمار از 100 مورد، در مقایسه با 40 بیمار از 100 مورد که درمان دیرهنگام دریافت داشتند (3% مزیت مطلق) در دوره پیگیری حداکثر پنج سال، با بدتر شدن میزان ناتوانی خود روبهرو شدند. با این حال، تنوع زیاد میان مطالعات و کیفیت پائین شواهد سطح اعتماد ما را به این نتیجه کم میکند.
عود
درمان زودهنگام، در مقابل درمان دیرهنگام، با نسبت کمتری از افرادی همراه بود که در هر زمانی از دوره پیگیری تا 10 سال، دچار حمله دوم هم شدند. میان افرادی که درمان زودهنگام خود را با داروهای Betaferon؛ Copaxone؛ یا Rebif دریافت کردند، 64 بیمار از 100 بیمار در مقایسه با 83 بیمار از 100 موردی که این داروها را دیرتر دریافت کردند (19% مزیت مطلق)، با عودهای مکرر در حداکثر پنج سال دوره پیگیری مواجه شدند.
عوارض جانبی
هیچ نتیجهگیری در مورد عوارض جانبی جدی طولانیمدت یا قطع درمان به دلیل عوارض جانبی نمیتوانیم داشته باشیم، زیرا دادههای موجود در مطالعات وارد شده ناکافی بودند.
نتیجهگیری
شواهدی با کیفیت پائین از مطالعات وارد شده پیشنهاد میکنند که مزیتی کوچک و نامطمئن با درمان زودهنگام در مقایسه با دارونما یا درمان دیرهنگام در کاهش میزان بدتر شدن ناتوانی و عودها وجود دارد.
ما نمیتوانیم در مورد بیخطری طولانیمدت این داروها، زمانی که به صورت زودهنگام تجویز میشوند، نتیجهگیری کنیم، زیرا دادههای کافی در دسترس نیستند.
تا زمان به دست آمدن شواهد قانع کننده از هر تفاوتی در مورد مزایای داروهای مختلف اصلاح کننده بیماری، تجویز داروهایی که برای سالیان متمادی است در کار بالین استفاده میشوند و پروفایل بیخطری آنها بهتر شناخته شده، معقولترین انتخاب برای درمان زودهنگام به شمار میروند.
Authors' conclusions
Summary of findings
| Patient: adults with first attack suggestive of MS | |||||||
| Outcomes | Relative effect | Anticipated absolute effects* (95% CI) | Quality of the evidence | What happens | |||
| With placebo | With early disease‐modifying drugs treatment | Difference | |||||
| Disability‐worsening Proportion of participants with disability‐worsening, assessed by EDSS** during 24 months of treatment | OR 0.74 | 34.1% | 27.7% (20.2 to 37.1) | 6.4% fewer (13.9 fewer to 3 more) | ⊕⊝⊝⊝ | The risk of disability‐worsening is less with disease‐modifying drugs than with placebo, but there is a lot of uncertainty in the effect | |
| Relapse Proportion of participants with relapse during 24 months of treatment | OR 0.65 | 41.6% | 31.7% (21.3 to 44.4) | 10.0% fewer (20.3 fewer to 2.8 more) | ⊕⊝⊝⊝ | The risk of relapse is less with disease‐modifying drugs than with placebo, but there is a lot of uncertainty in the effects | |
| Occurrence of at least one serious adverse event Proportion of participants with at least one serious adverse event during 24 months of treatment | OR 0.78 | 8.0% | 6.3% | 1.6% fewer | ⊕⊕⊝⊝ | Compared to placebo, disease‐modifying drugs were associated with less risk of serious adverse events | |
| Withdrawls or drug discontinuation due to adverse events during 24 months of treatment | OR 2.43 | 3.5% | 8.0% | 4.6% more | ⊕⊝⊝⊝ | Compared to placebo interferon beta 1‐b, glatiramer acetate, and cladribine were associated with higher risk of withdrawals due to adverse events | |
| *The risk in the intervention group (and its 95% confidence interval) is based on the assumed risk in the comparison group and the relative effect of the intervention (and its 95% CI). **EDSS: expanded disability status scale | |||||||
| GRADE Working Group grades of evidence | |||||||
| aHigh risk of bias for blinding of participants and outcome assessment and incomplete outcome data. | |||||||
| Patient: adults with first attack suggestive of MS | ||||||
| Outcomes | Relative effect | Anticipated absolute effects* (95% CI) | Quality of the evidence | What happens | ||
| Without early disease‐modifying drug treatment | With early disease‐modifying drug treatment | Difference | ||||
| Disability‐worsening Proportion of participants with disability‐worsening at a maximum of five years' follow‐up (assessed by EDSS**) | OR 0.88 | 40.2% | 37.2% | 3.0% fewer | ⊕⊝⊝⊝ | No significant effect of early treatment compared to delayed treatment during five years' follow‐up; however there is a significant heterogeneity between the studies |
| Relapse Proportion of participants with relapse at a maximum of five years' follow‐up | OR 0.35 | 83.4% | 63.8% | 19.6% fewer | ⊕⊕⊝⊝ | Early treatment reduced the risk of relapses compared to delayed treatment during five years' follow‐up |
| *The risk in the intervention group (and its 95% confidence interval) is based on the assumed risk in the comparison group and the relative effect of the intervention (and its 95% CI). | ||||||
| GRADE Working Group grades of evidence | ||||||
| aHigh risk of bias for allocation concealment, blinding of outcome assessment and incomplete outcome data. | ||||||
Background
Description of the condition
Since the revision of the McDonald criteria in 2010 (Polman 2011), multiple sclerosis (MS) can be diagnosed at the time of a first clinical attack when magnetic resonance imaging (MRI) shows the presence of focal lesions in the white matter of the central nervous system, which are considered typical for MS in terms of distribution, morphology, evolution and signal abnormalities on conventional MRI sequences (Filippi 2016). Opinion leaders have recommended early action as "treating at first clinical attack may be the most effective strategy to manage disease progression" (Freedman 2014). Revised guidelines of the Association of British Neurologists (Scolding 2015) and NHS England (NHS England 2014) suggest that treatment should be advised for patients within 12 months of a first attack, if MRI establishes a diagnosis of MS according to the 2010 McDonald criteria or predicts a high likelihood of recurrent attacks. The benefit of starting early treatment with disease‐modifying drugs has been demonstrated by some short‐term trials that showed delay of a second attack in participants given interferons beta (ETOMS 2001) or glatiramer acetate (PRECISE 2009) compared with those on placebo. On the basis of these results, interferons beta and glatiramer acetate were approved by national regulatory agencies for treating MS at clinical onset (EMA 2015a). However, the available evidence does not indicate that the prevention of recurrent attacks has an effect on disability (CHAMPS 2012 (10 years FU); Frischer 2009), and large variability of long‐term disability‐worsening has been reported, even among people with frequent early relapses (Scalfari 2013).
Once the decision for early treatment is made, patients and their healthcare providers need to select one of several disease‐modifying drugs. Most of the evidence about the relative efficacy and safety of interventions is non‐specific to early treatment. In a previously published review, moderate‐ to high‐quality evidence suggested that alemtuzumab, natalizumab and fingolimod were associated with greater benefit for preventing recurrent attacks compared with placebo, and evidence of moderate quality indicated that natalizumab was associated with greater benefit for preventing disability‐worsening among all treatments evaluated (Tramacere 2015). Despite alemtuzumab and natalizumab having been proven to exert higher relapse suppression, because of safety concerns, the guidelines of the Association of British Neurologists recommended their use as second‐line treatment, or as treatment for people with rapidly evolving relapsing‐remitting MS. Beta interferons, glatiramer acetate, teriflunomide, dimethyl fumarate and fingolimod are recommended as first‐line agents (Scolding 2015). Australian and New Zealand guidelines allow neurologists the discretionary use of all disease‐modifying drugs as first‐line treatments (Broadley 2014).
Description of the intervention
We considered all disease‐modifying drugs that are used, approved or off‐label, or are currently under marketing authorisation or investigation for people with a first clinical attack. We considered that all agents used or under investigation for relapsing‐remitting MS could be given to people with a first attack complying with the 2010 McDonald criteria. More specifically, we are interested in drugs that have been approved for a first attack complying with 2010 McDonald criteria.
-
Beta interferons (Betaferon/Betaseron®; Extavia®; Rebif®; Avonex®) and glatiramer acetate (Copaxone®) (EMA 2015a; FDA 2012a; FDA 2012b; FDA 2013). These medications are administered subcutaneously, except for beta interferon 1a (Avonex®), which is administered via intramuscular injections. Approved for relapsing‐remitting MS
-
Natalizumab (Tysabri®) (EMA 2006; FDA 2006) administered by intravenous infusion at a dose of 300 mg every four weeks
-
Fingolimod (Gilenya®) (EMA 2011; FDA 2010) given at an oral dose of 0.5 mg once daily
-
Teriflunomide (Aubagio®) (EMA 2013a; FDA 2012) given at an oral dose of 7 mg or 14 mg once daily
-
Dimethyl fumarate (Tecfidera®) (EMA 2014a; FDA 2013) given at an oral dose of 240 mg twice daily
-
Alemtuzumab (Lemtrada®) (EMA 2013b; FDA 2014a) administered intravenously in two annual treatment courses ‐ the first at a dose of 12 mg daily on five consecutive days (60 mg total dose), and the second, 12 months later, on three consecutive days (36 mg total dose)
-
Daclizumab (Zinbryta®) administered by subcutaneous or intravenous injections and approved by the European Medicines Agency (EMA) (EMA 2016) and the Food and Drug Administration (FDA) (FDA 2016)
-
Ocrelizumab (Ocrevus®) (FDA 2017) administered intravenously at an initial single dose of 300 mg followed two weeks later by a second 300 mg intravenous infusion. Subsequent doses of 600 mg intravenously every six months. Approved for relapsing forms of MS and primary progressive MS
-
Pegylated interferon beta‐1a (Plegridy®) (EMA 2014b; FDA 2014b) given by subcutaneous injection at a dose of 125 µg every 14 days
-
Cladribine (Movectro®) approved in Russia and Australia in 2010 (Murphy 2010). EMA (EMA 2015b) and FDA in 2011 did not approve it because of a suspected increase in cancer risk. A meta‐analysis failed to confirm these concerns (Pakpoor 2015)
-
Mitoxantrone (Novantrone®) approved in 2000 in the USA (FDA 2000), Europe and other countries for relapsing‐remitting and progressive MS. It is administered as a short intravenous infusion every three months. Safety concerns include cardiotoxicity and acute leukaemia
-
Azathioprine (Imuran®) used in many countries on the basis of placebo‐controlled randomised controlled trials (RCTs) published more than two decades ago. However, since interferons beta were approved, azathioprine is no longer recommended as first‐line therapy (Goodin 2002). It is taken orally, 2 mg/kg or 3 mg/kg per day. Intravenous immunoglobulins are used for people with severe and frequent relapses, for whom other treatments were contraindicated (Scolding 2015)
-
Rituximab (Rituxan® or Mabthera®) administered intravenously. Currently under marketing authorisation or investigation
-
Laquinimod (Nerventra®) given at an oral dose of 0.6 mg daily. The drug received a negative opinion from EMA (EMA 2014c). Studies of laquinimod in relapsing‐remitting MS are ongoing (Active Biotech 2014).
How the intervention might work
Immunosuppressive or immunomodulatory effects are common to all treatments included in the review.
-
Approved interventions
-
-
Beta interferons are naturally occurring cytokines that possess antiviral activity and a wide range of anti‐inflammatory properties. Recombinant beta interferons are believed to directly increase expression and concentration of anti‐inflammatory agents, while downregulating expression of pro‐inflammatory cytokines (Kieseier 2011).
-
Glatiramer acetate exerts an immunomodulatory action by inducing tolerance or anergy of myelin‐reactive lymphocytes (Schmied 2003). Glatiramer acetate may promote neuroprotective repair processes (Aharoni 2014).
-
Natalizumab is a humanised monoclonal antibody directed against the alfa4 integrin. This integrin is essential in the process by which lymphocytes gain access to the brain by allowing cells to penetrate the blood‐brain barrier. Natalizumab binds alfa4β1 and alfa4β7 integrin on the surface of circulating T lymphocytes, preventing interaction with cellular adhesion molecules that facilitate extravasation and migration from the circulation to the central nervous system (CNS) (Millard 2011).
-
Fingolimod is a sphingosine‐1‐phosphate (S1P) receptor modulator that prevents lymphocyte egress from lymphoid tissues, thereby reducing autoaggressive lymphocyte infiltration into the CNS. S1P receptors are also expressed by many CNS cell types and have been shown to influence cell proliferation, morphology and migration. Fingolimod crosses the blood–brain barrier and therefore may have direct CNS effects (Chun 2010).
-
Teriflunomide acts as an inhibitor of dihydroorotate dehydrogenase (DHODH), a mitochondrial enzyme involved in pyrimidine synthesis for DNA replication in rapidly proliferating cells. The drug reduces T lymphocyte and B lymphocyte activation and proliferation, and may attenuate the inflammatory response to autoantigens in MS. However, the exact mechanism of action for teriflunomide is not fully understood. Some observations suggest that the drug may have immunological effects outside of its ability to inhibit pyrimidine synthesis in rapidly proliferating cells (Claussen 2012; Oh 2013).
-
Dimethyl fumarate derives from fumaric acid, promotes anti‐inflammatory activity and can inhibit expression of pro‐inflammatory cytokines and adhesion molecules. Actions of neuroprotective and myelin‐protective mechanisms have been proposed (Linker 2011; Wilms 2010).
-
Alemtuzumab is a monoclonal antibody to CD52 on the cell surface of lymphocytes and monocytes. Its effects are thought to be mediated by extended B and T lymphocyte depletion followed by a distinctive pattern of T and B cell repopulation that begins within weeks of treatment and leads to a rebalanced immune system, including an increased percentage of regulatory and memory T cells. Effects of alemtuzumab persisted after it was cleared from the circulation (Lycke 2015).
-
Daclizumab is a monoclonal antibody to the interleukin‐2 receptor CD25 that is expressed on immune cells. The exact mechanism is not well understood. Daclizumab interrupts interleukin‐2‐mediated cell activation, thereby preventing expansion of autoreactive T lymphocytes and inhibiting survival of activated T cells (Wuest 2011).
-
Ocrelizumab is a recombinant monoclonal antibody designed to selectively target CD20‐positive B lymphocytes, a specific type of immune cell thought to be a key contributor to myelin and axonal nerve cell damage. The drug depletes CD20 B cells, it increases antibody‐dependent cell‐mediated cytotoxicity effects and reduces complement‐dependent cytotoxicity effects (Kappos 2011).
-
Pegylated interferon beta‐1a (PEG‐IFN) is the drug obtained by PEGylation of IFN beta‐1a (Avonex®) (i.e. joining of a polyethylene glycol group (PEG) molecule to the IFN beta‐1a molecule). PEGylation has been applied to increase IFN stability, solubility and half‐life, and to reduce dosing frequency (Hu 2012).
-
Cladribine is a chemotherapeutic drug approved for treatment of people with hairy‐cell leukaemia, a subtype of chronic lymphoid leukaemia. Short courses of cladribine induce prolonged lymphopenia by selectively interfering with DNA synthesis and repair in T and B lymphocytes lasting months to years (Leist 2011).
-
Mitoxantrone is a cytotoxic drug that intercalates with DNA and inhibits both DNA and RNA synthesis, thus reducing the number of lymphocytes (Fox 2004).
-
-
Interventions used off‐label
-
-
Azathioprine is a cytotoxic immunosuppressive drug that acts as a prodrug for mercaptopurine, inhibiting an enzyme required for DNA synthesis. Thus it most strongly affects proliferating cells, such as T cells and B cells of the immune system (Tiede 2003).
-
Intravenous immunoglobulins may improve remyelination of demyelinated axons through mediation of cytokines. However, their mechanism of action in MS remains unclear (Stangel 1999).
-
Rituximab is a monoclonal antibody to CD20 expressed on pre‐B and mature B cells; it acts by depleting these cells in the circulation and the CNS. Although MS was traditionally considered a T cell‐mediated disease, accumulating evidence suggests that B cells may play a role (Lycke 2015; Naismith 2010).
-
-
Interventions currently under marketing authorisation or investigation
-
-
Laquinimod may have an immunomodulatory effect on the peripheral and central nervous systems. This drug modulates the function of various myeloid antigen‐presenting cell populations, which then downregulate pro‐inflammatory T cell responses. Furthermore, data indicate that laquinimod acts directly on resident cells within the CNS to reduce demyelination and axonal damage. However, exactly how the drug works remains unknown (Varrin‐Doyer 2014).
-
Why it is important to do this review
Uncertainty
Many treatment options are available, and patients and their clinicians may choose to start with a drug of moderate efficacy and general safety or with a drug of high efficacy and a complex safety profile. Consequently, a comprehensive appreciation of the benefits and risks of all treatment approaches is urgently needed (Scolding 2015; Wingerchuk 2014).
Early treatment
Interferons and glatiramer acetate are indicated by the FDA and the EMA for treatment of people who have experienced a first attack and are at high risk of recurrent attacks. Other immunotherapies have been reported to delay recurrent attacks, although their effect on disability prevention remains unclear. In addition, various national guidelines provide conflicting information about effects of these treatments and their use as first‐line or second‐line therapy (see Description of the condition). This uncertainty results from several factors, including intermediate outcomes and short follow‐up periods in the clinical trials included in published reviews. Immunotherapies administered early in the disease can delay intermediate outcomes (i.e. short‐term relapses), but suppression of early relapses may not necessarily correlate with long‐term disability prevention (Frischer 2009; Scalfari 2013). Therefore an effect on disability cannot be claimed solely on the basis of relapse prevention (EMA 2015a). Given that most evidence has been derived from short‐term trials with low power to investigate rare adverse events, safety outcomes have not been extensively investigated. Consequently, a demonstration and quantification of the benefit and safety of the early treatment versus delayed treatment is still required.
Choice of interventions for early treatment
Patients and their doctors must be given information about the relative benefit and safety of the various treatment options if they are to make informed decisions. Various disease‐modifying drugs have been shown to have different benefit/acceptability profiles. Differences in benefit are as important to consider as differences in safety. For example, local injection site reactions and flu‐like symptoms have emerged as the main adverse effects of interferons beta, and cardiotoxicity and acute leukaemia as major safety issues for mitoxantrone. Investigators have described fatal cases of progressive multi‐focal leucoencephalopathy in people treated with natalizumab (EMA 2006), fingolimod (EMA 2011) and dimethyl fumarate (EMA 2014a). To support informed decision‐making, there is a need to identify, systematically collect and synthesise information about relative safety and efficacy between interventions administered to people with the first attack suggestive of MS.
Relevance
In July 2014, Cochrane Multiple Sclerosis launched a ‘Priority Setting Survey’ and invited consumers and MS societies to answer a questionnaire identifying priority research questions considered to have the most relevant impact for all stakeholders. The question ‐ "Early onset of treatment may avoid disease progression?" ‐ was one of the most frequently reported by people with MS and family members. The question ‐ "Does early treatment with aggressive disease‐modifying drugs improve the prognosis for people with MS?" ‐ addresses one of the top 10 MS priorities reported by the James Lind Alliance in collaboration with the UK MS Society 2012. This review aims to answer these two questions by comparing all disease‐modifying drugs with placebo; it also plans to provide an assessment of the relative effects of each drug compared with one other and a ranking of treatments according to benefit and safety. The significance of this project is underlined by the fact that evaluation of disease‐modifying drugs for people with a first clinical attack has been identified as a priority and is featured in the Cochrane Priority Review List 2015/16.
Most published reviews have compared a single treatment versus placebo and have made inferences about benefits and safety. This information is unlikely to be useful in practice, as people with MS have several treatment options. Network meta‐analysis (NMA), which is an extension of the traditional pairwise meta‐analysis, collates information from studies comparing different treatments in order to form a ‘network of interventions’. This provides information about the relative effects of all interventions included in the network, even those not directly compared in any trial and a hierarchy of treatments ordered by efficacy and safety. None of the existing comparative effectiveness reviews have specifically addressed disease‐modifying drugs in early treatment. As the number of people who choose to start treatment soon after diagnosis increases, it is important for healthcare providers to know the relative benefit and safety of the various treatment options in this particular setting.
Another important limitation of existing reviews is that all include randomised controlled trials. Although this study design is theoretically associated with low risk of bias, it has several shortcomings. First, randomised trials do not provide patient follow‐up for a long period; consequently, this design is not appropriate when rare safety outcomes are of interest. Second, randomised trials are typically undertaken in highly selected conditions and do not represent real‐world settings. Consequently, the generalisability of findings is doubtful. For these reasons, interest in including non‐randomised studies in the decision‐making process is growing (Faria 2015), and innovative methods have been developed for combining data obtained through different study designs (Schmitz 2013; Verde 2015).
Overall, we believe that despite the wealth of information and the plethora of studies and reviews on treatments for MS, uncertainty surrounds the relative ranking of disease‐modifying drugs when treatment starts early. In particular, the issue of safety is less well studied, as evidence from non‐randomised studies that provide useful information on adverse events has not been systematically considered. We believe that having access to high‐quality health information is an essential component of good decision‐making processes and helps people take control of their health. Our certainty comes from the results of studies previously undertaken by Cochrane Multiple Sclerosis, wherein people with MS and their family members told us that they want access to high‐quality information about MS provided by sources they can trust (Colombo 2014; Colombo 2016; Hill 2012; Synnot 2014).
Potential to change or influence clinical practice or health policy
The review aimed to provide critical information necessary in making informed healthcare decisions on treatments for people with MS, their neurologists and family members. Notably, marked variability in treatment decisions has been reported, likely as the result of physician preference and opinion (Palace 2013). Disease‐modifying drugs are expensive and their use has significant economic implications for the healthcare system. These treatments are associated with high risk of adverse events, which indirectly further increases treatment costs. Identifying treatment that offers a better benefit and safety profile, with particular attention to safety, may help to reduce costs.
Objectives
The review aimed to answer three research questions:
-
is early treatment efficacious and safe compared to placebo or no treatment?
-
are there differences in efficacy and safety between the various drugs administered for early treatment?
-
is early treatment better than delayed treatment?
Consequently, the objectives were:
-
to estimate the benefit and safety of disease‐modifying drugs that have been evaluated in all studies (randomised or non‐randomised) for the treatment of a first clinical attack suggestive of MS compared either with placebo or no treatment;
-
to assess the relative efficacy and safety of disease‐modifying drugs according to their benefit and safety;
-
to estimate the benefit and safety of disease‐modifying drugs that have been evaluated in all studies (randomised or non‐randomised) for treatment started after a first attack ('early treatment') compared with treatment started after a second attack or at another later time point ('delayed treatment').
Methods
Criteria for considering studies for this review
Types of studies
We included RCTs, open‐label extension (OLE) studies, controlled clinical trials, cohort studies and registries. Inclusion of non‐randomised controlled studies was supported by the aim to provide additional evidence about long‐term outcomes (in particular safety outcomes) and populations that are typical of real world practice.
An OLE study follows on from a RCT. At the end of the RCT or after the occurrence of a primary outcome event (e.g. conversion to MS), participants receiving placebo were offered the option to switch to the active treatment during an ‘open‐label’ follow‐up. In these studies efficacy and safety were evaluated comparing the early‐treatment group with the delayed‐treatment group.
We included studies with follow‐up of at least one year. We excluded non‐comparative studies.
Types of participants
Adults (aged 18 years or older) with a first clinical attack suggestive of MS as defined in the original articles. We included participants with optic neuritis, isolated brainstem or cerebellar syndrome or spinal cord or other clinical syndrome as a first attack and monofocal or multi‐focal first attacks.
Types of interventions
The following interventions administered as monotherapy were eligible for inclusion: alemtuzumab, azathioprine, cladribine, daclizumab, dimethyl fumarate, fingolimod, glatiramer acetate, immunoglobulins, interferon beta‐1b (Betaseron®), subcutaneous interferon beta‐1a (Rebif®), intramuscular interferon beta‐1a (Avonex®), laquinimod, mitoxantrone, natalizumab, ocrelizumab, pegylated interferon beta‐1a, rituximab and teriflunomide. We included regimens irrespective of their dose and assumed that treatments are 'jointly randomisable' across trial participants (Salanti 2012). To address the first two review questions we included studies comparing disease‐modifying drugs with placebo, no treatment or another active treatment. To address the third question we included studies comparing early treatment versus delayed treatment with disease‐modifying drugs. We excluded combination treatments, non‐pharmacological treatments, and interventions consisting of over‐the‐counter drugs.
Types of outcome measures
Primary outcomes
Primary efficacy outcomes
Disability‐worsening
We measured this as the proportion of participants who experienced disability‐worsening (as defined by the study authors) at 24 months, 36 months or at the end of the study. Most investigators used the expanded disability status scale (EDSS) (Kurtzke 1983). EDSS is based on the results of a neurological examination and the patient’s ability to walk. Scores range from 0 (no neurological abnormality) to 10 (death from multiple sclerosis). Disability‐worsening is often defined as a sustained (3 months or 6 months) increase of at least one point in EDSS recorded over a relapse‐free period.
Relapses
We measured this as the proportion of participants who experienced new relapses over 12 months, 24 months and 36 months or at the end of the study. A relapse is defined as a newly developed or recently worsened symptom of neurological dysfunction that lasted more than 24 hours with or without objective confirmation and that stabilised or resolved either partly or completely.
Primary safety outcomes
Occurrence of at least one serious adverse event
We measured this as the proportion of participants with at least one serious adverse event during the study.
Withdrawing from the study or discontinuing the drug due to adverse events
We measured this as the proportion of participants who withdrew from the study or discontinued the drug due to adverse events during the study.
Secondary outcomes
Time to conversion to clinically definite multiple sclerosis (CDMS)
As defined by Poser diagnostic criteria (Poser 1983).
Withdrawing from the study or discontinuing the drug for any reason
We measured this as the proportion of participants who discontinued treatment and were followed‐up to the end of the study or who were lost to follow‐up for any reason.
Search methods for identification of studies
We did not apply any language restrictions to the search.
Electronic searches
The Information Specialist searched the Cochrane Multiple Sclerosis and Rare Diseases of the CNS Trials Register , which, among other sources, contains trials from:
-
Cochrane Central Register of Controlled Trials (CENTRAL; 2016, issue 12);
-
MEDLINE (PubMed) (1966 to 31 December 2016);
-
Embase (Embase.com) (1974 to 31 December 2016);
-
Cumulative Index to Nursing and Allied Health Literature (CINAHL) (EBSCOhost) (1981 to 31 December 2016);
-
Latin American and Caribbean Health Science Information Database (LILACS) (Bireme) (1982 to 31 December 2016);
-
ClinicalTrials.gov (www.clinicaltrials.gov); and
-
World Health Organization (WHO) International Clinical Trials Registry Platform (apps.who.int/trialsearch).
Information on the Trials Register or the Review Group and details of the search strategies used to identify trials can be found in the 'Specialised Register' section within the Cochrane Multiple Sclerosis and Rare Diseases of the CNS module. We described in Appendix 1 the keywords that we used to search for trials. We performed an expanded search to identify articles of non‐randomised studies in MEDLINE (Appendix 2) and Embase (Appendix 3).
Searching other resources
-
We handsearched the reference lists of all retrieved articles, texts and other reviews on the topic.
-
We contacted study authors and researchers active in this field to ask for additional data, if necessary.
-
We searched for FDA and EMA reports.
Data collection and analysis
Selection of studies
Two teams of three authors each (MC, MM and AS; OB, FP and GF) independently assessed titles and abstracts to identify relevant studies for inclusion. We obtained the full text of the study when necessary to confirm inclusion. All completed RCTs, OLEs, CCTs, and cohort studies were included if the studies contained clinically relevant benefit and safety outcomes for any of the drugs included in the review and met the inclusion criteria. The reference lists of the articles were screened to identify any studies missed by the electronic database search. Discrepancies in judgement were resolved by discussion between review authors.
Data extraction and management
The six review authors extracted data independently and in duplicate using an Excel sheet piloted on three articles. We resolved disagreements on extractions by discussion.
Outcome data
For all dichotomous outcomes, we extracted arm‐level data (number of participants with events and number of participants). For time to conversion to CDMS we extracted hazard ratios (HR) and relative standard errors. When timing of outcome measure was not reported at selected time points, we extracted data as close as possible to that time point. When outcome data were not reported or were unclear in the original article we checked reports from the FDA or EMA. If necessary, we sought additional information from the trial investigators. For non‐randomised and OLE studies, we preferred adjusted relative treatment effects to unadjusted.
Other extracted data
-
Study design: year of publication, monocentric or multicentric, recruitment period, time between onset of first attack and randomisation method;
-
Participants: age, gender, monofocal or multi‐focal onset presentation, type of first attack, baseline EDSS, baseline MRI lesions, proportion of participants treated with steroids at the first attack;
-
Definitions of relapse and disability‐worsening;
-
Interventions: route, dose, frequency or duration of treatment/follow‐up.
In OLE studies we also extracted the number of participating centres, and the number of participants who entered and completed the study during different follow‐up times. For each non‐randomised study, we recorded the analysis method used to reduce confounding.
Assessment of risk of bias in included studies
RCTs and OLEs
We assessed the risk of bias of each included study using the Cochrane recommendations for assessment (Higgins 2011). These included: random sequence generation, allocation concealment, blinding of personnel and participants, blinding of outcome assessors, incomplete outcome data, selective outcome reporting, and evidence of major baseline imbalance. We explicitly judged the risk of bias on each criterion as 'low', 'high' or 'unclear'. We judged attrition as having low risk of bias when numbers and causes of dropouts were balanced between arms. To summarise the quality of evidence we considered allocation concealment, blinding of outcome assessors and incomplete outcome data to classify each study as having low risk of bias (when all three criteria were judged at low risk of bias), high risk of bias (when at least one criterion was at high risk of bias), unclear risk of bias when all three criteria were judged as having unclear risk of bias, and moderate risk of bias in the remaining cases.
Participants in OLE studies were informed at the time they were recruited into the RCT that they could be enrolled into an OLE study. Then the participants taking placebo had the possibility to switch to the active treatment when they were diagnosed with CDMS or after they completed the RCT. The participant allocated to the active treatment could decide to enter the OLE study at the end of the RCT and continue taking the treatment. The consequences of the OLE design were that original allocation concealment was lost, participants entering the extension were clearly selected, for example, those who had treatment benefit and did not discontinue treatment due to adverse events. Moreover, participants and outcome assessors were not blinded in the OLE phases. For these reasons, we considered OLE studies at high risk of bias for random sequence generation, allocation concealment and blinding of participants and outcome assessors. We reported the 'Risk of bias' assessments for RTC and OLE studies separately.
Cohort studies
We assessed the risk of bias in the cohort studies using the ROBINS‐I tool for NRS (Sterne 2016) that includes the following bias domains: confounding, selection of participants into the study, classification of interventions, deviations from intended interventions, missing data, measurement of outcomes and selection of reported result. We judged each domain as pertaining to low, moderate, serious, critical risk of bias or no information about risk of bias and performed an overall 'Risk of bias' assessment for each study according to the criteria reported in the ROBINS‐I tool for NRS (Sterne 2016).
Adverse events
We evaluated the methods of monitoring and detecting adverse events in each included study answering to the following two questions: firstly, did researchers actively monitor for adverse events, or did they simply provide spontaneous reporting of adverse events that arose; and secondly, did study authors define serious adverse events according to an accepted international classification and report the number of serious adverse events? (Singh 2011). We have reported answers to these questions in a table 'Assessment of adverse events monitoring, definition and reporting of serious adverse events'. We used the resulting answers to decide indirectness in GRADE.
MC, MM and AS independently assessed the risk of bias of each RCT and OLE study and resolved disagreements by discussion. OB, FP and GF independently assessed risk of bias of the cohort studies and resolved disagreements by discussion. The final judgments were established by GF and CDG.
Measures of treatment effect
We estimated, through pairwise meta‐analysis, treatment effects of competing interventions by using odds ratios (ORs) with 95% confidence intervals (95% CIs) for each binary outcome at each time point and HR with 95% CIs for conversion to CDMS. We estimated the absolute effects for primary outcomes included in the 'Summary of fIndings' table. We presented the results from NMA of RCTs as summary relative effect sizes according to the type of outcome.
Unit of analysis issues
For multi‐arm trials, intervention groups are all those that can be included in a pairwise comparison of intervention groups, which, if investigated alone, would meet the inclusion criteria. For example, if a study compares 'interferon beta versus natalizumab versus interferon beta plus natalizumab' only one comparison ('interferon beta vs natalizumab') addresses the review objectives. We merged data from study arms involving the same drug at different doses. For outcomes for which data were available as treatment effects (i.e. HR), we used the data from the arm trial at highest dose.
Dealing with missing data
We considered missing outcome data in the 'Risk of bias' assessment. In some of the studies included in the review, missing outcome rates were considerable and we accounted for the their impact on the outcomes assuming that they were not missing at random. We assumed a relationship between the unknown outcome among missing participants and the known outcome among observed participants by using the 'informative missingness odds ratios' (IMORs) approach, allowing for uncertainty in the missing data imputations (Higgins 2008; White 2008). We assumed in both groups that the odds of relapses or disability‐worsening in missing participants were roughly 6 times times the odds in the observed participants with 95% CI from 3 to 7 (IMOR = 5.95, 95% CI 3 to 7). We set these values after discussion with clinicians, who suggested that missing outcomes are most probably unfavourable outcomes. To implement the approach we used the 'metamiss' command in Stata v14 (available from https://www.mrc‐bsu.cam.ac.uk/software/stata‐software/).
Assessment of heterogeneity
In standard pairwise meta‐analyses, we estimated different heterogeneity variances for each pairwise comparison. In NMA, we assumed a common estimate for the heterogeneity variance for all comparisons. We assessed the presence of statistical heterogeneity within each pairwise comparison by visual inspection of the forest plots and by calculating the I2 statistic (Higgins 2003). The type of drug used in the various studies was a suspected source of heterogeneity and we performed all pairwise meta‐analyses in subgroups, considering the P value from the subgroup analyses as an indication of differences between interventions.
Assessment of reporting biases
We were not able to assess the possibility of reporting bias as the number of studies were fewer than 10 in all the analyses.
Data synthesis
We performed pairwise meta‐analyses using a random‐effects model (using the Mantel‐Haenszel estimator for Q) for any treatment versus placebo and for early versus delayed treatment. We performed NMA using a random‐effects model for outcomes evaluated in RCTs over 24 months of follow‐up. The validity of network estimates in NMA is based on the assumption of transitivity (Salanti 2012). We had planned to assess whether the distribution of potential effect modifiers (among those reported extracted data in Data extraction and management) were balanced across comparisons (Jansen 2013), however, none of the networks that we identified presented enough data to evaluate the assumptions. We conducted pairwise meta‐analyses in Review Manager 5 (RevMan 5) software (RevMan 2017) and NMA in Stata v14 using the network and network_graphs packages in Stata v14 (available from https://www.mrc‐bsu.cam.ac.uk/software/stata‐software/).
Subgroup analysis and investigation of heterogeneity
We used the test for subgroup differences to assess the statistical heterogeneity across comparisons with different active agents within standard pairwise meta‐analyses. In the context of NMA, we did not have enough information to assess incoherence, defined as the statistical disagreements between direct and indirect effect sizes, as only indirect evidence was available.
Sensitivity analysis
We re‐ran the analyses of excluding observational studies when relevant.
'Summary of findings' table
We have presented the main results of the review in two 'Summary of findings' tables, according to recommendations provided in Chapter 11 of the Cochrane Handbook for Systematic Reviews of Interventions (version 5.1.0) (Schunemann 2011). We judged the credibility of the evidence from pairwise meta‐analysis in accordance with the methods of the GRADE Working Group (GRADE Working Group 2004). For each outcome the assumed risk in the control group was based on the proportion of events in the included studies.
In the first 'Summary of findings' table we included an overall grading of the evidence for four patient‐important outcomes with regards to the review question 'Are disease‐modifying drugs for a first attack suggestive of MS effective and safe compared to placebo?'
-
Disability‐worsening during 24 months of treatment
-
Relapse during 24 months of treatment
-
Occurrence of at least one serious adverse event during 24 months of treatment
-
Withdrawing from the study or discontinuing the drug due to adverse events during 24 months of treatment
In the second 'Summary of findings' table we included an overall grading of the evidence for two patient‐important outcomes with regards to the review question 'Is early treatment with disease‐modifying drugs more efficacious and safe than delayed treatment?'
-
Disability‐worsening at a maximum of five years' follow‐up from randomisation
-
Relapse at a maximum of five years' follow‐up from randomisation
Results
Description of studies
Results of the search
A flow diagram describes the results of the electronic search (Figure 1).
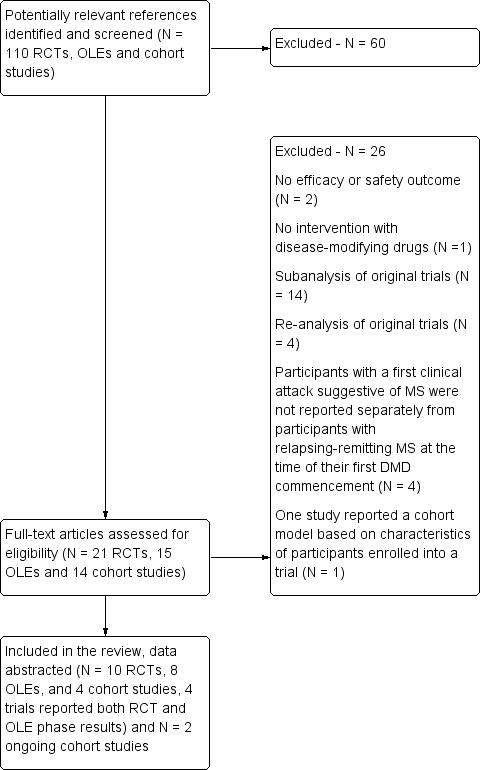
Study flow diagram.
DMD: disease‐modifying drugs; OLEs: open label extension studies; RCTs: randomised controlled trials
Included studies
Characteristics of included studies and Table 1 provide details on the characteristics of the included studies. We included 10 RCTs involving 3745 participants and published between 2000 and 2014 (Achiron 2004; BENEFIT 2006; CHAMPS 2000; ETOMS 2001; Motamed 2007; ORACLE 2014; Pakdaman 2007; PRECISE 2009; REFLEX 2012; TOPIC 2014); eight OLEs involving 1868 participants and published between 2006 and 2016 (BENEFIT 2007 (3 years FU); BENEFIT 2009 (5 years FU); BENEFIT 2014 (8.7 years FU); BENEFIT 2016 (11 years FU); CHAMPS 2006 (5 years FU); CHAMPS 2012 (10 years FU); PRECISE 2013 (5 years FU); REFLEX 2016 (3 and 5 years FU)); and four cohort studies involving 4775 participants and published between 2010 and 2016 (ACISS 2010; GERONIMUS 2013; MSBASIS 2016; Tintore 2015).
| Type of intervention | Route | RCTs N = 10 | OLEs N = 8 | Cohort studies N = 4 |
| Interferon beta‐1b sc (Betaseron®) | sc | 1 | 4 OLEs at a maximum follow‐up of 3, 5, 8.7, and 11 years | 0 |
| Interferon beta‐1a (Avonex®) | im | 2 | 2 OLEs at a maximum follow‐up of 5 and 10 years | 0 |
| Interferon beta‐1a (Rebif®) | sc | 3 | 1 OLE at a maximum follow‐up of 3 and 5 years | 0 |
| Glatiramer acetate sc | sc | 1 | 1 OLE at a maximum follow‐up of 5 years | 0 |
| Cladribine os | os | 1 | 0 | 0 |
| Teriflunomide os | os | 1 | 0 | 0 |
| Immunoglobulins iv | iv | 1 | 0 | 0 |
| disease‐modifying drugs | ‐ | 0 | 0 | follow‐up from 2 to 6 years |
im: intramuscular; iv: intravenously; OLEs: open‐label extension studies; os: oral; RCTs: randomised controlled studies; sc: subcutaneous
All RCTs were placebo‐controlled studies with a median of two years follow‐up. Six (60%) of the 10 included RCTs assessed interferons in people with a first attack suggestive of MS. BENEFIT 2006 provided data of four OLEs at maximum follow‐up of three, five, eight and 11 years from randomisation (BENEFIT 2007 (3 years FU); BENEFIT 2009 (5 years FU); BENEFIT 2014 (8.7 years FU); BENEFIT 2016 (11 years FU)); CHAMPS 2000 provided data of two OLEs with a maximum follow‐up of five and 10 years (CHAMPS 2006 (5 years FU); CHAMPS 2012 (10 years FU)); PRECISE 2009 provided data of one OLE with a maximum follow‐up of five years (PRECISE 2013 (5 years FU)); and REFLEX 2012 provided data of two OLEs with at maximum follow‐up of three and five years (REFLEX 2016 (3 and 5 years FU)). Follow‐up of the cohort studies ranged from two to six years.
We identified two ongoing cohort studies (NCT01371071; NCT01013350). We will include these studies in a future update of this review. Characteristics of ongoing studies provides details on the characteristics of the two studies.
Excluded studies
After full‐text review we excluded 26 studies (see Characteristics of excluded studies): 14 studies reported sub‐analysis of original trials (BENEFIT 2007; BENEFIT 2008; BENEFIT 2011; BENEFIT 2012; BENEFIT 2014a; CHAMPS 2001; CHAMPS 2002a; CHAMPS 2002b; CHAMPS 2002c; CHAMPS 2003; ETOMS 2003; Filippi 2004; REFLEX 2014a; REFLEX 2014b) and four studies reported re‐analysis of original trials (BENEFIT 2014b; CHAMPIONS 2015; CHAMPS 2009; Moraal 2009); in four studies participants with a first clinical attack suggestive of MS were not reported separately from participants with relapsing‐remitting MS at the time of their first disease‐modifying drugs commencement (Meyniel 2012; Mowry 2009; MSBASIS 2015; SWISS COHORT STUDY 2013); two studies did not include efficacy or safety outcome (Curkendall 2011; SWISS COHORT STUDY 2016); one cohort study did not evaluate disease‐modifying drugs (Kuhle 2015); and one study reported a cohort model based on characteristics of participants enrolled into the BENEFIT trial (Lazzaro 2009).
Risk of bias in included studies
The risk of bias assessments are summarised separately for RCTs and OLEs in Figure 2. Details on the judgement for each RCT and OLE study and the reason for that judgement are reported in Characteristics of included studies. Risk of bias in the included cohort studies was assessed by ROBINS‐I and it is reported in Table 2.

Review authors' judgements about each risk of bias item presented as percentages across all included studies and review authors' judgements about each risk of bias item for each included study
| Bias | Authors’ judgment | Support for judgement |
| Confounding | Serious | All known important domains were not appropriately controlled for |
| Selection of participants into the study | Low | All participants who would have been eligible for the target trial were likely included in the study and for each participant start of follow up and start of intervention likely coincided |
| Classification of interventions | Low | Intervention status was well defined and intervention definition was based on information collected at the time of intervention |
| Deviations from intended interventions | NI | No information was reported on whether there was deviation from the intended intervention |
| Missing data | Critical | There were critical differences between early, delayed or no treatment in participants with missing data and an appropriate analysis to address missing data was not done |
| Measurement of outcomes | Serious | The outcome measures were subjective and assessed by assessors aware of the intervention received by study participants. This judgment is applicable to all the three outcomes reported in the article |
| Selection of the reported result | Low | There was evidence that reported results corresponded to all intended outcomes and analyses |
| Overall bias | Critical | Study judged to be at critical risk of bias in one domain |
| Bias | Authors’ judgment | Support for judgement |
| Confounding | Moderate | Confounding expected, all known important confounding domains appropriately measured and controlled for, and reliability and validity of measurement of important domains were sufficient, such that we do not expect serious residual confounding |
| Selection of participants into the study | Low | All participants who would have been eligible for the target trial were likely included in the study and for each participant start of follow up and start of intervention likely coincided |
| Classification of interventions | Serious | Intervention status was not well defined |
| Deviations from intended interventions | NI | No information was reported on whether there was deviation from the intended intervention |
| Missing data | Low | Data were reasonably complete |
| Measurement of outcomes | Serious | CDMS was assessed by assessors aware of the intervention received by study participants |
| Selection of the reported result | Low | There was evidence that reported results corresponded to all intended outcomes and analyses |
| Overall bias | Serious | Study judged to be at serious risk of bias in two domains, but not at critical risk of bias in any domain |
| Bias | Authors’ judgment | Support for judgement |
| Confounding | Serious | Important domains were not appropriately controlled for |
| Selection of participants into the study | Critical | Selection into the study was very strongly related to intervention and outcome and this could not be adjusted for in analyses |
| Classification of interventions | Serious | Intervention status was not well defined |
| Deviations from intended interventions | NI | No information was reported on whether there was deviation from the intended intervention |
| Missing data | NI | No information was reported on missing data |
| Measurement of outcomes | Serious | The outcome measures were subjective and they were assessed by assessors aware of the intervention received by study participants. Follow‐up duration not reported |
| Selection of the reported result | Low | There was evidence that reported results corresponded to all intended outcomes and analyses |
| Overall bias | Critical | Study judged to be at critical risk of bias in one domain |
| Bias | Authors’ judgment | Support for judgement |
| Confounding | Serious | Important domains were not appropriately controlled for |
| Selection of participants into the study | Low | All participants who would have been eligible for the target trial were likely included in the study and for each participant start of follow up and start of intervention likely coincided |
| Classification of interventions | Serious | Intervention status was not well defined |
| Deviations from intended interventions | NI | No information was reported on whether there was deviation from the intended intervention |
| Missing data | Serious | Reasons for missing data differed substantially across interventions, and the analysis is unlikely to have removed the risk of bias arising from the missing data |
| Measurement of outcomes | Serious | The outcome measures were subjective and assessed by assessors aware of the intervention received by study participants. This judgment is applicable to all outcomes reported in the article |
| Selection of the reported result | Low | There was evidence that reported results corresponded to all intended outcomes and analyses |
| Overall bias | Serious | Study judged to be at serious risk of bias in four domains, but not at critical risk of bias in any domain |
ROBINS‐I is a tool to evaluate Risk Of Bias In Non‐randomised Studies ‐ of Interventions (Sterne 2016)
RCTs
Random sequence generation
Eight out of 10 RCTs (80%) reported adequate methods for allocation sequence and we judged them to be at low risk of bias. Two RCTs (20%) did not provide enough information to assess allocation sequence and we judged the risk of bias to be unclear for these studies.
Allocation concealment
Four out of 10 RCTs (40%) reported adequate methods for allocation concealment and we judged them to be at low risk of bias. Six RCTs (60%), did not provide enough information to assess allocation concealment and we judged the risk of bias to be unclear for these studies.
Other major baseline imbalance
Eight out of 10 RCTs (80%) were adequate in terms of baseline balance and we judged them to be at low risk of bias. Two RCTs (20%) did not provide enough information to assess the presence of other baseline imbalance and we judged the risk of bias to be unclear for these studies.
Blinding of participants and personnel
Only one RCT (10%) reported adequate methods for blinding participants and personnel to treatment allocation. Two RCTs (20%) did not provide enough information and we judged the risk of bias to be unclear for these studies. We judged seven RCTs (70%) to be at high risk of bias (BENEFIT 2006; ETOMS 2001; Motamed 2007; ORACLE 2014; PRECISE 2009; REFLEX 2012; TOPIC 2014).
Blinding of outcome assessors
Four out of 10 RCTs (40%) reported adequate methods for blinding outcome assessors to treatment allocation. Five RCTs (50%) did not provide enough information and we judged the risk of bias to be unclear for these studies. We judged one open‐label study to be at high risk of bias for blinding of outcome assessors (Motamed 2007).
Incomplete outcome data
We judged four out of 10 RCTs (40%) to be at low risk of bias because missing outcome data were balanced in numbers across intervention groups with similar reasons for missing data across groups. Two (20%) studies (Motamed 2007; Pakdaman 2007) reported insufficient information so that it was uncertain whether or not the handling of incomplete data was appropriate. We judged risk of bias for these two trials to be unclear. We judged four trials (40%) to be at a high risk of bias, of which three (CHAMPS 2000; ORACLE 2014; PRECISE 2009) were stopped before the scheduled period of follow‐up because the studies had ended prematurely and a low percentage of participants completed the studies. The fourth study (TOPIC 2014) showed more than 40% of participants lost to follow‐up.
Selective outcome reporting
We judged the majority of included studies (six of 10; 60%) to be at low risk of bias. The study protocols were available or the published reports included those outcomes that had been pre‐specified in the methods section of primary articles. One study did not provide enough information to assess this item and the risk of bias was judged to be unclear. In three trials (30%), we judged risk of bias to be high (Achiron 2004; ORACLE 2014; Pakdaman 2007).
Method of adverse event monitoring
Five included trials (5 out of 10; 50%) reported that adverse events were actively monitored. Four trials (40%) reported insufficient information about the method of adverse events monitoring so that it was uncertain whether or not adverse events were monitored appropriately. CHAMPS 2000 reported adverse events only during the first six months of treatment (Table 3).
| Study | Did the researchers actively monitor for adverse events or did they simply provide spontaneous reporting of adverse events that arose? | Did the authors define serious adverse events according to an accepted international classification and report the number of serious adverse events? |
| No information | No information | |
| No information | No information | |
| Yes, active monitoring.“Regular visits were scheduled for safety assessments at months 3, 6, 9, 12, 18, and 24”. (page 1243) | No information | |
| No information | No information | |
| No information | No information | |
| No information | No information | |
| No information | No information | |
| No active monitoring. "Each center was instructed to report all adverse events during the first six months of treatment, but thereafter to report only serious adverse events". (page 899) | No information | |
| No information | No information | |
| No information | No information | |
| Yes, active monitoring. "Safety was assessed at 1, 6, 12, 18, 24 months". (page 1577) | Yes to both questions. "Serious adverse events were defined according to the guidelines of the International Conference on Harmonisation". (page 1580) | |
| No information | No information | |
| Yes, active monitoring."Safety assessments were performed at the end of months 1, 2, 3, 9, 15, and 21 by a neurologist". (page 345) | No information | |
| No information | No information | |
| Yes, active monitoring. "Adverse events and laboratory findings were recorded at study visits and at regularly scheduled interim visits" (page 259). "International Conference on Harmonisation of Technical Requirements for Registration of Pharmaceuticals for Human Use". (page 258) | Yes to both questions. "International Conference on Harmonisation of Technical Requirements for Registration of Pharmaceuticals for Human Use". (page 258) | |
| No information | No information | |
| Unclear whether the researchers actively monitored for adverse events or they simply provided spontaneous reporting of adverse events | No information | |
| Unclear whether the researchers actively monitored for adverse events or they simply provided spontaneous reporting of adverse events | No information | |
| Yes, active monitoring. "Active monitoring by personnel was ensured via various testing". (page 34). "Adverse events were coded with the Medical Dictionary for Regulatory Activities (MedDRA) and analysed according to the preferred terms". (page 35) | Yes to both questions."Adverse events were coded with the Medical Dictionary for Regulatory Activities (MedDRA) and analysed according to the preferred terms". (page 35) | |
| Unclear. "Adverse events (adverse events) were monitored at months 25 and 27 and then every 3 months to the study end". (page 2) | No information | |
| No information | No information | |
| Unclear. "Adverse events were reported by study participants or investigators throughout the study; investigators recorded all such events on case report forms". (page 979) | No information |
Serious adverse event definitions
The majority of included studies (7 out of 10; 70%) gave insufficient information on serious adverse events definition, the remaining three trials (30%) provided this definition (Table 3).
OLEs
Random sequence generation
We judged all eight OLEs to be at high risk of bias for sequence generation because there was no random assignment to the open‐label treatment groups.
Allocation concealment
We judged all eight OLEs to be at high risk of bias because there was no allocation concealment with respect to assignment to the open‐label treatment groups.
Other major baseline imbalance
Two out of eight OLEs (25%) were adequate in terms of baseline balance and we judged them to be at low risk of bias. Six OLEs (75%) did not provide enough information to assess the presence of other baseline imbalance and we judged the risk of bias to be unclear for these studies.
Blinding of participants and personnel
None of the eight OLEs blinded participants or personnel to treatment allocation. We judged these studies to be at high risk of bias for blinding of participants and personnel.
Blinding of outcome assessors
None of the eight OLEs blinded outcome assessors to treatment allocation. We judged these studies to be at high risk of bias for blinding of outcome assessors.
Incomplete outcome data
Seven (87%) of the eight OLEs were likely to be at high risk of attrition bias as participants who dropped out ranged from 23% to 70% and proportions and reasons of missing participants differed substantially across intervention groups. Most of the participants who were lost to follow‐up may have not responded in the original RCT or have had adverse events that were not included in the analyses, which could overestimate the treatment benefit or underestimate the adverse effect estimates. In one OLE (BENEFIT 2007 (3 years FU)) the majority of participants (about 80%) contributed outcome data and thus we judged this study to be at low risk of attrition bias.
Selective outcome reporting
We judged most of the included studies (six of eight; 75%) to be at high risk of selective reporting bias. We did not find study protocols in the ClinicalTrials.gov database or in the FDA or EMA databases, and judged published reports to be at high risk of this type of reporting bias if they did not report all expected outcomes, including treatment discontinuation due to adverse events or serious adverse events, that were primary outcomes pre‐specified in the methods section. The six OLEs were likely to be at high risk of selective reporting bias because these studies did not specify in the methods that they intended to report adverse events and treatment discontinuation due to adverse events or serious adverse events were not reported.
Method of adverse event monitoring
All the included OLEs reported insufficient information to judge if adverse events were monitored appropriately or not (Table 3).
Serious adverse event definitions
All the included OLEs did not clearly define ‘serious adverse events’ (Table 3).
Cohort studies
We assessed risk of bias according to ROBINS‐I tool for non‐randomised studies of interventions (Sterne 2016). We judged two (ACISS 2010; MSBASIS 2016) of the four included cohort studies at critical risk of bias, and the other two studies (GERONIMUS 2013; Tintore 2015) at serious risk of bias (Table 2). None of the cohort studies reported the method they used to monitor and detect adverse events or to define serious adverse events (Table 3).
Effects of interventions
See: Summary of findings for the main comparison Are disease‐modifying drugs for a first attack suggestive of multiple sclerosis (MS) effective and safe compared to placebo?; Summary of findings 2 Is early treatment with disease‐modifying drugs more efficacious and safer than delayed treatment?
Research question 1: is early treatment efficacious and safe compared to placebo or no treatment?
Ten RCTs and two cohort studies compared early intervention versus placebo or no treatment.
Their results are synthesised and presented in summary of findings Table for the main comparison.
Primary outcomes
Disability‐worsening
The number of participants who had disability‐worsening during 24 months was available from two RCTs (ETOMS 2001, TOPIC 2014) and 927 participants (25% of those included in the 10 RCTs). The summary OR, which takes into account the missing outcome data, suggested a non‐significant reduction of the odds of disability‐worsening in early treatment with interferon beta‐1a (Rebif®) (ETOMS 2001) or teriflunomide (TOPIC 2014) compared with placebo (OR 0.74, 95% CI 0.49 to 1.14, P = 0.696) with very little heterogeneity (I² = 0%) (Figure 3). In one cohort study (ACISS 2010) participants treated with disease‐modifying drugs at their first attack had greater mean score of EDSS measured at 24 months than participants who were never treated (Table 4).

Forest plot of comparison: treatment with disease‐modifying drugs compared with placebo. Random‐effects meta‐analysis results of proportion of participants with disability‐worsening over 24 months in RCT studies. We assumed in both groups that the odds of disability‐worsening in missing participants were 5.95 times the odds in the observed participants with 95% CI from 3 to 7
| Early DMDs treatment (N = 49) | Delayed DMDs treatment (N = 57) | No treatment (N = 52) | |
| EDSS score over 24 months' follow‐up Mean (SD) Median (range) Kruskal–Wallis H‐Test P value <0.001 | 1.2 (0.9) 1.5 (0‐3) | 1.6 (1.2) 1.5 (0‐6) | 0.8 (0.8) 1.0 (0‐3) |
| P value versus no treatment | 0.016 | < 0.001 | NA |
| P value early versus delayed treatment (Wilcoxon matched pair test) | 0.055 | NA | NA |
| Relapses Mean (SD) Median (range) Kruskal–Wallis H‐Test P value < 0.001 | 0.5 (0.8) 0.0 (0‐4) | 1.0 (1.1) 1.0 (0‐4) | 0.2 (0.5) 0.0 (0‐3) |
| P value versus no treatment | 0.059 | < 0.001 | NA |
| P value early versus delayed treatment (Wilcoxon matched pair test) | 0.01 | NA | NA |
| Risk of attaining an EDSS score of 3.0 with early DMDs compared with delayed DMDs treatment. Adjusted hazard ratio: 0.5 (95% CI 0.3 to 0.9) Unadjusted hazard ratio: 1.1 (95% CI 0.7 to 1.9) | |||
DMDs: disease‐modifying drugs. EDSS: expanded disability status scale; NA: not applicable; SD: standard deviation
Relapses
Data from only one trial (TOPIC 2014) with 618 participants (16.5%) were available to calculate the number of participants who continued to have relapses during the first 24 months of treatment with teriflunomide. The result obtained applying the IMOR method indicated a lower but not significant odds of relapse compared to placebo (OR 0.65, 95% CI 0.38 to 1.12). In one cohort study (ACISS 2010) there was no difference during the first 24 months of treatment in the number of relapses among participants who took disease‐modifying drugs for their first attack compared to participants who were not treated (Table 4).
Occurrence of at least one serious adverse event
Data on adverse events over 24 months were available from seven RCTs (BENEFIT 2006; CHAMPS 2000; ETOMS 2001; ORACLE 2014; PRECISE 2009; REFLEX 2012; TOPIC 2014) (3385 participants; 90%).The summary OR was 0.78 (95% CI 0.60 to 1.03, P = 0.08) (Analysis 1.1) suggesting, with very little heterogeneity (I2 = 0%), that the odds of occurrence of at least one serious adverse event were lower in the active interventions compared with placebo. One trial (Pakdaman 2007) with 202 participants (5%) suggested that the odds of occurrence of at least one serious adverse event were greater with interferon beta 1‐a (Avonex®) compared with placebo over 36 months of follow‐up; however this difference was very imprecise (OR 1.23, 95% CI 0.44 to 3.45, P = 0.69, Analysis 1.2).
Withdrawing from the study or discontinuing the drug due to adverse events
Data from five RCTs (BENEFIT 2006; ORACLE 2014; PRECISE 2009; TOPIC 2014; REFLEX 2012) with 2693 participants (72%) were reported for this outcome over 24 months. Overall, treatment was associated with greater odds of withdrawal or discontinuation compared with placebo (OR 2.43, 95% CI 0.91 to 6.49, P = 0.08) (Analysis 1.3). There was considerable heterogeneity (I² = 78%); compared to placebo, interferon beta 1‐b (Betaseon®) (BENEFIT 2006), glatiramer acetate (PRECISE 2009) and cladribine (ORACLE 2014) were associated with significantly more withdrawals due to adverse events, while interferon beta‐1a (Rebif®) (REFLEX 2012) and teriflunomide (TOPIC 2014) were not significantly different from placebo. Interferon beta 1‐a (Avonex®) was shown to be associated with fewer withdrawals and discontinuations compared with placebo during the first 12 months of treatment (OR 0.14, 95% CI 0.02 to 1.12) (CHAMPS 2000) (Analysis 1.4).
Secondary outcomes
Time to conversion to CDMS
Seven RCTS reported this outcome at 24 months (BENEFIT 2006; CHAMPS 2000; ETOMS 2001; ORACLE 2014; PRECISE 2009; REFLEX 2012; TOPIC 2014) (3385 participants; 90%) and in two cohort studies (ACISS 2010; MSBASIS 2016) with 3592 participants (75% of those included in the four cohort studies). Overall there was a significant advantage of early treatment compared to control groups in reducing the hazard of CDMS during the first 24 months of treatment (HR 0.53, 95% CI 0.47 to 0.60; P < 0.001). There was no evidence of heterogeneity (I² = 0%) (Analysis 1.5). Immunoglobulins (Achiron 2004) were associated with a significantly lower hazard to conversion compared with placebo during the first 12 months of treatment (HR 0.36, 95% CI 0.15 to 0.86; P = 0.02, Analysis 1.6).
Withdrawing from the study or discontinuing the drug for any reason
Data at 24 months were available from six RCTs (BENEFIT 2006; CHAMPS 2000; ETOMS 2001; ORACLE 2014; REFLEX 2012; TOPIC 2014) (2931 participants; 78%). On average placebo and active drugs showed similar odds of discontinuation and dropout (OR 1.00, 95% CI 0.61 to 1.62, P = 0.99, Analysis 1.7) but there was considerable heterogeneity (I² = 84%). Compared to placebo, interferon beta 1‐b (Betaseron®) (BENEFIT 2006) and cladribine (ORACLE 2014) were associated with a greater proportion of participants who discontinued treatment or were lost to follow‐up for any reason (OR 1.50, 95% CI 0.95 to 2.3; OR 2.30, 95% CI 1.49 to 3.56), while interferon beta 1a (Rebif®) and teriflunomide were on average better than placebo. One study showed a very imprecise advantage of placebo over immunoglobulins (Achiron 2004) during the first 12 months of treatment (OR 2.15, 95% CI 0.37 to 12.35, Analysis 1.8).
Research question 2: are there differences in efficacy and safety between the various drugs administered as early treatments?
To examine the comparative effect of one disease‐modifying drug against another we considered the results from the NMA of RCTs. Evidence was scarce and the assumptions underlying NMA impossible to evaluate.
Primary outcomes
Disability‐worsening
Only two RCTs reported this outcome over 24 months, one for interferon beta‐1a (Rebif ®) (ETOMS 2001) and one for teriflunomide (TOPIC 2014) compared to placebo. Indirect comparison did not indicate a difference between the interventions (interferon beta‐1a (Rebif ®) versus teriflunomide: OR 0.84 95% CI 0.43 to 1.66) in reducing disability‐worsening.
Relapses
Only one study was available for teriflunomide compared with placebo over 24 months (TOPIC 2014).
Occurrence of at least one serious adverse event
There were no important differences between active drugs with respect to the odds of serious adverse events. The effect sizes from studies examining various drugs were not heterogeneous (in Analysis 1.1, I² = 0% and P = 0.72 for subgroup differences). We did not estimate relative treatment effects between active drugs in an NMA because there was important variation in the definition of serious adverse events violating the transitivity assumption.
Withdrawing from the study or discontinuing the drug due to adverse events
We identified important differences between the drugs, as shown in Analysis 1.3 (test for subgroup differences P = 0.003). The ORs between active drugs estimated from NMA along with the network plot are shown in Figure 4. As only one study per comparison was available the results pertain to a fixed‐effect model. Two treatments, interferon beta‐1a (Rebif®) and teriflunomide, were associated with significantly fewer withdrawals or discontinuation due to adverse events compared to other treatments. Odds of withdrawing from the study or discontinuing Rebif® were significantly lower compared with Betaseron® (OR 0.03, 95% CI 0.00 to 0.33), cladribine (OR 0.18, 95% CI 0.04 to 0.79) and glatiramer acetate (OR 0.21, 95% CI 0.04 to 0.96). Teriflunomide presented fewer withdrawals and discontinuations than Betaseron® (OR 0.05, 95% CI 0.01 to 0.38), cladribine (OR 0.25, 95% CI 0.07 to 0.82) and glatiramer acetate (OR 0.29, 95% CI 0.08 to 1.01). All these estimates have large variations around them. As only placebo‐controlled trials were available we were unable to evaluate the plausibility of the transitivity assumption and hence the confidence in the results from NMA is very low.

Network plot of comparisons and network meta‐analysis estimates for the proportion of participants who withdrew from the study because of adverse events in RCT studies. The estimate is located at the intersection of the column‐defining treatment and the row‐defining treatment. In the lower triangle the comparisons should be read from left to right, a OR value less than 1 favours the column‐defining treatment. In the upper triangle the comparisons should be read from right to left, a OR value larger 1 favours the row‐defining treatment. Significant results are in italic
Secondary outcomes
Time to conversion to CDMS
All interventions were associated with beneficial effects compared with placebo and there were no significant differences between them (test for subgroup differences P = 0.79, Analysis 1.5). This was confirmed by a NMA synthesising data over 24 months (Figure 5). Note that we were unable to evaluate the transitivity assumption because few studies and only indirect comparisons were available, and hence NMA results have low credibility.

Network plot of comparisons and network meta‐analysis estimates for the time to conversion to CDMS in RCT studies over 24 months. The estimate is located at the intersection of the column‐defining treatment and the row‐defining treatment. In the lower triangle the comparisons should be read from left to right, a HR value less than 1 favours the column‐defining treatment. In the upper triangle the comparisons should be read from right to left, a HR value larger than 1 favours the row‐defining treatment. Significant results are in italic
Withdrawing from the study or discontinuing the drug for any reason
Important differences existed between drugs with respect to the odds of discontinuing or withdrawing from the study for any reason (test for subgroup differences P = 0.005, Analysis 1.7). The network plot and results from NMA are presented in Figure 6. Indirect comparisons were very imprecise due to the low number of events. Note that we were unable to evaluate the transitivity assumption because few studies and only indirect comparisons were available, and hence NMA results have very low credibility.

Network plot of comparisons and network meta‐analysis estimates for the proportion of participants who discontinued treatment and were followed up to the end of the study or who were lost to follow‐up for any reason in RCT studies. The estimate is located at the intersection of the column‐defining treatment and the row‐defining treatment. In the lower triangle the comparisons should be read from left to right, a HR value less than 1 favours the column‐defining treatment. In the upper triangle the comparisons should be read from right to left, a HR value larger 1 favours the row‐defining treatment
Research question 3: is early treatment more effective and safe than delayed treatment?
Eight OLE studies provided data for this comparison. Delayed treatment was defined as treatment given only after a second clinically confirmed attack or at two years after randomisation. The study‐specific time until the delayed treatment after randomisation is presented in Table 5. In the description of results below, the follow‐up time is the time after randomisation.
| Study | Time until the delayed treatment after randomisation |
| Mean (SD): 1.5 (0.73) years | |
| Median (interquartile range): 30 (24‐35) months | |
| Median (range): 29 (0.5 –38) months | |
| Data not reported |
The results are synthesised and presented in summary of findings Table 2.
Primary outcomes
Disability‐worsening
Data were available at a maximum of three (BENEFIT 2007 (3 years FU); REFLEX 2016 (3 and 5 years FU)), five (CHAMPS 2006 (5 years FU); BENEFIT 2009 (5 years FU); PRECISE 2013 (5 years FU); REFLEX 2016 (3 and 5 years FU)), 8.7 (BENEFIT 2014 (8.7 years FU)), 10 and 11 years of follow‐up (CHAMPS 2012 (10 years FU); BENEFIT 2016 (11 years FU)). We undertook data synthesis accounting for the large amounts of missing outcome data. Overall, the benefit of early compared to delayed treatment was very imprecise with high heterogeneity (Figure 7). Early treatment with interferon beta‐1b (Betaseron®) appeared to significantly reduce the odds of participants with disability‐worsening compared with delayed treatment at a maximum of three and five years' follow‐up (BENEFIT 2007 (3 years FU); BENEFIT 2009 (5 years FU)). Results of the REFLEX 2016 (3 and 5 years FU) study suggested a non‐significant reduction of the odds of participants with disability‐worsening in delayed compared with early treatment with interferon beta‐1a (Rebif®) at a maximum of three and five years' follow‐up. Results on interferon beta‐1a (Avonex®) (CHAMPS 2006 (5 years FU); CHAMPS 2012 (10 years FU)) or glatiramer acetate (PRECISE 2013 (5 years FU)) were imprecise. We did not include the outcome data for interferon beta‐1b (Betaseron®) during 11 years' follow‐up (BENEFIT 2016 (11 years FU)) in the analysis as this was a cross‐sectional reassessment of the original RCT (investigators conducted participant assessments at their respective centers or via a structured interview by phone) and not appropriate to be combined with the other data (OR 0.82, 95% CI 0.46 to 1.47, as estimated from the original study data). One cohort study (Tintore 2015) reported that participants who received early treatment had a lower hazard of attaining an EDSS score of 3.0 compared with delayed treatment (adjusted HR 0.5, 95% CI 0.3 to 0.9) during a mean follow‐up time of three years and nine months (Table 4).
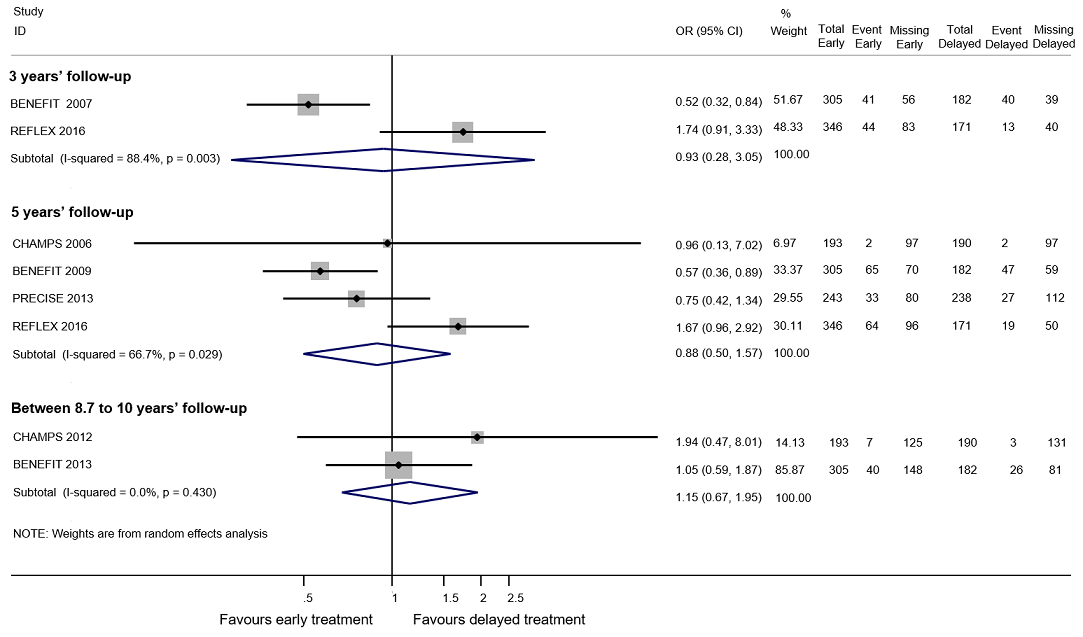
Forest plot of comparison: early treatment compared with delayed treatment with disease‐modifying drugs. Random‐effects meta‐analysis results of proportions of participants with disability‐worsening at a maximum of 3 years, 5 years and 10 years of follow‐up in open‐label extension studies. We assumed in both groups that the odds of disability‐worsening in missing participants were 5.95 times the odds in the observed participants with 95% CI from 3 to 7
Relapses
Data at a maximum of five years' follow‐up were available in three OLE studies. We undertook data synthesis accounting for the large amounts of missing outcome data. Early treatment with interferon beta 1‐b (BENEFIT 2009 (5 years FU)), interferon beta 1‐a (Rebif®) (REFLEX 2016 (3 and 5 years FU)) and glatiramer acetate (PRECISE 2013 (5 years FU)) significantly reduced the odds of participants with relapses compared to delayed treatment (OR 0.35, 95% CI 0.26 to 0.48, I² = 0.0%) (Figure 8). At a maximum of three years' follow‐up early treatment with interferon beta 1‐a (Rebif®) (REFLEX 2016 (3 and 5 years FU)) decreased the odds of participants with relapse compared to delayed treatment (OR 0.51, 95% CI 0.33 to 0.81). Between five and 10 years' follow‐up, the early interferon beta 1‐a (Avonex®) group was less likely than the delayed group to experience relapses (OR 0.51, 95% CI 0.25 to 1.04) (CHAMPS 2012 (10 years FU)).
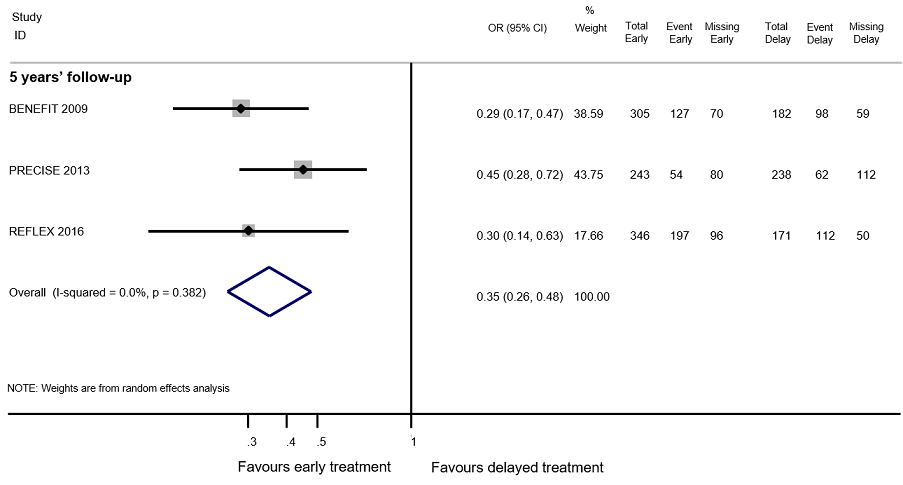
Forest plot of comparison: Early treatment compared with delayed treatment with disease‐modifying drugs. Random‐effects meta‐analysis results for proportion of participants with relapse over 5 years follow‐up in OLE studies. We assumed in both groups that the odds of relapses in missing participants were 5.95 times the odds in the observed participants with 95% CI from 3 to 7
Occurrence of at least one serious adverse event
Definition of serious adverse events according to an accepted international classification was not specified in any of the OLE studies and there was important variation across studies. Additionally, the process of including participants in the OLE phases was likely associated with the occurrence of adverse events and hence the risk of selections bias was very high. Consequently, we presented the data as reported in the studies in Table 6 but we did not draw any conclusions.
| Interferon beta‐1b | Intramuscular interferon beta 1‐a (Avonex) | Subcutaneous interferon beta 1‐a (Rebif) | Glatiramer acetate | |
| Participants | 487 | 383 | 517 | 481 |
| Serious adverse events ‐ number of participants | 123 | 65 | 49 | 60 |
| Discontinued treatment for any adverse events | Not reported | Not reported | 20 | 71 |
| Discontinued treatment or were lost to follow‐up for any reason | 204 | Not reported | 146 | 192 |
| Years of follow‐up | 8.7 | 10 | 5 | 5 |
Withdrawing from the study or discontinuing the drug due to adverse events
The method of monitoring adverse events was not specified in any of the extension studies and there was varying reliability of the different monitoring approaches. For these reasons and because there was selection of participants in the extension studies we presented results in Table 6 only and we did not draw any conclusions.
Secondary outcomes
Time to conversion to clinically definite multiple sclerosis
Early treatment with any drug reduced the hazard to conversion to CDMS over any follow‐up period (Analysis 2.1). Summary hazard ratios were 0.62 (95% CI 0.48 to 0.81, I² = 0%) from five studies reporting the outcome at a maximum follow‐up between two and four years, 0.62 (95% CI 0.53 to 0.73, I² = 0%) from four studies reporting the outcome at a maximum of five years and 0.65 (95% CI 0.54 to 0.79, I² = 0%) from two studies reporting the outcome between 8.7 and 10 years. This beneficial effect of early treatment was also present for longer follow‐up; BENEFIT 2016 (11 years FU) reported an HR of 0.67 (95% CI 0.53 to 0.85) at 11 years (this result was not included in the meta‐analysis for the same reason explained above).
Withdrawing from the study or discontinuing the drug for any reason
In OLE studies participants were selected according to their willingness to take an active intervention or continue with the active intervention they were initially randomised to and hence this outcome cannot be measured. We presented results reported in these studies in Table 6 but we did not draw any conclusions.
Subgroup and sensitivity analyses
We conducted the simple meta‐analysis for the conversion to CDMS for the first and third research question excluding cohort studies. In both cases the conclusions did not change compared with the main analyses (HR 0.53, 95% CI 0.46 to 0.61 and HR 0.58, 95% CI 0.46 to 0.73, respectively).
Discussion
Summary of main results
We analysed all RCTs and open‐label extension studies undertaken so far on the use of disease‐modifying drugs in participants with a first clinical attack. The review included ten RCTs (3745 participants) with a median of two years' follow‐up, and eight open‐label extension studies (1868 participants) ranging from three to 11 years' follow‐up. Most extension studies had major methodological shortcomings. The most common flaws were lack of blinding of outcome assessors and high dropout rates, combined with failure to do an intention‐to‐treat analysis, even though most trialists specifically declared their intention to do such an analysis. The review also included four cohort studies involving 4775 participants. These cohort studies had serious defects and we judged them to be at critical or serious risk of bias by the ROBINS‐I tool.
Disability‐worsening
Is early treatment efficacious and safe compared to placebo or no treatment?
Data were available from two RCTs. The odds of disability‐worsening decreased but were not significantly reduced during the first 24 months of interferon beta‐1a (Rebif®) or teriflunomide treatment compared to placebo. A small cohort study showed a greater mean score of EDSS measured at 24 months' follow‐up in participants receiving an early treatment compared with those who did not receive any treatment.
Are there differences in efficacy and safety between the various drugs administered for early treatment?
There was not enough evidence to answer this question with confidence.
Is early treatment better than delayed treatment?
Information to answer this question for disability‐worsening was available in the open‐label extension studies of four RCTs. The available evidence indicated a protective effect of early treatment with interferon beta‐1b (Betaseron®) compared with delayed treatment during three and five years' follow‐up. Early treatment with interferon beta‐1a (Rebif®), interferon beta‐1a (Avonex®), or glatiramer acetate was not beneficial compared to delayed treatment at any time of follow‐up. It is not clear from our analysis why this may be although in view of the great variability of the included extension studies these findings should be interpreted with caution. Early treatment with interferon beta‐1b (Betaseron®) or interferon beta‐1a (Avonex®) was no different from delayed treatment in terms of the proportion of participants who had disability‐worsening during 10 years' follow‐up.
Relapses
Is early treatment efficacious and safe compared to placebo or no treatment?
In a single trial the odds of relapses were less but not significantly smaller with early teriflunomide treatment compared with placebo. In one cohort study relapses were not reduced in participants on early disease‐modifying drugs compared with participants who were not treated.
Are there differences in efficacy and safety between the various drugs administered for early treatment?
There was not enough evidence to answer this question with confidence.
Is early treatment better than delayed treatment?
The results of open‐label extension studies showed that early treatment was associated with lower odds of recurrence of relapses during three and five years of follow‐up.
Occurence of at least one serious adverse event
Is early treatment efficacious and safe compared to placebo or no treatment?
Early treatment was associated with fewer chances of having at least one serious adverse event compared with placebo, although this difference was not significant. Information on serious adverse events was scanty and poorly reported in the included randomised trials.
Are there differences in efficacy and safety between the various drugs administered for early treatment?
No evidence was available.
Is early treatment better than delayed treatment?
This review cannot conclude on long‐term serious adverse events because of inadequacies in the available data both in the included open‐label extension studies and cohort studies.
Treatment discontinuation or dropout due to adverse events
Is early treatment efficacious and safe compared to placebo or no treatment?
Interferon beta 1‐b (Betaseron®), glatiramer acetate, and cladribine were associated with significantly higher proportion of participants who withdrew due to adverse events compared to placebo during 24 months of treatment.
Are there differences in efficacy and safety between the various drugs administered for early treatment?
Indirect comparisons revealed that interferon beta 1‐a (Rebif®) and teriflunomide were associated with significantly lower proportions of participants who withdrew due to adverse events compared to interferon beta 1‐b (Betaseron®), glatiramer acetate and cladribine. The estimates are very uncertain and it is possible that these differences reflect differences in the methods of monitoring and recording adverse events across studies.
Is early treatment better than delayed treatment?
This review cannot conclude on long‐term adverse events because of inadequate data reported both in the included open‐label extension studies and the cohort studies.
Conversion to CDMS
Is early treatment efficacious and safe compared to placebo or no treatment?
Early treatment was associated with significantly lower hazard of conversion to CDMS over 24 months of follow‐up.
Are there differences in efficacy and safety between the various drugs administered for early treatment?
Indirect comparisons and subgroup differences showed that the disease‐modifying drugs did not differ in their effects on efficacy and safety.
Is early treatment better than delayed treatment?
Open‐label extension studies and cohort studies showed that early treatment reduced the hazard of conversion to CDMS at any follow‐up up to 10 years.
Treatment discontinuation or dropout for any reason
Is early treatment efficacious and safe compared to placebo or no treatment?
Compared to placebo, interferon beta 1‐b (Betaseron®), and cladribine were associated with significantly higher proportion of participants who discontinued treatment or were lost to follow‐up for any reason during 24 months of treatment. These results are very uncertain therefore these findings should be interpreted with caution.
Are there differences in efficacy and safety between the various drugs administered for early treatment?
Indirect comparisons revealed that the disease‐modifying drugs did not differ from each other with regards to this outcome over 24 months of follow‐up and it is possible that these differences reflect differences in the methods of monitoring and recording adverse events across studies.
Is early treatment better than delayed treatment?
This review cannot conclude on this outcome because of inadequate data reported both in the included open‐label extension studies and the cohort studies.
Overall completeness and applicability of evidence
All eligible RCTs, their open‐label extensions and cohort studies up to December 2016 were included. Unfortunately, only a small number of included studies reported data on the predefined primary outcomes of the review, that is, short‐ and long‐term disability‐worsening and recurrence of relapses. This is an unwelcome finding considering that according to the new MS diagnostic criteria (Polman 2011) most of the participants included in this review currently receive a diagnosis of MS at their first attack and they need evidence about benefit of early disease‐modifying treatment with regards to disability‐worsening and recurrence of relapses that are the most important outcomes. We decided to include open‐label extension studies and cohort studies aiming to collect evidence on the long‐term safety of early treatment with disease‐modifying drugs, but unfortunately the studies included in the review reported scanty and poorly detailed safety data that did not allow us to draw conclusions, leading to uncertainty about the long‐term risk profile of these treatments.
Quality of the evidence
There were 10 RCTs with 3745 participants included in this review. We only judged one of the included trials (10%) to be at low risk of bias, when criteria for allocation concealment, blinding of outcome assessors, and complete outcome data were met. In the majority of trials, we judged allocation concealment to be ‘unclear’ due to lack of details provided in the study reports. Blinding of outcome assessors was also not clearly described in many of the included studies. We judged four studies to have a high risk of bias for incomplete outcome data. Most studies were judged to have a low risk of bias due to major baseline imbalances.
The majority of trials in this review did not provide sufficient information on how a serious adverse event was defined in the study. We combined data on serious adverse events in pairwise meta‐analysis, regardless of the definition and whether it was provided, so caution is needed in interpreting this outcome. We assessed whether trials reported undertaking active monitoring for adverse events. Fifty percent of included trials reported that they monitored for adverse effects, however many different monitoring techniques may have been used with great variation of the different approaches.
We included eight open‐label extension studies (1868 participants) of four RCTs. Given the design of extension studies, in which a highly selected group of participants continued on from the RCT and the majority of participants and outcome assessors were unblinded, we judged most of these studies to be at high risk of bias. We also judged 90% of the included studies to be at high risk of attrition bias because dropouts ranged from 23% to 70% and proportions and reasons for missing participants differed substantially across intervention groups. Serious adverse events were not clearly defined in most extension studies and the majority of them reported insufficient information to judge if adverse events were monitored appropriately or not.
We included four cohort studies with 4775 participants. We assessed risk of bias of these studies according to ROBINS‐I tool for non‐randomised studies of interventions (Sterne 2016). We judged two studies at critical risk of bias, and the other two studies at serious risk of bias. None of the included cohort studies defined or reported serious adverse events, or whether adverse events were monitored appropriately or not.
For the overall results of disease‐modifying drugs as a group versus placebo for the four primary outcomes of disability‐worsening, recurrence of relapse, serious adverse events and withdrawals due to adverse events during 24 months of treatment, we graded our confidence in the results as 'very low’ or ’low’ using the GRADE approach (summary of findings Table for the main comparison). For the results of early treatment compared to delayed treatment for the two primary outcomes of disability‐worsening and recurrence of relapses during five years' follow‐up, we graded our confidence in the results as ’very low’ or ’low’ (summary of findings Table 2).
Potential biases in the review process
This review has several differences compared to its protocol. We have broadened the research question as a result of the identified data. The initial protocol was focused on detecting differences between the intervention (research question 2) but we realised that we would not be able to answer this question and we added two other aims that we considered clinically important. We also added an outcome (time to conversion to CDMS). Although these decisions were guided by data availability, we think that this has not introduced bias in our review because its scope has become wider rather than narrower.
Agreements and disagreements with other studies or reviews
In this review that included RCTs of seven disease‐modifying drugs used in participants who had a first clinical attack suggestive of MS, we found that participants who received interferons, glatiramer acetate, teriflunomide, cladribine had significantly lower hazard of conversion to MS compared to placebo and the effects of these drugs did not differ from each other. Compared with placebo, disease‐modifying drugs did not increase the risk of serious adverse events. Interferon beta 1‐a (Rebif®) and teriflunomide were associated with a lower risk of withdrawals due to adverse events, compared with placebo and the other drugs.
Our findings extend the findings of a previous Cochrane Review that examined only three RCTs of 24 months' duration of interferon beta 1‐b (Betaseron®), interferon beta 1‐a (Rebif®) and interferon beta 1‐a (Avonex®) (Clerico 2008). They reported that interferons had lower‐than‐placebo risk of conversion to CDMS, the frequency of serious adverse events was not significantly different in interferon groups compared to placebo, but active treatment was more likely than placebo to lead to withdrawals due to adverse events. Similar observations have been made by one qualitative review, Freedman 2014 of the same three RCTs of interferons. In one review (Smith 2010) of five RCTs of disease‐modifying drugs, which included some of the same RCTs with their extensions during five years' follow‐up, the authors concluded that all the three interferons and glatiramer acetate reduced the probability of converting from clinically isolated syndrome to CDMS over a period of two to five years. They reported that the included studies did not describe methods of ascertaining adverse events and that their reporting was sparse. The incidence of adverse events was significantly higher in the interferon and glatiramer acetate groups compared with the placebo groups for most commonly occurring adverse events such as influenza‐like syndrome and injection‐site reactions. Rates of serious adverse events were no different from placebo in any trial. Most of our findings from direct and indirect comparisons cannot be compared to previous studies since most of them reported only a qualitative description of the trials focusing on efficacy outcomes.

Study flow diagram.
DMD: disease‐modifying drugs; OLEs: open label extension studies; RCTs: randomised controlled trials
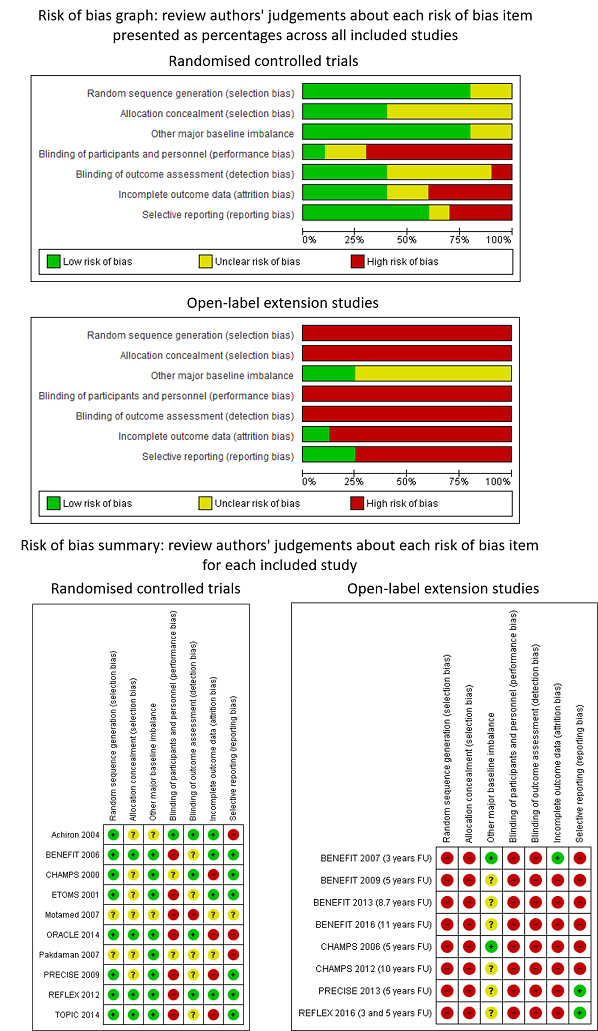
Review authors' judgements about each risk of bias item presented as percentages across all included studies and review authors' judgements about each risk of bias item for each included study

Forest plot of comparison: treatment with disease‐modifying drugs compared with placebo. Random‐effects meta‐analysis results of proportion of participants with disability‐worsening over 24 months in RCT studies. We assumed in both groups that the odds of disability‐worsening in missing participants were 5.95 times the odds in the observed participants with 95% CI from 3 to 7
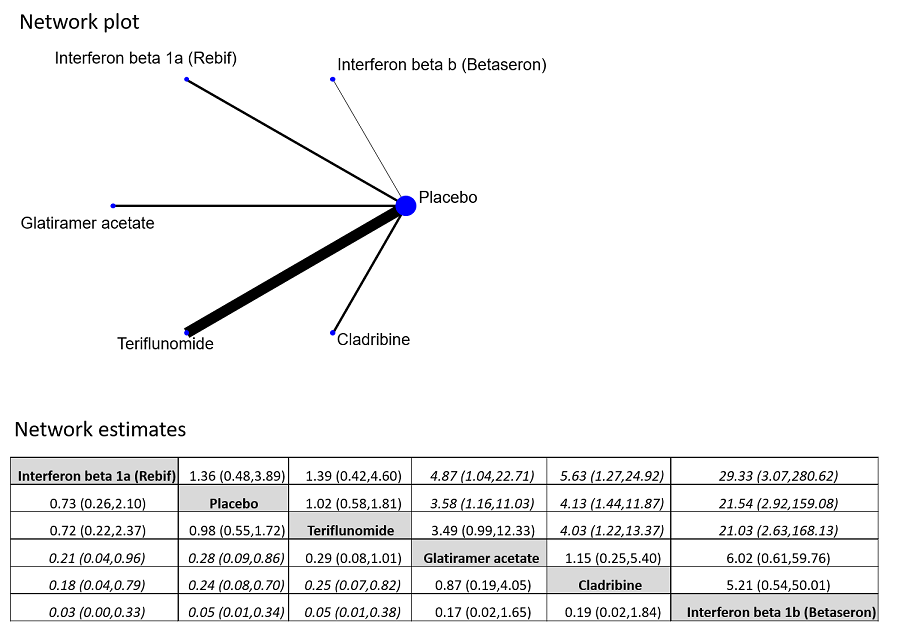
Network plot of comparisons and network meta‐analysis estimates for the proportion of participants who withdrew from the study because of adverse events in RCT studies. The estimate is located at the intersection of the column‐defining treatment and the row‐defining treatment. In the lower triangle the comparisons should be read from left to right, a OR value less than 1 favours the column‐defining treatment. In the upper triangle the comparisons should be read from right to left, a OR value larger 1 favours the row‐defining treatment. Significant results are in italic

Network plot of comparisons and network meta‐analysis estimates for the time to conversion to CDMS in RCT studies over 24 months. The estimate is located at the intersection of the column‐defining treatment and the row‐defining treatment. In the lower triangle the comparisons should be read from left to right, a HR value less than 1 favours the column‐defining treatment. In the upper triangle the comparisons should be read from right to left, a HR value larger than 1 favours the row‐defining treatment. Significant results are in italic
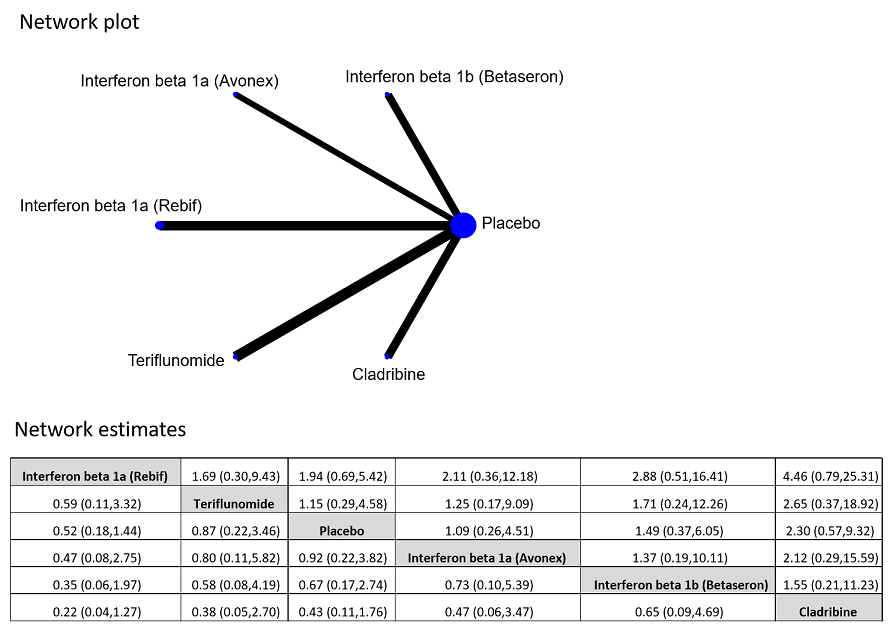
Network plot of comparisons and network meta‐analysis estimates for the proportion of participants who discontinued treatment and were followed up to the end of the study or who were lost to follow‐up for any reason in RCT studies. The estimate is located at the intersection of the column‐defining treatment and the row‐defining treatment. In the lower triangle the comparisons should be read from left to right, a HR value less than 1 favours the column‐defining treatment. In the upper triangle the comparisons should be read from right to left, a HR value larger 1 favours the row‐defining treatment

Forest plot of comparison: early treatment compared with delayed treatment with disease‐modifying drugs. Random‐effects meta‐analysis results of proportions of participants with disability‐worsening at a maximum of 3 years, 5 years and 10 years of follow‐up in open‐label extension studies. We assumed in both groups that the odds of disability‐worsening in missing participants were 5.95 times the odds in the observed participants with 95% CI from 3 to 7

Forest plot of comparison: Early treatment compared with delayed treatment with disease‐modifying drugs. Random‐effects meta‐analysis results for proportion of participants with relapse over 5 years follow‐up in OLE studies. We assumed in both groups that the odds of relapses in missing participants were 5.95 times the odds in the observed participants with 95% CI from 3 to 7

Comparison 1 Active intervention versus placebo, Outcome 1 Occurrence of at least one serious adverse event over 24 months.

Comparison 1 Active intervention versus placebo, Outcome 2 Occurrence of at least one serious adverse event over 36 months.

Comparison 1 Active intervention versus placebo, Outcome 3 Withdrawing from the study or discontinuing the drug due to adverse events over 24 months.
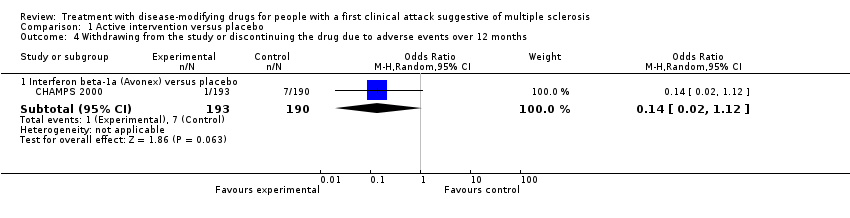
Comparison 1 Active intervention versus placebo, Outcome 4 Withdrawing from the study or discontinuing the drug due to adverse events over 12 months.

Comparison 1 Active intervention versus placebo, Outcome 5 Time to conversion to CDMS over 24 months.

Comparison 1 Active intervention versus placebo, Outcome 6 Time to conversion to CDMS over 12 months.
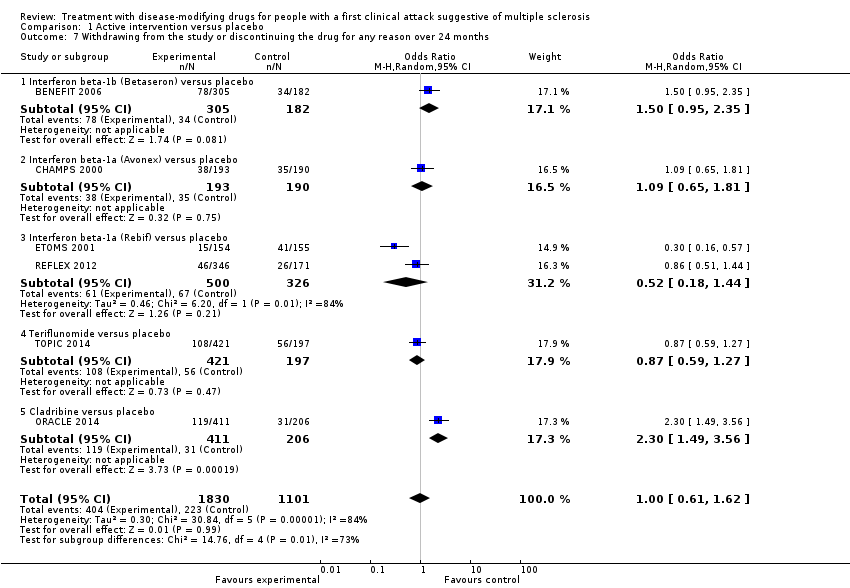
Comparison 1 Active intervention versus placebo, Outcome 7 Withdrawing from the study or discontinuing the drug for any reason over 24 months.

Comparison 1 Active intervention versus placebo, Outcome 8 Withdrawing from the study or discontinuing the drug for any reason over 12 months.

Comparison 2 Early versus delayed treatment, Outcome 1 Time to conversion to CDMS at different follow‐up years.
| Patient: adults with first attack suggestive of MS | |||||||
| Outcomes | Relative effect | Anticipated absolute effects* (95% CI) | Quality of the evidence | What happens | |||
| With placebo | With early disease‐modifying drugs treatment | Difference | |||||
| Disability‐worsening Proportion of participants with disability‐worsening, assessed by EDSS** during 24 months of treatment | OR 0.74 | 34.1% | 27.7% (20.2 to 37.1) | 6.4% fewer (13.9 fewer to 3 more) | ⊕⊝⊝⊝ | The risk of disability‐worsening is less with disease‐modifying drugs than with placebo, but there is a lot of uncertainty in the effect | |
| Relapse Proportion of participants with relapse during 24 months of treatment | OR 0.65 | 41.6% | 31.7% (21.3 to 44.4) | 10.0% fewer (20.3 fewer to 2.8 more) | ⊕⊝⊝⊝ | The risk of relapse is less with disease‐modifying drugs than with placebo, but there is a lot of uncertainty in the effects | |
| Occurrence of at least one serious adverse event Proportion of participants with at least one serious adverse event during 24 months of treatment | OR 0.78 | 8.0% | 6.3% | 1.6% fewer | ⊕⊕⊝⊝ | Compared to placebo, disease‐modifying drugs were associated with less risk of serious adverse events | |
| Withdrawls or drug discontinuation due to adverse events during 24 months of treatment | OR 2.43 | 3.5% | 8.0% | 4.6% more | ⊕⊝⊝⊝ | Compared to placebo interferon beta 1‐b, glatiramer acetate, and cladribine were associated with higher risk of withdrawals due to adverse events | |
| *The risk in the intervention group (and its 95% confidence interval) is based on the assumed risk in the comparison group and the relative effect of the intervention (and its 95% CI). **EDSS: expanded disability status scale | |||||||
| GRADE Working Group grades of evidence | |||||||
| aHigh risk of bias for blinding of participants and outcome assessment and incomplete outcome data. | |||||||
| Patient: adults with first attack suggestive of MS | ||||||
| Outcomes | Relative effect | Anticipated absolute effects* (95% CI) | Quality of the evidence | What happens | ||
| Without early disease‐modifying drug treatment | With early disease‐modifying drug treatment | Difference | ||||
| Disability‐worsening Proportion of participants with disability‐worsening at a maximum of five years' follow‐up (assessed by EDSS**) | OR 0.88 | 40.2% | 37.2% | 3.0% fewer | ⊕⊝⊝⊝ | No significant effect of early treatment compared to delayed treatment during five years' follow‐up; however there is a significant heterogeneity between the studies |
| Relapse Proportion of participants with relapse at a maximum of five years' follow‐up | OR 0.35 | 83.4% | 63.8% | 19.6% fewer | ⊕⊕⊝⊝ | Early treatment reduced the risk of relapses compared to delayed treatment during five years' follow‐up |
| *The risk in the intervention group (and its 95% confidence interval) is based on the assumed risk in the comparison group and the relative effect of the intervention (and its 95% CI). | ||||||
| GRADE Working Group grades of evidence | ||||||
| aHigh risk of bias for allocation concealment, blinding of outcome assessment and incomplete outcome data. | ||||||
| Type of intervention | Route | RCTs N = 10 | OLEs N = 8 | Cohort studies N = 4 |
| Interferon beta‐1b sc (Betaseron®) | sc | 1 | 4 OLEs at a maximum follow‐up of 3, 5, 8.7, and 11 years | 0 |
| Interferon beta‐1a (Avonex®) | im | 2 | 2 OLEs at a maximum follow‐up of 5 and 10 years | 0 |
| Interferon beta‐1a (Rebif®) | sc | 3 | 1 OLE at a maximum follow‐up of 3 and 5 years | 0 |
| Glatiramer acetate sc | sc | 1 | 1 OLE at a maximum follow‐up of 5 years | 0 |
| Cladribine os | os | 1 | 0 | 0 |
| Teriflunomide os | os | 1 | 0 | 0 |
| Immunoglobulins iv | iv | 1 | 0 | 0 |
| disease‐modifying drugs | ‐ | 0 | 0 | follow‐up from 2 to 6 years |
| im: intramuscular; iv: intravenously; OLEs: open‐label extension studies; os: oral; RCTs: randomised controlled studies; sc: subcutaneous | ||||
| Bias | Authors’ judgment | Support for judgement |
| Confounding | Serious | All known important domains were not appropriately controlled for |
| Selection of participants into the study | Low | All participants who would have been eligible for the target trial were likely included in the study and for each participant start of follow up and start of intervention likely coincided |
| Classification of interventions | Low | Intervention status was well defined and intervention definition was based on information collected at the time of intervention |
| Deviations from intended interventions | NI | No information was reported on whether there was deviation from the intended intervention |
| Missing data | Critical | There were critical differences between early, delayed or no treatment in participants with missing data and an appropriate analysis to address missing data was not done |
| Measurement of outcomes | Serious | The outcome measures were subjective and assessed by assessors aware of the intervention received by study participants. This judgment is applicable to all the three outcomes reported in the article |
| Selection of the reported result | Low | There was evidence that reported results corresponded to all intended outcomes and analyses |
| Overall bias | Critical | Study judged to be at critical risk of bias in one domain |
| Bias | Authors’ judgment | Support for judgement |
| Confounding | Moderate | Confounding expected, all known important confounding domains appropriately measured and controlled for, and reliability and validity of measurement of important domains were sufficient, such that we do not expect serious residual confounding |
| Selection of participants into the study | Low | All participants who would have been eligible for the target trial were likely included in the study and for each participant start of follow up and start of intervention likely coincided |
| Classification of interventions | Serious | Intervention status was not well defined |
| Deviations from intended interventions | NI | No information was reported on whether there was deviation from the intended intervention |
| Missing data | Low | Data were reasonably complete |
| Measurement of outcomes | Serious | CDMS was assessed by assessors aware of the intervention received by study participants |
| Selection of the reported result | Low | There was evidence that reported results corresponded to all intended outcomes and analyses |
| Overall bias | Serious | Study judged to be at serious risk of bias in two domains, but not at critical risk of bias in any domain |
| Bias | Authors’ judgment | Support for judgement |
| Confounding | Serious | Important domains were not appropriately controlled for |
| Selection of participants into the study | Critical | Selection into the study was very strongly related to intervention and outcome and this could not be adjusted for in analyses |
| Classification of interventions | Serious | Intervention status was not well defined |
| Deviations from intended interventions | NI | No information was reported on whether there was deviation from the intended intervention |
| Missing data | NI | No information was reported on missing data |
| Measurement of outcomes | Serious | The outcome measures were subjective and they were assessed by assessors aware of the intervention received by study participants. Follow‐up duration not reported |
| Selection of the reported result | Low | There was evidence that reported results corresponded to all intended outcomes and analyses |
| Overall bias | Critical | Study judged to be at critical risk of bias in one domain |
| Bias | Authors’ judgment | Support for judgement |
| Confounding | Serious | Important domains were not appropriately controlled for |
| Selection of participants into the study | Low | All participants who would have been eligible for the target trial were likely included in the study and for each participant start of follow up and start of intervention likely coincided |
| Classification of interventions | Serious | Intervention status was not well defined |
| Deviations from intended interventions | NI | No information was reported on whether there was deviation from the intended intervention |
| Missing data | Serious | Reasons for missing data differed substantially across interventions, and the analysis is unlikely to have removed the risk of bias arising from the missing data |
| Measurement of outcomes | Serious | The outcome measures were subjective and assessed by assessors aware of the intervention received by study participants. This judgment is applicable to all outcomes reported in the article |
| Selection of the reported result | Low | There was evidence that reported results corresponded to all intended outcomes and analyses |
| Overall bias | Serious | Study judged to be at serious risk of bias in four domains, but not at critical risk of bias in any domain |
| ROBINS‐I is a tool to evaluate Risk Of Bias In Non‐randomised Studies ‐ of Interventions (Sterne 2016) | ||
| Study | Did the researchers actively monitor for adverse events or did they simply provide spontaneous reporting of adverse events that arose? | Did the authors define serious adverse events according to an accepted international classification and report the number of serious adverse events? |
| No information | No information | |
| No information | No information | |
| Yes, active monitoring.“Regular visits were scheduled for safety assessments at months 3, 6, 9, 12, 18, and 24”. (page 1243) | No information | |
| No information | No information | |
| No information | No information | |
| No information | No information | |
| No information | No information | |
| No active monitoring. "Each center was instructed to report all adverse events during the first six months of treatment, but thereafter to report only serious adverse events". (page 899) | No information | |
| No information | No information | |
| No information | No information | |
| Yes, active monitoring. "Safety was assessed at 1, 6, 12, 18, 24 months". (page 1577) | Yes to both questions. "Serious adverse events were defined according to the guidelines of the International Conference on Harmonisation". (page 1580) | |
| No information | No information | |
| Yes, active monitoring."Safety assessments were performed at the end of months 1, 2, 3, 9, 15, and 21 by a neurologist". (page 345) | No information | |
| No information | No information | |
| Yes, active monitoring. "Adverse events and laboratory findings were recorded at study visits and at regularly scheduled interim visits" (page 259). "International Conference on Harmonisation of Technical Requirements for Registration of Pharmaceuticals for Human Use". (page 258) | Yes to both questions. "International Conference on Harmonisation of Technical Requirements for Registration of Pharmaceuticals for Human Use". (page 258) | |
| No information | No information | |
| Unclear whether the researchers actively monitored for adverse events or they simply provided spontaneous reporting of adverse events | No information | |
| Unclear whether the researchers actively monitored for adverse events or they simply provided spontaneous reporting of adverse events | No information | |
| Yes, active monitoring. "Active monitoring by personnel was ensured via various testing". (page 34). "Adverse events were coded with the Medical Dictionary for Regulatory Activities (MedDRA) and analysed according to the preferred terms". (page 35) | Yes to both questions."Adverse events were coded with the Medical Dictionary for Regulatory Activities (MedDRA) and analysed according to the preferred terms". (page 35) | |
| Unclear. "Adverse events (adverse events) were monitored at months 25 and 27 and then every 3 months to the study end". (page 2) | No information | |
| No information | No information | |
| Unclear. "Adverse events were reported by study participants or investigators throughout the study; investigators recorded all such events on case report forms". (page 979) | No information |
| Early DMDs treatment (N = 49) | Delayed DMDs treatment (N = 57) | No treatment (N = 52) | |
| EDSS score over 24 months' follow‐up Mean (SD) Median (range) Kruskal–Wallis H‐Test P value <0.001 | 1.2 (0.9) 1.5 (0‐3) | 1.6 (1.2) 1.5 (0‐6) | 0.8 (0.8) 1.0 (0‐3) |
| P value versus no treatment | 0.016 | < 0.001 | NA |
| P value early versus delayed treatment (Wilcoxon matched pair test) | 0.055 | NA | NA |
| Relapses Mean (SD) Median (range) Kruskal–Wallis H‐Test P value < 0.001 | 0.5 (0.8) 0.0 (0‐4) | 1.0 (1.1) 1.0 (0‐4) | 0.2 (0.5) 0.0 (0‐3) |
| P value versus no treatment | 0.059 | < 0.001 | NA |
| P value early versus delayed treatment (Wilcoxon matched pair test) | 0.01 | NA | NA |
| Risk of attaining an EDSS score of 3.0 with early DMDs compared with delayed DMDs treatment. Adjusted hazard ratio: 0.5 (95% CI 0.3 to 0.9) Unadjusted hazard ratio: 1.1 (95% CI 0.7 to 1.9) | |||
| DMDs: disease‐modifying drugs. EDSS: expanded disability status scale; NA: not applicable; SD: standard deviation | |||
| Study | Time until the delayed treatment after randomisation |
| Mean (SD): 1.5 (0.73) years | |
| Median (interquartile range): 30 (24‐35) months | |
| Median (range): 29 (0.5 –38) months | |
| Data not reported |
| Interferon beta‐1b | Intramuscular interferon beta 1‐a (Avonex) | Subcutaneous interferon beta 1‐a (Rebif) | Glatiramer acetate | |
| Participants | 487 | 383 | 517 | 481 |
| Serious adverse events ‐ number of participants | 123 | 65 | 49 | 60 |
| Discontinued treatment for any adverse events | Not reported | Not reported | 20 | 71 |
| Discontinued treatment or were lost to follow‐up for any reason | 204 | Not reported | 146 | 192 |
| Years of follow‐up | 8.7 | 10 | 5 | 5 |
| Outcome or subgroup title | No. of studies | No. of participants | Statistical method | Effect size |
| 1 Occurrence of at least one serious adverse event over 24 months Show forest plot | 7 | 3385 | Odds Ratio (M‐H, Random, 95% CI) | 0.78 [0.60, 1.03] |
| 1.1 Interferon beta‐1b (Betaseron) versus placebo | 1 | 468 | Odds Ratio (M‐H, Random, 95% CI) | 1.00 [0.48, 2.11] |
| 1.2 Interferon beta‐1a (Avonex) versus placebo | 1 | 383 | Odds Ratio (M‐H, Random, 95% CI) | 0.60 [0.28, 1.27] |
| 1.3 Interferon beta‐1a (Rebif) versus placebo | 2 | 823 | Odds Ratio (M‐H, Random, 95% CI) | 0.72 [0.35, 1.46] |
| 1.4 Glatiramer acetate versus placebo | 1 | 481 | Odds Ratio (M‐H, Random, 95% CI) | 0.55 [0.25, 1.17] |
| 1.5 Teriflunomide versus placebo | 1 | 614 | Odds Ratio (M‐H, Random, 95% CI) | 1.06 [0.59, 1.89] |
| 1.6 Cladribine versus placebo | 1 | 616 | Odds Ratio (M‐H, Random, 95% CI) | 0.77 [0.43, 1.37] |
| 2 Occurrence of at least one serious adverse event over 36 months Show forest plot | 1 | Odds Ratio (M‐H, Random, 95% CI) | Subtotals only | |
| 2.1 Interferon beta‐1a (Avonex) versus placebo | 1 | 202 | Odds Ratio (M‐H, Random, 95% CI) | 1.23 [0.44, 3.45] |
| 3 Withdrawing from the study or discontinuing the drug due to adverse events over 24 months Show forest plot | 5 | 2693 | Odds Ratio (M‐H, Random, 95% CI) | 2.43 [0.91, 6.49] |
| 3.1 Interferon beta‐1b (Betaseron) versus placebo | 1 | 468 | Odds Ratio (M‐H, Random, 95% CI) | 21.54 [2.92, 159.08] |
| 3.2 Interferon beta‐1a (Rebif) versus placebo | 1 | 514 | Odds Ratio (M‐H, Random, 95% CI) | 0.73 [0.26, 2.10] |
| 3.3 Glatiramer acetate versus placebo | 1 | 481 | Odds Ratio (M‐H, Random, 95% CI) | 3.58 [1.16, 11.03] |
| 3.4 Teriflunomide versus placebo | 1 | 614 | Odds Ratio (M‐H, Random, 95% CI) | 1.02 [0.58, 1.81] |
| 3.5 Cladribine versus placebo | 1 | 616 | Odds Ratio (M‐H, Random, 95% CI) | 4.13 [1.44, 11.87] |
| 4 Withdrawing from the study or discontinuing the drug due to adverse events over 12 months Show forest plot | 1 | Odds Ratio (M‐H, Random, 95% CI) | Subtotals only | |
| 4.1 Interferon beta‐1a (Avonex) versus placebo | 1 | 383 | Odds Ratio (M‐H, Random, 95% CI) | 0.14 [0.02, 1.12] |
| 5 Time to conversion to CDMS over 24 months Show forest plot | 9 | Hazard Ratio (Random, 95% CI) | 0.53 [0.47, 0.60] | |
| 5.1 Interferon beta‐1b (Betaseron) versus placebo | 1 | Hazard Ratio (Random, 95% CI) | 0.50 [0.36, 0.69] | |
| 5.2 Interferon beta‐1a (Avonex) versus placebo | 1 | Hazard Ratio (Random, 95% CI) | 0.56 [0.38, 0.83] | |
| 5.3 Interferon beta‐1a (Rebif) versus placebo | 2 | Hazard Ratio (Random, 95% CI) | 0.57 [0.43, 0.77] | |
| 5.4 Glatiramer acetate versus placebo | 1 | Hazard Ratio (Random, 95% CI) | 0.55 [0.40, 0.76] | |
| 5.5 Teriflunomide versus placebo | 1 | Hazard Ratio (Random, 95% CI) | 0.57 [0.38, 0.86] | |
| 5.6 Cladribine versus placebo | 1 | Hazard Ratio (Random, 95% CI) | 0.38 [0.25, 0.58] | |
| 5.7 Any DMD vs no treatment | 2 | Hazard Ratio (Random, 95% CI) | 0.48 [0.30, 0.78] | |
| 6 Time to conversion to CDMS over 12 months Show forest plot | 1 | Hazard Ratio (Random, 95% CI) | Subtotals only | |
| 6.1 Immunoglobulins versus placebo | 1 | Hazard Ratio (Random, 95% CI) | 0.36 [0.15, 0.86] | |
| 7 Withdrawing from the study or discontinuing the drug for any reason over 24 months Show forest plot | 6 | 2931 | Odds Ratio (M‐H, Random, 95% CI) | 1.00 [0.61, 1.62] |
| 7.1 Interferon beta‐1b (Betaseron) versus placebo | 1 | 487 | Odds Ratio (M‐H, Random, 95% CI) | 1.50 [0.95, 2.35] |
| 7.2 Interferon beta‐1a (Avonex) versus placebo | 1 | 383 | Odds Ratio (M‐H, Random, 95% CI) | 1.09 [0.65, 1.81] |
| 7.3 Interferon beta‐1a (Rebif) versus placebo | 2 | 826 | Odds Ratio (M‐H, Random, 95% CI) | 0.52 [0.18, 1.44] |
| 7.4 Teriflunomide versus placebo | 1 | 618 | Odds Ratio (M‐H, Random, 95% CI) | 0.87 [0.59, 1.27] |
| 7.5 Cladribine versus placebo | 1 | 617 | Odds Ratio (M‐H, Random, 95% CI) | 2.30 [1.49, 3.56] |
| 8 Withdrawing from the study or discontinuing the drug for any reason over 12 months Show forest plot | 1 | Odds Ratio (M‐H, Random, 95% CI) | Subtotals only | |
| 8.1 Immunoglobulins versus placebo | 1 | 91 | Odds Ratio (M‐H, Random, 95% CI) | 2.15 [0.37, 12.35] |
| Outcome or subgroup title | No. of studies | No. of participants | Statistical method | Effect size |
| 1 Time to conversion to CDMS at different follow‐up years Show forest plot | 10 | Hazard Ratio (Random, 95% CI) | Subtotals only | |
| 1.1 2‐4 years' follow‐up | 5 | Hazard Ratio (Random, 95% CI) | 0.62 [0.48, 0.81] | |
| 1.2 5 years' follow‐up | 4 | Hazard Ratio (Random, 95% CI) | 0.62 [0.53, 0.73] | |
| 1.3 8.7‐10 years' follow‐up | 2 | Hazard Ratio (Random, 95% CI) | 0.65 [0.54, 0.79] | |