Emolien dan pelembap untuk ekzema
Abstract
Background
Eczema is a chronic skin disease characterised by dry skin, intense itching, inflammatory skin lesions, and has a considerable impact on quality of life. Moisturisation is an integral part of treatment, but it is unclear if moisturisers are effective.
Objectives
To assess the effects of moisturisers for eczema.
Search methods
We searched the following databases to December 2015: Cochrane Skin Specialised Register, CENTRAL, MEDLINE, Embase, LILACS, and GREAT. We searched five trials registers and checked references of included and excluded studies for further relevant trials.
Selection criteria
Randomised controlled trials in people with eczema.
Data collection and analysis
We used standard Cochrane methodological procedures.
Main results
We included 77 studies (mean duration: 6.7 weeks; 6603 participants, mean age: 18.6 years). Thirty‐six studies were at high risk of bias, 34 at unclear risk, and seven at low risk. Twenty‐four studies assessed our primary outcome of participant‐assessed disease severity, 13 assessed satisfaction, and 41 assessed adverse events. Secondary outcomes included investigator‐assessed disease severity (addressed in 65 studies), skin barrier function (29), flare prevention (16), quality of life (10), and corticosteroid use (eight). Adverse events reporting was limited (smarting, stinging, pruritus, erythema, folliculitis).
Six studies evaluated moisturiser versus no moisturiser. Participant‐assessed disease severity and satisfaction were not assessed. Moisturiser use yielded lower SCORing Atopic Dermatitis (SCORAD) scores than no moisturiser (3 studies, 276 participants; mean difference (MD) ‐2.42, 95% confidence interval (CI) ‐4.55 to ‐0.28), but the minimal important difference (MID) was unmet. Moisturiser use resulted in fewer flares (2 studies, 87 participants; RR 0.40, 95% CI 0.23 to 0.70), prolonged time to flare (median: 180 versus 30 days), and reduced use of topical corticosteroids (2 studies, 222 participants; MD ‐9.30 g, 95% CI ‐15.3 to ‐3.27). There was no clear difference in adverse events (1 study, 173 participants; risk ratio (RR) 15.34, 95% CI 0.90 to 261.64). Evidence for these outcomes was low quality.
With Atopiclair, 174/232 participants reported improvement in disease severity versus 27/158 using vehicle (3 studies; RR 4.51, 95% CI 2.19 to 9.29). Atopiclair decreased itching (4 studies, 396 participants; MD ‐2.65, 95% CI ‐4.21 to ‐1.09) and achieved more frequent satisfaction (2 studies, 248 participants; RR 2.14, 95% CI 1.58 to 2.89), fewer flares (3 studies, 397 participants; RR 0.18, 95% CI 0.11 to 0.31), and lower Eczema Area and Severity Index (EASI) scores (4 studies, 426 participants; MD ‐4.0, 95% CI ‐5.42 to ‐2.57), but the MID was unmet. The number of participants reporting adverse events was not statistically different (4 studies, 430 participants; RR 1.03, 95% CI 0.79 to 1.33). Evidence for these outcomes was moderate quality.
Participants reported skin improvement more frequently with urea‐containing cream than placebo (1 study, 129 participants; RR 1.28, 95% CI 1.06 to 1.53; low‐quality evidence), with equal satisfaction between the two groups (1 study, 38 participants; low‐quality evidence). Urea‐containing cream improved dryness (investigator‐assessed) (1 study, 128 participants; RR 1.40, 95% CI 1.14 to 1.71; moderate‐quality evidence), and produced fewer flares (1 study, 44 participants; RR 0.47, 95% CI 0.24 to 0.92; low‐quality evidence), but caused more adverse events (1 study, 129 participants; RR 1.65, 95% CI 1.16 to 2.34; moderate‐quality evidence).
Three studies assessed glycerol‐containing moisturiser versus vehicle or placebo. More participants in the glycerol group noticed skin improvement (1 study, 134 participants; RR 1.22, 95% CI 1.01 to 1.48; moderate‐quality evidence), which also included improved investigator‐assessed SCORAD scores (1 study, 249 participants; MD ‐2.20, 95% CI ‐3.44 to ‐0.96; high‐quality evidence), but the MID was unmet. Participant satisfaction was not addressed. The number of adverse events reported was not statistically significant (2 studies, 385 participants; RR 0.90, 95% CI 0.68 to 1.19; moderate‐quality evidence).
Four studies investigated oat‐containing moisturisers versus no treatment or vehicle. No significant differences between groups were reported for participant‐assessed disease severity (1 study, 50 participants; RR 1.11, 95% CI 0.84 to 1.46; low‐quality evidence), satisfaction (1 study, 50 participants; RR 1.06, 95% CI 0.74 to 1.52; very low‐quality evidence), or investigator‐assessed disease severity (3 studies, 272 participants; standardised mean difference (SMD) ‐0.23, 95% CI ‐0.66 to 0.21; low‐quality evidence). In the oat group, there were fewer flares (1 study, 43 participants; RR 0.31, 95% CI 0.12 to 0.7; low‐quality evidence) and reduced use of topical corticosteroids (2 studies, 222 participants; MD ‐9.30g, 95% CI 15.3 to ‐3.27; low‐quality evidence), but more adverse events (1 study, 173 participants; Peto odds ratio (OR) 7.26, 95% CI 1.76 to 29.92; low‐quality evidence).
We compared all moisturisers to placebo, vehicle, or no moisturiser. Participants considered moisturisers to be more effective for reducing eczema (5 studies, 572 participants; RR 2.46, 95% CI 1.16 to 5.23; low‐quality evidence) and itch (7 studies, 749 participants; SMD ‐1.10, 95% CI ‐1.83 to ‐0.38) than control. Participants in both treatment arms reported comparable satisfaction (3 studies, 296 participants; RR 1.35, 95% CI 0.77 to 2.26; low‐quality evidence). Moisturisers led to lower investigator‐assessed disease severity scores (12 studies, 1281 participants; SMD ‐1.04, 95% CI ‐1.57 to ‐0.51; high‐quality evidence) and fewer flares (6 studies, 607 participants; RR 0.33, 95% CI 0.17 to 0.62; moderate‐quality evidence), without a difference in adverse events (10 studies, 1275 participants; RR 1.03, 95% CI 0.82 to 1.30; moderate‐quality evidence).
Topical active treatment combined with moisturiser was more effective than active treatment alone in reducing investigator‐assessed disease severity scores (3 studies, 192 participants; SMD ‐0.87, 95% CI ‐1.17 to ‐0.57; moderate‐quality evidence) and flares (1 study, 105 participants; RR 0.43, 95% CI 0.20 to 0.93), and was preferred by participants (both low‐quality evidence). There was no clear difference in number of adverse events (1 study, 125 participants; RR 0.39, 95% CI 0.13 to 1.19; very low‐quality evidence). Participant‐assessed disease severity was not addressed.
Authors' conclusions
Most moisturisers showed some beneficial effects; prolonging time to flare, reducing the number of flares and the amount of topical corticosteroids needed to achieve similar reductions in eczema severity. Moisturisers combined with active treatment gave better results than active treatment alone. We did not find reliable evidence that one moisturiser is better than another.
PICO
Ringkasan bahasa mudah
Emolien dan pelembap untuk ekzema
Soalan ulasan
Adakah emolien dan pelembap membantu mengawal ekzema?
Latar belakang
Ekzema adalah satu penyakit kulit yang kronik (tahan lama). Gejala utamanya adalah kulit kering dan kegatalan yang sengit. Kawasan yang terjejas kelihatan merah, dengan kerak dan calar, dan boleh mengalirkan cecair. Pelembab dianggap penting dalam rawatan ekzema, tetapi terdapat ketidakpastian tentang bagaimana mereka berfungsi, dan sama ada mana‐mana satu pelembap berkesan lebih baik‐dan lebih baik‐daripada yang lain.
Ciri‐ciri kajian
Kami telah mencari penerbitan perubatan sehingga Disember 2015, dan mengenal pasti 77 kajian yang berkaitan dengan 6603 peserta, terutamanya ekzema ringan sehingga sederhana. Umur peserta adalah dari empat bulan hingga 84 tahun (min: 18.6 tahun). Kebanyakan kajian berlangsung antara dua dan enam minggu, terdapat beberapa yang berkekalan sehingga enam bulan .
Empat puluh enam kajian menerima pembiayaan daripada syarikat farmaseutikal.
Keputusan utama
Kebanyakan pelembap nampaknya berkesan. Dua puluh empat kajian melaporkan keterukan ekzema yang dinilai oleh peserta. Hanya 13 kajian telah menilai kepuasan peserta dengan pelembap. Kesan‐kesan sampingan (peristiwa buruk) dilaporkan dalam 41 kajian, walaupun maklumat ini seringkali terhad (terutamanya pedih, rasa pedih, gatal, kemerahan). Kebanyakan kajian menilai tahap ekzema yang dinilai oleh doktor (65 kajian). Hasil lain berkenaan termasuklah fungsi halangan kulit (29 kajian), pencegahan dari bertambah teruk (16), kualiti hidup (10) dan penggunaan kortikosteroid (8).
Menurut pakar‐pakar perubatan, pelembap mengurangkan ekzema teruk berbanding tanpa pelembap (3 kajian), tetapi pengurangan itu terlalu kecil untuk dianggap bermakna bagi pesakit‐pesakit. Kegunaan pelembap mengakibatkan kekurangan ia bertambah teruk (2 kajian), dan mengurangkan keperluan untuk kortikosteroid topikal (2 kajian). Peserta menilai keterukan ekzema dan kepuasan tidak dinilai. Tiada perbezaan dalam bilangan kesan buruk yang dilaporkan.
Peserta menganggap Atopiclair (mengandungi asid glikopraktin) lebih daripada empat kali ganda lebih berkesan untuk meningkatkan keterukan ekzema daripada kawalan (iaitu kelihatan sama, tetapi tanpa asid glisirrhetinic) (3 kajian). Walau bagaimanapun, doktor tidak mengenal pasti perbezaan yang bermakna bagi pesakit. Atopiclair membawa kepada pengurangan gatal yang lebih banyak(4 kajian), kepuasan peserta yang lebih kerap (2 kajian), dan lebih sedikit kes ia bertambah buruk (3 kajian). Kesan sampingan adalah sama dalam kedua‐dua kumpulan.
Empat kajian mengkaji krim yang mengandungi urea. Peserta‐peserta yang menggunakan krim urea melaporkan bertambah baik lebih kerap daripada mereka yang menggunakan kawalan (1 kajian). Penarafan kepuasan dalam kedua‐dua kumpulan adalah sebanding positif (1 kajian). Krim mengandungi urea menambah baikkan kekeringan lebih kerap (penilaian pakar perubatan) (1 kajian) dan mengakibatkan sedikit suar (1 kajian), tetapi dengan lebih kesan buruk dilaporkan.
Tiga kajian mengkaji pelembab yang mengandungi gliserol berbanding dengan kawalan. Lebih peserta dalam kumpulan gliserol yang dianggap kulit mereka bertambah baik (1 kajian), seperti yang dilakukan oleh pakar‐pakar perubatan, tetapi perbezaan ini tidak bermakna cukup penting untuk pesakit. Kepuasan peserta tidak diambil kira. Tiada perbezaan dalam bilangan kesan buruk yang dilaporkan.
Empat kajian menyiasat pelembap yang mengandungi oat berbanding tiada rawatan atau kawalan. Tiada perbezaan didapati diantara kumpulan‐kumpulan untuk penambahbaikan penilaian‐ peserta (1 kajian), kepuasan peserta (1 kajian), atau penambahbaikan dinilai oleh pakar perubatan (3 kajian). Walau bagaimanapun, kumpulan oat mempunyai kurang kes bertmbah teruk (1 kajian), dan keperluan dikurangkan untuk kortikosteroid topikal (2 kajian). Krim oat boleh menyebabkan lebih banyak kesan buruk.
Apabila kita membandingkan dengan semua moisturisers terhadap tiada pelembap atau kawalan, secara keseluruhan, peserta dianggap moisturisers untuk menjadi lebih daripada dua kali lebih berkesan dalam meningkatkan ekzema daripada tidak ada pelembap atau kawalan (5 kajian), dan lebih berkesan untuk kegatalan (7 kajian). Peserta dalam kedua‐dua bahagian rawatan melaporkan kepuasan yang setanding (3 kajian). Menurut pakar‐pakar perubatan, pelembap mengurangkan tahap ekzema lebih daripada kawalan (12 kajian) dan menyebabkan sedikit suar (6 kajian). Tiada perbezaan dilaporkan untuk bilangan kesan buruk diantara kumpulan‐kumpulan tersebut .
Menurut pakar‐pakar perubatan, kortikosteroid topikal lebih berkesan untuk menambahbaik ekzema apabila digunakan dengan pelembap, dan bukannya digunakan secara bersendirian (3 kajian) dan juga telah mengurangkan jumlah suar (1 kajian). Gabungan ini juga digemari oleh para peserta, walaupun tahap penyakit yang dinilai peserta tidak ditangani. Tiada perbezaan dalam bilangan kesan buruk yang dilaporkan.
Kualiti bukti
Terdapat bukti kepastian yang tinggi untuk dinilai pakar perubatan bagi keterukan penyakit untuk krim yang mengandungi gliserolberbanding kawalan dan 'semua pelembap yang berbandingkan kawalan. Bagi kebanyakan keputusan lain diseluruh perbandingan, terdapat bukti kepastian yang rendah kepada sederhana. Sebab yang paling penting untuk merendahkan kepastian bukti adalah risiko berat sebelah dalam kajian (mis. tiada blinding, atau kehilangan data), atau terlalu sedikit peserta, yang membawa kepada keputusan yang kurang tepat.
Authors' conclusions
Summary of findings
| Moisturisers versus no moisturiser for eczema | ||||||
| Patient or population: people with eczema | ||||||
| Outcomes | Anticipated absolute effects* (95% CI) | Relative effect | № of participants | Quality of the evidence | Comments | |
|---|---|---|---|---|---|---|
| Risk with no moisturiser | Risk with moisturisers | |||||
| Change from baseline in disease severity according to participants ‐ not measured | ‐ | ‐ | ‐ | ‐ | ‐ | This outcome was not assessed in any of the studies. |
| Participant satisfaction ‐ not measured | ‐ | ‐ | ‐ | ‐ | ‐ | This outcome was not assessed in any of the studies. |
| Number of participants reporting an adverse event | Study population | RR15.34 | 173 | ⊕⊕⊝⊝ | 8/91 versus 0/82 reported an adverse event. Peto OR 7.26 (95% CI 1.76 to 29.92). 3 adverse events were reported to be mild, 3 moderate, and 2 were severe leading to treatment discontinuation. No adverse events were reported in the study of Simpson 2013 (within‐participant). | |
| 1 per 100 (0.5/82)a | 9 per 100 (1 to100) | |||||
| Change from baseline in disease severity as assessed by the investigators | The mean change from baseline in disease severity as assessed by the investigators ranged from ‐2.4 to ‐19.5 | The mean change from baseline in disease severity as assessed by the investigators in the intervention group was 2.42 lower (4.55 lower to 0.28 lower) | ‐ | 276 | ⊕⊕⊝⊝ | Reductions from baseline in Giordano‐Labadie 2006 and Grimalt 2007 met MID (= 8.7 Schram 2012) in both treatment arms. There was greater severity of disease in these studies than in Patrizi 2014. A MD of ‐2.42, although statistically significant, is not clinically important. |
| Number of participants who experienced a flare | Study population | RR 0.40 | 87 | ⊕⊕⊝⊝ | There were fewer flares in the moisturiser groups. The rate of flare in the control group was 3.74 times the rate in the moisturiser group (hazard ratio (HR) 3.74, 95% CI 1.86 to 7.50; P = 0.0002). | |
| 67 per 100 | 27 per 100 | |||||
| Amount of corticosteroids used | The mean amount of corticosteroids used ranged from 22.73 g to 62.1 g | The mean amount of corticosteroids used in the intervention group was 9.30 g less (15.30 g less to 3.27 g less) | ‐ | 222 | ⊕⊕⊝⊝ | P = 0.003. There was a statistically significant difference showing that the use of moisturisers decreased the use of topical corticosteroids to achieve similar reductions in SCORAD. |
| Change from baseline in health‐related quality of life | ‐ | The mean change from baseline in health‐related quality of life in the intervention group calculated as the SMD was 0.15 lower (0.55 lower to 0.24 higher) | ‐ | 177 | ⊕⊕⊝⊝ | There was no statistically significant difference in change from baseline of quality of life between the 2 treatment arms. |
| *The risk in the intervention group (and its 95% confidence interval) is based on the assumed risk in the comparison group and the relative effect of the intervention (and its 95% CI). | ||||||
| GRADE Working Group grades of evidence | ||||||
| aWe had to put a value other than 0 in GRADEproGDT to calculate the risk with no moisturiser in relation to the RR, and we chose 0.5 (after discussion with the GRADE working Group). GRADEproGDT then calculates the risk with moisturiser. 2Downgraded one level due to high risk of bias because of performance and detection bias. 3Downgraded one level due to serious imprecision (wide confidence interval, low occurrence of events). 4Giordano‐Labadie 2006, Grimalt 2007, Patrizi 2014. 5Downgraded one level for serious inconsistency (I² = 68%), caused by Grimalt 2007. 7Downgraded one level for serious imprecision (small sample size). 8Giordano‐Labadie 2006, Grimalt 2007. 9Downgraded one level for serious inconsistency (I² = 68%). In the study of Giordano‐Labadie 2006, far more topical corticosteroids were used and the difference between the two arms was much larger. 10Downgraded one level for serious imprecision (wide confidence interval). | ||||||
| Atopiclair versus vehicle for eczema | ||||||
| Patient or population: people with eczema | ||||||
| Outcomes | Anticipated absolute effects* (95% CI) | Relative effect | № of participants | Quality of the evidence | Comments | |
|---|---|---|---|---|---|---|
| Risk with vehicle | Risk with Atopiclair | |||||
| Change from baseline in disease severity according to participants (number of participants who considered their skin to have improved) | Study population | RR 4.51 | 390 | ⊕⊕⊕⊝ | Participants considered Atopiclair more effective than its vehicle. NNTB = 2, 95% CI 1 to 2 | |
| 17 per 100 | 77 per 100 | |||||
| Participant satisfaction | Study population | Not estimable | 248 | ⊕⊕⊕⊝ | Abramovits 2008: 119/145 (Atopiclair) vs 28/73 (vehicle) wished to continue (RR 2.14, 95% CI 1.58 to 2.89; P < 0.00001; NNTB = 2; 95% CI 2 to 3). Belloni 2005: 5/15 vs 0/15 would use again (Peto OR 10.18, 95% CI 1.54 to 67.23; P = 0.02) | |
| Not pooled | Not pooled | |||||
| Number of participants reporting an adverse event | Study population | RR 1.03 | 430 | ⊕⊕⊕⊝ | The number of participants reporting adverse events was not statistically different between the 2 groups. | |
| 33 per 100 | 34 per 100 | |||||
| Change from baseline in disease severity according to the investigators | The mean change from baseline in disease severity according to the investigators ranged from ‐1.7 to 0.84 | The mean change from baseline in disease severity according to the investigators in the intervention group was 4 lower (5.42 lower to 2.57 lower) | ‐ | 426 | ⊕⊕⊕⊝ | Although there is a statistically significant difference in favour of Atopiclair, the difference between the treatment group is not clinically important (MID EASI is 6.6 (Schram 2012)). |
| Number of participants who experienced a flare | Study population | RR 0.18 | 397 | ⊕⊕⊕⊝ | Participants in the Atopiclair group experienced fewer flares than the vehicle group (NNTB 3, 95% CI 3 to 5). | |
| 35 per 100 | 6 per 100 | |||||
| Change in use of topical active treatment ‐ not measured | ‐ | ‐ | ‐ | ‐ | ‐ | This outcome was not assessed in any of the studies. |
| Change from baseline in health‐related quality of life ‐ not measured | ‐ | ‐ | ‐ | ‐ | ‐ | This outcome was not assessed in any of the studies. |
| *The risk in the intervention group (and its 95% confidence interval) is based on the assumed risk in the comparison group and the relative effect of the intervention (and its 95% CI). | ||||||
| GRADE Working Group grades of evidence | ||||||
| 1Abramovits 2008, Belloni 2005, Boguniewicz 2008. 2Downgraded one level for serious imprecision (wide confidence interval). 3Abramovits 2008, Belloni 2005. 4Downgraded one level for serious indirectness, as outcomes did not exactly match participant satisfaction. 5Abramovits 2008, Belloni 2005, Boguniewicz 2008, Patrizi 2008. 6Downgraded one level for serious imprecision (small sample size and CI includes no difference (1) and appreciable harm (1.25)). 7Downgraded one level for serious inconsistency (I² = 51%), caused by Boguniewicz 2008, which showed a larger effect size. 8Abramovits 2008, Boguniewicz 2008, Patrizi 2008. 9Downgraded one level for risk of bias (Abramovits 2008: high risk for attrition bias, Boguniewicz 2008: unclear risk of bias for allocation concealment blinding and incomplete outcome data, and Patrizi 2008: at unclear risk of bias due to incomplete outcome data). | ||||||
| Urea‐containing moisturiser versus vehicle, placebo or no moisturiser for eczema | ||||||
| Patient or population: people with eczema | ||||||
| Outcomes | Anticipated absolute effects* (95% CI) | Relative effect | № of participants | Quality of the evidence | Comments | |
|---|---|---|---|---|---|---|
| Risk with vehicle, placebo or no moisturiser | Risk with urea‐ containing moisturiser | |||||
| Change from baseline in disease severity according to the participants (number of participants who considered their skin to have improved) | Study population | RR 1.28 | 129 | ⊕⊕⊝⊝ | P = 0.0009. NNTB = 5 (95% CI 3 to 18). Participants considered that urea‐containing moisturiser provided more improvement than placebo cream without urea. In Wilhelm 1998 (n = 77, within‐participant design), 61% considered that the side treated with urea cream showed moderate to very good improvement, and 48.1% felt the vehicle‐treated side showed moderate to very good improvement. | |
| 70 per 100 | 89 per 100 | |||||
| Participant satisfaction Assessed with: Likert scale Follow‐up: mean 4 weeks | ‐ | 38 (1 RCT) 4, 5 | ⊕⊕⊝⊝ | Smell, spreadability, penetration into the skin, and skin feel were assessed. None of these features were assessed as being better on the urea‐treated side than on the vehicle‐treated side. For details, see comparison 2b under Effects of interventions. | ||
| Number of participants reporting an adverse event | Study population | RR 1.65 | 129 | ⊕⊕⊕⊝ | P = 0.005; NNTH = 4, 95% CI 2 to 11.There were fewer adverse events in the group treated with placebo cream. | |
| 39 per 100 | 65 per 100 | |||||
| Change from baseline in disease severity according to the investigators (number of participants who improved according to the investigators) | Study population | RR 1.40 | 129 | ⊕⊕⊕⊝ | The assessments of the investigators were in line with the assessments of the participants. P = 0.001; NNTB = 4, 95% CI 3 to 9. The within‐participant study of Wilhelm 1998 demonstrated a mean of the paired differences of ‐0.57 (95% CI ‐1.14 to 0.0) in favour of urea moisturiser (lower score being better), and is more or less in line with the parallel‐design study of Lodén 2002. | |
| 64 per 100 | 89 per 100 | |||||
| Number of participants who experienced a flare | Study population | RR 0.47 | 44 | ⊕⊕⊝⊝ | P = 0.03; NNTB = 3, 95% CI 2 to 11 The rate of flare in the group that did not use a moisturiser was 3.2 times the rate in the group treated with urea cream (HR 3.2, 95% CI 1.3 to 7.8; P < 0.01). | |
| 68 per 100 | 32 per 100 | |||||
| Change in use of topical active treatment ‐ not measured | ‐ | ‐ | ‐ | ‐ | ‐ | This outcome was not assessed in any of the studies. |
| Change from baseline in health‐related quality of life ‐ not measured | ‐ | ‐ | ‐ | ‐ | ‐ | This outcome was not assessed in any of the studies. |
| *The risk in the intervention group (and its 95% confidence interval) is based on the assumed risk in the comparison group and the relative effect of the intervention (and its 95% CI). | ||||||
| GRADE Working Group grades of evidence | ||||||
| 2Downgraded one level for serious indirectness, the study of Lodén 2002 had a parallel study design and the study of Wilhelm 1998 had a within‐participant design. 3Downgraded one level for serious imprecision (small sample size). 5Within‐participant design. 6Downgraded two levels for very serious imprecision (very small sample size). 8Downgraded one level for risk of bias as Wirén 2009 was assessed as at high risk of bias as the study was not blinded. | ||||||
| Glycerin/glycerol‐containing moisturiser versus vehicle or placebo for eczema | ||||||
| Patient or population: people with eczema | ||||||
| Outcomes | Anticipated absolute effects* (95% CI) | Relative effect | № of participants | Quality of the evidence | Comments | |
|---|---|---|---|---|---|---|
| Risk with vehicle or placebo | Risk with glycerol‐containing moisturiser | |||||
| Change from baseline in disease severity as assessed by the participants | Study population | RR 1.22 | 134 | ⊕⊕⊕⊝ | Participants considered glycerol‐containing moisturiser more effective for improving dry skin than placebo cream (P = 0.03; NNTB = 6, 95% CI 3 to 60) | |
| 70 per 100 | 85 per 100 | |||||
| Participant satisfaction ‐ not measured | ‐ | ‐ | ‐ | ‐ | ‐ | This outcome was not assessed in any of the studies. |
| Number of participants reporting an adverse event | Study population | RR 0.90 | 385 | ⊕⊕⊕⊝ | The adverse events were mild to moderate and consisted of smarting, erythema, pruritus, or burning. | |
| 35 per 100 | 32 per 100 | |||||
| Change from baseline in disease severity as assessed by the investigators | The mean change from baseline in disease severity as assessed by the investigators was ‐3.1 | The mean change from baseline in disease severity as assessed by the investigators in the intervention group was 2.2 lower (3.44 lower to 0.96 lower) | ‐ | 249 | ⊕⊕⊕⊕ | P = 0.0005, but does not meet the MID (which is 8.2 for objective SCORAD (Schram 2012)). The study of Breternitz 2008 had a within‐participant design and confirmed these data. The mean of the paired differences was ‐1.10, CI 95% ‐1.63 to ‐0.57. In Lodén 2002, in the glycerol group 58/68 showed improvement in 'dryness' of the skin versus 42/66 in the vehicle group (RR 1.34, 95% CI 1.09 to 1.65; P = 0.0006, NNTB 5, 95% CI 3 to 14) |
| Number of participants who experienced a flare ‐ not measured | ‐ | ‐ | ‐ | ‐ | ‐ | This outcome was not assessed in any of the studies. |
| Change in use of topical active treatment ‐ not measured | ‐ | ‐ | ‐ | ‐ | ‐ | This outcome was not assessed in any of the studies. |
| Change from baseline in health‐related quality of life ‐ not measured | ‐ | ‐ | ‐ | ‐ | ‐ | This outcome was not assessed in any of the studies. |
| *The risk in the intervention group (and its 95% confidence interval) is based on the assumed risk in the comparison group and the relative effect of the intervention (and its 95% CI). | ||||||
| GRADE Working Group grades of evidence | ||||||
| 2Downgraded one level for serious imprecision (lower bound of CI approaches 1). 3Lodén 2002 and Boralevi 2014. 4Downgraded one level for serious imprecision (small sample size and CI includes appreciable benefit (0.75) and no difference (1)). | ||||||
| Oat‐containing moisturiser versus vehicle or no moisturiser | ||||||
| Patient or population: people with eczema | ||||||
| Outcomes | Anticipated absolute effects* (95% CI) | Relative effect | № of participants | Quality of the evidence | Comments | |
|---|---|---|---|---|---|---|
| Risk with vehicle or no moisturiser | Risk with oat‐containing moisturiser | |||||
| Change from baseline in disease severity as assessed by the participants (number of participants who considered their skin to have improved) | Study population | RR 1.11 | 50 | ⊕⊕⊝⊝ | P = 0.45. Participants did not consider that the oat‐containing moisturiser was more effective than the control treatment (occlusive vehicle). | |
| 76 per 100 | 84 per 100 | |||||
| Participant satisfaction | Study population | RR 1.06 | 50 | ⊕⊝⊝⊝ | P = 0.76. Participants were not more satisfied with oat‐containing moisturiser than with the occlusive vehicle. | |
| 68 per 100 | 72 per 100 | |||||
| Number of participants reporting an adverse event | Study population | RR 15.34 | 173 | ⊕⊕⊝⊝ | 8/91 versus 0/82 reported an adverse event. | |
| 1 per 100 | 9 per 100 | |||||
| Change from baseline in disease severity as assessed by the investigators | ‐ | The mean change from baseline in disease severity in the intervention group calculated as the SMD was 0.23 lower (0.66 lower to 0.21 higher) | ‐ | 272 | ⊕⊕⊝⊝ | P = 0.30. There was no statistically significant difference according to the investigators between the 2 treatment arms. |
| Number of participants who experienced a flare | Study population | RR 0.31 | 43 | ⊕⊕⊝⊝ | P = 0.01; NNTB = 2, 95% CI 1 to 5. The HR for rate of flare was 4.74 (95% CI 1.57 to 14.34; P = 0.006) in favour of the oat‐containing cream. | |
| 65 per 100 | 20 per 100 | |||||
| Total amount of topical corticosteroids used | The mean total amount of topical corticosteroids used ranged from 22.73 g to 62.1 g | The mean total amount of topical corticosteroids used in the intervention group was 9.3 g lower (15.3 g less to 3.27 g less) | ‐ | 222 | ⊕⊕⊝⊝ | P = 0.003. There is a statistically significant difference showing that the use of moisturisers decreased the use of topical corticosteroids to achieve similar reductions in disease severity. |
| Change from baseline in health‐related quality of life | ‐ | The mean change from baseline in health‐related quality of life in the intervention group calculated as the SMD was 0.09 lower (0.37 lower to 0.19 higher) | ‐ | 226 | ⊕⊕⊝⊝ | There was no statistically significant difference in change from baseline in quality of life between the 2 treatment arms. |
| *The risk in the intervention group (and its 95% confidence interval) is based on the assumed risk in the comparison group and the relative effect of the intervention (and its 95% CI). | ||||||
| GRADE Working Group grades of evidence | ||||||
| aWe had to put a value other than 0 in GRADEproGDT to calculate the risk with no moisturiser in relation to the RR, and we chose 0.5 (after discussion with the GRADE working Group). GRADEproGDT then calculates the risk with moisturiser. 2Downgraded two levels level for very serious imprecision (small sample size and CI includes no effect (1) and appreciable benefit (1.25)). 3Downgraded one level for serious indirectness as the outcome was more about soothing and calming of the skin and not really participant satisfaction. 4Downgraded two levels for very serious imprecision as the CI includes both no effect, and benefit of both oat‐containing cream as well as of the vehicle. 5Downgraded one level for risk of bias because of performance and detection bias. 6Downgraded one level for serious imprecision (wide confidence interval, low occurrence of events). 8Giordano‐Labadie 2006, Grimalt 2007, Nebus 2009. 9Downgraded one level for serious inconsistency (I² = 65%), caused by Giordano‐Labadie 2006, which was the study showing a favourable result for the oat‐containing creams whilst the other studies showed no difference between the treatment arms. 10Downgraded one level for serious imprecision; the CI creates uncertainty with the effect, ranging from moderate effect to small harmful effect. 11Weber 2015. 12Downgraded one level for serious imprecision (small sample size). 13Giordano‐Labadie 2006 and Grimalt 2007. 14Downgraded one level for serious inconsistency (I² = 68%). In the study of Giordano‐Labadie 2006, far more topical corticosteroids were used and the difference between the two arms was much larger. 15Downgraded one level for serious imprecision (wide confidence interval). 16Downgraded one level for serious risk of bias because of performance, detection, and attrition bias. 17Downgraded one level for serious imprecision (the CI creates uncertainty with the effect, ranging from small effect to small harmful effect). | ||||||
| All moisturisers compared to vehicle, placebo or no moisturiser for eczema | ||||||
| Patient or population: people with eczema | ||||||
| Outcomes | Anticipated absolute effects* (95% CI) | Relative effect | № of participants | Quality of the evidence | Comments | |
|---|---|---|---|---|---|---|
| Risk with vehicle, placebo or no moisturiser | Risk with all moisturisers | |||||
| Change from baseline in disease severity as assessed by the participants (number of participants who considered their skin to have improved) | Study population | RR 2.46 | 572 | ⊕⊕⊝⊝ | Participants considered the use of a moisturiser to be more effective than vehicle/placebo or no moisturiser. P = 0.02, NNTB = 2, 95% CI 2 to 3 | |
| 37 per 100 | 91 per 100 | |||||
| Participant satisfaction | Study population | RR 1.35 | 298 | ⊕⊕⊝⊝ | P = 0.29. According to the participants, there was no difference between the 2 treatment arms for this outcome. Results are supported by the within‐participant study (Bohnsack 1997). | |
| 48 per 100 | 65 per 100 | |||||
| Number of participants reporting an adverse event | Study population | RR 1.03 | 1275 | ⊕⊕⊕⊝ | There was no statistically significant difference in number of participants experiencing an adverse event. | |
| 23 per 100 | 24 per 100 | |||||
| Change from baseline in disease severity as assessed by the investigators | ‐ | The mean change from baseline in disease severity as assessed by the investigators in the intervention group calculated as the SMD was 1.04 lower (1.57 lower to 0.51 lower) | ‐ | 1281 | ⊕⊕⊕⊕ | P < 0.0001 The investigators considered the use of moisturisers to be more beneficial than the vehicle, placebo, or no moisturiser. However, clinical impact was unclear. |
| Number of participants who experienced a flare | Study population | RR 0.33 | 607 | ⊕⊕⊕⊝ | P = 0.006; NNTB = 4, 95% CI 3 to 5. The rate of flare in the control group was 3.74 times the rate in the moisturiser group based on Weber 2015 and Wirén 2009 (HR 3.74, 95% CI 1.86 to 7.50; P = 0.0002 in favour of moisturiser). | |
| 41 per 100 | 13 per 100 | |||||
| Total amount of topical corticosteroids used | The mean amount of corticosteroids used ranged from 22.73 g to 62.1 g | The mean amount of corticosteroids used in the intervention group was 9.30 g less (15.30 g less to 3.27 g less) | ‐ | 222 | ⊕⊕⊝⊝ | P = 0.003. There was a statistically significant difference showing that the use of moisturisers decreased the use of topical corticosteroids to achieve similar reductions in eczema severity. |
| Change from baseline in health‐related quality of life | ‐ | The mean change from baseline in health‐related quality of life in the intervention group calculated as the SMD was 0.39 lower (0.9 lower to 0.12 higher) | ‐ | 300 | ⊕⊕⊝⊝ | The effect on quality of life ranges from a moderate effect on quality of life in favour of moisturisers to no difference between the groups. |
| *The risk in the intervention group (and its 95% confidence interval) is based on the assumed risk in the comparison group and the relative effect of the intervention (and its 95% CI). | ||||||
| GRADE Working Group grades of evidence | ||||||
| 1Abramovits 2008, Belloni 2005, Boguniewicz 2008, Lodén 2002, Nebus 2009. 2Downgraded one level for inconsistency (I² = 95%), which was in part caused studies by studies at risk for attrition bias (Abramovits 2008 and Boguniewicz 2008). 3Downgraded one level for serious imprecision (wide confidence interval). 4Abramovits 2008, Belloni 2005, Nebus 2009. 5Downgraded one level for serious inconsistency (I² = 83%). All heterogeneity was removed when a study at high risk of bias was excluded (Abramovits 2008); we did not double count for risk of bias. 6Downgraded one level for serious imprecision (CI interval includes no effect (1) and appreciable benefit (1.25)). 7Abramovits 2008, Belloni 2005, Boguniewicz 2008, Boralevi 2014, Gayraud 2015, Grimalt 2007, Korting 2010, Lodén 2002, Patrizi 2008, Tan 2010. 8Downgraded one level for imprecision (CI interval included no difference (1) and appreciable harm (1.25)). 9Abramovits 2008, Belloni 2005, Boguniewicz 2008, Boralevi 2014, Gayraud 2015, Giordano‐Labadie 2006, Grimalt 2007, Korting 2010, Nebus 2009, Patrizi 2008, Patrizi 2014, Tan 2010. 10We did not downgrade for inconsistency as all sensitivity analyses show a clear positive effect of moisturisers. 11Abramovits 2008, Boguniewicz 2008, Gayraud 2015, Patrizi 2008, Weber 2015, Wirén 2009. 12Downgraded one level for serious inconsistency (I² = 73%), which was caused by the studies at unclear to high risk of bias showing better results. 13Giordano‐Labadie 2006, Grimalt 2007. 14Downgraded one level for serious inconsistency (I² = 68%). In the study of Giordano‐Labadie 2006, far more topical corticosteroids were used and the difference between the two arms was much larger. 15Gayraud 2015, Giordano‐Labadie 2006, Grimalt 2007. 16We did not downgrade for risk of bias, as, although there was attrition bias in Grimalt 2007, it did not impact the overall result, and even reduced the direction of effect. 17Downgraded one level for serious inconsistency (I² = 79%), it might have no effect at all, signal around 0. 18Downgraded one level for serious imprecision (CI includes moderate effect in favour of moisturisers as well as no difference). | ||||||
| Licochalcone‐containing moisturiser versus hydrocortisone acetate1% cream for eczema | ||||||
| Patient or population: people with eczema | ||||||
| Outcomes | Anticipated absolute effects* (95% CI) | Relative effect | № of participants | Quality of the evidence | Comments | |
|---|---|---|---|---|---|---|
| Risk with hydrocortisone acetate 1% cream | Risk with licochalcone‐containing moisturiser | |||||
| Change from baseline in disease severity according to participants ‐ not measured | ‐ | ‐ | ‐ | ‐ | ‐ | This outcome was not assessed in any of the studies. |
| Number of participants who rated treatment satisfaction as good to excellent | ‐ | ‐ | ‐ | 30 | ⊕⊕⊝⊝ | On both treatment sides, 22/30 participants rated their satisfaction good to excellent with no difference between either side. |
| Number of participants reporting an adverse event | ‐ | ‐ | ‐ | 18 | ⊕⊕⊝⊝ | Both Udompataikul 2011 and Wanakul 2013 reported no adverse events on any side during the study. Side effects in Angelova‐Fischer 2014 (within‐participant study) were skin tightness, itch, and scaling on both sides. 9 side effects were reported on each forearm (n = 18). |
| Change from baseline in disease severityas assessed by the investigators | The mean disease severity as assessed by the investigators ranged from ‐3.50 to ‐21.29 | The mean disease severity as assessed by the investigators in the intervention group was 0.08 higher (1.96 lower to 2.13 higher) | ‐ | 96 | ⊕⊕⊝⊝ | There was no statistically significant difference between the 2 treatments, which is in accordance with the data for participant satisfaction. |
| Number of participants who experienced a flare | ‐ | ‐ | ‐ | 30 | ⊕⊕⊝⊝ | 3/30 experienced a flare on the side treated with licochalcone and 6/30 on the contralateral side treated with hydrocortisone acetate 1%. |
| Change in use of active topical treatment ‐ not measured | ‐ | ‐ | ‐ | ‐ | ‐ | This outcome was not assessed in any of the studies. |
| Change from baseline in quality of life ‐ not measured | ‐ | ‐ | ‐ | ‐ | ‐ | This outcome was not assessed in any of the studies. |
| *The risk in the intervention group (and its 95% confidence interval) is based on the assumed risk in the comparison group and the relative effect of the intervention (and its 95% CI). | ||||||
| GRADE Working Group grades of evidence | ||||||
| 1Within‐participant study Udompataikul 2011. 2We did not downgrade for detection bias as the participants were not blinded, but they considered treatments equally satisfactory. 3Downgraded two levels for serious imprecision (very small sample size). 4Within‐participant study Angelova‐Fischer 2014. 5Not downgraded for risk of bias (participants in Angelova‐Fischer 2014 and Udompataikul 2011 were not blinded) as there was no difference between the both treatment arms regarding reporting adverse events. 6Downgraded two levels for very serious imprecision (very small sample size). 7We did not downgrade for detection bias as investigators were blinded. 8Downgraded two levels for very serious inconsistency (I² = 85%); it could benefit both treatments. We therefore did not downgrade further for imprecision. Differences in study duration, and, in Angelova‐Fischer 2014, only forearms were treated. 9Downgraded one level for serious imprecision (small sample size and as we downgraded for risk of bias, we only downgraded once for imprecision for this outcome). 10Downgraded one level for risk of bias (no blinding of participants). | ||||||
| Vehicle treatment + daily moisturiser compared to fluticasone propionate twice weekly + daily moisturiser for eczema | ||||||
| Patient or population: people with eczema | ||||||
| Outcomes | Anticipated absolute effects* (95% CI) | Relative effect | № of participants | Quality of the evidence | Comments | |
|---|---|---|---|---|---|---|
| Risk with fluticasone propionate twice weekly + moisturiser | Risk with vehicle treatment + moisturiser | |||||
| Change from baseline in disease severity as assessed by the participants (number of participants reporting good to excellent result) | Study population | RR 0.45 | 348 | ⊕⊕⊕⊕ | NNTB = 3, 95% CI 2 to 3, in favour of fluticasone propionate twice weekly + daily moisturiser | |
| 71 per 100 | 32 per 100 | |||||
| Participant satisfaction ‐ not measured | ‐ | ‐ | ‐ | ‐ | ‐ | This outcome was not assessed in any of the studies. |
| Number of participants reporting an adverse event | Study population | RR 0.51 | 718 | ⊕⊕⊝⊝ | Although there was a trend favouring the vehicle treatment + daily moisturiser, the 2 comparisons of Berth‐Jones 2003 implied that they might be equally safe (no adverse events in either group). | |
| 22 per 100 | 11 per 100 | |||||
| Change from baseline in disease severityas assessed by the investigators | 75 (1 RCT)5 | ⊕⊕⊕⊝ | There were reporting inconsistencies in the paper between the data table and text regarding the increase in SCORAD in the twice‐weekly fluticasone propionate + daily moisturiser group. These were reported as 7.1 in the table and as 3.8 in the text. In the vehicle + daily moisturiser group, the increase was 12.2 in both table and text. | |||
| Number of participants who experienced a flare | Study population | RR 2.17 | 718 | ⊕⊕⊕⊝ | NNTB = 3, 95% CI 2 to 3. Twice‐weekly fluticasone propionate combined with moisturiser resulted in fewer flares than moisturiser alone. HR of rate of flare 3.69, 95% CI 1.80 to 7.55 in favour of fluticasone propionate twice weekly + daily moisturiser | |
| 28 per 100 | 61 per 100 | |||||
| Change in use of topical active treatment ‐ not measured | ‐ | ‐ | ‐ | ‐ | ‐ | This outcome was not assessed in any of the studies. |
| Change from baseline in quality of life ‐ not measured | ‐ | ‐ | ‐ | ‐ | ‐ | This outcome was not assessed in any of the studies. |
| *The risk in the intervention group (and its 95% confidence interval) is based on the assumed risk in the comparison group and the relative effect of the intervention (and its 95% CI). | ||||||
| GRADE Working Group grades of evidence | ||||||
| 2Berth‐Jones 2003 (two comparisons), Glazenburg 2009, Hanifin 2002. 3Downgraded one level for serious inconsistency (I² = 67%); as there were no adverse events in both comparisons in Berth‐Jones 2003 in both treatment arms, they could be equally safe. 4Downgraded one level for serious imprecision (CI includes appreciable benefit and no difference). 5Glazenburg 2009 (See 'Comments'). 6Downgraded one level for serious imprecision (small sample size). 7Downgraded one level for serious inconsistency (I² = 72%). | ||||||
| Topical active treatment in combination with moisturiser compared to topical active treatment alone for eczema | ||||||
| Patient or population: people with eczema | ||||||
| Outcomes | Anticipated absolute effects* (95% CI) | Relative effect | № of participants | Quality of the evidence | Comments | |
|---|---|---|---|---|---|---|
| Risk with active treatment alone | Risk with active treatment in combination with moisturiser | |||||
| Change from baseline in disease severity according to participants ‐ not measured | ‐ | ‐ | ‐ | ‐ | ‐ | This outcome was not assessed in any of the studies. |
| Participant satisfaction | ‐ | ‐ | 201 | ⊕⊕⊝⊝ | Hanifin 1998: 96% of 78 preferred the combination treatment and just 4% the active treatment 'only'. Simpson 2011: 84.3% to 96.7% of 123 felt that the addition of the RestoraDerm to the routine use of their topical steroids "reduces inflammation, relieves dry and itchy skin, provides long lasting hydration, leaves skin protected and maintains healthy skin". | |
| Number of participants reporting an adverse event Follow‐up: mean 3 weeks | Study population | RR 0.39 | 125 | ⊕⊝⊝⊝ | Draelos 2008: no adverse events. Hanifin 1998 (within‐participant): 10 participants reported burning and stinging on the side treated with desonide 0.05% combined with moisturiser versus 11 on the other side treated with only desonide 0.05%. | |
| 16 per 100 | 6 per 100 | |||||
| Change from baseline in disease severity as assessed by the investigators | ‐ | The mean change from baseline in disease severity as assessed by the investigators in the intervention group calculated as the SMD0.87 lower (1.17 lower to 0.57 lower) | ‐ | 192 | ⊕⊕⊕⊝ | According to the assessments of the investigators, adding a moisturiser to topical active treatment is more effective than topical active treatment alone. |
| Number of participants who experienced a flare | Study population | RR 0.43 | 105 | ⊕⊕⊝⊝ | Adding a moisturiser to active treatment reduced the number of flares (NNTB = 6, 95% CI 3 to 57). | |
| 31 per 100 | 13 per 100 | |||||
| Change in amount of use topical active treatment ‐ not measured | ‐ | ‐ | ‐ | ‐ | ‐ | This outcome was not assessed in any of the studies. |
| Change from baseline in health‐related quality of life | The mean change from baseline in health‐related quality of life ranged from ‐2.07 to ‐3.17 | The mean change from baseline in health‐related quality of life in the intervention group was 1.31 lower (2.7 lower to 0.09 higher) | ‐ | 67 | ⊕⊕⊝⊝ | The study duration of 3 weeks was short; there was no difference in changes from baseline in quality of life between the 2 treatment groups. Results of DFI confirmed this (MD ‐1.03, 95% CI ‐2.47 to 0.42) |
| *The risk in the intervention group (and its 95% confidence interval) is based on the assumed risk in the comparison group and the relative effect of the intervention (and its 95% CI). | ||||||
| GRADE Working Group grades of evidence | ||||||
| 1Within‐participant design. 3Downgraded one level for serious risk of detection bias (no blinding of participants). 4Downgraded one level for serious indirectness as in both studies satisfaction was not really assessed. 5Wu 2014. 6Downgraded one level for risk of bias. Hanifin 1998 and Wu 2014 were assessed as being at a high risk of bias. 7Downgraded one level for serious indirectness for different reporting on adverse events including outcome definitions. 8Downgraded one level for serious imprecision (small sample size, too few adverse events, and wide CI). 9Msika 2008 (2 comparisons), Wu 2014. 10Downgraded one level for risk of bias (no blinding of outcome assessors). 11Downgraded one level for risk of bias (attrition bias (17/62) in the control group). 12Downgraded one level for serious imprecision (small sample size). 13Msika 2008 (2 comparisons). 14Downgraded one level for risk of bias (no blinding of participants). | ||||||
Background
We have listed relevant terms in the glossary of terms in Table 1.
| Term | Definition |
|---|---|
| Adverse events | Unwanted side effects of using medication |
| Allergic contact dermatitis | A form of eczema after contact with a substance (an allergen) that produces (elicits) an immune‐mediated response in the skin |
| Allergic rhinitis | 'Hay fever': inflammation of the nose caused by allergens such as house dust mite, animals, pollen. Symptoms include sneezing, itchiness in the nose, watery eyes, runny or blocked nose |
| Ameliorate | Improve, to make something (such as a problem) better |
| Atopy | The individual's genetic predisposition to develop allergic reactions such as eczema, allergic rhinitis and asthma. Atopy often involves production of IgE antibodies against allergens such as, for example, house dust mite, animals, grass and tree pollen, and food proteins. |
| Bacteria | Also referred to as germs, bacteria are tiny micro‐organisms that are invisible to the eye. They are found everywhere and can be harmful, e.g. causing infections, or helpful, e.g. aiding digestion of food |
| Ceramides | Lipid (fatty) molecules found in the lipid bilayer of the intercellular matrix (see `Intercellular lipid matrix' below) |
| Colonisation | The point at which an Infection begins, when an organism successfully enters the body, grows and multiplies |
| Control | The alternative treatment, placebo, or absence of treatment against which the intervention of interest in the review is compared |
| Corneodesmosomes | Any of a class of proteins that hold corneocytes (cells in the epidermis, or outer layers of the skin) together; their degradation leads to desquamation (see 'Desquamation' below) |
| DASI | Dry skin area and severity index: a tool used to evaluate dryness and severity of dry skin (Serup 1995) |
| Desquamation | Skin peeling |
| Dizygotic | Non‐identical twins, i.e. twins formed from two different eggs fertilised by separate sperm cells, are referred to as dizygotic. |
| DLQI | Dermatology Life Quality Index: an assessment tool to evaluate the impact of eczema and its treatment on quality of life (Finlay 1994) |
| EASI | Eczema Area and Severity Index: a tool used to measure the extent (area) and severity of eczema (Hanifin 2001) |
| Emollients | The terms `emollients' and `moisturisers' are often used interchangeably. But, since 'emollient' sometimes refers to a specific ingredient that soothes the skin, it is more appropriate to use the term 'moisturiser'. Emollients are included within ointments, creams, lotions, gels, bath oils and sprays, and are used to keep the skin soft and supple and reduce scaling. Application to the skin reduces water loss by covering it with a protective film. They can be used frequently and might ease itching |
| Epidermis | The outermost layers of cells in the skin which consist mainly of keratinocytes that mature to become corneocytes |
| Exacerbation | Periods of worsening the symptoms and signs of eczema |
| Excoriation | Abrasion, scratched skin |
| Extensor | The opposite site of a flexure point, i.e. the outer side of, for example elbow, knee or wrist |
| Filaggrin | An epidermal barrier protein |
| Flare | Periods of worsening of eczema symptoms and signs, or escalation in use of medication (Thomas 2015) |
| Flexural dermatitis | Eczema at the flexure points (inner sides) of elbow, knees, wrists, groin and armpits |
| Gene | Part of DNA that encodes a protein involved in body function |
| Genome‐wide linkage study | An established tool to map inherited diseases |
| Humectant | Substance or product that is 'water loving' and draws water towards it |
| Hygroscopic | Absorbing water |
| Hypersensitivity | An exaggerated immune response toward an allergen (for example pollen, house dust mite, but also for contact allergens such as nickel and fragrances) |
| IgE (immunoglobulin E) | A class of antibody that is important in defence against parasitic disease, and plays a key role in the disease process of allergic diseases. People with eczema often have an increased level of IgE in their blood |
| Immune response | The process through which the body identifies and defends itself against bacteria, viruses and other harmful agents |
| Intercellular lipid matrix | Space surrounding corneocytes with stacked layers of lipids |
| Lesion | A region or area of damaged skin |
| Lesional | Concerning lesions, or accompanied by lesions |
| Lichenification | Skin thickening |
| Moisturisers | Ointments, creams, lotions, gels, bath oils and sprays that are used to keep the skin soft and supple and reduce scaling. Application to the skin reduces water loss and covers it with a protective film. Moisturisers can be used frequently and might ease itching. |
| Monozygotic | Identical twins, i.e. twins who develop from a single fertilised egg (zygote) that splits to form two identical embryos, are referred to as monozygotic (in contrast to dizygotic twins (see above)). |
| Objective | Something observed and verified by physician or investigator by visible physical signs or laboratory tests (i.e. based on facts, not emotions or feelings) |
| Objective‐ SCORAD | Objective ‐ SCORing Atopic Dermatitis is a clinical scoring system, that uses the SCORAD system and excludes subjective symptoms, which cannot be measured accurately, such as daytime itching (pruritus) and sleep loss (Kunz 1997) |
| Occlusive | Describes an agent or process that seals something off |
| Over‐the‐counter (OTC) medicines | Medicines that can be bought without a prescription |
| Papulovesicular | Relating to an eruption of papules (clearly defined (circumscribed), solid elevations of skin with no visible fluid) and vesicles (small fluid‐filled sacs on the skin) |
| Pathogenesis | Origin of disease and how it develops |
| Pathognomonic biomarker | A specific indicator for a disease |
| Photochemotherapy (PUVA) | PUVA is a combination treatment of a drug (psoralen) with ultraviolet A (UVA) light. The psoralen makes the skin temporarily more sensitive to the ultraviolet light |
| Phototherapy | Treatment with ultraviolet light (UVB or UVA) |
| Placebo | A 'dummy' or fake medicine that has no expected benefit. In this review placebo means, in accordance with the terminology used by the investigators, a moisturiser without the ingredient considered to be the most beneficial, and so, of a different composition than the moisturiser being studied. Use of placebo treatments allows patients and staff to be blinded, as the placebo and active treatments appear the same, so it is impossible to tell which has been used. |
| POEM | The Patient Oriented Eczema Measure is a self‐assessment tool for monitoring eczema severity, based on signs and symptoms (Charman 2004) |
| PO‐SCORAD | The Patient‐Oriented SCORing Atopic Dermatitis (PO‐SCORAD) index is a self‐assessment score for patients to evaluate their eczema, based on subjective and objective criteria from the SCORAD (see also SCORAD below) (Stalder 2011) |
| Preservative | A natural or synthetic ingredient added to products such as foods, pharmaceuticals, paints, biological samples, wood, etc. which help to prevent decomposition caused by microbial growth or by undesirable chemical changes |
| Propylene glycol | Propylene glycols attract water and by enhancing skin penetration they behave as moisturisers to improve the appearance of the skin |
| Protease | An enzyme that breaks down proteins (via proteolysis) |
| Pruritus | Itch |
| Quality of life | The general well‐being of individuals and societies. Health‐Related Quality of Life (HRQoL) looks at quality of life in relation to health |
| QoLIAD | Quality of Life Index for Atopic Dermatitis (QoLIAD). An assessment tool to evaluate the impact of eczema and its treatment on quality of life (Whalley 2004) |
| Remission | A temporary or permanent decrease or absence of the symptoms and signs of disease activity |
| Sensitisation | Exposure to an allergen that results in the development of hypersensitivity, i.e. an increased or disproportionate response to the allergen |
| SCORAD‐index | An assessment tool used by clinicians to evaluate the extent and severity of eczema (SCORing Atopic Dermatitis) (European Task Force on Atopic Dermatitis 1993) |
| Staphyloccocus aureus | A type of bacterium that is often found on the skin |
| Subjective | Something experienced by the participant not perceived by the investigator or physician |
| TEWL | Trans‐epidermal water loss (TWL or TEWL) is the quantity of water that diffuses through and evaporates from the epidermis |
| Topical corticosteroid | Corticosteroids applied to the skin; these are effective in controlling inflammation and used to treat eczema and many other skin conditions |
| Urea | Urea absorbs water, helps to reduce the amount of water lost though the skin and increases skin penetration of other substances. It softens the horny layer and also has anti‐itch (anti‐pruritic) properties. |
| Vehicle | In this review 'vehicle' means a moisturiser that has the same composition as the studied moisturiser, but lacks the ingredient that is considered to be the most beneficial |
| Volar | The inside surface of the forearm, i.e. the same side as the palm of the hand |
| Xerosis | Dry skin |
Description of the condition
Definition
Atopic eczema, which is also known as atopic dermatitis, eczema, flexural eczema or neurodermatitis, is a chronic inflammatory skin disease that can present with frequent spontaneous flares and remissions (Bos 2010; Eichenfield 2014a; Weidinger 2016). It is a heterogeneous, highly variable skin disease with a broad range of presentations, and is characterised principally by dry skin, intense itching, and inflammatory skin lesions (Andersen 2015; Bieber 2008; Weidinger 2016). Atopic eczema has a typical age‐related distribution (Möhrenschlager 2006), and in all of the age categories, itching can result in sleep deprivation and have a considerable impact on quality of life (Bieber 2008; Weidinger 2016).
There is long‐standing and continuing debate as to whether atopic eczema is truly atopic (Flohr 2004; Flohr 2008; Williams 2005; Williams 2006). Atopy is associated with an increased level of immunoglobulin E (IgE) antibodies against common inhaled allergens (sensitisation) (Flohr 2004), but there does not seem to be an absolute relationship between IgE levels and atopic dermatitis, as the percentage of people with atopic dermatitis that show allergic sensitisation to aeroallergens varies widely from 30% to 80% (Eichenfield 2014a; Flohr 2004; Flohr 2008). The development of atopic eczema followed by the development of allergic sensitisation, asthma or food allergy is often called the 'atopic march' (Boguniewicz 2011; Eichenfield 2014a), but this is not a universal occurrence (Eichenfield 2014a; Williams 2006), and it has been postulated that the sequence might even be reversed (such as the onset of asthma before the onset of eczema) (Dharmage 2014). We will use the term 'eczema' throughout the review in agreement with the 'Revised nomenclature for allergy for global use' (Johansson 2004).
Epidemiology
A number of recent studies have reported that the lifetime prevalence of eczema at the global level continues to show a steady but measurable increase (Flohr 2014; Nutten 2015; Weidinger 2016). These findings largely concur with an earlier systematic review of epidemiological studies, covering the period 1990 to 2010, which concluded that although there was "no consistent overall global trend", prevalence has increased in some parts of the world (Deckers 2012; Haileamlak 2005). In an investigation into whether childhood eczema prevalence was on the increase worldwide, researchers evaluated data from Phases One (1991 to 2002) and Three (1999 to 2004) of the International Study of Asthma and Allergies in Childhood (ISAAC), and reported that "the epidemic of eczema seems to be levelling or decreasing in some countries with previously high prevalence rates" (Odhiambo 2009; Williams 2008). It is generally recognised that the limitations and reliability of most of these epidemiological data are in part dependent on the complexities associated with assessing global trends over time, as well as on the diversity of outcome and diagnostic measures used to gather the data (Flohr 2009).
Prevalence rates vary between and within countries and are reported to range between 15% and 30% in children, and between 2% and 10% in adults (Bieber 2008; Mack Correa 2012; Silverberg 2013). Most of these data have been derived from questionnaires; however, the validity and reliability of using questionnaires to obtain prevalence data for eczema in non‐English speaking and low‐ and middle‐income countries has recently been questioned (Flohr 2009; Hogewoning 2012).
The first manifestations of eczema usually occur in early infancy, with approximately 60% of cases developing during the first year of life (Bieber 2008; Eichenfield 2014a; Nutten 2015; Weidinger 2016), and with up to 90% of individuals experiencing an onset of eczema before the age of five (Bieber 2008; Eichenfield 2014a; Nutten 2015). However, eczema can also develop in adult life (late‐onset eczema) (Bieber 2008; Eichenfield 2014a). Several studies have reported that up to 70% of affected children have either a resolution or a marked improvement of their eczema before adolescence (Bieber 2008; Eichenfield 2014a; Weidinger 2016). The recent PEER study (Pediatric Eczema Elective Registry), which consisted mainly of children with mild to moderate eczema, also indicated that eczema probably does not resolve fully in the majority of children who have it to a mild or moderate degree, but is most likely a lifelong disease (Margolis 2014).
Eczema constitutes a major public health issue, and was ranked as the skin condition with the highest burden of disease expressed as disability‐adjusted life years (DALYs) in the Global Burden of Disease Study 2010 (Murray 2012). Furthermore, it has been estimated that the overall economic costs associated with eczema are not dissimilar to those for asthma (Jenner 2004; Nutten 2015; Williams 2005).
Symptoms
The cardinal features of eczema are dry skin and intense itch accompanied by persistent subsequent scratching, which become part of a continuous itch‐scratch cycle (Bieber 2008; Eichenfield 2014a). In addition, the presence of red, irritated, scaly patches on the skin that sometimes become infected, coupled with sleep disturbances and difficulties concentrating at school and at work, can have a significant impact on the quality of life of affected individuals (Lewis‐Jones 2006; Nutten 2015).
Risk factors and aetiology
Although the precise aetiology is yet to be determined conclusively, a number of potential risk factors and possible causative associations have been acknowledged for eczema (Bieber 2008; Eichenfield 2014a; Weidinger 2016). Genetic and environmental factors have been implicated and remain a continuing subject of debate, as does the lack of certainty regarding the balance of impact of these risk factors, and whether they should be considered as interdependent, cumulative or sequentially independent (Cork 2009; Flohr 2008; Flohr 2014). Indeed, it remains unclear how the increased prevalence can be explained by genetic factors alone, and whether these increases in prevalence may reflect more recent changes at an environmental level that appear to have a key role in the disease process (Cork 2006).
Genetic risk factors, which have been evaluated in several observational studies, showed a higher concordance rate in monozygotic (identical) twins than dizygotic (fraternal) twins (Bieber 2008; Nutten 2015), and people with a family history of atopic disease are at increased risk of developing eczema (Boguniewicz 2011; Eichenfield 2014a). Discussion of candidate gene association studies and genome‐wide linkage studies, as well as the concepts of innate and adaptive immunity is beyond the scope of this review, but more information can be found in the literature (Bieber 2008; Boguniewicz 2011; Weidinger 2016).
Important genetic risk factors have been identified and are the focus of ongoing research. The most significant of these are loss‐of‐function mutations in the filaggrin gene (FLG), which has the propensity to influence skin barrier function and transepidermal water loss (TEWL) (Flohr 2014; Palmer 2006). When the skin barrier functions normally it prevents water loss through the skin, and also protects against the penetration of irritants, allergens and pathogenic microbes (Elias 2014; Moncrieff 2013). Filaggrin is a key protein in epidermal differentiation, and is therefore crucial for skin barrier integrity (Nutten 2015; Palmer 2006). This protein, which is expressed in the outer layers of the epidermis, has multiple functions, one of which is hydration of the stratum corneum (Elias 2014; Kezic 2008). Filaggrin is degraded into hygroscopic, free amino acids, some of which generate natural moisturising factors (NMF) that maintain epidermal hydration (Kezic 2008; Moncrieff 2013). However, not all people suffering from eczema appear to have FLG mutations, and not all people with FLG mutations have eczema (Eichenfield 2014a; Nutten 2015). Further breakdown of the skin barrier can be caused by proteases ‐ enzymes normally involved in homeostasis and restoration of the skin barrier ‐ in the stratum corneum. Protease levels are increased in people with eczema (by genetic and environmental factors) (Cork 2006; Elias 2014). Proteases released by the bacterium Staphylococcus aureus (S aureus) can also add measurably to the disruption of the skin barrier and enhance microbial invasion (Cork 2009; Elias 2014). While the skin of 5% to 30% of people without eczema is colonised with S aureus, colonisation occurs in 60% to 100% of people with eczema (Petry 2013). In addition, the toxins produced by S aureus can exacerbate skin inflammation, and contribute to disease severity (Bieber 2008; Chung 2008; Elias 2011; Petry 2013).
Recent findings in skin biology suggest that skin barrier defects might be a crucial initiator of disease activity in eczema (Palmer 2006; Simpson 2014). Researchers and eczema experts continue to debate whether impaired barrier function is secondary to the inflammatory response in people with eczema (inside‐outside hypothesis) (Leung 2000), or if xerosis, caused by barrier dysfunction, should be considered to be the driver of disease activity (outside‐inside hypothesis) (Chamlin 2002; Cork 2006; Elias 2011; Elias 2014). The stratum corneum is central to the normal functioning of the skin barrier. In people with eczema, both lesional skin and non‐lesional skin demonstrate a reduced barrier function (Janssens 2012; van Smeden 2014b). Skin barrier function is largely dependent on the intercellular lipid matrix in the stratum corneum, which is composed of corneocytes (dead, flattened cells containing NMF), which are protected externally by a cornified cell envelope and are surrounded by a lipid matrix in what has been described as a 'bricks and mortar' structure (Caussin 2008; Rawlings 2014; van Smeden 2014b). The 'bricks' are held together by corneodesmosomes and the intercellular matrix (lipid bilayers) (Rawlings 2014; van Smeden 2014b, respectively). This lipid matrix consists of free fatty acids, ceramides and cholesterol. Studies have demonstrated that in eczema the amount, concentration, and chain length of ceramide and free fatty acids ‐ as well as the organisation of the lipids within the matrix ‐ are altered; and the amount of lipids is reduced in both lesional and non‐lesional skin (Elias 2014; Janssens 2012; van Smeden 2014a; van Smeden 2014b). In healthy skin, three components regulate hydration by inhibiting water loss: the intercellular lipid matrix, the fully matured corneocytes bound by the corneodesmosomes, and the NMF within the corneocytes (Rawlings 2005; Rawlings 2014). Skin barrier disruption in people with eczema makes the skin more susceptible to the penetration of allergens, irritants and microbes (Boguniewicz 2011; Flohr 2014; van Smeden 2014a). Furthermore, TEWL is increased when skin barrier function is impaired, and people with eczema demonstrate elevated TEWL in both lesional and non‐lesional skin (Janssens 2012; van Smeden 2014b).
Environmental factors such as aeroallergens, microbial exposure, diet, climate, antibiotics, smoking, pollution, skin irritants, hard water, improved hygiene, and number of siblings have also been implicated in the development of eczema (Eichenfield 2014a; Hogewoning 2010; Flohr 2014; Lee 2007; Mack Correa 2012).
Clinical findings and diagnosis
Three age‐related clinical phases can be observed for eczema (Bieber 2008; Möhrenschlager 2006; Weidinger 2016). The infantile phase is characterised by the appearance of lesions on the cheeks and scalp, but the whole body may be affected (Bieber 2008; Weidinger 2016). In childhood, the flexural areas of the knee and elbows are generally affected, but the wrists, ankles and buttocks can also be involved (Bieber 2008; Weidinger 2016). In adolescents and adults, the neck and face are most commonly affected, with a more diffuse scaling, erythema, and lichenification (Bieber 2008; Weidinger 2016). In people with a dark skin type (i.e. Asians, Carribeans or Africans) there is a predilection more often for the extensor surfaces to be affected instead of the flexor surfaces and "discoid (circular) or follicular (around hair follicles) patterns may be more common" (NICE 2007). Also, the severity of erythema might be more difficult to assess in darker skin types.
In the acute stage, eczema is characterised clinically by itching, diffuse redness, oozing papulovesicular lesions and crusts, and is often accompanied by secondary infection with S aureus (Mack Correa 2012; Weidinger 2016; Williams 2005). The chronic stage is typified by lichenification, excoriations and very dry skin with a more specific involvement of the elbow and knee folds, wrists, ankles, face and neck (Möhrenschlager 2006; Williams 1994).
Physical examination continues to be the best way to diagnose eczema because diagnosis is based on an array of clinical findings, and there is no single pathognomonic biomarker that can be used to make the diagnosis (Andersen 2015; Eichenfield 2014a; Weidinger 2016; Williams 2005). The most frequently used clinical criteria for the diagnosis of eczema are those developed by Hanifin and Rajka in 1980 (Hanifin 1980). These criteria are based on clinical experience and were developed via a consensus approach. The UK Diagnostic Criteria for Atopic Dermatitis Working Party has refined the criteria of Hanifin and Rajka further by developing a core set of six diagnostic criteria, which are especially suitable for use in epidemiological and clinical studies (Eichenfield 2014a; Williams 1994; Williams 1996).
Description of the intervention
Management strategies for eczema include both active treatments that address the inflammatory lesions and adjunctive therapies to optimise skin barrier function and prevent flare‐ups (Eichenfield 2014a; Eichenfield 2014b; Ring 2012a). Further recommended measures include advice on: bathing practices; avoidance of triggers such as irritants (e.g. wool, soap), allergens (such as aeroallergens, food allergens, contact allergens), environmental factors (e.g. humidity), and non‐irritating clothing; together with education about eczema, its treatments and how to apply these (Eichenfield 2014b; Ring 2012a; Sidbury 2014a; Weidinger 2016).
Topical corticosteroids are still the cornerstone of anti‐inflammatory therapy in the management of eczema (Eichenfield 2014b; Ring 2012a). However, under‐use of topical corticosteroids ‐ out of a fear of skin thinning or possible growth retardation ‐ are well‐known problems (Charman 2000). Other frequently used topical anti‐inflammatory treatments include coal tar applications and topical calcineurin inhibitors (non‐steroidal immune modulators) such as tacrolimus and pimecrolimus (Eichenfield 2014b; Ring 2012a). The beneficial effects of sunlight for eczema are well recognised, and so phototherapy or photo(chemo)therapy are periodically used as an alternate form of treatment (Ring 2012b; Sidbury 2014b). Systemic immunosuppressive treatments such as ciclosporin, mycophenolate mofetil, methotrexate, azathioprine, and systemic steroids (used in the short term for severe flares) are mainly indicated in people with moderate to severe eczema that does not respond sufficiently well to topical treatments and phototherapy (Haeck 2011; Ring 2012b; Sidbury 2014b). Antimicrobials can be used to treat infected eczema, but preferably only in the short term, as this treatment may foster the development of antibiotic resistance, and thus far, there is no reliable evidence of a beneficial effect when it is used in non‐infected eczema (Bath‐Hextall 2010; Eichenfield 2014b). Although antihistamines are widely prescribed for people with eczema, there is a lack of evidence that they reduce itching (van Zuuren 2014). However, sedative antihistamines may prove useful for improving sleep (Sidbury 2014b).
Some other interventions for eczema have been covered by other Cochrane Reviews (Apfelbacher 2013; Ashcroft 2007; Bamford 2013; Bath‐Hextall 2008; Bath‐Hextall 2010; Bath‐Hextall 2012; Birnie 2002; Boyle 2006; Cury Martins 2015; Ersser 2014; Gu 2013; Nankervis 2015), while some topics are under development and currently published as protocols (Calderon 2010; Futamura 2014; Jadotte 2014; Küster 2015; Moed 2012).
Emollients and moisturisers
The terms 'emollient' and 'moisturiser' are used interchangeably and lack consistency in their use in the literature (Penzer 2012). However, in essence an emollient is an ingredient of a moisturiser (Rawlings 2004). Therefore, it would be more appropriate to use the term 'moisturiser', and this will be used throughout this review.
As dry skin (xerosis) is the most important disease feature for eczema, skin moisturisation may constitute an integral part of standard treatment for all severities of eczema (Bieber 2008; Eichenfield 2014b). Moisturising the skin might be sufficient to control mild eczema, but could also form part of the treatment regimen for more severe eczema, and may have a role in the possible prevention of eczema flare‐ups (Eichenfield 2014b; Moncrieff 2013; Sidbury 2014a; Weber 2015).
The functions of moisturisers are to reduce the dryness of skin, decrease TEWL, improve comfort and reduce itch (Lodén 2012; Rawlings 2004). Moisturising components can be hydrophilic or lipophilic (Caussin 2008; Caussin 2009a). Hydrophilic components are predominantly important for skin hydration (Caussin 2008), whilst lipophilic components are designed to remain on the surface of the skin as an occlusive (waterproofing) layer that prevents evaporation of water and assists barrier recovery (Caussin 2008). Moisturisers can include humectants (e.g. urea, glycerol, lactic acid) which help increase the attraction and retention of water by the stratum corneum; occlusives (e.g. petrolatum, mineral oil, dimethicone) that form a layer on the skin surface and prevent TEWL; and emollients (lanolin, glycerol stearate, glyceryl stearate, soy sterols) to soften the skin and make it smoother (Eichenfield 2014b; Lodén 2003; Lodén 2012; Rawlings 2004). Recently, the notional term 'prescription emollient devices' (PED) was introduced; this is a class of topical agents developed to "target specific defects in skin barrier function" in people with eczema (Eichenfield 2014b). These PEDs contain various mixtures and ratios of lipids, ceramides, fatty acids, and natural anti‐inflammatory agents such as glycyrrhetinic acid, as well as other ingredients to alleviate itching and inflammation (Mack Correa 2012).
Studies to evaluate the use of moisturisers in primary prevention of eczema in high risk (atopic) families have been conducted, and are ongoing, but these are beyond the scope of our review (e.g. Kvenshagen 2014; Simpson 2010; Simpson 2014).
There are a number of different formulations of moisturisers, such as oil‐in‐water creams, water‐in‐oil creams, ointments, lotions, oils, gels, sprays and emulsions, and the choice of formulation used will depend on the severity of the skin condition and the patient's preferences (Eichenfield 2014b; Lodén 2003). Furthermore, moisturisers can be categorised as leave‐on (directly applied) moisturisers, soap substitutes and bath moisturisers. In this review we will focus on the leave‐on moisturisers.
Usually moisturisers need to be applied two to three times a day (Eichenfield 2014b), in amounts of up to "150‐200 g per week in young children and up to 500g in adults" (Ring 2012a). It is preferable to apply moisturisers after bathing (Eichenfield 2014b). The repetitive application of topical treatments is time consuming, and the use of adequate amounts of moisturiser is often restricted due to cost, especially since there is no reimbursement in most countries (Nutten 2015; Ring 2012a; Williams 2005). Possible side effects include irritation and contact allergy for certain ingredients (Eichenfield 2014b; Lodén 2003; Lodén 2012; Ring 2012a). The ideal moisturiser should be pleasant to use, restore the skin barrier and soften skin effectively, avoid additives that can irritate or sensitise ‐ such as fragrance and perfume ‐ and contain just a few ingredients (Eichenfield 2014b; Weidinger 2016).
How the intervention might work
Since Palmer 2006, a growing understanding that gene‐expressed skin barrier impairment may play a key role in the pathogenesis of eczema has reinforced the importance of developing specific treatments with the capacity to either restore barrier function or to ameliorate further damage, or both (Boguniewicz 2011; Elias 2014; Moncrieff 2013).
Moisturisers are directed towards improving the skin barrier function by delivering lipids and water to the stratum corneum (Lodén 2003; Moncrieff 2013; Simpson 2010). Restoring barrier function might also improve antimicrobial defence in the skin of people with eczema, and so have a beneficial effect on disease activity (Elias 2014). Moisturisers containing hydrophilic components mostly include low‐molecular‐weight hygroscopic substances such as glycerol and urea. It is assumed that, because of their low molecular weight, these substances penetrate the stratum corneum, where they subsequently act as humectants (Sagiv 2003), mimicking the role of NMF (Caussin 2008). Moisturisers containing more lipophilic components include compounds that are water insoluble, such as fatty acids, waxes, and triglycerides (Caussin 2009a). These are unlikely to penetrate the skin due to their high molecular weight (Caussin 2009a), so serve as occlusive agents that prevent TEWL. However, if they penetrate into the stratum corneum, they may restore barrier function by interacting with the lipid matrix (Caussin 2009b; Ghadially 1992). Although adjuvant constituents such as ceramides, cholesterol and fatty acids may be included in moisturisers, it is unclear if these actually improve the efficacy of the moisturisers (Moncrieff 2013).
Why it is important to do this review
Severe eczema remains difficult to treat and some of the treatments offered can be problematic and associated with adverse side effects (Eichenfield 2014b; Ring 2012a; Ring 2012b; Sidbury 2014b). Moisturisers are widely prescribed as the basis of eczema management, as they are relatively inexpensive, have a favourable safety profile, and can improve the appearance and symptoms of the dry skin (xerosis) (Eichenfield 2014b; Moncrieff 2013; NICE 2007; Ring 2012a; SIGN 2011). However, their application is time consuming ‐ possibly a life‐long requirement ‐ and moisturisers can be smelly, messy and stick to clothing (Eichenfield 2014b). Some preparations are known to cause skin reactions such as stinging and burning, which can result in poor adherence, while others may contain sensitising ingredients, which can lead to contact dermatitis (Eichenfield 2014b; Lodén 2003; Lodén 2012; Ring 2012a). The use of moisturisers still fails to meet the expectations of people with eczema (Rawlings 2014; Santer 2013; Santer 2016).
A perceived advantage of moisturiser use is that it may restrict the need to use topical corticosteroids to more severe eczema only, or during exacerbations and flare‐ups, while at the same time improving disease control (Harcharik 2014; Lucky 1997; Moncrieff 2013; Msika 2008; Weber 2015). Moisturisers may also reduce the number of flares (Moncrieff 2013; Sidbury 2014a), which we hope to confirm with this review. At present it is not clear which, if any, moisturiser is effective at particular body sites, and whether one moisturiser is preferable to another according to people with eczema.
The plans for this review were published as a protocol with the title 'Emollients and moisturisers for eczema' (van Zuuren 2016).
Objectives
To assess the effects of moisturisers for eczema.
Methods
Criteria for considering studies for this review
Types of studies
We have only included randomised controlled trials (RCTs).
Types of participants
People of any age with a clinical diagnosis of eczema (or 'atopic eczema' or 'atopic dermatitis') as diagnosed by a dermatologist, physician or other specialist healthcare practitioner using the standardised diagnostic criteria of Hanifin and Rajka (Hanifin 1980), the UK Working Party's diagnostic criteria for atopic dermatitis (Williams 1994), or other recognised diagnostic criteria.
We excluded trials where the participants suffered from other types of eczema such as contact dermatitis, nummular eczema or dyshidrotic eczema.
Types of interventions
All types of moisturisers alone or in combination versus:
-
active treatment e.g. topical corticosteroids;
-
another moisturiser;
-
'placebo' moisturiser (moisturiser, but with a different composition and without the assumed effective ingredient);
-
vehicle (has same composition as the moisturiser it is compared with, but without the assumed effective ingredient);
-
combination of moisturiser and active treatment;
-
or no treatment.
Types of outcome measures
Acronyms are included in the glossary of terms in Table 1. We have searched the website of Core Outcome Measures in Effectiveness Trials (COMET) (www.comet-initiative.org) to help us define some of the outcomes. A full set of core outcome measures has not yet been defined, although the Eczema Area and Severity Index (EASI), the objective SCORing Atopic Dermatitis (SCORAD) scale, and the Patient Oriented Eczema Measure (POEM) are the scales recommended for use in studies (Schmitt 2007; Schmitt 2014).
Primary outcomes
-
Change in disease severity from baseline as assessed by study participants using a recognised or validated rating scale (e.g. POEM and Patient Oriented SCORAD (PO‐SCORAD)), visual analogue scale (VAS) score, Likert scale, or similar scale. If data were available we evaluated change in scores for itch separately.
-
Participant satisfaction using any generic Likert scale or similar scale.
-
Adverse events (proportion of participants reporting an adverse event); we reviewed the nature of adverse events (e.g. itching, stinging, sensitisation) and reported them narratively.
Secondary outcomes
-
Change in disease severity from baseline as assessed by investigators using a recognised or validated rating scale (e.g. SCORAD and EASI), VAS score, Likert scale, or similar scale.
-
Prevention of flares (measured as time to first flare).
-
Change in use of topical active treatment (e.g. corticosteroids or topical immune modulators, tar).
-
Changes in skin barrier function as assessed by TEWL.
-
Change in health‐related quality of life (HRQoL) using a recognised or validated rating scale (e.g. the Dermatology Life Quality Index (DLQI), Children’s DLQI, and the Quality of Life Index for Atopic Dermatitis (QoLIAD)).
Timing of outcomes
We considered measurements taken for up to one week to be short‐term; between one and four weeks to be medium‐term; and after four weeks to be long‐term. We reported end of study data, and there were no other data that could be cohesively grouped into other specific time periods.
Outcomes for 'Summary of findings' tables
We produced 'Summary of findings' tables for the main comparisons that included the following outcomes (listed according to priority):
-
participant‐assessed change in disease severity from baseline;
-
participant satisfaction;
-
adverse events;
-
investigator‐assessed change in disease severity from baseline;
-
prevention of flares;
-
change in use of topical active treatment;
-
change in HRQoL.
We produced these tables using the GRADEpro GDT program.
Search methods for identification of studies
We aimed to identify all relevant randomised controlled trials (RCTs) regardless of language or publication status (published, unpublished, in press, or in progress).
Electronic searches
We searched the following databases up to 17 December 2015:
-
the Cochrane Skin Specialised Register using the search strategy in Appendix 1;
-
the Cochrane Central Register of Controlled Trials (CENTRAL; 2015, Issue 11, in the Cochrane Library) using the strategy in Appendix 2;
-
MEDLINE via Ovid (from 1946) using the strategy in Appendix 3;
-
Embase via Ovid (from 1974) using the strategy in Appendix 4; and
-
LILACS (Latin American and Caribbean Health Science Information database, from 1982) using the strategy in Appendix 5.
We searched the Global Resource of EczemA Trials (GREAT database) on 21 December 2015 using the strategy in Appendix 6. GREAT is produced by the Centre of Evidence Based Dermatology, and accessed at: www.greatdatabase.org.uk.
Trials registers
Two review authors (EvZ and ZF) searched the following trials registers on 16 February 2016 using the following search terms: 'eczema', 'emollient', 'ointment', 'cream', 'moisturizer' and 'moisturiser':
-
the ISRCTN registry (www.isrctn.com/);
-
ClinicalTrials.gov (www.clinicaltrials.gov);
-
the Australian New Zealand Clinical Trials Registry (www.anzctr.org.au);
-
the World Health Organization International Clinical Trials Registry Platform (apps.who.int/trialsearch/); and
-
the EU Clinical Trials Register (www.clinicaltrialsregister.eu).
Searching other resources
References from published studies
Two review authors (EvZ and ZF) examined the bibliographies of the included and excluded studies for further references to potentially eligible studies.
Adverse effects
We did not perform a separate search for adverse effects of the target intervention. However, we examined and reported the data on adverse effects from the included studies.
Correspondence
Trial investigators were contacted (by EvZ and ZF) and asked to provide missing data or clarify study details (see Table 2).
| Study ID | Response | Additional | Comment |
|---|---|---|---|
| Emails sent: 26 June 2014, 7 February 2016, 12 February 2016, 26 February 2016, 12 March 2016, 19 March 2016, to [email protected] Regarding allocation concealment and method of blinding Replies received: 24 March 2016 with responses; 29 March 2016 with additional information | Yes | ‐ | |
| Emails sent: 13 February 2016, 26 February 2016, to irena.angelova‐fischer@uk‐sh.de Regarding sequence generation and allocation concealment Reply received: 1 March 2016 with response to sequence generation Several emails sent regarding allocation concealment, but this remains unclear | Yes | ‐ | |
| [email protected] no need to contact, but this is recent email for future update of the review | Not applicable | ‐ | |
| Email sent: 13 February 2016, to [email protected] Regarding sequence generation and allocation concealment Email received: 15 February 2016 with responses | Yes | ‐ | |
| Emails sent: 13 February 2016, 26 February 2016, to [email protected] Regarding method of blinding Email received: 27 February 2016 with responses | Yes | ‐ | |
| Emails sent: 12 May 2014, 14 June 2014, 21 January 2016, to [email protected] and [email protected] Regarding sequence generation, allocation concealment and method of blinding Replies received: 2 February 2015 and 15 February 2016; received all responses and additional material | Yes | ‐ | |
| Emails sent: 14 February 2016, 26 February 2016, 12 March 2016, 19 March 2016, to [email protected]. Also did not reply to questions about the Abramovits 2008 study Regarding allocation concealment and method of blinding, EASI scores at day 43 and subjects/care givers assessment of global response at day 43 in vehicle group No reply received | Not applicable | ‐ | |
| Emails sent: 15 February 2016, 26 February 2016, 12 March 2016, 26 March 2016, to franck.boralevi@chu‐bordeaux.fr Regarding P‐VAS scores, SCORAD, Objective SCORAD, and HI at day 28 as well as SDs Replies received: 31 March 2016 and 5 April 2016 responses and additional information | Yes | ‐ | |
| Emails sent: May 2014, 15 February 2016, to elsner@derma‐jena.de and [email protected] Regarding sequence generation, allocation concealment and method of blinding, mean SCORAD, TEWL, capacitance and SDs Replies received: 16 May 2014 and 15 February 2016, received responses and additional information | Yes | ‐ | |
| Emails sent: 15 February 2016, 26 February 2016, 15 March 2016, 19 March 2016, to [email protected] Regarding sequence generation, allocation concealment, method of blinding, TEWL values and SDs after 2 weeks, number of dropouts, numbers of male/female and age of participants Reply received: 22 March 2016 with responses to our questions | Yes | ‐ | |
| Email sent: 16 February 2016 to [email protected] and clarence.de‐[email protected] Regarding allocation concealment and method of blinding Replies received: 24 February 2016 and 12 March 2016 from [email protected] and [email protected], with responses to our questions | Yes | ‐ | |
| Emails sent: 16 February 2016, 12 March 2016, 19 March 2016, 26 March 2016, to [email protected] Regarding allocation concealment and method of blinding No reply received | Not applicable | ‐ | |
| Emails sent: 19 February 2016, 12 March 2016, 19 March 2016, 26 March 2016, to [email protected] Regarding allocation concealment and method of blinding, more precise baseline data and data at end of study means and SDs No reply received | Not applicable | ‐ | |
| Emails sent: 19 February 2016, 12 March 2016, 19 March 2016, 26 March 2016, to [email protected] Regarding sequence generation, allocation concealment, method of blinding, precise baseline data and data at end of study, means and SDs, Participant assessments of target site skin appearance for redness, peeling, dryness, stinging/burning, and overall skin irritation, sponsoring and declaration of interest No reply received | Not applicable | ‐ | |
| Emails sent: 5 March 2016, 12 March 2016, 19 March 2016, 26 March 2016 to Jason Emer (email not current anymore), with last 2 emails to A Frankel ([email protected]) Regarding sequence generation, allocation concealment, method of blinding, colour version of pdf and SDs at week 4 No reply received | Not applicable | ‐ | |
| Emails sent: 7 March 2016, 12 March 2016, to [email protected] Regarding sequence generation, allocation concealment, method of blinding, more precise data Reply received: 12 March 2015 "it is so long time ago that I performed this study so I do not remember. I retired last November 2015 and I do not have assess to any data now." | No | ‐ | |
| Email sent 9 March 2016 to [email protected] Regarding sequence generation, allocation concealment, method of blinding and incomplete data Reply received: 14 March 2014 with responses to our questions | Yes | ‐ | |
| Email sent: 13 May 2014 to giordano.labadie.f@chu‐toulouse.fr, frederic.cambazard@chu‐st‐etienne.fr, gerard.guillet@chu‐poitiers.fr, [email protected], and valerie.mengeaud@pierre‐fabre.com Regarding sequence generation and allocation concealment Reply received: 26 May 2014 with responses to our questions | Yes | ‐ | |
| Emails sent:14 March 2016, 19 March 2016, 26 March 2016, 3 April 2016, to [email protected] Regarding allocation concealment, method of blinding and inconsistencies in text page 64 and table 1 No reply received | Not applicable | ‐ | |
| Email sent: 13 April 2014, to [email protected], frederic.cambazard@chu‐st‐etienne.fr, valerie.mengeaud@pierre‐fabre.com Regarding sequence generation and allocation concealment Reply received: 24 June 2015, after several emails we received responses to everything we asked for | Yes | ‐ | |
| Email sent: 17 April 2016, to [email protected] (no longer correct, no more recent email, so sent again to [email protected], but this is also no longer correct) Regarding sequence generation, allocation concealment and baseline data for TEWL and corneometry No recent email addresses could be found | Not applicable | ‐ | |
| We could not find a current email address of any of the authors listed | Not applicable | ‐ | |
| Emails sent: 18 March 2016, 26 March 2016, 3‐4 February 2016,10 April 2016, to [email protected] Regarding sequence generation and allocation concealment, frequency of use, precise data after 3 months (means and SDs), more data on adverse events No reply received | Not applicable | ‐ | |
| Emails sent: 19 March 2016, 26 March 2016, 3 April 2016, to [email protected] Regarding allocation concealment, method of blinding, exact data for POEM and quality of life at baseline, and SCORAD, POEM and quality of life at day 28 | Not applicable | ‐ | |
| Emails sent: 8 January 2016, 24 January 2016, 12 February 2016, 8 April 2016, 18 April 2016, to [email protected] Regarding sequence generation and allocation concealment No reply received | Not applicable | ‐ | |
| Email sent: 19 March 2015, to [email protected] Regarding full text publication Reply received: 21 March 2015, Principal investigator could not remember anymore | No | ‐ | |
| Email sent: 19 March 2015, to [email protected] Regarding sequence generation, allocation concealment, method of blinding, exact TEWL values and corneometry with SDs at week 4 Reply received: 21 March 2016 with responses to some of our questions, the rest was no longer accessible | Yes and No | We did not receive exact data | |
| Email sent: 20 March 2016, to [email protected]‐muenchen.de Regarding allocation concealment and blinding Email address is no longer correct, and further searches showed that he died in 2012. None of the other authors could be contacted | Not applicable | ‐ | |
| Emails sent: 20 March 2016, 26 March 2016, to a‐[email protected], [email protected] [email protected] Regarding sequence generation, allocation concealment, method of blinding and precise study data Reply received: 26 March 2016 with responses to our questions | Yes | ‐ | |
| Emails sent: 15 April 2016, 19 April 2016, 23 April 2016, 30 April 2016, to [email protected] Regarding allocation concealment and blinding Reply received: 2 May 2016 with responses to our questions | Yes | ‐ | |
| Email sent: 14 May 2014, to [email protected]. Latest email address is [email protected] (since October 2015) Regarding sequence generation and allocation concealment Reply received: 14 May 2014 with responses to our questions | Yes | ‐ | |
| Email sent: 15 May 2014, to [email protected], clarence.de‐[email protected], [email protected] Regarding sequence generation, stratifying, allocation concealment, means and SDs for some outcomes and clarification about data losses for the following outcomes in particular IDQOL, DFI, IGE Reply received: 30 June 2014 with additional information | Yes | ‐ | |
| Email sent: 30 June 2014, to [email protected] and [email protected] Regarding clarification of correct citation i.e. author string/journal page numbers to the 2 citations listed in Included studies, plus sequence generation, allocation concealment and method of blinding Reply received: 30 June 2014 and 5 July 2014, with responses to our questions | Yes | ‐ | |
| Emails sent: 2 January 2016, 5 January 2016, 15 January 2016, 20 January 2016, to [email protected], [email protected], [email protected] Regarding missing data of control, and clarification regarding study design, and data regarding EASI, IGA Repy received: 20 January 2016 from Dr Nebus with responses to our questions and additional documents | Yes | ‐ | |
| Email sent: 7 January 2016, to [email protected] Regarding sequence generation and allocation concealment Reply received: 18 January 2016, from [email protected], with responses to our questions | Yes | ‐ | |
| Email sent: 26 March 2016, to [email protected] Regarding sequence generation, allocation concealment, method of blinding, dropouts, EASI, VAS scores at baseline and day 21 and additional study details Replies received: 26 March 2016, and 30 March 2016 with responses to our questions | Yes | ‐ | |
| Emails sent: 26 March 2016, 3 April 2016, 10 April 2016, 16 April 2016, to Dr Seo: [email protected] Regarding sequence generation, allocation concealment, method of blinding and precise data of IGA, VAS, TEWL and corneometry with SD at 4 weeks No reply received | Not applicable | ‐ | |
| Emails sent: 27 March 2016, 3 April 2016, 10 April 2016, to [email protected] Regarding sequence generation, allocation concealment, method of blinding and precise data of EASI at day 43, and data of appraisal patients Reply received: 12 April 2016, with responses regarding sequence generation, allocation concealment and blinding, but not the rest. 14 April 2016 we sent mails to the sponsor at [email protected] (no longer working) and [email protected] No further details retrieved | In part | ‐ | |
| Email sent 27 March 2016, 3 April 2016 jennifer.theunis@pierre‐fabre.com. Regarding sequence generation, allocation concealment, and precise data of TEWL at day 43, and to which group drop‐out was randomised Response 7 April 2016 we received responses to our questions | Yes | ‐ | |
| Email sent 28 March 2016, 3 April 2016, 10 April 2016, 16 April 2016 [email protected] Regarding allocation concealment, precise data at baseline,day 10 and 28 for TEWL, PGA, EASI, adverse events in Cis UCA group and in vehicle No reply received | Not applicable | ‐ | |
| Email sent: 29 March 2016, to [email protected]‐bonn.de Regarding sequence generation, allocation concealment, method of blinding as one group had two different tubes, precise data at baseline and week 16 for VAS, EASI, DLQI and CDLQI Reply received: 30 March 2016, saying that cannot help us, the study was too long ago, and Schering Dermatology does not exist anymore. Intendis (the pharmaceutical company) did not reply | No | ‐ | |
| Email sent: 2 April 2016, to [email protected], [email protected] Regarding sequence generation, allocation concealment, differences between publication and protocol and exact baseline values for data after 15, 30 and 60 minutes for TEWL, and corneometry Reply received: 12 April 2016, with responses to our questions | Yes | ‐ | |
| Email sent: 18 May 2014, to [email protected], SOTIRIOS‐[email protected] Regarding sequence generation and allocation concealment, mean reduction in EASI and corresponding standard deviations at day 28, and dropouts Reply received: 18 July 2014, with responses to our questions | Yes | ‐ | |
| Emails sent: 2 April 2016, 10 April 2016, 16 April 2016, 23 April 2016, to [email protected], [email protected], [email protected] Regarding exact baseline values (and SD) at day 28 for dryness scale, TEWL, and corneometry Reply received: 2 May 2016, with responses to our questions and additional information | Yes | ‐ | |
| Email sent: 3 April 2016, to [email protected] Regarding sequence generation, allocation concealment, method of blinding, precise data at baseline and day 28 for IGA and patient/family self‐assessments Reply received: 4 April 2016, with responses to our questions and additional information | Yes | ‐ | |
| Email sent: 14 May 2014, to [email protected], Adam Reich Regarding sequence generation and allocation concealment | Yes | Quasi randomised, exclude | |
| Emails sent: 3 April 2016, 10 April 2016, 16 April 2016, 23 April 2016, 30 April 2016, to [email protected]‐u.ac.jp Regarding sequence generation and allocation concealment, and SCORAD (mean and SD) at start maintenance phase and at day 28 No reply received | Not applicable | ‐ | |
| Emails sent: 3 April 2016, 10 April 2016, to [email protected] Regarding allocation concealment Reply received: 11 April 2016, with response to our question | Yes | ‐ | |
| Email sent: 8 April 2016, to [email protected] Regarding allocation concealment Reply received: 8 April 2016, with response to our question | Yes | ‐ | |
| Emails sent: 2 July 2014, 7 July 2014, 24 January 2016, 12 February 2016, 8 April 2016, 18 April 2016, to [email protected] ([email protected] is no longer in use) Regarding sequence generation, allocation concealment and standard deviations (or SEM) of the SCORAD at baseline, week 2, week 4 and week 6? Reply received: 18 April 2016, with some data but no information regarding sequence generation, or allocation concealment and there were no data for week 6 | In part | ‐ | |
| Email sent: 10 April 2016, to tweberQbdfusa.com Regarding sequence generation and allocation concealment | Yes | ‐ | |
| Email sent: 15 April 2016, to [email protected], karin.wiren@omega‐pharma.se Regarding sequence generation and allocation concealment | Yes | ‐ | |
| Emails sent: 5 January 2016, 15 January 2016, 31 January 2016, 12 February 2016, 10 April 2016, to [email protected] Regarding sequence generation and allocation concealment No reply received | Not applicable | ‐ | |
| Emails sent: 10 April 2016, 16 April 2016, to [email protected] Regarding allocation concealment, method of blinding, SCORAD values at start maintenance phase and follow‐up, item EQ‐5D Reply received: 18 April 2016, with responses to our questions | Yes | ‐ |
Abbreviations
CDLQI: Children’s Dermatology Life Quality Index
DLQI: Dermatology Life Quality Index
EASI: eczema area and severity index
EQ‐5D: a measure of health‐related quality of life that was developed by the EuroQol group that includes the five dimensions of mobility, self‐care, usual activities, pain/discomfort, and anxiety/depression
HI: hydration index
IGA: Investigator Global Assessment
IGE: Immunoglobulin E
POEM: Patient‐Oriented Eczema Measure
P‐VAS: Pruritus visual analogue scale
SCORAD: scoring atopic dermatitis
SD: standard deviation
SEM: standard error of the mean
TEWL: transepidermal water loss
Data collection and analysis
Some parts of the methods section of this review uses text that was originally published in the Cochrane Handbook for Systematic Reviews of Interventions (Higgins 2011). We followed the published protocol for this Cochrane Review (van Zuuren 2016).
Selection of studies
Two authors (EvZ and ZF) independently assessed the titles and abstracts of studies identified from the searches and, if necessary, obtained and reviewed them in full text to evaluate whether they met the inclusion criteria. We resolved disagreement through discussion and, when necessary, by the judgement of a third author (AL). We excluded studies that did not meet our inclusion criteria. We have reported the number of reports retrieved, the number of both included and excluded studies and the reasons for exclusion in a flow diagram (Figure 1), as described in the Preferred Reporting Items for Systematic Reviews and Meta‐Analyses (PRISMA) statement (Liberati 2009).
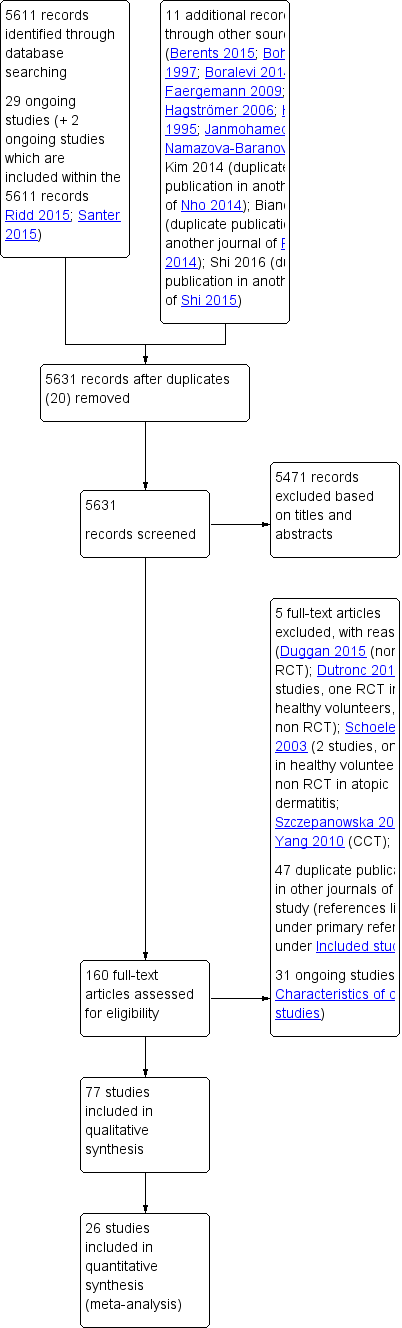
Study flow diagram
Data extraction and management
Two review authors (EvZ and ZF) collected study details and outcome data independently with a piloted data extraction form. Disagreements were resolved through discussion or a third author (RC).
The following details were extracted.
-
Methods: study design, blinding of participants, investigators and outcome assessors, setting, date of study conduct and study duration.
-
Participants: number randomised, gender, inclusion and exclusion criteria, number of dropouts and reasons for losses to follow‐up, baseline data.
-
Interventions: description of treatment arms, dosage or application frequency, duration of intervention.
-
Outcomes: timing of assessments and outcomes as reported by trial authors.
-
Funding source as reported.
-
Declarations of interest.
One review author (EvZ) added these details into the Characteristics of included studies tables in Review Manager (RevMan) 5 (RevMan 2014), and these were checked by another review author (ZF).
Assessment of risk of bias in included studies
Two review authors (EvZ and ZF) independently assessed the risk of bias of each individual included study using the Cochrane tool for assessing risk of bias (Higgins 2011). Inconsistencies were resolved through discussion or by involving a third author (RC). The 'Risk of bias' tool addresses the following domains:
-
method of sequence generation;
-
method of allocation concealment;
-
blinding of investigators and participants;
-
blinding of outcome assessors;
-
presence of incomplete outcome data;
-
presence of selective reporting; and
-
other bias such as, for example, baseline imbalance.
For each study we categorised each domain as being at a low risk of bias, high risk of bias or unclear risk of bias. We determined the overall risk of bias of each study as follows:
-
low risk of bias when all domains were assessed as being at low risk (plausible bias unlikely to seriously alter the results);
-
unclear risk of bias when at least one domain was classified as being at unclear risk (plausible bias that raises some doubt about the results);
-
high risk of bias when at least one domain was judged as being at high risk (plausible bias that seriously weakens confidence in the results).
Measures of treatment effect
Dichotomous data
We calculated risk ratios (RR) with their associated 95% confidence interval (CI) for dichotomous data. When the RR was statistically significant (95% CI did not overlap 1) we computed the number needed to treat for an additional beneficial outcome (NNTB) or number needed to treat for an additional harmful outcome (NNTH) on the basis of the combined RR value, applying the overall event rate in the placebo groups as a proxy for baseline risk.
Continuous data
We calculated mean differences (MD) with their associated 95% CI for continuous data when the eligible trials used the same instrument to measure a given construct. In cases where different measurement instruments were used, we calculated standardised mean differences (SMDs). Clinically, for HRQoL measures, an effect size (SMD) of 0.2 is considered small, 0.5 is considered moderate, and 0.8 or more is considered large (Bliddal 2009).
Time‐to‐event data
We expressed results for time‐to‐event outcome data as hazard ratios (HR). Conducting a meta‐analysis using summary information from published papers can often be problematic. We obtained the estimates of log hazard ratios and the corresponding standard errors from the reports (either from confidence intervals or reported P values) and applied them in meta‐analyses using the generic inverse variance method (Tierney 2007). We estimated the corresponding standard error (from the log‐scale), which enabled us to use the generic inverse variance method in RevMan 5. In future updates, if situations arise where we only have a contrast between groups (e.g. a difference) with an explicit P value, we will estimate the standard error, based on a Wald test (Wald 1943).
Unit of analysis issues
In studies with a parallel‐group design, the unit of analysis was the participant.
Cross‐over studies
We only included the first treatment period of cross‐over trials, due to possible carryover effects.
Studies with multiple treatment groups
We included studies with multiple treatment arms and these have been included as pair‐wise comparisons following the recommendations in Chapter 16, section 16.5.4 of the Cochrane Handbook for Systematic Reviews of Interventions (Higgins 2011).
Within‐participant studies
We included within‐participant studies following the recommendation in Chapter 16, section 16.4.4 in the Cochrane Handbook for Systematic Reviews of Interventions (Higgins 2011). For continuous outcomes reported from within‐participant designs we used the mean of the paired differences (i.e. we handled the unit of analysis as a pair of observations rather than two independent observations). We calculated the summary statistics ‐ outside RevMan 5 – and reported and presented these using the inverse variance property feature. Matched group designs enrol pairs of subjects, and in analysis, use the difference score between 'subject' and 'sibling'. In dermatology this study design is applied when different sides of the body are compared; thus, it is not the 'matching subjects' that are compared but the matching sides of the body. The standard deviation (SD) of the difference is computed by summing the two SDs, and then subtracting a term that includes the correlation (rho) between the two scores on the same individual (Borenstein 2009). For pragmatic reasons we decided a priori to assume that the correlation between 'within‐participant' measures was 0.7 for all studies reporting paired samples.
We had limited analyses for binary outcomes, therefore we only reported proportions or percentages of the body sides without calculating RRs, principally because the data could not be analysed in a way that takes into account the within‐participant nature of the study design.
Dealing with missing data
We contacted trial investigators and sponsors for details of missing data for studies that were less than 10 years old. Whenever possible we used results from the intention‐to‐treat (ITT) population for both continuous and dichotomous data. For dichotomous data, we assumed that the missing participants experienced a poor outcome (imputation on basis of the worst‐case scenario).
For continuous data, we extracted the mean change from baseline and corresponding SD, or, where applicable, the after‐value scores. When necessary, we approximated means and measures of dispersion from figures in the reports.
Assessment of heterogeneity
We assessed both clinical and statistical diversity to determine if data from studies could meaningfully be combined and entered into a meta‐analysis. We assessed clinical heterogeneity by exploring variability in participants, interventions and outcomes. For the meta‐analysis we used standard random‐effects meta‐analysis as the default option (DerSimonian 1986), and applied the fixed‐effect model for the purpose of sensitivity analysis. The random‐effects model assumes that the true treatment effect differs from study to study and provides an estimate of the average treatment effect, rather than assuming all studies are estimating the same (fixed) treatment effect (Riley 2011). We assessed heterogeneity across the studies by using the I² statistic, which describes the percentage of total variation across trials that is due to heterogeneity rather than chance (Higgins 2011). An I² of 50% to 90% may represent considerable heterogeneity and 75% to 100%, represents substantial heterogeneity. We conducted meta‐analyses according to the protocol independently of the observed I². Based on the recommendations of the Grading of Recommendations Assessment, Development and Evaluation working group (GRADE), we considered downgrading the quality of the evidence for serious inconsistency if I² was above 50%, and also took other considerations for downgrading into account. One consequence of using random‐effects models as the default (these models weigh studies more equally than a fixed‐effect analysis) is that in the presence of small‐study effects (in which the intervention effect is more beneficial in the smaller studies) the random‐effects estimate of the intervention effect will appear more beneficial than the fixed‐effect estimate. In order to explore whether there was evidence of small‐study effects, we performed sensitivity analyses to examine how the results of the meta‐analysis changed when we compared the fixed‐effect and random‐effects estimates of the intervention effect. If the estimates were similar, then any small‐study effects had little effect on the estimate of the intervention effect (Chapter 10.4.4.1 Cochrane Handbook for Systematic Reviews of Interventions (Higgins 2011).
Assessment of reporting biases
There was only one outcome for which we had more than 10 studies entered in a meta‐analysis (one secondary outcome in comparison 2f). We generated a funnel plot for this outcome to check for asymmetry (which may suggest publication and small study effect biases) (Higgins 2011), however we did not detect asymmetry in the funnel plot for this specific outcome (disease severity as assessed by the investigators).
Data synthesis
Two review authors (EvZ and ZF) analysed the data in RevMan 5 using a random‐effects model, following the recommendations in Chapter 9 of the Cochrane Handbook for Systematic Reviews of Interventions (Higgins 2011).
Where outcomes of interest were rare, we followed the recommendations of Bradburn 2007 and used Peto odds ratios to compare the intervention and comparator groups. We planned to undertake meta‐analyses using Mantel‐Haenszel risk differences. However, this was not required, as we had no meta‐analysis for outcomes that were rare. In future updates when we can perform meta‐analyses for these outcomes, we will report results with 95% CI and forest plots for both statistical measures so that findings can be compared.
Where we estimated results for individual studies with low numbers of events (fewer than 10 in total) or where the total sample size was less than 30 participants, we reported the proportion of events in each group, together with a P value from a Fisher's exact test.
We applied the GRADE approach for the main comparisons (Schünemann 2013), in order to rate the quality of the evidence for the prespecified outcomes (see Outcomes for 'Summary of findings' tables under Types of outcome measures) (Guyatt 2013a; Guyatt 2013b).
Subgroup analysis and investigation of heterogeneity
According to our protocol we planned to undertake the following stratified analyses for the primary outcomes to explore whether different study characteristics could be considered as effect modifiers:
-
age of participants (e.g. children versus adults) (subset of participants);
-
disease severity (mild versus severe eczema) (subset of participants);
-
atopic versus non‐atopic eczema (subset of participants); and
-
presence of filaggrin gene mutations versus no filaggrin gene mutations (subset of participants).
However, we did not find enough studies to carry out any subgroup analysis.
Sensitivity analysis
We carried out sensitivity analyses to examine the effects of excluding studies at high risk of bias, as well as different stratified analyses to explore heterogeneity. To do this we performed stratified analyses for the overall risk of bias, defined as low risk (low for all domains), high risk (high for one or more domains), and unclear risk (unclear for one or more domains).
In the presence of small‐study effects, that is where the intervention effect appears more beneficial in smaller studies, use of a random‐effects estimate of intervention effect produces a more beneficial result than a fixed‐effect estimate. Therefore, we assessed the influence of small‐study effects on the results of meta‐analyses in which there was evidence of between‐study heterogeneity (I² > 0), by comparing the fixed‐effect and random‐effects estimates of the intervention effect (i.e. if the estimates were similar, then any small‐study effects had little effect on the intervention effect estimate) (Chapter 10 Cochrane Handbook for Systematic Reviews of Interventions (Higgins 2011)).
Where possible, we performed a stratified analysis to compare study results from preregistered trials (e.g. available on ClinicalTrials.gov) with those without an available prespecified protocol.
Results
Description of studies
See Characteristics of included studies and Characteristics of excluded studies.
Results of the search
Our searches of the various databases retrieved 5611 records for studies, two of which were protocols for ongoing trials. The searches of the trials registers identified a further 29 ongoing studies, and we found 11 additional references through other resources, including the bibliographies of included and excluded studies. After removal of 20 duplicate records, we screened 5631 references for eligibility. We excluded 5471 studies through assessment of their titles and abstracts, and we obtained full‐text copies of the remaining 160 studies. Among the 160 studies there were 47 duplicate studies (multiple publications of the same study; i.e. studies published as well in another journal or presented as an abstract or poster during a conference). We excluded five studies with reasons detailed in Characteristics of excluded studies; a further 31 are ongoing trials (see Characteristics of ongoing studies). We included the remaining 77 studies in the review (see Characteristics of included studies). For details of our screening process, see the study flow diagram (Figure 1).
Thirteen studies had to be translated into English from Chinese (Gao 2008; Wu 2014; Yang 2010), German (Bohnsack 1997; Gehring 1996; Puschmann 2003; Thumm 2000; Wilhelm 1998), Japanese (Hamada 2008; Shiratori 1977), Korean (Kim 2014 (full publication of Nho 2014) and Noh 2011), and French (Larregue 1996), prior to further assessment (see Acknowledgements).
Included studies
We included 77 studies, with a total of 6603 participants, in the review. The number of participants for whom gender was reported (2986 women and 2311 men) were fairly comparable, but gender was not reported for the remaining 1306 participants.
Characteristics of the trial setting and methods
Within the 77 included RCTs:
-
seven compared a moisturiser with no treatment (no moisturiser) (Giordano‐Labadie 2006; Grimalt 2007; Hagströmer 2006; Patrizi 2014; Simpson 2013; Weber 2015; Wirén 2009);
-
15 were placebo‐ or vehicle‐controlled (Abramovits 2008; Belloni 2005; Boguniewicz 2008; Bohnsack 1997; Boralevi 2014; Breternitz 2008; Gayraud 2015; Gehring 1999; Hamada 2008; Korting 2010; Larregue 1996; Nebus 2009; Peltonen 2014; Tan 2010; Wilhelm 1998);
-
four multi‐armed studies made comparisons between placebo or vehicle as well as another moisturiser (Lodén 2002; Patrizi 2008; Shiratori 1977; Thumm 2000);
-
15 studies compared moisturisers against active treatments (topical corticosteroids or topical immunomodulators) (Angelova‐Fischer 2014; Berth‐Jones 2003; De Belilovsky 2011; Emer 2011; Frankel 2011; Gehring 1996; Glazenburg 2009; Hanifin 2002; Janmohamed 2014; Jirabundansuk 2014; Peserico 2008; Sugarman 2009; Takeuchi 2012; Udompataikul 2011; Wanakul 2013);
-
seven studies compared active treatment combined with moisturisers against active treatment alone (Draelos 2008; Gao 2008; Hanifin 1998; Kircik 2009; Msika 2008; Simpson 2011; Wu 2014);
-
the remaining 29 studies compared one moisturiser with another moisturiser.
Thirty‐eight studies were conducted in a single centre, mostly dermatology departments of hospitals, whilst 40 studies were multicentre studies. The majority of studies were conducted in Europe (42), followed by the USA and Canada (20), Asia (14), and Africa (1).
Characteristics of the participants
The studies mainly included participants with mild to moderate eczema; the criteria of the UK Working Party (Williams 1994), and of Hanifin and Rajka (Hanifin 1980), were the most widely used diagnostic criteria. Sample sizes were relatively small and ranged from six to 552 participants with the majority of studies including between 20 and 60 participants.
The ages of the participants varied across the studies, with a range of four months to 84 years, and an overall mean of 18.6 years.
Characteristics of the interventions
The studies evaluated a wide range of different moisturisers (see Table 3), but very few compared similar interventions. Duration of interventions lasted from a single 10‐minute application of a treatment to application several times a day for up to six months, but two to six weeks was the most common duration of study, with a mean of 6.7 weeks.
| MOISTURISER VERSUS VEHICLE, PLACEBO OR NO TREATMENT | ||||
|---|---|---|---|---|
| Moisturisers versus no treatment (i.e. no moisturiser) | ||||
| Study | Intervention | Comparator | Within‐participant? | Active treatment allowed? |
| Exomega lotion (oat) twice daily 6 weeks | No treatment for 6 weeks | No | Moderate‐ and high‐potency corticosteroids allowed | |
| Exomega moisturising milk (oat) twice daily for 2 months | No treatment for 2 months | No | Moderate‐ and high‐potency corticosteroids allowed | |
| Eucerin Eczema Relief body cream (oat and licochalcone) once a day for 6 months + cleanser | Only cleanser for 6 months | No | Eucerin Eczema Relief Instant Therapy allowed for active lesions, | |
| Canoderm (urea 5%) twice daily 6 months | No treatment 6 months | No | Permitted only at areas other than target lesion | |
| Cethaphil Restoraderm Body moisturiser (ceramide precursors etc) twice daily 27 days | No treatment 27 days | Yes | No | |
| Emollient balm twice daily for 28 days | Hygiene product for 28 days | No | Not mentioned | |
| Atopiclairversus vehicle | ||||
| Study | Intervention | Comparator | Within‐participant? | Active treatment allowed? |
| Atopiclair three times daily for 50 days | Vehicle three times daily for 50 days | No | No | |
| Atopiclair three times daily for 21 days | Vehicle three times daily for 21 days | No | Oral medication continued | |
| Atopiclair three times daily for 43 days | Vehicle three times daily for 43 days | No | If really needed, low‐potency topical corticosteroids allowed | |
| Patrizi 20083‐arm (1st comparison) As Atopiclair 'light' is not marketed and clearly less effective, it is not included in the comparison Atopiclair versus vehicle. The comparison Atopiclair 'light' versus vehicle (2nd comparison) will therefore not be further discussed | Atopiclair three times daily for 43 days | Vehicle three times daily for 43 days | No | If really needed, low‐potency topical corticosteroid allowed |
| Other moisturisers versus vehicle or placebo | ||||
| Urea‐containing moisturisers | ||||
| Study | Intervention | Comparator | Within‐participant? | Active treatment allowed? |
| Laceran (10% urea) twice daily for 4 weeks | Vehicle twice daily for 4 weeks | Yes | No | |
| Canoderm (urea 5%) twice daily for 6 months | No treatment for 6 months | No | Only at other areas than target lesion | |
| Laceran (10% urea) twice daily for 4 weeks | Vehicle twice daily for 4 weeks | Yes | No | |
| Lodén 20023 arm (1st comparison) | Urea saline 4% cream once daily for 30 days | Placebo (cream base) cream once daily for 30 days | No | Topical steroids allowed |
| Glycerol‐containing moisturisers | ||||
| Lodén 20023 arm (2nd comparison) | Glycerol 20% once daily for 30 days | Placebo (cream base) once daily for 30 days | No | Topical steroids allowed |
| Dexeryl (glycerol 15%) twice daily for 4 weeks | Vehicle without glycerol twice daily for 4 weeks | No | If really needed, moderate‐potency topical corticosteroid allowed | |
| Glycerol 20% twice daily for 4 weeks | Vehicle without glycerol twice daily for 4 weeks | Yes | No | |
| Oat‐containing moisturisers | ||||
| Exomega lotion (oat) twice daily for 6 weeks | No treatment for 6 weeks | No | Moderate‐ and high‐potency corticosteroids allowed | |
| Exomega moisturising milk (oat) twice daily for 2 months | No treatment for 2 months | No | Moderate‐ and high‐potency corticosteroids allowed | |
| Oatmeal based occlusive cream twice daily for 8 weeks | Occlusive vehicle for 8 weeks | No | Topical medications allowed | |
| Eucerin Eczema Relief body cream (oat and licochalcone) once a day for 6 months + cleanser | Cleanser only for 6 months | No | Eucerin Eczema Relief Instant Therapy was allowed for active lesions | |
| Remaining moisturisers versus vehicle or placebo | ||||
| Ammonium lactate 6% in water‐in‐oil emulsion twice daily for 4 weeks | Vehicle twice daily for 4 weeks | Yes | No | |
| Pale sulfonated 4% shale oil cream three times daily for 4 weeks | Vehicle three times daily for 4 weeks | No | No | |
| Atoderm Intensive cream twice daily for 6 months | Moisturiser base twice daily for 6 months | No | Topical corticosteroid and immunomodulators could be continued | |
| Triclosan 1% moisturiser twice daily for 41 days | Vehicle cream twice daily for 41 days | No | Low‐potency corticosteroid allowed | |
| Thumm 20003 arm (1st comparison) | Hippophae rhamnoides 10% cream for 4 weeks | Placebo cream for 4 weeks | No | No |
| Thumm 20003 arm (2nd comparison) | Hippophae rhamnoides 20% cream for 4 weeks | Placebo cream for 4 weeks | No | No |
| Oils versus placebo | ||||
| Gehring 1999study 1 | Primrose oil amphilic o/w emulsion twice daily for 4 weeks | Placebo oil twice daily for 4 weeks | Yes | No |
| Gehring 1999study 2 | Primrose oil amphilic w/o emulsion twice daily for 4 weeks | Placebo oil twice daily for 4 weeks | Yes | No |
| Camellia oil spray for 2 weeks | Purified water spray for 2 weeks | No | All allowed without changing | |
| ONE MOISTURISER VERSUS ANOTHER MOISTURISER | ||||
| Study | Intervention | Comparator | Within‐participant? | Active treatment allowed? |
| Patrizi 20083 arm (3rd comparison) | Atopiclair three times daily for 43 days | Atopiclair 'light' three times daily for 43 days | No | If really needed, low‐potency topical corticosteroid allowed |
| Miller 20113 arm (1st comparison) | Atopiclair three times daily for 3 weeks | EpiCeram three times daily for 3 weeks | No | No |
| Miller 20113 arm (2nd comparison) | Atopiclair three times daily for 3 weeks | Aquaphor (petrolatum 41%, glycerol, lanolin etc.), three times daily for 3 weeks | No | No |
| Miller 20113 arm (3rd comparison) | EpiCeram (high ceramides) three times daily for 3 weeks | Aquaphor three times daily for 3 weeks | No | No |
| EpiCeram twice daily for 4 weeks | Hyalotopic (hyaluronic acid, glycerol, propylene glycol etc) twice daily for 4 weeks | Yes | No | |
| EpiCeram twice daily for 3 weeks | Oatmeal‐containing cream twice daily for 3 weeks | No | No | |
| EpiCeram for 4 weeks | Eucerin for 4 weeks | Yes | No | |
| MimyX + Eucerin twice daily for 12 weeks | Eucerin cream twice daily for 12 weeks | Yes | If really needed, low‐potency topical corticosteroid allowed | |
| Albolene twice daily for 4 weeks | MimyX twice daily for 4 weeks | Yes | Low‐potency topical corticosteroid allowed | |
| Fredriksson 1975(2 studies) | Aquacare twice daily for 4 weeks | Calmurid twice daily for 4 weeks | Yes | No |
| Locobase repair twice daily for a year | Atoderma twice daily for a year | No | Moderate‐potency topical corticosteroid allowed | |
| Canoderm (urea 5%) twice daily for 6 months | Miniderm (no urea) twice daily for 6 months | No | No | |
| Urea 5% moisturiser twice daily for 6 weeks | Urea 10% lotion for 6 weeks | No | Topical steroids allowed | |
| Urea 4% + NaCl in o/w twice daily for 2 weeks | Urea 4% in o/w twice daily for 2 weeks | Yes | No | |
| Lodén 20023 arm (3rd comparison) | Glycerol 20% once daily for 30 days | Urea saline 4% cream once daily for 30 days | No | Topical corticosteroids allowed |
| Propyless (20% propylene glycol) twice daily for 2 weeks | Fenuril (urea 4% and NaCl 4%) twice daily for 2 weeks | Yes | No | |
| Ceramide‐containing moisturiser twice daily for 6 weeks | Control moisturiser (?) twice daily for 6 weeks | No | Topical corticosteroids allowed | |
| Furfuryl palmitate‐enriched moisturiser twice daily for 2 weeks | Moisturiser twice daily for 2 weeks | No | No | |
| Pro‐AMP cream (rhamnosoft ceramides) twice daily for 4 weeks | Hydrating cream (glycerol, vaseline, paraffin twice daily for 4 weeks | No | No | |
| Thumm 20003 arm (3rd comparison) | Hippophae rhamnoides 10% cream for 4 weeks | Hipophae rhamnoides 20% cream for 4 weeks | No | No |
| Lactobacillus sakei‐containing moisturiser twice daily for 4 weeks | Control moisturiser for 4 weeks | Yes | Topical corticosteroids allowed | |
| Virgin coconut oil twice daily for 8 weeks | Mineral oil twice daily for 8 weeks | No | No | |
| Virgin coconut oil twice daily for 4 weeks | Virgin olive oil twice daily for 4 weeks | No | No | |
| Bleach bath with moisturiser on one occasion | Water bath with moisturiser on one occasion | No | No | |
| MOISTURISERS VERSUS ACTIVE TREATMENT | ||||
| Moisturisers versus topical corticosteroids | ||||
| Study | Intervention | Comparator | Within‐participant? | Active treatment allowed? |
| Within‐participant studies comparing licochalcone containing moisturiser versus hydrocortisone | ||||
| O/W formulation containing licochalcone A (Glycyrrhiza Inflata root extract) twice daily for 1 week | Hydrocortisone cream twice daily for 1 week | Yes | No | |
| Licochalcone twice daily for 6 weeks | Hydrocortisone cream twice daily for 6 weeks | Yes | No | |
| Licochalcone twice daily for 4 weeks | Hydrocortisone cream twice daily for 4 weeks | Yes | No | |
| Parallel studies comparing moisturisers versus topical corticosteroids | ||||
| Stelatopia (2% sunflower oil distillate, fatty acids, ceramides) twice daily for 3 weeks | Hydrocortisone butyric propionate twice daily for 3 weeks | No | No | |
| EpiCeram twice daily for 4 weeks | Fluticasone 0.5% cream twice a day for 4 weeks | No | No (Cetaphil lotion applied to uninvolved lesions) | |
| 20% petrolatum in cetomacrogol + wet wrap for 4 weeks | Mometasone furoate 0.1% + wet wrap for 4 weeks | No | No | |
| w/o emulsion Excipial twice a day for 1 week | Hydrocortisone 1% in w/o emulsion (Excipial) twice daily for 1 week | No | No | |
| Moisturiser containing spent grain wax, spinose kernel oil, etc. twice a day for 4 weeks | Hydrocortisone 1% cream twice a day for 4 weeks | Yes | No | |
| Moisturiser (Advabase) twice a day for 16 weeks | Methylprednisolone aceponate cream 2 days a week, on other days used moisturiser twice a day for 16 weeks | No | No | |
| Moisturiser versus topical immunomodulators | ||||
| Eletone (high lipid) three times daily for 4 weeks | Pimecrolimus three times daily for 4 weeks | Yes | No | |
| Moisturiser therapy (?) for 4 weeks | Tacrolimus for 4 weeks | No | No | |
| Hyalotopic (ceramide) three times daily for 4 weeks | Pimecrolimus twice a day for 4 weeks | Yes | No | |
| VEHICLE + MOISTURISER VERSUS TOPICAL CORTICOSTEROID + MOISTURISER | ||||
| Berth‐Jones 20034 arm (1st comparison) | Vehicle cream twice weekly + moisturiser for 16 weeks | Fluticasone propionate 0.05% cream twice weekly + moisturiser for 16 weeks | No | No |
| Berth‐Jones 20034 arm (2nd comparison) We did not consider other possible comparisons of the 4 arms important for this review | Vehicle ointment twice weekly + moisturiser for 16 weeks | Fluticasone propionate 0.005% ointment twice weekly + moisturiser for 16 weeks | No | No |
| Vehicle twice a week + moisturiser for 20 weeks | Fluticasone propionate 0.05% cream twice weekly + moisturiser for 20 weeks | No | No | |
| Placebo ointment twice weekly + moisturiser for 16 weeks | Fluticasone propionate 0.005% ointment twice weekly + moisturiser for 16 weeks | No | No | |
| TOPICAL ACTIVE TREATMENT + MOISTURISER VERSUS TOPICAL ACTIVE TREATMENT ALONE | ||||
| Study | Intervention | Comparator | Within‐participant? | Active treatment allowed? |
| Draelos 20083 arm (1st comparison) | Fluocinonide 0.05% twice a day + ceramide cleanser+ moisturising cream for 4 weeks | Fluocinonide 0.05% twice a day plus cleansing bar for 4 weeks | No | No |
| Draelos 20083 arm (2nd comparison) 3rd possible comparison did not include moisturiser i.e. fluocinonide + cleansing bar vs fluocinonide + ceramide cleanser | Fluocinonide 0.05% twice a day + ceramide cleanser+ moisturising cream for 4 weeks | Fluocinonide 0.05% twice a day plus ceramide cleanser for 4 weeks | No | No |
| Moisturising and softening cream + flumethasone ointment twice a day for 3 weeks | Flumethasone ointment twice a day for 3 weeks | No | No | |
| Simpson 2011 study D | Restoraderm moisturiser twice a day + topical corticosteroids for 4 weeks | Routine use of topical corticosteroids for 4 weeks | Yes | No |
| Desonide 0.05% twice a day + three times daily moisturiser for 3 weeks | Desonide 0.05% cream twice a day for 3 weeks | Yes | No | |
| Msika 20085 arm (1st comparison) | Desonide 0.05% twice a day plus moisturiser + sunflower oil 2% twice a day for 21 days | Desonide 0.05% twice a day for 21 days | No | No |
| Msika 20085 arm (2nd comparison) We did not consider other possible comparisons of the 5 arms to be important for this review | Desonide 0.05% once daily plus moisturiser + sunflower oil 2% twice a day for 21 days | Desonide 0.05% once daily for 21 days | No | No |
| BoPao cream + 10% urea ointment once a day or twice a day for 2 weeks | BoPao cream only (antifungal/anti‐inflammatory cream) | No | No | |
o/w: oil in water
w/o: water in oil
Fourteen of the 77 included studies provided no usable data (see Table 4). The reasons for this were: that the study report was unclear about how many participants were randomised to each treatment arm; or reported no precise outcome data, so the data could only be estimated from figures; or there were no separate data for healthy participants and atopic participants; or the study did not address our prespecified outcomes; or the reports were posters with limited information. We were either unsuccessful in our attempts to obtain data from the principal investigators of these 14 cases (see Table 2), or the studies were more than 10 years old, which made a response to enquiries unlikely.
| Study ID | Interventions & comparisons | N | Comments |
|---|---|---|---|
| 5% urea as active substance versus 4% urea and 4% NaCl | 50 | The data were reported in box‐and‐whisker plots, and no precise data were provided, too much estimation | |
| Emollient + fresh expressed milk versus moisturiser only | 9 | None of our outcomes were assessed | |
| Aqueous cream BP versus Oilatum Junior Bath additive | 38 | Poster with limited information. The principal investigator said, "The study itself was a purely mechanistic study, and not meant to provide clinical evidence" | |
| Nioleol (10% primrose oil, 8%‐9% γ‐linolenic acid) versus Uriage (borage oil and 24% γ‐linolenic acid) versus Atopic (35%‐40% γ‐linolenic acid) versus Atoderm control moisturiser once daily for 12 weeks | 23 | Unclear how many participants were randomised to each arm | |
| Proderm versus no treatment | 24 | No baseline data nor end value data were reported. The data were reported in box‐and‐whisker plots, and were not interpretable | |
| Oilatum Plus versus Oilatum Emollient | 30 | Unclear how many participants were randomised to each arm, inconsistencies in reporting of data | |
| Study 1 Emulsifying ointment with aqueous cream versus emulsifying ointment with baby oil Study 2 Cetomacrogol versus emulsifying ointment versus glycerol/petrolatum versus petroleum jelly | 120 | Frequency of use during day or week were not reported. There were quite some inconsistencies in text and figures. Study 2 reported no end data, just that all scores tended to decline. We mailed investigators numerous times to clarify study details, but received no response. | |
| Midpotency corticosteroid cream versus midpotency corticosteroid cream combined with a hydrolipid cream | 6 | Poster with limited information, principal investigator was not able to provide missing study details | |
| Glycerol 20% cream versus 4% urea and 4% NaCl | 110 | Unclear how many participants were randomised to each arm. The data all need to be estimated from box‐and‐whisker plots, too much estimation | |
| PPARα activator and ceramide versus moisturiser without these ingredients | 31 | Only 5 participants with eczema included, no individual patient data, not our prespecified outcomes | |
| Cis‐urocanic acid 5% emulsion cream versus control vehicle | 14 | Data provided need to be estimated from figures (for transepidermal water loss (TEWL)), or no precise data were provided other than that there were no significant differences. We mailed investigators numerous times to clarify study details, but received no response | |
| Cream containing 10% urea versus control cream | 70 | Unclear how many were randomised to each treatment arm, no separate data for healthy subjects and atopic subjects | |
| Two different formulations of polidocanol‐ and urea‐containing creams against each other | 54 | Unclear how many were randomised to each treatment arm, no separate data for healthy subjects and atopic subjects | |
| Urea 10% ointment versus base OR versus urea 20% ointment | 552 | The data were confusingly reported in this study and did not lend themselves to further analysis. As the study was 39 years old we have not contacted the investigators for data |
Characteristics of the outcome measures
Our primary outcome, participant‐assessed disease severity, was addressed in only 24 studies, which mostly used a 3‐ to 6‐point Likert scale. However, three studies used a validated instrument. The Gayraud 2015 study applied the Patient‐Oriented SCORing Atopic Dermatitis (PO‐SCORAD) scale (Stalder 2011), and the Hlela 2015 and Janmohamed 2014 studies used the Patient Oriented Eczema Measure (POEM) (Charman 2004). A total of 23 studies evaluated changes in itch scores, which were predominantly measured with a visual analogue scale (VAS). Satisfaction was assessed in 13 studies with either a Likert scale, VAS or a questionnaire. Adverse events were reported in 41 studies, however, information was mostly limited or generic in nature (e.g. "Only five adverse events were possibly or probably related to the study products with three of them of mild intensity and all of them related to the skin" (Bissonnette 2010)).
One of our secondary outcomes, investigator‐assessed disease severity, was addressed in 65 studies and, as with the participant assessments, was predominantly evaluated with a Likert scale alone or in combination with validated instruments such as the Eczema Area and Severity Index (EASI) and SCORAD. Fourteen studies assessed disease severity with EASI (Hanifin 2001), and 25 studies used the SCORAD (European Task Force on Atopic Dermatitis 1993). Prevention of flares (lengthening the time to first flare) was investigated in 16 studies, mostly after eczema had been stabilised with active treatment. The least assessed outcome was 'change in use of topical active treatment' which was only addressed in eight studies. Twenty‐nine studies assessed changes in skin barrier function by TEWL, followed by corneometry, to measure skin hydration. The remaining secondary outcome 'change in health‐related quality of life' was covered in 10 studies. All of the studies used validated instruments except Bissonnette 2010 which used a 22‐item questionnaire. De Belilovsky 2011, Grimalt 2007 and Msika 2008 used two instruments (the Infant’s Dermatitis Quality of Life index (IDQOL) (Lewis‐Jones 2001), and the Dermatitis Family Impact questionnaire (DFI) (Lawson 1998)). Gayraud 2015 used the Children's Dermatology Life Quality Index (CDLQI) as an additional instrument (Lewis‐Jones 1995). Hlela 2015 and Janmohamed 2014 applied the IDQOL, Giordano‐Labadie 2006 used the CDLQI, Nebus 2009 the Dermatology Quality of Life Index (DLQI) (Finlay 1994), and Åkerström 2015 the EQ‐5D (The EuroQol Group 1990).
Many of the included studies in this review reported additional outcomes of potential clinical relevance, but they were not directly relevant to the prespecified objectives of this review. Examples of such outcomes included reduction in S aureus (Angelova‐Fischer 2014; Verallo‐Rowell 2008), tolerability (Bissonnette 2010; Draelos 2008; Grimalt 2007; Korting 2010; Larregue 1996; Marseglia 2014; Puschmann 2003; Wilhelm 1998), cosmetic acceptability (Bissonnette 2010; Faergemann 2009; Fredriksson 1975), and onset and duration of itch relief (Boguniewicz 2008).
Declaration of interest and funding
A total of 46 of the 77 studies reported the source of their funding, which was mostly from the pharmaceutical industry, and 27 of these studies declared conflicts of interest. Some studies did not report funding, although the product under investigation was manufactured by a pharmaceutical company that employed one or more of the investigators, which would make the prospect of pharmaceutical company funding more likely (Abramovits 2008; Andersson 1999; Bissonnette 2010; Bohnsack 1997; Giordano‐Labadie 2006).
Some studies reported that there was no conflict of interest, but indicated that some of the investigators were employees of the manufacturer of the moisturiser under investigation (Andersson 1999; Bohnsack 1997; De Belilovsky 2011; Giordano‐Labadie 2006; Glazenburg 2009; Hanifin 1998; Hanifin 2002; Lodén 2001; Lodén 2002; Msika 2008; Thumm 2000; Wilhelm 1998; Wirén 2009).
Nine studies did not report funding (or were not funded by the pharmaceutical industry) and had no apparent conflict of interest (Berents 2015; Evangelista 2014; Hagströmer 2006; Hamada 2008; Hlela 2015; Park 2014; Shi 2015; Takeuchi 2012; Verallo‐Rowell 2008). The older studies generally did not report funding or conflicts of interest, as these declarations were not a requirement at that time; this made it impossible for us to draw conclusions about whether these studies were industry sponsored or were free of conflicts of interest (e.g. Ferreira 1998; Fredriksson 1975; Gehring 1996; Gehring 1999; Larregue 1996; Pigatto 1996; Shiratori 1977).
Excluded studies
We excluded five studies after evaluation of their full text; most were excluded because they were not RCTs (see details Characteristics of excluded studies).
Risk of bias in included studies
We assessed each of the six domains of the Cochrane 'Risk of bias' tool for every included study (see 'Risk of bias' table corresponding to the individual studies in Characteristics of included studies). Risk of bias is also presented in Figure 2 (the 'Risk of bias' graph) and Figure 3 (the 'Risk of bias' summary).

Risk of bias graph: review authors' judgements about each risk of bias item presented as percentages across all included studies

Risk of bias summary: review authors' judgements about each risk of bias item for each included study
Seven studies received an overall assessment of low risk of bias as we judged all domains in the 'Risk of bias' tool to be at low risk (plausible bias unlikely to alter the results seriously) (Åkerström 2015; Belloni 2005; Boralevi 2014; Gayraud 2015; Miller 2011; Nebus 2009; Tan 2010). We assessed 36 studies as being at high risk of bias because we considered one or more domains to be at a high risk of bias (plausible bias that weakens confidence in the results seriously). We classified the remaining 34 studies as being at an unclear risk of bias (plausible bias that raises some doubt about the results).
Allocation
In 44 studies the method used to generate the allocation sequence was clearly described, and allowed a clear assessment of whether the method would produce comparable groups; most of these studies used computer‐generated randomisation codes. The remaining 33 studies were reported to be randomised, but did not provide further details about the methods of random sequence generation used.
Allocation concealment was ensured in 32 studies. Central allocation by pharmaceutical companies and deliveries of sequentially numbered, de‐identified containers or tubes of identical appearance were the most frequently used methods to secure this. We considered allocation concealment to be at a high risk of bias in one study, as the principal investigator informed us that there was no concealment of allocation (Danby 2011). We judged this domain to be at unclear risk of bias for the other 44 studies, as these did not report the method of allocation concealment used.
Blinding
Lack of blinding was the single most important reason for which we judged studies to be at a high risk of bias.
Sixteen studies had no blinding, or incomplete or inadequate blinding, and we therefore judged the domain for performance bias as being at high risk. We judged 21 studies to be at low risk of bias for this domain, as these provided sufficient detail about the measures used to blind study participants and personnel from knowledge of which intervention a participant received. Methods we considered to provide adequate blinding included the use of similar containers, tubes or boxes with similar looking moisturisers, and comparative treatments and similar application frequencies. Forty studies did not describe the method of blinding, or described it inadequately, and therefore we considered the domain as being at unclear risk of bias.
Twenty‐three studies ensured blinding of the outcomes assessors, and it was unlikely that the blinding could have been broken. For 29 studies we judged blinding of outcome assessors as being at high risk of bias. This number is clearly higher than for the domain of performance bias. This was mainly due to the fact that although some studies were labelled as investigator‐blinded, the participants were not blinded, yet the study design included participant‐assessed outcomes. We judged 25 studies to be at an unclear risk of detection bias, largely due to the lack of detail reported about the methods of blinding.
Incomplete outcome data
For 52 studies there was no evidence of incomplete reporting of outcome data, or missing data were limited and balanced between the treatment arms, therefore we judged this domain to be at a low risk of bias. For six studies we considered this domain to be at a high risk of bias (Abramovits 2008; Berents 2015; Grimalt 2007; Noh 2011; Tripodi 2009; Wu 2014), mainly because of high dropout rates combined with per‐protocol analysis, an unbalanced number of dropouts, or because outcome data were missing (such as incomplete outcome data from questionnaires). We assessed the remaining 19 studies as being at an unclear risk of bias.
Selective reporting
The prespecified outcomes and those mentioned in the Methods section appeared to have been reported adequately in the majority of studies (66). In four studies one or more predefined outcomes were not addressed in the Results section (Draelos 2011; Larregue 1996; Laumann 2006; Takeuchi 2012), and we considered that this presented a high risk of bias for this domain. For the other seven studies there was either limited reporting of an outcome, or insufficient information available to permit us to make a 'Risk of bias' judgement.
Other potential sources of bias
We considered the domain of other bias to be at low risk of bias in 67 studies. We assessed this domain as being at unclear risk of bias for 10 studies; there was some baseline imbalance in three studies (Breternitz 2008; Hlela 2015; Verallo‐Rowell 2008), and, in the remaining seven studies, there was insufficient information available to permit us to make a clear judgement (e.g. poster abstract) (Danby 2011; Gao 2008; Kircik 2009; Laumann 2006; Nho 2014; Nuñez 2013; Pigatto 1996).
Effects of interventions
See: Summary of findings 1 Moisturisers versus no treatment (no moisturiser); Summary of findings 2 Atopiclair versus vehicle; Summary of findings 3 Urea‐containing moisturisers versus vehicle, placebo or no moisturiser; Summary of findings 4 Glycerin/glycerol‐containing moisturisers versus vehicle or placebo; Summary of findings 5 Oat‐containing moisturisers versus vehicle or no moisturiser; Summary of findings 6 All moisturisers compared to vehicle, placebo or no moisturiser for eczema; Summary of findings 7 Licochalcone‐containing moisturiser versus hydrocortisone acetate 1% cream for eczema; Summary of findings 8 Vehicle treatment + daily moisturiser compared to fluticasone propionate twice weekly + daily moisturiser; Summary of findings 9 Topical active treatment in combination with moisturiser compared to topical active treatment alone
A total of 63 studies contributed to comparisons as listed below. Some studies contributed to more than one comparison. As stated above, 14 studies provided no usable data (Table 4).
We provide a summary of the comparisons we made, and the categories within them, below for ease of navigation (see Table 3). Some studies appear in more than one category.
Comparison 1: moisturisers versus no treatment (i.e. no moisturiser) (six studies)
Comparison 2: moisturisers versus vehicle, placebo or no treatment (2a to 2g): subdivided as follows.
-
2a ‐ Atopiclair (glycyrrhetinic acid‐containing moisturiser) versus vehicle (four studies);
-
2b ‐ Urea‐containing moisturisers versus vehicle, placebo or no treatment (i.e. no moisturiser) (four studies);
-
2c ‐ Glycerol (glycerine)‐containing moisturisers versus vehicle or placebo (three studies);
-
2d ‐ Oat‐containing moisturisers versus vehicle or no treatment (four studies);
-
2e‐I to 2e‐VI ‐ Remainder of moisturisers versus vehicle or placebo (five studies, one reference included three treatment arms (Thumm 2000));
-
2f ‐ All moisturisers versus vehicle, placebo or no treatment (14 studies);
-
2g ‐ Oil versus placebo (three studies (one reference: Gehring 1999 included two studies).
To ensure consistency with the terminology used by the investigators, we have used their wording and refer to 'placebo' or 'vehicle' accordingly. It is important to know that a placebo is also a moisturiser, but with a different composition and without the ingredient assumed to be effective, while a vehicle has the same composition as the moisturiser it is compared with, but without the ingredient assumed to be effective. As both placebo and vehicle have moisturising properties, they might have a beneficial effect on the skin barrier and thus might decrease disease severity.
Comparison 3: one moisturiser versus another moisturiser (3a to 3x, 22 studies, one reference included two studies (Fredriksson 1975), and one reference included three treatment arms (Miller 2011)).
Comparison 4: moisturisers versus active treatment:
-
4a ‐ Licochalcone‐containing cream versus hydrocortisone acetate 1% cream (three studies);
-
4b‐I to 4b‐VI ‐ Other moisturisers versus topical corticosteroids (six studies);
-
4c‐ Moisturisers versus topical immunomodulators (three studies).
Comparison 5: vehicle in combination with a moisturiser versus topical corticosteroids in combination with a moisturiser (three studies, one reference included four treatment arms (Berth‐Jones 2003)).
Comparison 6: topical active treatment in combination with a moisturiser versus topical active treatment only (six studies).
Where small‐study bias was suspected in the meta‐analyses, we used a fixed‐effect model sensitivity analyses for pooled data and we present the estimates in Table 5. We also performed stratified analyses for 'Risk of bias' domain for pooled data (where there were three or more studies) and the results are presented in Table 6. We could not perform a stratified analysis to compare study results from trials that were preregistered (e.g. available on ClinicalTrials.gov (www.clinicaltrials.gov)) with those without an available prespecified protocol because, a limited number of studies included in the meta‐analyses were preregistered.
| Analysis | Comparison | MD/RR/HR/SMD | 95% confidence interval | P value |
|---|---|---|---|---|
| Change from baseline in SCORAD | Moisturisers versus no treatment Pooled data | MD ‐2.51 | ‐3.66 to ‐1.37 | P < 0.0001 |
| Number of participants experiencing a flare | Moisturisers versus no treatment Pooled data | RR 0.39 | 0.22 to 0.68 | P = 0.0008 |
| Amount of topical steroids used | Moisturisers versus no treatment Pooled data for the first 3 to 4 weeks | MD ‐5.34 | ‐7.79 to ‐2.89 | P < 0.0001 |
| Moisturisers versus no treatment Single study data last 3 to 4 weeks | MD 0.50 | ‐4.70 to 5.70 | P = 0.85 | |
| Moisturisers versus no treatment Pooled data for 6 to 8 weeks | MD ‐8.11 | ‐11.00 to ‐5.22 | P < 0.00001 | |
| Change from baseline in quality of life | Moisturisers versus no treatment Pooled data | SMD ‐0.14 | ‐0.44 to 0.16 | P = 0.35 |
| Number of participants who experienced good improvement to total resolution | Atopiclair versus vehicle Pooled data | RR 4.16 | 2.96 to 5.86 | P < 0.00001 |
| Change from baseline itch measured on a VAS | Atopiclair versus vehicle Pooled data | MD ‐2.08 | ‐2.35 to ‐1.81 | P < 0.00001 |
| Number of participants reporting an adverse event | Atopiclair versus vehicle Pooled data | RR 1.04 | 0.80 to 1.35 | P = 0.78 |
| Change from baseline in EASI | Atopiclair versus vehicle Pooled data | MD ‐4.05 | ‐5.00 to ‐3.10 | P < 0.00001 |
| Number of participants experiencing a flare | Atopiclair versus vehicle Pooled data | RR 0.18 | 0.11 to 0.31 | P < 0.00001 |
| Change from baseline in skin capacitance | Urea‐containing versus vehicle | MD 3.13 | 2.13 to 4.13 | P < 0.00001 |
| Numbers of participants reporting an adverse event | Glycerol versus placebo cream Pooled data | RR 0.89 | 0.67 to 1.18 | P = 0.46 |
| Change in disease severity as assessed by the investigators | Oat‐containing cream versus vehicle or no treatment Pooled data | SMD ‐0.19 | ‐0.43 to 0.05 | P = 0.12 |
| Change from baseline in quality of life | Oat‐containing cream versus vehicle or no treatment Pooled data | SMD ‐0.09 | ‐0.35 to 0.17 | P = 0.51 |
| Number of participants that experienced improvement | All moisturisers versus vehicle, placebo or no treatment Pooled data | RR 2.20 | 1.84 to 2.62 | P < 0.00001 |
| Change from baseline in itch | All moisturisers versus vehicle, placebo or no treatment Pooled data | SMD ‐0.88 | ‐1.04 to ‐0.72 | P < 0.00001 |
| Number of participants that expressed treatment satisfaction | All moisturisers versus vehicle, placebo or no treatment Pooled data | RR 1.69 | 1.35 to 2.11 | P < 0.00001 |
| Number of participants reporting an adverse event | All moisturisers versus vehicle, placebo or no treatment Pooled data | RR 1.06 | 0.88 to 1.27 | P = 0.56 |
| Change in disease severity as assessed by the investigators | All moisturisers versus vehicle, placebo or no treatment Pooled data | SMD ‐0.62 | ‐0.73 to ‐0.51 | P < 0.00001 |
| Number of participants experiencing a flare | All moisturisers versus vehicle, placebo or no treatment Pooled data | RR 0.35 | 0.26 to 0.47 | P < 0.00001 |
| Change from baseline in quality of life | All moisturisers versus vehicle, placebo or no treatment Pooled data | SMD ‐0.40 | ‐0.64 to ‐0.17 | P = 0.0006 |
| Change from baseline in TEWL | Primrose oil versus placebo oil Pooled data | MD ‐0.34 | ‐1.44 to 0.76 | P = 0.55 |
| Change from baseline in skin hydration | Primrose oil versus placebo oil Pooled data | MD 0.34 | ‐2.54 to 3.21 | P = 0.82 |
| Change from baseline in itch (VAS) | Licochalcone versus hydrocortisone Pooled data | MD ‐0.37 | ‐0.75 to ‐0.00 | P = 0.05 |
| Change from baseline in SCORAD | Licochalcone versus hydrocortisone Pooled data | MD ‐0.12 | ‐0.77 to 0.54 | P = 0.73 |
| Change from baseline in TEWL | Licochalcone versus hydrocortisone Pooled data | MD ‐2.04 | ‐3.60 to ‐0.49 | P = 0.010 |
| Number of participants reporting an adverse event | Vehicle plus moisturiser versus fluticasone propionate plus moisturiser Pooled data | RR 0.60 | 0.42 to 0.85 | P = 0.004 |
| Number of participants experiencing a flare | Vehicle plus moisturiser versus fluticasone propionate plus moisturiser Pooled data | RR 2.27 | 1.91 to 2.71 | P < 0.00001 |
| Hazard ratio for rate of flare | Vehicle plus moisturiser versus fluticasone propionate plus moisturiser Pooled data | HR 3.67 | 2.78 to 4.84 | P < 0.00001 |
| Change in disease severity as assessed by the investigators | Active treatment in combination with a moisturiser versus active treatment only Pooled data | SMD ‐0.87 | ‐1.17 to ‐0.57 | P = 0.00001 |
| Change in quality of life IDQOL | Active treatment in combination with a moisturiser versus active treatment only Pooled data | MD ‐1.31 | ‐2.70 to 0.09 | P = 0.07 |
| Change of quality of life DFI | Active treatment in combination with a moisturiser versus active treatment only Pooled data | MD ‐1.03 | ‐2.47 to 0.42 | P = 0.17 |
Abbreviations
DFI: dermatitis family impact
EASI: eczema area and severity index
IDQOL: infant's dermatitis quality of life;
HR: hazard ratio
MD: mean difference
RR: risk ratio
SCORAD: scoring atopic dermatitis
SMD: standardised mean difference
TEWL: transepidermal water loss
VAS: visual analogue scale
| MOISURISER VERSUS NO MOISTURISER | ||||||
|---|---|---|---|---|---|---|
| Change from baseline in SCORAD | ||||||
| Variable | Number of studies | Number of participants in moisturiser group | Number of participants in control group | MD (95% CI) | Heterogeneity I² | P value |
| All trials (Giordano‐Labadie 2006; Grimalt 2007; Patrizi 2014) | 3 | 141 | 135 | ‐2.42 (‐4.55 to ‐0.28) | 68% | P = 0.03 |
| Sequence generation | ||||||
| Low risk (all trials) | 3 | 141 | 135 | ‐2.42 (‐4.55 to ‐0.28) | 68% | P = 0.03 |
| Allocation concealment | ||||||
| Low risk (all trials) | 3 | 141 | 135 | ‐2.42 (‐4.55 to ‐0.28) | 68% | P = 0.03 |
| Blinding of participants and personnel | ||||||
| High risk (all trials) | 3 | 141 | 135 | ‐2.42 (‐4.55 to ‐0.28) | 68% | P = 0.03 |
| Blinding of outcome assessment | ||||||
| High risk (all trials) | 3 | 141 | 135 | ‐2.42 (‐4.55 to ‐0.28) | 68% | P = 0.03 |
| Incomplete outcome data | ||||||
| Low risk (Giordano‐Labadie 2006; Patrizi 2014) | 2 | 63 | 65 | ‐3.39 (‐4.73 to ‐2.05) | 0% | P < 0.00001 |
| High risk (Grimalt 2007) | 1 | 78 | 70 | ‐0.16 (‐2.36 to 2.04) | NA | P = 0.89 |
| Selective reporting | ||||||
| Low risk (all trials) | 3 | 141 | 135 | ‐2.42 (‐4.55 to ‐0.28) | 68% | P = 0.03 |
| Other bias | ||||||
| Low risk (all trials) | 3 | 141 | 135 | ‐2.42 (‐4.55 to ‐0.28) | 68% | P = 0.03 |
| ATOPICLAIR VERSUS VEHICLE | ||||||
| Number of participants who considered their skin to have improved | ||||||
| Variable | Number of studies | Number of participants in Atopiclair group | Number of participants in vehicle group | RR (95% CI) | Heterogeneity I² | P value |
| All trials (Abramovits 2008; Belloni 2005; Boguniewicz 2008) | 3 | 232 | 158 | 4.51 (2.19 to 9.29) | 64% | P < 0.0001 |
| Sequence generation | ||||||
| Low risk (all trials) | 3 | 232 | 158 | 4.51 (2.19 to 9.29) | 64% | P < 0.0001 |
| Allocation concealment | ||||||
| Low risk (Abramovits 2008; Belloni 2005) | 2 | 160 | 88 | 3.09 (2.08 to 4.59) | 0% | P < 0.00001 |
| Unclear risk (Boguniewicz 2008) | 1 | 72 | 70 | 8.06 (3.95 to 16.42) | NA | P < 0.00001 |
| Blinding of participants and personnel | ||||||
| Low risk (Abramovits 2008; Belloni 2005) | 2 | 160 | 88 | 3.09 (2.08 to 4.59) | 0% | P < 0.00001 |
| Unclear risk (Boguniewicz 2008) | 1 | 72 | 70 | 8.06 (3.95 to 16.42) | NA | P < 0.00001 |
| Blinding of outcome assessment | ||||||
| Low risk (Abramovits 2008; Belloni 2005) | 2 | 160 | 88 | 3.09 (2.08 to 4.59) | 0% | P < 0.00001 |
| Unclear risk (Boguniewicz 2008) | 1 | 72 | 70 | 8.06 (3.95 to 16.42) | NA | P < 0.00001 |
| Incomplete outcome data | ||||||
| Low risk (Belloni 2005; Boguniewicz 2008) | 2 | 87 | 85 | 6.95 (3.69 to 13.07) | 0% | P < 0.00001 |
| High risk (Abramovits 2008) | 1 | 145 | 73 | 3.02 (2.00 to 4.56) | NA | P < 0.00001 |
| Selective reporting | ||||||
| Low risk (all trials) | 3 | 232 | 158 | 4.51 (2.19 to 9.29) | 64% | P < 0.0001 |
| Other bias | ||||||
| Low risk (all trials) | 3 | 232 | 158 | 4.51 (2.19 to 9.29) | 64% | P < 0.0001 |
| Change from baseline in itch measured on a VAS | ||||||
| Variable | Number of studies | Number of participants in Atopiclair group | Number of participants in vehicle group | MD (95% CI) | Heterogeneity I² | P value |
| All trials (Abramovits 2008; Belloni 2005; Boguniewicz 2008; Patrizi 2008) | 4 | 235 | 161 | ‐2.65 (‐4.21 to ‐1.09) | 97% | P = 0.0008 |
| Sequence generation | ||||||
| Low risk (all trials) | 4 | 235 | 161 | ‐2.65 (‐4.21 to ‐1.09) | 97% | P = 0.0008 |
| Allocation concealment | ||||||
| Low risk (Abramovits 2008; Belloni 2005; Patrizi 2008) | 3 | 163 | 91 | ‐2.25 (‐3.83 to ‐0.68) | 95% | P = 0.005 |
| Unclear risk (Boguniewicz 2008) | 1 | 72 | 70 | ‐3.80 (‐4.36 to ‐3.24) | NA | P < 0.00001 |
| Blinding of participants and personnel | ||||||
| Low risk (Abramovits 2008; Belloni 2005; Patrizi 2008) | 3 | 163 | 91 | ‐2.25 (‐3.83 to ‐0.68) | 95% | P = 0.005 |
| Unclear risk (Boguniewicz 2008) | 1 | 72 | 70 | ‐3.80 (‐4.36 to ‐3.24) | NA | P < 0.00001 |
| Blinding of outcome assessment | ||||||
| Low risk (Abramovits 2008; Belloni 2005; Patrizi 2008) | 3 | 163 | 91 | ‐2.25 (‐3.83 to ‐0.68) | 95% | P = 0.005 |
| Unclear risk (Boguniewicz 2008) | 1 | 72 | 70 | ‐3.80 (‐4.36 to ‐3.24) | NA | P < 0.00001 |
| Incomplete outcome data | ||||||
| Low risk (Belloni 2005; Boguniewicz 2008; Patrizi 2008) | 3 | 106 | 104 | ‐2.33 (‐4.13 to ‐0.52) | 97% | P = 0.01 |
| High risk ((Abramovits 2008) | 1 | 129 | 57 | ‐3.70 (‐4.66 to ‐2.74) | NA | P < 0.00001 |
| Selective reporting | ||||||
| Low risk (all trials) | 4 | 235 | 161 | ‐2.65 (‐4.21 to ‐1.09) | 97% | P = 0.0008 |
| Other bias | ||||||
| Low risk (all trials) | 4 | 235 | 161 | ‐2.65 (‐4.21 to ‐1.09) | 97% | P = 0.0008 |
| Change from baseline in EASI | ||||||
| Variable | Number of studies | Number of participants in Atopiclair group | Number of participants in vehicle group | MD (95% CI) | Heterogeneity I² | P value |
| All trials (Abramovits 2008; Belloni 2005; Boguniewicz 2008; Patrizi 2008) | 4 | 251 | 175 | ‐4.00 (‐5.42 to ‐2.57) | 51% | P < 0.00001 |
| Sequence generation | ||||||
| Low risk (all trials) | 4 | 251 | 175 | ‐4.00 (‐5.42 to ‐2.57) | 51% | P < 0.00001 |
| Allocation concealment | ||||||
| Low risk Abramovits 2008; Belloni 2005; Patrizi 2008) | 3 | 179 | 105 | ‐3.36 (‐4.47 to ‐2.25) | 0% | P < 0.00001 |
| Unclear risk (Boguniewicz 2008) | 1 | 72 | 70 | ‐5.99 (‐7.85 to ‐4.13) | NA | P < 0.00001 |
| Blinding of participants and personnel | ||||||
| Low risk Abramovits 2008; Belloni 2005; Patrizi 2008) | 3 | 179 | 105 | ‐3.36 (‐4.47 to ‐2.25) | 0% | P < 0.00001 |
| Unclear risk (Boguniewicz 2008) | 1 | 72 | 70 | ‐5.99 (‐7.85 to ‐4.13) | NA | P < 0.00001 |
| Blinding of outcome assessment | ||||||
| Low risk Abramovits 2008; Belloni 2005; Patrizi 2008) | 3 | 179 | 105 | ‐3.36 (‐4.47 to ‐2.25) | 0% | P < 0.00001 |
| Unclear risk (Boguniewicz 2008) | 1 | 72 | 70 | ‐5.99 (‐7.85 to ‐4.13) | NA | P < 0.00001 |
| Incomplete outcome data | ||||||
| Low risk (Belloni 2005) | 1 | 15 | 15 | ‐3.30 (‐5.67 to ‐0.93) | NA | P = 0.006 |
| Unclear risk (Boguniewicz 2008; Patrizi 2008) | 2 | 91 | 89 | ‐4.42 (‐7.73 to ‐1.10) | 77% | P = 0.009 |
| High risk (Abramovits 2008) | 1 | 145 | 71 | ‐3.62 (‐5.06 to ‐2.18) | NA | P < 0.0001 |
| Selective reporting | ||||||
| Low risk (all trials) | 4 | 251 | 175 | ‐4.00 (‐5.42 to ‐2.57) | 51% | P < 0.00001 |
| Other bias | ||||||
| Low risk (all trials) | 4 | 251 | 175 | ‐4.00 (‐5.42 to ‐2.57) | 51% | P < 0.00001 |
| OAT‐CONTAINING MOISTURISERS VERSUS VEHICLE OR NO TREATMENT (NO MOISTURISER) | ||||||
| Change from baseline in disease severity as assessed by the investigators (EASI and SCORAD) | ||||||
| Variable | Number of studies | Number of participants in oat‐containing moisturiser group | Number of participants in control group | SMD (95% CI) | Heterogeneity I² | P value |
| All trials (Giordano‐Labadie 2006; Grimalt 2007; Nebus 2009) | 3 | 138 | 134 | ‐0.23 (‐0.66 to 0.21) | 65% | P = 0.30 |
| Sequence generation | ||||||
| Low risk (all trials) | 3 | 138 | 134 | ‐0.23 (‐0.66 to 0.21) | 65% | P = 0.30 |
| Allocation concealment | ||||||
| Low risk (all trials) | 3 | 138 | 134 | ‐0.23 (‐0.66 to 0.21) | 65% | P = 0.30 |
| Blinding of participants and personnel | ||||||
| Low risk (Nebus 2009) | 1 | 25 | 25 | 0.01 (‐0.55 to 0.56) | NA | P = 0.98 |
| High risk (Giordano‐Labadie 2006; Grimalt 2007) | 2 | 113 | 109 | ‐0.33 (‐0.98 to 0.32) | 81% | P = 0.32 |
| Blinding of outcome assessment | ||||||
| Low risk (Nebus 2009) | 1 | 25 | 25 | 0.01 (‐0.55 to 0.56) | NA | P = 0.98 |
| High risk (Giordano‐Labadie 2006; Grimalt 2007) | 2 | 113 | 109 | ‐0.33 (‐0.98 to 0.32) | 81% | P = 0.32 |
| Incomplete outcome data | ||||||
| Low risk (Giordano‐Labadie 2006; Nebus 2009) | 2 | 60 | 64 | ‐0.36 (‐1.03 to 0.32) | 71% | P = 0.30 |
| High risk (Grimalt 2007) | 1 | 78 | 70 | ‐0.02 (‐0.35 to 0.30) | NA | P = 0.98 |
| Selective reporting | ||||||
| Low risk (all trials) | 3 | 138 | 134 | ‐0.23 (‐0.66 to 0.21) | 65% | P = 0.30 |
| Other bias | ||||||
| Low risk (all trials) | 3 | 138 | 134 | ‐0.23 (‐0.66 to 0.21) | 65% | P = 0.30 |
| Effect | ||||||
| No difference (Grimalt 2007; Nebus 2009) | 2 | 103 | 95 | ‐0.02 (‐0.29 to 0.26) | 0% | P = 0.91 |
| Difference in favour of oat‐containing moisturiser (Giordano‐Labadie 2006) | 1 | 35 | 39 | ‐0.69 (‐1.16 to ‐0.22) | NA | P = 0.004 |
| Change from baseline in quality of life | ||||||
| Variable | Number of studies | Number of participants in oat‐containing moisturiser group | Number of participants in control group | SMD (95% CI) | Heterogeneity I² | P value |
| All trials (Giordano‐Labadie 2006; Grimalt 2007; Nebus 2009) | 3 | 110 | 116 | ‐0.09 (‐0.37 to 0.19) | 12% | P = 0.53 |
| Sequence generation | ||||||
| Low risk (all trials) | 3 | 110 | 116 | ‐0.09 (‐0.37 to 0.19) | 12% | P = 0.53 |
| Allocation concealment | ||||||
| Low risk (all trials) | 3 | 110 | 116 | ‐0.09 (‐0.37 to 0.19) | 12% | P = 0.53 |
| Blinding of participants and personnel | ||||||
| Low risk (Nebus 2009) | 1 | 25 | 25 | 0.10 (‐0.46 to 0.65) | NA | P = 0.74 |
| High risk (Giordano‐Labadie 2006; Grimalt 2007) | 2 | 85 | 91 | ‐0.16 (‐0.55 to 0.24) | 42% | P = 0.44 |
| Blinding of outcome assessment | ||||||
| Low risk (Nebus 2009) | 1 | 25 | 25 | 0.10 (‐0.46 to 0.65) | NA | P = 0.74 |
| High risk (Giordano‐Labadie 2006; Grimalt 2007) | 2 | 85 | 91 | ‐0.16 (‐0.55 to 0.24) | 42% | P = 0.44 |
| Incomplete outcome data | ||||||
| Low risk (Giordano‐Labadie 2006; Nebus 2009) | 2 | 60 | 64 | ‐0.17 (‐0.63 to 0.29) | 39% | P = 0.48 |
| High risk (Grimalt 2007) | 1 | 50 | 52 | 0.03 (‐0.36 to 0.41) | NA | P = 0.89 |
| Selective reporting | ||||||
| Low risk (all trials) | 3 | 110 | 116 | ‐0.09 (‐0.37 to 0.19) | 12% | P = 0.53 |
| Other bias | ||||||
| Low risk (all trials) | 3 | 110 | 116 | ‐0.09 (‐0.37 to 0.19) | 12% | P = 0.53 |
| ALL MOISTURISERS VERSUS VEHICLE TO PLACEBO OR NO MOISTURISER | ||||||
| Number of participants who considered their skin to have improved | ||||||
| Variable | Number of studies | Number of participants in moisturiser group | Number of participants in control group | RR (95% CI) | Heterogeneity I² | P value |
| All studies (Abramovits 2008; Belloni 2005; Boguniewicz 2008; Lodén 2002; Nebus 2009) | 5 | 323 | 249 | 2.46 (1.16 to 5.23) | 95% | P = 0.02 |
| Sequence generation | ||||||
| Low risk (Abramovits 2008; Belloni 2005; Boguniewicz 2008; Nebus 2009 | 4 | 257 | 183 | 3.10 (0.98 to 9.82) | 95% | P = 0.05 |
| Unclear risk (Lodén 2002) | 1 | 66 | 66 | 1.24 (1.03 to 1.49) | NA | P = 0.02 |
| Allocation concealment | ||||||
| Low risk (Abramovits 2008; Belloni 2005; Nebus 2009) | 3 | 185 | 113 | 2.19 (0.75 to 6.39) | 95% | P = 0.15 |
| Unclear risk (Boguniewicz 2008; Lodén 2002) | 2 | 138 | 136 | 3.11 (0.25 to 38.71) | 98% | P = 0.98 |
| Blinding of participants and personnel | ||||||
| Low risk (Abramovits 2008; Belloni 2005; Nebus 2009) | 3 | 185 | 113 | 2.19 (0.75 to 6.39) | 95% | P = 0.15 |
| Unclear risk (Boguniewicz 2008; Lodén 2002) | 2 | 138 | 136 | 3.11 (0.25 to 38.71) | 98% | P = 0.98 |
| Blinding of outcome assessment | ||||||
| Low risk (Abramovits 2008; Belloni 2005; Nebus 2009) | 3 | 185 | 113 | 2.19 (0.75 to 6.39) | 95% | P = 0.15 |
| Unclear risk (Boguniewicz 2008; Lodén 2002) | 2 | 138 | 136 | 3.11 (0.25 to 38.71) | 98% | P = 0.98 |
| Incomplete outcome data | ||||||
| Low risk (Belloni 2005; Lodén 2002; Nebus 2009) | 3 | 106 | 106 | 1.23 (0.94 to 1.62) | 48% | P = 0.13 |
| Unclear risk (Boguniewicz 2008) | 1 | 72 | 70 | 8.06 (3.95 to 16.42) | NA | P < 0.00001 |
| High risk (Abramovits 2008) | 1 | 145 | 73 | 3.02 (2.00 to 4.56) | NA | P < 0.00001 |
| Selective reporting | ||||||
| Low risk (all trials) | 5 | 323 | 249 | 2.46 (1.16 to 5.23) | 95% | P = 0.02 |
| Other bias | ||||||
| Low risk (all trials) | 5 | 323 | 249 | 2.46 (1.16 to 5.23) | 95% | P = 0.02 |
| Change from baseline in itch | ||||||
| Variable | Number of studies | Number of participants in moisturiser group | Number of participants in control group | SMD (95% CI) | Heterogeneity I² | P value |
| All studies (Abramovits 2008; Belloni 2005; Boguniewicz 2008; Boralevi 2014; Nebus 2009; Patrizi 2008; Patrizi 2014) | 7 | 412 | 337 | ‐1.10 (‐1.83 to ‐0.38) | 94% | P = 0.003 |
| Sequence generation | ||||||
| Low risk (all trials) | 7 | 412 | 337 | ‐1.10 (‐1.83 to ‐0.38) | 94% | P = 0.003 |
| Allocation concealment | ||||||
| Low risk (Abramovits 2008; Belloni 2005; Boralevi 2014; Nebus 2009; Patrizi 2008; Patrizi 2014) | 6 | 340 | 267 | ‐0.89 (‐1.56 to ‐0.23) | 91% | P = 0.009 |
| Unclear risk (Boguniewicz 2008) | 1 | 72 | 70 | ‐2.22 (‐2.64 to ‐1.80) | NA | P < 0.00001 |
| Blinding of participants and personnel | ||||||
| Low risk (Abramovits 2008; Belloni 2005; Boralevi 2014; Nebus 2009; Patrizi 2008) | 5 | 312 | 241 | ‐0.98 (‐1.79 to ‐0.18) | 93% | P < 0.00001 |
| Unclear risk (Boguniewicz 2008) | 1 | 72 | 70 | ‐2.22 (‐2.64 to ‐1.80) | NA | P < 0.00001 |
| High risk (Patrizi 2014) | 1 | 28 | 26 | ‐0.52 (‐1.06 to 0.03) | NA | P = 0.06 |
| Blinding of outcome assessment | ||||||
| Low risk (Abramovits 2008; Belloni 2005; Boralevi 2014; Nebus 2009; Patrizi 2008) | 5 | 312 | 241 | ‐0.98 (‐1.79 to ‐0.18) | 93% | P < 0.00001 |
| Unclear risk (Boguniewicz 2008) | 1 | 72 | 70 | ‐2.22 (‐2.64 to ‐1.80) | NA | P < 0.00001 |
| High risk (Patrizi 2014) | 1 | 28 | 26 | ‐0.52 (‐1.06 to 0.03) | NA | P = 0.06 |
| Incomplete outcome data | ||||||
| Low risk (Belloni 2005; Boralevi 2014; Nebus 2009; Patrizi 2014) | 4 | 192 | 191 | ‐0.38 (‐0.94 to 0.17) | 80% | P = 0.18 |
| Unclear risk (Boguniewicz 2008; Patrizi 2008) | 2 | 91 | 89 | ‐2.29 (‐2.67 to ‐1.91) | 0% | P < 0.00001 |
| High risk (Abramovits 2008) | 1 | 129 | 57 | ‐1.33 (‐1.67 to ‐0.99) | NA | P < 0.00001 |
| Selective reporting | ||||||
| Low risk (all trials) | 7 | 412 | 337 | ‐1.10 (‐1.83 to ‐0.38) | 94% | P = 0.003 |
| Other bias | ||||||
| Low risk (all trials) | 7 | 412 | 337 | ‐1.10 (‐1.83 to ‐0.38) | 94% | P = 0.003 |
| Number of participants who expressed treatment satisfaction | ||||||
| Variable | Number of studies | Number of participants in moisturiser group | Number of participants in control group | RR (95% CI) | Heterogeneity I² | P value |
| All trials (Abramovits 2008; Belloni 2005; Nebus 2009) | 3 | 185 | 113 | 1.35 (0.77 to 2.36) | 83% | P = 0.29 |
| Sequence generation | ||||||
| Low risk (all trials) | 3 | 185 | 113 | 1.35 (0.77 to 2.36) | 83% | P = 0.29 |
| Allocation concealment | ||||||
| Low risk (all trials) | 3 | 185 | 113 | 1.35 (0.77 to 2.36) | 83% | P = 0.29 |
| Blinding of participants and personnel | ||||||
| Low risk (all trials) | 3 | 185 | 113 | 1.35 (0.77 to 2.36) | 83% | P = 0.29 |
| Blinding of outcome assessment | ||||||
| Low risk (all trials) | 3 | 185 | 113 | 1.35 (0.77 to 2.36) | 83% | P = 0.29 |
| Incomplete outcome data | ||||||
| Low risk (Belloni 2005; Nebus 2009) | 2 | 40 | 40 | 1.04 (0.77 to 1.42) | 0% | P = 0.79 |
| High risk (Abramovits 2008) | 1 | 145 | 73 | 2.14 (1.58 to 2.89) | NA | P < 0.00001 |
| Selective reporting | ||||||
| Low risk (all trials) | 3 | 185 | 113 | 1.35 (0.77 to 2.36) | 83% | P = 0.29 |
| Other bias | ||||||
| Low risk (all trials) | 3 | 185 | 113 | 1.35 (0.77 to 2.36) | 83% | P = 0.29 |
| Number of participants who reported an adverse event | ||||||
| Variable | Number of studies | Number of participants in moisturiser group | Number of participants in control group | RR (95% CI) | Heterogeneity I² | P value |
| All trials (Abramovits 2008; Belloni 2005; Boguniewicz 2008; Boralevi 2014; Gayraud 2015; Grimalt 2007; Korting 2010; Lodén 2002; Patrizi 2008; Tan 2010) | 10 | 680 | 595 | 1.03 (0.82 to 1.30) | 21% | P = 0.80 |
| Sequence generation | ||||||
| Low risk (Abramovits 2008; Belloni 2005; Boguniewicz 2008; Boralevi 2014; Gayraud 2015; Grimalt 2007; Korting 2010; Patrizi 2008; Tan 2010) | 9 | 614 | 529 | 0.96 (0.74 to 1.24) | 16% | P = 0.76 |
| Unclear risk (Lodén 2002) | 1 | 66 | 66 | 1.31 (0.89 to 1.91) | NA | P = 0.17 |
| Allocation concealment | ||||||
| Low risk ((Abramovits 2008; Belloni 2005; Boralevi 2014; Gayraud 2015; Grimalt 2007; Korting 2010; Patrizi 2008; Tan 2010) | 7 | 491 | 411 | 1.00 (0.65 to 1.55) | 35% | P = 0.99 |
| Unclear risk (Boguniewicz 2008; Korting 2010; Lodén 2002) | 3 | 189 | 184 | 1.08 (0.82 to 1.43) | 15% | P = 0.59 |
| Blinding of participants and personnel | ||||||
| Low risk (Abramovits 2008; Belloni 2005; Boralevi 2014; Gayraud 2015; Patrizi 2008; Tan 2010) | 6 | 400 | 329 | 0.94 (0.72 to 1.24) | 0% | P = 0.67 |
| Unclear risk (Boguniewicz 2008; Lodén 2002) | 2 | 138 | 136 | 1.11 (0.83 to 1.48) | 26% | P = 0.49 |
| High risk (Grimalt 2007; Korting 2010) | 2 | 142 | 130 | 2.27 (0.06 to 90.70) | 80% | P = 0.66 |
| Blinding of outcome assessment | ||||||
| Low risk (Abramovits 2008; Belloni 2005; Boralevi 2014; Gayraud 2015; Patrizi 2008; Tan 2010) | 6 | 400 | 329 | 0.94 (0.72 to 1.24) | 0% | P = 0.67 |
| Unclear risk (Boguniewicz 2008; Lodén 2002) | 2 | 138 | 136 | 1.11 (0.83 to 1.48) | 26% | P = 0.49 |
| High risk (Grimalt 2007; Korting 2010) | 2 | 142 | 130 | 2.27 (0.06 to 90.70) | 80% | P = 0.66 |
| Incomplete outcome data | ||||||
| Low risk (Belloni 2005; Boralevi 2014; Gayraud 2015; Korting 2010; Lodén 2002; Tan 2010) | 6 | 352 | 350 | 0.99 (0.70 to 1.40) | 23% | P = 0.96 |
| Unclear risk (Boguniewicz 2008; Patrizi 2008) | 2 | 92 | 90 | 0.95 (0.69 to 1.30) | 0% | P = 0.73 |
| High risk (Abramovits 2008; Grimalt 2007) | 2 | 236 | 155 | 3.04 (0.24 to 38.72) | 71% | P = 0.39 |
| Selective reporting | ||||||
| Low risk (all trials) | 10 | 680 | 595 | 1.03 (0.82 to 1.30) | 21% | P = 0.80 |
| Other bias | ||||||
| Low risk (all trials) | 10 | 680 | 595 | 1.03 (0.82 to 1.30) | 21% | P = 0.80 |
| Change in disease severity as assessed by the investigators | ||||||
| Variable | Number of studies | Number of participants in moisturiser group | Number of participants in control group | SMD (95% CI) | Heterogeneity I² | P value |
| All studies (Abramovits 2008; Belloni 2005; Boguniewicz 2008; Boralevi 2014; Gayraud 2015; Giordano‐Labadie 2006; Grimalt 2007; Korting 2010; Nebus 2009; Patrizi 2008; Patrizi 2014; Tan 2010) | 12 | 683 | 598 | ‐0.65 (‐0.89 to ‐0.41) | 75% | P < 0.00001 |
| Sequence generation | ||||||
| Low risk (all trials) | 12 | 683 | 598 | ‐0.65 (‐0.89 to ‐0.41) | 75% | P < 0.00001 |
| Allocation concealment | ||||||
| Low risk (Abramovits 2008; Belloni 2005; Boralevi 2014; Gayraud 2015; Giordano‐Labadie 2006; Grimalt 2007; Nebus 2009; Patrizi 2008; Patrizi 2014; Tan 2010) | 10 | 561 | 481 | ‐0.53 (‐0.76 to ‐0.30) | 66% | P = 0.009 |
| Unclear risk (Boguniewicz 2008; Korting 2010) | 2 | 122 | 117 | ‐1.15 (‐1.43 to ‐0.88) | 0% | P < 0.00001 |
| Blinding of participants and personnel | ||||||
| Low risk (Abramovits 2008; Belloni 2005; Boralevi 2014; Gayraud 2015; Nebus 2009; Patrizi 2008; Tan 2010) | 7 | 420 | 346 | ‐0.53 (‐0.77 to ‐0.30) | 52% | P < 0.00001 |
| Unclear risk (Boguniewicz 2008) | 1 | 72 | 70 | ‐1.04 (‐1.39 to ‐0.69) | NA | P < 0.00001 |
| High risk ( Giordano‐Labadie 2006; Grimalt 2007; Korting 2010; Patrizi 2014) | 4 | 191 | 182 | ‐0.77 (‐1.41 to ‐0.12) | 88% | P = 0.02 |
| Blinding of outcome assessment | ||||||
| Low risk (Abramovits 2008; Belloni 2005; Boralevi 2014; Gayraud 2015; Nebus 2009; Patrizi 2008; Tan 2010) | 7 | 420 | 346 | ‐0.53 (‐0.77 to ‐0.30) | 52% | P < 0.00001 |
| Unclear risk (Boguniewicz 2008) | 1 | 72 | 70 | ‐1.04 (‐1.39 to ‐0.69) | NA | P < 0.00001 |
| High risk (Giordano‐Labadie 2006; Grimalt 2007; Korting 2010; Patrizi 2014) | 4 | 191 | 182 | ‐0.77 (‐1.41 to ‐0.12) | 88% | P = 0.02 |
| Incomplete outcome data | ||||||
| Low risk (Belloni 2005; Boralevi 2014; Gayraud 2015; Giordano‐Labadie 2006; Korting 2010; Nebus 2009; Patrizi 2014; Tan 2010 | 8 | 369 | 368 | ‐0.66 (‐0.96 to ‐0.36) | 71% | P < 0.0001 |
| Unclear risk (Boguniewicz 2008; Patrizi 2008) | 2 | 91 | 89 | ‐0.93 (‐1.29 to ‐0.57) | 17% | P < 0.00001 |
| High risk (Abramovits 2008; Grimalt 2007) | 2 | 223 | 141 | ‐0.41 (‐1.17 to 0.35) | 92% | P = 0.29 |
| Selective reporting | ||||||
| Low risk (all trials) | 12 | 683 | 598 | ‐0.65 (‐0.89 to ‐0.41) | 75% | P < 0.00001 |
| Other bias | ||||||
| Low risk (all trials) | 12 | 683 | 598 | ‐0.65 (‐0.89 to ‐0.41) | 75% | P < 0.00001 |
| Number of participants who experienced a flare | ||||||
| Variable | Number of studies | Number of participants in moisturiser group | Number of participants in control group | RR (95% CI) | Heterogeneity I² | P value |
| All studies (Abramovits 2008; Boguniewicz 2008; Gayraud 2015; Patrizi 2008; Weber 2015; Wirén 2009) | 6 | 341 | 266 | 0.33 (0.17 to 0.62) | 73% | P = 0.0006 |
| Sequence generation | ||||||
| Low risk (all trials) | 6 | 341 | 266 | 0.33 (0.17 to 0.62) | 73% | P = 0.0006 |
| Allocation concealment | ||||||
| Low risk (Abramovits 2008; Gayraud 2015; Patrizi 2008; Weber 2015; Wirén 2009) | 5 | 269 | 196 | 0.33 (0.15 to 0.71) | 78% | P = 0.005 |
| Unclear risk (Boguniewicz 2008) | 1 | 72 | 70 | 0.29 (0.12 to 0.68) | NA | P = 0.005 |
| Blinding of participants and personnel | ||||||
| Low risk (Abramovits 2008; Gayraud 2015; Patrizi 2008) | 3 | 227 | 151 | 0.27 (0.06 to 1.20) | 89% | P = 0.09 |
| Unclear risk (Boguniewicz 2008) | 1 | 72 | 70 | 0.29 (0.12 to 0.68) | NA | P = 0.005 |
| High risk (Weber 2015; Wirén 2009) | 2 | 42 | 45 | 0.40 (0.23 to 0.70) | 0% | P = 0.001 |
| Blinding of outcome assessment | ||||||
| Low risk (Abramovits 2008; Gayraud 2015; Patrizi 2008) | 3 | 227 | 151 | 0.27 (0.06 to 1.20) | 89% | P = 0.09 |
| Unclear risk (Boguniewicz 2008) | 1 | 72 | 70 | 0.29 (0.12 to 0.68) | NA | P = 0.005 |
| High risk (Weber 2015; Wirén 2009) | 2 | 42 | 45 | 0.40 (0.23 to 0.70) | 0% | P = 0.001 |
| Incomplete outcome data | ||||||
| Low risk (Gayraud 2015; Weber 2015; Wirén 2009) | 3 | 104 | 106 | 0.54 (0.31 to 0.92) | 47% | P = 0.02 |
| Unclear risk (Boguniewicz 2008; Patrizi 2008) | 2 | 92 | 89 | 0.26 (0.12 to 0.57) | 0% | P = 0.0007 |
| High risk (Abramovits 2008) | 1 | 145 | 71 | 0.14 (0.07 to 0.28) | NA | P < 0.00001 |
| Selective reporting | ||||||
| Low risk (all trials) | 6 | 341 | 266 | 0.33 (0.17 to 0.62) | 73% | P = 0.0006 |
| Other bias | ||||||
| Low risk (all trials) | 6 | 341 | 266 | 0.33 (0.17 to 0.62) | 73% | P = 0.0006 |
| Change from baseline in quality of life | ||||||
| Variable | Number of studies | Number of participants in moisturiser group | Number of participants in control group | SMD (95% CI) | Heterogeneity I² | P value |
| All trials (Gayraud 2015; Giordano‐Labadie 2006; Grimalt 2007) | 3 | 146 | 154 | ‐0.39 (‐0.90 to 0.12) | 79% | P = 0.13 |
| Sequence generation | ||||||
| Low risk (all trials) | 3 | 146 | 154 | ‐0.39 (‐0.90 to 0.12) | 79% | P = 0.13 |
| Allocation concealment | ||||||
| Low risk (all trials) | 3 | 146 | 154 | ‐0.39 (‐0.90 to 0.12) | 79% | P = 0.13 |
| Blinding of participants and personnel | ||||||
| Low risk (Gayraud 2015) | 1 | 62 | 61 | ‐0.81 (‐1.18 to ‐0.44) | NA | P < 0.0001 |
| High risk (Giordano‐Labadie 2006; Grimalt 2007) | 2 | 84 | 93 | ‐0.15 (‐0.55 to 0.24) | 42% | P = 0.44 |
| Blinding of outcome assessment | ||||||
| Low risk (Gayraud 2015) | 1 | 62 | 61 | ‐0.81 (‐1.18 to ‐0.44) | NA | P < 0.0001 |
| High risk (Giordano‐Labadie 2006; Grimalt 2007) | 2 | 84 | 93 | ‐0.15 (‐0.55 to 0.24) | 42% | P = 0.44 |
| Incomplete outcome data | ||||||
| Low risk (Gayraud 2015; Giordano‐Labadie 2006) | 2 | 97 | 100 | ‐0.62 (‐1.04 to ‐0.19) | 52% | P = 0.004 |
| High risk (Grimalt 2007) | 1 | 49 | 54 | 0.03 (‐0.36 to 0.41) | NA | P = 0.89 |
| Selective reporting | ||||||
| Low risk (all trials) | 3 | 146 | 154 | ‐0.39 (‐0.90 to 0.12) | 79% | P = 0.13 |
| Other bias | ||||||
| Low risk (all trials) | 3 | 146 | 154 | ‐0.39 (‐0.90 to 0.12) | 79% | P = 0.13 |
| LICOCHALCONE‐CONTAINING MOISTURISERS VERSUS HYDROCORTISONE ACETATE 1% CREAM | ||||||
| Change from baseline in disease severity as assessed by the investigators (SCORAD) | ||||||
| Variable | Number of studies | Number of participants in licochalcone group | Number of participants in hydrocortisone group | MD (95% CI) | Heterogeneity I² | P value |
| All trials (Angelova‐Fischer 2014; Udompataikul 2011; Wanakul 2013) | 3 | 96 (within‐participant) | 96 (within‐participant) | 0.08 (‐1.96 to 2.13) | 85% | P = 0.94 |
| Sequence generation | ||||||
| Low risk (Angelova‐Fischer 2014; Wanakul 2013) | 2 | 70 (within‐participant) | 70 (within‐participant) | ‐0.90 (‐2.85 to 1.05) | 82% | P = 0.32 |
| Unclear risk (Udompataikul 2011) | 1 | 26 (within‐participant) | 26 (within‐participant) | 2.57 (0.59 to 4.55) | NA | P = 0.01 |
| Blinding of participants and personnel | ||||||
| Low risk (Wanakul 2013) | 1 | 52 (within‐participant) | 52 (within‐participant) | ‐2.00 (‐3.47 to ‐0.53) | NA | P = 0.008 |
| Unclear risk (Angelova‐Fischer 2014; Udompataikul 2011) | 2 | 44 (within‐participant) | 44 (within‐participant) | 1.12 (‐1.38 to 3.61) | 82% | P = 0.38 |
| Blinding of outcome assessment | ||||||
| Low risk (Wanakul 2013) | 1 | 52 (within‐participant) | 52 (within‐participant) | ‐2.00 (‐3.47 to ‐0.53) | NA | P = 0.008 |
| High risk (Angelova‐Fischer 2014; Udompataikul 2011) | 2 | 44 (within‐participant) | 44 (within‐participant) | 1.12 (‐1.38 to 3.61) | 82% | P = 0.38 |
| Incomplete outcome data | ||||||
| Low risk (Angelova‐Fischer 2014; Wanakul 2013) | 2 | 70 (within‐participant) | 70 (within‐participant) | ‐0.90 (‐2.85 to 1.05) | 82% | P = 0.32 |
| Unclear risk (Udompataikul 2011) | 1 | 26 (within‐participant) | 26 (within‐participant) | 2.57 (0.59 to 4.55) | NA | P = 0.01 |
| Selective reporting | ||||||
| All studies | 3 | 96 (within‐participant) | 96 (within‐participant) | 0.08 (‐1.96 to 2.13) | 85% | P = 0.94 |
| Other bias | ||||||
| All studies | 3 | 96 (within‐participant) | 96 (within‐participant) | 0.08 (‐1.96 to 2.13) | 85% | P = 0.94 |
| VEHICLE TREATMENT + MOISTURISER VERSUS FLUTICASONE TREATMENT TWICE WEEKLY + MOISTURISER | ||||||
| Number of participants reporting an adverse event | ||||||
| Variable | Number of studies | Number of participants in vehicle + moisturiser group | Number of participants in fluticasone propionate + moisturiser group | RR (95% CI) | Heterogeneity I² | P value |
| All studies (Berth‐Jones 2003 (2 studies); Glazenburg 2009; Hanifin 2002) | 4 | 312 | 406 | 0.51 (0.22 to 1.14) | 67% | P = 0.10 |
| Sequence generation | ||||||
| Low risk (Berth‐Jones 2003 (2 studies); Glazenburg 2009) | 3 | 193 | 177 | 0.30 (0.12 to 0.73) | NA | P = 0.008 |
| Unclear risk (Hanifin 2002) | 1 | 119 | 229 | 0.70 (0.48 to 1.04) | NA | P = 0.08 |
| Allocation concealment | ||||||
| Low risk (Berth‐Jones 2003 (2 studies)) | 2 | 157 | 138 | Not estimable | NA | NA |
| Unclear risk (Glazenburg 2009; Hanifin 2002) | 2 | 155 | 268 | 0.51 (0.22 to 1.14) | 67% | P = 0.10 |
| Blinding of participants and personnel | ||||||
| Low risk (Berth‐Jones 2003 (2 studies)) | 2 | 157 | 138 | Not estimable | NA | NA |
| Unclear risk (Glazenburg 2009; Hanifin 2002) | 2 | 155 | 268 | 0.51 (0.22 to 1.14) | 67% | P = 0.10 |
| Blinding of outcome assessment | ||||||
| Low risk (Berth‐Jones 2003 (2 studies)) | 2 | 157 | 138 | Not estimable | NA | NA |
| Unclear risk (Glazenburg 2009; Hanifin 2002) | 2 | 155 | 268 | 0.51 (0.22 to 1.14) | 67% | P = 0.10 |
| Incomplete outcome data | ||||||
| Unclear risk (all studies) | 4 | 312 | 406 | 0.51 (0.22 to 1.14) | 67% | P = 0.10 |
| Selective reporting | ||||||
| Low risk (all studies) | 4 | 312 | 406 | 0.51 (0.22 to 1.14) | 67% | P = 0.10 |
| Other bias | ||||||
| Low risk (all studies) | 4 | 312 | 406 | 0.51 (0.22 to 1.14) | 67% | P = 0.10 |
| Number of participants experiencing a flare | ||||||
| Variable | Number of studies | Number of participants in vehicle + moisturiser group | Number of participants in fluticasone propionate + moisturiser group | RR (95% CI) | Heterogeneity I² | P value |
| All studies (Berth‐Jones 2003 (2 studies); Glazenburg 2009; Hanifin 2002) | 4 | 312 | 406 | 2.17 (1.51 to 3.11) | 74% | P < 0.0001 |
| Sequence generation | ||||||
| Low risk (Berth‐Jones 2003 (2 studies); Glazenburg 2009) | 3 | 193 | 177 | 2.02 (1.24 to 3.30) | 76% | P = 0.005 |
| Unclear risk (Hanifin 2002) | 1 | 119 | 229 | 2.62 (2.03 to 3.39) | NA | P < 0.00001 |
| Allocation concealment | ||||||
| Low risk (Berth‐Jones 2003 (2 studies)) | 2 | 157 | 138 | 2.17 (0.88 to 5.37) | 88% | P = 0.09 |
| Unclear risk (Glazenburg 2009; Hanifin 2002) | 2 | 155 | 268 | 2.27 (1.62 to 3.19) | 54% | P < 0.00001 |
| Blinding of participants and personnel | ||||||
| Low risk (Berth‐Jones 2003 (2 studies)) | 2 | 157 | 138 | 2.17 (0.88 to 5.37) | 88% | P = 0.09 |
| Unclear risk (Glazenburg 2009; Hanifin 2002) | 2 | 155 | 268 | 2.27 (1.62 to 3.19) | 54% | P < 0.00001 |
| Blinding of outcome assessment | ||||||
| Low risk (Berth‐Jones 2003 (2 studies)) | 2 | 157 | 138 | 2.17 (0.88 to 5.37) | 88% | P = 0.09 |
| Unclear risk (Glazenburg 2009; Hanifin 2002) | 2 | 155 | 268 | 2.27 (1.62 to 3.19) | 54% | P < 0.00001 |
| Incomplete outcome data | ||||||
| Unclear risk (all studies) | 4 | 312 | 406 | 2.17 (1.51 to 3.11) | 74% | P < 0.0001 |
| Selective reporting | ||||||
| Low risk (all studies) | 4 | 312 | 406 | 2.17 (1.51 to 3.11) | 74% | P < 0.0001 |
| Other bias | ||||||
| Low risk (all studies) | 4 | 312 | 406 | 2.17 (1.51 to 3.11) | 74% | P < 0.0001 |
| Hazard ratio for rate of flare | ||||||
| Variable | Number of studies | Number of participants in fluticasone propionate + moisturiser group | Number of participants in vehicle + moisturiser group | HR (95% CI) | Heterogeneity I² | P value |
| All studies (Berth‐Jones 2003 (2 studies); Glazenburg 2009; Hanifin 2002) | 4 | 406 | 312 | 3.69 (1.80 to 7.55) | 85% | P = 0.0004 |
| Sequence generation | ||||||
| Low risk (Berth‐Jones 2003 (2 studies); Glazenburg 2009) | 3 | 177 | 193 | 2.84 (1.44 to 5.61) | 76% | P = 0.003 |
| Unclear risk (Hanifin 2002) | 1 | 229 | 119 | 7.70 (4.62 to 12.84) | NA | P < 0.00001 |
| Allocation concealment | ||||||
| Low risk (Berth‐Jones 2003 (2 studies)) | 2 | 138 | 157 | 3.26 (1.09 to 9.74) | 87% | P = 0.03 |
| Unclear risk (Glazenburg 2009; Hanifin 2002) | 2 | 268 | 155 | 4.16 (1.21 to 14.31) | 89% | P = 0.02 |
| Blinding of participants and personnel | ||||||
| Low risk (Berth‐Jones 2003 (2 studies)) | 2 | 138 | 157 | 3.26 (1.09 to 9.74) | 87% | P = 0.03 |
| Unclear risk (Glazenburg 2009; Hanifin 2002) | 2 | 268 | 155 | 4.16 (1.21 to 14.31) | 89% | P = 0.02 |
| Blinding of outcome assessment | ||||||
| Low risk (Berth‐Jones 2003 (2 studies)) | 2 | 138 | 157 | 3.26 (1.09 to 9.74) | 87% | P = 0.03 |
| Unclear risk (Glazenburg 2009; Hanifin 2002) | 2 | 268 | 155 | 4.16 (1.21 to 14.31) | 89% | P = 0.02 |
| Incomplete outcome data | ||||||
| Unclear risk (all studies ) | 4 | 406 | 312 | 3.69 (1.80 to 7.55) | 85% | P = 0.0004 |
| Selective reporting | ||||||
| Low risk (all studies) | 4 | 406 | 312 | 3.69 (1.80 to 7.55) | 85% | P = 0.0004 |
| Other bias | ||||||
| Low risk (all studies) | 4 | 406 | 312 | 3.69 (1.80 to 7.55) | 85% | P = 0.0004 |
NA not applicable; MD mean difference; SMD standardised mean difference; RR risk ratio; HR hazard ratio
Analyses are only shown when we were able to pool data of at least two studies.
(1) Moisturisers versus no treatment (i.e. no moisturiser)
Six studies (413 participants) evaluated this comparison (Giordano‐Labadie 2006; Grimalt 2007; Patrizi 2014; Simpson 2013; Weber 2015; Wirén 2009); however, in Patrizi 2014 and Weber 2015, the comparator consisted of a cleaning product only. Study duration varied from four weeks in the Patrizi 2014 and Simpson 2013 studies, to six months in the Weber 2015 and Wirén 2009 studies. Four studies were conducted in children (Giordano‐Labadie 2006; Grimalt 2007; Patrizi 2014; Weber 2015), and the other two, in adults (Simpson 2013; Wirén 2009). The participants in these studies had predominantly mild to moderate eczema.
The Simpson 2013 study, which was reported only as 'investigator‐blinded', included mainly investigator‐assessed outcomes, but because the method of blinding was not clearly specified, we judged it to be at unclear risk of bias. None of the other studies were blinded; therefore, we assessed them as being at a high risk of bias.
In Giordano‐Labadie 2006 and Grimalt 2007, application of moderate to strong topical corticosteroids was allowed in both treatment arms, whilst in Weber 2015, 'Eucerin Eczema Relief Instant Therapy' was allowed on active lesions, and Wirén 2009 allowed topical corticosteroids on areas other than the target lesions.
See also summary of findings Table 1.
Primary outcomes
Change from baseline in disease severity as assessed by the participants
This outcome was not assessed in any of the studies; however, 'itch' was evaluated in Patrizi 2014 (54 participants) on a 4‐point Likert scale (0 to 3), with a higher score indicating more severe itch. The mean change from baseline in itch in the emollient balm group (28 participants) was ‐1.24 (standard deviation (SD) 0.77) compared to ‐0.76 (SD 1.05) in the control group (26 participants), with a mean difference (MD) of ‐0.48 (95% confidence interval (CI) ‐0.97 to 0.01; P = 0.06).
Participant satisfaction
This outcome was not assessed in any of the studies.
Adverse events
Two studies reported some data on adverse events (Grimalt 2007; Simpson 2013). In Grimalt 2007, 8/91 participants reported adverse events in the active treatment group compared to 0/82 in the control group after six weeks (Peto odds ratio (OR) 7.26, 95% CI 1.76 to 29.92; P = 0.006). The P value of Fisher's Exact Test was 0.0071. Three adverse events were reported to be mild, three moderate, and two were severe, which led to treatment discontinuation. No further details were provided other than "all the adverse events spontaneously resolved without sequel." The Simpson 2013 study had a within‐participant design, in which the legs of 20 participants were randomised, and there were no treatment‐related adverse events experienced on either leg.
Secondary outcomes
Change from baseline in disease severity as assessed by the investigators
Disease severity was assessed using the SCORing Atopic Dermatitis (SCORAD) index (scale: 0 to 103, higher scores indicate worse eczema) in three studies, with a total of 276 participants (Giordano‐Labadie 2006; Grimalt 2007; Patrizi 2014). In both Giordano‐Labadie 2006 and Grimalt 2007, moderate to strong topical corticosteroids were allowed in both treatment arms, and the participants in these two studies had higher baseline SCORAD scores, which indicated more severe disease, than those in Patrizi 2014. The baseline SCORAD values in Giordano‐Labadie 2006 were 25.96 (SD 7.67) in the moisturiser group and 23.3 (SD 7.63) in the non‐treated group; in Grimalt 2007, these baseline values were 35.63 (SD 11.92) versus 35.96 (SD 10.50) and in Patrizi 2014, 11.7 (SD 3.1) versus 10.2 (SD 3.3), which explains the considerable heterogeneity observed with the pooled data. The MD between the pooled moisturiser groups and control groups was ‐2.42 (95% CI ‐4.55 to ‐0.28; P = 0.03; I² = 68%; Analysis 1.1), favouring the moisturiser group. However, the minimal important difference (MID) for the SCORAD is estimated to be 8.7 (Schram 2012), and therefore this difference, although statistically significant, is not clinically relevant. As Giordano‐Labadie 2006 and Grimalt 2007 used topical corticosteroids in both treatment arms, the SCORAD decreased in each arm in a very substantial way and met the MID in both arms (but without meeting MID between arms). Grimalt 2007 was the only study that did not show a difference between the two treatments, while the other two studies with smaller sample sizes did show a difference (although did not meet MID). However, baseline differences in eczema severity as well as the use of topical corticosteroids might be responsible for this difference. All three studies were assessed as being at an overall high risk of bias due to lack of blinding, therefore, we did not conduct sensitivity analyses for overall risk of bias. However, when we conducted further stratified analyses for the individual domains of risk of bias, our repeat analysis showed no heterogeneity following the exclusion of Grimalt 2007, which was also judged to be at high risk of bias for incomplete outcome data (MD ‐3.39, 95% CI ‐4.73 to ‐2.05; P < 0.00001; I² = 0%; Table 6).
The Simpson 2013 study, which had a within‐participant design (20 participants), used a dryness scale (0 to 4, with higher scores being worse) for assessment of this outcome. The mean change from baseline was ‐1.15 (SD 0.41) on the side treated with moisturiser versus ‐0.91 (SD 0.58) on the side that received no treatment. The mean of the paired differences was statistically significant at ‐0.24 (95% CI ‐0.42 to ‐0.06). This small difference in favour of moisturiser is unlikely to be clinically important.
Prevention of flares (lengthening the time to first flare)
Both Weber 2015 and Wirén 2009 (total of 87 participants) had a study duration of six months and assessed the efficacy of reducing the risk of flare. Combining data from the two studies, a total of 11/42 participants experienced a flare in the moisturiser group over a period of six months compared to 30/45 in the control group (risk ratio (RR) 0.40, 95% CI 0.23 to 0.70; P = 0.001; number needed to treat for an additional beneficial outcome (NNTB) = 3, 95% CI 2 to 5; Analysis 1.2). The RR showed a significant difference in favour of the moisturiser group. In both studies, the median time to flare in the moisturiser group was more than 180 days versus 28 days and 30 days for the control groups (Weber 2015 and Wirén 2009, respectively). The rate of flare in the control group was 3.74 times the rate in the moisturiser group (hazard ratio (HR) 3.74, 95% CI 1.86 to 7.50; P = 0.0002, I²= 0%; Analysis 1.3). These data indicate that with the use of moisturisers there are fewer flares, and the time to flare is lengthened.
Change in use of topical active treatment
Two of the studies in this comparison measured the amount of topical corticosteroids used (Giordano‐Labadie 2006; Grimalt 2007).
In Giordano‐Labadie 2006, data were available from 35/37 participants in the moisturiser group. The mean amount of topical corticosteroids (moderate and strong, class 2 and 3 respectively) used in the first part of the study (days 0 to 28) was 24.5 g (SD 12.51) in the moisturiser group, compared to 38 g (SD 18.63) in the control group (39 participants) (MD ‐13.50 g, 95% CI ‐20.67 to ‐6.33; P = 0.0002), which was a 35% reduction in the use of topical corticosteroids in the moisturiser group. This corresponded with a 50% reduction in SCORAD in the moisturiser group and a 48.7% reduction in SCORAD in the control group, demonstrating that the control group had to apply more topical corticosteroids to reach a similar reduction in SCORAD. From day 28 until day 56, 24.6 g (SD 9.89) was used in the moisturiser group versus 24.1 g (SD 12.85) in the control group, which is almost identical for both groups (MD 0.50 g, 95% CI ‐4.70 to 5.70; P = 0.85). The reduction in SCORAD was greater in the moisturiser group (Analysis 1.1), but the difference was not clinically relevant (see the 'Change from baseline in disease severity as assessed by the investigators' section).
In the first three weeks of the Grimalt 2007 study, 4.86 g (SD 8.57) of high‐potency topical corticosteroids was used in the moisturiser group (based on 78/91 participants) compared to 8.87 g (SD 11.46) in the control group (based on 70/82 participants) (MD ‐4.01 g, 95% CI ‐7.30 to ‐0.72; P = 0.02), which corresponds to a 45.2% reduction in the use of strong‐potency topical corticosteroids in the moisturiser group compared to the control group. The amount of moderate‐potency topical corticosteroids used was 4.66 g (SD 5.74) in the moisturiser group versus 4.91 g (SD 6.27) in the control group (MD ‐0.25 g, 95% CI ‐2.19 to 1.69; P = 0.80), which, in contrast to the use of strong‐potency topical corticosteroids, was not statistically significant. The total amount of high‐potency corticosteroids used over six weeks was 8.56 g (SD 15.37) in the moisturiser group and 14.7 g (SD 17.47) in the control group (MD ‐6.14 g, 95% CI ‐11.47 to ‐0.81; P = 0.02). Although this is a statistically significant difference, it did not hold true for the moderate‐potency topical corticosteroids, for which the amount used in the moisturiser group was 7.43 g (SD 9.98) versus 8.03 g (SD 10.29) in the control group (MD ‐0.60 g, 95% CI ‐3.87 to 2.67; P = 0.72). The amount of topical corticosteroids used from weeks three to six was not specified separately.
Analysis 1.4 is subgrouped by length of treatment. In the first few weeks, both studies showed a non‐statistically significant difference in favour of the moisturiser groups for the amount of corticosteroids used (MD ‐8.25 g, 95% CI ‐17.22 to 0.72; P = 0.07; I² = 82%), but no difference was seen in the last three to four weeks (MD 0.50 g, 95% CI ‐4.70 to 5.70) (data from Giordano‐Labadie 2006 only). However, the mean difference in the total amount of corticosteroids used over six to eight weeks was ‐9.30 g (95% CI ‐15.33 to ‐3.27; P = 0.003; I² = 68%). This is a statistically significant difference showing that the use of moisturisers decreased the need for topical corticosteroids. For this analysis in Grimalt 2007, data for both the moderate‐ and high‐potency corticosteroids were combined. The amount of total topical corticosteroids used in both treatment groups was much higher in Giordano‐Labadie 2006, which may explain the substantial heterogeneity.
Changes in skin barrier function
Three studies reported data on transepidermal water loss (TEWL) (Patrizi 2014; Simpson 2013; Wirén 2009). The Wirén 2009 study only reported that "the difference in TEWL between the groups after three weeks of maintenance treatment did not reach statistical significance." Simpson 2013 had a within‐participant design, and therefore we did not pool the data with Patrizi 2014. A reduction in TEWL score equates to an improvement in skin barrier function. In Patrizi 2014, the mean change from baseline in TEWL at day 28 was ‐12.50 g/m²/h (SD 12.81) in the moisturiser group (28 participants) compared to 1.13 g/m²/h (SD 12.09) in the control group (26 participants), with a MD of ‐13.63 g/m²/h (95% CI ‐20.27 to ‐6.99; P < 0.0001).
In Simpson 2013 (a within‐participant design with 20 participants), the mean changes from baseline in TEWL were ‐1.59 g/m²/h (SD 0.97) on the moisturiser side and ‐0.42 g/m²/h (SD 1.13) on the control side, which were both minimal changes (statistically significant mean of the paired differences: ‐1.17 g/m²/h (95% CI ‐1.52 to ‐0.82)). In this study, measurement of skin capacitance was evaluated with a corneometer and showed an improvement of 16.91 units (SD 6.31) on the moisturiser side and 3.3 units (SD 3.86) on the control side (statistically significant mean of the paired differences: 13.61 units, 95% CI 11.60 to 15.60).
Change in health‐related quality of life
Change in health‐related quality of life was assessed in two studies (Giordano‐Labadie 2006; Grimalt 2007). Giordano‐Labadie 2006 used the Children's Dermatology Life Quality Index (CDLQI) with scoring ranging from 0 to 30. Scores between 0 and 1 indicate no effect on quality of life, while scores between 19 and 30 indicate an extremely large negative effect on quality of life (Lewis‐Jones 1995). In the moisturiser group the score had changed by ‐0.84 (SD 0.43) at day 56 and by ‐0.41 (1.50) in the control group. Grimalt 2007 used the Infant's Dermatitis Quality of Life Index (IDQOL) (Lewis‐Jones 2001), and the Dermatitis Family Impact (DFI) questionnaires (Lawson 1998), with scores in both ranging from 0 (no quality of life impairment) to 30 (most serious quality of life impairment). The mean change from baseline on the IDQOL was ‐2.57 (SD 35.51) in the moisturiser group (data only available for 49/91 participants) and ‐3.41 (SD 26.70) in the control group (data for 54/82 participants only). The standardised mean difference (SMD) in change from baseline quality of life between the moisturiser group and the control group was ‐0.15 (95% CI ‐0.55 to 0.24; P = 0.44; I² = 42%; Analysis 1.5). The reductions in scores in each treatment arm for both studies were small and not clinically important with no statistically significant difference between groups. The data from the second questionnaire in Grimalt 2007 (DFI) were in agreement with this analysis. For the DFI, the mean changes were ‐2.82 (SD 35.79) in the moisturiser group and ‐2.89 (SD 30.10) in the control group with a MD of 0.07 (95% CI ‐12.77 to 12.91; P = 0.99). A possible explanation for the statistical heterogeneity (I² = 42%) between the two treatments might be that in Grimalt 2007 40% of the participants did not complete the questionnaires, and this domain was therefore assessed as being at high risk of attrition bias.
(2) Moisturisers versus vehicle, placebo or no treatment (i.e. no moisturiser)
2a Atopiclair (containing glycyrrhetinic acid) three times a day versus vehicle three times a day
Four studies with a total of 450 participants reported data on this comparison (Abramovits 2008; Belloni 2005; Boguniewicz 2008; Patrizi 2008). We assessed the Belloni 2005 study as being at a low risk of bias, Abramovits 2008 at high risk of bias, and the other two at unclear risk of bias. Study duration ranged from 21 days (Belloni 2005), through 43 days (Boguniewicz 2008; Patrizi 2008), up to 50 days (Abramovits 2008). Both Boguniewicz 2008 and Patrizi 2008 were conducted in children, Belloni 2005 included children and adults, and Abramovits 2008 only investigated adults. All of the participants included in these studies had mild to moderate eczema.
In Boguniewicz 2008 and Patrizi 2008, low‐potency topical corticosteroids were allowed in both treatment arms, but only if really needed. Patrizi 2008 was a three‐arm study (see also comparison 3a, we did not consider Atopiclair light versus vehicle, as Atopiclair light was never marketed).
See also summary of findings Table 2.
Primary outcomes
Change from baseline in disease severity as assessed by the participants
Three studies reported the number of participants who experienced improvement rated as good improvement to total resolution (Abramovits 2008; Belloni 2005; Boguniewicz 2008); this showed that 174/232 in the Atopiclair group experienced good improvement to total resolution versus 27/158 in the vehicle group (RR 4.51, 95% CI 2.19 to 9.29; P < 0.0001; I² = 64%; NNTB = 2, 95% CI 1 to 2; Analysis 2.1). When we removed the study with the smallest sample size (Belloni 2005), the effect estimate increased slightly showing that the meta‐analysis findings were robust. We conducted a sensitivity analysis based on these three studies. When we excluded the Abramovits 2008 study (which was at high risk of bias) from the analysis, our repeat analysis showed no residual heterogeneity (RR 6.95, 95% CI 3.69 to 13.07; P < 0.00001; I² = 0%; NNTB = 2, 95% CI 1 to 2).
Itch was addressed in all four studies via a visual analogue scale (VAS) that ran from 0 cm to 10 cm, with score of 0 indicating no itch. There was a significant reduction in itch in favour of the Atopiclair moisturiser group with a MD of ‐2.65 cm (95% CI ‐4.21 to ‐1.09; P = 0.0008; I² = 97%; Analysis 2.2). The only study at low risk of bias, Belloni 2005, showed a smaller effect, which might have been caused by the shorter treatment duration (three weeks versus six to seven weeks in the other studies). None of the sensitivity analyses (stratified by risk of bias or effect size) reduced the heterogeneity to a minimum.
Participant satisfaction
At the end of the Abramovits 2008 study, 119/145 participants were willing to continue treatment with Atopiclair, while only 28/73 wished to continue with vehicle (RR 2.14, 95% CI 1.58 to 2.89; P < 0.00001; NNTB = 2, 95% CI 2 to 3). In Belloni 2005, the participants were asked about their willingness to use the treatment again; 9/15 in both groups indicated that they 'might' (RR 1.00, 95% CI 0.56 to 1.79; P = 1.00), and 5/15 in the Atopiclair group indicated that they 'would' use it again versus 0/15 in the vehicle group (Peto OR 10.18, 95% CI 1.54 to 67.23; P = 0.02). The P value of the Fisher's Exact Test was 0.0421. This outcome was not assessed in Boguniewicz 2008, and in Patrizi 2008, no data were reported other than P values indicating the participants' desire to continue on the treatment, which read "P < 0.001 in favour of Atopiclair".
Adverse events
All four studies addressed adverse events. There was no statistically significant difference in the number reporting an adverse event in either group with 84/252 adverse events in the Atopiclair group and 59/178 in the vehicle group (RR 1.03, 95% CI 0.79 to 1.33; P = 0.83; I² = 0%; Analysis 2.3). As no adverse events were reported in either group in Belloni 2005, we repeated our analysis adding one adverse event in each group for this study, and the RR was 1.03 (95% CI 0.79 to 1.33), which made no difference.
Secondary outcomes
Change from baseline in disease severity as assessed by the investigators
This outcome was assessed in all four studies with the EASI (for which the score rating runs from 0 to 72, with higher scores being worse (Hanifin 2001)), with a MD of ‐4.00 (95% CI ‐5.42 to ‐2.57; P < 0.00001; I² = 51%; Analysis 2.4) in favour of Atopiclair. The MID for the EASI is estimated at 6.6 (Schram 2012), and therefore the difference was not clinically relevant. Removing both of the studies with smaller sample sizes did slightly increase the MD (Belloni 2005; Patrizi 2008), therefore, we can conclude that the meta‐analysis is robust. The stratified sensitivity analyses per domain of risk of bias concluded that Boguniewicz 2008 demonstrated the greatest effect size, as well as being the only study in which there was uncertainty regarding the efficacy of the allocation concealment and of the blinding (see Table 6).
Prevention of flares (lengthening the time to first flare)
Occurrence of flares was measured as the number of participants who needed rescue medication in three of the four studies (Abramovits 2008; Boguniewicz 2008; Patrizi 2008). In the Atopiclair treatment arm, 15/237 of the participants experienced a flare versus 56/160 in the vehicle group, showing benefit in the treatment arm (RR 0.18, 95% CI 0.11 to 0.31; P < 0.00001; I² = 0%; NNTB = 3, 95% CI 3 to 5; Analysis 2.5). The study at high risk of bias, Abramovits 2008, did not appreciably alter the effect estimate In the sensitivity analysis (Analysis 2.5).
Change in use of topical active treatment
This outcome was not assessed in any of the studies.
Changes in skin barrier function
This outcome was not assessed in any of the studies.
Change in health‐related quality of life
This outcome was not assessed in any of the studies.
2b Urea‐containing moisturisers versus vehicle, placebo or no treatment (i.e. no moisturiser)
Four studies, with a total of 362 adult participants, examined urea‐containing cream versus vehicle, placebo, or no treatment (Bohnsack 1997; Lodén 2002; Wilhelm 1998; Wirén 2009). We assessed three of these as being at an unclear risk of bias (Bohnsack 1997; Lodén 2002; Wilhelm 1998), and the fourth as being at high risk of bias due to lack of blinding (Wirén 2009). The Bohnsack 1997, Lodén 2002, and Wilhelm 1998 studies were four weeks long, and Wirén 2009 had a duration of six months (this study is featured in Comparison 1 also). The objective of the Wirén 2009 study was to explore time to flare after treatment; treatment success was obtained in certain target areas with betamethasone valerate 0.1% (a steroid) and moisturiser, and Canoderm cream (containing urea) was compared with no treatment in the subsequent maintenance phase. Bohnsack 1997 and Wilhelm 1998 had a within‐participant design and did not allow topical treatments, while Lodén 2002 and Wirén 2009 did allow topical steroids in either treatment arm (though in Wirén 2009 they were permitted at areas other than the target areas during the maintenance phase). Lodén 2002 was a three‐armed study (see Comparisons 2c and 3o).
See summary of findings Table 3.
Primary outcomes
Change from baseline in disease severity as assessed by the participants
This outcome was not assessed in Bohnsack 1997 and Wirén 2009. In Lodén 2002, 56/63 participants in the group treated with urea‐containing cream (4% urea and 4% sodium chloride) rated the dryness of their skin as improved versus 46/66 in the group treated with placebo (for ingredients, see Notes in Characteristics of included studies for Lodén 2002), with a statistically significant difference in favour of the urea‐containing cream (RR 1.28, 95% CI 1.06 to 1.53; P = 0.009; NNTB = 5, 95% CI 3 to 18).
Sixty‐one per cent of the 77 participants in the Wilhelm 1998 within‐participant study considered that the side treated with 10% urea cream showed moderate to very good improvement compared to 48.1% who felt that the side treated with vehicle showed moderate to good improvement. Itch was also assessed in this study, with 54.5% reporting improvement of itch on the side treated with urea cream and 45.5% reporting improvement on the vehicle side.
Participant satisfaction
Only Bohnsack 1997 assessed participant satisfaction, specifically smell, spreadability, penetration into the skin, and the feel of the skin, using a 4‐point Likert scale (1 = unsatisfactory, 2 = satisfactory, 3 = good, 4 = very good). Thirty‐two of the 38 participants thought the side treated with 10% urea cream smelt 'satisfactory to good', and 31/38 considered that the vehicle side smelt 'satisfactory' (RR 1.07, 95% CI 0.79 to 1.44; P = 0.68). Spreadability was assessed as 'satisfactory to very good' by 35/38 participants for the 10% urea cream and by 37/38 for the vehicle (RR 0.94, 95% 0.78 to 1.14; P = 0.55). Penetration into the skin was assessed as 'satisfactory to very good' by 26/38 participants for the 10% urea cream and as 'satisfactory to good' by 32/38 participants for the vehicle (RR 0.81, 95% CI 0.57 to 1.17; P = 0.26). Twenty‐seven out of 38 participants considered the feel of the skin on the 10% urea‐treated side as 'satisfactory to good', and 32/38 considered it to be 'satisfactory to good' on the vehicle‐treated side (RR 0.88, 95% CI 0.63 to 1.22; P = 0.43).
Adverse events
Only the Lodén 2002 trial assessed adverse events. Smarting was reported by 41/63 participants in the urea cream group and by 26/66 participants in the placebo group (RR 1.65, 95% CI 1.16 to 2.34; P = 0.005; NNTH = 4, 95% CI 2 to 11), which is a statistically significant difference in favour of the placebo cream.
Secondary outcomes
Change from baseline in disease severity as assessed by the investigators
This outcome was not assessed in Wirén 2009. The Lodén 2002 study used the dry skin area and severity index (DASI) to assess disease severity (score from 4 to 20, with higher scores being worse) (Serup 1995). After four weeks, 56/63 in the urea cream‐treated group had improved, and 42/66 in the placebo cream group (RR 1.40, 95% CI 1.14 to 1.71; P = 0.001; NNTB = 4, 95% CI 3 to 9); this result favoured the urea‐containing cream and was consistent with the participant assessments.
The within‐participant Bohnsack 1997 study used a combined score for all participants to assess dryness (4‐point Likert scale (0 to 3); 0 = fine shiny skin surface, 1 = dry matte skin surface, 2 = mild scaling, 3 = obvious mild to moderate scaling). The combined total score for all 38 participants decreased from 91 to 63 on the side treated with 10% urea cream and from 88 to 70 on the vehicle side. The investigators of the study reported that this was not a statistically significant difference.
The within‐participant Wilhelm 1998 study used a sum score to assess change in disease severity (erythema, dryness, induration, papules, with each item scoring from 0 to 4, with higher values being worse). The mean change from baseline in the sum score after four weeks was ‐1.90 (SD 3.5) on the side treated with urea‐containing cream and ‐1.33 (SD 2.11) on the side treated with vehicle, with the mean of the paired differences being ‐0.57 (95% CI ‐1.14 to 0.0).
Prevention of flares (lengthening the time to first flare)
Only Wirén 2009 examined time to first flare. During the six‐month period of the trial, 7/22 of the 5% urea cream group experienced a flare compared with 15/22 of the no moisturiser group, which favours the use of moisturiser (RR 0.47, 95% CI 0.24 to 0.92; P = 0.03; NNTB = 3, 95% CI 2 to 11). In this study, the median time to flare was more than 180 days in the urea cream group versus 30 days for the no moisturiser group. The rate of flare in the no moisturiser group was 3.2 times that in the urea cream group (HR 3.2, 95% CI 1.3 to 7.8; P = 0.01). (See the data analysis for Wirén 2009 in Analysis 1.3). These data demonstrate that urea cream reduced the number of flares and prolonged time to flare compared to not using a moisturiser.
Change in use of topical active treatment
This outcome was not assessed in any of the studies.
Changes in skin barrier function
Bohnsack 1997 and Wilhelm 1998 (both within‐participant studies) assessed skin hydration with a corneometer in a total of 115 participants. In Bohnsack 1997, hydration increased over four weeks by 12 arbitrary units (SD 7.21) on the side treated with 10% urea cream and by 15.20 units (SD 7.92) on the vehicle‐treated side. In Wilhelm 1998 the changes were 11.80 (SD 6.90) arbitrary units on the side treated with urea cream and 6.20 (SD 6.58) units on the side treated with vehicle (pooled data showed a MD 1.23, 95% CI ‐7.39 to 9.86; P = 0.78; I² = 98%; Analysis 3.1). Improvements in skin hydration were seen in both arms, with the studies just showing slightly different results, with Bohnsack 1997 favouring vehicle and Wilhelm 1998 favouring the urea cream.
The Wirén 2009 study measured TEWL, and the investigators reported that "the difference in TEWL between the groups after three weeks of maintenance treatment did not reach statistical significance."
Change in health‐related quality of life
This outcome was not assessed in any of the studies.
2c Glycerol‐containing moisturisers versus vehicle or placebo
The participants in the three studies that evaluated glycerol‐containing moisturises against vehicle or placebo had mild to moderate eczema (409 participants) (Boralevi 2014; Breternitz 2008; Lodén 2002). The duration of all three studies was four weeks. The Boralevi 2014 study enrolled 251 children aged from two to six years and allowed topical corticosteroids only if they were really needed; we assessed it as being at low risk of bias. The Breternitz 2008 study was a within‐participant study (24 participants), conducted in people aged between 15 and 49 years, in which no concomitant treatments were permitted; we assessed it as being at an unclear risk of bias. Lodén 2002 was a three‐armed study of 197 adults (see also Comparisons 2b and 3o) that did not permit additional use of topical corticosteroids; we assessed it as being at an unclear risk of bias.
See summary of findings Table 4.
Primary outcomes
Change from baseline in disease severity as assessed by the participants
Only Lodén 2002 evaluated participant‐assessed disease severity and rated the improvement in dryness of the skin. In the group treated with glycerol 20% cream, 58/68 participants considered their skin to have improved in terms of dryness versus 46/66 in the placebo cream group, with a RR of 1.22 (95% CI 1.01 to 1.48; P = 0.03; NNTB = 6, 95% CI 3 to 60), showing greater improvement in the glycerol group.
In the Boralevi 2014 study, the participants scored itch on a 10 cm VAS (with higher values being worse): in the 124 children treated with glycerol 15% cream, the mean change from baseline in itch was ‐1.72 cm (SD 2.01), while in the 125 children treated with placebo cream, the mean change was ‐1.11 cm (SD 1.93), which were both small changes but slightly favoured the glycerol group (MD ‐0.61 cm, 95% CI ‐1.10 to ‐0.12; P = 0.01).
Participant satisfaction
This outcome was not assessed in any of the studies.
Adverse events
Two studies reported data on adverse events (Boralevi 2014; Lodén 2002). There was no statistically significant difference in the number of adverse events between the two treatment groups (RR 0.90, 95% CI 0.68 to 1.19; P = 0.45; I² = 0%; Analysis 4.1). The adverse events were mild to moderate and consisted of smarting, erythema, pruritus, or burning.
Secondary outcomes
Change from baseline in disease severity as assessed by the investigators
In Boralevi 2014, the investigators assessed disease severity with the objective SCORAD (Kunz 1997). The mean change from baseline was ‐5.3 (SD 5.3) in the 124 participants treated with glycerol cream versus a change of ‐3.1 (SD 4.7) in the 125 participants treated with vehicle cream (MD ‐2.20, 95% ‐3.44 to ‐0.96; P = 0.0005), which is a statistically significant difference in favour of the glycerol‐containing cream, but this value does not meet the MID of 8.2 for the objective SCORAD (Schram 2012).
Breternitz 2008 had a within‐participant design with 24 participants. The mean change from baseline in SCORAD was ‐1.10 (SD 1.57) on the side treated with glycerol 20% cream, and 0.0 (SD 1.83) on the side treated with vehicle (mean of the paired differences: ‐1.10, CI 95% ‐1.63 to ‐0.57), which favoured the glycerol‐containing cream.
The investigators in Lodén 2002 evaluated skin dryness with the DASI (Serup 1995), and stated that there were "no differences between the groups in DASI scores". Despite this, in the glycerol group, 58/68 showed improvement in dryness of the skin versus 42/66 in the vehicle group (RR 1.34, 95% CI 1.09 to 1.65; P = 0.0006; NNTB = 5, 95% CI 3 to 14), which is in accordance with the participant assessments and favoured the glycerol cream.
Prevention of flares (lengthening the time to first flare)
This outcome was not assessed in any of the studies.
Change in use of topical active treatment
This outcome was not assessed in any of the studies.
Changes in skin barrier function
In Boralevi 2014, the hydration index was measured with corneometry and showed a mean change of 11.14 units (SD 10.21) in the glycerol group (120 participants) versus 5.56 units (SD 9.88) in the vehicle group (121 participants) (MD 5.58 units, 95% CI 3.04 to 8.12; P < 0.0001), showing glycerol was more effective at improving hydration.
In the within‐participant study (24 participants) of Breternitz 2008, the mean change in TEWL was ‐5.80 g/m²/h (SD 4.95) on the side treated with glycerol cream versus 7.20 g/m²/h (SD 11.01) on the side treated with vehicle, with a statistically significant mean of the paired differences of ‐13 g/m²/h (95% CI ‐16.33 to ‐9.67) in favour of glycerol cream. Furthermore, the mean change from baseline in hydration was 12.40 units (SD 6.2) on the glycerol cream side versus 5.30 units (SD 5.77) on the vehicle cream side (statistically significant mean of the paired differences: 7.10 units, 95% CI 5.24 to 8.96).
Change in health‐related quality of life
This outcome was not assessed in any of the studies.
2d Oat‐containing moisturisers versus vehicle or no treatment (i.e. no moisturiser)
Four studies (344 participants) reported data on oat‐containing moisturisers versus no treatment or vehicle (Giordano‐Labadie 2006; Grimalt 2007; Nebus 2009; Weber 2015). Three of these four studies are also reported under Comparison 1 (Giordano‐Labadie 2006; Grimalt 2007; Weber 2015). Only Nebus 2009 compared oat‐containing moisturiser versus occlusive vehicle, whilst the comparison in the other studies was no moisturiser. Study duration was six weeks for Grimalt 2007, eight weeks for Giordano‐Labadie 2006 and Nebus 2009, and six months for Weber 2015.
The Giordano‐Labadie 2006, Grimalt 2007, and Weber 2015 studies were conducted in children, and Nebus 2009 included both children (above 12 years of age) and adults. All participants had predominantly mild to moderate eczema.
We assessed Nebus 2009 as being at low risk of bias, but the other three studies were not blinded, and we therefore assessed them as being at a high risk of bias.
The Giordano‐Labadie 2006, Grimalt 2007, and Nebus 2009 studies allowed application of moderate to strong topical corticosteroids in both treatment arms, and Weber 2015 allowed application of 'Eucerin Eczema Relief Instant Therapy' to active lesions.
See summary of findings Table 5.
Primary outcomes
Change from baseline in disease severity as assessed by the participants
This outcome was only assessed in Nebus 2009, in which 50 participants reported how effective the creams were in hydrating and alleviating eczema. There was no difference between the two treatment groups for two assessments: 21/25 participants in the oat‐containing cream group considered the moisturiser to be effective in hydrating skin versus 19/25 in the occlusive vehicle group (RR 1.11, 95% CI 0.84 to 1.46; P = 0.45), while 18/25 in the oat‐containing cream group felt eczema was alleviated versus 16/25 in the occlusive vehicle group (RR 1.13, 95% CI 0.77 to 1.65; P = 0.55).
Itch was assessed on a 5‐point Likert scale (0 to 4, with a higher score being worse) in Nebus 2009. The mean change from baseline was ‐0.78 (SD 0.76) in the oat‐containing cream group (25 participants) versus ‐1.20 (SD 1.01) in the occlusive vehicle group (25 participants) (MD 0.42, 95% CI ‐0.08 to 0.92; P = 0.10).
Participant satisfaction
This outcome was only assessed in Nebus 2009, where there was equal satisfaction in the two groups with the treatments; 18/25 participants in the oat‐containing cream group indicated that the cream was soothing and calmed the discomfort versus 17/25 in the occlusive vehicle group (RR 1.06, 95% CI 0.74 to 1.52; P = 0.76).
Adverse events
At six weeks in the Grimalt 2007 trial, 8/91 participants reported adverse events in the oat‐containing cream group compared to 0/82 in the no moisturiser control group (Peto OR 7.26, 95% CI 1.76 to 29.92; P = 0.006). The P value of Fisher's Exact Test was 0.0071. Three adverse events were reported to be mild, three moderate, and two severe, which led to treatment discontinuation. No further details were provided other than "all the adverse events spontaneously resolved without sequel." None of the other studies addressed this outcome.
Secondary outcomes
Change from baseline in disease severity as assessed by the investigators
The investigators in three studies evaluated disease severity (Giordano‐Labadie 2006; Grimalt 2007; Nebus 2009). Two of the studies, Giordano‐Labadie 2006 and Grimalt 2007, used the SCORAD to measure disease severity, and Nebus 2009 used the EASI. The SMD in change from baseline in disease severity was ‐0.23 (95% CI ‐0.66 to 0.21; P = 0.30; I² = 65%; Analysis 5.1). However, when we conducted further analyses based on individual domains of risk of bias in addition to a stratified analysis adjusting for effect size ‐ which eliminated the heterogeneity ‐ Giordano‐Labadie 2006 showed a greater effect than the other two studies, but did not alter the conclusion (Table 6).
Prevention of flares (lengthening the time to first flare)
Only Weber 2015 evaluated flaring: 4/20 participants in the oat‐containing cream group experienced a flare versus 15/23 in the no moisturiser control group (RR 0.31, 95% CI 0.12 to 0.77; P = 0.01; NNTB = 2, 95% CI 1 to 5), favouring the use of oat‐containing cream. The median time to flare was more than 180 days for the group treated with oat‐containing cream versus 28 days for the no moisturiser group. The HR for rate to flare was 4.74 (95% CI 1.57 to 14.34; P = 0.006; Analysis 1.3) in favour of the oat‐containing cream.
Change in use of topical active treatment
Two of the four studies provided data for this outcome, Giordano‐Labadie 2006 and Grimalt 2007. These have been discussed under Comparison 1, and only the conclusion is repeated here. Pooled data that demonstrated a statistically significant reduction in use of topical corticosteroids in the moisturiser groups, where a smaller amount was required to achieve a similar reduction in eczema severity, are presented in Analysis 1.4. Total topical corticosteroid usage was much higher in both treatment groups in Giordano‐Labadie 2006, which explains the substantial heterogeneity.
Changes in skin barrier function
This outcome was not assessed in any study.
Change in health‐related quality of life
Three studies assessed change from baseline in quality of life (Giordano‐Labadie 2006; Grimalt 2007; Nebus 2009) (details of Giordano‐Labadie 2006 and Grimalt 2007 appear in Comparison 1 and Analysis 1.5). Giordano‐Labadie 2006 used the CDLQI; Grimalt 2007, the IDQOL; and Nebus 2009 used the Dermatology Quality of Life Index (DLQI) (Finlay 1994). The SMD for changes from baseline in quality of life was ‐0.09 (95% CI ‐0.37 to 0.19; P = 0.53; I² = 12%; Analysis 5.2).
2e Remainder of moisturisers versus vehicle, placebo or no treatment (i.e. no moisturiser)
2e‐I Ammonium lactate‐containing moisturiser (6%) versus vehicle
One study compared twice daily application of ammonium lactate (6%) in water in oil emulsion with vehicle that was also applied twice daily (Larregue 1996). This within‐participant trial had 46 participants (six to 12 years old), who had had moderate eczema for four weeks. We assessed the study as being at a high risk of bias. Very limited data were provided, and no additional treatment was allowed.
Primary outcomes
Change from baseline in disease severity as assessed by the participants
Although this was a prespecified outcome and should have been measured with a questionnaire filled in by the parents, the data were not reported. (See the 'Risk of bias' assessment in Characteristics of included studies).
Participant satisfaction
The trial did not assess this outcome.
Adverse events
The trial did not assess this outcome.
Secondary outcomes
Change from baseline in disease severity as assessed by the investigators
Larregue 1996 assessed desquamation and xerosis, lichenification, and hyperkeratosis on a 4‐point Likert scale (0 = normal, to 3 = severe), and summed the results for all participants into a total score. At the start of the study, the total score for desquamation and xerosis in 44/46 participants on the side treated with ammonium lactate was 74, which decreased to 34 over a period of four weeks. On the vehicle side of the body, the score was 76 at baseline and 35 at the end of the study, showing a minimal difference between the two treatments on either side of the body. Data for lichenification showed a decrease of 21 on the side treated with ammonium lactate and a decrease of 19 on the vehicle side. Hyperkeratosis decreased by 23 on the side treated with ammonium lactate and by 18 on the vehicle side. The authors reported that both treatments were effective in reducing erythema and papules.
Prevention of flares (lengthening the time to first flare)
The trial did not assess this outcome.
Change in use of topical active treatment
The trial did not assess this outcome.
Changes in skin barrier function
The trial did not assess this outcome.
Change in health‐related quality of life
The trial did not assess this outcome.
2e‐II Pale sulfonated 4% shale oil cream versus vehicle
One study compared application of pale sulfonated 4% shale oil (PSSO) with application of vehicle, both applied three times daily (Korting 2010). The trial included 99 children who had had mild to moderate eczema for four weeks. We assessed the study as being at a high risk of bias. No other treatments for eczema were allowed during the study period.
Primary outcomes
Change from baseline in disease severity as assessed by the participants
The trial did not assess this outcome.
Participant satisfaction
The trial did not assess this outcome.
Adverse events
Two out of the 51 participants treated with PSSO reported adverse events (both reported itch and erythema) versus 4/48 treated with vehicle (Peto OR 0.46, 95% CI 0.09 to 2.40; P = 0.36). The P value of Fisher's Exact Test was 0.4270. The adverse events in the vehicle group included one case each of a bacterial super‐infection; erythema and itch; erythema, itch and spreading of eczema; and worsening of eczema.
Secondary outcomes
Change from baseline in disease severity as assessed by the investigators
This outcome was assessed with EASI (score rating from 0 to 72, with a higher score being worse) (Hanifin 2001). In the PSSO group (50 participants), the mean change from baseline in EASI was ‐8.90 (SD 4.96) compared to ‐1.30 (SD 6.40) in the vehicle group (47 participants) (MD ‐7.60, 95% CI ‐9.89 to ‐5.31; P < 0.00001). The MID of the EASI is 6.6 (Schram 2012), and therefore the reduction in the PSSO group was a clinically important reduction, as was the difference between the two groups.
Prevention of flares (lengthening the time to first flare)
The trial did not assess this outcome.
Change in use of topical active treatment
The trial did not assess this outcome.
Changes in skin barrier function
The trial did not assess this outcome.
Change in health‐related quality of life
The trial did not assess this outcome.
2e‐III Atoderm Intensive cream versus moisturiser base
One study compared twice daily application of Atoderm Intensive cream with moisturiser base, also applied twice daily, over six months (Gayraud 2015). The trial enrolled 130 children with mild to moderate eczema. We assessed the study as being at a low risk of bias. Participants were permitted to continue using their prescribed medication for eczema, as long as the usage remained stable.
Primary outcomes
Change from baseline in disease severity as assessed by the participants
Participants assessed disease severity with the patient‐oriented SCORAD (Stalder 2011). The mean change from baseline was ‐5.70 (SD 5.59) in the 62 participants treated with Atoderm Intensive cream versus ‐2.70 (SD 5.66) in the 61 treated with the moisturiser base, with a MD of ‐3.00 (95% CI ‐4.99 to ‐1.01; P = 0.003) in favour of Atoderm Intensive cream.
Participant satisfaction
The trial did not assess this outcome.
Adverse events
Five out of the 65 participants randomised to Atoderm Intensive cream reported adverse events (warm sensation, pruritus, stinging, pain, erythema, flare‐up) versus 7/65 in the moisturiser base group (pruritus, mild warm sensation, mild flare‐ups, mild or moderate erythema and papules) (RR 0.71, 95% CI 0.24 to 2.13; P = 0.55).
Secondary outcomes
Change from baseline in disease severity as assessed by the investigators
Investigators used the SCORAD (score 0 to 103, with higher scores being worse) to assess disease severity. The mean change from baseline was ‐3.70 (SD 3.79) in the 62 participants treated with Atoderm Intensive cream versus 0 (SD 5.60) in the 61 treated with the moisturiser base, with a MD of ‐3.70 (95% CI ‐5.39 to ‐2.01; P < 0.0001). Although this difference clearly favoured Atoderm Intensive cream, it did not meet the estimated MID of 8.7 (Schram 2012).
Prevention of flares (lengthening the time to first flare)
In the Atoderm Intensive cream group, 18/62 of the participants experienced a flare versus 22/61 in the control group (RR 0.80, 95% CI 0.48 to 1.34; P = 0.41). The time to flare was 59 days (SD 11) in the Atoderm Intensive cream group compared to 39 days (SD 12) in the moisturiser base group (MD 20.00 days, 95% CI 15.93 to 24.07; P < 0.00001), and favoured Atoderm Intensive cream. In addition, the investigators reported that "overall, severity of flares had decreased by 49% in SBT [Atoderm Intensive cream] complex group compared to 15% in the emollient base group."
Change in use of topical active treatment
Change in use of topical active treatment was evaluated through reporting the mean number of treatment days during flares. The usage of topical corticosteroids was 4.3 days (SD 1.10) in the Atoderm Intensive cream group (62 participants) versus 4.8 days (SD 1.0) in the moisturiser base group (61 participants) (MD ‐0.50 day, 95% CI ‐0.87 to ‐0.13; P = 0.008). The difference in usage of topical immunomodulators was 1.6 days (SD 0.6) versus 3.8 days (SD 1.0) (MD ‐2.20 days, 95% CI ‐2.49 to ‐1.91; P < 0.00001), respectively. The usage of oral antihistamines was 0.5 days (SD 0.3) versus 3.5 days (SD 1.6), respectively (MD ‐3.00, 95% CI ‐3.41 to ‐2.59; P < 0.00001), which favoured the Atoderm Intensive cream.
Changes in skin barrier function
The trial did not assess this outcome.
Change in health‐related quality of life
For children under four years of age, quality of life was assessed with the IDQOL (0 = no quality of life impairment, 30 = highest quality of life impairment), and for children over four years of age, it was assessed with the CDLQI (score 0 to 30: 0 to 1 = no effect on quality of life, 19 to 30 = extremely large effect on quality of life). In addition, the DFI questionnaire was used to assess quality of life in all of the participants and their parents (0 = no quality of life impairment, 30 = highest quality of life impairment).
In children under four years of age, the mean change in IDQOL was ‐4.90 (SD 4.69) in the 47 children on Atoderm Intensive cream versus ‐1.00 (SD 2.90) in the 36 children treated with the moisturiser base (MD ‐3.90, 95% CI ‐5.54 to ‐2.26; P < 0.00001). For children over four years of age, the mean change from baseline in CDLQI was ‐0.70 (SD 1.64) in the 15 children treated with Atoderm Intensive cream versus ‐0.50 (SD 2.12) in the 25 treated with moisturiser base (MD ‐0.20, 95% CI ‐1.56 to 1.16; P = 0.77).
All children were included in the assessments of the DFI, where the mean change from baseline was ‐4.40 (SD 2.49) in the 62 children treated with Atoderm Intensive cream versus ‐2.2 (SD 2.88) in the 61 treated with moisturiser base (MD ‐2.20, 95% CI ‐3.78 to ‐0.62; P = 0.006). While this was a statistically significant difference in favour of Atoderm Intensive cream, and although the MID of the DFI has not yet been established, this difference is unlikely to be clinically important.
2e‐IV Triclosan 1% moisturiser twice daily versus vehicle cream twice daily
Triclosan 1% moisturiser was evaluated in a single study we assessed as being at low risk of bias, which included 60 children and adults with mild to moderate eczema (Tan 2010). The study duration was 41 days, and usage of low‐potency topical corticosteroids was allowed in both treatment arms.
Primary outcomes
Change from baseline in disease severity as assessed by the participants
The trial did not assess this outcome.
Participant satisfaction
The trial did not assess this outcome.
Adverse events
Three of the 30 participants who used triclosan 1% moisturiser experienced transient stinging pain after application compared to 1/30 of those who used the vehicle cream (Peto OR 2.87, 95% CI 0.38 to 21.44; P = 0.30). The P value of Fisher's Exact Test was 0.6120.
Secondary outcomes
Change from baseline in disease severity as assessed by the investigators
The investigators measured disease severity with SCORAD. The mean change from baseline was ‐12.67 (SD 7.7) in the triclosan 1% moisturiser group and ‐11.69 (SD 7.7) in the vehicle cream group (MD ‐0.98, 95% CI ‐4.88 to 2.92; P = 0.62). Both reductions met the MID of 8.7 (Schram 2012), but with no important difference between the two groups.
Prevention of flares (lengthening the time to first flare)
The trial did not assess this outcome.
Change in use of topical active treatment
The mean amount of topical corticosteroids used for the duration of the study varied substantially between groups, with 22 g used in the triclosan 1% moisturiser group and 44.2 g used in the vehicle cream group; the vehicle cream group required twice the amount of corticosteroids to achieve a reduction in SCORAD similar to that seen in the triclosan 1% moisturiser group.
Changes in skin barrier function
The trial did not assess this outcome.
Change in health‐related quality of life
The trial did not assess this outcome.
2e‐V Hippophae rhamnoides 10% cream versus placebo cream
Thumm 2000 was a three‐armed study with a total of 43 adult participants with mild to moderate eczema (see Comparisons 2e‐VI and 3t). The study compared sea buckthorn oil (Hippophae rhamnoides) 10% cream, with H rhamnoides 20% cream, and with placebo. H rhamnoides cream also contains beeswax, paraffin, and glycerol and was applied for four weeks. We assessed the study as being at an unclear risk of bias.
Primary outcomes
Change from baseline in disease severity as assessed by the participants
Disease severity was not assessed by the participants, although itch was assessed on a VAS. No precise data were reported, other than that there were improvements in the severity of itch in both groups, with the H rhamnoides 10% group showing greater improvement than the placebo group.
Participant satisfaction
The trial did not assess this outcome.
Adverse events
The trial did not assess this outcome.
Secondary outcomes
Change from baseline in disease severity as assessed by the investigators
The investigators assessed disease severity with the SCORAD. No standard deviations were reported, but in the H rhamnoides 10% cream group (17 participants) the SCORAD decreased by 9.52 and by 13.76 in the placebo cream group (19 participants). Both scores indicate clinically relevant reductions (MID for the SCORAD is 8.7 (Schram 2012)), with the placebo group apparently doing better.
Prevention of flares (lengthening the time to first flare)
The trial did not assess this outcome.
Change in use of topical active treatment
The trial did not assess this outcome.
Changes in skin barrier function
TEWL showed a decrease of 10.20 g/m²/h in the H rhamnoides 10% cream group and a decrease of 11.37 g/m²/h in the placebo cream group. No standard deviations were provided. Skin hydration improved in both arms by 8 and 10.15 units, respectively. Hence, there were only small differences between the groups for both TEWL and skin hydration.
Change in health‐related quality of life
The Thumm 2000 study used the DLQI to measure changes in quality of life (score 0 to 30, with a higher score indicating a greater impairment of quality of life). The mean change from baseline was ‐2.74 for the H rhamnoides 10% cream group and ‐3.79 in the placebo cream group. Previously, the MID of DLQI varied between three and five, but an MID of four is the currently recommended value for inflammatory skin diseases (Basra 2015).
2e‐VI Hippophae rhamnoides 20% cream versus placebo cream
This is the second comparison in Thumm 2000 (see Comparisons 2e‐V and 3t).
Primary outcomes
Change from baseline in disease severity as assessed by the participants
Disease severity was not assessed by the participants, but itch was assessed on a VAS. No precise data were reported, other than that there were improvements in the severity of itch in both groups, with the H rhamnoides 20% group showing greater improvement than the placebo group.
Participant satisfaction
The trial did not assess this outcome.
Adverse events
The trial did not assess this outcome.
Secondary outcomes
Change from baseline in disease severity as assessed by the investigators
The investigators assessed disease severity with the SCORAD. No standard deviations were provided, but in the H rhamnoides 20% cream group (17 participants) the SCORAD decreased by 10.98 and by 13.76 in the placebo cream group (19 participants). Both are both clinically important reductions (MID for the SCORAD is 8.7 (Schram 2012)). The size of reduction that was reported in the placebo group was quite remarkable.
Prevention of flares (lengthening the time to first flare)
The trial did not assess this outcome.
Change in use of topical active treatment
The trial did not assess this outcome.
Changes in skin barrier function
TEWL showed a decrease of 10.59 g/m²/h in the H rhamnoides 20% cream group and a decrease of 11.37 g/m²/h in the placebo cream group. No standard deviations were provided. Skin hydration improved in both arms by 14.84 and 10.15 units, respectively. Hence, there were only small differences between the groups for both TEWL and skin hydration.
Change in health‐related quality of life
The mean change from baseline in DLQI was ‐3.67 for the H rhamnoides 20% cream group and ‐3.79 for the placebo cream group. Until recently the MID of DLQI varied between three and five, but an MID of four is the currently recommended value for inflammatory skin diseases (Basra 2015).
2f All moisturisers (2a‐2e) versus vehicle, placebo, or no treatment (i.e. no moisturiser)
All of the studies listed under Comparisons 2a up to 2e‐VIII provided data for this overall comparison for at least one of the outcomes.
See summary of findings Table 6.
Primary outcomes
Change from baseline in disease severity as assessed by the participants
This outcome was addressed in five studies for which the data could be pooled (Abramovits 2008; Belloni 2005; Boguniewicz 2008; Lodén 2002; Nebus 2009); Lodén 2002 provided data on two different treatment arms versus placebo, and therefore we pooled the data from the two active treatment arms and have partitioned them in the analyses (to avoid double counting). The number of participants who considered that their eczema had improved was 252/323 in the moisturiser group versus 92/249 in the control group, which favoured the use of moisturiser (RR 2.46, 95% CI 1.16 to 5.23; P = 0.02; I² = 95%; NNTB = 2, 95% CI 1 to 3; Analysis 6.1). From a clinical point of view, the result of the Nebus 2009 study appeared to be an outlier, but removing this study had little effect on the effect estimate. Removing the study with the smallest sample size did not alter the results (Belloni 2005).
Seven studies assessed itch (Abramovits 2008; Belloni 2005; Boguniewicz 2008; Boralevi 2014; Nebus 2009; Patrizi 2008; Patrizi 2014). Six of these used a VAS scale, and Patrizi 2014 used a 4‐point Likert scale. The SMD was ‐1.10 (95% CI ‐1.83 to ‐0.38; P < 0.00001; I² = 94%; Analysis 6.2), and favoured moisturiser. Again, the Nebus 2009 study, which had a smaller sample size, appeared to be an outlier, but the removal of this study did not have an important effect on the overall effect estimate. The stratified sensitivity analyses by domain of risk of bias (Table 6) and effect size (analyses not shown) did not minimise the degree of heterogeneity. Stratified analyses that compared study results from the single prospectively registered trial, Boralevi 2014, with those without a published prespecified protocol (remainder of trials included for this outcome) did not alter the degree of heterogeneity (analysis not shown).
Participant satisfaction
Only three studies reported data on participant satisfaction with the treatment (Abramovits 2008; Belloni 2005; Nebus 2009). In the moisturiser group, 146/185 expressed satisfaction to a certain extent with the treatment and also indicated their willingness to use it again, versus 54/113 in the control group (RR 1.35, 95% CI 0.77 to 2.36; P = 0.29; I² = 83%; Analysis 6.3). The stratified analyses based on individual domains demonstrated that Abramovits 2008, which was assessed as being at high risk of bias (due to high risk of attrition bias) and also showed the greatest effect estimate, was responsible for all of the heterogeneity (see Table 6).
The Bohnsack 1997 study (within‐participant design) included 38 participants and assessed smell, spreadability, penetration into the skin, and skin feeling. The results are summarised under Comparison 2b, but there was no difference between the two treatments for any of these features, which confirms the results from the other three studies that we pooled (Analysis 6.3).
Adverse events
Ten studies reported on the number of participants who experienced an adverse event (Abramovits 2008; Belloni 2005; Boguniewicz 2008; Boralevi 2014; Gayraud 2015; Grimalt 2007; Korting 2010; Lodén 2002; Patrizi 2008; Tan 2010). We took the number of participants who reported an adverse event in the two active treatment arms of Lodén 2002 together and partitioned them (numerator and denominator) to avoid double‐counting. In total, 170/680 participants treated with a moisturiser reported an adverse event compared to 139/595 in the control arms with a RR of 1.03 (95% CI 0.82 to 1.30; P = 0.80; I² = 21%; Analysis 6.4), which was not a statistically significant difference. As Belloni 2005 did not report adverse events in either treatment arm, we repeated our analysis when one adverse event was added in both groups, which resulted in a RR of 1.03 (95% CI 0.83 to 1.27), showing no difference between groups. Our repeat analysis no longer showed heterogeneity when we pooled data from studies at low risk of bias only (Table 6).
Secondary outcomes
Change from baseline in disease severity as assessed by the investigators
Twelve studies provided usable data for this outcome (Abramovits 2008; Belloni 2005; Boguniewicz 2008; Boralevi 2014; Gayraud 2015; Giordano‐Labadie 2006; Grimalt 2007; Korting 2010; Nebus 2009; Patrizi 2008; Patrizi 2014; Tan 2010), measured with different instruments, and showed a SMD of ‐0.65 (95% CI ‐0.89 to ‐0.41; P < 0.00001; I² = 75%; Analysis 6.5), which is a significant difference in favour of the moisturiser group. Further exploration of the heterogeneity to detect publication bias and small‐study effects revealed no evidence of funnel plot asymmetry (Figure 4). In addition, our stratified sensitivity analyses by domain of risk of bias did not reduce the heterogeneity to a minimum (Table 6). Only the Boralevi 2014 study had a prospectively registered protocol.

Funnel plot of comparison 5: All moisturisers versus vehicle, placebo or no treatment (no moisturiser), outcome: 5.5 Change in disease severity as assessed by the investigators
The investigators in the within‐participant Bohnsack 1997 study reported a combined total score for all 38 participants, which, over four weeks, showed a reduction in total score of 28 on the urea cream‐treated side versus a reduction of 18 on the vehicle‐treated side. (For further details, see Comparison 2b). The within‐participant Wilhelm 1998 study used a sum score that included erythema, dryness, induration, and papules (each item scored from 0 to 4, with higher scores being worse) in the assessment of this outcome. The mean change from baseline in the sum score after four weeks was ‐1.90 (SD 3.5) on the side treated with urea cream and ‐1.33 (SD 2.11) on the side treated with vehicle, with a mean of the paired differences of ‐0.57 (95% CI ‐1.14 to 0.0).
Prevention of flares (lengthening the time to first flare)
Six studies examined occurrence of flares (Abramovits 2008; Boguniewicz 2008; Gayraud 2015; Patrizi 2008; Weber 2015; Wirén 2009). The number of participants who experienced a flare in the moisturiser group was 44/341 versus 108/266 in the control group (RR 0.33, 95% CI 0.17 to 0.62; P = 0.0006; I² = 73%; NNTB = 4, 95% CI 3 to 5; Analysis 6.6); this result favoured use of moisturiser. The Gayraud 2015 study was the only one that did not show a difference between the treatment arms. Removing this study from the meta‐analysis altered the result only slightly. In this trial, the moisturiser base in the placebo arm appeared to be quite effective as well, possibly because it included glycerol, which might explain this effect.
The only two studies that addressed time to flare were Weber 2015 and Wirén 2009; both studies lasted six months, and the results have already been discussed under Comparison 1. There was a statistically significant difference in favour of the moisturiser groups for risk of flare (HR 3.74, 95% CI 1.86 to 7.50; P = 0.0002; I²= 0%; Analysis 1.3).
Change in use of topical active treatment
The assessments for this outcome have been presented in Comparison 1 and include two studies that evaluated the amount of topical steroid used (Giordano‐Labadie 2006; Grimalt 2007, see Analysis 1.4). See Comparison 2e‐III too (Gayraud 2015), which evaluated the number of treatment days and not the amount of topical active treatment used.
Changes in skin barrier function
Seven of the studies did not provide data that could be pooled for this outcome. Boralevi 2014 reported on the skin hydration index; Patrizi 2014 on TEWL; Breternitz 2008 and Simpson 2013 (within‐participants studies) both reported TEWL. SDs were not reported in Thumm 2000 for TEWL and skin capacitance. Both Bohnsack 1997 and Wilhelm 1998 evaluated skin capacitance (Analysis 3.1). All of the results on skin barrier function have been presented in the comparisons listed above (1, 2b, 2c, 2e‐V, and 2e‐VI).
Change in health‐related quality of life
Three studies provided usable data for this outcome (Gayraud 2015; Giordano‐Labadie 2006; Grimalt 2007). Gayraud 2015 used three separate measuring instruments. We chose to use the DFI, as that was the only instrument that covered the whole population, whilst the other two instruments assessed children on the basis of their age. Giordano‐Labadie 2006 used the CDLQI, and Grimalt 2007 used the IDQOL. (See Comparisons 1 and 2e‐III.) In the three studies, the SMD for the change from baseline in quality of life was ‐0.39 (95% CI ‐0.90 to 0.12; P = 0.13; I² = 79%; Analysis 6.7). We assessed Gayraud 2015 as being at a low risk of bias, and it demonstrated the largest effect size; we assessed the other two studies as being at a high risk of bias. Furthermore, as already stated under Comparison 1, in Grimalt 2007, 40% of the participants did not complete the questionnaires, and we assessed this domain as being at high risk of attrition bias, which might further explain some of the heterogeneity (Table 6).
2g Oil versus placebo
Three studies compared oil versus placebo and provided limited data: Gehring 1999, which reported two studies, and Hamada 2008. We assessed all of the studies as being at an unclear risk of bias. The two Gehring 1999 studies assessed evening primrose oil in different vehicles on adults, and the Hamada 2008 study assessed camellia oil versus water in both children and adults. The Gehring 1999 studies had a within‐participant design, with a treatment period of four weeks during which no other treatments were allowed. The Hamada 2008 study had a two‐week duration, a parallel design, and allowed all concomitant treatments.
Primary outcomes
Change from baseline in disease severity as assessed by the participants
This outcome was not assessed by any study.
Participant satisfaction
This outcome was not assessed by any study.
Adverse events
Only the Hamada 2008 study addressed this outcome; no adverse events were reported in the 30 participants who used camellia oil spray or in the nine who applied water spray.
Secondary outcomes
Change from baseline in disease severity as assessed by the investigators
This outcome was not assessed in the Gehring 1999 studies, but was assessed in Hamada 2008 by means of a 5‐point Likert scale. The investigators considered that the camellia oil spray treatment was effective, or very effective, in 8/30 participants, and that water spray was effective, or very effective, in 2/9 of the participants (RR 1.20, 95% CI 0.31 to 4.67; P = 0.79).
Prevention of flares (lengthening the time to first flare)
This outcome was not assessed by any study.
Change in use of topical active treatment
This outcome was not assessed by any study.
Changes in skin barrier function
The two Gehring 1999 within‐participant studies (data on 20 and 19 participants) evaluated TEWL and skin hydration. For TEWL, the MD was ‐0.34 g/m²/h (95% CI ‐1.44 to 0.76; P = 0.94; I² = 0%; Analysis 7.1), showing no difference in results between the two treatments. The measurements with corneometry showed a similar result with an MD of 0.34 (95% CI ‐2.54 to 3.21; P = 0.82; I² = 0%; Analysis 7.2).
Change in health‐related quality of life
This outcome was not assessed by any study.
(3) One moisturiser versus another moisturiser
3a Atopiclair three times daily versus Atopiclair 'light' three times daily (both containing glycyrrhetinic acid)
Patrizi 2008, a three‐armed study with 60 children, at unclear risk of bias, evaluated this comparison over 29 days (see Comparison 2a too). Atopiclair light contains the same key ingredients as Atopiclair, but at a lower concentration and with no preservatives. The study included children between the ages of two and 17 years with mild to moderate eczema. Additional low‐potency topical corticosteroids were allowed in both treatment arms as part of a rescue regimen when really needed.
Primary outcomes
Change from baseline in disease severity as assessed by the participants
Disease severity was not assessed by the participants, but itch (pruritus) was assessed on a VAS (0 cm to 10 cm, with higher values being worse). The VAS showed a reduction of 2.6 cm (SD 0.9) in the Atopiclair group (19 participants) versus a reduction of 0.23 cm (SD 0.9) in the Atopiclair light group (19 participants), with a mean difference of ‐2.37 cm (95% CI ‐2.94 to ‐1.80; P < 0.00001) in favour of the Atopiclair group.
Participant satisfaction
Participants' or caregivers' 'appraisal of acceptability of study substance' and wish to continue was a prespecified outcome. The principal investigators reported that there was a statistically significant difference in favour of Atopiclair, citing a P value of less than 0.0001, but provided no further details, and the contact person for the study was unable to provide us with further information (see Table 2).
Adverse events
In both groups, 2/20 participants reported an adverse event that was mild or moderate in severity (Peto OR 1.00, 95% CI 0.13 to 7.69; P = 1.00). The P value of Fisher's Exact Test was 1.000.
Secondary outcomes
Change from baseline in disease severity as assessed by the investigators
The review authors estimated data for this outcome from a figure that showed a change in EASI (score from 0 to 72, with higher scores being worse). The Atopiclair group (19 participants) showed a reduction of ‐4.3 (SD 3.3) and the Atopiclair light group (19 participants) showed a reduction of ‐0.8 (SD 5.53), with a MD of ‐3.50 (95% CI ‐6.40 to ‐0.60; P = 0.02).
Prevention of flares (lengthening the time to first flare)
This was reported as the need for rescue medication in the event of a flare. One of the 20 participants in the Atopiclair group experienced a flare and needed rescue medication compared to 9/18 in the Atopiclair light group (RR 0.10, 95% CI 0.01 to 0.71; P = 0.02; NNTB = 2, 95% CI 1 to 5), which was statistically significant in favour of Atopiclair.
Change in use of topical active treatment
This outcome was not assessed.
Changes in skin barrier function
This outcome was not assessed.
Change in health‐related quality of life
This outcome was not assessed.
3b Atopiclair (containing glycyrrhetinic acid) three times daily versus EpiCeram (containing ceramides, cholesterol and free fatty acids) three times daily
Miller 2011 conducted a three‐arm study (39 participants in total), which we assessed as being at a low risk of bias, to evaluate Atopiclair, EpiCeram and Aquaphor Healing Ointment (Aquaphor Healing Ointment is considered in Comparisons 3c and 3d). The study duration was 43 days; no other eczema treatment was allowed during the study. The study was conducted in children with mild to moderate eczema.
Primary outcomes
Change from baseline in disease severity as assessed by the participants
Participants did not assess disease severity, but itch was scored on a VAS from 0 mm to 100 mm (0 = no itch and 100 = the most intense itch imaginable). The mean change from baseline in itch was ‐5.73 mm (SD 15.54) in the 13 participants treated with Atopiclair and ‐20.35 mm (SD 36.21) for the 13 participants in the EpiCeram group, with a MD of 14.62 mm (95% CI ‐6.80 to 36.04; P = 0.18).
Participant satisfaction
This outcome was not assessed.
Adverse events
This was not a predefined outcome in this study, but the investigators reported that there were no serious adverse events in any group.
Secondary outcomes
Change from baseline in disease severity as assessed by the investigators
The mean change from baseline as measured with the EASI (score from 0 to 72, higher being worse) was ‐1.36 (SD 2.22) in the Atopiclair group and ‐0.95 (SD 1.91) in the EpiCeram group, which were both minimal reductions (MD ‐0.41, 95% CI ‐2.00 to 1.18; P = 0.61). The MID for the EASI is estimated at 6.6 (Schram 2012), and therefore the reductions reported are not considered clinically relevant.
Prevention of flares (lengthening the time to first flare)
This outcome was not assessed.
Change in use of topical active treatment
This outcome was not assessed.
Changes in skin barrier function
This outcome was not assessed.
Change in health‐related quality of life
This outcome was not assessed.
3c Atopiclair (containing glycyrrhetinic acid) three times daily versus Aquaphor (containing petrolatum, cera microcristallina, panthenol, glycerol, bisabolol) three times daily
This comparison includes the Aquaphor Healing Ointment arm of the Miller 2011 study, the EpiCeram arm is not considered here, but is included in Comparisons 3b and 3d.
Primary outcomes
Change from baseline in disease severity as assessed by the participants
Disease severity was not assessed, but itch was assessed on a VAS from 0 mm to 100 mm. The mean change from baseline for itch was ‐5.73 mm (SD 15.54) in the 13 participants on Atopiclair compared to ‐24.86 mm (SD 13.74) in the 13 participants treated with Aquaphor (MD 19.13 mm, 95% CI 7.85 to 30.41; P = 0.0009), which is statistically significant in favour of Aquaphor.
Participant satisfaction
This outcome was not assessed.
Adverse events
This was not a predefined outcome in this study, but the investigators reported that there were no serious adverse events in any of the intervention groups.
Secondary outcomes
Change from baseline in disease severity as assessed by the investigators
Investigators assessed disease severity with the EASI. The mean change from baseline was ‐1.36 (SD 2.22) in the Atopiclair group and ‐2.90 (SD 2.23) in the Aquaphor group (MD 1.54, 95% CI ‐0.17, 3.25; P = 0.08). These were both small improvements.
Prevention of flares (lengthening the time to first flare)
This outcome was not assessed.
Change in use of topical active treatment
This outcome was not assessed.
Changes in skin barrier function
This outcome was not assessed.
Change in health‐related quality of life
This outcome was not assessed.
3d EpiCeram (containing ceramides, cholesterol and free fatty acids) three time daily versus Aquaphor (containing petrolatum, cera microcristallina, panthenol, glycerol, bisabolol) three time daily
This is the third comparison in the Miller 2011 study (see Comparisons 3b and 3c too).
Primary outcomes
Change from baseline in disease severity as assessed by the participants
Disease severity was not assessed in this study, but reduction of itch was assessed on a VAS from 0 mm to 100 mm. The mean change from baseline for itch was ‐20.35 mm (SD 36.21) in the 13 participants treated with EpiCeram compared to a change of ‐24.86 mm (SD 13.74) in the 13 participants of the Aquaphor group (MD 4.51 mm, 95% CI ‐16.54 to 25.56; P = 0.67).
Participant satisfaction
This outcome was not assessed.
Adverse events
This was not a predefined outcome in this study, but the investigators reported that there were no serious adverse events in any of the intervention groups.
Secondary outcomes
Change from baseline in disease severity as assessed by the investigators
The investigators assessed disease severity with the EASI; the reductions in EASI were small in both arms and not clinically meaningful. The MID for the EASI is estimated at 6.6 (Schram 2012). The change from baseline in EASI score in the EpiCeram group (13 participants) was ‐0.95 (SD 1.91) and ‐2.90 (SD 2.23) in the Aquaphor group (13 participants), with a MD of 1.95 (95% CI 0.35 to 3.55; P = 0.02), which, although not a clinically important difference, does favour Aquaphor.
Prevention of flares (lengthening the time to first flare)
This outcome was not assessed.
Change in use of topical active treatment
This outcome was not assessed.
Changes in skin barrier function
This outcome was not assessed.
Change in health‐related quality of life
This outcome was not assessed.
3e EpiCeram (containing ceramides, cholesterol and free fatty acids) twice daily versus Hyalotopic (hyaluronic acid‐based emollient foam) twice daily
Only one within‐participant study (20 participants) that we judged to be at a high risk of bias compared these two interventions over four weeks (Draelos 2011). Participants had to have at least moderate eczema. No additional treatment for eczema was allowed during the study period.
Primary outcomes
Change from baseline in disease severity as assessed by the participants
Although this was a prespecified outcome, measured on a 6‐point Likert scale, these data were not reported, and we failed in our attempts to receive clarification (see Table 2 and 'Risk of bias' assessment under Characteristics of included studies). In this study, data were available for 18 participants; 6/18 felt that EpiCeram worked better while the remaining 12/18 felt Hyalotopic worked better.
Participant satisfaction
The participants expressed a preference for Hyalotopic foam over EpiCeram; 10/18 wished to continue with Hyalotopic foam, compared to 8/18 who wished to continue with EpiCeram. Thirteen thought that Hyalotopic foam had less odour, were willing to spend more money on it, found that it rubbed in more easily, and that it was more moisturising. In addition, 14 considered that Hyalotopic foam spread more easily and was easier to use than EpiCeram.
Adverse events
No adverse events occurred on either side of the participants' bodies.
Secondary outcomes
Change from baseline in disease severity as assessed by the investigators
Disease severity was assessed on a 6‐point Likert scale (0 = none, 5 = severe). No standard deviations were reported, but we estimated from a figure that on the EpiCeram side, the score went from 2.95 (3 = moderate) to 1.55 (minimal‐mild), and on the Hyalotopic foam side from 2.95 to 1.1, which are reductions of 47.5% and 62.7%, respectively.
Prevention of flares (lengthening the time to first flare)
This outcome was not assessed.
Change in use of topical active treatment
This outcome was not assessed.
Changes in skin barrier function
This outcome was not assessed.
Change in health‐related quality of life
This outcome was not assessed.
3f EpiCeram (containing ceramides, cholesterol and free fatty acids) twice daily versus colloidal oatmeal cream twice daily
One study, which we assessed as being at unclear risk of bias, was reported as a poster presentation and therefore provided limited data for this comparison (Nuñez 2013). The study was conducted over three weeks and included 49 participants. Following email contact, the principal investigator provided us with most of the missing study details (see Table 2). The study was conducted in African American children with mild to moderate eczema. No additional treatment for eczema was allowed during the study period.
Primary outcomes
Change from baseline in disease severity as assessed by the participants
This outcome was not assessed in this study, but itch was assessed on a VAS (0 cm to 10 cm, with higher scores indicating more itch). The mean change in baseline for itch was ‐0.20 cm (SD 2.03) in the 24 participants treated with EpiCeram versus 0.5 cm (SD 2.3) in the 25 participants who used the colloidal oatmeal cream, with a MD of ‐0.70 cm (95% CI ‐1.91 to 0.51; P = 0.26).
Participant satisfaction
This outcome was not assessed.
Adverse events
This outcome was not assessed.
Secondary outcomes
Change from baseline in disease severity as assessed by the investigators
The change in EASI (score 0 to 72, with higher scores being worse) over three weeks was ‐2.20 (SD 3.81) in the EpiCeram group (24 participants) versus ‐2.40 (SD 1.17) in the colloidal oatmeal cream group (25 participants), which are both small reductions; the MD was 0.20 (95% CI ‐1.39 to 1.79; P = 0.81).
Prevention of flares (lengthening the time to first flare)
This outcome was not assessed.
Change in use of topical active treatment
This outcome was not assessed.
Changes in skin barrier function
This outcome was not assessed.
Change in health‐related quality of life
This outcome was not assessed.
3g EpiCeram (containing ceramides, cholesterol and free fatty acids) versus Eucerin lotion (petrolatum‐based)
One small within‐participant pilot study evaluated these two products in 10 participants over a period of four weeks (Kircik 2014). The study was assessed as being at unclear risk of bias and mainly provided very limited data on barrier function. The application frequency of the interventions was unclear in the report. Both children and adults with mild to moderate eczema were included. No other treatment for eczema was allowed during the study period.
Primary outcomes
Change from baseline in disease severity as assessed by the participants
This outcome was not assessed.
Participant satisfaction
This outcome was not assessed.
Adverse events
This outcome was not assessed.
Secondary outcomes
Change from baseline in disease severity as assessed by the investigators
This outcome was not assessed.
Prevention of flares (lengthening the time to first flare)
This outcome was not assessed.
Change in use of topical active treatment
This outcome was not assessed.
Changes in skin barrier function
Barrier function assessment was based on measurement of TEWL and corneometry. We estimated the reduction from a figure, as the principal investigator was unable to provide more precise data (see Table 2). TEWL decreased by 2.2 g/m²/h on the EpiCeram side and by 1.4 g/m²/h on the Eucerin side, both of which are very small improvements.
Hydration improved by 55% on the EpiCeram side and by 37% on the Eucerin side; no further details were reported.
Change in health‐related quality of life
This outcome was not assessed.
3h MimyX cream (barrier cream containing lipids and palmitoylethanolamide (palmitamide MEA)) plus Eucerin twice daily versus Eucerin only twice daily
The data for this comparison were reported in a conference abstract (Laumann 2006). This was a within‐participant study that evaluated 74 participants over 12 weeks, that we assessed as being at a high risk of bias. The outcomes reported were predominantly assessments of participants' experience with Mimyx. The study included both children and adults with eczema in remission, but with a history of frequent flares.
Primary outcomes
Change from baseline in disease severity as assessed by the participants
This outcome was assessed by a questionnaire and data were available for 71 of the 74 participants. Overall, 37 participants (50%) considered Mimyx to be better than anything they had used before, 23 (31%) considered it similar to other products, and 11 (15%) considered it was not as good as other products.
Participant satisfaction
Satisfaction was also assessed with a questionnaire, with data available for 71/74 participants. Overall, 57 (77%) participants indicated that they were willing to continue treatment with Mimyx, while 14 (19%) did not want to continue. Mimyx was reported as 'very nice to use and pleasant' by 66 (89%) participants, while 5 (7%) considered it was 'not pleasant and too sticky'.
Adverse events
One participant at the end of the study reported mild stinging and burning with Mimyx cream.
Secondary outcomes
Change from baseline in disease severity as assessed by the investigators
Although this was a prespecified outcome, this was not reported (see the 'Risk of bias' assessment under Characteristics of included studies ).
Prevention of flares (lengthening the time to first flare)
The median number of days before flare was 43 days (95% CI 37 to 78) on the Mimyx plus Eucerin side versus 29 days (95% CI 15 to 43) on the Eucerin only side, which was 48% longer for Mimyx plus Eucerin. On the Mimyx plus Eucerin side of the body, 59.5% had a flare versus 74.3% on the Eucerin only side of the body.
Change in use of topical active treatment
Rescue medication was used in 41/74 participants on the Mimyx plus Eucerin side of the body, and in 50/74 on the Eucerin only side.
Changes in skin barrier function
This outcome was not assessed.
Change in health‐related quality of life
This outcome was not assessed.
3i Albolene over‐the‐counter (OTC) moisturiser twice daily versus Mimyx (barrier cream containing lipids and palmitamide MEA) twice daily
A single within‐participant study of four weeks duration with 60 adult participants reported data on this comparison (Draelos 2009). We assessed this study as being at a high risk of bias. Participants with mild eczema used the moisturisers only, while participants with moderate eczema used 0.1% triamcinolone cream as well on both sides.
Primary outcomes
Change from baseline in disease severity as assessed by the participants
Although the study lasted four weeks, no end‐of‐study data were reported, and our attempts to receive clarification from the principal investigator were unsuccessful (see Table 2). Therefore, we only report data at two weeks. Disease severity was assessed on a 6‐point Likert scale (0 = none, 5 = severe). Both treatment sides started at 2.8 and reduced to 1 at two weeks, as estimated from a figure in the report.
Participant satisfaction
This outcome was not assessed.
Adverse events
There were no adverse events at either side.
Secondary outcomes
Change from baseline in disease severity as assessed by the investigators
Disease severity was assessed by the investigators on the same Likert scale used by the participants. On both sides, disease severity went from 2.6 to 0.6 after two weeks. As with the participant data, there were no four‐week data reported, but similar to the participant‐assessed data, the investigator reported that at all time points, there were no differences between the two moisturisers.
Prevention of flares (lengthening the time to first flare)
This outcome was not assessed.
Change in use of topical active treatment
This outcome was not assessed.
Changes in skin barrier function
This outcome was not assessed.
Change in health‐related quality of life
This outcome was not assessed.
3j Aquacare (containing 10% urea, multisterols, phospholipids and fatty diols) twice daily versus Calmurid (containing 10% urea, betaine, and a high concentration of lactic acid) twice daily
These treatments were assessed in two within‐participant studies each with 30 participants (Fredriksson 1975 reports on two studies). We assessed both of these studies as being at an unclear risk of bias. Study duration was four weeks, and no other treatments were allowed.
Primary outcomes
Change from baseline in disease severity as assessed by the participants
This outcome was not assessed.
Participant satisfaction
Based on preference ratings, 27/60 participants in this within‐participant study preferred Aquacare, 7/60 preferred Calmurid (RR 3.50, 95% CI 1.30 to 9.41; P = 0.01; NNTB = 3, 95% CI 2 to 8), and 26/60 expressed no preference.
Adverse events
The 60 participants reported no adverse events on the Aquacare‐treated side, but reported 13 adverse events on the contralateral Calmurid‐treated side (RR 0.08, 95% CI 0.00 to 1.31; P = 0.08).
Secondary outcomes
Change from baseline in disease severity as assessed by the investigators
The assessments of the investigators were in agreement with the assessments of the participants. Aquacare was considered to be the more effective treatment in 28/60 participants and Calmurid was considered more effective in 7/60 participants (RR 3.50, 95% CI 1.30 to 9.41; P = 0.01; NNTB = 3, 95% CI 2 to 8); both treatments were considered equally effective in 25 participants.
Prevention of flares (lengthening the time to first flare)
This outcome was not assessed.
Change in use of topical active treatment
This outcome was not assessed.
Changes in skin barrier function
This outcome was not assessed.
Change in health‐related quality of life
This outcome was not assessed.
3k Locobase repair (containing ceramide III, cholesterol and free fatty acids) twice daily versus Atoderma (containing glycerol, ceramides, cholesterol, vitamin E) twice daily
These moisturisers were evaluated in a single study with a duration of one year, and we assessed the study as being at a high risk of bias (Namazova‐Baranova 2012). All participants in both groups received 0.1% hydrocortisone 17‐butyrate cream one to three times a day and oral antihistamines as needed. The study was conducted in 44 children between six months and 12 years of age with eczema of moderate severity.
Primary outcomes
Change from baseline in disease severity as assessed by the participants
This outcome was not assessed.
Participant satisfaction
This outcome was not assessed.
Adverse events
None of the 44 participants reported an adverse event.
Secondary outcomes
Change from baseline in disease severity as assessed by the investigators
The investigators measured disease severity with SCORAD (score 0 to 103, higher score being worse). The change in SCORAD was ‐29.9 (SD 8.1) in the 22 participants on Locobase repair versus ‐27.1 (SD 7.9) in the 22 participants treated with Atoderm, both of which are substantial and clinically important reductions, but with a MD of ‐2.80 (95% CI ‐7.53 to 1.93; P = 0.25), so there was no clear difference between the groups.
Prevention of flares (lengthening the time to first flare)
The only information reported stated: "Clinically, a decrease in the recurrence of the disease and the severity of the current 1‐year follow‐up was observed."
Change in use of topical active treatment
Over the one‐year study period, the mean daily consumption of topical corticosteroid decreased by 1.6 g per day in the Locobase repair group (22 participants) and 1.7 g per day in the Atoderm group (22 participants) to achieve similar reduction in eczema severity.
Changes in skin barrier function
This outcome was not assessed.
Change in health‐related quality of life
The CDLQI was used to assess changes in quality of life (score 0 to 30: 0 to 1 = no effect on quality of life, 19 to 30 = extremely large effect on quality of life). The investigators reported the degree of reduction in scores as percentages without providing the exact data. The CDLQI score reduced by ‐12.7% in the Locobase repair group (22 participants) and by ‐11.55% in the Atoderm group (22 participants), which indicates that the quality of life in both groups improved over the treatment period.
3l Canoderm (containing urea 5%) twice daily versus Miniderm (reference cream without urea) twice daily
These moisturisers were evaluated by a single study with 172 adult participants; we judged this study to be at a low risk of bias (Åkerström 2015). The study consisted of two phases. In the stabilisation phase, all participants were treated with once‐daily topical mometasone furoate cream 0.1% (Elocon) on the trunk and extremities, and hydrocortisone cream 1% on the face, groin, and armpits. In addition, in this phase of the study the participants used a medicinal moisturiser containing 20% glycerol (Miniderm). After (almost) clearing the eczema, participants entered the maintenance phase for 180 days, one group using Canoderm (containing 5% urea) and the other using Miniderm reference cream (without 20% glycerol). No topical corticosteroids were allowed.
Primary outcomes
Change from baseline in disease severity as assessed by the participants
This outcome was not assessed.
Participant satisfaction
This outcome was not assessed.
Adverse events
In the Canoderm group, 48/87 participants reported an adverse event compared to 44/85 in the Miniderm group (RR 1.07, 95% CI 0.81 to 1.41; P = 0.65). These adverse events included erythema, pruritus, and burning and were mainly considered to be mild to moderate in severity and unrelated to treatment.
Secondary outcomes
Change from baseline in disease severity as assessed by the investigators
At the start of the maintenance phase (after being treated with topical corticosteroids), the SCORAD had reduced substantially to around six in both groups. At the end of the 180 days for those participants who remained 'eczema free', the mean change in SCORAD was ‐3.38 (SD 4.24) in the Canoderm group (21 participants) versus 0.44 (SD 4.07) in the Miniderm group (8 participants) (MD ‐3.82, 95% CI ‐7.17 to ‐0.47; P = 0.03), which, although it is a statistically significant difference, is not clinically relevant, as the MID for the SCORAD is estimated to be 8.7 (Schram 2012).
For those who relapsed, the mean SCORAD increased to 27.45 (SD 10.32) in the Canoderm group (66 participants) and to 30.46 (SD 12.67) in the Miniderm group (77 participants) (MD ‐3.01, 95% CI ‐6.78 to 0.76; P = 0.12).
Prevention of flares (lengthening the time to first flare)
At the end of the 180‐day maintenance phase, 21/87 of the participants in the Canoderm group had not experienced a flare, compared to 8/85 in the Miniderm group (RR 2.56, 95% CI 1.20 to 5.47; P = 0.01; NNTB = 7, 95% CI 3 to 26). The median time to flare was 22 days in the Canoderm group compared to 15 days in the Miniderm group. At day 180, 66/87 (75.8%) in the Canoderm group had a flare versus 77/85 (90.1%) in the Miniderm group, which corresponds to an absolute risk reduction of flare of 14.0% and a relative risk reduction of 15.6% with the use of Canoderm.
Change in use of topical active treatment
This outcome was not assessed.
Changes in skin barrier function
This outcome was not assessed.
Change in health‐related quality of life
This outcome was measured using the EQ‐5D health questionnaire covering five dimensions (mobility, self‐care, usual activities, pain/discomfort, anxiety/depression) and a VAS that was rated 0 to 100 (100 equated to "best health you can imagine") (The EuroQol Group 1990). At the start of the maintenance phase in the Canoderm group, the score was 90 (after a period of treatment with topical corticosteroids) and 90 at the end of the study, and for those with a flare, the score reduced to 82.5. In the Miniderm group, it started at 89 and was 95 at the end of the study, but for those who experienced a flare, it dropped to 74.0.
On the EQ‐5D 5‐item instrument, the mean score was 0.945 (SD 0.137) at the beginning of the maintenance phase and 0.951 (SD 0.093) at end of study in the Canoderm group, but this score dropped to 0.881 (SD 0.154) in those with a flare. In the Miniderm group, the score at the start of the maintenance phase was 0.931 (SD 0.135), and at the end of the study and during flare, it was 0.935 (SD 0.136) and 0.851 (SD 0.152), respectively. These scores indicate that the quality of life remained relatively stable during the eczema‐free periods, but decreased during flares.
3m Urea 5% moisturiser twice daily versus urea 10% lotion twice daily
These two moisturisers were compared in one six‐week study with 100 adult participants; we assessed this study as being at an unclear risk of bias (Bissonnette 2010). The use of a stable dose of topical corticosteroids was permitted throughout the study period in both groups.
Primary outcomes
Change from baseline in disease severity as assessed by the participants
This outcome was not assessed.
Participant satisfaction
Cosmetic acceptability was assessed with a questionnaire consisting of 21 items (each scored from 0 = totally agree to 3 = totally disagree), with a lower total score indicating better acceptability. At the end of the study, 43/50 participants treated with urea 5% moisturiser had a mean score of 20.52 (SD 11.93) versus 29.75 (SD 13.03) in the 44/50 participants treated with urea 10% lotion (MD ‐9.23, 95% CI ‐14.32 to ‐‐4.14; P = 0.0004); this result favours the urea 5% moisturiser.
Adverse events
In the urea 5% group, 12/50 participants reported adverse events versus 10/50 in the urea 10% group, with a RR of 1.20 (95% CI 0.57 to 2.52; P = 0.63). The adverse events were reported to be of mild intensity.
Secondary outcomes
Change from baseline in disease severity as assessed by the investigators
Investigators assessed disease severity with SCORAD (score from 0 to 103, higher score being worse). The mean change from baseline was ‐4.52 (SD 4.63) in the urea 5% group (43 participants) versus ‐4.39 (SD 5.48) in the urea 10% group (44 participants) (MD ‐0.13, 95% CI ‐2.26 to 2.00; P = 0.90).
Prevention of flares (lengthening the time to first flare)
This outcome was not assessed.
Change in use of topical active treatment
This outcome was not assessed.
Changes in skin barrier function
This outcome was not assessed.
Change in health‐related quality of life
This outcome was not assessed.
3n Urea 4% and sodium chloride 40 mg/g in oil‐in‐water emulsion twice daily versus urea 4% in oil‐in‐water emulsion twice daily
These moisturisers were compared by one within‐participant study with a small sample size (22 participants), which we assessed as being at an unclear risk of bias (Hagströmer 2001). The study duration was two weeks, and no topical steroids were allowed. The study was conducted in adult participants with eczema, and only forearms were treated. There were minimal changes in barrier function after treatment between the two treatments.
Primary outcomes
Change from baseline in disease severity as assessed by the participants
This outcome was not assessed.
Participant satisfaction
This outcome was not assessed.
Adverse events
This outcome was not assessed.
Secondary outcomes
Change from baseline in disease severity as assessed by the investigators
This outcome was not assessed.
Prevention of flares (lengthening the time to first flare)
This outcome was not assessed.
Change in use of topical active treatment
This outcome was not assessed.
Changes in skin barrier function
We had to estimate data from a figure; the change from baseline in TEWL was ‐0.60 g/m²/h (SD 1.90) on the urea 4% plus sodium chloride side versus 2.50 g/m²/h (SD 2.5) on the urea 4% only side, with a mean of the paired differences of ‐3.10 g/m²/h (95% CI ‐3.84 to ‐2.36), which is a statistically significant difference in favour of urea 4% plus sodium chloride.
Skin barrier function was also assessed with a corneometer (0 to 120, with higher measurements indicating greater hydration); the mean change from baseline was 8 arbitrary units (SD 3) on the urea 4% plus sodium chloride side versus 14 arbitrary units (SD 3.16) on the urea 4% only side, with a mean of the paired differences of ‐6.0 arbitrary units (95% CI ‐7.00 to ‐5.00), which was a statistically significant difference in favour of urea 4% only.
Change in health‐related quality of life
This outcome was not assessed.
3o Glycerol cream 20% once daily versus urea 4% cream once daily
These moisturisers constituted the third comparison in the three‐armed study conducted by Lodén 2002 (see Comparisons 2b and 2c). The study lasted 30 days and was assessed as being at an unclear risk of bias. The participants in all treatment arms were allowed to continue their use of topical corticosteroids.
Primary outcomes
Change from baseline in disease severity as assessed by the participants
In the glycerol cream group, 58/68 participants considered the dryness of their skin to be improved versus 56/63 in the urea group with no difference between groups (RR 0.96, 95% CI 0.84 to 1.09; P = 0.54).
Participant satisfaction
This outcome was not assessed.
Adverse events
Smarting was mentioned by 27/68 in the glycerol cream group and by 41/63 in the urea cream group (RR 0.61, 95% CI 0.43 to 0.86; P = 0.005; NNTH = 4, 95% CI 2 to 11) in favour of the glycerol cream. However, the investigators stated that there "were no differences between treatment with the cream containing glycerol and urea regarding stinging, itching and experience of dryness/irritation".
Secondary outcomes
Change from baseline in disease severity as assessed by the investigators
The investigators assessed dryness of skin with the DASI (score from 0 to 20, higher being worse) (Serup 1995). No exact data were provided, but the investigators stated "no differences were observed in disease severity as DASI scores between the glycerol and urea group (P = 0.787)."
The DASI score improved for 27/68 in the glycerol cream group and for 56/63 in the urea cream group, which does not agree with the assessments of the participants (RR 0.45, 95% CI 0.33 to 0.61; P < 0.00001; NNTB = 2, 95% CI 1 to 3).
Prevention of flares (lengthening the time to first flare)
This outcome was not assessed.
Change in use of topical active treatment
This outcome was not assessed.
Changes in skin barrier function
This outcome was not assessed.
Change in health‐related quality of life
This outcome was not assessed.
3p Propyless (containing propylene glycol 20%) twice daily versus Fenuril (containing urea 4% and sodium chloride 4%) twice daily
These moisturisers were compared in a two‐week within‐participant study with 56 participants, which we assessed as being at a high risk of bias (Faergemann 2009). No other treatment was allowed. The study was conducted in adult participants with eczema and with symmetrical areas of dry skin on their lower legs.
Primary outcomes
Change from baseline in disease severity as assessed by the participants
No exact data were provided in the report, and the investigators merely stated that "Propyless lotion resulted in statistically significantly less itching (P = 0.046) and irritation (P = 0.014). No statistical significance was observed for smarting (P = 1.0) or stinging (P = 0.75). The change in total score was statistically significantly better for Propyless lotion than for Fenuril cream (P = 0.049)."
Participant satisfaction
This outcome was not assessed.
Adverse events
Two adverse events were reported on the side treated with Propyless lotion; these were itching in one participant and eczema in another participant.
Secondary outcomes
Change from baseline in disease severity as assessed by the investigators
No precise data were reported. Investigators reported improvements for both treated sides and that "there were no statistically significant differences between the two treatments with respect to the DASI [score from 0 to 20, higher being worse] evaluations" and "In total, 69% of the investigators and patients rated the overall treatment effect of Propyless as better (40%) or equal (29%) to that of Fenuril."
Prevention of flares (lengthening the time to first flare)
This outcome was not assessed.
Change in use of topical active treatment
This outcome was not assessed.
Changes in skin barrier function
This was assessed in only 20/56 participants and as with the previously reported assessments, no precise data were provided. The investigators only reported that "no (Fenuril) or almost no (decrease of 0.1 g/m2/h for Propyless) effect on TEWL was observed after treatment."
Change in health‐related quality of life
This outcome was not assessed.
3q Ceramide‐containing moisturiser twice daily versus 'control moisturiser' twice daily
This comparison was evaluated in Noh 2011, a six‐week trial in 40 children with mild to moderate eczema. We assessed the study as being at a high risk of bias. Topical corticosteroids were applied twice daily to all participants.
Primary outcomes
Change from baseline in disease severity as assessed by the participants
This outcome was not assessed.
Participant satisfaction
This outcome was not assessed.
Adverse events
This outcome was not assessed.
Secondary outcomes
Change from baseline in disease severity as assessed by the investigators
The investigators measured disease severity with EASI (score from 0 to 72, higher being worse). The mean change from baseline in EASI score was ‐6.65 (SD 2.79) in the ceramide‐containing moisturiser group (15 participants) and ‐7.31 (SD 2.64) in the control moisturiser group (17 participants), which are both clinically relevant reductions as the MID for the EASI is estimated at 6.6 (Schram 2012). However, the MD between groups was 0.66 (95% CI ‐1.23 to 2.55; P = 0.49), which was not a statistically significant difference.
Prevention of flares (lengthening the time to first flare)
This outcome was not assessed.
Change in use of topical active treatment
The amount of topical corticosteroids used (to achieve a similar reduction in eczema severity) over a six‐week period had to be estimated from a figure and was approximately 10 g in the ceramide‐containing moisturiser group and according to the figure in the report was 7.46% higher in the control moisturiser group.
Changes in skin barrier function
The mean change from baseline in TEWL was ‐14 g/m²/h (SD 12.24) in the 15 participants who were treated with the ceramide‐containing moisturiser versus ‐12 g/m²/h (SD 9.94) in the 17 participants in the control moisturiser group (MD ‐2.00 g/m2/h, 95% CI ‐9.79 to 5.79; P = 0.61).
Assessment with a corneometer showed that the hydration of the skin had improved by 17 arbitrary units (SD 13.98) in the ceramide‐containing moisturiser group (15 participants) versus 10 arbitrary units (SD 13.03) in the control moisturiser group (17 participants) (MD 7.00 arbitrary units, 95% CI ‐2.40 to 16.40; P = 0.14).
Change in health‐related quality of life
This outcome was not assessed.
3r Furfuryl palmitate enriched moisturiser twice daily versus moisturiser twice daily
These treatment options were investigated by a single study in 117 children with eczema; we assessed the study as being at a high risk of bias (Tripodi 2009). The study duration was two weeks, during which time no other treatment was allowed.
Primary outcomes
Change from baseline in disease severity as assessed by the participants
This outcome was assessed through a questionnaire completed by parents and paediatricians, and, although no exact data were reported, the investigators stated that "both paediatricians and parents rated the moisturiser cream without furfuryl palmitate to be more efficacious than the cream with furfuryl palmitate (P = 0.016)."
Participant satisfaction
This outcome was not assessed.
Adverse events
This outcome was not assessed.
Secondary outcomes
Change from baseline in disease severity as assessed by the investigators
Disease severity was evaluated with SCORAD. In the furfuryl palmitate enriched moisturiser group (39 participants), the mean change from baseline in SCORAD was ‐7.10 (SD 8.42), and in the in the control group (49 participants) ‐11.60 (SD 6.13), with a MD of 4.50 (95% CI 1.35 to 7.65; P = 0.005). The MID for the SCORAD is estimated to be 8.7 (Schram 2012); therefore, the decrease in SCORAD in the control group was a clinically relevant reduction.
Prevention of flares (lengthening the time to first flare)
This outcome was not assessed.
Change in use of topical active treatment
This outcome was not assessed.
Changes in skin barrier function
This outcome was not assessed.
Change in health‐related quality of life
This outcome was not assessed.
3s PRO‐AMP cream (containing rhamsosoft, ceramides, L‐isoleucine) twice daily versus 'hydrating' cream (containing glycerol, vaseline, paraffin) twice daily
This comparison was assessed in a study we judged as being at a high risk of bias (Marseglia 2014). The moisturisers were applied to the faces (only) of 107 children with mild to moderate eczema for a period of six weeks, and no other treatments were allowed.
Primary outcomes
Change from baseline in disease severity as assessed by the participants
This outcome was not assessed.
Participant satisfaction
This outcome was not assessed.
Adverse events
This outcome was not assessed.
Secondary outcomes
Change from baseline in disease severity as assessed by the investigators
The EASI facial score was used to assess eczema severity; the mean change from baseline was ‐5.10 (SD 1.58) in the PRO‐AMP cream group (72 participants) and ‐2.70 (SD 1.84) in the control group (35 participants) (MD ‐2.40, 95% CI ‐3.11 to ‐1.69; P < 0.00001). Sixty‐three of the 72 participants in the PRO‐AMP cream group achieved treatment success (i.e. Investigator Global assessment (IGA) score < 1: where 0 = clear, 1 = almost clear, 2 = mild disease, 3 = moderate disease, 4 = severe) versus 20/35 in the control arm (RR 1.53, 95% CI 1.13 to 2.07; P = 0.005; NNTB = 3, 95% CI 2 to 8), this result favours the PRO‐AMP cream.
Prevention of flares (lengthening the time to first flare)
This outcome was not assessed.
Change in use of topical active treatment
This outcome was not assessed.
Changes in skin barrier function
This outcome was not assessed.
Change in health‐related quality of life
This outcome was not assessed.
3t Hippophae rhamnoides 10% cream versus Hippophae rhamnoides 20% cream
This is the third comparison of the Thumm 2000 three‐armed study with 43 participants (see Comparisons 2e‐V and 2e‐VI too). Sea buckthorn oil (Hippophae rhamnoides) 10% and 20% cream containing beeswax, paraffin, and glycerol was applied for four weeks. We assessed this study as being at an unclear risk of bias.
Primary outcomes
Change from baseline in disease severity as assessed by the participants
Disease severity was not assessed by the participants; however, itch was assessed on a VAS. No precise data were reported other than that itch severity improved in both groups, but without a statistically significant difference between the groups.
Participant satisfaction
This outcome was not assessed.
Adverse events
This outcome was not assessed.
Secondary outcomes
Change from baseline in disease severity as assessed by the investigators
The investigators assessed disease severity with the SCORAD. No standard deviations were provided, but the SCORAD in the H rhamnoides 10% cream group (17 participants) decreased by 9.52, and in the H rhamnoides 20% cream group (17 participants), it decreased by 10.98. Both results indicate clinically relevant reductions (MID for the SCORAD is estimated to be 8.7 (Schram 2012)), but with no important difference between the groups.
Prevention of flares (lengthening the time to first flare)
This outcome was not assessed.
Change in use of topical active treatment
This outcome was not assessed.
Changes in skin barrier function
TEWL showed a decrease of 10.20 g/m²/h in the H rhamnoides 10% cream group (n = 17) and of 10.59 g/m²/h in the H rhamnoides 20% cream group (n = 17). No standard deviations were provided. Skin hydration improved in both arms by 8 units and 14.84 units, respectively.
Change in health‐related quality of life
The DLQI was used for measuring changes in quality of life (score 0 to 30, with a higher score indicating greater impairment of quality of life). The mean change from baseline was ‐2.74 for the H rhamnoides 10% cream group (17 participants) and ‐3.67 for the H rhamnoides 20% cream group (17 participants). Previously, the MID of the DLQI varied between three and five, but a MID of four is the current recommended value for inflammatory skin diseases (Basra 2015), therefore, these changes from baseline were not clinically important, nor was the difference between groups.
3u Lactobacillus sakei‐containing moisturiser twice daily versus 'control moisturiser' twice daily
A within‐participant study in 30 children evaluated the effect of a moisturiser that contains a vegetable‐derived lactobacillus for the treatment of eczema (Park 2014). The study duration was four weeks. We assessed the study as being at an unclear risk of bias. Continued usage of topical corticosteroids on both sides was permitted.
Primary outcomes
Change from baseline in disease severity as assessed by the participants
Disease severity was not assessed, but itch was assessed on a VAS (0 cm to 10 cm, with higher scores indicating more itch) in 28 participants. On the side treated with Lsakei‐containing moisturiser, the mean change in itch was ‐2.03 cm (SD 1.12) versus ‐1.50 cm (SD 1.11) on the control side, with a mean of the paired differences of ‐0.53 cm (95% CI ‐0.84 to ‐0.22) in favour of the side treated with Lsakei‐containing moisturiser.
Participant satisfaction
This outcome was not assessed.
Adverse events
No precise data were provided, but three participants reported mild burning and stinging on the Lsakei‐containing moisturiser side, which resolved within three days.
Secondary outcomes
Change from baseline in disease severity as assessed by the investigators
The investigators reported no statistically significant difference between the treatment sides (28 participants). The mean change from baseline as measured on the IGA scale (0 = clear, 4 = severe) was ‐0.85 (SD 0.44) on the L sakei‐containing moisturiser side and ‐0.71 (SD 0.42) on the control side, with a mean of the paired differences of ‐0.14 (95% CI ‐0.26 to ‐0.02) in favour of Lsakei‐containing moisturiser.
Prevention of flares (lengthening the time to first flare)
This outcome was not assessed.
Change in use of topical active treatment
This outcome was not assessed.
Changes in skin barrier function
Skin barrier function was assessed through TEWL and corneometry in the 28 participants. The mean change from baseline in TEWL was ‐15.10 (SD 5.88) g/m²/h on the Lsakei‐containing moisturiser side and ‐5.30 (SD 5.31) g/m²/h on the control side, with a statistically significant mean of the paired differences of ‐9.80 g/m²/h (95% CI ‐11.43 to ‐8.17), which favours Lsakei‐containing moisturiser. Corneometry showed an increase of 17.60 (6.83) arbitrary units versus 9.10 (6.32) arbitrary units, respectively, with a mean of the paired differences of 8.50 (95% CI 6.60 to 10.40), which was also statistically significant in favour of the Lsakei‐containing moisturiser.
Change in health‐related quality of life
This outcome was not assessed.
3v Virgin coconut oil twice daily versus mineral oil twice daily
A single eight‐week study that we assessed as being at an unclear risk of bias compared these two oils in 117 children with mild to moderate eczema (Evangelista 2014). No other treatments were allowed.
Primary outcomes
Change from baseline in disease severity as assessed by the participants
This outcome was not assessed.
Participant satisfaction
This outcome was not assessed.
Adverse events
No adverse events were reported in the virgin coconut oil group (59 participants), but five of the 58 children in the mineral oil group reported adverse events (increase in erythema, pruritus) necessitating rescue therapy with topical corticosteroids (Peto OR 0.12, 95% CI 0.02 to 0.74; P = 0.02). The P value of Fisher's Exact Test was 0.0273.
Secondary outcomes
Change from baseline in disease severity as assessed by the investigators
Disease severity was measured with the SCORAD (score from 0 to 103, with higher scores being worse). Data were reported as 'moderate improvement' (30% to 75%) or 'excellent improvement' (> 75%). In the virgin coconut oil group, 28/59 participants experienced moderate improvement versus 20/58 in the mineral oil group (RR 1.38, 95% CI 0.88 to 2.15; P = 0.16). Excellent improvement was seen in 27/59 in the virgin coconut oil group and 11/58 in the mineral oil group (RR 2.41, 95% CI 1.32 to 4.40; P = 0.004; NNTB = 4, 95% CI 2 to 9), which was statistically significant in favour of virgin coconut oil.
Prevention of flares (lengthening the time to first flare)
This outcome was not assessed.
Change in use of topical active treatment
This outcome was not assessed.
Changes in skin barrier function
The change from baseline in TEWL was ‐19.71 g/m²/h (SD 12.72) in the virgin coconut oil group and ‐10.57 g/m²/h (SD 12.72) in the mineral oil group, with a MD of ‐9.14 g/m²/h (95% CI ‐13.75 to ‐4.53; P = 0.0001). The skin capacitance increased by 10.30 (SD 4.17) versus 6.18 (SD 4.17), respectively (MD 4.12, 95% CI 2.61, 5.63; P < 0.00001). Both measurements were in favour of virgin coconut oil.
Change in health‐related quality of life
This outcome was not assessed.
3w Virgin coconut oil twice daily versus virgin olive oil twice daily
These two oils were evaluated in 52 adult participants with newly diagnosed mild to 'high moderate' eczema (Verallo‐Rowell 2008). We assessed the study as being at an unclear risk of bias. The study had a four‐week duration in which no other moisturisers or products were allowed.
Primary outcomes
Change from baseline in disease severity as assessed by the participants
This outcome was not assessed.
Participant satisfaction
This outcome was not assessed.
Adverse events
This outcome was not assessed.
Secondary outcomes
Change from baseline in disease severity as assessed by the investigators
The investigators assessed disease severity with the objective SCORAD (Kunz 1997). The mean change from baseline was ‐16.60 (SD 4.13) in the group treated with virgin coconut oil (26 participants) compared to ‐9.90 (SD 3.84) in the virgin olive oil group (26 participants), both of which are clinically important reductions (the MID objective SCORAD is 8.2 (Schram 2012)); the MD was ‐6.70 (95% CI ‐8.87 to ‐4.53; P < 0.00001) in favour of virgin coconut oil.
Prevention of flares (lengthening the time to first flare)
This outcome was not assessed.
Change in use of topical active treatment
This outcome was not assessed.
Changes in skin barrier function
This outcome was not assessed.
Change in health‐related quality of life
This outcome was not assessed.
3x Bleach bath with moisturiser versus water bath with moisturiser once daily
The intervention under investigation for this comparison was the 'bleach bath' and not the moisturiser (Shi 2015). Reducing Staphylococcus aureus has been shown to have an effect on the disease severity of eczema (Hon 2016). The Shi 2015 study had a within‐participant design with 20 participants, 10 of whom had eczema. The study was designed to evaluate skin barrier function following bleach bath and water bath, and we assessed it as being at a high risk of bias. Immersion of the volar surface of the forearm in the bleach bath or water bath for 10 minutes was followed by the application of a moisturiser containing glycerol and petrolatum.
Primary outcomes
Change from baseline in disease severity as assessed by the participants
This outcome was not assessed.
Participant satisfaction
This outcome was not assessed.
Adverse events
This outcome was not assessed.
Secondary outcomes
Change from baseline in disease severity as assessed by the investigators
This outcome was not assessed.
Prevention of flares (lengthening the time to first flare)
This outcome was not assessed.
Change in use of topical active treatment
This outcome was not assessed.
Changes in skin barrier function
Both treatments (bleach bath and water bath) had very limited effect on TEWL values and corneometry.
Immediately after the bath, the TEWL increased for both arms from 12 g/m²/h to slightly over 30 g/m²/h; however, after 15 minutes, TEWL decreased again in both volar surfaces of the forearms and remained stable over 60 minutes. After 60 minutes, the changes from baseline (from before the bath) were ‐2.15 g/m²/h (SD 6.18) on the side treated with bleach bath and moisturiser versus ‐2.63 g/m²/h (SD 5.19) on the water bath side, with a mean of the paired differences of 0.48 g/m²/h (95% CI ‐2.30 to 3.26). Assessments with the corneometer showed substantial increases from around 24 arbitrary units for both forearms at baseline, to around 60 arbitrary units immediately after the bath. Within 15 minutes, these returned to baseline values and remained stable for 60 minutes. The mean changes from baseline from before the bath were ‐1.36 arbitrary units (SD 6.85) on the bleach bath side and ‐1.84 arbitrary units (SD 6.30) on the water bath side, with a mean of the paired differences of 0.48 arbitrary units (95% CI ‐2.70 to 3.66).
Change in health‐related quality of life
This outcome was not assessed.
(4) Moisturisers versus active treatment
4a Licochalcone (containing Glycyrrhiza inflata root extract, decanediol, menthoxypropanediol and ω‐6‐fatty acids) twice daily versus hydrocortisone acetate 1% cream twice daily
Three within‐participant studies (100 participants) evaluated the efficacy of these treatments (Angelova‐Fischer 2014; Udompataikul 2011; Wanakul 2013). We could only include data for the first week from Angelova‐Fischer 2014, because after one week, all participants received licochalcone‐containing cream. This study evaluated the interventions on forearms only and included both children and adults. The Udompataikul 2011 and Wanakul 2013 studies lasted six and four weeks, respectively, and were conducted only in children. We assessed both the Angelova‐Fischer 2014 and Udompataikul 2011 studies as being at a high risk of bias, and the Wanakul 2013 as being at a unclear risk of bias. Additional treatment for eczema was not permitted in any of these studies.
See summary of findings Table 7.
Primary outcomes
Change from baseline in disease severity as assessed by the participants
Disease severity was not assessed by the participants in any of the three studies. However, itch was assessed in both Angelova‐Fischer 2014 and Wanakul 2013. At one week in the Angelova‐Fischer 2014 study (18 participants), itch severity assessed on a VAS (0 cm to 10 cm, with 10 being worst imaginable itch), reduced by 1.75 cm (SD 1.82) in the arm treated with licochalcone‐containing cream and by 2.75 cm (SD 1.36) in the arm treated with hydrocortisone acetate 1% cream. The mean of the paired differences was 1.00 cm (95% CI 0.39 to 1.61). The Wanakul 2013 study (52 participants) also assessed itch with a VAS (0 cm to 10 cm). After four weeks, itch had decreased from baseline by 4.00 cm (SD 2.25) on the licochalcone‐treated side of the body and by 4.00 cm (SD 2.22) on the hydrocortisone acetate‐treated side. Both appeared to be effective in reducing itch with no difference between treatment arms (mean of the paired differences: 0.0 cm, 95% CI ‐0.47 to 0.47). Pooled data demonstrated a MD of ‐0.48 (95% CI ‐1.46 to 0.50; P = 0.34; I² = 85%; Analysis 8.1).
Participant satisfaction
This outcome was only assessed in Udompataikul 2011, where it was scored on a 5‐point Likert scale. Twenty‐two of the 30 participants rated their satisfaction as good to excellent, with no difference between either side.
Adverse events
Both Udompataikul 2011 and Wanakul 2013 reported no adverse events on either side during the study, however, Angelova‐Fischer 2014 reported detailed side effects based on a standardised questionnaire. There were nine side effects on the 18 forearms treated with licochalcone (erythema (1), skin dryness (1), burning (2), skin tightness (1), and itch (4)) and nine on the contralateral arm (erythema (1), scaling (1), skin dryness (1), burning (3), skin tightness (1), and itch (2)).
Secondary outcomes
Change from baseline in disease severity as assessed by the investigators
All three studies measured disease severity with SCORAD (score from 0 to 103, higher score being worse). In Angelova‐Fischer 2014 the SCORAD decreased by 3.50 (SD 2.34) in one week on the side treated with licochalcone (18 sides) and by 3.50 (SD 1.85) on the hydrocortisone acetate‐treated side (18 sides), with a mean of the paired differences of 0.0 (95% CI ‐0.78 to 0.78).
In Udompataikul 2011 (26 participants), the mean change from baseline in SCORAD after four weeks was ‐18.72 (SD 6.96) on the licochalcone side and ‐21.29 (SD 6.14) on the hydrocortisone acetate side (mean of the paired differences of 2.57, 95% CI 0.59 to 4.55). In Wanakul 2013 (52 participants), the mean changes from baseline after four weeks were ‐14.00 (SD 6.85) on the licochalcone side and ‐12.00 (SD 7.09) on the hydrocortisone acetate side (mean of the paired differences of ‐2.00 (95% CI ‐3.47 to ‐0.53)). In both studies, the reductions in both treatment arms were clinically important, as the MID was met (MID SCORAD is 8.7 (Schram 2012)). Pooled data of the mean change from baseline in SCORAD resulted in a MD of 0.08 (95% CI ‐1.96 to 2.13; P = 0.94; I² = 85%; Analysis 8.2). We explored reasons for the heterogeneity (see Table 6), and considered that the most important factor was that the effect sizes differed between the studies. Furthermore, we could only include data for the first week of the Angelova‐Fischer 2014 study, as the first week was the only randomised one, and therefore smaller reductions were reported in both treatment arms compared to the other two studies, which had a four‐week duration with a correspondingly larger treatment effect. In addition, in Angelova‐Fischer 2014only the forearms/arms were treated.
Prevention of flares (lengthening the time to first flare)
This outcome was only assessed in the Udompataikul 2011 study (30 participants), where 3/30 experienced a flare on the side treated with licochalcone and 6/30 on the side treated with hydrocortisone acetate 1%.
Change in use of topical active treatment
This outcome was not assessed in any study.
Changes in skin barrier function
Two studies assessed this outcome (Angelova‐Fischer 2014; Wanakul 2013). In Angelova‐Fischer 2014 (18 participants), the mean change from baseline in TEWL after one week was ‐9.92 g/m²/h (SD 9.08) on the licochalcone‐treated forearms and ‐12.43 g/m²/h (SD 11.17) on those treated with hydrocortisone acetate 1% (the mean of the paired differences was 2.51 g/m²/h, 95% CI ‐1.21 to 6.23). In Wanakul 2013 (52 participants), the mean change from baseline in TEWL after four weeks was ‐4.0 g/m²/h (SD 7.44) on the licochalcone side and ‐1.00 g/m²/h (SD 8.59) on the hydrocortisone acetate 1% side (the mean of the paired differences was ‐3.00 g/m²/h, 95% CI ‐4.71 to ‐1.29). Pooled data of the mean change from baseline in TEWL demonstrated a MD of ‐0.50 g/m²/h (95% CI ‐5.88 to 4.87; P = 0.85; I² = 86%; Analysis 8.3). The reductions on both treatment sides were clearly smaller after four weeks than the reductions after only one week in Angelova‐Fischer 2014. Furthermore, the differences in effect between both sides of the body were small in both studies.
Change in health‐related quality of life
This outcome was not assessed in any study.
4b‐I Stelatopia (2% sunflower oil, fatty acids, ceramides) twice daily versus hydrocortisone butyric propionate 0.1% twice daily
This comparison was evaluated over three weeks in the De Belilovsky 2011 study. We assessed this study as being at a high risk of bias. It was conducted on 80 children aged four months to four years, with mild to moderate eczema.
Primary outcomes
Change from baseline in disease severity as assessed by the participants
This outcome was not assessed.
Participant satisfaction
This outcome was not assessed.
Adverse events
No participants reported adverse events.
Secondary outcomes
Change from baseline in disease severity as assessed by the investigators
After three weeks, the mean change from baseline in SCORAD was ‐27.48 (SD 7.63) in the 40 participants treated with Stelatopia versus ‐26.20 (SD 9.80) in the 40 treated with hydrocortisone butyric propionate 0.1% cream (MD ‐1.28, 95% CI ‐5.13 to 2.57; P = 0.51), which was not a statistically significant difference between the groups. However, the reductions in both treatment arms were substantial and clinically important, as the MID for SCORAD is estimated at 8.7 (Schram 2012).
Prevention of flares (lengthening the time to first flare)
The investigators 'agreed' or 'strongly agreed' (assessment based on a 5‐point Likert scale) that the frequency of flares was reduced in 37/40 participants treated with Stelatopia versus 32/40 treated with hydrocortisone butyric propionate 0.1% cream (RR 1.16, 95% CI 0.97 to 1.38; P = 0.11).
Change in use of topical active treatment
This outcome was not assessed.
Changes in skin barrier function
This outcome was not assessed.
Change in health‐related quality of life
This outcome was evaluated with two instruments for all 80 participants: the IDQOL (scores range from 0 (no quality of life impairment) to 30 (highest quality of life impairment)) showed mean changes from baseline of ‐8.48 (SD 3.54) in the Stelatopia group versus ‐6.50 (SD 3.61) in the hydrocortisone butyric propionate 0.1% cream group, with a MD of ‐1.98 (95% CI ‐3.55 to ‐0.41; P = 0.01) in favour of Stelatopia. The second instrument used was the DFI questionnaire; the data reported from this supported the results of the IDQOL. The mean change from baseline in DFI was ‐7.47 (SD 3.64) in the Stelatopia group compared to ‐4.85 (SD 3.16) in the hydrocortisone butyric propionate 0.1% cream group, with a MD of ‐2.62 (95% CI ‐4.11 to ‐1.13; P = 0.0006).
4b‐II EpiCeram twice daily versus fluticasone 0.05% cream twice daily
One four‐week study of 121 participants aged between six months and 18 years evaluated these treatments (Sugarman 2009). We assessed this study as being at a high risk of bias. All participants had moderate to severe eczema, and no other treatments were allowed.
Primary outcomes
Change from baseline in disease severity as assessed by the participants
Participants judged any improvement on a 3‐point Likert scale (no change, improved, worsening), and the mean change from baseline in 53/59 participants in the EpiCeram group was ‐0.90 (SD 0.61) compared to ‐0.87 (SD 0.65) in 59/62 treated with fluticasone 0.05% cream, with a MD of ‐0.03 (95% CI ‐0.26 to 0.20; P = 0.80).
Participants assessed itch on a VAS (0 cm to 10 cm) and reported that itch was reduced by 3.3 cm in the EpiCeram group (59 participants) and by 3.7 cm in the fluticasone 0.05% group (54 participants). No SDs were provided.
Participant satisfaction
This outcome was not assessed.
Adverse events
The participants did not report any serious adverse events in either group, but no further details regarding other possible treatment‐related adverse events were reported.
Secondary outcomes
Change from baseline in disease severity as assessed by the investigators
Investigators used the SCORAD. The mean change from baseline in SCORAD was ‐18.7 (SD 7.8) in the 53 participants in the EpiCeram group versus ‐22.2 (SD 7.8) in the fluticasone 0.05% group (59 participants) (MD 3.50, 95% CI 0.61 to 6.39; P = 0.02). Both reductions were clinically important, as the MID for the SCORAD is estimated at 8.7 (Schram 2012), but the difference between the two treatments, although statistically significant, is not clinically important.
Prevention of flares (lengthening the time to first flare)
This outcome was not assessed.
Change in use of topical active treatment
This outcome was not assessed.
Changes in skin barrier function
This outcome was not assessed.
Change in health‐related quality of life
This outcome was not assessed.
4b‐III 20% petrolatum in cetomacrogol combined with wet wrap versus diluted mometasone furoate 0.1% combined with wet wrap
Only one study compared wet wrap in combination with a petrolatum‐cetomacrogol moisturiser in one group and diluted mometasone furoate 0.1% ointment in the other (Janmohamed 2014). We assessed this study as being at an unclear risk of bias. The duration of the study was four weeks; it included 39 children aged between six months and 10 years with severe eczema (objective SCORAD 40 (± 5)) (Kunz 1997). The reporting of data in this trial was suboptimal, and our attempts to obtain clarification of missing and incomplete data were unsuccessful (see Table 2).
Primary outcomes
Change from baseline in disease severity as assessed by the participants
Participants or parents applied the Patient‐Oriented Eczema Measure (POEM) (score: 0 to 28, higher score being worse) to assess this outcome. However, we had to estimate the data from a figure, and despite numerous attempts to contact the investigators, we did not obtain more precise data. Estimated reductions were 11 in the petrolatum‐cetomacrogol moisturiser group (16 participants) and 15.3 in the mometasone furoate 0.1% ointment group, which according to the investigators was not a statistically significant difference. Both reductions were clinically important as the MID for the POEM is estimated at 3.4 (Schram 2012).
Participant satisfaction
This outcome was not assessed.
Adverse events
In the petrolatum‐cetomacrogol moisturiser group, 7/20 children reported an adverse event (folliculitis (2), secondary infected eczema (2), the beginning of decubitus due to the mask (2), decubitus at mask (1)) versus 12/19 in the mometasone furoate 0.1% ointment group (folliculitis (9), severe folliculitis (1), decubitus at mask (2)) (RR 0.55, 95% CI 0.28 to 1.10; P = 0.09).
Secondary outcomes
Change from baseline in disease severity as assessed by the investigators
Investigators used the objective SCORAD, and as with the POEM, we had to estimate the data from a figure as no precise data were provided. Estimated reductions were 20 in the petrolatum‐cetomacrogol moisturiser group (16 participants) and 29.8 in the mometasone furoate 0.1% ointment group (20 participants), which are both substantial reductions (MID for objective SCORAD is 8.2 (Schram 2012)). The investigators reported "a difference of 9.927 (3.68 SE) and a P value of 0.0028".
Prevention of flares (lengthening the time to first flare)
This outcome was not assessed.
Change in use of topical active treatment
This outcome was not assessed.
Changes in skin barrier function
This outcome was not assessed.
Change in health‐related quality of life
This outcome was assessed with the IDQOL, and again we had to estimate data from a figure. The IDQOL reduced by 4 in the 16 children on petrolatum‐cetomacrogol moisturiser versus a reduction of 12 in the 19 children on mometasone furoate 0.1% ointment. The authors reported that this difference was statistically significant ("P = 0.0002").
4b‐IV Water‐in‐oil emulsion Excipial twice daily versus hydrocortisone 1% in a water‐in‐oil emulsion
These treatments were examined in a single one‐week study with 69 adult participants (Gehring 1996). We assessed the study as being at an unclear risk of bias; no other treatments were allowed. Six participants dropped out overall, but it was unclear from which groups they came.
Primary outcomes
Change from baseline in disease severity as assessed by the participants
'Roughness' of the skin was assessed with a VAS scale (1 cm to 10 cm, with higher being better). In the 31 participants in the Excipial moisturiser group, the mean change from baseline was 2.19 cm (SD 1.31) versus 2.60 cm (SD 0.98) in the 32 participants treated with hydrocortisone 1% (MD ‐0.41 cm, 95% CI ‐0.98 to 0.16; P = 0.16).
Participant satisfaction
This outcome was not assessed.
Adverse events
This outcome was not assessed.
Secondary outcomes
Change from baseline in disease severity as assessed by the investigators
The investigators assessed redness on a scale from one to four, with a lower score being better. The mean change from baseline in the 31 participants in the Excipial moisturiser group was ‐0.84 (SD 0.66) compared to ‐1.00 (SD 0.52) in the 32 participants in the hydrocortisone 1% group (MD 0.16, 95% CI ‐0.13 to 0.45; P = 0.29). Roughness was assessed with the same scale of one to four, and this demonstrated a change from baseline of ‐0.97 (SD 0.59) versus ‐1.06 (SD 0.46), respectively, with a MD of 0.09 (95% CI ‐0.18 to 0.36; P = 0.52).
Prevention of flares (lengthening the time to first flare)
This outcome was not assessed.
Change in use of topical active treatment
This outcome was not assessed.
Changes in skin barrier function
The data reporting TEWL had to be estimated from a figure and showed a reduction of 8.2 g/m²/h in the Excipial moisturiser group (31 participants) versus 8 g/m²/h in the hydrocortisone group (32 participants), which are similar reductions.
Change in health‐related quality of life
This outcome was not assessed.
4b‐V Moisturiser containing spent grain, Vitellaria paradoxa (formerly Butyrospermum parkii) extract plus Argania spinosa kernel oil twice daily versus hydrocortisone acetate1% cream twice daily
The four‐week Jirabundansuk 2014 study examined these treatments in 31 children between two and 15 years of age, with mild to moderate eczema, using a within‐participant design. We assessed the study as being at a high risk of bias. No other treatments were allowed.
Primary outcomes
Change from baseline in disease severity as assessed by the participants
Twenty‐nine children or their parents reported change in disease severity on a 4‐point Likert scale (excellent, good, fair, unchanged). After four weeks, 89.7% rated the outcome on the side treated with the moisturiser as good to excellent compared to 93.1% on the side treated with hydrocortisone acetate 1% cream.
Participant satisfaction
This outcome was not assessed.
Adverse events
The investigators stated that "no specific adverse events were reported".
Secondary outcomes
Change from baseline in disease severity as assessed by the investigators
The investigators measured disease severity in 29 participants with the SCORAD (score 0 to 103, higher score being worse). Both treatment sides showed clinically important reductions (MID SCORAD is estimated at 8.7 (Schram 2012)). On the side treated with the moisturiser, the mean change from baseline was ‐17.92 (SD 5) and on the side treated with hydrocortisone acetate 1% cream the change was ‐18.22 (SD 4.74), with a mean of the paired differences of 0.30 (95% CI ‐1.07 to 1.67), which was not a statistically significant difference between the two treatments.
Prevention of flares (lengthening the time to first flare)
After the four‐week treatment period, the moisturiser group continued for a further four weeks with the moisturiser, whilst the hydrocortisone acetate 1% group switched to the cream base for the following four weeks. No recurrences were seen in either group. However, the investigators also reported that "as for the relapse rates, it was 17.2% on the HC [hydrocortisone] cream side, and 10.3% on the S [moisturiser] cream side (P = 0.500)." It was not clear to us what the difference between recurrence and relapse might be.
Change in use of topical active treatment
This outcome was not assessed.
Changes in skin barrier function
This outcome was not assessed.
Change in health‐related quality of life
This outcome was not assessed.
4b‐VI Advabase twice daily versus methylprednisolone aceponate cream two days a week plus moisturiser for remaining five days
The Peserico 2008 study commenced with an open‐label acute treatment phase of four weeks in which participants ‐ 12 years and older with moderate to severe eczema ‐ were treated with once‐daily methylprednisolone aceponate cream (MPA) and once‐daily moisturiser (Advabase). The second part of the study was a randomised phase that included 221 participants and had a duration of 16 weeks. In this phase, one treatment arm used only moisturiser (Advabase) and the other used MPA for two consecutive days a week and moisturiser for the remaining five days a week. We assessed the study as being at an unclear risk of bias.
Primary outcomes
Change from baseline in disease severity as assessed by the participants
Disease severity was not assessed, but itch was assessed on a VAS (0 mm to 100 mm, higher being worse). The investigators were not able to provide us with SDs. The VAS scores increased during the second (maintenance) phase in the Advabase moisturiser group (109 participants) by 23.3 mm and in the MPA cream group (112 participants) by 5.5 mm. Authors reported "P < 0.001".
Participant satisfaction
This outcome was not assessed.
Adverse events
In the Advabase moisturiser group, 26/109 participants reported an adverse event compared to 17/112 in the MPA cream group (RR 1.57, 95% CI 0.91 to 2.73; P = 0.11). Investigators reported that "no AEs [adverse events] during the MP [maintenance phase] were considered [to be] related to the study drug".
Secondary outcomes
Change from baseline in disease severity as assessed by the investigators
The mean increase in EASI (score from 0 to 72, higher score is worse) during the maintenance phase was 2.97 in the Advabase moisturiser group versus 0.5 in the MPA cream group. The trial authors reported "P < 0.001". The MID for the EASI is 6.6 (Schram 2012), and therefore the difference between the two treatments was not clinically important.
Prevention of flares (lengthening the time to first flare)
During the 16‐week phase of maintenance therapy, 36/109 participants experienced a flare in the moisturiser group compared to 16/112 in the MPA cream group, a result that favours MPA cream (RR 2.31, 95% CI 1.37 to 3.91; P = 0.002; NNTH = 5, 95% CI 3 to 13). The rate of flare in the moisturiser group was 3.5 times the rate of flare in the MPA cream group (HR 3.5, 95% CI 1.91 to 6.43; P < 0.0001; Analysis 9.1). Twice‐weekly use of topical corticosteroid cream on consecutive days combined with use of moisturiser reduced the rate of flare compared to the use of moisturiser alone (see Comparison 5 too).
Change in use of topical active treatment
This outcome was not assessed.
Changes in skin barrier function
This outcome was not assessed.
Change in health‐related quality of life
No precise data were provided for this outcome, and the investigators were not able to provide missing trial details; however, they reported that, "The DLQI total score improved under MPA treatment by 0.6 points, mainly due to improvements in the categories 'leisure' (1.6 points) and 'personal relationships' (1.2 points) but worsened in all categories (by 4.4 to 13.8 points) in the moisturiser group. Similarly, the CDLQI had better results in the MPA group in all categories assessed (data not shown)."
4c Moisturisers versus topical immunomodulators
Three four‐week studies, that we assessed as being at a high risk of bias, evaluated different moisturisers against topical immunomodulators (Emer 2011; Frankel 2011; Takeuchi 2012). Both children and adults were included and all participants had mild to moderate eczema. Emer 2011 and Frankel 2011 used a within‐participant design. Emer 2011 included 20 participants and compared Eletone (high in lipids) three times a day on one side of the body with pimecrolimus cream three times a day on the other side of the body. Frankel 2011 included 30 participants and compared application of Hyalotopic (ceramide foam) to one side of the body with twice daily application of pimecrolimus cream to the other side. The Takeuchi 2012 study started with an induction phase in which the 70 participants received tacrolimus. They were moved to the maintenance phase only when the VAS score (0 mm to 100 mm, higher score is worse) reduced by more than 20 mm (43 participants). The application frequency of the moisturiser and the tacrolimus was not stated.
Trial details were missing and data were inadequately reported In all three studies; we made numerous attempts to contact the investigators to clarify missing study details, but were unsuccessful (see Table 2).
Primary outcomes
Change from baseline in disease severity as assessed by the participants
In Emer 2011 (within‐participant design), 20 participants compared moisturiser with pimecrolimus on a 4‐point Likert scale (0 to 3, higher scores being worse). The score reduced by 1.45 on the side treated with moisturiser, and by 1.42 on the side treated with pimecrolimus. Frankel 2011 (within‐participant design) provided no precise data; the investigators reported only that "subject self‐assessment scores decreased quadratically from week 0 to week 4 for both study treatment groups (P = 0.0001). However, there was no statistically significant difference between the pimecrolimus cream and ceramide‐hyaluronic acid emollient foam [moisturiser] group in subject self‐assessment scores (P = 0.7093)." Itch (measured on a VAS) was reduced by 54.6% versus 56.4%, respectively.
In Takeuchi 2012, itch was assessed by means of a VAS (0 mm to 100 mm). The mean change from baseline was ‐31.40 mm (SD 10.66) in the moisturiser group (21 participants) versus 1.50 mm (SD 12.61) in the tacrolimus group (23 participants) (MD 29.90 mm, 95% CI 23.02 to 36.78; P < 0.00001), which favours the moisturiser group.
Participant satisfaction
This outcome was assessed only in Frankel 2011. The investigators of this within‐participant study reported that 68% of the 28 participants preferred Hyalotopic, while 32% preferred pimecrolimus cream.
Adverse events
The Emer 2011 and Frankel 2011 studies did not report any adverse events on either side of the body. In Takeuchi 2012, adverse events were not assessed during the maintenance phase. In the induction phase, a transient burning sensation was reported in 32/69 participants after application of tacrolimus.
Secondary outcomes
Change from baseline in disease severity as assessed by the investigators
Takeuchi 2012 failed to report data on the SCORAD (see 'Risk of bias' table in Characteristics of included studies for this study). The Emer 2011 study assessed this outcome in 20 participants using a 6‐point Likert scale (0 to 5, higher values indicating worse). The mean score reduced by 2.11 on the side treated with moisturiser and by 2.16 on the side treated with pimecrolimus. Frankel 2011 reported that there was an improvement of 67.9% in the IGA (score 0 to 5, higher being worse) on the side treated with Hyalotopic and an improvement of 63.1% on the side treated with pimecrolimus (28 participants).
Prevention of flares (lengthening the time to first flare)
This outcome was not assessed in these studies.
Change in use of topical active treatment
This outcome was not assessed in these studies.
Changes in skin barrier function
This outcome was not assessed in these studies.
Change in health‐related quality of life
This outcome was not assessed in these studies.
5 Vehicle cream/ointment twice weekly combined with daily moisturiser versus fluticasone propionate cream (0.05%)/ointment (0.005%) twice weekly combined with daily moisturiser
Three studies with similar designs evaluated these treatments (Berth‐Jones 2003; Glazenburg 2009; Hanifin 2002). We assessed the three studies as being at an unclear risk of bias. All three started with a stabilisation phase of four weeks in which all participants were treated with fluticasone propionate (FP) 0.005% ointment (Berth‐Jones 2003 FP 0.05% cream in one treatment arm). They then entered a 16‐week (Berth‐Jones 2003; Glazenburg 2009), or 20‐week (Hanifin 2002), randomised maintenance phase. The participants had recurring moderate to severe eczema at entry to the studies. Berth‐Jones 2003 was a four‐arm study; we considered only two of its comparisons to be important for this review, i.e. 1) vehicle cream twice weekly combined with daily moisturiser versus FP cream combined with daily moisturiser, and 2) vehicle ointment twice weekly combined with daily moisturiser versus FP ointment combined with daily moisturiser. This study had 376 participants who were 12 to 65 years of age. The Glazenburg 2009 study included 90 children aged four to 10 years, and Hanifin 2002 included 372 participants aged from three months to 65 years. The objective of these studies was to establish whether intermittent use of FP added to a moisturiser could reduce the rate of flare over time.
See summary of findings Table 8.
Primary outcomes
Change from baseline in disease severity as assessed by the participants
This outcome was assessed only in Hanifin 2002, which used a 6‐point Likert scale. Thirty‐eight of the 119 participants in the vehicle group reported a good to excellent result compared to 163/229 in the FP group, with a significant difference in favour of intermittent FP (RR 0.45, 95% CI 0.34 to 0.59; P < 0.00001; NNTB = 3, 95% CI 2 to 3).
Participant satisfaction
This outcome was not assessed in these studies.
Adverse events
All three studies reported adverse events. The number of participants in the vehicle group reporting adverse events did not demonstrate a statistically significant difference when compared with the participants in the FP group (RR 0.51, 95% CI 0.22 to 1.14; P = 0.61; I² = 67%; Analysis 10.1). No adverse events were reported in Berth‐Jones 2003, so we repeated our analysis, adding one adverse event to all treatment arms, which produced an RR of 0.60 (95% CI 0.41 to 0.90; P = 0.01), which is in favour of vehicle plus moisturiser. The investigators in Berth‐Jones 2003 stated that "during the maintenance phase investigators made no reports of visual signs of skin changes and of atrophy". Comparison of the two other studies showed that there were more adverse events in the FP group in Glazenburg 2009 than in Hanifin 2002. In Glazenburg 2009, very few participants reported skin‐related adverse events, and skin atrophy was not observed. In both studies, viral infections were reported mostly as adverse events. We assessed all three studies as being at an unclear risk of bias overall, therefore, we did not conduct sensitivity analyses for overall risk of bias. We conducted further stratified analyses for the individual domains of risk of bias (see Table 6), but the heterogeneity was not reduced.
Secondary outcomes
Change from baseline in disease severity as assessed by the investigators
Only the Glazenburg 2009 study assessed this outcome. There was inconsistency between the data reported in the text regarding the objective SCORAD, the corresponding data in the table, and a comment made by the investigators, "Overall a statistically significant difference was observed between treatment groups (P = 0.021)." The increase in SCORAD in the twice weekly FP plus moisturiser group was reported as 7.1 in the data table and as 3.8 in the text. This would appear to be an unintentional error, but we were unable to clarify or analyse the data further due to a lack of response from the corresponding author (see Table 2). The increase for the vehicle plus moisturiser group was 12.2, which was reported consistently in both table and text.
Prevention of flares (lengthening the time to first flare)
The number of participants who experienced a flare was reported in all three studies. In the vehicle group (combined with moisturiser) 203/312 participants had flared after 16 to 20 weeks, whilst in the FP plus moisturiser group only 115/406 had flared (RR 2.17, 95% CI 1.51 to 3.11; P < 0.0001; I² = 74%; NNTB = 3, 95% CI 2 to 3, Analysis 10.2). We explored reasons for the high level of heterogeneity using stratified analyses for effect size as well as for 'Risk of bias' domain, but all studies had an overall unclear risk of bias. One study had a smaller effect size, that is, the second comparison of Berth‐Jones 2003 in which vehicle ointment was compared with FP ointment. The investigators in Berth‐Jones 2003 stated that "the difference between the two formulations was significant (P = 0.002), with a hazard ratio of 2.9 (1.5 to 5.9), indicating that patients using the cream formulation were approximately one third as likely to have a flare as those using the ointment." The other sensitivity analyses according to 'Risk of bias' domain did not lead to further reductions in heterogeneity (Table 6).
The median time to flare in Berth‐Jones 2003 was 6.1 weeks for both vehicle plus moisturiser groups and more than 16 weeks for both FP plus moisturiser groups. In Glazenburg 2009, the median time to flare was 2.6 weeks in the vehicle plus moisturiser group versus more than 16 weeks in the FP plus moisturiser group, while in Hanifin 2002 the median times were 4.7 weeks and more than 20 weeks, respectively. The rate of flare in the vehicle plus moisturiser group was 3.69 times the rate in the FP plus moisturiser group (HR 3.69, 95% CI 1.80 to 7.55; P = 0.0004; I² = 85%; Analysis 10.3).
These results indicate that intermittent use of FP (0.05%) cream or FP (0.005%) ointment in combination with a moisturiser is more effective than moisturiser alone to reduce the rate of flare.
Change in use of topical active treatment
This outcome was not assessed in any study.
Changes in skin barrier function
This outcome was not assessed in any study.
Change in health‐related quality of life
This outcome was not assessed in any study.
6 Topical active treatment in combination with a moisturiser versus topical active treatment only
Six studies (648 participants) evaluated whether combining an active treatment, such as a topical corticosteroid, with a moisturiser would be more effective than an active treatment alone (Draelos 2008; Gao 2008; Hanifin 1998; Msika 2008; Simpson 2011; Wu 2014). These studies investigated whether moisturisers have an add‐on effect. We assessed all of the studies as being at a high risk of bias, with the exception of Draelos 2008, which we assessed as being at an unclear risk of bias. Study duration varied from two weeks in Gao 2008, to four weeks in Draelos 2008 and Simpson 2011. The Gao 2008 and Msika 2008 studies were conducted in children; Wu 2014, in adults; and the other studies included both children and adults. All participants suffered from mild to moderate eczema.
Two studies had a within‐participant design (Hanifin 1998; Simpson 2011). Draelos 2008 was a three‐arm study, and Msika 2008 was a five‐arm study. Only two comparisons from each of these two studies contributed to the present overarching comparison.
See summary of findings Table 9.
Primary outcomes
Change from baseline in disease severity as assessed by the participants
This outcome was not assessed in any study.
Participant satisfaction
This outcome was assessed in two within‐participant studies only (Hanifin 1998; Simpson 2011). In Hanifin 1998 (78 participants), 96% preferred the combination of desonide 0.05% lotion twice daily with moisturiser three times a day, and only 4% preferred desonide 0.05% only. In Simpson 2011, 84.3% to 96.7% of the 123 participants (per‐protocol population) were cited as saying that the addition of the moisturiser, RestoraDerm, to the routine use of their topical steroids "reduces inflammation, relieves dry and itchy skin, provides long lasting hydration, leaves skin protected and maintains healthy skin".
Adverse events
This outcome was assessed by three studies (Draelos 2008; Hanifin 1998; Wu 2014). Draelos 2008 (60 participants) did not report any adverse events in any of the three study arms (i.e. fluocinonide 0.05% combined with a multilamellar vesicular emulsion (MVE) ceramide moisturiser, fluocinonide 0.05% combined with a MVE ceramide‐containing liquid cleanser and fluocinonide 0.05% with a mild cleansing bar). After one week, In Hanifin 1998 (80 participants, within‐participant design), 10 participants reported burning and stinging on the side treated with desonide 0.05% combined with moisturiser versus 11 reports for the side treated with desonide 0.05% alone. After three weeks, none of the participants reported burning and stinging in the combined treatment side versus two on the desonide 0.05% lotion only side. In Wu 2014, 4/63 participants treated with flumethasone ointment combined with moisturiser reported burning, redness, or greasiness versus 10/62 treated with only flumethasone ointment (RR 0.39, 95% CI 0.13 to 1.19; P = 0.10).
Secondary outcomes
Change from baseline in disease severity as assessed by the investigators
We could combine data from two of the studies (Msika 2008; Wu 2014). We included two possible comparisons from the five‐arm Msika 2008 study: desonide 0.05% twice daily combined with moisturiser containing 2% sunflower oil oleodistillate (17 participants) versus desonide 0.05% twice daily (18 participants); and desonide 0.05% once daily combined with moisturiser containing 2% sunflower oil oleodistillate (17 participants) versus desonide 0.05% once daily (15 participants). Msika 2008 assessed disease severity with SCORAD. The investigators in Wu 2014 used the EASI to assess disease severity. The reductions in disease severity in both treatment arms in all of the three comparisons met the MID (estimated at 8.7 for SCORAD, and 6.6 for EASI (Schram 2012)), but the combination of active treatment (topical corticosteroid) plus a moisturiser was only slightly more effective than active treatment alone with a SMD ‐0.87 (95% CI ‐1.17 to ‐0.57; P < 0.00001; I² = 0%; Analysis 11.1), and the difference between the interventions was not clinically important (i.e. the difference between treatment arms did not meet the MID for any of the three comparisons).
In Draelos 2008, the reductions in IGA were 2.7 for the fluocinonide 0.05% plus MVE ceramide moisturiser group (20 participants), 2.2 for the fluocinonide 0.05% plus MVE ceramide‐containing liquid cleanser group (20 participants), and 1.4 for the fluocinonide 0.05% with a mild cleansing bar group (20 participants).
In Gao 2008, BoPao plus urea 10% ointment (101 participants) was compared against BoPao alone (95 participants). The investigators stated that BoPao cream was categorised as an "inflammatory and antifungal cream [exact meaning unclear due to translation issues] for treatment of eczema", and we were unable to locate any more information about this cream. Treatment was reported to be effective in 89/101 participants on combination therapy compared to 70/95 on BoPao only (RR 1.20, 95% CI 1.04 to 1.38; P = 0.01; NNTB = 7, 95% CI 4 to 28).
In the within‐participant Hanifin 1998 study (78 participants), 70% showed marked improvement to 'clear' on the side treated with desonide 0.05% plus moisturiser compared to 55% on the side treated with desonide only (authors stated "P < 0.01"). Simpson 2011, the other within‐participant study (121 participants), used the EASI. Reductions in EASI were 1.28 (SD 1.94) on the combined treatment side versus 1.01 (SD 1.50) on the side that received active treatment only, with a statistically significant mean of the paired differences of ‐0.27 (95% CI ‐0.52 to ‐0.02) favouring combined treatment.
All studies showed that the combination of active treatment with a moisturiser was more effective (statistically significant) than active treatment alone.
Prevention of flares (lengthening the time to first flare)
This outcome was only assessed in one study (Wu 2014). In the combined treatment group, 8/60 participants experienced a flare versus 14/45 in the group on active treatment only (RR 0.43, 95% CI 0.20 to 0.93; P = 0.03; NNTB = 6, 95% CI 3 to 57), which favoured combined treatment.
Change in use of topical active treatment
This outcome was not assessed in any study.
Changes in skin barrier function
This outcome was assessed in Simpson 2011 only, via corneometry. Skin hydration improved by 5.4 arbitrary units on the side treated with topical corticosteroids plus RestoraDerm, and by 3 arbitrary units on the side treated solely with topical corticosteroids, which were both small improvements.
Change in health‐related quality of life
Only Msika 2008 evaluated this outcome, and used the IDQOL. We combined the results of the two comparisons within this study, and there was no statistically significant difference in change from baseline in quality of life between desonide 0.05% treatment plus a moisturiser versus desonide 0.05% alone (MD ‐1.31, 95% CI ‐2.70 to 0.09; P = 0.07; I² = 0%; Analysis 11.2). These data were confirmed with assessments of the DFI (MD ‐1.03, 95% CI ‐2.47 to 0.42; P = 0.17; I² = 0%; Analysis 11.3).
Discussion
Summary of main results
We included 77 studies with a total of 6603 participants in this review. Only seven of these studies compared moisturisers versus no moisturisers, which is probably the most important and highly informative comparison to use when assessing the efficacy of moisturisers in people with eczema. In the 15 studies that compared a moisturiser with a placebo or vehicle, the placebos and vehicles were also moisturisers, but lacked the ingredient that was considered to be the most effective in the moisturiser. These comparisons, although valuable, do not provide us with crucial information about how effective the tested moisturiser is by itself, as the placebo or vehicle might decrease disease severity. Indeed, in some studies the placebo or vehicle performed better than the moisturiser under investigation (e.g. 10% and 20% Hippophae rhamnoides cream versus placebo (Thumm 2000), and furfuryl palmitate‐enriched moisturiser versus the moisturiser without furfuryl palmitate (Tripodi 2009)).
There were 29 single study comparisons that evaluated one moisturiser versus another moisturiser; these provide information on whether one moisturiser is more effective than another, but do not inform us about the efficacy of a moisturiser by itself. However, in some instances both treatment arms showed clinically important reductions from baseline in disease severity (meeting minimal important differences (MID)) suggesting that both were similarly effective. It is worth mentioning the Åkerström 2015 study (assessed as being at low risk of bias), which compared a barrier‐strengthening moisturiser containing 5% urea against a reference cream without urea. This study started with a stabilisation phase in which active treatment (mometasone) was used until the eczema was (almost) cleared. During the maintenance phase of 180 days (with no active treatment), fewer participants in the group using barrier‐strengthening moisturiser with 5% urea experienced a flare compared to those using the reference cream, and the time to flare was considerably lengthened (15 compared to 22 days). Furthermore, two studies at unclear risk of bias that were conducted in the Philippines, evaluated oils as a moisturiser (Evangelista 2014; Verallo‐Rowell 2008). In Evangelista 2014 virgin coconut oil was compared to mineral oil, and in Verallo‐Rowell 2008 virgin coconut oil to virgin olive oil. In both studies the oils showed clinically important reductions in disease severity in both treatment arms, but virgin coconut oil appeared to be more effective in both studies.
The Sugarman 2009 study (at high risk of bias), which fits under the overarching comparison of moisturisers versus active treatment, indicated that the ceramide‐containing barrier cream (EpiCeram) showed a large reduction in the SCORing Atopic Dermatitis Index (SCORAD) (18.7) over a four‐week period, which is a clinically important reduction (MID SCORAD is 8.7 (Schram 2012)). However, several other studies (Comparisons 3b, 3d, 3e, and 3f) that evaluated the same ceramide‐containing barrier cream showed inconsistent results in improvements in eczema, which varied from very small improvements to more important clinical reductions. Another study, Jirabundansuk 2014 (high risk of bias), which evaluated a moisturiser containing spent grain, Vitellaria paradoxa (formerly Butyrospermum parkii) extract and Argania spinosa kernel oil together with other ingredients also demonstrated a reduction in SCORAD of 17.92, which is a clinically important reduction. This appeared to indicate that such a moisturiser might have an anti‐inflammatory effect, but it is equally possible that this may be due to the effective moisturising action of the product.
Three studies were conducted to assess whether twice weekly topical fluticasone propionate in combination with a moisturiser was more effective than moisturiser alone (plus the vehicle of the fluticasone propionate) in preventing flares, which is important for people with eczema who experience frequent flares. The seven studies that compared topical active treatment with a moisturiser versus active treatment alone provide us with insight into the add‐on efficacy of moisturisers when applying topical active treatment.
In general most of the moisturisers that were evaluated appeared to show at least some beneficial effect as assessed by our predefined outcomes, however the extent of the effects varied widely across the included studies.
Our primary outcome 'participant‐assessed disease severity' was addressed in only a third (24) of the studies and itch was assessed in 23 studies. In most instances only small reductions were seen in the outcome change from baseline in itch (Comparisons 1, 2b, 2c, 2d, and 2e), and these were usually based on assessments with visual analogue scales (VAS). Noteworthy improvements in itch occurred with Atopiclair, which showed a statistically significant difference compared to its vehicle (Comparison 2a). Possibly more importantly, pooled data for all of the moisturisers versus control (Comparison 2f) showed a large effect on reduction of itch in favour of the use of moisturisers. However, apart from the fact that there was a high degree of inconsistency in the data, the clinical relevance of this effect is difficult to interpret. As yet no MID has been established for itch on VAS scales, and the studies that contributed data to this outcome used a range of different scales. Based on a recent publication, the MID of the VAS for itch lies within a two to three point decrease (Reich 2016).
Only 13 studies assessed 'participant satisfaction with treatment'. These did not report in detail about specific preferences and did not elaborate about which moisturisers are preferable for daytime use and which for night‐time use, or whether choices vary depending on the season (e.g. winter versus summer). The secondary outcome 'change in health‐related quality of life' was only covered in 10 of the 77 studies. As eczema is a chronic disease with a clear impact on quality of life (Lewis‐Jones 2006; Nutten 2015), the significance of relevant patient‐reported outcomes (PROs) would appear to have been underestimated in the majority of studies.
The reporting of adverse events, although included in over half of the studies (41/77), was not informative, and most comments about these events were limited and quite generic. Most of the adverse events that were reported with moisturisers consisted of smarting, stinging, pruritus and erythema, and sometimes folliculitis.
The most assessed outcome, assessed in 65 of the 77 studies, was our prespecified secondary outcome 'investigator‐assessed disease severity'; 25 studies evaluated this with the SCORAD index (European Task Force on Atopic Dermatitis 1993), and 14 with the Eczema Area and Severity Index (EASI) (Hanifin 2001), which is the core outcome instrument for measuring clinician‐reported signs in eczema studies (Schmitt 2014). The remaining studies used Likert scales or other instruments. The other secondary outcomes assessed in studies included prevention of flares (16 studies); change in use of topical active treatment (eight studies); and changes in barrier function (29 studies).
Pooling of data for the prespecified outcomes of our review was limited, mainly because of the wide variety of comparisons, which were often assessed only by single studies. We have provided 'Summary of findings' tables for those comparisons we consider to be the most important and where data could be pooled.
For the comparison 'moisturisers versus no moisturiser' (summary of findings Table 1), there was low quality evidence of a statistically significant difference favouring moisturisers over no moisturiser for the outcome 'change from baseline in disease severity as assessed by the investigators' based on the SCORAD. However, the SCORAD MID of 8.7 was not met (Schram 2012). There was also low quality evidence that more adverse events occurred in the moisturiser group than in the no moisturiser group, which was not totally unexpected. We reported two important observations (both low quality evidence); firstly, that there was a clinically relevant and statistically significant difference in favour of moisturisers for rate of flare which was reduced to almost a quarter (0.27), with a prolonged time to flare; and secondly, when moisturisers were used, a smaller quantity of topical corticosteroids was needed to achieve a greater reduction in SCORAD. However, this difference in SCORAD did not meet the MID. There were no statistically significant differences between the groups for changes in quality of life (low quality evidence).
There was moderate quality evidence for the efficacy and safety of Atopiclair over its vehicle for all the outcomes evaluated by the studies (summary of findings Table 2). Both participants and investigators were in agreement that Atopiclair was the more effective, but the difference in investigator scores with the EASI did not meet the MID of 6.6 (Schram 2012). In addition, participants in the Atopiclair group experienced fewer flares than those in the vehicle group. Atopiclair contains glycyrrhetinic acid, which, as summarised in Abramovits 2008, "has anti‐inflammatory effects, possibly mediated through inhibition of 11‐β‐hydroxysteroid dehydrogenase, an enzyme that interconverts active cortisol to and from inactive cortisone; this inhibition may increase the cortisol available for binding to local glucocorticoid receptors, including in the skin". Atopiclair reduced itch more effectively than its vehicle and the difference might be clinically important (Reich 2016), on the basis of the MID described above.
There was low to moderate quality evidence for several outcomes assessed in the comparison of urea‐containing moisturisers versus vehicle, placebo or no moisturiser (summary of findings Table 3). Both participants and investigators considered urea‐containing cream to be more effective than its control, but there were fewer adverse events in the control group. It is fairly widely acknowledged that urea can cause transient burning and stinging after application. The use of urea‐containing moisturiser reduced the rate of flare by one‐third (0.31) (low quality evidence).
The effects of glycerol (glycerine) are summarised in summary of findings Table 4. There was moderate to high quality evidence for the outcomes assessed. Both participants and investigators considered glycerol‐containing moisturiser to be more effective than vehicle or placebo cream. However, for the investigator‐assessed change in disease severity, the 8.2 SCORAD MID was not met between the two treatment arms.
When oat‐containing creams were compared to vehicle or no moisturiser there was no difference between the two treatment arms for participant‐ and investigator‐assessed change in disease severity (low to very low quality evidence) (summary of findings Table 5). In contrast there were statistically significantly fewer flares in the oat‐containing moisturiser group, and the rate of flare was reduced by a factor of almost five (0.21), which was quite remarkable. Furthermore, smaller amounts of corticosteroids were needed in the oat‐containing moisturiser group than in the control group. However, more adverse events were reported in the oat‐containing moisturiser group.
summary of findings Table 6 compares all moisturisers to vehicle, placebo or no moisturiser, and the quality of evidence ranges from low to high. Participants considered the use of a moisturiser to be more effective than the control (low quality evidence), and this was confirmed by the judgement of the investigators in 12 studies (high quality evidence). There was low quality evidence of no difference in participant satisfaction or in the number of participants experiencing an adverse event between the two treatment arms. There was a statistically significant difference in the number of participants who experienced a flare which was three times lower in the moisturiser group (moderate quality evidence), and rate of flare was nearly reduced by a factor of four (0.27). The data showed that the use of moisturisers decreased use of topical corticosteroids without compromising reductions in disease severity (low quality evidence). There was no statistically significant difference in changes in quality of life between the two treatment groups (low quality evidence). Pooled data from seven studies showed that the use of moisturisers had a large effect on itch compared to the control group. However, due to considerable heterogeneity in the results, the use of different assessment scales, and the fact that the clinical relevance of this outcome is difficult to estimate, caution must be exercised in interpreting these data.
Three within‐participant studies compared a licochalcone‐containing moisturiser with topical hydrocortisone acetate 1% cream (summary of findings Table 7). These studies showed that there were no statistically significant differences between the treatment effect, satisfaction, adverse events and number of participants who experienced a flare (all low quality evidence). In Udompataikul 2011 the study investigators stated that "licochalcone A, a major phenolic constituent of liquorice species Glycyrrhiza inflata, has lately been reported to possess anti‐inflammatory and antimicrobial properties". The investigators in Angelova‐Fischer 2014 indicated that "licochalcone A suppress the production of pro‐inflammatory mediators and cytokines such as PGE2, LTB4, IL‐6 and TNF‐α in in vitro systems relevant to the skin such as dermal fibroblasts, granulocytes, dendritic cells and human skin equivalents". It is interesting to note that moisturisers with non‐steroidal anti‐inflammatory properties, such as these licochalcone‐containing moisturisers (as well as Atopiclair), would appear to have similar effects to low potency topical corticosteroids.
Four trials that investigated vehicle treatment combined with a moisturiser compared to fluticasone propionate twice weekly in combination with a moisturiser mainly addressed the potential benefits of the twice weekly fluticasone propionate in preventing flares (summary of findings Table 8). There was high quality evidence that participants considered twice weekly fluticasone propionate more effective than the control treatment in achieving good to excellent improvement. Furthermore, twice weekly fluticasone propionate in combination with a moisturiser was shown to be effective in reducing flares compared to a moisturiser with vehicle treatment (moderate quality of evidence), and reduced the rate of flare to almost a quarter (0.27). There was no statistically significant difference between the intervention groups for the number of participants who reported an adverse event (low quality evidence).
The last comparison for which we were able to pool data was topical active treatment in combination with a moisturiser versus topical active treatment alone, summarised in summary of findings Table 9. There was low quality evidence that participants were more satisfied with the combined therapy, and moderate quality evidence from the investigators that adding a moisturiser to topical active treatment was more effective than topical active treatment alone. There was no difference in the number of adverse events (very low quality of evidence) and, based on one study, the addition of a moisturiser to topical active treatment reduced the number of participants who experienced a flare. There was no difference in change of quality of life (low quality of evidence), but it is likely that the three‐week study duration was probably too short to detect a difference.
The results of the 29 studies that assessed change from baseline in skin barrier function showed wide and inconsistent variation of small to substantial improvements.
The overall conclusion from the various comparisons is that moisturisers are effective at reducing rate of flare, can prolong time to flare, reduce the use of topical corticosteroids, and, when combined with topical active treatment, lead to better results than active treatment alone. However, the quality of evidence varied from low to high, and the MID for the investigators' assessments based on (objective) SCORAD and EASI was not met.
Overall completeness and applicability of evidence
Although we were able to include 77 studies, the majority (70/77) were at unclear to high risk of bias, and very few studies compared similar interventions.
The comparison that would be expected to provide the most reliable information about the efficacy of moisturisers in eczema was moisturiser versus no moisturiser, but this was only addressed in seven studies (six provided usable data). The low quality evidence from these studies indicated that the use of moisturisers was more effective, but not clinically important (investigator‐reported), than no moisturiser and resulted in fewer flares, a prolonged time to flare and a reduced need for topical corticosteroids to reach comparable reductions in eczema severity.
The 29 studies that compared one moisturiser with another moisturiser (23 provided usable data) were all evaluated in single studies with different treatment arms, which did not permit pooling of their data. Although it was clear from some of these studies that improvements were experienced in one or both treatment arms (participant‐reported, investigator‐reported, or both), these studies mainly indicated that moisturisers might have a similar effect to each other, or that one moisturiser might be better than another, though evidence for this was based on a single study ‐ often with a small sample size‐ and mostly at an unclear to high risk of bias. It also demonstrated the heterogeneous performance of moisturisers, which, as was emphasised by Danby and colleagues, has a notable impact on the treatment of eczema, and its long‐term control (Danby 2016).
There was moderate quality evidence that Atopiclair, urea‐containing moisturisers and glycerol‐containing moisturiser (high quality evidence for investigators’ assessment) were more effective than their control (no moisturiser, vehicle or placebo), although the MID for investigator assessments was not met. Both Atopiclair and urea‐containing moisturisers reduced the number of flares (this outcome was not assessed in the comparisons with glycerol‐containing moisturisers).
The overall conclusion, according to both participants (low quality evidence) and investigators (high quality evidence), when all comparisons of moisturiser versus vehicle, placebo or no moisturiser were combined, was that moisturisers are effective, can reduce flares (moderate quality evidence), and have a corticosteroid‐sparing effect.
Adding moisturisers to an active topical treatment resulted in better clinical results than topical active treatment alone, which is an encouragement for the continued use of moisturisers during eczema flare‐ups (moderate quality evidence). Twice weekly fluticasone propionate added to daily use of moisturisers reduced the likelihood of flares over time, and has key implications for daily practice, particularly in people with eczema who experience frequent flare‐ups. Furthermore, the use of moisturisers decreased usage and the need for topical corticosteroids, which is another important outcome. There was low quality evidence that licochalcone was as effective as hydrocortisone acetate 1% cream.
The majority of moisturisers considered in this systematic review included a large array of ingredients (see Notes sections in Characteristics of included studies), which made it impossible to distinguish clearly between hydrophilic and hydrophobic moisturisers, or, indeed, between humectant, emollient and occlusive moisturisers. Uncertainty about the exact proportions of these ingredients in a moisturiser does not permit a clear distinction to be made, especially as the proportions are rarely mentioned in the labelling or packaging. The quantity of certain ingredients can also affect the way a moisturiser feels on the skin. Some ingredients in a moisturiser enhance its ability to remain on the skin (e.g. petrolatum), while others (e.g. oils) transfer quickly to clothes or bed linen. Temperature can influence the viscosity of moisturisers, which is crucially important for application on the skin, as the higher the viscosity of the moisturiser, the more difficult it is to smear and spread on the skin, which can cause friction and lead to friction‐related adverse events. Once all of these aspects are taken into account, as well as dryness, day or night‐time, the seasons, the weather, and even the clothes that are worn, people with eczema will express a variety of preferences in different situations. The ideal moisturiser should be easy to spread on the skin, have no smell, contain no irritating or sensitising ingredients, be cosmetically acceptable without excessive sticking to clothes and bed linen, and be affordable for people with eczema.
This review does not address the importance of educating people with eczema on how to apply moisturisers, how much to use or how often to use them. Cork and colleagues demonstrated that correct and adequate instructions in usage "of the treatments resulted in an 800% increase in the use of emollients, a reduction in disease severity as assessed with six area, six sign atopic dermatitis severity score (SASSAD) (89% reduction compared with baseline) and no overall increase in the use of topical steroids" (Cork 2003a). The importance of education as part of the management strategy has also been emphasised by several other investigators (Arkwright 2013; Ersser 2014; Mason 2013; Oakley 2016). Another shortcoming of the studies in this review was the lack of detailed reporting of adverse events, which meant that we could not conclude which moisturiser might be preferable for avoiding adverse events. None of the studies reported aspects such as the smell, stickiness or greasiness of the moisturiser, but rather adverse effects such as pruritus, stinging, smarting or increase in erythema. We are still unable to confirm how often moisturisers need to be applied, although it is more generally acknowledged that this should be at least once a day and preferably more frequently. Current recommended quantities of moisturisers range from 250 g to 500 g per week (Moncrieff 2013; NICE 2007; Wollenberg 2016).
Quality of the evidence
Limitations in study design and implementation
Although we only included randomised controlled trials (RCTs), we assessed most studies as being at either unclear risk or high risk of bias (for details see the Risk of bias in included studies). The method of sequence generation was described in detail in slightly more than half of the studies and allocation concealment in just under half, so for the remaining studies we judged these domains as being at unclear risk of bias. The lack of (adequate) blinding was the most frequent reason for us giving studies an overall assessment of a high risk of bias. In addition, in one‐third of the studies (25/77) there was a degree of incomplete data reporting, which did not permit a full and accurate interpretation of the study results.
In 33 instances investigators or pharmaceutical companies were helpful in providing us with missing study details (seeTable 2). We were not successful in obtaining any response from investigators or industry in 13 cases, despite repeated attempts to clarify missing study details. We did not seek further clarification for 21 studies, mainly because publication was more than 10 years ago, or because we were unable to locate a current email addresses for any of the investigators.
Inconsistency of the results
Most of the comparisons included in this review were assessed in single studies, which did not allow us to assess consistency of results across studies for the various moisturisers. For several comparisons where pooling of data was possible, we observed substantial heterogeneity for one or more outcomes. In Comparison 1 (moisturiser versus no moisturiser; summary of findings Table 1), one study, Giordano‐Labadie 2006, was responsible for substantial heterogeneity for the outcome 'amount of corticosteroid used' (I² = 68%), as far more topical corticosteroids were used in both treatment arms than in the other study (Grimalt 2007). This was surprising, especially when considering that disease severity at baseline was markedly worse in the Grimalt 2007 study. (See summary of findings Table 5 and summary of findings Table 6).
In Comparison 2a (Atopiclair versus vehicle; summary of findings Table 2), we observed substantial heterogeneity (I² = 51%) for the outcome 'change from baseline in disease severity as assessed by the investigators'. This was mainly caused by the Boguniewicz 2008 study, which showed a greater effect size and was the only study in which there was uncertainty regarding the efficacy of the allocation concealment and of the blinding. We observed considerable heterogeneity (97%) for the outcome 'change from baseline in itch', but the reasons for this remain unexplained.
In Comparison 2d (oat‐containing moisturiser versus vehicle or no moisturiser; summary of findings Table 5), there was substantial heterogeneity for the outcome 'change from baseline in disease severity as assessed by the investigators' (I² = 65%). We explored the heterogeneity by conducting further sensitivity analyses based on individual domains of risk of bias in addition to carrying out a stratified analysis adjusting for effect size. This heterogeneity appeared to be caused by Giordano‐Labadie 2006, which showed a greater effect than the other two studies, and, although its exclusion from the analysis eliminated the heterogeneity, it did not alter the conclusions (Table 6).
In Comparison 2f (all moisturisers versus vehicle, placebo or no moisturiser; summary of findings Table 6), five studies contributed to the outcome 'change from baseline in disease severity as assessed by the participants'. There was considerable inconsistency (I² = 95%) between the studies, which was in part reduced through sensitivity analyses based on risk of bias domain, especially with our sensitivity analysis for risk of attrition bias. For the outcome 'change from baseline in itch' the same held true (I² = 94%), but the heterogeneity remained unexplained. For the outcome 'participant satisfaction' (I² = 83%), the repeat sensitivity analysis no longer showed heterogeneity after we excluded a study at high risk of bias (Abramovits 2008). Pooled data for the outcome 'number of participants who experienced a flare' also demonstrated heterogeneity (I² = 73%), with those studies that had been judged to be at an unclear to high risk of bias showing better results. Considerable heterogeneity was also seen for the outcome 'change from baseline in quality of life' (I² = 79%). Gayraud 2015 was the only study at low risk of bias and demonstrated the largest effect size, whilst we assessed the other two studies as being at a high risk of bias (Giordano‐Labadie 2006; Grimalt 2007). Furthermore, in the Grimalt 2007 study, 40% of participants did not complete the questionnaires, and therefore we assessed this domain as being at high risk of attrition bias, which might explain some of the heterogeneity.
In Comparison 4a (licochalcone‐containing moisturiser versus hydrocortisone acetate 1% cream) the pooled data from two within‐participant studies for the outcome 'change from baseline in itch' demonstrated considerable heterogeneity (I² = 85%). There was a difference in study duration (four weeks for Wanakul 2013 versus one week for Angelova‐Fischer 2014), and a difference in application sites, as Wanakul 2013 used the two sides of the body, while Angelova‐Fischer 2014 used a straight comparison between the two forearms, which could explain the inconsistency. These explanations are also applicable for the outcome 'change from baseline in transepidermal water loss' (I² = 86%). In addition, there was a similar degree of inconsistency (I² = 85%) for 'change from baseline in disease severity as assessed by the investigators', which was addressed in three studies (see summary of findings Table 7). We explored possible explanations for the heterogeneity (see Table 6), and considered that the most important explanation was that the effect sizes differed between the three studies. We could only include data for the first week of the Angelova‐Fischer 2014 study, as only the first week was randomised, and therefore smaller reductions were reported in both treatment arms than in the other two studies that had four‐week durations and correspondingly larger treatment effects (Udompataikul 2011; Wanakul 2013).
In Comparison 5 (vehicle twice weekly combined with daily moisturiser versus fluticasone propionate twice weekly combined with daily moisturiser; summary of findings Table 8), there was substantial heterogeneity for the number of participants reporting an adverse event (I² = 67%). No adverse events were reported in either of the two comparisons included in Berth‐Jones 2003, while in the other two studies adverse events were reported in both arms, with a predominance in the fluticasone propionate treatment arm. There was also substantial heterogeneity for the number of participants experiencing a flare (I² = 72%). One study had a smaller effect size (i.e. the second comparison of Berth‐Jones 2003 in which vehicle ointment was compared with fluticasone propionate ointment), removal of the study from the analysis reduced some, but not all, of the heterogeneity. The investigators in Berth‐Jones 2003 stated that "the difference between the two formulations was significant (P = 0.002), with a hazard ratio of 2.9 (1.5 to 5.9), indicating that patients using the cream formulation were approximately one third as likely to have a flare as those using the ointment." We also observed considerable heterogeneity in the pooled data of the three studies for this comparison in the hazard ratio for rate of flare (I² = 85%), which remained unexplained (see sensitivity analyses in Table 5 and Table 6).
Indirectness of the evidence
The participants in the included studies had mostly mild to moderate eczema according to prespecified criteria (see Types of participants) and, therefore, were a reasonably representative group that matched our inclusion criteria. However, only a limited number of studies evaluated the most informative outcome for this review, which was whether moisturisers are effective (and safe) in people with eczema; i.e. by comparing moisturiser versus no moisturiser, though many of the comparisons provided us with indirect evidence (e.g. moisturiser versus another moisturiser).
Patient‐reported outcomes (PROs) have been a target of increasing interest for the last 30 years. Data derived from PROs have demonstrated improvements in communication and decision‐making between physicians and patients, and can lead to greater satisfaction with a chosen treatment regimen (Nelson 2015). However, PROs for this clinical topic appear not to have been adequately appreciated, especially with regard to participant satisfaction with the use of moisturisers ‐ which can be sticky, greasy, smelly, and time‐consuming to apply. Frequently the included studies based inferences on simple questions ("Which one do you prefer?" or "Do you want to continue?") instead of addressing satisfaction with treatment, and this provided us with a reason to downgrade the quality of the evidence for indirectness in summary of findings Table 2, summary of findings Table 5 and summary of findings Table 9.
Imprecision of the results
Together with inconsistency, imprecision was the most frequent reason for downgrading the quality of evidence for predefined outcomes in the 'Summary of findings' tables. Small sample sizes and low occurrence of events leading to wide confidence intervals caused us to downgrade for imprecision for one or more outcomes in all of the 'Summary of findings' tables.
Publication bias
We included a number of abstracts from conference proceedings, most of which subsequently appeared as full text publications. However, among the ongoing trials, which were often industry‐sponsored, there were a number of studies that had completed a few years ago, but have not been published, which tends to suggest that these trials showed no, or marginal, benefit for the moisturiser under investigation. Furthermore, we identified 47 duplicate publications for the same study data (Figure 1). Comparison 2f (all moisturisers versus control) was the single comparison for which we had more than 10 studies addressing an outcome; 12 studies contributed to the outcome 'change in disease severity as assessed by the investigators'; the funnel plot showed no asymmetry (Figure 4).
Potential biases in the review process
Although we took numerous steps to reduce publication bias through systematic searching and inclusion of studies published in languages other English, it is possible that the analyses in this review are based on an incomplete set of the data collected and analysed in the original trials. We made every attempt to contact investigators for missing trial data, sometimes six times over a six‐month period. However, despite our numerous attempts, we received no response for 13 studies and so were unable to obtain clarification of some of the missing trial details and study data (see Table 2). Data from studies that had a within‐participant design could not be adjusted accurately. The absence of a correlation coefficient for these studies meant that we could not analyse the data in a way that took account of the within‐participant nature of the design. For a limited number of dichotomous outcomes the results have been presented narratively, and for continuous data our decision to apply a pragmatic correlation coefficient to adjust continuous data from within‐participant studies may not reflect the true nature of the within‐person correlation.
Agreements and disagreements with other studies or reviews
Our extensive searches identified several reviews and guidelines, a practice statement and a dissertation that addressed the efficacy and usefulness of moisturisers in the treatment of eczema (Eichenfield 2014b; Hoare 2000; Katayama 2014; Lindh 2015; Mack Correa 2012; Moncrieff 2013; Nankervis 2016; NICE 2007; Oakley 2016; Penzer 2012; Ring 2012a; SIGN 2011; Silverberg 2014; Sirikudta 2013; Wollenberg 2016).
A general conclusion that can be drawn from the reviews and guidelines is that consistent, frequent, and generous use of moisturisers is necessary to restore or maintain the skin barrier. Their recommendations indicate that physicians should advise their patients to use moisturisers in large amounts (250 g to 500 g per week), preferably after bathing or showering. Educational programmes, supportive information and guidance were considered to be essential for moisturisers to achieve an optimal benefit. There was general agreement that people with eczema should have the opportunity to choose between different moisturisers and, more specifically, those that are most suitable for their own skin. Several of these reviews and guidelines referred to the studies of Cork 2003b and Danby 2011b, which stated that aqueous cream BP (or other leave‐on moisturisers containing sodium lauryl sulphate) should not be used as a leave‐on moisturiser in eczema, as this has been shown to have a negative impact on the skin barrier. Furthemore, some recent studies have questioned or discouraged the use of oils as they can damage the skin barrier, or impair skin barrier maturation in neonates (Cooke 2016; Danby 2013; Kanti 2014).
A comprehensive systematic review of treatments for atopic eczema was conducted in 2000 as a part of the NHS Health Technology Assessment (HTA) Programme (Hoare 2000). Only five RCTs were retrieved at that time and the authors of that review concluded that although moisturiser "may have beneficial actions, there is an urgent need to answer several basic questions about their use, preferably through industry‐independent RCTs". They also provided a summary of the research gaps in addition to the top 10 questions that required addressing in future RCTs. Recently, a systematic scoping review that provides an update to this review has been published; this has a search date of August 2013 (Nankervis 2016). The reviewers acknowledged that the number of RCTs evaluating moisturisers had increased considerably, with the addition of 15 studies since 2000, but that still these studies were poorly designed, with small sample sizes and short follow‐up periods, and reporting of results was frequently inadequate. The 'Risk of bias' assessment of the included studies in this HTA update was somewhat limited compared to our review, and did not include an evaluation of reporting bias and attrition bias. The authors discussed the studies in detail with respect to benefits, harms and overall implications for research and practice, but did not perform meta‐analysis or provide a rating of the quality of the evidence. The conclusions were "that the trial evidence was not clear enough to make recommendations with regard to using emollients to reduce the severity of eczema and prevent flares or to reduce the need for other eczema treatments". Our current review builds on the scoping review by reporting moderate to low quality evidence for the efficacy of moisturisers to prevent flares, as well as low quality evidence that moisturisers reduce the need for topical corticosteroids to attain similar reductions in eczema severity.
Another more recent systematic review, which had a broader scope than our review, summarised the clinical effectiveness of moisturisers in atopic dermatitis and related disorders, and also included participants with irritant hand dermatitis and ichthyosis vulgaris (Lindh 2015). Our search retrieved 45 more studies that addressed eczema, which might be because we conducted more extensive searches for studies in additional databases. Although a 'Risk of bias' assessment was conducted in the Lindh 2015 review, supportive judgements and justifications for those judgements were often lacking. However in our review we were quite successful at contacting principal investigators, and consequently our judgements for the various 'Risk of bias' domains differed in a number of instances. The authors of the Lindh 2015 review considered that the efficacy for urea‐based preparation was most well‐documented and concluded that they had "found convincing evidence that moisturizer treatment is beneficial for AD [atopic dermatitis] and related disorders". Although we are in general in concordance with the conclusion of the review ‐ that moisturiser treatment is beneficial ‐ a rating of the quality of evidence by the reviewers was lacking.
An evidence‐based treatment update for atopic dermatitis was published in 2014 (Silverberg 2014). This systematic review included randomised controlled trials as well as systematic reviews, complied with the PRISMA statement, and covered the period from 2011 until August 2013.However, the searches were restricted to MEDLINE only. There were clear inclusion and exclusion criteria and GRADE was used to assess the quality of evidence, but only for the systematic reviews retrieved by the search, which did not include any for moisturisers. The time span was quite limited (2.5 years) and only one RCT was included and a full critical appraisal was not carried out. The review reached no clear conclusions on the efficacy of moisturisers.
We identified and evaluated several narrative reviews, such as the Mack Correa 2012 review, which described the role of moisturisers in eczema management and summarised studies conducted with moisturisers, but did not appraise the studies that were selected critically. The narrative Sirikudta 2013 review provided a general overview of active ingredients in moisturisers, including those in popular over‐the‐counter moisturisers, and those that are supposed to have an anti‐inflammatory effect such as Vitellaria paradoxa (shea butter; formerly Butyrospermum parkii), glycyrrhetinic acid and licochalcone A (from Glycyrrhiza inflata), as well as a list of moisturising properties of the active ingredients. Our Cochrane Review included studies that evaluated moisturisers containing these ingredients.
Moncrieff 2013 is a consensus statement on the use of emollients in dry‐skin conditions that summarised current data and practice, and emphasised that there is evidence that urea‐containing creams enhance efficacy, prolong time to flare, and are topical corticosteroid‐sparing when compared to not using a moisturiser. The statement covers seven key topics, and concludes with consensus‐based conclusions and recommendations that are consistent with the findings of our review. An additional important conclusion was that the efficacy of a moisturiser is dependent on the adherence to treatment of people suffering from eczema, and that informed, shared decision making based on a spectrum of moisturisers, is key to optimising moisturiser treatment.
Preparation of the eczema treatment guideline of the American Academy of Dermatology included an extensive search across various databases (Eichenfield 2014a). Its authors based the evidence on the 'Strength of Recommendations Taxonomy' (SORT), where levels of evidence for individual studies are graded on a 3‐point scale and recommendations are formulated according to the best available evidence (graded A, B, C). This guideline reported that there is strong evidence that the use of moisturisers can reduce disease severity and the need for pharmacological treatment, and that, therefore, their use should be an integral part of eczema treatment. The number of studies included to evaluate the efficacy of moisturisers was much smaller than in our review, but the results and conclusions of the guideline are in broad agreement with our findings.
Katayama 2014, a Japanese guideline, was not very informative regarding moisturisers for eczema; it contained no evidentiary support from clinical trials, ratings of the quality of evidence or gradings of strengths of recommendations, but mainly reported that moisturisers are recommended and useful to prevent flares. The guideline, however, did provide a warning that "urea preparations should be used with caution, as they can stimulate an eroded surface or strongly inflammatory skin".
Similarly, the Canadian Practical Guide for treatment and management of eczema did not involve a robust methodological approach, but mainly indicated that moisturising of the skin is a fundamental part of treatment for eczema (Lynde 2005).
The National Institute for Health and Clinical Excellence (NICE) guideline only addressed eczema in children from birth to 12 years old (NICE 2007). The recommendations support the daily use of moisturisers for all eczema severities based on children’s need and preferences. Data from a limited number of RCTs that investigated the efficacy of moisturisers were summarised in evidence tables. Follow‐up searches (surveillance review) were conducted up to 2013 and concluded there was no new evidence that might have an impact on the clinical recommendations. In July 2016 it was decided not to update this guideline further (www.nice.org.uk/Guidance/CG57).
The guideline from the European Dermatology Forum, European and the European Academy of Dermatology and Venereology (EADV), the European Task Force on Atopic Dermatitis (ETFAD), European Federation of Allergy (EFA), the European Society of Pediatric Dermatology (ESPD), and the Global Allergy and Asthma European Network (GA2LEN) (Ring 2012a), reported that there was "limited evidence‐based proof" for using moisturisers. Different ingredients in moisturisers were described, together with their benefits and harms, but these guidelines did not undertake any 'Risk of bias' assessments or any appraisal of the methodological quality of the included studies.
The Scottish Intercollegiate Guidelines Network (SIGN) guideline presented conclusions based on the Hoare 2000 systematic review, and provided levels of evidence, graded recommendations (A to D), and identified good practice points for the various eczema treatments (SIGN 2011). Its authors concluded that people with eczema should have continuous treatment with moisturisers, and should continue moisturiser treatment during treatment with topical corticosteroids. Furthermore, twice weekly maintenance treatment with topical corticosteroids should be considered in people with moderate to severe eczema with frequent flares (based on the Berth‐Jones 2003 study).
An overview of how moisturisers should be used in practice, how they work, and what type of moisturisers are available, was summarised in a best practice statement produced by the British Dermatology Nursing Group (BDNG) in association with Dermatological Nursing (Penzer 2012). The statements made in this publication were supported by studies or guidelines, and are in concordance with the conclusions we draw in this Cochrane Review.
A recent paper entitled 'Views on unwanted effects of leave‐on emollients and experiences surrounding their incidence' addressed the results of a survey amongst 210 people with eczema and their carers (Oakley 2016). This study aimed to gain a greater understanding of unwanted events associated with moisturisers, and whether these might influence adherence. The findings of this survey are consistent with the results our review, as we found that participants' satisfaction with moisturisers was only assessed in 13/77 studies and that reporting of adverse events was inconsistent, without clear distinction between adverse events and unwanted events. In the Oakley 2016 survey 126/185 responders reported that they had experienced unwanted effects with the use of moisturisers (stinging was most reported), and 90/126 stopped using the moisturiser because of this unwanted effect. Oakley 2016 stated that these results confirm that poor adherence is related to unwanted effects, which underlines the importance of patient satisfaction with moisturisers in both clinical practice and future research.

Study flow diagram

Risk of bias graph: review authors' judgements about each risk of bias item presented as percentages across all included studies

Risk of bias summary: review authors' judgements about each risk of bias item for each included study

Funnel plot of comparison 5: All moisturisers versus vehicle, placebo or no treatment (no moisturiser), outcome: 5.5 Change in disease severity as assessed by the investigators

Comparison 1: Moisturisers versus no treatment (i.e. no moisturiser), Outcome 1: Change from baseline in SCORAD

Comparison 1: Moisturisers versus no treatment (i.e. no moisturiser), Outcome 2: Number of participants experiencing a flare

Comparison 1: Moisturisers versus no treatment (i.e. no moisturiser), Outcome 3: Rate of flare

Comparison 1: Moisturisers versus no treatment (i.e. no moisturiser), Outcome 4: Amount of topical steroids used

Comparison 1: Moisturisers versus no treatment (i.e. no moisturiser), Outcome 5: Change from baseline in quality of life

Comparison 2: Atopiclair versus vehicle, Outcome 1: Number of participants who experienced good improvement to total resolution

Comparison 2: Atopiclair versus vehicle, Outcome 2: Change from baseline in itch measured on a VAS

Comparison 2: Atopiclair versus vehicle, Outcome 3: Number of participants reporting an adverse event

Comparison 2: Atopiclair versus vehicle, Outcome 4: Change from baseline in EASI

Comparison 2: Atopiclair versus vehicle, Outcome 5: Number of participants experiencing a flare

Comparison 3: Urea‐containing moisturiser versus vehicle, Outcome 1: Change from baseline in skin capacitance

Comparison 4: Glycerin cream versus placebo cream, Outcome 1: Number of participants reporting an adverse event

Comparison 5: Oat‐containing cream versus vehicle or no treatment, Outcome 1: Change in disease severity as assessed by the investigators (SCORAD and EASI)

Comparison 5: Oat‐containing cream versus vehicle or no treatment, Outcome 2: Change from baseline in quality of life

Comparison 6: All moisturisers versus vehicle, placebo or no treatment (no moisturiser), Outcome 1: Number of participants who experienced improvement

Comparison 6: All moisturisers versus vehicle, placebo or no treatment (no moisturiser), Outcome 2: Change from baseline in itch

Comparison 6: All moisturisers versus vehicle, placebo or no treatment (no moisturiser), Outcome 3: Number of participants who expressed treatment satisfaction

Comparison 6: All moisturisers versus vehicle, placebo or no treatment (no moisturiser), Outcome 4: Number of participants reporting an adverse event

Comparison 6: All moisturisers versus vehicle, placebo or no treatment (no moisturiser), Outcome 5: Change in disease severity as assessed by the investigators

Comparison 6: All moisturisers versus vehicle, placebo or no treatment (no moisturiser), Outcome 6: Number of participants experiencing a flare

Comparison 6: All moisturisers versus vehicle, placebo or no treatment (no moisturiser), Outcome 7: Change from baseline in quality of life

Comparison 7: Evening primrose oil versus placebo oil, Outcome 1: Change from baseline in TEWL

Comparison 7: Evening primrose oil versus placebo oil, Outcome 2: Change from baseline in skin hydration

Comparison 8: Licochalcone versus hydrocortisone acetate (HCA) 1%, Outcome 1: Change from baseline in itch (VAS)

Comparison 8: Licochalcone versus hydrocortisone acetate (HCA) 1%, Outcome 2: Change from baseline in SCORAD

Comparison 8: Licochalcone versus hydrocortisone acetate (HCA) 1%, Outcome 3: Change from baseline in TEWL

Comparison 9: Advabase versus MPA cream twice weekly and emollient, Outcome 1: Rate of flare

Comparison 10: Vehicle + daily moisturiser versus fluticasone propionate (FP) + daily moisturiser, Outcome 1: Number of participants reporting an adverse event

Comparison 10: Vehicle + daily moisturiser versus fluticasone propionate (FP) + daily moisturiser, Outcome 2: Number of participants experiencing a flare

Comparison 10: Vehicle + daily moisturiser versus fluticasone propionate (FP) + daily moisturiser, Outcome 3: Rate of flare

Comparison 11: Active treatment in combination with a moisturiser versus active treatment only, Outcome 1: Change in disease severity as assessed by the investigators

Comparison 11: Active treatment in combination with a moisturiser versus active treatment only, Outcome 2: Change in quality of life IDQOL

Comparison 11: Active treatment in combination with a moisturiser versus active treatment only, Outcome 3: Change in quality of life DFI
| Moisturisers versus no moisturiser for eczema | ||||||
| Patient or population: people with eczema | ||||||
| Outcomes | Anticipated absolute effects* (95% CI) | Relative effect | № of participants | Quality of the evidence | Comments | |
|---|---|---|---|---|---|---|
| Risk with no moisturiser | Risk with moisturisers | |||||
| Change from baseline in disease severity according to participants ‐ not measured | ‐ | ‐ | ‐ | ‐ | ‐ | This outcome was not assessed in any of the studies. |
| Participant satisfaction ‐ not measured | ‐ | ‐ | ‐ | ‐ | ‐ | This outcome was not assessed in any of the studies. |
| Number of participants reporting an adverse event | Study population | RR15.34 | 173 | ⊕⊕⊝⊝ | 8/91 versus 0/82 reported an adverse event. Peto OR 7.26 (95% CI 1.76 to 29.92). 3 adverse events were reported to be mild, 3 moderate, and 2 were severe leading to treatment discontinuation. No adverse events were reported in the study of Simpson 2013 (within‐participant). | |
| 1 per 100 (0.5/82)a | 9 per 100 (1 to100) | |||||
| Change from baseline in disease severity as assessed by the investigators | The mean change from baseline in disease severity as assessed by the investigators ranged from ‐2.4 to ‐19.5 | The mean change from baseline in disease severity as assessed by the investigators in the intervention group was 2.42 lower (4.55 lower to 0.28 lower) | ‐ | 276 | ⊕⊕⊝⊝ | Reductions from baseline in Giordano‐Labadie 2006 and Grimalt 2007 met MID (= 8.7 Schram 2012) in both treatment arms. There was greater severity of disease in these studies than in Patrizi 2014. A MD of ‐2.42, although statistically significant, is not clinically important. |
| Number of participants who experienced a flare | Study population | RR 0.40 | 87 | ⊕⊕⊝⊝ | There were fewer flares in the moisturiser groups. The rate of flare in the control group was 3.74 times the rate in the moisturiser group (hazard ratio (HR) 3.74, 95% CI 1.86 to 7.50; P = 0.0002). | |
| 67 per 100 | 27 per 100 | |||||
| Amount of corticosteroids used | The mean amount of corticosteroids used ranged from 22.73 g to 62.1 g | The mean amount of corticosteroids used in the intervention group was 9.30 g less (15.30 g less to 3.27 g less) | ‐ | 222 | ⊕⊕⊝⊝ | P = 0.003. There was a statistically significant difference showing that the use of moisturisers decreased the use of topical corticosteroids to achieve similar reductions in SCORAD. |
| Change from baseline in health‐related quality of life | ‐ | The mean change from baseline in health‐related quality of life in the intervention group calculated as the SMD was 0.15 lower (0.55 lower to 0.24 higher) | ‐ | 177 | ⊕⊕⊝⊝ | There was no statistically significant difference in change from baseline of quality of life between the 2 treatment arms. |
| *The risk in the intervention group (and its 95% confidence interval) is based on the assumed risk in the comparison group and the relative effect of the intervention (and its 95% CI). | ||||||
| GRADE Working Group grades of evidence | ||||||
| aWe had to put a value other than 0 in GRADEproGDT to calculate the risk with no moisturiser in relation to the RR, and we chose 0.5 (after discussion with the GRADE working Group). GRADEproGDT then calculates the risk with moisturiser. 2Downgraded one level due to high risk of bias because of performance and detection bias. 3Downgraded one level due to serious imprecision (wide confidence interval, low occurrence of events). 4Giordano‐Labadie 2006, Grimalt 2007, Patrizi 2014. 5Downgraded one level for serious inconsistency (I² = 68%), caused by Grimalt 2007. 7Downgraded one level for serious imprecision (small sample size). 8Giordano‐Labadie 2006, Grimalt 2007. 9Downgraded one level for serious inconsistency (I² = 68%). In the study of Giordano‐Labadie 2006, far more topical corticosteroids were used and the difference between the two arms was much larger. 10Downgraded one level for serious imprecision (wide confidence interval). | ||||||
| Atopiclair versus vehicle for eczema | ||||||
| Patient or population: people with eczema | ||||||
| Outcomes | Anticipated absolute effects* (95% CI) | Relative effect | № of participants | Quality of the evidence | Comments | |
|---|---|---|---|---|---|---|
| Risk with vehicle | Risk with Atopiclair | |||||
| Change from baseline in disease severity according to participants (number of participants who considered their skin to have improved) | Study population | RR 4.51 | 390 | ⊕⊕⊕⊝ | Participants considered Atopiclair more effective than its vehicle. NNTB = 2, 95% CI 1 to 2 | |
| 17 per 100 | 77 per 100 | |||||
| Participant satisfaction | Study population | Not estimable | 248 | ⊕⊕⊕⊝ | Abramovits 2008: 119/145 (Atopiclair) vs 28/73 (vehicle) wished to continue (RR 2.14, 95% CI 1.58 to 2.89; P < 0.00001; NNTB = 2; 95% CI 2 to 3). Belloni 2005: 5/15 vs 0/15 would use again (Peto OR 10.18, 95% CI 1.54 to 67.23; P = 0.02) | |
| Not pooled | Not pooled | |||||
| Number of participants reporting an adverse event | Study population | RR 1.03 | 430 | ⊕⊕⊕⊝ | The number of participants reporting adverse events was not statistically different between the 2 groups. | |
| 33 per 100 | 34 per 100 | |||||
| Change from baseline in disease severity according to the investigators | The mean change from baseline in disease severity according to the investigators ranged from ‐1.7 to 0.84 | The mean change from baseline in disease severity according to the investigators in the intervention group was 4 lower (5.42 lower to 2.57 lower) | ‐ | 426 | ⊕⊕⊕⊝ | Although there is a statistically significant difference in favour of Atopiclair, the difference between the treatment group is not clinically important (MID EASI is 6.6 (Schram 2012)). |
| Number of participants who experienced a flare | Study population | RR 0.18 | 397 | ⊕⊕⊕⊝ | Participants in the Atopiclair group experienced fewer flares than the vehicle group (NNTB 3, 95% CI 3 to 5). | |
| 35 per 100 | 6 per 100 | |||||
| Change in use of topical active treatment ‐ not measured | ‐ | ‐ | ‐ | ‐ | ‐ | This outcome was not assessed in any of the studies. |
| Change from baseline in health‐related quality of life ‐ not measured | ‐ | ‐ | ‐ | ‐ | ‐ | This outcome was not assessed in any of the studies. |
| *The risk in the intervention group (and its 95% confidence interval) is based on the assumed risk in the comparison group and the relative effect of the intervention (and its 95% CI). | ||||||
| GRADE Working Group grades of evidence | ||||||
| 1Abramovits 2008, Belloni 2005, Boguniewicz 2008. 2Downgraded one level for serious imprecision (wide confidence interval). 3Abramovits 2008, Belloni 2005. 4Downgraded one level for serious indirectness, as outcomes did not exactly match participant satisfaction. 5Abramovits 2008, Belloni 2005, Boguniewicz 2008, Patrizi 2008. 6Downgraded one level for serious imprecision (small sample size and CI includes no difference (1) and appreciable harm (1.25)). 7Downgraded one level for serious inconsistency (I² = 51%), caused by Boguniewicz 2008, which showed a larger effect size. 8Abramovits 2008, Boguniewicz 2008, Patrizi 2008. 9Downgraded one level for risk of bias (Abramovits 2008: high risk for attrition bias, Boguniewicz 2008: unclear risk of bias for allocation concealment blinding and incomplete outcome data, and Patrizi 2008: at unclear risk of bias due to incomplete outcome data). | ||||||
| Urea‐containing moisturiser versus vehicle, placebo or no moisturiser for eczema | ||||||
| Patient or population: people with eczema | ||||||
| Outcomes | Anticipated absolute effects* (95% CI) | Relative effect | № of participants | Quality of the evidence | Comments | |
|---|---|---|---|---|---|---|
| Risk with vehicle, placebo or no moisturiser | Risk with urea‐ containing moisturiser | |||||
| Change from baseline in disease severity according to the participants (number of participants who considered their skin to have improved) | Study population | RR 1.28 | 129 | ⊕⊕⊝⊝ | P = 0.0009. NNTB = 5 (95% CI 3 to 18). Participants considered that urea‐containing moisturiser provided more improvement than placebo cream without urea. In Wilhelm 1998 (n = 77, within‐participant design), 61% considered that the side treated with urea cream showed moderate to very good improvement, and 48.1% felt the vehicle‐treated side showed moderate to very good improvement. | |
| 70 per 100 | 89 per 100 | |||||
| Participant satisfaction Assessed with: Likert scale Follow‐up: mean 4 weeks | ‐ | 38 (1 RCT) 4, 5 | ⊕⊕⊝⊝ | Smell, spreadability, penetration into the skin, and skin feel were assessed. None of these features were assessed as being better on the urea‐treated side than on the vehicle‐treated side. For details, see comparison 2b under Effects of interventions. | ||
| Number of participants reporting an adverse event | Study population | RR 1.65 | 129 | ⊕⊕⊕⊝ | P = 0.005; NNTH = 4, 95% CI 2 to 11.There were fewer adverse events in the group treated with placebo cream. | |
| 39 per 100 | 65 per 100 | |||||
| Change from baseline in disease severity according to the investigators (number of participants who improved according to the investigators) | Study population | RR 1.40 | 129 | ⊕⊕⊕⊝ | The assessments of the investigators were in line with the assessments of the participants. P = 0.001; NNTB = 4, 95% CI 3 to 9. The within‐participant study of Wilhelm 1998 demonstrated a mean of the paired differences of ‐0.57 (95% CI ‐1.14 to 0.0) in favour of urea moisturiser (lower score being better), and is more or less in line with the parallel‐design study of Lodén 2002. | |
| 64 per 100 | 89 per 100 | |||||
| Number of participants who experienced a flare | Study population | RR 0.47 | 44 | ⊕⊕⊝⊝ | P = 0.03; NNTB = 3, 95% CI 2 to 11 The rate of flare in the group that did not use a moisturiser was 3.2 times the rate in the group treated with urea cream (HR 3.2, 95% CI 1.3 to 7.8; P < 0.01). | |
| 68 per 100 | 32 per 100 | |||||
| Change in use of topical active treatment ‐ not measured | ‐ | ‐ | ‐ | ‐ | ‐ | This outcome was not assessed in any of the studies. |
| Change from baseline in health‐related quality of life ‐ not measured | ‐ | ‐ | ‐ | ‐ | ‐ | This outcome was not assessed in any of the studies. |
| *The risk in the intervention group (and its 95% confidence interval) is based on the assumed risk in the comparison group and the relative effect of the intervention (and its 95% CI). | ||||||
| GRADE Working Group grades of evidence | ||||||
| 2Downgraded one level for serious indirectness, the study of Lodén 2002 had a parallel study design and the study of Wilhelm 1998 had a within‐participant design. 3Downgraded one level for serious imprecision (small sample size). 5Within‐participant design. 6Downgraded two levels for very serious imprecision (very small sample size). 8Downgraded one level for risk of bias as Wirén 2009 was assessed as at high risk of bias as the study was not blinded. | ||||||
| Glycerin/glycerol‐containing moisturiser versus vehicle or placebo for eczema | ||||||
| Patient or population: people with eczema | ||||||
| Outcomes | Anticipated absolute effects* (95% CI) | Relative effect | № of participants | Quality of the evidence | Comments | |
|---|---|---|---|---|---|---|
| Risk with vehicle or placebo | Risk with glycerol‐containing moisturiser | |||||
| Change from baseline in disease severity as assessed by the participants | Study population | RR 1.22 | 134 | ⊕⊕⊕⊝ | Participants considered glycerol‐containing moisturiser more effective for improving dry skin than placebo cream (P = 0.03; NNTB = 6, 95% CI 3 to 60) | |
| 70 per 100 | 85 per 100 | |||||
| Participant satisfaction ‐ not measured | ‐ | ‐ | ‐ | ‐ | ‐ | This outcome was not assessed in any of the studies. |
| Number of participants reporting an adverse event | Study population | RR 0.90 | 385 | ⊕⊕⊕⊝ | The adverse events were mild to moderate and consisted of smarting, erythema, pruritus, or burning. | |
| 35 per 100 | 32 per 100 | |||||
| Change from baseline in disease severity as assessed by the investigators | The mean change from baseline in disease severity as assessed by the investigators was ‐3.1 | The mean change from baseline in disease severity as assessed by the investigators in the intervention group was 2.2 lower (3.44 lower to 0.96 lower) | ‐ | 249 | ⊕⊕⊕⊕ | P = 0.0005, but does not meet the MID (which is 8.2 for objective SCORAD (Schram 2012)). The study of Breternitz 2008 had a within‐participant design and confirmed these data. The mean of the paired differences was ‐1.10, CI 95% ‐1.63 to ‐0.57. In Lodén 2002, in the glycerol group 58/68 showed improvement in 'dryness' of the skin versus 42/66 in the vehicle group (RR 1.34, 95% CI 1.09 to 1.65; P = 0.0006, NNTB 5, 95% CI 3 to 14) |
| Number of participants who experienced a flare ‐ not measured | ‐ | ‐ | ‐ | ‐ | ‐ | This outcome was not assessed in any of the studies. |
| Change in use of topical active treatment ‐ not measured | ‐ | ‐ | ‐ | ‐ | ‐ | This outcome was not assessed in any of the studies. |
| Change from baseline in health‐related quality of life ‐ not measured | ‐ | ‐ | ‐ | ‐ | ‐ | This outcome was not assessed in any of the studies. |
| *The risk in the intervention group (and its 95% confidence interval) is based on the assumed risk in the comparison group and the relative effect of the intervention (and its 95% CI). | ||||||
| GRADE Working Group grades of evidence | ||||||
| 2Downgraded one level for serious imprecision (lower bound of CI approaches 1). 3Lodén 2002 and Boralevi 2014. 4Downgraded one level for serious imprecision (small sample size and CI includes appreciable benefit (0.75) and no difference (1)). | ||||||
| Oat‐containing moisturiser versus vehicle or no moisturiser | ||||||
| Patient or population: people with eczema | ||||||
| Outcomes | Anticipated absolute effects* (95% CI) | Relative effect | № of participants | Quality of the evidence | Comments | |
|---|---|---|---|---|---|---|
| Risk with vehicle or no moisturiser | Risk with oat‐containing moisturiser | |||||
| Change from baseline in disease severity as assessed by the participants (number of participants who considered their skin to have improved) | Study population | RR 1.11 | 50 | ⊕⊕⊝⊝ | P = 0.45. Participants did not consider that the oat‐containing moisturiser was more effective than the control treatment (occlusive vehicle). | |
| 76 per 100 | 84 per 100 | |||||
| Participant satisfaction | Study population | RR 1.06 | 50 | ⊕⊝⊝⊝ | P = 0.76. Participants were not more satisfied with oat‐containing moisturiser than with the occlusive vehicle. | |
| 68 per 100 | 72 per 100 | |||||
| Number of participants reporting an adverse event | Study population | RR 15.34 | 173 | ⊕⊕⊝⊝ | 8/91 versus 0/82 reported an adverse event. | |
| 1 per 100 | 9 per 100 | |||||
| Change from baseline in disease severity as assessed by the investigators | ‐ | The mean change from baseline in disease severity in the intervention group calculated as the SMD was 0.23 lower (0.66 lower to 0.21 higher) | ‐ | 272 | ⊕⊕⊝⊝ | P = 0.30. There was no statistically significant difference according to the investigators between the 2 treatment arms. |
| Number of participants who experienced a flare | Study population | RR 0.31 | 43 | ⊕⊕⊝⊝ | P = 0.01; NNTB = 2, 95% CI 1 to 5. The HR for rate of flare was 4.74 (95% CI 1.57 to 14.34; P = 0.006) in favour of the oat‐containing cream. | |
| 65 per 100 | 20 per 100 | |||||
| Total amount of topical corticosteroids used | The mean total amount of topical corticosteroids used ranged from 22.73 g to 62.1 g | The mean total amount of topical corticosteroids used in the intervention group was 9.3 g lower (15.3 g less to 3.27 g less) | ‐ | 222 | ⊕⊕⊝⊝ | P = 0.003. There is a statistically significant difference showing that the use of moisturisers decreased the use of topical corticosteroids to achieve similar reductions in disease severity. |
| Change from baseline in health‐related quality of life | ‐ | The mean change from baseline in health‐related quality of life in the intervention group calculated as the SMD was 0.09 lower (0.37 lower to 0.19 higher) | ‐ | 226 | ⊕⊕⊝⊝ | There was no statistically significant difference in change from baseline in quality of life between the 2 treatment arms. |
| *The risk in the intervention group (and its 95% confidence interval) is based on the assumed risk in the comparison group and the relative effect of the intervention (and its 95% CI). | ||||||
| GRADE Working Group grades of evidence | ||||||
| aWe had to put a value other than 0 in GRADEproGDT to calculate the risk with no moisturiser in relation to the RR, and we chose 0.5 (after discussion with the GRADE working Group). GRADEproGDT then calculates the risk with moisturiser. 2Downgraded two levels level for very serious imprecision (small sample size and CI includes no effect (1) and appreciable benefit (1.25)). 3Downgraded one level for serious indirectness as the outcome was more about soothing and calming of the skin and not really participant satisfaction. 4Downgraded two levels for very serious imprecision as the CI includes both no effect, and benefit of both oat‐containing cream as well as of the vehicle. 5Downgraded one level for risk of bias because of performance and detection bias. 6Downgraded one level for serious imprecision (wide confidence interval, low occurrence of events). 8Giordano‐Labadie 2006, Grimalt 2007, Nebus 2009. 9Downgraded one level for serious inconsistency (I² = 65%), caused by Giordano‐Labadie 2006, which was the study showing a favourable result for the oat‐containing creams whilst the other studies showed no difference between the treatment arms. 10Downgraded one level for serious imprecision; the CI creates uncertainty with the effect, ranging from moderate effect to small harmful effect. 11Weber 2015. 12Downgraded one level for serious imprecision (small sample size). 13Giordano‐Labadie 2006 and Grimalt 2007. 14Downgraded one level for serious inconsistency (I² = 68%). In the study of Giordano‐Labadie 2006, far more topical corticosteroids were used and the difference between the two arms was much larger. 15Downgraded one level for serious imprecision (wide confidence interval). 16Downgraded one level for serious risk of bias because of performance, detection, and attrition bias. 17Downgraded one level for serious imprecision (the CI creates uncertainty with the effect, ranging from small effect to small harmful effect). | ||||||
| All moisturisers compared to vehicle, placebo or no moisturiser for eczema | ||||||
| Patient or population: people with eczema | ||||||
| Outcomes | Anticipated absolute effects* (95% CI) | Relative effect | № of participants | Quality of the evidence | Comments | |
|---|---|---|---|---|---|---|
| Risk with vehicle, placebo or no moisturiser | Risk with all moisturisers | |||||
| Change from baseline in disease severity as assessed by the participants (number of participants who considered their skin to have improved) | Study population | RR 2.46 | 572 | ⊕⊕⊝⊝ | Participants considered the use of a moisturiser to be more effective than vehicle/placebo or no moisturiser. P = 0.02, NNTB = 2, 95% CI 2 to 3 | |
| 37 per 100 | 91 per 100 | |||||
| Participant satisfaction | Study population | RR 1.35 | 298 | ⊕⊕⊝⊝ | P = 0.29. According to the participants, there was no difference between the 2 treatment arms for this outcome. Results are supported by the within‐participant study (Bohnsack 1997). | |
| 48 per 100 | 65 per 100 | |||||
| Number of participants reporting an adverse event | Study population | RR 1.03 | 1275 | ⊕⊕⊕⊝ | There was no statistically significant difference in number of participants experiencing an adverse event. | |
| 23 per 100 | 24 per 100 | |||||
| Change from baseline in disease severity as assessed by the investigators | ‐ | The mean change from baseline in disease severity as assessed by the investigators in the intervention group calculated as the SMD was 1.04 lower (1.57 lower to 0.51 lower) | ‐ | 1281 | ⊕⊕⊕⊕ | P < 0.0001 The investigators considered the use of moisturisers to be more beneficial than the vehicle, placebo, or no moisturiser. However, clinical impact was unclear. |
| Number of participants who experienced a flare | Study population | RR 0.33 | 607 | ⊕⊕⊕⊝ | P = 0.006; NNTB = 4, 95% CI 3 to 5. The rate of flare in the control group was 3.74 times the rate in the moisturiser group based on Weber 2015 and Wirén 2009 (HR 3.74, 95% CI 1.86 to 7.50; P = 0.0002 in favour of moisturiser). | |
| 41 per 100 | 13 per 100 | |||||
| Total amount of topical corticosteroids used | The mean amount of corticosteroids used ranged from 22.73 g to 62.1 g | The mean amount of corticosteroids used in the intervention group was 9.30 g less (15.30 g less to 3.27 g less) | ‐ | 222 | ⊕⊕⊝⊝ | P = 0.003. There was a statistically significant difference showing that the use of moisturisers decreased the use of topical corticosteroids to achieve similar reductions in eczema severity. |
| Change from baseline in health‐related quality of life | ‐ | The mean change from baseline in health‐related quality of life in the intervention group calculated as the SMD was 0.39 lower (0.9 lower to 0.12 higher) | ‐ | 300 | ⊕⊕⊝⊝ | The effect on quality of life ranges from a moderate effect on quality of life in favour of moisturisers to no difference between the groups. |
| *The risk in the intervention group (and its 95% confidence interval) is based on the assumed risk in the comparison group and the relative effect of the intervention (and its 95% CI). | ||||||
| GRADE Working Group grades of evidence | ||||||
| 1Abramovits 2008, Belloni 2005, Boguniewicz 2008, Lodén 2002, Nebus 2009. 2Downgraded one level for inconsistency (I² = 95%), which was in part caused studies by studies at risk for attrition bias (Abramovits 2008 and Boguniewicz 2008). 3Downgraded one level for serious imprecision (wide confidence interval). 4Abramovits 2008, Belloni 2005, Nebus 2009. 5Downgraded one level for serious inconsistency (I² = 83%). All heterogeneity was removed when a study at high risk of bias was excluded (Abramovits 2008); we did not double count for risk of bias. 6Downgraded one level for serious imprecision (CI interval includes no effect (1) and appreciable benefit (1.25)). 7Abramovits 2008, Belloni 2005, Boguniewicz 2008, Boralevi 2014, Gayraud 2015, Grimalt 2007, Korting 2010, Lodén 2002, Patrizi 2008, Tan 2010. 8Downgraded one level for imprecision (CI interval included no difference (1) and appreciable harm (1.25)). 9Abramovits 2008, Belloni 2005, Boguniewicz 2008, Boralevi 2014, Gayraud 2015, Giordano‐Labadie 2006, Grimalt 2007, Korting 2010, Nebus 2009, Patrizi 2008, Patrizi 2014, Tan 2010. 10We did not downgrade for inconsistency as all sensitivity analyses show a clear positive effect of moisturisers. 11Abramovits 2008, Boguniewicz 2008, Gayraud 2015, Patrizi 2008, Weber 2015, Wirén 2009. 12Downgraded one level for serious inconsistency (I² = 73%), which was caused by the studies at unclear to high risk of bias showing better results. 13Giordano‐Labadie 2006, Grimalt 2007. 14Downgraded one level for serious inconsistency (I² = 68%). In the study of Giordano‐Labadie 2006, far more topical corticosteroids were used and the difference between the two arms was much larger. 15Gayraud 2015, Giordano‐Labadie 2006, Grimalt 2007. 16We did not downgrade for risk of bias, as, although there was attrition bias in Grimalt 2007, it did not impact the overall result, and even reduced the direction of effect. 17Downgraded one level for serious inconsistency (I² = 79%), it might have no effect at all, signal around 0. 18Downgraded one level for serious imprecision (CI includes moderate effect in favour of moisturisers as well as no difference). | ||||||
| Licochalcone‐containing moisturiser versus hydrocortisone acetate1% cream for eczema | ||||||
| Patient or population: people with eczema | ||||||
| Outcomes | Anticipated absolute effects* (95% CI) | Relative effect | № of participants | Quality of the evidence | Comments | |
|---|---|---|---|---|---|---|
| Risk with hydrocortisone acetate 1% cream | Risk with licochalcone‐containing moisturiser | |||||
| Change from baseline in disease severity according to participants ‐ not measured | ‐ | ‐ | ‐ | ‐ | ‐ | This outcome was not assessed in any of the studies. |
| Number of participants who rated treatment satisfaction as good to excellent | ‐ | ‐ | ‐ | 30 | ⊕⊕⊝⊝ | On both treatment sides, 22/30 participants rated their satisfaction good to excellent with no difference between either side. |
| Number of participants reporting an adverse event | ‐ | ‐ | ‐ | 18 | ⊕⊕⊝⊝ | Both Udompataikul 2011 and Wanakul 2013 reported no adverse events on any side during the study. Side effects in Angelova‐Fischer 2014 (within‐participant study) were skin tightness, itch, and scaling on both sides. 9 side effects were reported on each forearm (n = 18). |
| Change from baseline in disease severityas assessed by the investigators | The mean disease severity as assessed by the investigators ranged from ‐3.50 to ‐21.29 | The mean disease severity as assessed by the investigators in the intervention group was 0.08 higher (1.96 lower to 2.13 higher) | ‐ | 96 | ⊕⊕⊝⊝ | There was no statistically significant difference between the 2 treatments, which is in accordance with the data for participant satisfaction. |
| Number of participants who experienced a flare | ‐ | ‐ | ‐ | 30 | ⊕⊕⊝⊝ | 3/30 experienced a flare on the side treated with licochalcone and 6/30 on the contralateral side treated with hydrocortisone acetate 1%. |
| Change in use of active topical treatment ‐ not measured | ‐ | ‐ | ‐ | ‐ | ‐ | This outcome was not assessed in any of the studies. |
| Change from baseline in quality of life ‐ not measured | ‐ | ‐ | ‐ | ‐ | ‐ | This outcome was not assessed in any of the studies. |
| *The risk in the intervention group (and its 95% confidence interval) is based on the assumed risk in the comparison group and the relative effect of the intervention (and its 95% CI). | ||||||
| GRADE Working Group grades of evidence | ||||||
| 1Within‐participant study Udompataikul 2011. 2We did not downgrade for detection bias as the participants were not blinded, but they considered treatments equally satisfactory. 3Downgraded two levels for serious imprecision (very small sample size). 4Within‐participant study Angelova‐Fischer 2014. 5Not downgraded for risk of bias (participants in Angelova‐Fischer 2014 and Udompataikul 2011 were not blinded) as there was no difference between the both treatment arms regarding reporting adverse events. 6Downgraded two levels for very serious imprecision (very small sample size). 7We did not downgrade for detection bias as investigators were blinded. 8Downgraded two levels for very serious inconsistency (I² = 85%); it could benefit both treatments. We therefore did not downgrade further for imprecision. Differences in study duration, and, in Angelova‐Fischer 2014, only forearms were treated. 9Downgraded one level for serious imprecision (small sample size and as we downgraded for risk of bias, we only downgraded once for imprecision for this outcome). 10Downgraded one level for risk of bias (no blinding of participants). | ||||||
| Vehicle treatment + daily moisturiser compared to fluticasone propionate twice weekly + daily moisturiser for eczema | ||||||
| Patient or population: people with eczema | ||||||
| Outcomes | Anticipated absolute effects* (95% CI) | Relative effect | № of participants | Quality of the evidence | Comments | |
|---|---|---|---|---|---|---|
| Risk with fluticasone propionate twice weekly + moisturiser | Risk with vehicle treatment + moisturiser | |||||
| Change from baseline in disease severity as assessed by the participants (number of participants reporting good to excellent result) | Study population | RR 0.45 | 348 | ⊕⊕⊕⊕ | NNTB = 3, 95% CI 2 to 3, in favour of fluticasone propionate twice weekly + daily moisturiser | |
| 71 per 100 | 32 per 100 | |||||
| Participant satisfaction ‐ not measured | ‐ | ‐ | ‐ | ‐ | ‐ | This outcome was not assessed in any of the studies. |
| Number of participants reporting an adverse event | Study population | RR 0.51 | 718 | ⊕⊕⊝⊝ | Although there was a trend favouring the vehicle treatment + daily moisturiser, the 2 comparisons of Berth‐Jones 2003 implied that they might be equally safe (no adverse events in either group). | |
| 22 per 100 | 11 per 100 | |||||
| Change from baseline in disease severityas assessed by the investigators | 75 (1 RCT)5 | ⊕⊕⊕⊝ | There were reporting inconsistencies in the paper between the data table and text regarding the increase in SCORAD in the twice‐weekly fluticasone propionate + daily moisturiser group. These were reported as 7.1 in the table and as 3.8 in the text. In the vehicle + daily moisturiser group, the increase was 12.2 in both table and text. | |||
| Number of participants who experienced a flare | Study population | RR 2.17 | 718 | ⊕⊕⊕⊝ | NNTB = 3, 95% CI 2 to 3. Twice‐weekly fluticasone propionate combined with moisturiser resulted in fewer flares than moisturiser alone. HR of rate of flare 3.69, 95% CI 1.80 to 7.55 in favour of fluticasone propionate twice weekly + daily moisturiser | |
| 28 per 100 | 61 per 100 | |||||
| Change in use of topical active treatment ‐ not measured | ‐ | ‐ | ‐ | ‐ | ‐ | This outcome was not assessed in any of the studies. |
| Change from baseline in quality of life ‐ not measured | ‐ | ‐ | ‐ | ‐ | ‐ | This outcome was not assessed in any of the studies. |
| *The risk in the intervention group (and its 95% confidence interval) is based on the assumed risk in the comparison group and the relative effect of the intervention (and its 95% CI). | ||||||
| GRADE Working Group grades of evidence | ||||||
| 2Berth‐Jones 2003 (two comparisons), Glazenburg 2009, Hanifin 2002. 3Downgraded one level for serious inconsistency (I² = 67%); as there were no adverse events in both comparisons in Berth‐Jones 2003 in both treatment arms, they could be equally safe. 4Downgraded one level for serious imprecision (CI includes appreciable benefit and no difference). 5Glazenburg 2009 (See 'Comments'). 6Downgraded one level for serious imprecision (small sample size). 7Downgraded one level for serious inconsistency (I² = 72%). | ||||||
| Topical active treatment in combination with moisturiser compared to topical active treatment alone for eczema | ||||||
| Patient or population: people with eczema | ||||||
| Outcomes | Anticipated absolute effects* (95% CI) | Relative effect | № of participants | Quality of the evidence | Comments | |
|---|---|---|---|---|---|---|
| Risk with active treatment alone | Risk with active treatment in combination with moisturiser | |||||
| Change from baseline in disease severity according to participants ‐ not measured | ‐ | ‐ | ‐ | ‐ | ‐ | This outcome was not assessed in any of the studies. |
| Participant satisfaction | ‐ | ‐ | 201 | ⊕⊕⊝⊝ | Hanifin 1998: 96% of 78 preferred the combination treatment and just 4% the active treatment 'only'. Simpson 2011: 84.3% to 96.7% of 123 felt that the addition of the RestoraDerm to the routine use of their topical steroids "reduces inflammation, relieves dry and itchy skin, provides long lasting hydration, leaves skin protected and maintains healthy skin". | |
| Number of participants reporting an adverse event Follow‐up: mean 3 weeks | Study population | RR 0.39 | 125 | ⊕⊝⊝⊝ | Draelos 2008: no adverse events. Hanifin 1998 (within‐participant): 10 participants reported burning and stinging on the side treated with desonide 0.05% combined with moisturiser versus 11 on the other side treated with only desonide 0.05%. | |
| 16 per 100 | 6 per 100 | |||||
| Change from baseline in disease severity as assessed by the investigators | ‐ | The mean change from baseline in disease severity as assessed by the investigators in the intervention group calculated as the SMD0.87 lower (1.17 lower to 0.57 lower) | ‐ | 192 | ⊕⊕⊕⊝ | According to the assessments of the investigators, adding a moisturiser to topical active treatment is more effective than topical active treatment alone. |
| Number of participants who experienced a flare | Study population | RR 0.43 | 105 | ⊕⊕⊝⊝ | Adding a moisturiser to active treatment reduced the number of flares (NNTB = 6, 95% CI 3 to 57). | |
| 31 per 100 | 13 per 100 | |||||
| Change in amount of use topical active treatment ‐ not measured | ‐ | ‐ | ‐ | ‐ | ‐ | This outcome was not assessed in any of the studies. |
| Change from baseline in health‐related quality of life | The mean change from baseline in health‐related quality of life ranged from ‐2.07 to ‐3.17 | The mean change from baseline in health‐related quality of life in the intervention group was 1.31 lower (2.7 lower to 0.09 higher) | ‐ | 67 | ⊕⊕⊝⊝ | The study duration of 3 weeks was short; there was no difference in changes from baseline in quality of life between the 2 treatment groups. Results of DFI confirmed this (MD ‐1.03, 95% CI ‐2.47 to 0.42) |
| *The risk in the intervention group (and its 95% confidence interval) is based on the assumed risk in the comparison group and the relative effect of the intervention (and its 95% CI). | ||||||
| GRADE Working Group grades of evidence | ||||||
| 1Within‐participant design. 3Downgraded one level for serious risk of detection bias (no blinding of participants). 4Downgraded one level for serious indirectness as in both studies satisfaction was not really assessed. 5Wu 2014. 6Downgraded one level for risk of bias. Hanifin 1998 and Wu 2014 were assessed as being at a high risk of bias. 7Downgraded one level for serious indirectness for different reporting on adverse events including outcome definitions. 8Downgraded one level for serious imprecision (small sample size, too few adverse events, and wide CI). 9Msika 2008 (2 comparisons), Wu 2014. 10Downgraded one level for risk of bias (no blinding of outcome assessors). 11Downgraded one level for risk of bias (attrition bias (17/62) in the control group). 12Downgraded one level for serious imprecision (small sample size). 13Msika 2008 (2 comparisons). 14Downgraded one level for risk of bias (no blinding of participants). | ||||||
| Term | Definition |
|---|---|
| Adverse events | Unwanted side effects of using medication |
| Allergic contact dermatitis | A form of eczema after contact with a substance (an allergen) that produces (elicits) an immune‐mediated response in the skin |
| Allergic rhinitis | 'Hay fever': inflammation of the nose caused by allergens such as house dust mite, animals, pollen. Symptoms include sneezing, itchiness in the nose, watery eyes, runny or blocked nose |
| Ameliorate | Improve, to make something (such as a problem) better |
| Atopy | The individual's genetic predisposition to develop allergic reactions such as eczema, allergic rhinitis and asthma. Atopy often involves production of IgE antibodies against allergens such as, for example, house dust mite, animals, grass and tree pollen, and food proteins. |
| Bacteria | Also referred to as germs, bacteria are tiny micro‐organisms that are invisible to the eye. They are found everywhere and can be harmful, e.g. causing infections, or helpful, e.g. aiding digestion of food |
| Ceramides | Lipid (fatty) molecules found in the lipid bilayer of the intercellular matrix (see `Intercellular lipid matrix' below) |
| Colonisation | The point at which an Infection begins, when an organism successfully enters the body, grows and multiplies |
| Control | The alternative treatment, placebo, or absence of treatment against which the intervention of interest in the review is compared |
| Corneodesmosomes | Any of a class of proteins that hold corneocytes (cells in the epidermis, or outer layers of the skin) together; their degradation leads to desquamation (see 'Desquamation' below) |
| DASI | Dry skin area and severity index: a tool used to evaluate dryness and severity of dry skin (Serup 1995) |
| Desquamation | Skin peeling |
| Dizygotic | Non‐identical twins, i.e. twins formed from two different eggs fertilised by separate sperm cells, are referred to as dizygotic. |
| DLQI | Dermatology Life Quality Index: an assessment tool to evaluate the impact of eczema and its treatment on quality of life (Finlay 1994) |
| EASI | Eczema Area and Severity Index: a tool used to measure the extent (area) and severity of eczema (Hanifin 2001) |
| Emollients | The terms `emollients' and `moisturisers' are often used interchangeably. But, since 'emollient' sometimes refers to a specific ingredient that soothes the skin, it is more appropriate to use the term 'moisturiser'. Emollients are included within ointments, creams, lotions, gels, bath oils and sprays, and are used to keep the skin soft and supple and reduce scaling. Application to the skin reduces water loss by covering it with a protective film. They can be used frequently and might ease itching |
| Epidermis | The outermost layers of cells in the skin which consist mainly of keratinocytes that mature to become corneocytes |
| Exacerbation | Periods of worsening the symptoms and signs of eczema |
| Excoriation | Abrasion, scratched skin |
| Extensor | The opposite site of a flexure point, i.e. the outer side of, for example elbow, knee or wrist |
| Filaggrin | An epidermal barrier protein |
| Flare | Periods of worsening of eczema symptoms and signs, or escalation in use of medication (Thomas 2015) |
| Flexural dermatitis | Eczema at the flexure points (inner sides) of elbow, knees, wrists, groin and armpits |
| Gene | Part of DNA that encodes a protein involved in body function |
| Genome‐wide linkage study | An established tool to map inherited diseases |
| Humectant | Substance or product that is 'water loving' and draws water towards it |
| Hygroscopic | Absorbing water |
| Hypersensitivity | An exaggerated immune response toward an allergen (for example pollen, house dust mite, but also for contact allergens such as nickel and fragrances) |
| IgE (immunoglobulin E) | A class of antibody that is important in defence against parasitic disease, and plays a key role in the disease process of allergic diseases. People with eczema often have an increased level of IgE in their blood |
| Immune response | The process through which the body identifies and defends itself against bacteria, viruses and other harmful agents |
| Intercellular lipid matrix | Space surrounding corneocytes with stacked layers of lipids |
| Lesion | A region or area of damaged skin |
| Lesional | Concerning lesions, or accompanied by lesions |
| Lichenification | Skin thickening |
| Moisturisers | Ointments, creams, lotions, gels, bath oils and sprays that are used to keep the skin soft and supple and reduce scaling. Application to the skin reduces water loss and covers it with a protective film. Moisturisers can be used frequently and might ease itching. |
| Monozygotic | Identical twins, i.e. twins who develop from a single fertilised egg (zygote) that splits to form two identical embryos, are referred to as monozygotic (in contrast to dizygotic twins (see above)). |
| Objective | Something observed and verified by physician or investigator by visible physical signs or laboratory tests (i.e. based on facts, not emotions or feelings) |
| Objective‐ SCORAD | Objective ‐ SCORing Atopic Dermatitis is a clinical scoring system, that uses the SCORAD system and excludes subjective symptoms, which cannot be measured accurately, such as daytime itching (pruritus) and sleep loss (Kunz 1997) |
| Occlusive | Describes an agent or process that seals something off |
| Over‐the‐counter (OTC) medicines | Medicines that can be bought without a prescription |
| Papulovesicular | Relating to an eruption of papules (clearly defined (circumscribed), solid elevations of skin with no visible fluid) and vesicles (small fluid‐filled sacs on the skin) |
| Pathogenesis | Origin of disease and how it develops |
| Pathognomonic biomarker | A specific indicator for a disease |
| Photochemotherapy (PUVA) | PUVA is a combination treatment of a drug (psoralen) with ultraviolet A (UVA) light. The psoralen makes the skin temporarily more sensitive to the ultraviolet light |
| Phototherapy | Treatment with ultraviolet light (UVB or UVA) |
| Placebo | A 'dummy' or fake medicine that has no expected benefit. In this review placebo means, in accordance with the terminology used by the investigators, a moisturiser without the ingredient considered to be the most beneficial, and so, of a different composition than the moisturiser being studied. Use of placebo treatments allows patients and staff to be blinded, as the placebo and active treatments appear the same, so it is impossible to tell which has been used. |
| POEM | The Patient Oriented Eczema Measure is a self‐assessment tool for monitoring eczema severity, based on signs and symptoms (Charman 2004) |
| PO‐SCORAD | The Patient‐Oriented SCORing Atopic Dermatitis (PO‐SCORAD) index is a self‐assessment score for patients to evaluate their eczema, based on subjective and objective criteria from the SCORAD (see also SCORAD below) (Stalder 2011) |
| Preservative | A natural or synthetic ingredient added to products such as foods, pharmaceuticals, paints, biological samples, wood, etc. which help to prevent decomposition caused by microbial growth or by undesirable chemical changes |
| Propylene glycol | Propylene glycols attract water and by enhancing skin penetration they behave as moisturisers to improve the appearance of the skin |
| Protease | An enzyme that breaks down proteins (via proteolysis) |
| Pruritus | Itch |
| Quality of life | The general well‐being of individuals and societies. Health‐Related Quality of Life (HRQoL) looks at quality of life in relation to health |
| QoLIAD | Quality of Life Index for Atopic Dermatitis (QoLIAD). An assessment tool to evaluate the impact of eczema and its treatment on quality of life (Whalley 2004) |
| Remission | A temporary or permanent decrease or absence of the symptoms and signs of disease activity |
| Sensitisation | Exposure to an allergen that results in the development of hypersensitivity, i.e. an increased or disproportionate response to the allergen |
| SCORAD‐index | An assessment tool used by clinicians to evaluate the extent and severity of eczema (SCORing Atopic Dermatitis) (European Task Force on Atopic Dermatitis 1993) |
| Staphyloccocus aureus | A type of bacterium that is often found on the skin |
| Subjective | Something experienced by the participant not perceived by the investigator or physician |
| TEWL | Trans‐epidermal water loss (TWL or TEWL) is the quantity of water that diffuses through and evaporates from the epidermis |
| Topical corticosteroid | Corticosteroids applied to the skin; these are effective in controlling inflammation and used to treat eczema and many other skin conditions |
| Urea | Urea absorbs water, helps to reduce the amount of water lost though the skin and increases skin penetration of other substances. It softens the horny layer and also has anti‐itch (anti‐pruritic) properties. |
| Vehicle | In this review 'vehicle' means a moisturiser that has the same composition as the studied moisturiser, but lacks the ingredient that is considered to be the most beneficial |
| Volar | The inside surface of the forearm, i.e. the same side as the palm of the hand |
| Xerosis | Dry skin |
| Study ID | Response | Additional | Comment |
|---|---|---|---|
| Emails sent: 26 June 2014, 7 February 2016, 12 February 2016, 26 February 2016, 12 March 2016, 19 March 2016, to [email protected] Regarding allocation concealment and method of blinding Replies received: 24 March 2016 with responses; 29 March 2016 with additional information | Yes | ‐ | |
| Emails sent: 13 February 2016, 26 February 2016, to irena.angelova‐fischer@uk‐sh.de Regarding sequence generation and allocation concealment Reply received: 1 March 2016 with response to sequence generation Several emails sent regarding allocation concealment, but this remains unclear | Yes | ‐ | |
| [email protected] no need to contact, but this is recent email for future update of the review | Not applicable | ‐ | |
| Email sent: 13 February 2016, to [email protected] Regarding sequence generation and allocation concealment Email received: 15 February 2016 with responses | Yes | ‐ | |
| Emails sent: 13 February 2016, 26 February 2016, to [email protected] Regarding method of blinding Email received: 27 February 2016 with responses | Yes | ‐ | |
| Emails sent: 12 May 2014, 14 June 2014, 21 January 2016, to [email protected] and [email protected] Regarding sequence generation, allocation concealment and method of blinding Replies received: 2 February 2015 and 15 February 2016; received all responses and additional material | Yes | ‐ | |
| Emails sent: 14 February 2016, 26 February 2016, 12 March 2016, 19 March 2016, to [email protected]. Also did not reply to questions about the Abramovits 2008 study Regarding allocation concealment and method of blinding, EASI scores at day 43 and subjects/care givers assessment of global response at day 43 in vehicle group No reply received | Not applicable | ‐ | |
| Emails sent: 15 February 2016, 26 February 2016, 12 March 2016, 26 March 2016, to franck.boralevi@chu‐bordeaux.fr Regarding P‐VAS scores, SCORAD, Objective SCORAD, and HI at day 28 as well as SDs Replies received: 31 March 2016 and 5 April 2016 responses and additional information | Yes | ‐ | |
| Emails sent: May 2014, 15 February 2016, to elsner@derma‐jena.de and [email protected] Regarding sequence generation, allocation concealment and method of blinding, mean SCORAD, TEWL, capacitance and SDs Replies received: 16 May 2014 and 15 February 2016, received responses and additional information | Yes | ‐ | |
| Emails sent: 15 February 2016, 26 February 2016, 15 March 2016, 19 March 2016, to [email protected] Regarding sequence generation, allocation concealment, method of blinding, TEWL values and SDs after 2 weeks, number of dropouts, numbers of male/female and age of participants Reply received: 22 March 2016 with responses to our questions | Yes | ‐ | |
| Email sent: 16 February 2016 to [email protected] and clarence.de‐[email protected] Regarding allocation concealment and method of blinding Replies received: 24 February 2016 and 12 March 2016 from [email protected] and [email protected], with responses to our questions | Yes | ‐ | |
| Emails sent: 16 February 2016, 12 March 2016, 19 March 2016, 26 March 2016, to [email protected] Regarding allocation concealment and method of blinding No reply received | Not applicable | ‐ | |
| Emails sent: 19 February 2016, 12 March 2016, 19 March 2016, 26 March 2016, to [email protected] Regarding allocation concealment and method of blinding, more precise baseline data and data at end of study means and SDs No reply received | Not applicable | ‐ | |
| Emails sent: 19 February 2016, 12 March 2016, 19 March 2016, 26 March 2016, to [email protected] Regarding sequence generation, allocation concealment, method of blinding, precise baseline data and data at end of study, means and SDs, Participant assessments of target site skin appearance for redness, peeling, dryness, stinging/burning, and overall skin irritation, sponsoring and declaration of interest No reply received | Not applicable | ‐ | |
| Emails sent: 5 March 2016, 12 March 2016, 19 March 2016, 26 March 2016 to Jason Emer (email not current anymore), with last 2 emails to A Frankel ([email protected]) Regarding sequence generation, allocation concealment, method of blinding, colour version of pdf and SDs at week 4 No reply received | Not applicable | ‐ | |
| Emails sent: 7 March 2016, 12 March 2016, to [email protected] Regarding sequence generation, allocation concealment, method of blinding, more precise data Reply received: 12 March 2015 "it is so long time ago that I performed this study so I do not remember. I retired last November 2015 and I do not have assess to any data now." | No | ‐ | |
| Email sent 9 March 2016 to [email protected] Regarding sequence generation, allocation concealment, method of blinding and incomplete data Reply received: 14 March 2014 with responses to our questions | Yes | ‐ | |
| Email sent: 13 May 2014 to giordano.labadie.f@chu‐toulouse.fr, frederic.cambazard@chu‐st‐etienne.fr, gerard.guillet@chu‐poitiers.fr, [email protected], and valerie.mengeaud@pierre‐fabre.com Regarding sequence generation and allocation concealment Reply received: 26 May 2014 with responses to our questions | Yes | ‐ | |
| Emails sent:14 March 2016, 19 March 2016, 26 March 2016, 3 April 2016, to [email protected] Regarding allocation concealment, method of blinding and inconsistencies in text page 64 and table 1 No reply received | Not applicable | ‐ | |
| Email sent: 13 April 2014, to [email protected], frederic.cambazard@chu‐st‐etienne.fr, valerie.mengeaud@pierre‐fabre.com Regarding sequence generation and allocation concealment Reply received: 24 June 2015, after several emails we received responses to everything we asked for | Yes | ‐ | |
| Email sent: 17 April 2016, to [email protected] (no longer correct, no more recent email, so sent again to [email protected], but this is also no longer correct) Regarding sequence generation, allocation concealment and baseline data for TEWL and corneometry No recent email addresses could be found | Not applicable | ‐ | |
| We could not find a current email address of any of the authors listed | Not applicable | ‐ | |
| Emails sent: 18 March 2016, 26 March 2016, 3‐4 February 2016,10 April 2016, to [email protected] Regarding sequence generation and allocation concealment, frequency of use, precise data after 3 months (means and SDs), more data on adverse events No reply received | Not applicable | ‐ | |
| Emails sent: 19 March 2016, 26 March 2016, 3 April 2016, to [email protected] Regarding allocation concealment, method of blinding, exact data for POEM and quality of life at baseline, and SCORAD, POEM and quality of life at day 28 | Not applicable | ‐ | |
| Emails sent: 8 January 2016, 24 January 2016, 12 February 2016, 8 April 2016, 18 April 2016, to [email protected] Regarding sequence generation and allocation concealment No reply received | Not applicable | ‐ | |
| Email sent: 19 March 2015, to [email protected] Regarding full text publication Reply received: 21 March 2015, Principal investigator could not remember anymore | No | ‐ | |
| Email sent: 19 March 2015, to [email protected] Regarding sequence generation, allocation concealment, method of blinding, exact TEWL values and corneometry with SDs at week 4 Reply received: 21 March 2016 with responses to some of our questions, the rest was no longer accessible | Yes and No | We did not receive exact data | |
| Email sent: 20 March 2016, to [email protected]‐muenchen.de Regarding allocation concealment and blinding Email address is no longer correct, and further searches showed that he died in 2012. None of the other authors could be contacted | Not applicable | ‐ | |
| Emails sent: 20 March 2016, 26 March 2016, to a‐[email protected], [email protected] [email protected] Regarding sequence generation, allocation concealment, method of blinding and precise study data Reply received: 26 March 2016 with responses to our questions | Yes | ‐ | |
| Emails sent: 15 April 2016, 19 April 2016, 23 April 2016, 30 April 2016, to [email protected] Regarding allocation concealment and blinding Reply received: 2 May 2016 with responses to our questions | Yes | ‐ | |
| Email sent: 14 May 2014, to [email protected]. Latest email address is [email protected] (since October 2015) Regarding sequence generation and allocation concealment Reply received: 14 May 2014 with responses to our questions | Yes | ‐ | |
| Email sent: 15 May 2014, to [email protected], clarence.de‐[email protected], [email protected] Regarding sequence generation, stratifying, allocation concealment, means and SDs for some outcomes and clarification about data losses for the following outcomes in particular IDQOL, DFI, IGE Reply received: 30 June 2014 with additional information | Yes | ‐ | |
| Email sent: 30 June 2014, to [email protected] and [email protected] Regarding clarification of correct citation i.e. author string/journal page numbers to the 2 citations listed in Included studies, plus sequence generation, allocation concealment and method of blinding Reply received: 30 June 2014 and 5 July 2014, with responses to our questions | Yes | ‐ | |
| Emails sent: 2 January 2016, 5 January 2016, 15 January 2016, 20 January 2016, to [email protected], [email protected], [email protected] Regarding missing data of control, and clarification regarding study design, and data regarding EASI, IGA Repy received: 20 January 2016 from Dr Nebus with responses to our questions and additional documents | Yes | ‐ | |
| Email sent: 7 January 2016, to [email protected] Regarding sequence generation and allocation concealment Reply received: 18 January 2016, from [email protected], with responses to our questions | Yes | ‐ | |
| Email sent: 26 March 2016, to [email protected] Regarding sequence generation, allocation concealment, method of blinding, dropouts, EASI, VAS scores at baseline and day 21 and additional study details Replies received: 26 March 2016, and 30 March 2016 with responses to our questions | Yes | ‐ | |
| Emails sent: 26 March 2016, 3 April 2016, 10 April 2016, 16 April 2016, to Dr Seo: [email protected] Regarding sequence generation, allocation concealment, method of blinding and precise data of IGA, VAS, TEWL and corneometry with SD at 4 weeks No reply received | Not applicable | ‐ | |
| Emails sent: 27 March 2016, 3 April 2016, 10 April 2016, to [email protected] Regarding sequence generation, allocation concealment, method of blinding and precise data of EASI at day 43, and data of appraisal patients Reply received: 12 April 2016, with responses regarding sequence generation, allocation concealment and blinding, but not the rest. 14 April 2016 we sent mails to the sponsor at [email protected] (no longer working) and [email protected] No further details retrieved | In part | ‐ | |
| Email sent 27 March 2016, 3 April 2016 jennifer.theunis@pierre‐fabre.com. Regarding sequence generation, allocation concealment, and precise data of TEWL at day 43, and to which group drop‐out was randomised Response 7 April 2016 we received responses to our questions | Yes | ‐ | |
| Email sent 28 March 2016, 3 April 2016, 10 April 2016, 16 April 2016 [email protected] Regarding allocation concealment, precise data at baseline,day 10 and 28 for TEWL, PGA, EASI, adverse events in Cis UCA group and in vehicle No reply received | Not applicable | ‐ | |
| Email sent: 29 March 2016, to [email protected]‐bonn.de Regarding sequence generation, allocation concealment, method of blinding as one group had two different tubes, precise data at baseline and week 16 for VAS, EASI, DLQI and CDLQI Reply received: 30 March 2016, saying that cannot help us, the study was too long ago, and Schering Dermatology does not exist anymore. Intendis (the pharmaceutical company) did not reply | No | ‐ | |
| Email sent: 2 April 2016, to [email protected], [email protected] Regarding sequence generation, allocation concealment, differences between publication and protocol and exact baseline values for data after 15, 30 and 60 minutes for TEWL, and corneometry Reply received: 12 April 2016, with responses to our questions | Yes | ‐ | |
| Email sent: 18 May 2014, to [email protected], SOTIRIOS‐[email protected] Regarding sequence generation and allocation concealment, mean reduction in EASI and corresponding standard deviations at day 28, and dropouts Reply received: 18 July 2014, with responses to our questions | Yes | ‐ | |
| Emails sent: 2 April 2016, 10 April 2016, 16 April 2016, 23 April 2016, to [email protected], [email protected], [email protected] Regarding exact baseline values (and SD) at day 28 for dryness scale, TEWL, and corneometry Reply received: 2 May 2016, with responses to our questions and additional information | Yes | ‐ | |
| Email sent: 3 April 2016, to [email protected] Regarding sequence generation, allocation concealment, method of blinding, precise data at baseline and day 28 for IGA and patient/family self‐assessments Reply received: 4 April 2016, with responses to our questions and additional information | Yes | ‐ | |
| Email sent: 14 May 2014, to [email protected], Adam Reich Regarding sequence generation and allocation concealment | Yes | Quasi randomised, exclude | |
| Emails sent: 3 April 2016, 10 April 2016, 16 April 2016, 23 April 2016, 30 April 2016, to [email protected]‐u.ac.jp Regarding sequence generation and allocation concealment, and SCORAD (mean and SD) at start maintenance phase and at day 28 No reply received | Not applicable | ‐ | |
| Emails sent: 3 April 2016, 10 April 2016, to [email protected] Regarding allocation concealment Reply received: 11 April 2016, with response to our question | Yes | ‐ | |
| Email sent: 8 April 2016, to [email protected] Regarding allocation concealment Reply received: 8 April 2016, with response to our question | Yes | ‐ | |
| Emails sent: 2 July 2014, 7 July 2014, 24 January 2016, 12 February 2016, 8 April 2016, 18 April 2016, to [email protected] ([email protected] is no longer in use) Regarding sequence generation, allocation concealment and standard deviations (or SEM) of the SCORAD at baseline, week 2, week 4 and week 6? Reply received: 18 April 2016, with some data but no information regarding sequence generation, or allocation concealment and there were no data for week 6 | In part | ‐ | |
| Email sent: 10 April 2016, to tweberQbdfusa.com Regarding sequence generation and allocation concealment | Yes | ‐ | |
| Email sent: 15 April 2016, to [email protected], karin.wiren@omega‐pharma.se Regarding sequence generation and allocation concealment | Yes | ‐ | |
| Emails sent: 5 January 2016, 15 January 2016, 31 January 2016, 12 February 2016, 10 April 2016, to [email protected] Regarding sequence generation and allocation concealment No reply received | Not applicable | ‐ | |
| Emails sent: 10 April 2016, 16 April 2016, to [email protected] Regarding allocation concealment, method of blinding, SCORAD values at start maintenance phase and follow‐up, item EQ‐5D Reply received: 18 April 2016, with responses to our questions | Yes | ‐ | |
| Abbreviations CDLQI: Children’s Dermatology Life Quality Index | |||
| MOISTURISER VERSUS VEHICLE, PLACEBO OR NO TREATMENT | ||||
|---|---|---|---|---|
| Moisturisers versus no treatment (i.e. no moisturiser) | ||||
| Study | Intervention | Comparator | Within‐participant? | Active treatment allowed? |
| Exomega lotion (oat) twice daily 6 weeks | No treatment for 6 weeks | No | Moderate‐ and high‐potency corticosteroids allowed | |
| Exomega moisturising milk (oat) twice daily for 2 months | No treatment for 2 months | No | Moderate‐ and high‐potency corticosteroids allowed | |
| Eucerin Eczema Relief body cream (oat and licochalcone) once a day for 6 months + cleanser | Only cleanser for 6 months | No | Eucerin Eczema Relief Instant Therapy allowed for active lesions, | |
| Canoderm (urea 5%) twice daily 6 months | No treatment 6 months | No | Permitted only at areas other than target lesion | |
| Cethaphil Restoraderm Body moisturiser (ceramide precursors etc) twice daily 27 days | No treatment 27 days | Yes | No | |
| Emollient balm twice daily for 28 days | Hygiene product for 28 days | No | Not mentioned | |
| Atopiclairversus vehicle | ||||
| Study | Intervention | Comparator | Within‐participant? | Active treatment allowed? |
| Atopiclair three times daily for 50 days | Vehicle three times daily for 50 days | No | No | |
| Atopiclair three times daily for 21 days | Vehicle three times daily for 21 days | No | Oral medication continued | |
| Atopiclair three times daily for 43 days | Vehicle three times daily for 43 days | No | If really needed, low‐potency topical corticosteroids allowed | |
| Patrizi 20083‐arm (1st comparison) As Atopiclair 'light' is not marketed and clearly less effective, it is not included in the comparison Atopiclair versus vehicle. The comparison Atopiclair 'light' versus vehicle (2nd comparison) will therefore not be further discussed | Atopiclair three times daily for 43 days | Vehicle three times daily for 43 days | No | If really needed, low‐potency topical corticosteroid allowed |
| Other moisturisers versus vehicle or placebo | ||||
| Urea‐containing moisturisers | ||||
| Study | Intervention | Comparator | Within‐participant? | Active treatment allowed? |
| Laceran (10% urea) twice daily for 4 weeks | Vehicle twice daily for 4 weeks | Yes | No | |
| Canoderm (urea 5%) twice daily for 6 months | No treatment for 6 months | No | Only at other areas than target lesion | |
| Laceran (10% urea) twice daily for 4 weeks | Vehicle twice daily for 4 weeks | Yes | No | |
| Lodén 20023 arm (1st comparison) | Urea saline 4% cream once daily for 30 days | Placebo (cream base) cream once daily for 30 days | No | Topical steroids allowed |
| Glycerol‐containing moisturisers | ||||
| Lodén 20023 arm (2nd comparison) | Glycerol 20% once daily for 30 days | Placebo (cream base) once daily for 30 days | No | Topical steroids allowed |
| Dexeryl (glycerol 15%) twice daily for 4 weeks | Vehicle without glycerol twice daily for 4 weeks | No | If really needed, moderate‐potency topical corticosteroid allowed | |
| Glycerol 20% twice daily for 4 weeks | Vehicle without glycerol twice daily for 4 weeks | Yes | No | |
| Oat‐containing moisturisers | ||||
| Exomega lotion (oat) twice daily for 6 weeks | No treatment for 6 weeks | No | Moderate‐ and high‐potency corticosteroids allowed | |
| Exomega moisturising milk (oat) twice daily for 2 months | No treatment for 2 months | No | Moderate‐ and high‐potency corticosteroids allowed | |
| Oatmeal based occlusive cream twice daily for 8 weeks | Occlusive vehicle for 8 weeks | No | Topical medications allowed | |
| Eucerin Eczema Relief body cream (oat and licochalcone) once a day for 6 months + cleanser | Cleanser only for 6 months | No | Eucerin Eczema Relief Instant Therapy was allowed for active lesions | |
| Remaining moisturisers versus vehicle or placebo | ||||
| Ammonium lactate 6% in water‐in‐oil emulsion twice daily for 4 weeks | Vehicle twice daily for 4 weeks | Yes | No | |
| Pale sulfonated 4% shale oil cream three times daily for 4 weeks | Vehicle three times daily for 4 weeks | No | No | |
| Atoderm Intensive cream twice daily for 6 months | Moisturiser base twice daily for 6 months | No | Topical corticosteroid and immunomodulators could be continued | |
| Triclosan 1% moisturiser twice daily for 41 days | Vehicle cream twice daily for 41 days | No | Low‐potency corticosteroid allowed | |
| Thumm 20003 arm (1st comparison) | Hippophae rhamnoides 10% cream for 4 weeks | Placebo cream for 4 weeks | No | No |
| Thumm 20003 arm (2nd comparison) | Hippophae rhamnoides 20% cream for 4 weeks | Placebo cream for 4 weeks | No | No |
| Oils versus placebo | ||||
| Gehring 1999study 1 | Primrose oil amphilic o/w emulsion twice daily for 4 weeks | Placebo oil twice daily for 4 weeks | Yes | No |
| Gehring 1999study 2 | Primrose oil amphilic w/o emulsion twice daily for 4 weeks | Placebo oil twice daily for 4 weeks | Yes | No |
| Camellia oil spray for 2 weeks | Purified water spray for 2 weeks | No | All allowed without changing | |
| ONE MOISTURISER VERSUS ANOTHER MOISTURISER | ||||
| Study | Intervention | Comparator | Within‐participant? | Active treatment allowed? |
| Patrizi 20083 arm (3rd comparison) | Atopiclair three times daily for 43 days | Atopiclair 'light' three times daily for 43 days | No | If really needed, low‐potency topical corticosteroid allowed |
| Miller 20113 arm (1st comparison) | Atopiclair three times daily for 3 weeks | EpiCeram three times daily for 3 weeks | No | No |
| Miller 20113 arm (2nd comparison) | Atopiclair three times daily for 3 weeks | Aquaphor (petrolatum 41%, glycerol, lanolin etc.), three times daily for 3 weeks | No | No |
| Miller 20113 arm (3rd comparison) | EpiCeram (high ceramides) three times daily for 3 weeks | Aquaphor three times daily for 3 weeks | No | No |
| EpiCeram twice daily for 4 weeks | Hyalotopic (hyaluronic acid, glycerol, propylene glycol etc) twice daily for 4 weeks | Yes | No | |
| EpiCeram twice daily for 3 weeks | Oatmeal‐containing cream twice daily for 3 weeks | No | No | |
| EpiCeram for 4 weeks | Eucerin for 4 weeks | Yes | No | |
| MimyX + Eucerin twice daily for 12 weeks | Eucerin cream twice daily for 12 weeks | Yes | If really needed, low‐potency topical corticosteroid allowed | |
| Albolene twice daily for 4 weeks | MimyX twice daily for 4 weeks | Yes | Low‐potency topical corticosteroid allowed | |
| Fredriksson 1975(2 studies) | Aquacare twice daily for 4 weeks | Calmurid twice daily for 4 weeks | Yes | No |
| Locobase repair twice daily for a year | Atoderma twice daily for a year | No | Moderate‐potency topical corticosteroid allowed | |
| Canoderm (urea 5%) twice daily for 6 months | Miniderm (no urea) twice daily for 6 months | No | No | |
| Urea 5% moisturiser twice daily for 6 weeks | Urea 10% lotion for 6 weeks | No | Topical steroids allowed | |
| Urea 4% + NaCl in o/w twice daily for 2 weeks | Urea 4% in o/w twice daily for 2 weeks | Yes | No | |
| Lodén 20023 arm (3rd comparison) | Glycerol 20% once daily for 30 days | Urea saline 4% cream once daily for 30 days | No | Topical corticosteroids allowed |
| Propyless (20% propylene glycol) twice daily for 2 weeks | Fenuril (urea 4% and NaCl 4%) twice daily for 2 weeks | Yes | No | |
| Ceramide‐containing moisturiser twice daily for 6 weeks | Control moisturiser (?) twice daily for 6 weeks | No | Topical corticosteroids allowed | |
| Furfuryl palmitate‐enriched moisturiser twice daily for 2 weeks | Moisturiser twice daily for 2 weeks | No | No | |
| Pro‐AMP cream (rhamnosoft ceramides) twice daily for 4 weeks | Hydrating cream (glycerol, vaseline, paraffin twice daily for 4 weeks | No | No | |
| Thumm 20003 arm (3rd comparison) | Hippophae rhamnoides 10% cream for 4 weeks | Hipophae rhamnoides 20% cream for 4 weeks | No | No |
| Lactobacillus sakei‐containing moisturiser twice daily for 4 weeks | Control moisturiser for 4 weeks | Yes | Topical corticosteroids allowed | |
| Virgin coconut oil twice daily for 8 weeks | Mineral oil twice daily for 8 weeks | No | No | |
| Virgin coconut oil twice daily for 4 weeks | Virgin olive oil twice daily for 4 weeks | No | No | |
| Bleach bath with moisturiser on one occasion | Water bath with moisturiser on one occasion | No | No | |
| MOISTURISERS VERSUS ACTIVE TREATMENT | ||||
| Moisturisers versus topical corticosteroids | ||||
| Study | Intervention | Comparator | Within‐participant? | Active treatment allowed? |
| Within‐participant studies comparing licochalcone containing moisturiser versus hydrocortisone | ||||
| O/W formulation containing licochalcone A (Glycyrrhiza Inflata root extract) twice daily for 1 week | Hydrocortisone cream twice daily for 1 week | Yes | No | |
| Licochalcone twice daily for 6 weeks | Hydrocortisone cream twice daily for 6 weeks | Yes | No | |
| Licochalcone twice daily for 4 weeks | Hydrocortisone cream twice daily for 4 weeks | Yes | No | |
| Parallel studies comparing moisturisers versus topical corticosteroids | ||||
| Stelatopia (2% sunflower oil distillate, fatty acids, ceramides) twice daily for 3 weeks | Hydrocortisone butyric propionate twice daily for 3 weeks | No | No | |
| EpiCeram twice daily for 4 weeks | Fluticasone 0.5% cream twice a day for 4 weeks | No | No (Cetaphil lotion applied to uninvolved lesions) | |
| 20% petrolatum in cetomacrogol + wet wrap for 4 weeks | Mometasone furoate 0.1% + wet wrap for 4 weeks | No | No | |
| w/o emulsion Excipial twice a day for 1 week | Hydrocortisone 1% in w/o emulsion (Excipial) twice daily for 1 week | No | No | |
| Moisturiser containing spent grain wax, spinose kernel oil, etc. twice a day for 4 weeks | Hydrocortisone 1% cream twice a day for 4 weeks | Yes | No | |
| Moisturiser (Advabase) twice a day for 16 weeks | Methylprednisolone aceponate cream 2 days a week, on other days used moisturiser twice a day for 16 weeks | No | No | |
| Moisturiser versus topical immunomodulators | ||||
| Eletone (high lipid) three times daily for 4 weeks | Pimecrolimus three times daily for 4 weeks | Yes | No | |
| Moisturiser therapy (?) for 4 weeks | Tacrolimus for 4 weeks | No | No | |
| Hyalotopic (ceramide) three times daily for 4 weeks | Pimecrolimus twice a day for 4 weeks | Yes | No | |
| VEHICLE + MOISTURISER VERSUS TOPICAL CORTICOSTEROID + MOISTURISER | ||||
| Berth‐Jones 20034 arm (1st comparison) | Vehicle cream twice weekly + moisturiser for 16 weeks | Fluticasone propionate 0.05% cream twice weekly + moisturiser for 16 weeks | No | No |
| Berth‐Jones 20034 arm (2nd comparison) We did not consider other possible comparisons of the 4 arms important for this review | Vehicle ointment twice weekly + moisturiser for 16 weeks | Fluticasone propionate 0.005% ointment twice weekly + moisturiser for 16 weeks | No | No |
| Vehicle twice a week + moisturiser for 20 weeks | Fluticasone propionate 0.05% cream twice weekly + moisturiser for 20 weeks | No | No | |
| Placebo ointment twice weekly + moisturiser for 16 weeks | Fluticasone propionate 0.005% ointment twice weekly + moisturiser for 16 weeks | No | No | |
| TOPICAL ACTIVE TREATMENT + MOISTURISER VERSUS TOPICAL ACTIVE TREATMENT ALONE | ||||
| Study | Intervention | Comparator | Within‐participant? | Active treatment allowed? |
| Draelos 20083 arm (1st comparison) | Fluocinonide 0.05% twice a day + ceramide cleanser+ moisturising cream for 4 weeks | Fluocinonide 0.05% twice a day plus cleansing bar for 4 weeks | No | No |
| Draelos 20083 arm (2nd comparison) 3rd possible comparison did not include moisturiser i.e. fluocinonide + cleansing bar vs fluocinonide + ceramide cleanser | Fluocinonide 0.05% twice a day + ceramide cleanser+ moisturising cream for 4 weeks | Fluocinonide 0.05% twice a day plus ceramide cleanser for 4 weeks | No | No |
| Moisturising and softening cream + flumethasone ointment twice a day for 3 weeks | Flumethasone ointment twice a day for 3 weeks | No | No | |
| Simpson 2011 study D | Restoraderm moisturiser twice a day + topical corticosteroids for 4 weeks | Routine use of topical corticosteroids for 4 weeks | Yes | No |
| Desonide 0.05% twice a day + three times daily moisturiser for 3 weeks | Desonide 0.05% cream twice a day for 3 weeks | Yes | No | |
| Msika 20085 arm (1st comparison) | Desonide 0.05% twice a day plus moisturiser + sunflower oil 2% twice a day for 21 days | Desonide 0.05% twice a day for 21 days | No | No |
| Msika 20085 arm (2nd comparison) We did not consider other possible comparisons of the 5 arms to be important for this review | Desonide 0.05% once daily plus moisturiser + sunflower oil 2% twice a day for 21 days | Desonide 0.05% once daily for 21 days | No | No |
| BoPao cream + 10% urea ointment once a day or twice a day for 2 weeks | BoPao cream only (antifungal/anti‐inflammatory cream) | No | No | |
| o/w: oil in water w/o: water in oil | ||||
| Study ID | Interventions & comparisons | N | Comments |
|---|---|---|---|
| 5% urea as active substance versus 4% urea and 4% NaCl | 50 | The data were reported in box‐and‐whisker plots, and no precise data were provided, too much estimation | |
| Emollient + fresh expressed milk versus moisturiser only | 9 | None of our outcomes were assessed | |
| Aqueous cream BP versus Oilatum Junior Bath additive | 38 | Poster with limited information. The principal investigator said, "The study itself was a purely mechanistic study, and not meant to provide clinical evidence" | |
| Nioleol (10% primrose oil, 8%‐9% γ‐linolenic acid) versus Uriage (borage oil and 24% γ‐linolenic acid) versus Atopic (35%‐40% γ‐linolenic acid) versus Atoderm control moisturiser once daily for 12 weeks | 23 | Unclear how many participants were randomised to each arm | |
| Proderm versus no treatment | 24 | No baseline data nor end value data were reported. The data were reported in box‐and‐whisker plots, and were not interpretable | |
| Oilatum Plus versus Oilatum Emollient | 30 | Unclear how many participants were randomised to each arm, inconsistencies in reporting of data | |
| Study 1 Emulsifying ointment with aqueous cream versus emulsifying ointment with baby oil Study 2 Cetomacrogol versus emulsifying ointment versus glycerol/petrolatum versus petroleum jelly | 120 | Frequency of use during day or week were not reported. There were quite some inconsistencies in text and figures. Study 2 reported no end data, just that all scores tended to decline. We mailed investigators numerous times to clarify study details, but received no response. | |
| Midpotency corticosteroid cream versus midpotency corticosteroid cream combined with a hydrolipid cream | 6 | Poster with limited information, principal investigator was not able to provide missing study details | |
| Glycerol 20% cream versus 4% urea and 4% NaCl | 110 | Unclear how many participants were randomised to each arm. The data all need to be estimated from box‐and‐whisker plots, too much estimation | |
| PPARα activator and ceramide versus moisturiser without these ingredients | 31 | Only 5 participants with eczema included, no individual patient data, not our prespecified outcomes | |
| Cis‐urocanic acid 5% emulsion cream versus control vehicle | 14 | Data provided need to be estimated from figures (for transepidermal water loss (TEWL)), or no precise data were provided other than that there were no significant differences. We mailed investigators numerous times to clarify study details, but received no response | |
| Cream containing 10% urea versus control cream | 70 | Unclear how many were randomised to each treatment arm, no separate data for healthy subjects and atopic subjects | |
| Two different formulations of polidocanol‐ and urea‐containing creams against each other | 54 | Unclear how many were randomised to each treatment arm, no separate data for healthy subjects and atopic subjects | |
| Urea 10% ointment versus base OR versus urea 20% ointment | 552 | The data were confusingly reported in this study and did not lend themselves to further analysis. As the study was 39 years old we have not contacted the investigators for data |
| Analysis | Comparison | MD/RR/HR/SMD | 95% confidence interval | P value |
|---|---|---|---|---|
| Change from baseline in SCORAD | Moisturisers versus no treatment Pooled data | MD ‐2.51 | ‐3.66 to ‐1.37 | P < 0.0001 |
| Number of participants experiencing a flare | Moisturisers versus no treatment Pooled data | RR 0.39 | 0.22 to 0.68 | P = 0.0008 |
| Amount of topical steroids used | Moisturisers versus no treatment Pooled data for the first 3 to 4 weeks | MD ‐5.34 | ‐7.79 to ‐2.89 | P < 0.0001 |
| Moisturisers versus no treatment Single study data last 3 to 4 weeks | MD 0.50 | ‐4.70 to 5.70 | P = 0.85 | |
| Moisturisers versus no treatment Pooled data for 6 to 8 weeks | MD ‐8.11 | ‐11.00 to ‐5.22 | P < 0.00001 | |
| Change from baseline in quality of life | Moisturisers versus no treatment Pooled data | SMD ‐0.14 | ‐0.44 to 0.16 | P = 0.35 |
| Number of participants who experienced good improvement to total resolution | Atopiclair versus vehicle Pooled data | RR 4.16 | 2.96 to 5.86 | P < 0.00001 |
| Change from baseline itch measured on a VAS | Atopiclair versus vehicle Pooled data | MD ‐2.08 | ‐2.35 to ‐1.81 | P < 0.00001 |
| Number of participants reporting an adverse event | Atopiclair versus vehicle Pooled data | RR 1.04 | 0.80 to 1.35 | P = 0.78 |
| Change from baseline in EASI | Atopiclair versus vehicle Pooled data | MD ‐4.05 | ‐5.00 to ‐3.10 | P < 0.00001 |
| Number of participants experiencing a flare | Atopiclair versus vehicle Pooled data | RR 0.18 | 0.11 to 0.31 | P < 0.00001 |
| Change from baseline in skin capacitance | Urea‐containing versus vehicle | MD 3.13 | 2.13 to 4.13 | P < 0.00001 |
| Numbers of participants reporting an adverse event | Glycerol versus placebo cream Pooled data | RR 0.89 | 0.67 to 1.18 | P = 0.46 |
| Change in disease severity as assessed by the investigators | Oat‐containing cream versus vehicle or no treatment Pooled data | SMD ‐0.19 | ‐0.43 to 0.05 | P = 0.12 |
| Change from baseline in quality of life | Oat‐containing cream versus vehicle or no treatment Pooled data | SMD ‐0.09 | ‐0.35 to 0.17 | P = 0.51 |
| Number of participants that experienced improvement | All moisturisers versus vehicle, placebo or no treatment Pooled data | RR 2.20 | 1.84 to 2.62 | P < 0.00001 |
| Change from baseline in itch | All moisturisers versus vehicle, placebo or no treatment Pooled data | SMD ‐0.88 | ‐1.04 to ‐0.72 | P < 0.00001 |
| Number of participants that expressed treatment satisfaction | All moisturisers versus vehicle, placebo or no treatment Pooled data | RR 1.69 | 1.35 to 2.11 | P < 0.00001 |
| Number of participants reporting an adverse event | All moisturisers versus vehicle, placebo or no treatment Pooled data | RR 1.06 | 0.88 to 1.27 | P = 0.56 |
| Change in disease severity as assessed by the investigators | All moisturisers versus vehicle, placebo or no treatment Pooled data | SMD ‐0.62 | ‐0.73 to ‐0.51 | P < 0.00001 |
| Number of participants experiencing a flare | All moisturisers versus vehicle, placebo or no treatment Pooled data | RR 0.35 | 0.26 to 0.47 | P < 0.00001 |
| Change from baseline in quality of life | All moisturisers versus vehicle, placebo or no treatment Pooled data | SMD ‐0.40 | ‐0.64 to ‐0.17 | P = 0.0006 |
| Change from baseline in TEWL | Primrose oil versus placebo oil Pooled data | MD ‐0.34 | ‐1.44 to 0.76 | P = 0.55 |
| Change from baseline in skin hydration | Primrose oil versus placebo oil Pooled data | MD 0.34 | ‐2.54 to 3.21 | P = 0.82 |
| Change from baseline in itch (VAS) | Licochalcone versus hydrocortisone Pooled data | MD ‐0.37 | ‐0.75 to ‐0.00 | P = 0.05 |
| Change from baseline in SCORAD | Licochalcone versus hydrocortisone Pooled data | MD ‐0.12 | ‐0.77 to 0.54 | P = 0.73 |
| Change from baseline in TEWL | Licochalcone versus hydrocortisone Pooled data | MD ‐2.04 | ‐3.60 to ‐0.49 | P = 0.010 |
| Number of participants reporting an adverse event | Vehicle plus moisturiser versus fluticasone propionate plus moisturiser Pooled data | RR 0.60 | 0.42 to 0.85 | P = 0.004 |
| Number of participants experiencing a flare | Vehicle plus moisturiser versus fluticasone propionate plus moisturiser Pooled data | RR 2.27 | 1.91 to 2.71 | P < 0.00001 |
| Hazard ratio for rate of flare | Vehicle plus moisturiser versus fluticasone propionate plus moisturiser Pooled data | HR 3.67 | 2.78 to 4.84 | P < 0.00001 |
| Change in disease severity as assessed by the investigators | Active treatment in combination with a moisturiser versus active treatment only Pooled data | SMD ‐0.87 | ‐1.17 to ‐0.57 | P = 0.00001 |
| Change in quality of life IDQOL | Active treatment in combination with a moisturiser versus active treatment only Pooled data | MD ‐1.31 | ‐2.70 to 0.09 | P = 0.07 |
| Change of quality of life DFI | Active treatment in combination with a moisturiser versus active treatment only Pooled data | MD ‐1.03 | ‐2.47 to 0.42 | P = 0.17 |
| Abbreviations DFI: dermatitis family impact | ||||
| MOISURISER VERSUS NO MOISTURISER | ||||||
|---|---|---|---|---|---|---|
| Change from baseline in SCORAD | ||||||
| Variable | Number of studies | Number of participants in moisturiser group | Number of participants in control group | MD (95% CI) | Heterogeneity I² | P value |
| All trials (Giordano‐Labadie 2006; Grimalt 2007; Patrizi 2014) | 3 | 141 | 135 | ‐2.42 (‐4.55 to ‐0.28) | 68% | P = 0.03 |
| Sequence generation | ||||||
| Low risk (all trials) | 3 | 141 | 135 | ‐2.42 (‐4.55 to ‐0.28) | 68% | P = 0.03 |
| Allocation concealment | ||||||
| Low risk (all trials) | 3 | 141 | 135 | ‐2.42 (‐4.55 to ‐0.28) | 68% | P = 0.03 |
| Blinding of participants and personnel | ||||||
| High risk (all trials) | 3 | 141 | 135 | ‐2.42 (‐4.55 to ‐0.28) | 68% | P = 0.03 |
| Blinding of outcome assessment | ||||||
| High risk (all trials) | 3 | 141 | 135 | ‐2.42 (‐4.55 to ‐0.28) | 68% | P = 0.03 |
| Incomplete outcome data | ||||||
| Low risk (Giordano‐Labadie 2006; Patrizi 2014) | 2 | 63 | 65 | ‐3.39 (‐4.73 to ‐2.05) | 0% | P < 0.00001 |
| High risk (Grimalt 2007) | 1 | 78 | 70 | ‐0.16 (‐2.36 to 2.04) | NA | P = 0.89 |
| Selective reporting | ||||||
| Low risk (all trials) | 3 | 141 | 135 | ‐2.42 (‐4.55 to ‐0.28) | 68% | P = 0.03 |
| Other bias | ||||||
| Low risk (all trials) | 3 | 141 | 135 | ‐2.42 (‐4.55 to ‐0.28) | 68% | P = 0.03 |
| ATOPICLAIR VERSUS VEHICLE | ||||||
| Number of participants who considered their skin to have improved | ||||||
| Variable | Number of studies | Number of participants in Atopiclair group | Number of participants in vehicle group | RR (95% CI) | Heterogeneity I² | P value |
| All trials (Abramovits 2008; Belloni 2005; Boguniewicz 2008) | 3 | 232 | 158 | 4.51 (2.19 to 9.29) | 64% | P < 0.0001 |
| Sequence generation | ||||||
| Low risk (all trials) | 3 | 232 | 158 | 4.51 (2.19 to 9.29) | 64% | P < 0.0001 |
| Allocation concealment | ||||||
| Low risk (Abramovits 2008; Belloni 2005) | 2 | 160 | 88 | 3.09 (2.08 to 4.59) | 0% | P < 0.00001 |
| Unclear risk (Boguniewicz 2008) | 1 | 72 | 70 | 8.06 (3.95 to 16.42) | NA | P < 0.00001 |
| Blinding of participants and personnel | ||||||
| Low risk (Abramovits 2008; Belloni 2005) | 2 | 160 | 88 | 3.09 (2.08 to 4.59) | 0% | P < 0.00001 |
| Unclear risk (Boguniewicz 2008) | 1 | 72 | 70 | 8.06 (3.95 to 16.42) | NA | P < 0.00001 |
| Blinding of outcome assessment | ||||||
| Low risk (Abramovits 2008; Belloni 2005) | 2 | 160 | 88 | 3.09 (2.08 to 4.59) | 0% | P < 0.00001 |
| Unclear risk (Boguniewicz 2008) | 1 | 72 | 70 | 8.06 (3.95 to 16.42) | NA | P < 0.00001 |
| Incomplete outcome data | ||||||
| Low risk (Belloni 2005; Boguniewicz 2008) | 2 | 87 | 85 | 6.95 (3.69 to 13.07) | 0% | P < 0.00001 |
| High risk (Abramovits 2008) | 1 | 145 | 73 | 3.02 (2.00 to 4.56) | NA | P < 0.00001 |
| Selective reporting | ||||||
| Low risk (all trials) | 3 | 232 | 158 | 4.51 (2.19 to 9.29) | 64% | P < 0.0001 |
| Other bias | ||||||
| Low risk (all trials) | 3 | 232 | 158 | 4.51 (2.19 to 9.29) | 64% | P < 0.0001 |
| Change from baseline in itch measured on a VAS | ||||||
| Variable | Number of studies | Number of participants in Atopiclair group | Number of participants in vehicle group | MD (95% CI) | Heterogeneity I² | P value |
| All trials (Abramovits 2008; Belloni 2005; Boguniewicz 2008; Patrizi 2008) | 4 | 235 | 161 | ‐2.65 (‐4.21 to ‐1.09) | 97% | P = 0.0008 |
| Sequence generation | ||||||
| Low risk (all trials) | 4 | 235 | 161 | ‐2.65 (‐4.21 to ‐1.09) | 97% | P = 0.0008 |
| Allocation concealment | ||||||
| Low risk (Abramovits 2008; Belloni 2005; Patrizi 2008) | 3 | 163 | 91 | ‐2.25 (‐3.83 to ‐0.68) | 95% | P = 0.005 |
| Unclear risk (Boguniewicz 2008) | 1 | 72 | 70 | ‐3.80 (‐4.36 to ‐3.24) | NA | P < 0.00001 |
| Blinding of participants and personnel | ||||||
| Low risk (Abramovits 2008; Belloni 2005; Patrizi 2008) | 3 | 163 | 91 | ‐2.25 (‐3.83 to ‐0.68) | 95% | P = 0.005 |
| Unclear risk (Boguniewicz 2008) | 1 | 72 | 70 | ‐3.80 (‐4.36 to ‐3.24) | NA | P < 0.00001 |
| Blinding of outcome assessment | ||||||
| Low risk (Abramovits 2008; Belloni 2005; Patrizi 2008) | 3 | 163 | 91 | ‐2.25 (‐3.83 to ‐0.68) | 95% | P = 0.005 |
| Unclear risk (Boguniewicz 2008) | 1 | 72 | 70 | ‐3.80 (‐4.36 to ‐3.24) | NA | P < 0.00001 |
| Incomplete outcome data | ||||||
| Low risk (Belloni 2005; Boguniewicz 2008; Patrizi 2008) | 3 | 106 | 104 | ‐2.33 (‐4.13 to ‐0.52) | 97% | P = 0.01 |
| High risk ((Abramovits 2008) | 1 | 129 | 57 | ‐3.70 (‐4.66 to ‐2.74) | NA | P < 0.00001 |
| Selective reporting | ||||||
| Low risk (all trials) | 4 | 235 | 161 | ‐2.65 (‐4.21 to ‐1.09) | 97% | P = 0.0008 |
| Other bias | ||||||
| Low risk (all trials) | 4 | 235 | 161 | ‐2.65 (‐4.21 to ‐1.09) | 97% | P = 0.0008 |
| Change from baseline in EASI | ||||||
| Variable | Number of studies | Number of participants in Atopiclair group | Number of participants in vehicle group | MD (95% CI) | Heterogeneity I² | P value |
| All trials (Abramovits 2008; Belloni 2005; Boguniewicz 2008; Patrizi 2008) | 4 | 251 | 175 | ‐4.00 (‐5.42 to ‐2.57) | 51% | P < 0.00001 |
| Sequence generation | ||||||
| Low risk (all trials) | 4 | 251 | 175 | ‐4.00 (‐5.42 to ‐2.57) | 51% | P < 0.00001 |
| Allocation concealment | ||||||
| Low risk Abramovits 2008; Belloni 2005; Patrizi 2008) | 3 | 179 | 105 | ‐3.36 (‐4.47 to ‐2.25) | 0% | P < 0.00001 |
| Unclear risk (Boguniewicz 2008) | 1 | 72 | 70 | ‐5.99 (‐7.85 to ‐4.13) | NA | P < 0.00001 |
| Blinding of participants and personnel | ||||||
| Low risk Abramovits 2008; Belloni 2005; Patrizi 2008) | 3 | 179 | 105 | ‐3.36 (‐4.47 to ‐2.25) | 0% | P < 0.00001 |
| Unclear risk (Boguniewicz 2008) | 1 | 72 | 70 | ‐5.99 (‐7.85 to ‐4.13) | NA | P < 0.00001 |
| Blinding of outcome assessment | ||||||
| Low risk Abramovits 2008; Belloni 2005; Patrizi 2008) | 3 | 179 | 105 | ‐3.36 (‐4.47 to ‐2.25) | 0% | P < 0.00001 |
| Unclear risk (Boguniewicz 2008) | 1 | 72 | 70 | ‐5.99 (‐7.85 to ‐4.13) | NA | P < 0.00001 |
| Incomplete outcome data | ||||||
| Low risk (Belloni 2005) | 1 | 15 | 15 | ‐3.30 (‐5.67 to ‐0.93) | NA | P = 0.006 |
| Unclear risk (Boguniewicz 2008; Patrizi 2008) | 2 | 91 | 89 | ‐4.42 (‐7.73 to ‐1.10) | 77% | P = 0.009 |
| High risk (Abramovits 2008) | 1 | 145 | 71 | ‐3.62 (‐5.06 to ‐2.18) | NA | P < 0.0001 |
| Selective reporting | ||||||
| Low risk (all trials) | 4 | 251 | 175 | ‐4.00 (‐5.42 to ‐2.57) | 51% | P < 0.00001 |
| Other bias | ||||||
| Low risk (all trials) | 4 | 251 | 175 | ‐4.00 (‐5.42 to ‐2.57) | 51% | P < 0.00001 |
| OAT‐CONTAINING MOISTURISERS VERSUS VEHICLE OR NO TREATMENT (NO MOISTURISER) | ||||||
| Change from baseline in disease severity as assessed by the investigators (EASI and SCORAD) | ||||||
| Variable | Number of studies | Number of participants in oat‐containing moisturiser group | Number of participants in control group | SMD (95% CI) | Heterogeneity I² | P value |
| All trials (Giordano‐Labadie 2006; Grimalt 2007; Nebus 2009) | 3 | 138 | 134 | ‐0.23 (‐0.66 to 0.21) | 65% | P = 0.30 |
| Sequence generation | ||||||
| Low risk (all trials) | 3 | 138 | 134 | ‐0.23 (‐0.66 to 0.21) | 65% | P = 0.30 |
| Allocation concealment | ||||||
| Low risk (all trials) | 3 | 138 | 134 | ‐0.23 (‐0.66 to 0.21) | 65% | P = 0.30 |
| Blinding of participants and personnel | ||||||
| Low risk (Nebus 2009) | 1 | 25 | 25 | 0.01 (‐0.55 to 0.56) | NA | P = 0.98 |
| High risk (Giordano‐Labadie 2006; Grimalt 2007) | 2 | 113 | 109 | ‐0.33 (‐0.98 to 0.32) | 81% | P = 0.32 |
| Blinding of outcome assessment | ||||||
| Low risk (Nebus 2009) | 1 | 25 | 25 | 0.01 (‐0.55 to 0.56) | NA | P = 0.98 |
| High risk (Giordano‐Labadie 2006; Grimalt 2007) | 2 | 113 | 109 | ‐0.33 (‐0.98 to 0.32) | 81% | P = 0.32 |
| Incomplete outcome data | ||||||
| Low risk (Giordano‐Labadie 2006; Nebus 2009) | 2 | 60 | 64 | ‐0.36 (‐1.03 to 0.32) | 71% | P = 0.30 |
| High risk (Grimalt 2007) | 1 | 78 | 70 | ‐0.02 (‐0.35 to 0.30) | NA | P = 0.98 |
| Selective reporting | ||||||
| Low risk (all trials) | 3 | 138 | 134 | ‐0.23 (‐0.66 to 0.21) | 65% | P = 0.30 |
| Other bias | ||||||
| Low risk (all trials) | 3 | 138 | 134 | ‐0.23 (‐0.66 to 0.21) | 65% | P = 0.30 |
| Effect | ||||||
| No difference (Grimalt 2007; Nebus 2009) | 2 | 103 | 95 | ‐0.02 (‐0.29 to 0.26) | 0% | P = 0.91 |
| Difference in favour of oat‐containing moisturiser (Giordano‐Labadie 2006) | 1 | 35 | 39 | ‐0.69 (‐1.16 to ‐0.22) | NA | P = 0.004 |
| Change from baseline in quality of life | ||||||
| Variable | Number of studies | Number of participants in oat‐containing moisturiser group | Number of participants in control group | SMD (95% CI) | Heterogeneity I² | P value |
| All trials (Giordano‐Labadie 2006; Grimalt 2007; Nebus 2009) | 3 | 110 | 116 | ‐0.09 (‐0.37 to 0.19) | 12% | P = 0.53 |
| Sequence generation | ||||||
| Low risk (all trials) | 3 | 110 | 116 | ‐0.09 (‐0.37 to 0.19) | 12% | P = 0.53 |
| Allocation concealment | ||||||
| Low risk (all trials) | 3 | 110 | 116 | ‐0.09 (‐0.37 to 0.19) | 12% | P = 0.53 |
| Blinding of participants and personnel | ||||||
| Low risk (Nebus 2009) | 1 | 25 | 25 | 0.10 (‐0.46 to 0.65) | NA | P = 0.74 |
| High risk (Giordano‐Labadie 2006; Grimalt 2007) | 2 | 85 | 91 | ‐0.16 (‐0.55 to 0.24) | 42% | P = 0.44 |
| Blinding of outcome assessment | ||||||
| Low risk (Nebus 2009) | 1 | 25 | 25 | 0.10 (‐0.46 to 0.65) | NA | P = 0.74 |
| High risk (Giordano‐Labadie 2006; Grimalt 2007) | 2 | 85 | 91 | ‐0.16 (‐0.55 to 0.24) | 42% | P = 0.44 |
| Incomplete outcome data | ||||||
| Low risk (Giordano‐Labadie 2006; Nebus 2009) | 2 | 60 | 64 | ‐0.17 (‐0.63 to 0.29) | 39% | P = 0.48 |
| High risk (Grimalt 2007) | 1 | 50 | 52 | 0.03 (‐0.36 to 0.41) | NA | P = 0.89 |
| Selective reporting | ||||||
| Low risk (all trials) | 3 | 110 | 116 | ‐0.09 (‐0.37 to 0.19) | 12% | P = 0.53 |
| Other bias | ||||||
| Low risk (all trials) | 3 | 110 | 116 | ‐0.09 (‐0.37 to 0.19) | 12% | P = 0.53 |
| ALL MOISTURISERS VERSUS VEHICLE TO PLACEBO OR NO MOISTURISER | ||||||
| Number of participants who considered their skin to have improved | ||||||
| Variable | Number of studies | Number of participants in moisturiser group | Number of participants in control group | RR (95% CI) | Heterogeneity I² | P value |
| All studies (Abramovits 2008; Belloni 2005; Boguniewicz 2008; Lodén 2002; Nebus 2009) | 5 | 323 | 249 | 2.46 (1.16 to 5.23) | 95% | P = 0.02 |
| Sequence generation | ||||||
| Low risk (Abramovits 2008; Belloni 2005; Boguniewicz 2008; Nebus 2009 | 4 | 257 | 183 | 3.10 (0.98 to 9.82) | 95% | P = 0.05 |
| Unclear risk (Lodén 2002) | 1 | 66 | 66 | 1.24 (1.03 to 1.49) | NA | P = 0.02 |
| Allocation concealment | ||||||
| Low risk (Abramovits 2008; Belloni 2005; Nebus 2009) | 3 | 185 | 113 | 2.19 (0.75 to 6.39) | 95% | P = 0.15 |
| Unclear risk (Boguniewicz 2008; Lodén 2002) | 2 | 138 | 136 | 3.11 (0.25 to 38.71) | 98% | P = 0.98 |
| Blinding of participants and personnel | ||||||
| Low risk (Abramovits 2008; Belloni 2005; Nebus 2009) | 3 | 185 | 113 | 2.19 (0.75 to 6.39) | 95% | P = 0.15 |
| Unclear risk (Boguniewicz 2008; Lodén 2002) | 2 | 138 | 136 | 3.11 (0.25 to 38.71) | 98% | P = 0.98 |
| Blinding of outcome assessment | ||||||
| Low risk (Abramovits 2008; Belloni 2005; Nebus 2009) | 3 | 185 | 113 | 2.19 (0.75 to 6.39) | 95% | P = 0.15 |
| Unclear risk (Boguniewicz 2008; Lodén 2002) | 2 | 138 | 136 | 3.11 (0.25 to 38.71) | 98% | P = 0.98 |
| Incomplete outcome data | ||||||
| Low risk (Belloni 2005; Lodén 2002; Nebus 2009) | 3 | 106 | 106 | 1.23 (0.94 to 1.62) | 48% | P = 0.13 |
| Unclear risk (Boguniewicz 2008) | 1 | 72 | 70 | 8.06 (3.95 to 16.42) | NA | P < 0.00001 |
| High risk (Abramovits 2008) | 1 | 145 | 73 | 3.02 (2.00 to 4.56) | NA | P < 0.00001 |
| Selective reporting | ||||||
| Low risk (all trials) | 5 | 323 | 249 | 2.46 (1.16 to 5.23) | 95% | P = 0.02 |
| Other bias | ||||||
| Low risk (all trials) | 5 | 323 | 249 | 2.46 (1.16 to 5.23) | 95% | P = 0.02 |
| Change from baseline in itch | ||||||
| Variable | Number of studies | Number of participants in moisturiser group | Number of participants in control group | SMD (95% CI) | Heterogeneity I² | P value |
| All studies (Abramovits 2008; Belloni 2005; Boguniewicz 2008; Boralevi 2014; Nebus 2009; Patrizi 2008; Patrizi 2014) | 7 | 412 | 337 | ‐1.10 (‐1.83 to ‐0.38) | 94% | P = 0.003 |
| Sequence generation | ||||||
| Low risk (all trials) | 7 | 412 | 337 | ‐1.10 (‐1.83 to ‐0.38) | 94% | P = 0.003 |
| Allocation concealment | ||||||
| Low risk (Abramovits 2008; Belloni 2005; Boralevi 2014; Nebus 2009; Patrizi 2008; Patrizi 2014) | 6 | 340 | 267 | ‐0.89 (‐1.56 to ‐0.23) | 91% | P = 0.009 |
| Unclear risk (Boguniewicz 2008) | 1 | 72 | 70 | ‐2.22 (‐2.64 to ‐1.80) | NA | P < 0.00001 |
| Blinding of participants and personnel | ||||||
| Low risk (Abramovits 2008; Belloni 2005; Boralevi 2014; Nebus 2009; Patrizi 2008) | 5 | 312 | 241 | ‐0.98 (‐1.79 to ‐0.18) | 93% | P < 0.00001 |
| Unclear risk (Boguniewicz 2008) | 1 | 72 | 70 | ‐2.22 (‐2.64 to ‐1.80) | NA | P < 0.00001 |
| High risk (Patrizi 2014) | 1 | 28 | 26 | ‐0.52 (‐1.06 to 0.03) | NA | P = 0.06 |
| Blinding of outcome assessment | ||||||
| Low risk (Abramovits 2008; Belloni 2005; Boralevi 2014; Nebus 2009; Patrizi 2008) | 5 | 312 | 241 | ‐0.98 (‐1.79 to ‐0.18) | 93% | P < 0.00001 |
| Unclear risk (Boguniewicz 2008) | 1 | 72 | 70 | ‐2.22 (‐2.64 to ‐1.80) | NA | P < 0.00001 |
| High risk (Patrizi 2014) | 1 | 28 | 26 | ‐0.52 (‐1.06 to 0.03) | NA | P = 0.06 |
| Incomplete outcome data | ||||||
| Low risk (Belloni 2005; Boralevi 2014; Nebus 2009; Patrizi 2014) | 4 | 192 | 191 | ‐0.38 (‐0.94 to 0.17) | 80% | P = 0.18 |
| Unclear risk (Boguniewicz 2008; Patrizi 2008) | 2 | 91 | 89 | ‐2.29 (‐2.67 to ‐1.91) | 0% | P < 0.00001 |
| High risk (Abramovits 2008) | 1 | 129 | 57 | ‐1.33 (‐1.67 to ‐0.99) | NA | P < 0.00001 |
| Selective reporting | ||||||
| Low risk (all trials) | 7 | 412 | 337 | ‐1.10 (‐1.83 to ‐0.38) | 94% | P = 0.003 |
| Other bias | ||||||
| Low risk (all trials) | 7 | 412 | 337 | ‐1.10 (‐1.83 to ‐0.38) | 94% | P = 0.003 |
| Number of participants who expressed treatment satisfaction | ||||||
| Variable | Number of studies | Number of participants in moisturiser group | Number of participants in control group | RR (95% CI) | Heterogeneity I² | P value |
| All trials (Abramovits 2008; Belloni 2005; Nebus 2009) | 3 | 185 | 113 | 1.35 (0.77 to 2.36) | 83% | P = 0.29 |
| Sequence generation | ||||||
| Low risk (all trials) | 3 | 185 | 113 | 1.35 (0.77 to 2.36) | 83% | P = 0.29 |
| Allocation concealment | ||||||
| Low risk (all trials) | 3 | 185 | 113 | 1.35 (0.77 to 2.36) | 83% | P = 0.29 |
| Blinding of participants and personnel | ||||||
| Low risk (all trials) | 3 | 185 | 113 | 1.35 (0.77 to 2.36) | 83% | P = 0.29 |
| Blinding of outcome assessment | ||||||
| Low risk (all trials) | 3 | 185 | 113 | 1.35 (0.77 to 2.36) | 83% | P = 0.29 |
| Incomplete outcome data | ||||||
| Low risk (Belloni 2005; Nebus 2009) | 2 | 40 | 40 | 1.04 (0.77 to 1.42) | 0% | P = 0.79 |
| High risk (Abramovits 2008) | 1 | 145 | 73 | 2.14 (1.58 to 2.89) | NA | P < 0.00001 |
| Selective reporting | ||||||
| Low risk (all trials) | 3 | 185 | 113 | 1.35 (0.77 to 2.36) | 83% | P = 0.29 |
| Other bias | ||||||
| Low risk (all trials) | 3 | 185 | 113 | 1.35 (0.77 to 2.36) | 83% | P = 0.29 |
| Number of participants who reported an adverse event | ||||||
| Variable | Number of studies | Number of participants in moisturiser group | Number of participants in control group | RR (95% CI) | Heterogeneity I² | P value |
| All trials (Abramovits 2008; Belloni 2005; Boguniewicz 2008; Boralevi 2014; Gayraud 2015; Grimalt 2007; Korting 2010; Lodén 2002; Patrizi 2008; Tan 2010) | 10 | 680 | 595 | 1.03 (0.82 to 1.30) | 21% | P = 0.80 |
| Sequence generation | ||||||
| Low risk (Abramovits 2008; Belloni 2005; Boguniewicz 2008; Boralevi 2014; Gayraud 2015; Grimalt 2007; Korting 2010; Patrizi 2008; Tan 2010) | 9 | 614 | 529 | 0.96 (0.74 to 1.24) | 16% | P = 0.76 |
| Unclear risk (Lodén 2002) | 1 | 66 | 66 | 1.31 (0.89 to 1.91) | NA | P = 0.17 |
| Allocation concealment | ||||||
| Low risk ((Abramovits 2008; Belloni 2005; Boralevi 2014; Gayraud 2015; Grimalt 2007; Korting 2010; Patrizi 2008; Tan 2010) | 7 | 491 | 411 | 1.00 (0.65 to 1.55) | 35% | P = 0.99 |
| Unclear risk (Boguniewicz 2008; Korting 2010; Lodén 2002) | 3 | 189 | 184 | 1.08 (0.82 to 1.43) | 15% | P = 0.59 |
| Blinding of participants and personnel | ||||||
| Low risk (Abramovits 2008; Belloni 2005; Boralevi 2014; Gayraud 2015; Patrizi 2008; Tan 2010) | 6 | 400 | 329 | 0.94 (0.72 to 1.24) | 0% | P = 0.67 |
| Unclear risk (Boguniewicz 2008; Lodén 2002) | 2 | 138 | 136 | 1.11 (0.83 to 1.48) | 26% | P = 0.49 |
| High risk (Grimalt 2007; Korting 2010) | 2 | 142 | 130 | 2.27 (0.06 to 90.70) | 80% | P = 0.66 |
| Blinding of outcome assessment | ||||||
| Low risk (Abramovits 2008; Belloni 2005; Boralevi 2014; Gayraud 2015; Patrizi 2008; Tan 2010) | 6 | 400 | 329 | 0.94 (0.72 to 1.24) | 0% | P = 0.67 |
| Unclear risk (Boguniewicz 2008; Lodén 2002) | 2 | 138 | 136 | 1.11 (0.83 to 1.48) | 26% | P = 0.49 |
| High risk (Grimalt 2007; Korting 2010) | 2 | 142 | 130 | 2.27 (0.06 to 90.70) | 80% | P = 0.66 |
| Incomplete outcome data | ||||||
| Low risk (Belloni 2005; Boralevi 2014; Gayraud 2015; Korting 2010; Lodén 2002; Tan 2010) | 6 | 352 | 350 | 0.99 (0.70 to 1.40) | 23% | P = 0.96 |
| Unclear risk (Boguniewicz 2008; Patrizi 2008) | 2 | 92 | 90 | 0.95 (0.69 to 1.30) | 0% | P = 0.73 |
| High risk (Abramovits 2008; Grimalt 2007) | 2 | 236 | 155 | 3.04 (0.24 to 38.72) | 71% | P = 0.39 |
| Selective reporting | ||||||
| Low risk (all trials) | 10 | 680 | 595 | 1.03 (0.82 to 1.30) | 21% | P = 0.80 |
| Other bias | ||||||
| Low risk (all trials) | 10 | 680 | 595 | 1.03 (0.82 to 1.30) | 21% | P = 0.80 |
| Change in disease severity as assessed by the investigators | ||||||
| Variable | Number of studies | Number of participants in moisturiser group | Number of participants in control group | SMD (95% CI) | Heterogeneity I² | P value |
| All studies (Abramovits 2008; Belloni 2005; Boguniewicz 2008; Boralevi 2014; Gayraud 2015; Giordano‐Labadie 2006; Grimalt 2007; Korting 2010; Nebus 2009; Patrizi 2008; Patrizi 2014; Tan 2010) | 12 | 683 | 598 | ‐0.65 (‐0.89 to ‐0.41) | 75% | P < 0.00001 |
| Sequence generation | ||||||
| Low risk (all trials) | 12 | 683 | 598 | ‐0.65 (‐0.89 to ‐0.41) | 75% | P < 0.00001 |
| Allocation concealment | ||||||
| Low risk (Abramovits 2008; Belloni 2005; Boralevi 2014; Gayraud 2015; Giordano‐Labadie 2006; Grimalt 2007; Nebus 2009; Patrizi 2008; Patrizi 2014; Tan 2010) | 10 | 561 | 481 | ‐0.53 (‐0.76 to ‐0.30) | 66% | P = 0.009 |
| Unclear risk (Boguniewicz 2008; Korting 2010) | 2 | 122 | 117 | ‐1.15 (‐1.43 to ‐0.88) | 0% | P < 0.00001 |
| Blinding of participants and personnel | ||||||
| Low risk (Abramovits 2008; Belloni 2005; Boralevi 2014; Gayraud 2015; Nebus 2009; Patrizi 2008; Tan 2010) | 7 | 420 | 346 | ‐0.53 (‐0.77 to ‐0.30) | 52% | P < 0.00001 |
| Unclear risk (Boguniewicz 2008) | 1 | 72 | 70 | ‐1.04 (‐1.39 to ‐0.69) | NA | P < 0.00001 |
| High risk ( Giordano‐Labadie 2006; Grimalt 2007; Korting 2010; Patrizi 2014) | 4 | 191 | 182 | ‐0.77 (‐1.41 to ‐0.12) | 88% | P = 0.02 |
| Blinding of outcome assessment | ||||||
| Low risk (Abramovits 2008; Belloni 2005; Boralevi 2014; Gayraud 2015; Nebus 2009; Patrizi 2008; Tan 2010) | 7 | 420 | 346 | ‐0.53 (‐0.77 to ‐0.30) | 52% | P < 0.00001 |
| Unclear risk (Boguniewicz 2008) | 1 | 72 | 70 | ‐1.04 (‐1.39 to ‐0.69) | NA | P < 0.00001 |
| High risk (Giordano‐Labadie 2006; Grimalt 2007; Korting 2010; Patrizi 2014) | 4 | 191 | 182 | ‐0.77 (‐1.41 to ‐0.12) | 88% | P = 0.02 |
| Incomplete outcome data | ||||||
| Low risk (Belloni 2005; Boralevi 2014; Gayraud 2015; Giordano‐Labadie 2006; Korting 2010; Nebus 2009; Patrizi 2014; Tan 2010 | 8 | 369 | 368 | ‐0.66 (‐0.96 to ‐0.36) | 71% | P < 0.0001 |
| Unclear risk (Boguniewicz 2008; Patrizi 2008) | 2 | 91 | 89 | ‐0.93 (‐1.29 to ‐0.57) | 17% | P < 0.00001 |
| High risk (Abramovits 2008; Grimalt 2007) | 2 | 223 | 141 | ‐0.41 (‐1.17 to 0.35) | 92% | P = 0.29 |
| Selective reporting | ||||||
| Low risk (all trials) | 12 | 683 | 598 | ‐0.65 (‐0.89 to ‐0.41) | 75% | P < 0.00001 |
| Other bias | ||||||
| Low risk (all trials) | 12 | 683 | 598 | ‐0.65 (‐0.89 to ‐0.41) | 75% | P < 0.00001 |
| Number of participants who experienced a flare | ||||||
| Variable | Number of studies | Number of participants in moisturiser group | Number of participants in control group | RR (95% CI) | Heterogeneity I² | P value |
| All studies (Abramovits 2008; Boguniewicz 2008; Gayraud 2015; Patrizi 2008; Weber 2015; Wirén 2009) | 6 | 341 | 266 | 0.33 (0.17 to 0.62) | 73% | P = 0.0006 |
| Sequence generation | ||||||
| Low risk (all trials) | 6 | 341 | 266 | 0.33 (0.17 to 0.62) | 73% | P = 0.0006 |
| Allocation concealment | ||||||
| Low risk (Abramovits 2008; Gayraud 2015; Patrizi 2008; Weber 2015; Wirén 2009) | 5 | 269 | 196 | 0.33 (0.15 to 0.71) | 78% | P = 0.005 |
| Unclear risk (Boguniewicz 2008) | 1 | 72 | 70 | 0.29 (0.12 to 0.68) | NA | P = 0.005 |
| Blinding of participants and personnel | ||||||
| Low risk (Abramovits 2008; Gayraud 2015; Patrizi 2008) | 3 | 227 | 151 | 0.27 (0.06 to 1.20) | 89% | P = 0.09 |
| Unclear risk (Boguniewicz 2008) | 1 | 72 | 70 | 0.29 (0.12 to 0.68) | NA | P = 0.005 |
| High risk (Weber 2015; Wirén 2009) | 2 | 42 | 45 | 0.40 (0.23 to 0.70) | 0% | P = 0.001 |
| Blinding of outcome assessment | ||||||
| Low risk (Abramovits 2008; Gayraud 2015; Patrizi 2008) | 3 | 227 | 151 | 0.27 (0.06 to 1.20) | 89% | P = 0.09 |
| Unclear risk (Boguniewicz 2008) | 1 | 72 | 70 | 0.29 (0.12 to 0.68) | NA | P = 0.005 |
| High risk (Weber 2015; Wirén 2009) | 2 | 42 | 45 | 0.40 (0.23 to 0.70) | 0% | P = 0.001 |
| Incomplete outcome data | ||||||
| Low risk (Gayraud 2015; Weber 2015; Wirén 2009) | 3 | 104 | 106 | 0.54 (0.31 to 0.92) | 47% | P = 0.02 |
| Unclear risk (Boguniewicz 2008; Patrizi 2008) | 2 | 92 | 89 | 0.26 (0.12 to 0.57) | 0% | P = 0.0007 |
| High risk (Abramovits 2008) | 1 | 145 | 71 | 0.14 (0.07 to 0.28) | NA | P < 0.00001 |
| Selective reporting | ||||||
| Low risk (all trials) | 6 | 341 | 266 | 0.33 (0.17 to 0.62) | 73% | P = 0.0006 |
| Other bias | ||||||
| Low risk (all trials) | 6 | 341 | 266 | 0.33 (0.17 to 0.62) | 73% | P = 0.0006 |
| Change from baseline in quality of life | ||||||
| Variable | Number of studies | Number of participants in moisturiser group | Number of participants in control group | SMD (95% CI) | Heterogeneity I² | P value |
| All trials (Gayraud 2015; Giordano‐Labadie 2006; Grimalt 2007) | 3 | 146 | 154 | ‐0.39 (‐0.90 to 0.12) | 79% | P = 0.13 |
| Sequence generation | ||||||
| Low risk (all trials) | 3 | 146 | 154 | ‐0.39 (‐0.90 to 0.12) | 79% | P = 0.13 |
| Allocation concealment | ||||||
| Low risk (all trials) | 3 | 146 | 154 | ‐0.39 (‐0.90 to 0.12) | 79% | P = 0.13 |
| Blinding of participants and personnel | ||||||
| Low risk (Gayraud 2015) | 1 | 62 | 61 | ‐0.81 (‐1.18 to ‐0.44) | NA | P < 0.0001 |
| High risk (Giordano‐Labadie 2006; Grimalt 2007) | 2 | 84 | 93 | ‐0.15 (‐0.55 to 0.24) | 42% | P = 0.44 |
| Blinding of outcome assessment | ||||||
| Low risk (Gayraud 2015) | 1 | 62 | 61 | ‐0.81 (‐1.18 to ‐0.44) | NA | P < 0.0001 |
| High risk (Giordano‐Labadie 2006; Grimalt 2007) | 2 | 84 | 93 | ‐0.15 (‐0.55 to 0.24) | 42% | P = 0.44 |
| Incomplete outcome data | ||||||
| Low risk (Gayraud 2015; Giordano‐Labadie 2006) | 2 | 97 | 100 | ‐0.62 (‐1.04 to ‐0.19) | 52% | P = 0.004 |
| High risk (Grimalt 2007) | 1 | 49 | 54 | 0.03 (‐0.36 to 0.41) | NA | P = 0.89 |
| Selective reporting | ||||||
| Low risk (all trials) | 3 | 146 | 154 | ‐0.39 (‐0.90 to 0.12) | 79% | P = 0.13 |
| Other bias | ||||||
| Low risk (all trials) | 3 | 146 | 154 | ‐0.39 (‐0.90 to 0.12) | 79% | P = 0.13 |
| LICOCHALCONE‐CONTAINING MOISTURISERS VERSUS HYDROCORTISONE ACETATE 1% CREAM | ||||||
| Change from baseline in disease severity as assessed by the investigators (SCORAD) | ||||||
| Variable | Number of studies | Number of participants in licochalcone group | Number of participants in hydrocortisone group | MD (95% CI) | Heterogeneity I² | P value |
| All trials (Angelova‐Fischer 2014; Udompataikul 2011; Wanakul 2013) | 3 | 96 (within‐participant) | 96 (within‐participant) | 0.08 (‐1.96 to 2.13) | 85% | P = 0.94 |
| Sequence generation | ||||||
| Low risk (Angelova‐Fischer 2014; Wanakul 2013) | 2 | 70 (within‐participant) | 70 (within‐participant) | ‐0.90 (‐2.85 to 1.05) | 82% | P = 0.32 |
| Unclear risk (Udompataikul 2011) | 1 | 26 (within‐participant) | 26 (within‐participant) | 2.57 (0.59 to 4.55) | NA | P = 0.01 |
| Blinding of participants and personnel | ||||||
| Low risk (Wanakul 2013) | 1 | 52 (within‐participant) | 52 (within‐participant) | ‐2.00 (‐3.47 to ‐0.53) | NA | P = 0.008 |
| Unclear risk (Angelova‐Fischer 2014; Udompataikul 2011) | 2 | 44 (within‐participant) | 44 (within‐participant) | 1.12 (‐1.38 to 3.61) | 82% | P = 0.38 |
| Blinding of outcome assessment | ||||||
| Low risk (Wanakul 2013) | 1 | 52 (within‐participant) | 52 (within‐participant) | ‐2.00 (‐3.47 to ‐0.53) | NA | P = 0.008 |
| High risk (Angelova‐Fischer 2014; Udompataikul 2011) | 2 | 44 (within‐participant) | 44 (within‐participant) | 1.12 (‐1.38 to 3.61) | 82% | P = 0.38 |
| Incomplete outcome data | ||||||
| Low risk (Angelova‐Fischer 2014; Wanakul 2013) | 2 | 70 (within‐participant) | 70 (within‐participant) | ‐0.90 (‐2.85 to 1.05) | 82% | P = 0.32 |
| Unclear risk (Udompataikul 2011) | 1 | 26 (within‐participant) | 26 (within‐participant) | 2.57 (0.59 to 4.55) | NA | P = 0.01 |
| Selective reporting | ||||||
| All studies | 3 | 96 (within‐participant) | 96 (within‐participant) | 0.08 (‐1.96 to 2.13) | 85% | P = 0.94 |
| Other bias | ||||||
| All studies | 3 | 96 (within‐participant) | 96 (within‐participant) | 0.08 (‐1.96 to 2.13) | 85% | P = 0.94 |
| VEHICLE TREATMENT + MOISTURISER VERSUS FLUTICASONE TREATMENT TWICE WEEKLY + MOISTURISER | ||||||
| Number of participants reporting an adverse event | ||||||
| Variable | Number of studies | Number of participants in vehicle + moisturiser group | Number of participants in fluticasone propionate + moisturiser group | RR (95% CI) | Heterogeneity I² | P value |
| All studies (Berth‐Jones 2003 (2 studies); Glazenburg 2009; Hanifin 2002) | 4 | 312 | 406 | 0.51 (0.22 to 1.14) | 67% | P = 0.10 |
| Sequence generation | ||||||
| Low risk (Berth‐Jones 2003 (2 studies); Glazenburg 2009) | 3 | 193 | 177 | 0.30 (0.12 to 0.73) | NA | P = 0.008 |
| Unclear risk (Hanifin 2002) | 1 | 119 | 229 | 0.70 (0.48 to 1.04) | NA | P = 0.08 |
| Allocation concealment | ||||||
| Low risk (Berth‐Jones 2003 (2 studies)) | 2 | 157 | 138 | Not estimable | NA | NA |
| Unclear risk (Glazenburg 2009; Hanifin 2002) | 2 | 155 | 268 | 0.51 (0.22 to 1.14) | 67% | P = 0.10 |
| Blinding of participants and personnel | ||||||
| Low risk (Berth‐Jones 2003 (2 studies)) | 2 | 157 | 138 | Not estimable | NA | NA |
| Unclear risk (Glazenburg 2009; Hanifin 2002) | 2 | 155 | 268 | 0.51 (0.22 to 1.14) | 67% | P = 0.10 |
| Blinding of outcome assessment | ||||||
| Low risk (Berth‐Jones 2003 (2 studies)) | 2 | 157 | 138 | Not estimable | NA | NA |
| Unclear risk (Glazenburg 2009; Hanifin 2002) | 2 | 155 | 268 | 0.51 (0.22 to 1.14) | 67% | P = 0.10 |
| Incomplete outcome data | ||||||
| Unclear risk (all studies) | 4 | 312 | 406 | 0.51 (0.22 to 1.14) | 67% | P = 0.10 |
| Selective reporting | ||||||
| Low risk (all studies) | 4 | 312 | 406 | 0.51 (0.22 to 1.14) | 67% | P = 0.10 |
| Other bias | ||||||
| Low risk (all studies) | 4 | 312 | 406 | 0.51 (0.22 to 1.14) | 67% | P = 0.10 |
| Number of participants experiencing a flare | ||||||
| Variable | Number of studies | Number of participants in vehicle + moisturiser group | Number of participants in fluticasone propionate + moisturiser group | RR (95% CI) | Heterogeneity I² | P value |
| All studies (Berth‐Jones 2003 (2 studies); Glazenburg 2009; Hanifin 2002) | 4 | 312 | 406 | 2.17 (1.51 to 3.11) | 74% | P < 0.0001 |
| Sequence generation | ||||||
| Low risk (Berth‐Jones 2003 (2 studies); Glazenburg 2009) | 3 | 193 | 177 | 2.02 (1.24 to 3.30) | 76% | P = 0.005 |
| Unclear risk (Hanifin 2002) | 1 | 119 | 229 | 2.62 (2.03 to 3.39) | NA | P < 0.00001 |
| Allocation concealment | ||||||
| Low risk (Berth‐Jones 2003 (2 studies)) | 2 | 157 | 138 | 2.17 (0.88 to 5.37) | 88% | P = 0.09 |
| Unclear risk (Glazenburg 2009; Hanifin 2002) | 2 | 155 | 268 | 2.27 (1.62 to 3.19) | 54% | P < 0.00001 |
| Blinding of participants and personnel | ||||||
| Low risk (Berth‐Jones 2003 (2 studies)) | 2 | 157 | 138 | 2.17 (0.88 to 5.37) | 88% | P = 0.09 |
| Unclear risk (Glazenburg 2009; Hanifin 2002) | 2 | 155 | 268 | 2.27 (1.62 to 3.19) | 54% | P < 0.00001 |
| Blinding of outcome assessment | ||||||
| Low risk (Berth‐Jones 2003 (2 studies)) | 2 | 157 | 138 | 2.17 (0.88 to 5.37) | 88% | P = 0.09 |
| Unclear risk (Glazenburg 2009; Hanifin 2002) | 2 | 155 | 268 | 2.27 (1.62 to 3.19) | 54% | P < 0.00001 |
| Incomplete outcome data | ||||||
| Unclear risk (all studies) | 4 | 312 | 406 | 2.17 (1.51 to 3.11) | 74% | P < 0.0001 |
| Selective reporting | ||||||
| Low risk (all studies) | 4 | 312 | 406 | 2.17 (1.51 to 3.11) | 74% | P < 0.0001 |
| Other bias | ||||||
| Low risk (all studies) | 4 | 312 | 406 | 2.17 (1.51 to 3.11) | 74% | P < 0.0001 |
| Hazard ratio for rate of flare | ||||||
| Variable | Number of studies | Number of participants in fluticasone propionate + moisturiser group | Number of participants in vehicle + moisturiser group | HR (95% CI) | Heterogeneity I² | P value |
| All studies (Berth‐Jones 2003 (2 studies); Glazenburg 2009; Hanifin 2002) | 4 | 406 | 312 | 3.69 (1.80 to 7.55) | 85% | P = 0.0004 |
| Sequence generation | ||||||
| Low risk (Berth‐Jones 2003 (2 studies); Glazenburg 2009) | 3 | 177 | 193 | 2.84 (1.44 to 5.61) | 76% | P = 0.003 |
| Unclear risk (Hanifin 2002) | 1 | 229 | 119 | 7.70 (4.62 to 12.84) | NA | P < 0.00001 |
| Allocation concealment | ||||||
| Low risk (Berth‐Jones 2003 (2 studies)) | 2 | 138 | 157 | 3.26 (1.09 to 9.74) | 87% | P = 0.03 |
| Unclear risk (Glazenburg 2009; Hanifin 2002) | 2 | 268 | 155 | 4.16 (1.21 to 14.31) | 89% | P = 0.02 |
| Blinding of participants and personnel | ||||||
| Low risk (Berth‐Jones 2003 (2 studies)) | 2 | 138 | 157 | 3.26 (1.09 to 9.74) | 87% | P = 0.03 |
| Unclear risk (Glazenburg 2009; Hanifin 2002) | 2 | 268 | 155 | 4.16 (1.21 to 14.31) | 89% | P = 0.02 |
| Blinding of outcome assessment | ||||||
| Low risk (Berth‐Jones 2003 (2 studies)) | 2 | 138 | 157 | 3.26 (1.09 to 9.74) | 87% | P = 0.03 |
| Unclear risk (Glazenburg 2009; Hanifin 2002) | 2 | 268 | 155 | 4.16 (1.21 to 14.31) | 89% | P = 0.02 |
| Incomplete outcome data | ||||||
| Unclear risk (all studies ) | 4 | 406 | 312 | 3.69 (1.80 to 7.55) | 85% | P = 0.0004 |
| Selective reporting | ||||||
| Low risk (all studies) | 4 | 406 | 312 | 3.69 (1.80 to 7.55) | 85% | P = 0.0004 |
| Other bias | ||||||
| Low risk (all studies) | 4 | 406 | 312 | 3.69 (1.80 to 7.55) | 85% | P = 0.0004 |
| NA not applicable; MD mean difference; SMD standardised mean difference; RR risk ratio; HR hazard ratio | ||||||
| Outcome or subgroup title | No. of studies | No. of participants | Statistical method | Effect size |
| 1.1 Change from baseline in SCORAD Show forest plot | 3 | 276 | Mean Difference (IV, Random, 95% CI) | ‐2.42 [‐4.55, ‐0.28] |
| 1.2 Number of participants experiencing a flare Show forest plot | 2 | 87 | Risk Ratio (M‐H, Random, 95% CI) | 0.40 [0.23, 0.70] |
| 1.3 Rate of flare Show forest plot | 2 | 87 | Hazard Ratio (IV, Random, 95% CI) | 3.74 [1.86, 7.50] |
| 1.4 Amount of topical steroids used Show forest plot | 2 | Mean Difference (IV, Random, 95% CI) | Subtotals only | |
| 1.4.1 Amount of topical corticosteroids first 3‐4 weeks | 2 | 222 | Mean Difference (IV, Random, 95% CI) | ‐8.25 [‐17.22, 0.72] |
| 1.4.2 Amount of topical corticosteroids used last 3‐4 weeks | 1 | 74 | Mean Difference (IV, Random, 95% CI) | 0.50 [‐4.70, 5.70] |
| 1.4.3 Total amount of topical corticosteroids used in 6 to 8 weeks | 2 | 222 | Mean Difference (IV, Random, 95% CI) | ‐9.30 [‐15.33, ‐3.27] |
| 1.5 Change from baseline in quality of life Show forest plot | 2 | 177 | Std. Mean Difference (IV, Random, 95% CI) | ‐0.15 [‐0.55, 0.24] |
| Outcome or subgroup title | No. of studies | No. of participants | Statistical method | Effect size |
| 2.1 Number of participants who experienced good improvement to total resolution Show forest plot | 3 | 390 | Risk Ratio (M‐H, Random, 95% CI) | 4.51 [2.19, 9.29] |
| 2.1.1 Number of participants who experienced good improvement to total resolution (low risk of bias) | 1 | 30 | Risk Ratio (M‐H, Random, 95% CI) | 4.00 [1.01, 15.81] |
| 2.1.2 Number of participants who experienced good improvement to total resolution (unclear risk of bias) | 1 | 142 | Risk Ratio (M‐H, Random, 95% CI) | 8.06 [3.95, 16.42] |
| 2.1.3 Number of participants who experienced good improvement to total resolution (high risk of bias) | 1 | 218 | Risk Ratio (M‐H, Random, 95% CI) | 3.02 [2.00, 4.56] |
| 2.2 Change from baseline in itch measured on a VAS Show forest plot | 4 | 396 | Mean Difference (IV, Random, 95% CI) | ‐2.65 [‐4.21, ‐1.09] |
| 2.2.1 Change from baseline in itch measured on a VAS (low risk of bias) | 1 | 30 | Mean Difference (IV, Random, 95% CI) | ‐0.80 [‐1.20, ‐0.40] |
| 2.2.2 Change from baseline in itch measured on a VAS (unclear risk of bias) | 2 | 180 | Mean Difference (IV, Random, 95% CI) | ‐3.10 [‐4.47, ‐1.73] |
| 2.2.3 Change from baseline in itch measured on a VAS (high risk of bias) | 1 | 186 | Mean Difference (IV, Random, 95% CI) | ‐3.70 [‐4.66, ‐2.74] |
| 2.3 Number of participants reporting an adverse event Show forest plot | 4 | 430 | Risk Ratio (M‐H, Random, 95% CI) | 1.03 [0.79, 1.33] |
| 2.4 Change from baseline in EASI Show forest plot | 4 | 426 | Mean Difference (IV, Random, 95% CI) | ‐4.00 [‐5.42, ‐2.57] |
| 2.4.1 Change from baseline in EASI (low risk of bias) | 1 | 30 | Mean Difference (IV, Random, 95% CI) | ‐3.30 [‐5.67, ‐0.93] |
| 2.4.2 Change from baseline in EASI (unclear risk of bias) | 2 | 180 | Mean Difference (IV, Random, 95% CI) | ‐4.42 [‐7.73, ‐1.10] |
| 2.4.3 Change from baseline in EASI (high risk of bias) | 1 | 216 | Mean Difference (IV, Random, 95% CI) | ‐3.62 [‐5.06, ‐2.18] |
| 2.5 Number of participants experiencing a flare Show forest plot | 3 | 397 | Risk Ratio (M‐H, Random, 95% CI) | 0.18 [0.11, 0.31] |
| 2.5.1 Number of participants experiencing a flare (unclear risk of bias) | 2 | 181 | Risk Ratio (M‐H, Random, 95% CI) | 0.26 [0.12, 0.57] |
| 2.5.2 Number of participants experiencing a flare (high risk of bias) | 1 | 216 | Risk Ratio (M‐H, Random, 95% CI) | 0.14 [0.07, 0.28] |
| Outcome or subgroup title | No. of studies | No. of participants | Statistical method | Effect size |
| 3.1 Change from baseline in skin capacitance Show forest plot | 2 | Mean Difference (IV, Random, 95% CI) | 1.23 [‐7.39, 9.86] | |
| Outcome or subgroup title | No. of studies | No. of participants | Statistical method | Effect size |
| 4.1 Number of participants reporting an adverse event Show forest plot | 2 | 385 | Risk Ratio (M‐H, Random, 95% CI) | 0.90 [0.68, 1.19] |
| Outcome or subgroup title | No. of studies | No. of participants | Statistical method | Effect size |
| 5.1 Change in disease severity as assessed by the investigators (SCORAD and EASI) Show forest plot | 3 | 272 | Std. Mean Difference (IV, Random, 95% CI) | ‐0.23 [‐0.66, 0.21] |
| 5.1.1 Change in disease severity as assessed by the investigator (EASI) (low risk of bias) | 1 | 50 | Std. Mean Difference (IV, Random, 95% CI) | 0.01 [‐0.55, 0.56] |
| 5.1.2 Change in disease severity as assessed by the investigators (SCORAD) (high risk of bias) | 2 | 222 | Std. Mean Difference (IV, Random, 95% CI) | ‐0.33 [‐0.98, 0.32] |
| 5.2 Change from baseline in quality of life Show forest plot | 3 | 226 | Std. Mean Difference (IV, Random, 95% CI) | ‐0.09 [‐0.37, 0.19] |
| 5.2.1 Change from baseline in quality of life (low risk of bias) | 1 | 50 | Std. Mean Difference (IV, Random, 95% CI) | 0.10 [‐0.46, 0.65] |
| 5.2.2 Change from baseline in quality of life (high risk of bias) | 2 | 176 | Std. Mean Difference (IV, Random, 95% CI) | ‐0.16 [‐0.55, 0.24] |
| Outcome or subgroup title | No. of studies | No. of participants | Statistical method | Effect size |
| 6.1 Number of participants who experienced improvement Show forest plot | 5 | 572 | Risk Ratio (M‐H, Random, 95% CI) | 2.46 [1.16, 5.23] |
| 6.1.1 Number of participants who experienced improvement (low risk of bias) | 2 | 80 | Risk Ratio (M‐H, Random, 95% CI) | 1.86 [0.41, 8.31] |
| 6.1.2 Number of participants who experienced improvement (unclear risk of bias) | 2 | 274 | Risk Ratio (M‐H, Random, 95% CI) | 3.11 [0.25, 38.71] |
| 6.1.3 Number of participants who experienced improvement (high risk of bias) | 1 | 218 | Risk Ratio (M‐H, Random, 95% CI) | 3.02 [2.00, 4.56] |
| 6.2 Change from baseline in itch Show forest plot | 7 | 749 | Std. Mean Difference (IV, Random, 95% CI) | ‐1.10 [‐1.83, ‐0.38] |
| 6.2.1 Change from baseline in itch (low risk of bias) | 3 | 329 | Std. Mean Difference (IV, Random, 95% CI) | ‐0.36 [‐1.16, 0.43] |
| 6.2.2 Change from baseline in itch (unclear risk of bias) | 2 | 180 | Std. Mean Difference (IV, Random, 95% CI) | ‐2.29 [‐2.67, ‐1.91] |
| 6.2.3 Change from baseline in itch (high risk of bias) | 2 | 240 | Std. Mean Difference (IV, Random, 95% CI) | ‐0.95 [‐1.75, ‐0.16] |
| 6.3 Number of participants who expressed treatment satisfaction Show forest plot | 3 | 298 | Risk Ratio (M‐H, Random, 95% CI) | 1.35 [0.77, 2.36] |
| 6.3.1 Number of participants who expressed treatment satisfaction (low risk of bias) | 2 | 80 | Risk Ratio (M‐H, Random, 95% CI) | 1.04 [0.77, 1.42] |
| 6.3.2 Number of participants who expressed treatment satisfaction (high risk of bias) | 1 | 218 | Risk Ratio (M‐H, Random, 95% CI) | 2.14 [1.58, 2.89] |
| 6.4 Number of participants reporting an adverse event Show forest plot | 10 | 1275 | Risk Ratio (M‐H, Random, 95% CI) | 1.03 [0.82, 1.30] |
| 6.4.1 Number of participants reporting an adverse event (low risk of bias) | 4 | 471 | Risk Ratio (M‐H, Random, 95% CI) | 0.83 [0.58, 1.18] |
| 6.4.2 Number of participants reporting an adverse events (unclear risk of bias) | 3 | 314 | Risk Ratio (M‐H, Random, 95% CI) | 1.08 [0.82, 1.42] |
| 6.4.3 Number of participants reporting an adverse events (high risk of bias) | 3 | 490 | Risk Ratio (M‐H, Random, 95% CI) | 1.35 [0.37, 4.96] |
| 6.5 Change in disease severity as assessed by the investigators Show forest plot | 12 | 1281 | Std. Mean Difference (IV, Random, 95% CI) | ‐0.65 [‐0.89, ‐0.41] |
| 6.5.1 Change in disease severity as assessed by the investigators (low risk of bias) | 5 | 512 | Std. Mean Difference (IV, Random, 95% CI) | ‐0.45 [‐0.74, ‐0.15] |
| 6.5.2 Change in disease severity as assessed by the investigators (unclear risk of bias) | 2 | 180 | Std. Mean Difference (IV, Random, 95% CI) | ‐0.93 [‐1.29, ‐0.57] |
| 6.5.3 Change in disease severity as assessed by the investigators (high risk of bias) | 5 | 589 | Std. Mean Difference (IV, Random, 95% CI) | ‐0.77 [‐1.23, ‐0.30] |
| 6.6 Number of participants experiencing a flare Show forest plot | 6 | 607 | Risk Ratio (M‐H, Random, 95% CI) | 0.33 [0.17, 0.62] |
| 6.6.1 Number of participants experiencing a flare (low risk of bias) | 1 | 123 | Risk Ratio (M‐H, Random, 95% CI) | 0.80 [0.48, 1.34] |
| 6.6.2 Number of participants experiencing a flare (unclear risk of bias) | 2 | 181 | Risk Ratio (M‐H, Random, 95% CI) | 0.26 [0.12, 0.57] |
| 6.6.3 Number of participants experiencing a flare (high risk of bias) | 3 | 303 | Risk Ratio (M‐H, Random, 95% CI) | 0.27 [0.12, 0.59] |
| 6.7 Change from baseline in quality of life Show forest plot | 3 | 300 | Std. Mean Difference (IV, Random, 95% CI) | ‐0.39 [‐0.90, 0.12] |
| 6.7.1 Change from baseline in quality of life (low risk of bias) | 1 | 123 | Std. Mean Difference (IV, Random, 95% CI) | ‐0.81 [‐1.18, ‐0.44] |
| 6.7.2 Change from baseline in quality of life (high risk of bias) | 2 | 177 | Std. Mean Difference (IV, Random, 95% CI) | ‐0.15 [‐0.55, 0.24] |
| Outcome or subgroup title | No. of studies | No. of participants | Statistical method | Effect size |
| 7.1 Change from baseline in TEWL Show forest plot | 1 | Mean Difference (IV, Random, 95% CI) | ‐0.34 [‐1.44, 0.76] | |
| 7.2 Change from baseline in skin hydration Show forest plot | 1 | Mean Difference (IV, Random, 95% CI) | 0.34 [‐2.54, 3.21] | |
| Outcome or subgroup title | No. of studies | No. of participants | Statistical method | Effect size |
| 8.1 Change from baseline in itch (VAS) Show forest plot | 2 | Mean Difference (IV, Random, 95% CI) | ‐0.48 [‐1.46, 0.50] | |
| 8.1.1 Change from baseline in itch (VAS) (unclear risk of bias) | 1 | Mean Difference (IV, Random, 95% CI) | 0.00 [‐0.47, 0.47] | |
| 8.1.2 Change from baseline in itch (VAS) (high risk of bias) | 1 | Mean Difference (IV, Random, 95% CI) | ‐1.00 [‐1.61, ‐0.39] | |
| 8.2 Change from baseline in SCORAD Show forest plot | 3 | Mean Difference (IV, Random, 95% CI) | 0.08 [‐1.96, 2.13] | |
| 8.2.1 Change from baseline in SCORAD (unclear risk of bias) | 1 | Mean Difference (IV, Random, 95% CI) | ‐2.00 [‐3.47, ‐0.53] | |
| 8.2.2 Change from baseline in SCORAD (high risk of bias) | 2 | Mean Difference (IV, Random, 95% CI) | 1.12 [‐1.38, 3.61] | |
| 8.3 Change from baseline in TEWL Show forest plot | 2 | Mean Difference (IV, Random, 95% CI) | ‐0.50 [‐5.88, 4.87] | |
| 8.3.1 Change from baseline in TEWL (unclear risk of bias) | 1 | Mean Difference (IV, Random, 95% CI) | ‐3.00 [‐4.71, ‐1.29] | |
| 8.3.2 Change from baseline in TEWL (high risk of bias) | 1 | Mean Difference (IV, Random, 95% CI) | 2.51 [‐1.21, 6.23] | |
| Outcome or subgroup title | No. of studies | No. of participants | Statistical method | Effect size |
| 9.1 Rate of flare Show forest plot | 1 | Hazard Ratio (IV, Random, 95% CI) | Totals not selected | |
| Outcome or subgroup title | No. of studies | No. of participants | Statistical method | Effect size |
| 10.1 Number of participants reporting an adverse event Show forest plot | 3 | 718 | Risk Ratio (M‐H, Random, 95% CI) | 0.51 [0.22, 1.14] |
| 10.2 Number of participants experiencing a flare Show forest plot | 3 | 718 | Risk Ratio (M‐H, Random, 95% CI) | 2.17 [1.51, 3.11] |
| 10.3 Rate of flare Show forest plot | 3 | 723 | Hazard Ratio (IV, Random, 95% CI) | 3.69 [1.80, 7.55] |
| Outcome or subgroup title | No. of studies | No. of participants | Statistical method | Effect size |
| 11.1 Change in disease severity as assessed by the investigators Show forest plot | 2 | 192 | Std. Mean Difference (IV, Random, 95% CI) | ‐0.87 [‐1.17, ‐0.57] |
| 11.2 Change in quality of life IDQOL Show forest plot | 1 | 67 | Mean Difference (IV, Random, 95% CI) | ‐1.31 [‐2.70, 0.09] |
| 11.3 Change in quality of life DFI Show forest plot | 1 | 67 | Mean Difference (IV, Random, 95% CI) | ‐1.03 [‐2.47, 0.42] |