Nichtsteroidale Antirheumatika bei chronischen Kreuzschmerzen
Referencias
References to studies included in this review
References to studies excluded from this review
Additional references
References to other published versions of this review
Characteristics of studies
Characteristics of included studies [ordered by study ID]
Ir a:
| Methods | RCT | |
| Participants | 180 participants, 102 women and 78 men; mean age 51 years (range 19 to 78 years) Inclusion: symptomatic lumbar osteoarthritis with daily pain during daily activities defined as a score as 40 mm on a 100 mm VAS Exclusion: participants with known hypersensitivity or allergy to piroxicam or to other NSAIDs; participants using topical medications to the painful region and the use of steroids by any route within 7 days before inclusion | |
| Interventions | NSAID (i): piroxicam patch 14mg/day, 8 consecutive days (N = 60) NSAID (ii): piroxicam 1% cream, 1.4g/day, 8 consecutive days (N = 60) Reference treatment (iii): placebo patch, 8 consecutive days (N = 60) | |
| Outcomes | Responder (reduction of pain score of at least 30%) rate to the administered treatment after 9 days: (i) 60%, (ii) 62% and (iii) 34% Adverse events: (i) 5 participants; (ii) 3 participants; (iii) 3 participants | |
| Notes | ||
| Risk of bias | ||
| Bias | Authors' judgement | Support for judgement |
| Random sequence generation (selection bias) | Low risk | Computer randomized |
| Allocation concealment (selection bias) | Unclear risk | Not mentioned |
| Blinding (performance bias and detection bias): All outcomes ‐ Patients | Unclear risk | Not mentioned |
| Blinding (performance bias and detection bias): All outcomes ‐ Care providers | Unclear risk | Not mentioned |
| Blinding (performance bias and detection bias): All outcomes ‐ Outcome assessors | Unclear risk | Not mentioned |
| Incomplete outcome data (attrition bias): All outcomes ‐ Drop‐outs | High risk | Each group had a drop out rate of > 20% |
| Incomplete outcome data (attrition bias): All outcomes ‐ ITT analysis | Unclear risk | Not mentioned |
| Selective reporting (reporting bias) | Unclear risk | No protocol |
| Similarity of baseline characteristics | Unclear risk | No table with baseline characteristics |
| Co‐interventions avoided or similar | Low risk | Rescue medication: paracetamol, up to 1.5 g per day allowed |
| Compliance acceptable | Low risk | All included participants were compliant |
| Timing outcome assessments similar | Low risk | Timing was similar |
| Methods | RCT, double blind, double‐dummy, cross‐over | |
| Participants | 37 participants, 24 women and 13 men; mean age 55 years (range 32 to 79); median disease duration of 3 years Inclusion: adult participants with chronic back pain (≥ 3 months) due to spondylosis, degenerative spinal disease, sciatica or pain of nonspecific cause Exclusion: pain due to malignant disorders, infective diseases, spondylolisthesis, an alkaline phosphatase level outside normal limits or an ESR > 25 mm/hour | |
| Interventions | NSAID (i): naproxen sodium 1100 mg/day, 14 days (N = 37 in cross‐over design) NSAID (ii): diflunisal 1000 mg/day, 14 days (N = 37 in cross‐over design) Reference treatment (iii): Placebo of dummy naproxen sodium capsules and diflunisal tablets (N = 37 in cross‐over design) | |
| Outcomes | Global pain, night pain, pain on movement and pain on standing assessed on vertical 10 cm VAS Reduction of pain on (i), an increase of pain (iii), and no significant change on (ii) Adverse events: (i) 18 participants; (ii) 16 participants; (iii) 18 participants | |
| Notes | ||
| Risk of bias | ||
| Bias | Authors' judgement | Support for judgement |
| Random sequence generation (selection bias) | Unclear risk | Randomization procedure not mentioned |
| Allocation concealment (selection bias) | Unclear risk | Allocation procedure not mentioned |
| Blinding (performance bias and detection bias): All outcomes ‐ Patients | Low risk | Patients were blinded |
| Blinding (performance bias and detection bias): All outcomes ‐ Care providers | Low risk | Care providers were blinded |
| Blinding (performance bias and detection bias): All outcomes ‐ Outcome assessors | Low risk | Outcome assessors were blinded |
| Incomplete outcome data (attrition bias): All outcomes ‐ Drop‐outs | Low risk | There was < 20% drop out |
| Incomplete outcome data (attrition bias): All outcomes ‐ ITT analysis | Unclear risk | Unclear whether or not all participants were analysed |
| Selective reporting (reporting bias) | Unclear risk | No protocol |
| Similarity of baseline characteristics | Low risk | Cross‐over design |
| Co‐interventions avoided or similar | High risk | Corsets, braces, physiotherapy and paracetamol were permitted as long as they were started before entry to the study and continued unchanged for the trial duration |
| Compliance acceptable | High risk | 14 drug discontinuations in 37 people |
| Timing outcome assessments similar | Low risk | Timing was similar |
| Methods | RCT, double blind | |
| Participants | 319 participants, 190 women and 124 men; mean age 52 years Inclusion: participants 18 to 75 years, low back pain ≥ 3 months, at least the past 30 days user of NSAID or acetaminophen. Pain without radiation to an extremity and without neurological signs or with radiation but not below the knee; After wash out period: ≥ 40 mm on low back intensity scale, increase of 10 mm and worsening of patient global assessment of disease status by ≥ 1 point compared to first screening visit Exclusion: low back pain due to malignancy, inflammatory disease, osteoporosis, fibromyalgia, ochronosis, vertebral fracture, infection, juvenile scoliosis or congenital malformation. Surgery in the past 6 months, symptomatic depression, drugs or alcohol abuse within the past 5 years, opioid use more than 4 days in the previous month, corticosteroid injections in the previous 3 months | |
| Interventions | NSAID (i): etoricoxib 60 mg/day, 12 weeks (N = 103) NSAID (ii): etoricoxib 90 mg/day, 12 weeks (N = 107) Reference treatment (iii): placebo (N = 109) | |
| Outcomes | Mean difference (95% CI) pain intensity scale (100 mm VAS) at 12 weeks: (i versus iii) −10.45 (−16.77 to −4.14); (ii versus iii) −7.5 (−13.71 to −1.28) Mean difference (95% CI) LBP bothersomeness (4‐point Likert scale) at 12 weeks: (i versus iii) −0.38 (−0.62 to −0.14); (ii versus iii) −0.33 (−0.57 to −0.09) Mean difference (95% CI) RDQ (0 to 24 point scale) over 12 weeks; (i versus iii) −2.42 (−3.87 to −0.98); (ii versus iii) −2.06 (−3.46 to −0.65) Adverse events: (i) 60 participants (14 withdrew), (ii) 56 participants (17 withdrew) (iii) 51 participants (10 withdrew) | |
| Notes | ||
| Risk of bias | ||
| Bias | Authors' judgement | Support for judgement |
| Random sequence generation (selection bias) | Low risk | Computer randomized |
| Allocation concealment (selection bias) | Low risk | Computer random allocation schedule |
| Blinding (performance bias and detection bias): All outcomes ‐ Patients | Low risk | Patients were blinded |
| Blinding (performance bias and detection bias): All outcomes ‐ Care providers | Low risk | Care providers were blinded |
| Blinding (performance bias and detection bias): All outcomes ‐ Outcome assessors | Low risk | Outcome assessors were blinded |
| Incomplete outcome data (attrition bias): All outcomes ‐ Drop‐outs | High risk | High drop‐out rates, 33%, 28%, 41% |
| Incomplete outcome data (attrition bias): All outcomes ‐ ITT analysis | High risk | No ITT analysis |
| Selective reporting (reporting bias) | Unclear risk | No protocol |
| Similarity of baseline characteristics | Low risk | Basline characteristics similar |
| Co‐interventions avoided or similar | High risk | Muscle relaxants, physical therapy, and chiropractic or alternative therapy (such as acupuncture) were permitted, if their use was stable for the month preceding the screening visit and was expected to remain stable for the trial duration |
| Compliance acceptable | High risk | Discontinuation in 6%, 11% and 26% |
| Timing outcome assessments similar | Low risk | Timing was similar |
| Methods | RCT, double‐blind; 'flare' design | |
| Participants | 293 participants, 166 women, 127 men; mean age 48.7 years Inclusion: participants ≥ 18 years with low back pain ≥ 3 months requiring regular use of analgesic medication. Flare criteria after washout period Exclusion: low back pain of neurologic aetiology or as the result of major trauma; surgical interventions for low back pain < 4 weeks prior to study entry; participants who had received corticosteroids or opioids | |
| Interventions | NSAID (i): valdecoxib 40 mg/day, 4 weeks (N = 148) Reference treatment (ii): placebo, 4 weeks (N = 143) | |
| Outcomes | Mean change score on pain intensity scale (100 mm VAS) at 1 and 4 weeks: (i) 29.2 mm and 41.9 mm; (ii) 17.7 mm and 31.1 mm; (i versus ii) all P < 0.001 Adverse events: (i) 52 participants (1 withdrew); (ii) 35 participants (3 withdrew) | |
| Notes | ||
| Risk of bias | ||
| Bias | Authors' judgement | Support for judgement |
| Random sequence generation (selection bias) | Low risk | Randomly assigned using a computer generated list of random numbers |
| Allocation concealment (selection bias) | Unclear risk | Procedure is not described |
| Blinding (performance bias and detection bias): All outcomes ‐ Patients | Low risk | Patients were blinded |
| Blinding (performance bias and detection bias): All outcomes ‐ Care providers | Unclear risk | Care providers were not mentioned in blinding procedure |
| Blinding (performance bias and detection bias): All outcomes ‐ Outcome assessors | Low risk | Outcome assessors were blinded |
| Incomplete outcome data (attrition bias): All outcomes ‐ Drop‐outs | High risk | In placebo group drop‐out rate was 21% |
| Incomplete outcome data (attrition bias): All outcomes ‐ ITT analysis | Low risk | Intention‐to‐treat (ITT) analysis was used |
| Selective reporting (reporting bias) | Unclear risk | No protocol |
| Similarity of baseline characteristics | Low risk | Baseline characteristics similar |
| Co‐interventions avoided or similar | Low risk | Rescue medication: acetaminophen ≤ 2000 mg/d for ≤ 3 consecutive days only in the first week, thereafter participants requiring any additional rescue medication were to be withdrawn from the study |
| Compliance acceptable | Low risk | 3 participants (2%) versus 1 participant (< 1%) withdrew |
| Timing outcome assessments similar | Low risk | Timing similar |
| Methods | RCT, double‐blind, double‐dummy | |
| Participants | 62 participants, 33 women, 29 men; mean age (SD) 52.6 (14.3) Inclusion: hospital outpatients, chronic back pain for at least 4 weeks and required NSAID treatment Exclusion: acute or chronic infections, neoplasm or metastases, other severe intercurrent systemic disease, sciatica, referred pain from other organs or believed to be of psychogenic origin, treatment with local corticosteroid injection within 4 weeks of study commencement, pregnancy, lactation, contraindications for NSAID therapy | |
| Interventions | NSAID (i): ibuprofen sustained‐release 1600 mg, plus placebo, 14 days (N = 30) NSAID (ii): diclofenac sustained‐release 100 mg, plus placebo, 14 days (N = 32) | |
| Outcomes | Mean (SD) overall change in clinical condition compared to baseline on a 9‐point scale: (i) 6.0 (1.4) (ii) 5.3 (1.5) Adverse events: (i) 4 participants, (ii) 16 participants (P = 0.002) | |
| Notes | ||
| Risk of bias | ||
| Bias | Authors' judgement | Support for judgement |
| Random sequence generation (selection bias) | Unclear risk | Randomization procedure not described |
| Allocation concealment (selection bias) | Unclear risk | Allocation procedure not described |
| Blinding (performance bias and detection bias): All outcomes ‐ Patients | Low risk | Patients were blinded |
| Blinding (performance bias and detection bias): All outcomes ‐ Care providers | Low risk | Care providers were blinded |
| Blinding (performance bias and detection bias): All outcomes ‐ Outcome assessors | Low risk | Outcome assessors were blinded |
| Incomplete outcome data (attrition bias): All outcomes ‐ Drop‐outs | High risk | 25% of the participants in the diclofenac dropped out |
| Incomplete outcome data (attrition bias): All outcomes ‐ ITT analysis | High risk | Withdrawn participants were not analysed |
| Selective reporting (reporting bias) | Unclear risk | No study protocol |
| Similarity of baseline characteristics | Low risk | Baseline characteristics similar |
| Co‐interventions avoided or similar | Low risk | Rescue analgesia: 500 mg paracetamol with a maximum dose of 4000 mg/day |
| Compliance acceptable | High risk | 12 participants withdrew during treatment period |
| Timing outcome assessments similar | Low risk | Timing similar |
| Methods | RCT, double‐blind | |
| Participants | 30 participants, 26 women, 4 men Inclusion: incapacity due to low back pain, duration ≥ 6 months, age 21 to 75 years Exclusion: pain from intervertebral disc prolapse, suspected neoplastic disease, neurological disease, pregnancy, peptic ulceration or gastrointestinal haemorrhage, current treatment with systemic corticosteroids or anticoagulants, liver or kidney disease, haemopoietic disorders, history of sensitivity to salicylates or paracetamol, psychiatric problems | |
| Interventions | NSAID (i): Diflunisal 1000 mg/day, 4 weeks (N = 16) Reference treatment (ii): paracetamol 4000 mg/day, 4 weeks (N = 14) | |
| Outcomes | Number of participants with none or mild low back pain after 2 and 4 weeks: (i) 11, 13 (ii) 9, 7. Significantly more participants in (i) (10 out of 16) considered the therapy as good or excellent than in (ii) (4 out of 12). Adverse events: (i) 2 participants (ii) 1 participants | |
| Notes | ||
| Risk of bias | ||
| Bias | Authors' judgement | Support for judgement |
| Random sequence generation (selection bias) | Low risk | Randomization prior to the trial |
| Allocation concealment (selection bias) | Low risk | Code‐labelled drugs, code was not broken |
| Blinding (performance bias and detection bias): All outcomes ‐ Patients | Low risk | Patients were blinded |
| Blinding (performance bias and detection bias): All outcomes ‐ Care providers | Low risk | Care providers were blinded |
| Blinding (performance bias and detection bias): All outcomes ‐ Outcome assessors | Low risk | Outcome assessors were blinded |
| Incomplete outcome data (attrition bias): All outcomes ‐ Drop‐outs | Low risk | Sixteen out of 16 participants and 13 out of 14 participants completed the trial |
| Incomplete outcome data (attrition bias): All outcomes ‐ ITT analysis | High risk | Two participants in the paracetamol group were not analysed in their allocation group |
| Selective reporting (reporting bias) | Unclear risk | No protocol |
| Similarity of baseline characteristics | Unclear risk | No baseline characteristics were shown |
| Co‐interventions avoided or similar | Low risk | Only anti‐hypertensive drug therapy was allowed, other drugs were forbidden |
| Compliance acceptable | Unclear risk | Compliance was not mentioned |
| Timing outcome assessments similar | Low risk | Timing similar |
| Methods | RCT, double‐blind | |
| Participants | 217 participants, 118 women, 99 men Inclusion: participants aged ≥ 18 years, body mass index ≤ 39 kg/m², nonradiculopathic low back pain for at least 3 months, required regular analgesic medication, analgesic medication > 4 days/week over the previous month, average pain intensity score ≥ 4 over previous 24 hours on 11‐point numerical rating scale, minimum compliance of 4 entries in electronic daily pain diary over the 5 previous days Exclusion: radiculopathy in previous 2 years, secondary causes of back pain, surgical intervention for treatment of back pain, pregnancy, lactation, rheumatoid arthritis, seronegative spondyloarthropathy, Paget disease of spine, pelvis or femur, fibromyalgia, tumours or infections of spinal cord, cancer in previous 2 years other than cutaneous basal cell or squamous cell carcinoma, allergic reaction to monoclonal antibody or IgG‐fusion protein, acetaminophen or NSAIDs, contraindications to NSAID therapy | |
| Interventions | NSAID (i): naproxen 1000 mg daily and placebo single intravenous infusion, 12 weeks (N = 88) Reference treatment (ii): tanezumab single intravenous infusion 200 μg/kg and oral placebo daily, 12 weeks (N = 88) Reference treatment (iii): placebo single intravenous infusion and oral placebo daily, 12 weeks (N = 41) | |
| Outcomes | Mean change in average low back pain intensity over previous 24 hours on 11‐point numerical rating scale, at 6 weeks compared to baseline: (i versus iii) ‐2.5 versus ‐2.0 (P = 0.068) Adverse events: (i) 54 participants (3 withdrew); (ii) 50 participants (4 withdrew); (iii) 27 participants (2 withdrew) | |
| Notes | ||
| Risk of bias | ||
| Bias | Authors' judgement | Support for judgement |
| Random sequence generation (selection bias) | Unclear risk | Not mentioned |
| Allocation concealment (selection bias) | Unclear risk | Not mentioned |
| Blinding (performance bias and detection bias): All outcomes ‐ Patients | Low risk | Patients were blinded, placebo tablets/injections |
| Blinding (performance bias and detection bias): All outcomes ‐ Care providers | Unclear risk | Unclear if care providers were blinded |
| Blinding (performance bias and detection bias): All outcomes ‐ Outcome assessors | Low risk | Outcome assessors were blinded |
| Incomplete outcome data (attrition bias): All outcomes ‐ Drop‐outs | High risk | Drop out 32% |
| Incomplete outcome data (attrition bias): All outcomes ‐ ITT analysis | Low risk | ITT was performed |
| Selective reporting (reporting bias) | Low risk | Trial was registered |
| Similarity of baseline characteristics | Low risk | Baseline characteristics were similar |
| Co‐interventions avoided or similar | Low risk | Rescue medication acetaminophen with a maximum of 2000 mg per day and maximum 3 days per week |
| Compliance acceptable | Low risk | Nine people discontinued the trial |
| Timing outcome assessments similar | Low risk | Timing similar |
| Methods | Randomized, double‐blind, placebo and active‐controlled trial | |
| Participants | 1359 participants, 714 women, 645 men Inclusion: duration of back pain of ≥ 3 months requiring regular use of analgesic medication (> 4 days per week for the past month), including immediate‐release opioids (in which the average daily opioid dose (for a 7‐day period) did not exceed a morphine equivalent dose of 30 mg/d) but excluding acetaminophen, gabapentin or pregabalin as the sole analgesics used for chronic low back pain; primary location of low back pain between the 12th thoracic vertebra and the lower gluteal folds, with or without radiation into the Exclusion: history of lumbosacral radiculopathy within the past 2 years, vertebral fracture, major trauma or back surgery in the past 6 months; significant cardiac, neurological, or other pain, or psychological conditions; known history of rheumatoid arthritis, seronegative spondyloarthropathy, Paget’s disease of the spine, pelvis or femur, fibromyalgia, tumours or infections of the spinal cord; and any condition that might preclude NSAID use. Patients also were excluded if extended‐release (ER) opioids or long‐acting opioids such as oxycodone controlled release, oxymorphone ER, hydromorphone, transdermal fentanyl or methadone had been used within 3 months of screening | |
| Interventions | NSAID (i): naproxen 1000 mg daily and placebo infusion at baseline, 8 weeks and 16 weeks (N = 295) Reference treatment (ii): placebo tablets daily and placebo infusion at baseline and 8 weeks, 16 weeks (N = 230) Reference treatment (iii): tanezumab 5 mg iv infusion over 5 minutes at baseline and 8 weeks, 16 weeks (N = 232) Reference treatment (iv): tanezumab 10 mg iv infusion over 5 minutes at baseline and 8 weeks, 16 weeks (N = 295) Reference treatment (v): tanezumab 20 mg iv infusion over 5 minutes at baseline and 8 weeks, 16 weeks (N= 295) | |
| Outcomes | Least squares mean difference from baseline on a 11‐point scale: (i versus iii) 0.08 (P = 0.688) Least squares mean difference from baseline on a 11‐point scale: (i versus iv) −0.39 (P = 0.035) Least squares mean difference from baseline on a 11‐point scale: (i versus v) −0.51 (P = 0.006) Adverse events: (i) 142 participants (10 withdrew), (ii) 120 participants (14 withdrew), (iii) 141 participants (11 withdrew), (iv) 171 participants (19 withdrew), (v) 190 participants (28 withdrew) | |
| Notes | ||
| Risk of bias | ||
| Bias | Authors' judgement | Support for judgement |
| Random sequence generation (selection bias) | Unclear risk | Not mentioned |
| Allocation concealment (selection bias) | Unclear risk | Not mentioned |
| Blinding (performance bias and detection bias): All outcomes ‐ Patients | Low risk | Patients were blinded |
| Blinding (performance bias and detection bias): All outcomes ‐ Care providers | Low risk | Care providers were blinded |
| Blinding (performance bias and detection bias): All outcomes ‐ Outcome assessors | Unclear risk | Not mentioned for all examinations |
| Incomplete outcome data (attrition bias): All outcomes ‐ Drop‐outs | High risk | All trial groups had high drop out rates |
| Incomplete outcome data (attrition bias): All outcomes ‐ ITT analysis | Unclear risk | ITT and per protocol analysis used, unclear which analysis was used in what comparison |
| Selective reporting (reporting bias) | Low risk | Protocol present |
| Similarity of baseline characteristics | Low risk | Baseline characteristics were comparable |
| Co‐interventions avoided or similar | Low risk | Only paracetamol up to 300 mg/day and max 3 days per week was allowed |
| Compliance acceptable | Unclear risk | Not mentioned |
| Timing outcome assessments similar | Low risk | Timing was similar |
| Methods | RCT, double‐blind, double‐dummy | |
| Participants | 2 studies; study 1: 791 participants, 462 women, 329 men; study 2: 802 participants, 450 women, 342 men Inclusion: participants aged ≥ 18 years, duration of back pain ≥ 12 weeks, requiring analgesics ≥ 4 days/week, back pain score of ≥ 4 on 11‐point NRS at baseline Exclusion: back pain with neurologic aetiology, recent major trauma, due to visceral disorder, history of rheumatoid arthritis, spondyloarthropathy, spinal stenosis, malignancy, fibromyalgia, tumours or infections of the brain, spinal cord or peripheral nerves, herniated disc with neurological impairment in previous 2 years, psoriasis, seizure disorder, alcohol/analgesic/narcotic or other substance abuse in previous 2 years, asthma, allergic reactions on aspirin or NSAID, contraindications for NSAID use, surgical intervention for back pain in previous 6 months. | |
| Interventions | NSAID (i): celecoxib 400 mg/day, 6 weeks (study 1: N = 402; study 2: N = 396) Reference treatment (ii): tramadol 200 mg/day, 6 weeks (study 1: N = 389; study 2: N = 396) | |
| Outcomes | At 6 weeks ≥ 30% improvement in pain from baseline, measured with 11‐point numerical rating scale; study 1 (i versus ii) 63.2% versus 49.9% (P < 0.001); study 2 (i versus ii) 64.1% versus 55.1% (P = 0.008) Adverse events: study 1: (i) 191 participants (18 withdrew), (ii) 230 participants (72 withdrew); study 2: (i) 190 participants (21 withdrew), (ii) 224 participants (60 withdrew) | |
| Notes | ||
| Risk of bias | ||
| Bias | Authors' judgement | Support for judgement |
| Random sequence generation (selection bias) | Low risk | Randomization was computer generated |
| Allocation concealment (selection bias) | Low risk | Computerized schedule |
| Blinding (performance bias and detection bias): All outcomes ‐ Patients | Low risk | Double dummy, double blind |
| Blinding (performance bias and detection bias): All outcomes ‐ Care providers | Low risk | Double dummy, double blind |
| Blinding (performance bias and detection bias): All outcomes ‐ Outcome assessors | Low risk | Double dummy, double blind |
| Incomplete outcome data (attrition bias): All outcomes ‐ Drop‐outs | High risk | The tramadol group had a drop out rate > 20% |
| Incomplete outcome data (attrition bias): All outcomes ‐ ITT analysis | Low risk | ITT analysis |
| Selective reporting (reporting bias) | Unclear risk | No study protocol |
| Similarity of baseline characteristics | Low risk | Baseline characteristics were similar |
| Co‐interventions avoided or similar | Low risk | No rescue medication allowed |
| Compliance acceptable | High risk | Non‐compliance in 9.6% of celecoxib group and 15% in tramadol group |
| Timing outcome assessments similar | Low risk | Timing similar |
| Methods | RCT, cross‐over design | |
| Participants | 42 participants, 20 women, 16 men Inclusion: low back pain ≥ 6 months due to disc prolapse, lumbar spondylosis or spinal stenosis or both, minimum VAS > 40 mm, age 18 to 75 Exclusion: Previous back surgery, diabetes, neurological disease, cardio‐renal disease, history of gastric ulcers or intestinal bleeding, known allergy to drugs under study, alcohol/drugs abuse | |
| Interventions | Each treatment lasted 4 weeks with 1 week discontinuation between treatments NSAID: (i) celecoxib approximately 3 to 6 mg/kg/day and placebo Reference treatment: (ii) pregabalin approximately 1 mg/kg/day and placebo Reference treatment: (iii) celecoxib and pregabalin | |
| Outcomes | Mean (SD) pain reduction after 4 weeks on 100 mm VAS: (i) 5.6; (ii) 5; (iii) 17.7; Adverse events: (i) 4 participants (1 withdrew), (ii) 5 participants (1 withdrew), (iii) 7 participants (2 withdrew) | |
| Notes | ||
| Risk of bias | ||
| Bias | Authors' judgement | Support for judgement |
| Random sequence generation (selection bias) | Unclear risk | Randomization unclear |
| Allocation concealment (selection bias) | Unclear risk | Not mentioned |
| Blinding (performance bias and detection bias): All outcomes ‐ Patients | Unclear risk | Not mentioned |
| Blinding (performance bias and detection bias): All outcomes ‐ Care providers | Unclear risk | Not mentioned |
| Blinding (performance bias and detection bias): All outcomes ‐ Outcome assessors | Unclear risk | Not mentioned |
| Incomplete outcome data (attrition bias): All outcomes ‐ Drop‐outs | Low risk | Low dropout rate |
| Incomplete outcome data (attrition bias): All outcomes ‐ ITT analysis | High risk | Drop outs were excluded from data analysis |
| Selective reporting (reporting bias) | Unclear risk | No study protocol |
| Similarity of baseline characteristics | Low risk | Cross over design |
| Co‐interventions avoided or similar | Low risk | Use of antidepressants or anticonvulsants or both, opioids, nonsteroidal anti‐inflammatory drugs or muscle relaxants was not permitted |
| Compliance acceptable | Low risk | Individual drug consumption was measured and acceptable |
| Timing outcome assessments similar | Low risk | Timing similar |
| Methods | RCT | |
| Participants | 201 participants, 112 women, 89 men; mean age 42.2 years Inclusion: age 20 to 64 years, nonspecific chronic low back pain ≥ 3 months without radicular pain, ≥ 70° at straight leg raising test, negative femoral nerve stretching test, no superficial sensory deficits, muscle strength ≥ 4/5 Exclusion: low back pain due to tumours, infections, fractures, previous back surgery, severe osteoporosis, psychiatric disorders, liver and renal dysfunction, pregnancy, medication for cardiac failure, history of cerebrovascular accident or myocardial infarction, or both, in previous 6 months | |
| Interventions | NSAID (i): 1 of the following 3 NSAIDs were prescribed: loxoprofen sodium 180 mg/day; diclofenac sodium 75 mg/day; zaltoprofen 240 mg/day, 12 weeks Reference treatment (ii): exercise programme with trunk muscle strengthening and stretching, 12 weeks | |
| Outcomes | Mean change from baseline to 8 weeks on 100 mm VAS was not different between (i) and (ii), P = 0.33 Mean change from baseline to 8 weeks on RDQ in favour of (ii), P = 0.02 | |
| Notes | ||
| Risk of bias | ||
| Bias | Authors' judgement | Support for judgement |
| Random sequence generation (selection bias) | Low risk | Computer generated 4 block randomization |
| Allocation concealment (selection bias) | Low risk | Office manager concealed allocation |
| Blinding (performance bias and detection bias): All outcomes ‐ Patients | High risk | NSAIDs versus exercise |
| Blinding (performance bias and detection bias): All outcomes ‐ Care providers | High risk | NSAIDs versus exercise |
| Blinding (performance bias and detection bias): All outcomes ‐ Outcome assessors | Low risk | Outcome assessor was blinded |
| Incomplete outcome data (attrition bias): All outcomes ‐ Drop‐outs | Low risk | Two in exercise, 6 in NSAIDs. |
| Incomplete outcome data (attrition bias): All outcomes ‐ ITT analysis | High risk | No ITT analysis performed. |
| Selective reporting (reporting bias) | Unclear risk | study protocol not attainable |
| Similarity of baseline characteristics | Low risk | Baseline characteristics were similar |
| Co‐interventions avoided or similar | Unclear risk | Rescue medication not mentioned |
| Compliance acceptable | Unclear risk | Compliance not mentioned |
| Timing outcome assessments similar | Low risk | Timing similar |
| Methods | RCT, double‐blind | |
| Participants | 28 outpatients, 11 women, 17 men; mean age 45 years Inclusion: chronic severe low back pain, age 25 to 76 years Exclusion: pregnant or nursing women, compensation claims, haematological, renal or hepatic disease, pre‐existing radiological evidence of peptic ulcer, intolerance to indomethacin | |
| Interventions | NSAID (i): piroxicam 20 mg/day, 6 weeks (N = 14) NSAID (ii): indometacin 75 mg/day, 6 weeks (N = 14) | |
| Outcomes | Change of pain from baseline until 6 weeks: (i) 8.1 (ii) 9.4; no significant difference between groups. Adverse events: (i) 8 participants (ii) 10 participants | |
| Notes | ||
| Risk of bias | ||
| Bias | Authors' judgement | Support for judgement |
| Random sequence generation (selection bias) | Unclear risk | Not mentioned |
| Allocation concealment (selection bias) | Unclear risk | Not mentioned |
| Blinding (performance bias and detection bias): All outcomes ‐ Patients | Low risk | Patients were blinded |
| Blinding (performance bias and detection bias): All outcomes ‐ Care providers | Low risk | Care providers were blinded |
| Blinding (performance bias and detection bias): All outcomes ‐ Outcome assessors | Low risk | Outcome assessors were blinded |
| Incomplete outcome data (attrition bias): All outcomes ‐ Drop‐outs | Low risk | Two out of 14 participants in one group were lost to follow‐up. |
| Incomplete outcome data (attrition bias): All outcomes ‐ ITT analysis | High risk | Complete case analysis |
| Selective reporting (reporting bias) | Unclear risk | No study protocol |
| Similarity of baseline characteristics | Unclear risk | No baseline characteristics shown |
| Co‐interventions avoided or similar | Low risk | Only paracetamol as co‐intervention up to 3000 mg |
| Compliance acceptable | Unclear risk | Compliance not mentioned |
| Timing outcome assessments similar | Unclear risk | Timing was unclear |
| Methods | RCT, double‐blind, double‐dummy, 'flare design' | |
| Participants | 446 participants, 320 women, 126 men; mean age (SD) 51.9 (13.8) Inclusion: age 19 to 85 years, with chronic low back pain, regular users of analgesic medication, pain without radiation to an extremity and without neurological signs or pain with radiation to an extremity, but not below the knee and without neurological signs, after 1 week washout period LBP intensity ≤ 80 mm on 100 mm VAS scale | |
| Interventions | NSAID (i) etoricoxib 60 mg/day, 4 weeks (N = 224) NSAID (ii) diclofenac 150 mg/day, 4 weeks (N = 222) | |
| Outcomes | Mean difference (95% CI) pain intensity scale (100 mm VAS) at 4 weeks: (i, N = 222 versus ii, N = 218) 2.51 (−1.50 to 6.51) Mean difference (95% CI) RDQ (0 to 24) over 4 weeks: (i versus ii) −0.23 (−1.14 to 0.67) Adverse events: (i) 79 participants (15 withdrew); (ii) 87 participants (12 withdrew) | |
| Notes | ||
| Risk of bias | ||
| Bias | Authors' judgement | Support for judgement |
| Random sequence generation (selection bias) | Unclear risk | Randomization procedure not described |
| Allocation concealment (selection bias) | Unclear risk | Not mentioned |
| Blinding (performance bias and detection bias): All outcomes ‐ Patients | Low risk | Double dummy |
| Blinding (performance bias and detection bias): All outcomes ‐ Care providers | Low risk | Care providers blinded |
| Blinding (performance bias and detection bias): All outcomes ‐ Outcome assessors | Low risk | Outcome assessors blinded |
| Incomplete outcome data (attrition bias): All outcomes ‐ Drop‐outs | Low risk | 9% and 11% drop out in both groups |
| Incomplete outcome data (attrition bias): All outcomes ‐ ITT analysis | High risk | Per protocol analysis |
| Selective reporting (reporting bias) | Unclear risk | No study protocol |
| Similarity of baseline characteristics | Low risk | Similar baseline characteristics |
| Co‐interventions avoided or similar | Low risk | Paracetamol as rescue therapy |
| Compliance acceptable | Low risk | More than 95% compliance in both study groups |
| Timing outcome assessments similar | Low risk | Timing similar |
Abbreviations: ESR: erythorcyte sedimentation rate, LBP: low back pain, NSAID: non‐steroidal anti‐inflammatory drug, RCT: randomized controlled trial, RDQ: Roland Morris Disability Questionnaire, SD: standard deviation, VAS: visual analogue scale.
Characteristics of excluded studies [ordered by study ID]
Ir a:
| Study | Reason for exclusion |
| Duration of back pain is unclear. | |
| Only acute back pain included. | |
| No comparison made, one study group. | |
| Patients were given intravenous infusion after spine surgery. | |
| Rofecoxib as study medication. | |
| The trial only included participants with acute back pain. | |
| The trial does not distinguish between participants with subacute and chronic back pain. | |
| Duration of back pain is unclear. | |
| The study only included participants with acute back pain. | |
| Duration of back pain is unclear. | |
| Rofecoxib as study medication. | |
| Duration of back pain is unclear. | |
| Inclusion > 1 month of back pain. | |
| Article in Russian. | |
| Article in Chinese. | |
| Inclusion > 2 months of back pain. | |
| Participants selected based on radiological osteoarthritis, not on back pain. | |
| NSAIDs were used in both groups as needed. | |
| Duration of back pain is unclear. | |
| Duration of back pain is unclear. | |
| Intravenous infusion in patients on chronic opioid treatment. |
Data and analyses
| Outcome or subgroup title | No. of studies | No. of participants | Statistical method | Effect size |
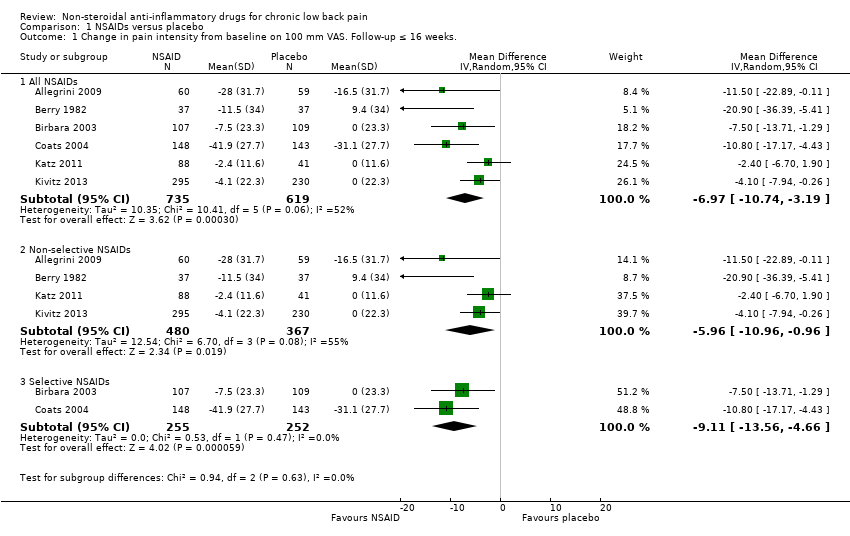
| 1 Change in pain intensity from baseline on 100 mm VAS. Follow‐up ≤ 16 weeks. Show forest plot | 6 | Mean Difference (IV, Random, 95% CI) | Subtotals only | |
| Analysis 1.1  Comparison 1 NSAIDs versus placebo, Outcome 1 Change in pain intensity from baseline on 100 mm VAS. Follow‐up ≤ 16 weeks.. | ||||
| 1.1 All NSAIDs | 6 | 1354 | Mean Difference (IV, Random, 95% CI) | ‐6.97 [‐10.74, ‐3.19] |
| 1.2 Non‐selective NSAIDs | 4 | 847 | Mean Difference (IV, Random, 95% CI) | ‐5.96 [‐10.96, ‐0.96] |
| 1.3 Selective NSAIDs | 2 | 507 | Mean Difference (IV, Random, 95% CI) | ‐9.11 [‐13.56, ‐4.66] |
| 2 Change in disability from baseline Show forest plot | 4 | 1161 | Mean Difference (IV, Fixed, 95% CI) | ‐0.85 [‐1.30, ‐0.40] |
| Analysis 1.2  Comparison 1 NSAIDs versus placebo, Outcome 2 Change in disability from baseline. | ||||
| 3 Proportion of patients experiencing adverse events. Follow‐up ≤ 16 weeks. Show forest plot | 6 | Risk Ratio (M‐H, Fixed, 95% CI) | Subtotals only | |
| Analysis 1.3  Comparison 1 NSAIDs versus placebo, Outcome 3 Proportion of patients experiencing adverse events. Follow‐up ≤ 16 weeks.. | ||||
| 3.1 All NSAIDs | 6 | 1354 | Risk Ratio (M‐H, Fixed, 95% CI) | 1.04 [0.92, 1.17] |
| 3.2 Non‐selective NSAIDs | 4 | 847 | Risk Ratio (M‐H, Fixed, 95% CI) | 0.94 [0.82, 1.08] |
| 3.3 Selective NSAIDs | 2 | 507 | Risk Ratio (M‐H, Fixed, 95% CI) | 1.25 [1.00, 1.56] |
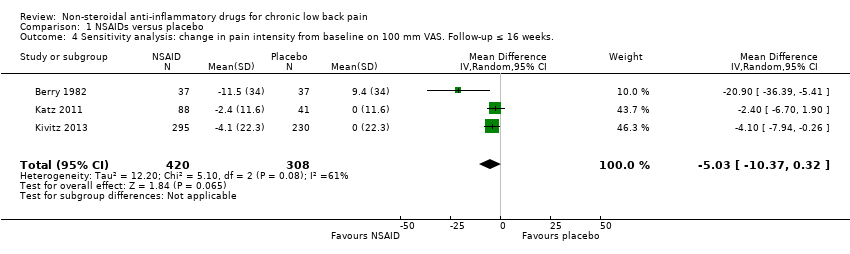
| 4 Sensitivity analysis: change in pain intensity from baseline on 100 mm VAS. Follow‐up ≤ 16 weeks. Show forest plot | 3 | 728 | Mean Difference (IV, Random, 95% CI) | ‐5.03 [‐10.37, 0.32] |
| Analysis 1.4  Comparison 1 NSAIDs versus placebo, Outcome 4 Sensitivity analysis: change in pain intensity from baseline on 100 mm VAS. Follow‐up ≤ 16 weeks.. | ||||
| 5 Sensitivity analysis: change in disability from baseline Show forest plot | 2 | 654 | Mean Difference (IV, Fixed, 95% CI) | ‐0.41 [‐1.04, 0.23] |
| Analysis 1.5  Comparison 1 NSAIDs versus placebo, Outcome 5 Sensitivity analysis: change in disability from baseline. | ||||
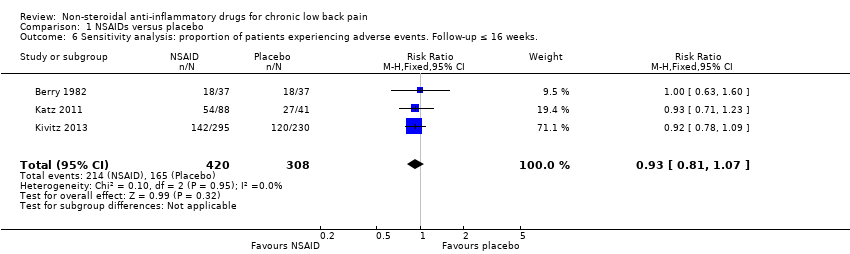
| 6 Sensitivity analysis: proportion of patients experiencing adverse events. Follow‐up ≤ 16 weeks. Show forest plot | 3 | 728 | Risk Ratio (M‐H, Fixed, 95% CI) | 0.93 [0.81, 1.07] |
| Analysis 1.6  Comparison 1 NSAIDs versus placebo, Outcome 6 Sensitivity analysis: proportion of patients experiencing adverse events. Follow‐up ≤ 16 weeks.. | ||||
| Outcome or subgroup title | No. of studies | No. of participants | Statistical method | Effect size |
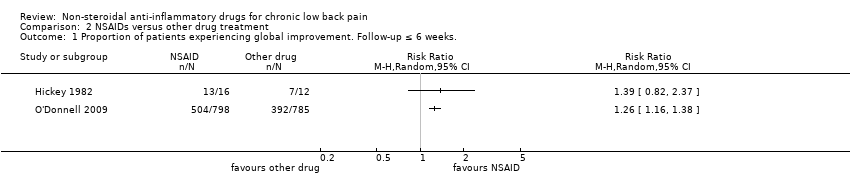
| 1 Proportion of patients experiencing global improvement. Follow‐up ≤ 6 weeks. Show forest plot | 2 | Risk Ratio (M‐H, Random, 95% CI) | Totals not selected | |
| Analysis 2.1  Comparison 2 NSAIDs versus other drug treatment, Outcome 1 Proportion of patients experiencing global improvement. Follow‐up ≤ 6 weeks.. | ||||
| 2 Proportion of patients experiencing adverse events. Follow‐up ≤ 6 weeks. Show forest plot | 3 | Risk Ratio (M‐H, Random, 95% CI) | Totals not selected | |
| Analysis 2.2  Comparison 2 NSAIDs versus other drug treatment, Outcome 2 Proportion of patients experiencing adverse events. Follow‐up ≤ 6 weeks.. | ||||

study flow diagram.

'Risk of bias' summary: review authors' judgements about each 'Risk of bias' item for each included trial.

'Risk of bias' graph: review authors' judgements about each 'Risk of bias' item presented as percentages across all included trials.

Funnel plot of comparison: 1 NSAIDs versus placebo, outcome: 1.1 Change in pain intensity from baseline on 100 mm VAS. Follow‐up ≤ 12 weeks.

Funnel plot of comparison: 1 NSAIDs versus placebo, outcome: 1.2 Change in disability from baseline.

Funnel plot of comparison: 1 NSAIDs versus placebo, outcome: 1.3 Proportion of patients experiencing adverse events. Follow‐up ≤ 16 weeks.
Comparison 1 NSAIDs versus placebo, Outcome 1 Change in pain intensity from baseline on 100 mm VAS. Follow‐up ≤ 16 weeks..

Comparison 1 NSAIDs versus placebo, Outcome 2 Change in disability from baseline.

Comparison 1 NSAIDs versus placebo, Outcome 3 Proportion of patients experiencing adverse events. Follow‐up ≤ 16 weeks..
Comparison 1 NSAIDs versus placebo, Outcome 4 Sensitivity analysis: change in pain intensity from baseline on 100 mm VAS. Follow‐up ≤ 16 weeks..

Comparison 1 NSAIDs versus placebo, Outcome 5 Sensitivity analysis: change in disability from baseline.
Comparison 1 NSAIDs versus placebo, Outcome 6 Sensitivity analysis: proportion of patients experiencing adverse events. Follow‐up ≤ 16 weeks..
Comparison 2 NSAIDs versus other drug treatment, Outcome 1 Proportion of patients experiencing global improvement. Follow‐up ≤ 6 weeks..

Comparison 2 NSAIDs versus other drug treatment, Outcome 2 Proportion of patients experiencing adverse events. Follow‐up ≤ 6 weeks..
| NSAIDs for people with chronic low back pain compared to placebo | |||||
| Participant or population: people with chronic low back pain | |||||
| Outcomes | Illustrative comparative risks* (95% CI) | Relative effect | Number of participants | Quality of the evidence | |
| Assumed risk | Corresponding risk | ||||
| Control | NSAIDs | ||||
| Change in pain intensity from baseline | Not estimable | The mean change in pain intensity from baseline in the intervention groups was | ‐ | 1354 | ⊕⊕⊝⊝ |
| Change in disability from baseline | Not estimable | The mean change in disability from baseline in the intervention groups was | ‐ | 1161 | ⊕⊕⊝⊝ |
| Proportion of participants experiencing adverse events | Study population | RR 1.04 | 1354 | ⊕⊕⊝⊝ | |
| 410 per 1000 | 427 per 1000 | ||||
| Moderate | |||||
| 477 per 1000 | 496 per 1000 | ||||
| Sensitivity analysis: change in pain intensity from baseline | Not estimable | The mean sensitivity analysis change in pain intensity from baseline. in the intervention groups was | ‐ | 728 | ⊕⊕⊕⊝ |
| Sensitivity analysis: change in disability from baseline | Not estimable | The mean sensitivity analysis change in disability from baseline in the intervention groups was | ‐ | 654 | ⊕⊕⊕⊝ |
| Sensitivity analysis: proportion of participants experiencing adverse events. Follow‐up ≤ 16 weeks | Study population | RR 0.93 | 728 | ⊕⊕⊕⊝ | |
| 536 per 1000 | 498 per 1000 | ||||
| Moderate | |||||
| 522 per 1000 | 485 per 1000 | ||||
| *The basis for the assumed risk (e.g. the median control group risk across studies) is provided in footnotes. The corresponding risk (and its 95% CI) is based on the assumed risk in the comparison group and the relative effect of the intervention (and its 95% CI). | |||||
| GRADE Working Group grades of evidence | |||||
| 1Allocation concealment was uncertain in most included trials, and randomization was uncertain in half of the included trials, therefore selection bias is likely. Five out of six trials had high drop‐out rates, so attrition bias is likely, one level downgrade. | |||||
| Outcome or subgroup title | No. of studies | No. of participants | Statistical method | Effect size |
| 1 Change in pain intensity from baseline on 100 mm VAS. Follow‐up ≤ 16 weeks. Show forest plot | 6 | Mean Difference (IV, Random, 95% CI) | Subtotals only | |
| 1.1 All NSAIDs | 6 | 1354 | Mean Difference (IV, Random, 95% CI) | ‐6.97 [‐10.74, ‐3.19] |
| 1.2 Non‐selective NSAIDs | 4 | 847 | Mean Difference (IV, Random, 95% CI) | ‐5.96 [‐10.96, ‐0.96] |
| 1.3 Selective NSAIDs | 2 | 507 | Mean Difference (IV, Random, 95% CI) | ‐9.11 [‐13.56, ‐4.66] |
| 2 Change in disability from baseline Show forest plot | 4 | 1161 | Mean Difference (IV, Fixed, 95% CI) | ‐0.85 [‐1.30, ‐0.40] |
| 3 Proportion of patients experiencing adverse events. Follow‐up ≤ 16 weeks. Show forest plot | 6 | Risk Ratio (M‐H, Fixed, 95% CI) | Subtotals only | |
| 3.1 All NSAIDs | 6 | 1354 | Risk Ratio (M‐H, Fixed, 95% CI) | 1.04 [0.92, 1.17] |
| 3.2 Non‐selective NSAIDs | 4 | 847 | Risk Ratio (M‐H, Fixed, 95% CI) | 0.94 [0.82, 1.08] |
| 3.3 Selective NSAIDs | 2 | 507 | Risk Ratio (M‐H, Fixed, 95% CI) | 1.25 [1.00, 1.56] |
| 4 Sensitivity analysis: change in pain intensity from baseline on 100 mm VAS. Follow‐up ≤ 16 weeks. Show forest plot | 3 | 728 | Mean Difference (IV, Random, 95% CI) | ‐5.03 [‐10.37, 0.32] |
| 5 Sensitivity analysis: change in disability from baseline Show forest plot | 2 | 654 | Mean Difference (IV, Fixed, 95% CI) | ‐0.41 [‐1.04, 0.23] |
| 6 Sensitivity analysis: proportion of patients experiencing adverse events. Follow‐up ≤ 16 weeks. Show forest plot | 3 | 728 | Risk Ratio (M‐H, Fixed, 95% CI) | 0.93 [0.81, 1.07] |
| Outcome or subgroup title | No. of studies | No. of participants | Statistical method | Effect size |
| 1 Proportion of patients experiencing global improvement. Follow‐up ≤ 6 weeks. Show forest plot | 2 | Risk Ratio (M‐H, Random, 95% CI) | Totals not selected | |
| 2 Proportion of patients experiencing adverse events. Follow‐up ≤ 6 weeks. Show forest plot | 3 | Risk Ratio (M‐H, Random, 95% CI) | Totals not selected | |