Agentes antiinflamatorios no esteroideos para el dolor lumbar crónico
Información
- DOI:
- https://doi.org/10.1002/14651858.CD012087Copiar DOI

- Base de datos:
-
- Cochrane Database of Systematic Reviews
- Versión publicada:
-
- 10 febrero 2016see what's new
- Tipo:
-
- Intervention
- Etapa:
-
- Review
- Grupo Editorial Cochrane:
-
Grupo Cochrane de Espalda y cuello
- Copyright:
-
- Copyright © 2016 The Cochrane Collaboration. Published by John Wiley & Sons, Ltd.
Cifras del artículo
Altmetric:
Citado por:
Autores
Contributions of authors
BW Koes, PDDM Roelofs and WTM Enthoven screened titles and abstracts. WTM Enthoven and PDDM Roelofs performed methodological quality assessments, data extraction and data analyses. WTM Enthoven wrote the initial draft of the manuscript and all review authors critically reviewed the manuscript.
Sources of support
Internal sources
-
No sources of support supplied
External sources
-
Dutch Arthritis Foundation, Netherlands.
This Cochrane review is partly funded by a Dutch Arthritis Foundation programme grant.
Declarations of interest
Wendy TM Enthoven has no known conflicts of interest.
Pepijn DDM Roelofs has no known conflicts of interest.
Richard A Deyo has no known conflicts of interest.
Maurits W van Tulder has no known conflicts of interest.
Bart W Koes has no known conflicts of interest.
Acknowledgements
We thank Shireen Harbin and Rachel Couban, Trials Search Co‐ordinators of the Cochrane Back Review Group, who updated the literature searches. We also thank Rob Scholten for his contributions to the original Cochrane review (Roelofs 2008).
Version history
| Published | Title | Stage | Authors | Version |
| 2016 Feb 10 | Non‐steroidal anti‐inflammatory drugs for chronic low back pain | Review | Wendy TM Enthoven, Pepijn DDM Roelofs, Richard A Deyo, Maurits W van Tulder, Bart W Koes | |
Differences between protocol and review
We excluded NSAIDs which are no longer available on the market, such as rofecoxib, from this Cochrane review. We had not previously stated this in the Cochrane protocol.
Keywords
MeSH
Medical Subject Headings (MeSH) Keywords
- Anti‐Inflammatory Agents, Non‐Steroidal [adverse effects, *therapeutic use];
- Chronic Pain [*drug therapy];
- Diclofenac [therapeutic use];
- Disability Evaluation;
- Ibuprofen [therapeutic use];
- Indomethacin [therapeutic use];
- Low Back Pain [*drug therapy];
- Pain Measurement;
- Piroxicam [therapeutic use];
- Randomized Controlled Trials as Topic;
Medical Subject Headings Check Words
Humans;
PICO

study flow diagram.

'Risk of bias' summary: review authors' judgements about each 'Risk of bias' item for each included trial.

'Risk of bias' graph: review authors' judgements about each 'Risk of bias' item presented as percentages across all included trials.

Funnel plot of comparison: 1 NSAIDs versus placebo, outcome: 1.1 Change in pain intensity from baseline on 100 mm VAS. Follow‐up ≤ 12 weeks.

Funnel plot of comparison: 1 NSAIDs versus placebo, outcome: 1.2 Change in disability from baseline.

Funnel plot of comparison: 1 NSAIDs versus placebo, outcome: 1.3 Proportion of patients experiencing adverse events. Follow‐up ≤ 16 weeks.
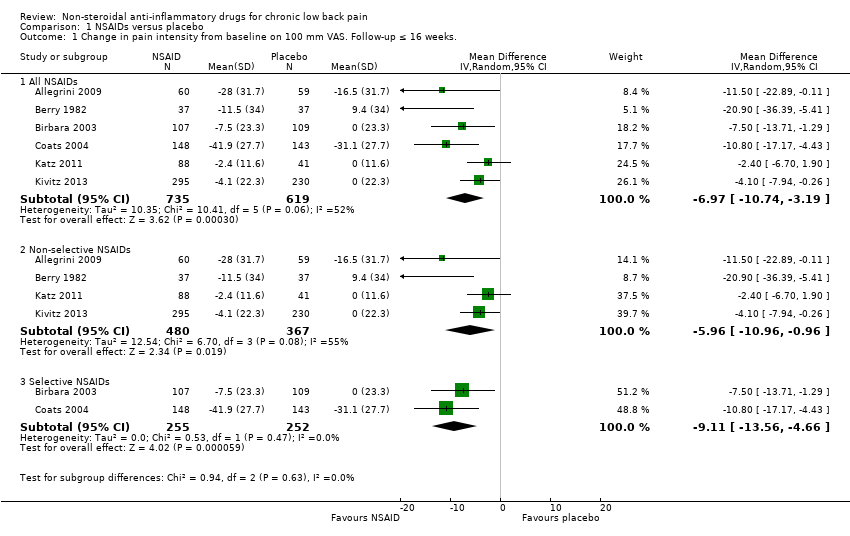
Comparison 1 NSAIDs versus placebo, Outcome 1 Change in pain intensity from baseline on 100 mm VAS. Follow‐up ≤ 16 weeks..

Comparison 1 NSAIDs versus placebo, Outcome 2 Change in disability from baseline.

Comparison 1 NSAIDs versus placebo, Outcome 3 Proportion of patients experiencing adverse events. Follow‐up ≤ 16 weeks..
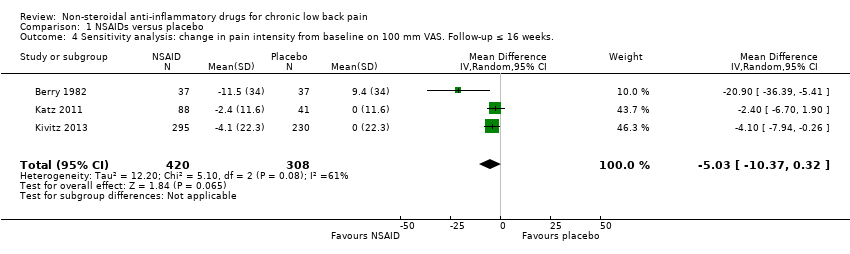
Comparison 1 NSAIDs versus placebo, Outcome 4 Sensitivity analysis: change in pain intensity from baseline on 100 mm VAS. Follow‐up ≤ 16 weeks..

Comparison 1 NSAIDs versus placebo, Outcome 5 Sensitivity analysis: change in disability from baseline.
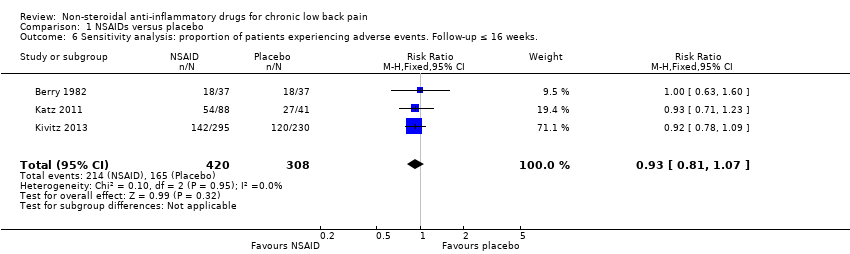
Comparison 1 NSAIDs versus placebo, Outcome 6 Sensitivity analysis: proportion of patients experiencing adverse events. Follow‐up ≤ 16 weeks..
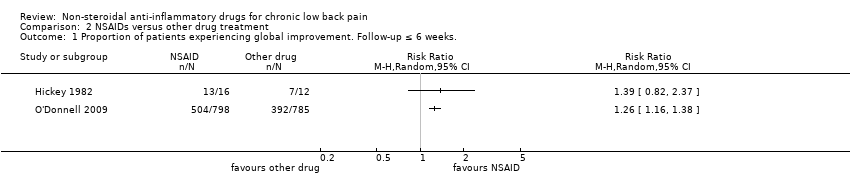
Comparison 2 NSAIDs versus other drug treatment, Outcome 1 Proportion of patients experiencing global improvement. Follow‐up ≤ 6 weeks..

Comparison 2 NSAIDs versus other drug treatment, Outcome 2 Proportion of patients experiencing adverse events. Follow‐up ≤ 6 weeks..
| NSAIDs for people with chronic low back pain compared to placebo | |||||
| Participant or population: people with chronic low back pain | |||||
| Outcomes | Illustrative comparative risks* (95% CI) | Relative effect | Number of participants | Quality of the evidence | |
| Assumed risk | Corresponding risk | ||||
| Control | NSAIDs | ||||
| Change in pain intensity from baseline | Not estimable | The mean change in pain intensity from baseline in the intervention groups was | ‐ | 1354 | ⊕⊕⊝⊝ |
| Change in disability from baseline | Not estimable | The mean change in disability from baseline in the intervention groups was | ‐ | 1161 | ⊕⊕⊝⊝ |
| Proportion of participants experiencing adverse events | Study population | RR 1.04 | 1354 | ⊕⊕⊝⊝ | |
| 410 per 1000 | 427 per 1000 | ||||
| Moderate | |||||
| 477 per 1000 | 496 per 1000 | ||||
| Sensitivity analysis: change in pain intensity from baseline | Not estimable | The mean sensitivity analysis change in pain intensity from baseline. in the intervention groups was | ‐ | 728 | ⊕⊕⊕⊝ |
| Sensitivity analysis: change in disability from baseline | Not estimable | The mean sensitivity analysis change in disability from baseline in the intervention groups was | ‐ | 654 | ⊕⊕⊕⊝ |
| Sensitivity analysis: proportion of participants experiencing adverse events. Follow‐up ≤ 16 weeks | Study population | RR 0.93 | 728 | ⊕⊕⊕⊝ | |
| 536 per 1000 | 498 per 1000 | ||||
| Moderate | |||||
| 522 per 1000 | 485 per 1000 | ||||
| *The basis for the assumed risk (e.g. the median control group risk across studies) is provided in footnotes. The corresponding risk (and its 95% CI) is based on the assumed risk in the comparison group and the relative effect of the intervention (and its 95% CI). | |||||
| GRADE Working Group grades of evidence | |||||
| 1Allocation concealment was uncertain in most included trials, and randomization was uncertain in half of the included trials, therefore selection bias is likely. Five out of six trials had high drop‐out rates, so attrition bias is likely, one level downgrade. | |||||
| Outcome or subgroup title | No. of studies | No. of participants | Statistical method | Effect size |
| 1 Change in pain intensity from baseline on 100 mm VAS. Follow‐up ≤ 16 weeks. Show forest plot | 6 | Mean Difference (IV, Random, 95% CI) | Subtotals only | |
| 1.1 All NSAIDs | 6 | 1354 | Mean Difference (IV, Random, 95% CI) | ‐6.97 [‐10.74, ‐3.19] |
| 1.2 Non‐selective NSAIDs | 4 | 847 | Mean Difference (IV, Random, 95% CI) | ‐5.96 [‐10.96, ‐0.96] |
| 1.3 Selective NSAIDs | 2 | 507 | Mean Difference (IV, Random, 95% CI) | ‐9.11 [‐13.56, ‐4.66] |
| 2 Change in disability from baseline Show forest plot | 4 | 1161 | Mean Difference (IV, Fixed, 95% CI) | ‐0.85 [‐1.30, ‐0.40] |
| 3 Proportion of patients experiencing adverse events. Follow‐up ≤ 16 weeks. Show forest plot | 6 | Risk Ratio (M‐H, Fixed, 95% CI) | Subtotals only | |
| 3.1 All NSAIDs | 6 | 1354 | Risk Ratio (M‐H, Fixed, 95% CI) | 1.04 [0.92, 1.17] |
| 3.2 Non‐selective NSAIDs | 4 | 847 | Risk Ratio (M‐H, Fixed, 95% CI) | 0.94 [0.82, 1.08] |
| 3.3 Selective NSAIDs | 2 | 507 | Risk Ratio (M‐H, Fixed, 95% CI) | 1.25 [1.00, 1.56] |
| 4 Sensitivity analysis: change in pain intensity from baseline on 100 mm VAS. Follow‐up ≤ 16 weeks. Show forest plot | 3 | 728 | Mean Difference (IV, Random, 95% CI) | ‐5.03 [‐10.37, 0.32] |
| 5 Sensitivity analysis: change in disability from baseline Show forest plot | 2 | 654 | Mean Difference (IV, Fixed, 95% CI) | ‐0.41 [‐1.04, 0.23] |
| 6 Sensitivity analysis: proportion of patients experiencing adverse events. Follow‐up ≤ 16 weeks. Show forest plot | 3 | 728 | Risk Ratio (M‐H, Fixed, 95% CI) | 0.93 [0.81, 1.07] |
| Outcome or subgroup title | No. of studies | No. of participants | Statistical method | Effect size |
| 1 Proportion of patients experiencing global improvement. Follow‐up ≤ 6 weeks. Show forest plot | 2 | Risk Ratio (M‐H, Random, 95% CI) | Totals not selected | |
| 2 Proportion of patients experiencing adverse events. Follow‐up ≤ 6 weeks. Show forest plot | 3 | Risk Ratio (M‐H, Random, 95% CI) | Totals not selected | |