Ecografía para la confirmación de la colocación de la sonda gástrica
Resumen
Antecedentes
Las sondas gástricas se utilizan habitualmente para la administración de fármacos y para la alimentación con sonda a los pacientes que no pueden tragar. La alimentación a través de una sonda colocada de manera inadecuada en la tráquea puede dar lugar a neumonía grave. Por lo tanto, es importante la confirmación de la colocación de la sonda en el estómago después de su inserción. Estudios recientes han informado que la ecografía proporciona una buena estimación de la exactitud diagnóstica en la confirmación de la colocación apropiada de la sonda. Por lo tanto, la ecografía podría ser una alternativa prometedora a los rayos X en la confirmación de la colocación de la sonda, en especial en ámbitos en los que los establecimientos con rayos X no están disponibles o es difícil acceder a ellos.
Objetivos
Evaluar la exactitud diagnóstica de la ecografía para confirmar la colocación de la sonda gástrica.
Métodos de búsqueda
Se hicieron búsquedas en la Cochrane Library (2016, número 3), MEDLINE (hasta marzo 2016), Embase (hasta marzo 2016), National Institute for Health Research (NIHR) PROSPERO Register (hasta mayo 2016), Aggressive Research Intelligence Facility Databases (hasta mayo 2016), ClinicalTrials.gov (hasta mayo 2016), ISRCTN registry (hasta mayo 2016), World Health Organization International Clinical Trials Registry Platform (hasta mayo 2016) y en listas de referencias de artículos, y se contactó con autores de los estudios.
Criterios de selección
Se incluyeron los estudios que evaluaron la exactitud diagnóstica de la colocación de la sonda nasogástrica y orogástrica confirmada mediante la visualización por ecografía en comparación con la visualización por rayos X como el estándar de referencia. Se incluyeron estudios transversales y estudios de casos y controles. Se excluyeron las series de casos clínicos o los informes de casos. Los estudios se excluyeron si la visualización por rayos X no fue el estándar de referencia o si la sonda que se colocó fue una sonda de gastrostomía o entérica.
Obtención y análisis de los datos
Dos autores de la revisión evaluaron de forma independiente el riesgo de sesgo y extrajeron los datos de cada uno de los estudios incluidos. Se estableció contacto con los autores de los estudios incluidos para obtener datos faltantes.
Resultados principales
Se identificaron diez estudios (545 participantes y 560 inserciones de sondas) que cumplieron con los criterios de inclusión.
A ningún estudio se le asignó bajo riesgo de sesgo ni baja preocupación en los dominios de QUADAS‐2. Sólo tres estudios (30%) se consideraron con bajo riesgo de sesgo en el dominio de selección de los participantes porque realizaron la ecografía después que confirmaron la posición correcta por otros métodos.
Hubo pocos datos (43 participantes) disponibles para la detección de la colocación inadecuada (especificidad) debido a que su incidencia fue baja. No se realizó un metanálisis debido a la considerable heterogeneidad en la prueba índice, como la diferencia de la ventana del eco, la combinación de la ecografía con otros métodos de confirmación (p.ej. visualización del flujo de solución salina por ecografía) y la ecografía durante la inserción de la sonda. En todos los contextos el cálculo de la sensibilidad de los estudios individuales varió de 0,50 a 1,00 y el cálculo de la especificidad de 0,17 a 1,00. En los contextos en los que los rayos X no estuvieron fácilmente disponibles y a los participantes se les insertó una sonda gástrica para drenaje (cuatro estudios, 305 participantes), los cálculos de la sensibilidad de la ecografía en combinación con otras pruebas confirmatorias variaron de 0,86 a 0,98 y los cálculos de la especificidad de 1,00, con intervalos de confianza amplios.
En los estudios que utilizaron la ecografía sola (cuatro estudios, 314 participantes), los cálculos de la sensibilidad variaron de 0,91 a 0,98 y los cálculos de la especificidad de 0,67 a 1,00.
Conclusiones de los autores
De diez estudios que evaluaron la exactitud diagnóstica de la colocación de la sonda gástrica, pocos tuvieron bajo riesgo de sesgo. Según la evidencia limitada, la ecografía no tiene exactitud suficiente como prueba única para confirmar la colocación de la sonda gástrica. Sin embargo, en ámbitos en los que los rayos X no están fácilmente disponibles, la ecografía puede ser útil para detectar una sonda gástrica con una colocación inadecuada. Se necesitan estudios más grandes para determinar la posibilidad de eventos adversos cuando se utiliza la ecografía para confirmar la colocación de la sonda.
Resumen en términos sencillos
Examen por ecografía para la confirmación de la colocación de la sonda gástrica
Antecedentes
Cada año en los EE.UU. aproximadamente 1 000 000 de pacientes reciben alimentación por sonda (sonda gástrica). Las sondas gástricas se utilizan habitualmente para administrarles fármacos y alimentación directamente en el sistema digestivo (conducto para la digestión de los alimentos) a los pacientes que no pueden tragar. La alimentación a través de una sonda que está colocada de forma inadecuada en la tráquea (conducto del aire) puede dar lugar a neumonía grave (infección de los pulmones). Por lo tanto, es importante la confirmación de la colocación de la sonda en el estómago después de su inserción. Las sondas gástricas también se utilizan para reducir la presión del estómago después de proporcionar asistencia respiratoria a través de máscaras, utilizadas principalmente en la reanimación. La ecografía médica es una de las técnicas de imagenología que utilizan ondas sonoras para crear imágenes del interior del cuerpo. Estudios recientes indican que la ecografía proporciona una buena exactitud diagnóstica para la confirmación de la colocación apropiada de la sonda. Por lo tanto, la ecografía podría ser una alternativa prometedora a los rayos X para confirmar la colocación de la sonda, especialmente cuando los rayos X no están disponibles o es difícil acceder a ellos.
Características de los estudios
Los estudios incluidos en esta revisión están actualizados hasta marzo de 2016. Se incluyeron diez estudios con 545 participantes que evaluaron la exactitud diagnóstica de la ecografía para la confirmación de la colocación de la sonda gástrica.
Resultados clave
La mayoría de los estudios mostraron un buen rendimiento para la colocación correcta de la sonda. Sin embargo, hubo pocos datos disponibles para la colocación incorrecta de la sonda y las posibles complicaciones de una sonda colocada de forma inadecuada. Entre los estudios incluidos, en sólo 43 participantes la sonda estaba colocada de forma inadecuada. Ninguno de los estudios informó complicaciones durante la realización de la ecografía. Se informaron tres métodos de ecografía: el enfoque del cuello, el enfoque del abdomen (barriga) superior y una combinación de ambos. Ninguno de los estudios incluidos indicó que la ecografía tuvo exactitud suficiente como prueba única para la confirmación de la colocación de la sonda gástrica para la alimentación. Por otra parte, la ecografía combinada con otras pruebas (p.ej. la visualización del flujo de solución salina [inyectar solución salina a través de la sonda y verla dentro del estómago por ecografía]) podría ser útil para la confirmación de la sonda utilizada para el drenaje gástrico.
Limitaciones de la revisión
En general, los estudios tenían una calidad metodológica baja o poco clara. Se consideró que sólo tres (30%) de los diez estudios incluidos fueron representativos de los pacientes en la práctica porque la ecografía se realizó después de confirmar la posición correcta mediante otros métodos. Los estudios presentaron diversos resultados para la colocación inadecuada de la sonda.
Investigación futura
Se necesitan estudios más grandes que investiguen si la ecografía podría reemplazar los rayos X para confirmar la colocación de la sonda gástrica, así como si la ecografía podría reducir las complicaciones graves de una sonda colocada inadecuadamente, como la neumonía.
Authors' conclusions
Summary of findings
| Accuracy of ultrasound for confirmation of gastric tube placement | |||||||||
| Population | Adults in any settings (prehospital, ICU, EMS or unclear) | ||||||||
| Index test | Ultrasound (any methods) | ||||||||
| Reference standard | X‐ray | ||||||||
| Studies | Cross‐sectional study or unclear study designa | ||||||||
| Study ID | TPb | FPb | FNb | TNb | Participants | Sensitivity | Specificity | Methodc | Echo windowc |
| 17 | 10 | 17 | 2 | 46 | 0.50 (0.32 to 0.68) | 0.17 (0.02 to 0.48) | Ultrasound + air injection after insertion | NR | |
| Brun 2012a,d | 80 | 0 | 8 | 8 | 96 | 0.91 (0.83 to 0.96) | 1.00 (0.63 to 1.00) | Ultrasound after insertion | Epigastric |
| 27 | 0 | 1 | 4 | 32 | 0.96 (0.82 to 1.00) | 1.00 (0.40 to 1.00) | Ultrasound + air injection after insertion | Neck + epigastric | |
| 116 | 0 | 2 | 12 | 130 | 0.98 (0.94 to 1.00) | 1.00 (0.74 to 1.00) | Ultrasound after insertion | Epigastric | |
| 52 | 0 | 4 | 0 | 56 | 0.93 (0.83 to 0.98) | Not estimable | Ultrasound during insertion | Neck | |
| 38 | 1 | 6 | 2 | 47 | 0.86 (0.73 to 0.95) | 0.67 (0.09 to 0.99) | Ultrasound + saline and air injection | Neck + epigastric | |
| 43 | 0 | 15 | 2 | 55 (60 measurements)e | 0.74 (0.61 to 0.85) | 1.00 (0.16 to 1.00) | Ultrasound + air injection after insertion | Epigastric | |
| 15 | 0 | 1 | 0 | 16 | 0.94 (0.70 to 1.00) | Not estimable | Ultrasound + dextrose and air injection after insertion | NR | |
| 28 | 0 | 2 | 2 | 32 | 0.93 (0.78 to 0.99) | 1.00 (0.16 to 1.00) | Ultrasound after insertion | Neck + epigastric | |
| 34 | 0 | 1 | 0 | 35 | 0.97 (0.85 to 1.00) | Not estimable | Ultrasound + saline injection after insertion | Epigastric | |
| CI: confidence interval; EMS: emergency medical service; ICU: intensive care unit: FN: false negative; FP: false positive; NR: not reported; TN: true negative; TP: true positive. | |||||||||
| Accuracy of ultrasound for confirmation of gastric tube placement for drainage in settings where X‐ray facilities are not readily available | |||||||||
| Population | Adults underwent gastric tube insertion for drainage in settings where X‐ray facilities are not readily available (prehospital or EMS) | ||||||||
| Index test | Ultrasound (any methods) | ||||||||
| Reference standard | X‐ray | ||||||||
| Studies | Cross‐sectional study or unclear study designa | ||||||||
| Study ID | TPb | FPb | FNb | TNb | Participants | Sensitivity | Specificity | Methodc | Echo windowc |
| Brun 2012c,d | 80 | 0 | 8 | 8 | 96 | 0.91 (0.83 to 0.96) | 1.00 (0.63 to 1.00) | Ultrasound after insertion | Epigastric |
| 27 | 0 | 1 | 4 | 32 | 0.96 (0.82 to 1.00) | 1.00 (0.40 to 1.00) | Ultrasound+ air injection after insertion | Neck + epigastric | |
| 116 | 0 | 2 | 12 | 130 | 0.98 (0.94 to 1.00) | 1.00 (0.74 to 1.00) | Ultrasound after insertion | Epigastric | |
| 38 | 1 | 6 | 2 | 47 | 0.86 (0.73 to 0.95) | 0.67 (0.09 to 0.99) | Ultrasound + saline and air injection | Neck + epigastric | |
| CI: confidence interval; EMS: emergency medical service; FN: false negative; FP: false positive; TN: true negative; TP: true positive. | |||||||||
Background
Gastric tubes are commonly used for the administration of drugs and delivery of nutrition directly into the gastrointestinal tract (enteral feeding) for people who are unable to swallow (e.g. people after stroke, or who need respirator support) (NICE 2006; Samuels 2013). Placement of a gastric tube is performed by inserting the tube through the nose (nasogastric tube) or mouth (oral gastric or orogastric tube), down the oesophagus and into the stomach (ENA 2015; Samuels 2013). Generally, doctors or nurses insert the tubes by pushing the tube into the nose or mouth. Gastrectomy tubes (G‐tubes) are a type of gastric tube inserted into the stomach; however, they are inserted via the abdominal wall rather than the nose or mouth. This review will focus on nasogastric and orogastric tubes.
Each year approximately one million people receive tube feeding in the US (Metheny 1999). Gastric tubes are also used for the decompression of the gastrointestinal tract after the application of a bag valve mask, which is mainly used in resuscitation (Chenaitia 2012). Gastric tubes, made primarily from flexible polyurethane, and sometimes latex, silicone or polyurethane, require regular replacement if used for extended periods (Samuels 2013). In addition, tubes sometimes require unscheduled replacement due to dislodgement caused by vomiting or blockages (Thomson 2000). Gastric feeding tubes are associated with the recognised risk of misplacement into the trachea (airway) through the larynx due to the close proximity of the larynx to the oesophagus. During insertion, the tubes might enter the trachea through the larynx. Feeding via a tube misplaced in the trachea can result in severe pneumonia, pneumothorax, empyema and pulmonary haemorrhage. Therefore, the confirmation of tube placement in the stomach after insertion is important (Kawati 2005). Recommended methods to confirm correct tube placement are X‐ray visualization and suction of gastric fluids (AACCN 2009). In a prehospital situation, a combination of the suction method and auscultation is used (Chenaitia 2012).
Medical ultrasound is one of the diagnostic imaging techniques using ultrasound wave. Studies from the same research group have demonstrated that ultrasonography provides good diagnostic accuracy estimates in the confirmation of appropriate tube placement (Brun 2014; Chenaitia 2012). These studies focused on tube placement for decompression of the stomach after the administration of a bag valve mask in a prehospital situation where X‐ray was not available. Therefore, ultrasound could provide a promising alternative to X‐rays in the confirmation of tube placement, especially in settings where X‐ray facilities are unavailable or difficult to use.
Target condition being diagnosed
Appropriate gastric tube placement for any reason.
Index test(s)
Ultrasound test for gastric tube confirmation that visualizes the tubes via both the neck and abdomen, regardless of frequency of ultrasound, probe shape (linear or convex) or probe size. The test is performed in both prone and sitting position and can also be performed at the bedside. Visualization of the tubes is generally from the neck, abdomen, or both. Direct visualization of tubes in the oesophagus or stomach is interpreted as correct placement. During visualization, saline or air flush of the tube may help to visualize it by showing dynamic fogging in the stomach (Kim 2012).
Clinical pathway
People may need a gastric tube for the administration of drugs, enteral feeding or drainage. In these situations, the gastric tube is inserted via the nose or mouth, down the oesophagus and into the stomach.
After the gastric tube is inserted, its location should be promptly confirmed before proceeding with feeding or drug administration (AACCN 2009). This is by either suction of gastric fluids (visual inspection of aspirate contents or checking of pH) or the auscultation method (instillation of air in the tube with sounds heard simultaneously through a stethoscope placed over the stomach region) or both may be performed as prior tests (AACCN 2009; Chenaitia 2012). Tube placement is usually confirmed by X‐ray visualization of the tube (e.g. chest X‐ray).
Ultrasound may be used as a replacement test for X‐ray. During the test, saline or air flush of the tube may help to visualize it.
In addition, if the person with the tube placement has vomited, retched or coughed, or if oropharyngeal suction was needed, the tube will require regular checking every four hours during daily feeding or in cases of suspected tube dislodgement (Holland 2013).
Prior test(s)
Either suction of gastric fluids (visual inspection of aspirate contents) or the auscultation method (instillation of air in the tube with sounds heard simultaneously through a stethoscope placed over the stomach region), or both are possibly performed as prior tests (AACCN 2009; Chenaitia 2012). In a prehospital situation, a combination of the suction and the auscultation method is possibly used (Chenaitia 2012). If one of these tests showed misplacement, reinsertion of the tube is needed.
Role of index test(s)
The role of ultrasound is assumed as a replacement test for X‐ray visualization. The downstream consequences according to the four test accuracy categories are as follows:
-
no need for further testing for TP (true positive) = correct gastric tube placement and correct visualization by ultrasound;
-
serious accidents of feeding via a tube misplaced in the trachea or no effective drainage of gastric contents via a tube misplaced in the trachea for FP (false positive) = incorrect gastric tube placement but not visualized by ultrasound;
-
useless reinsertion of the tube and retesting for FN (false negative) = correct gastric tube placement but not visualized by ultrasound;
-
safe feeding or effective drainage of gastric contents for TN (true negative) = incorrect gastric tube placement and correct visualization by ultrasound.
Alternative test(s)
X‐ray visualization is generally used to assess appropriate tube placement (Bourgault 2009). Although the risk of cancer from X‐rays is not conclusive, concerns regarding the risks associated with frequent exposure to X‐rays exist (Berrington 2004).
In addition, pH test of aspirate is used. The National Patient Safety Agency reported if pH is between 1 and 5.5, it is safe to start feeding (Lamont 2011; National Patient Safety Agency 2011). If pH is between 5 and 6, it is recommended that checking of the pH with a competent colleague (double checking is needed because misinterpretations of pH is possible) (Lamont 2011).
Rationale
The use of ultrasonography to assess appropriate tube placement has the potential to reduce patient discomfort. Confirmation by X‐ray visualization can be difficult for people with tube placement because they have to change their body position to have a hard film plate placed on their back, or stand up for scanning while dealing with uncomfortable tubes hanging from their nose or mouth. An ultrasound test, by comparison, can be performed at the bedside without the need for the person to sit up or change position, and can, therefore, reduce the discomfort of the procedure for the patient (Vigneau 2005).
Ultrasonography can also widen accessibility to confirmatory testing outside of the hospital environment. As some ultrasound devices are portable, medical care providers who visit patients in the home can use ultrasound to check appropriate tube placement. Patients need not visit the hospital for insertion and confirmation of nasogastric or orogastric feeding tubes, which is an important consideration in the primary care setting (Mariani 2010).
The National Patient Safety Agency recommends that before using feeding tubes, repeated placement checks should be performed by X‐ray or pH of aspirate measured at least once daily (National Patient Safety Agency 2011). X‐rays should be avoided for children as much as possible due to concerns about the risk of irradiation (Frush 2003). Although the dose of irradiation by chest or abdominal X‐rays is small according to the linear non‐threshold model used in risk assumption, reducing irradiation as much as possible is of value to people of all ages (Berrington 2004; CNSC 2013).
We hypothesized that ultrasound could be a beneficial alternative to X‐ray visualization since ultrasound devices have become common not only in critical care but also in primary care or prehospital settings.
Objectives
To assess the diagnostic accuracy of ultrasound for gastric tube placement confirmation.
Secondary objectives
To assess the diagnostic accuracy of ultrasound for gastric tube placement confirmation in children (aged 16 years or less).
To investigate the potential sources of heterogeneity, we planned to assess the effects of the following factors on the diagnostic accuracy of ultrasound: body mass index (BMI), clinical setting (emergency setting or not), tube diameter and area of visualization (the neck, abdomen, or both).
Methods
Criteria for considering studies for this review
Types of studies
We included studies that evaluated the diagnostic accuracy of naso‐ and orogastric tube placement confirmed by ultrasound visualization and using X‐ray visualization as the reference standard. We included cross‐sectional studies and case‐control studies. We excluded case series or case reports (Bossuyt 2008). We excluded studies where X‐ray visualization was not the reference standard or if the tube being placed was a gastrostomy or enteric tube. We defined gastrostomy tubes as tubes for percutaneous enteric access and enteric tubes as both nasal or oral gastrojejunal tubes and small bowel tubes (Schattner 1997). We excluded studies if we could not extract TP, FN, FP and TN values.
Participants
Both adults (aged greater than 16 years) and children (aged 16 years or less) who needed gastric tube placement.
Index tests
Ultrasonographic confirmation of gastric tube placement. We included all studies regardless of where the ultrasound test was performed (e.g. bedside or X‐ray department) or who performed and interpreted the test (e.g. ultrasonographer or physician).
Target conditions
The target condition was appropriate gastric tube placement for any reason.
Reference standards
The reference standard was X‐ray of the chest or abdomen (X‐ray visualization). If misinterpretation of the X‐ray was not reported in the included studies, we considered X‐ray of the chest or abdomen to have 100% sensitivity and 100% specificity.
Search methods for identification of studies
Electronic searches
We systematically searched the following databases:
-
the Cochrane Library databases (Cochrane Reviews and other reviews, the Cochrane Central Register of Controlled Trials (CENTRAL) and technology assessments) (2016, issue 2) (Appendix 2)
-
MEDLINE (Ovid MEDLINE(R) In‐Process & Other Non‐Indexed Citations and Ovid MEDLINE(R) 1946 to 2016 February) (Appendix 3);
-
Embase (OvidSP) (1974 to 2016 February) (Appendix 4);
-
National Institute for Health Research (NIHR) PROSPERO Register (up to 2016 May) (www.crd.york.ac.uk/prospero/);
-
Aggressive Research Intelligence Facility Databases (ARIF) (up to 2016 May) (www.arif.bham.ac.uk/databases.shtml);
-
ClinicalTrials.gov (up to 2016 May) (clinicaltrials.gov/);
-
the International Clinical Trials Registry Platform (ISRCTN) registry (up to 2016 May) (www.isrctn.com/);
-
World Health Organization (WHO) International Clinical Trials Registry Platform (ICTRP) (up to 2016 May) (www.who.int/ictrp/en/).
We used controlled indexing terms and free‐text terms as well as variations of root words. Key terms related to 'ultrasound' were combined using the set operator "AND" with key terms related to 'stomach tube'. We excluded animal studies.
We applied no language restrictions.
Searching other resources
We searched for additional references by cross‐checking bibliographies of retrieved full‐text papers. We searched citations and references using Scopus (www.elsevier.com/solutions/scopus). We contacted common manufacturers of ultrasound devices to seek additional or unpublished studies.
We contacted the top five manufacturing companies according to their global market share in ultrasound devices: GE Healthcare, Philips, Hitachi‐Aloka, Toshiba and Siemens (Ministry of Economy, Trade and Industry 2013).
Data collection and analysis
Selection of studies
We undertook the systematic review using the methods outlined in the Cochrane Handbook for Systematic Reviews of Interventions (Higgins 2011) and the Cochrane Handbook for Reviews of Diagnostic Test Accuracy (Deeks 2010). Two review authors (HT and YK or MU) independently reviewed titles and abstracts identified by the search strategy. HT and YT retrieved the full text of potentially relevant studies and independently assessed the full text against the eligibility criteria outlined in the Criteria for considering studies for this review section. We resolved differences by consensus. We provided details of both included and excluded studies in the Characteristics of included studies and Characteristics of excluded studies tables.
Data extraction and management
The two review authors (HT and YK) independently extracted data on study characteristics, participant demographics, sample size, test methods, methodological quality, sensitivity and specificity. Then, both review authors extracted data to construct a 2 × 2 contingency table including TP = correct gastric tube placement and correct visualization by ultrasound; FP = incorrect gastric tube placement but failure to visualize by ultrasound; FN = correct gastric tube placement but failure to visualize by ultrasound; TN = incorrect gastric tube placement and correct visualization by ultrasound. We resolved disagreements by consensus and with the help of the other investigator (YT).
Assessment of methodological quality
We used the QUADAS‐2 tool to assess the quality of studies (Whiting 2011). We recorded the assessment on in the Characteristics of included studies table. The qualities assessed were described in detail in Appendix 5. For each item in the quality assessment form, we included a description of how the study addressed the issue and entered a judgement of 'low', 'high' or 'unclear' for an overall risk of bias for each of the four domains. In addition, we added a judgement of 'low', 'high' and 'unclear' for the overall concern of applicability to the review question for domains one, two and three. We presented an Assessment of methodological quality, which showed all judgements made for all included studies. Two review authors (HT and YK or YT) independently assessed methodological quality. We resolved disagreements by discussion between the review authors, with a further review author acting as an arbiter (YT or YK).
Statistical analysis and data synthesis
We planned to analyze data using the methods recommended in the Cochrane Handbook for Systematic Reviews of Diagnostic Test Accuracy (Deeks 2010). We assumed that the data were binary (either appropriate placement, or not). Therefore, no threshold or cut‐off value for positivity was required. For each study, the sensitivity, specificity, positive and negative likelihood ratios, and diagnostic odds ratio (Glas 2003) for the detection of appropriate gastric tube placement were calculated from the 2 × 2 contingency table. If these counts were unavailable, we contacted the original authors of the study.
If any misinterpretation of the X‐ray was reported, we planned to construct another 2 × 2 contingency table that took the misinterpretation into account. For the table, if misplacement of the tubes was interpreted as correct placement by X‐ray, we planned to ignore the X‐ray result and treat the outcome as misplacement. If appropriate placement of the tubes was interpreted as misplacement by X‐ray, we planned to ignore the X‐ray result and treat the outcome as appropriate placement. In addition, we planned to perform sensitivity analyses.
For the meta‐analysis, if quantitative data synthesis was acceptable, we planned to use a bivariate random‐effects model to determine summary estimates of sensitivity and specificity with 95% confidence and prediction regions (Reitsma 2005). We planned to create a summary receiver‐operator curve (sROC).
We planned to present the bivariate mean estimates of sensitivity and specificity graphically along with their corresponding 95% confidence ellipses.
All analyses were to be undertaken using Review Manager 5 (RevMan 2014), or STATA software, version 13.0 (Stata).
Investigations of heterogeneity
If sufficient studies were available, we planned to investigate the following potential sources of heterogeneity by adding variables to the meta‐regression model and using the command xtmelogit in Stata (Harbord 2009; Takwoingi 2013): effects of obesity (BMI over 30 or not), effects of tube diameter (up to 14 Fr or 16 Fr and above) and area of visualization (the neck, abdomen, or both).
Sensitivity analyses
We planned to perform sensitivity analyses stratified by methodological quality as per the QUADAS‐2 tool domain and planned to carry out the following sensitivity analyses to explore the robustness of the results:
-
excluding studies of non‐sedated people;
-
excluding studies of intubated people;
-
excluding studies of orogastric tubes;
-
excluding studies including reported X‐ray misinterpretation.
The reason for excluding non‐sedated people was because the gag reflex of non‐sedated people may suggest tracheal insertion of the gastric tube which may affect the diagnostic accuracy of the ultrasound. For intubated people, the tube may be difficult to visualize in the oesophagus behind the trachea, or the tracheal tube itself may block the gastric tube from entering the trachea. We anticipated that there were no differences between the diagnostic accuracy of the nasogastric and orogastric tubes and confirmed the assumption using sensitivity analysis. In addition, we anticipated that we would identify other relevant factors to include in the sensitivity analyses as we went through the process of reviewing the identified studies. We specified the criteria for the sensitivity analyses in the review rather than to predefine them at the protocol stage.
Assessment of reporting bias
We did not explore reporting bias due to a lack of suitable statistical methods (Deeks 2013).
Results
Results of the search
We identified 953 references through the electronic searches of CENTRAL (26 records), MEDLINE (330), and Embase (597). One record was identified through other sources (citation search of relevant guidelines). No additional reports were identified through NIHR Prospero Register, ARIF, ClinicalTrials.gov, ISRCTN registry or WHO ICTRP.
We excluded 147 duplicates from the electronic searches. We then excluded 791 records through reading the titles and abstracts. We retrieved 19 references for further assessment. Of the 19 references, we excluded nine for the reasons listed in the Characteristics of excluded studies table. This resulted in the inclusion of 10 references of 10 studies. Results of the search are displayed in Figure 1. We identified no additional reports through citation search of included studies or inquiry of manufacturing companies.
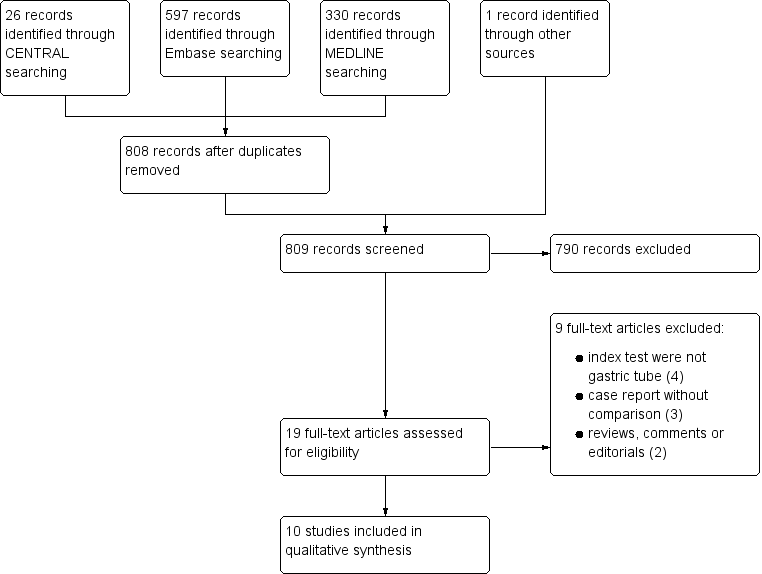
Study flow diagram.
Methodological quality of included studies
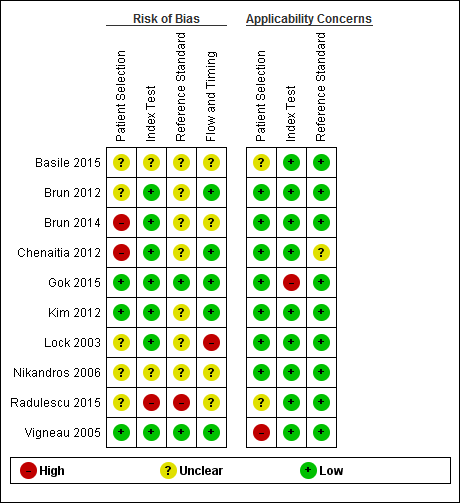
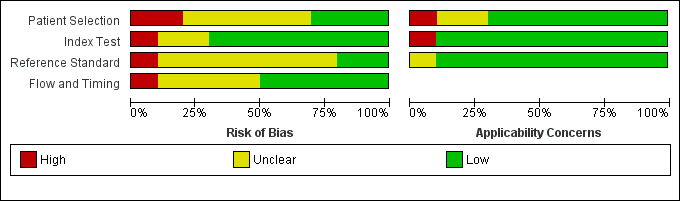
The methodological quality of the included studies is shown in the Characteristics of included studies table, Figure 2, and Figure 3.

Risk of bias and applicability concerns graph: review authors' judgements about each domain presented as percentages across included studies.
Risk of bias and applicability concerns summary: review authors' judgements about each domain for each included study.
No study was assigned low risk of bias or low concern in every QUADAS‐2 domain assessed. Two studies presented high risk of participant selection bias because they performed the index test after they confirmed correct position by whoosh test or auscultation (Brun 2014; Chenaitia 2012), five had unclear risk (Basile 2015; Brun 2012; Lock 2003; Nikandros 2006; Radulescu 2015), and three demonstrated low risk (Gok 2015; Kim 2012; Vigneau 2005).
One study presented high risk of index test interpretation bias because a single examiner interpreted the index test and the reference standard (Radulescu 2015), two had unclear risk (Basile 2015; Nikandros 2006), and seven demonstrated low risk (Brun 2012; Brun 2014; Chenaitia 2012; Gok 2015; Kim 2012; Lock 2003; Vigneau 2005).
We considered that one study has high risk of bias in the reference standard because the use of prespecified criteria was unclear and the same person interpreted all the results of X‐ray and ultrasound (Radulescu 2015). Seven studies presented unclear risk of reference standard interpretation bias (Basile 2015; Brun 2012; Brun 2014; Chenaitia 2012; Kim 2012; Lock 2003; Nikandros 2006), and two demonstrated low risk (Gok 2015: Vigneau 2005).
One study presented high risk of bias in the 'flow and timing' domain because they reported the possibility of long time gap (greater than four hours) between the index test and the reference standard (Lock 2003), four had unclear risk (Basile 2015; Brun 2014; Nikandros 2006; Radulescu 2015), and five demonstrated low risk (Brun 2012; Chenaitia 2012; Gok 2015; Kim 2012; Vigneau 2005). In the 'flow and timing' domain, time gap presents a risk of bias because a person may feel uncomfortable when a tube remains in a misplaced position for a long time.
Findings
Characteristics of participants
Overall, we included 545 participants and 560 tube insertions for this review. The number of appropriate tube placements was 492 insertions (88%) and the number of misplacements was 68 insertions (12%). The mean age of participants in the included studies was about 50 to 60 years old (some studies did not report the range) (Table 1). None of the included studies assessed the diagnostic accuracy of ultrasound for gastric tube placement confirmation in children (aged 16 years or less).
| Study ID | Male:female | Age | BMI | Children | Non‐sedated | Sedated | Intubated | Diameter | Setting |
| NR | NR | NR | NR | NR | NR | NR | NR | NR | |
| 56:24 | 52 ± 23 | NR | 0 | 0 | 96 | 96 | 14 or 16 | Prehospital | |
| 18:14 | 57 ± 17 | NR | 0 | 22 | 10 | 32 | 14 or 16 | Prehospital | |
| 77:53 | 55.7 ± 19.8 | NR | 0 | 0 | 130 | 130 | 14‐18 | Prehospital | |
| 32:24 | 48.4 ± 28.9 | 27.1 ± 6.4 | 0 | 0 | 56 | 56 | 10‐14 | ICU | |
| 28:19 | 57.6 ± 17.2 | NR | 0 | 0 | 47 | 27 | 16 | EMS | |
| NR | 59.2 ± 16.2 | NR | NR | NR | NR | 50 | 14 or 16 | ICU | |
| 9:7 | 66.3 ± 7.1 | NR | NR | 0 | 16 | 16 | NR | ICU | |
| NR | N/R | NR | NR | NR | NR | NR | NR | NR | |
| 18:16 | 62.2 ± 19.8 | 24.8 ± 5.8 | 0 | 14 | 19 | 26 | 12 | ICU |
BMI: body mass index; EMS: emergency medical service; ICU: intensive care unit; NR: not reported; SD: standard deviation.
a Reports from the same research group.
Participants of five studies were all intubated (Brun 2012; Brun 2014; Chenaitia 2012; Gok 2015; Nikandros 2006). Over half of participants of two studies were intubated (78.8% of Vigneau 2005; 57.4% of Kim 2012). One study of 55 participants reported that 50 (83.3%) of 60 of tube insertions were performed in intubated participants (Lock 2003). The number of intubated participants in two studies was unclear (Basile 2015; Radulescu 2015). One study included 14 (42.4%) non‐sedated participants (Vigneau 2005). One study of 55 participants reported that nine (15.0%) from 60 tube insertions were performed in non‐sedated participants (Lock 2003). Participants of seven studies were either sedated or intubated (Brun 2012; Brun 2014; Chenaitia 2012; Gok 2015; Kim 2012; Lock 2003; Nikandros 2006). The number of non‐sedated participants in two studies was unclear (Basile 2015; Radulescu 2015). Studies that provided demographic details of participants reported roughly equal numbers of males and females. Four studies were an intensive care unit (ICU) setting (Gok 2015; Lock 2003; Nikandros 2006; Vigneau 2005). Three studies were prehospital settings (Brun 2012; Brun 2014; Chenaitia 2012). One study was in the emergency medical service (EMS) (Kim 2012). It was considered that ultrasound was performed at the bedside in eight studies (Brun 2012; Brun 2014; Chenaitia 2012; Gok 2015; Kim 2012; Lock 2003; Nikandros 2006; Vigneau 2005). Two studies had an unknown setting (Basile 2015; Radulescu 2015). Two studies reported mean participant BMI of 27.1 (Gok 2015) and 24.8 (Vigneau 2005). Diameter of inserted tubes ranged from 10 Fr to 18 Fr.
Characteristics of the index test and the reference standard
We found several methods of ultrasound to confirm gastric tubes using ultrasound (see summary of findings Table 1). Four studies reported the diagnostic accuracy of ultrasound alone (Brun 2012; Chenaitia 2012; Gok 2015; Radulescu 2015), while the others reported the diagnostic accuracy of ultrasound combined with other confirmation method (Basile 2015; Brun 2014; Kim 2012; Lock 2003; Nikandros 2006; Vigneau 2005). One study reported the diagnostic accuracy of ultrasound during tube insertion (ultrasound‐guide insertion) (Gok 2015). We found three visualization methods (echo window) of ultrasound: neck approach (Gok 2015), epigastric approach (Brun 2012; Chenaitia 2012; Kim 2012; Lock 2003; Vigneau 2005), and a combination of both (Brun 2014; Radulescu 2015). Two studies used air injection during ultrasound (Basile 2015; Brun 2014). One study used saline injection (Vigneau 2005). One study used both air and saline injection (Kim 2012). One study used dextrose and air injection (Nikandros 2006). Two studies did not report the echo window (Basile 2015; Nikandros 2006). None of the studies reported any complications related to ultrasound test. One study reported the performers of ultrasound were trained nurses (Basile 2015). In other studies, the performers of the ultrasound were emergency medicine specialists (Kim 2012), experienced examiners/practitioners (Lock 2003), emergency physicians (Brun 2014), intensive care physicians following two‐hour training course (Vigneau 2005), emergency physician following a one‐day training course (Chenaitia 2012), staff experienced in ultrasonography (Gok 2015), prehospital services doctors trained in extended Focused Assessment with Sonography for Trauma (eFAST) examination (Brun 2012), and unclear (Nikandros 2006; Radulescu 2015). It was considered that the performers interpreted the results. All included studies used X‐ray as a reference standard. No misinterpretation of X‐ray among gastric tube position (revealed by other reliable clinical tests) was reported.
Diagnostic accuracy estimates of included studies
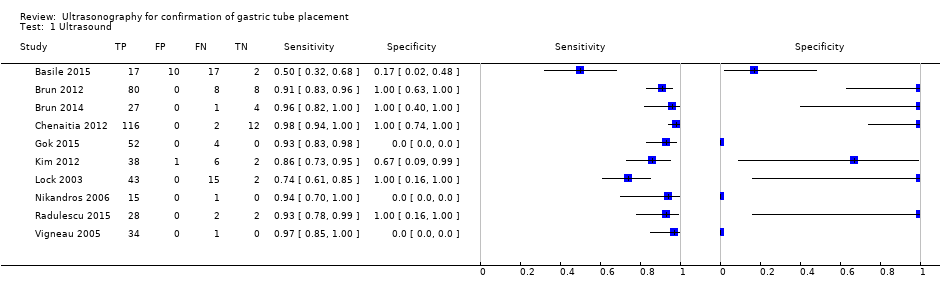
We considered the studies to differ in important ways clinically, therefore, we did not perform a meta‐analysis to determine summary diagnostic accuracy estimates of ultrasound. We described diagnostic accuracy estimates of the individual studies in any settings in summary of findings Table 1 and Figure 4. We separately described the diagnostic accuracy of ultrasound for confirmation of gastric tube placement for drainage in settings where X‐ray facilities were not readily available for the clinical implications (summary of findings Table 2). Three studies had lower accuracy estimates than those of the other studies (Basile 2015; Kim 2012; Lock 2003) (summary of findings Table 1; Figure 4). Basile and colleagues reported a sensitivity of 0.50 (95% confidence interval (CI) 0.32 to 0.68) and specificity of 0.17 (95% CI 0.02 to 0.48) (Basile 2015). Kim and colleagues reported a sensitivity of 0.86 (95% CI 0.73 to 0.95) and specificity of 0.67 (95% CI 0.09 to 0.99) (Kim 2012). Lock and colleagues reported a sensitivity of 0.74 (95% CI 0.61 to 0.85) and specificity of 1.00 (95% CI 0.16 to 1.00) (Lock 2003).

Forest plot of diagnostic accuracy of ultrasound in different ways. Four studies reported the diagnostic accuracy of ultrasound (Brun 2012; Chenaitia 2012; Gok 2015; Radulescu 2015), while the others reported the diagnostic accuracy of ultrasound combined with other methods. Gok 2015 reported the diagnostic accuracy of ultrasound during tube insertion (ultrasound‐guide insertion). We found three visualization methods (echo window) of ultrasound: neck (Gok 2015), epigastric (Brun 2012; Chenaitia 2012; Kim 2012; Lock 2003; Vigneau 2005), and a combination (Brun 2014; Radulescu 2015). Studies used air injection during ultrasound (Basile 2015; Brun 2014), saline injection (Vigneau 2005), both air and saline injection (Kim 2012), and dextrose and air injection (Nikandros 2006). Two studies did not report the echo window (Basile 2015; Nikandros 2006).
Discussion
Summary of main results
This review assessed the diagnostic accuracy of ultrasound for gastric tube placement confirmation. Most results showed high point estimates for correct tube detection (sensitivity) (Figure 4). However, there was a variety of point estimates for misplacement detection (specificity) and their CIs were wide due to the small sample of misplacement (Figure 4). We found considerable clinical heterogeneity among the included studies in terms of the difference of echo window, combination of ultrasound with other methods (e.g. saline flush visualization by ultrasound) and ultrasound during insertion of the tube. Thus, we could not obtain summary diagnostic accuracy (summary of findings Table 1; Figure 4).
Among studies that evaluated the diagnostic accuracy of ultrasound on its own, we found three different visualization methods reported: neck approach (Gok 2015), epigastric approach (Brun 2012; Chenaitia 2012; Lock 2003), and a combination of both neck and epigastric approaches (Brun 2014; Radulescu 2015).
The authors of the studies reported mostly high sensitivity; however, the CIs of specificity were too wide to apply to clinical practice. We hypothesized that ultrasound could be an alternative to X‐ray. However, studies included only a small number of participants for the purpose of determining tube misplacement (specificity) (Figure 4). In addition, there were limited data on the accuracy of tube placement in children.
Strengths and weaknesses of the review
Strengths and limitations of included studies
We contacted the authors of included studies and some authors provided us with unpublished details of studies for the review. The authors who provided additional information are presented in Acknowledgements. The weakness of our review is the inclusion of three studies from the same research group (see Table 1; summary of findings Table 1) (Brun 2012; Brun 2014; Chenaitia 2012). In addition, we calculated diagnostic accuracy based on the number of tube insertions, rather than the number of participants, using 60 tube insertions among 55 participants.
Strengths and limitations of the search strategy
A strength of this review is that we placed no restrictions on the language of publication and we conducted a comprehensive search using both controlled term and free words (de Vet 2008). We avoided using search filters because of their limited sensitivity (Beynon 2013). We undertook additional searches to find related articles by inquiring major companies of ultrasound devises to obtain unpublished data. We also performed a citation search of included studies, major guidelines (ENA 2015; ESPEN Guidelines 2009; JSPEN Guideline 2013; SCCM and ASPEN Guidelines 2016), and previous related reviews (Irving 2014; Milsom 2015), regarding gastric tube placement or parenteral feeding. Therefore, we minimized the risk of missing relevant studies. Little is known about the mechanisms of publication bias for diagnostic accuracy studies and so it is not possible to estimate the impact of unpublished studies on our findings. Nevertheless, the studies included in this systematic review are likely to be the majority of studies that provided evidence on this topic.
We did not employ Web of Science (apps.webofknowledge.com/) for our citation search strategy, and acknowledge that we may have missed some studies despite the otherwise comprehensive search.
Quality assessment
Our review had several weaknesses in terms of the methodological quality of the included studies (Figure 2; Figure 3). Two studies presented high risk of participant selection bias because they performed the index test after they confirmed correct position by whoosh test or auscultation (Brun 2014; Chenaitia 2012); however, if the assumed prior test were whoosh test or auscultation, the risk of participant selection bias would be low. One study presented high risk of index test interpretation bias because a single examiner interpreted the index test and the reference standard (Radulescu 2015). We considered that one study had a high risk of bias in the reference standard because the use of prespecified criteria was unclear and the same person interpreted all the results of X‐ray and ultrasound (Radulescu 2015).
Limitations in the review analyses
We could not synthesize the estimates of diagnostic accuracy (e.g. summary sensitivity, sROC curve) because of the heterogeneity of the included studies. This might make our findings relatively difficult to apply to clinical practice.
Within‐ and between‐study comparisons
One study had extremely poor diagnostic performance with a sensitivity of 0.50 (95% CI 0.32 to 0.68) and specificity of 0.17 (95% CI 0.02 to 0.48) than those of the other studies (Basile 2015) (summary of findings Table 1). The performers of ultrasound were trained personnel (nurses); however, they presented poor diagnostic accuracy. The reason was unclear; we inquired about the detailed information from the authors but we could not get sufficient information for this study.
Comparison with previous research
Milsom and colleagues systematically reviewed the methods to confirm the tube location regardless of gastric or enteric tubes and identified one study of gastric tubes. Their electronic search strategies were restricted publications to English language and they did not use controlled terms (Milsom 2015). In addition, they used a date filter for diagnostic accuracy studies restricting the search to 1985 to 2012. We could have identified additional studies by broadening the search methods but could not identify any relevant studies in children. Similarly, Irving and colleagues systematically reviewed ultrasound confirmation of gastric tube placement among children but found no studies of interest (Irving 2014).
Applicability of findings to the review question
Population and setting
Most included participants were unconscious, which may reduce the sensitivity to the tube being misplaced in the trachea. Misplaced tubes usually cause discomfort and conscious people may complain about it. Most included studies were in a prehospital setting (unconscious due to severe trauma), ICU setting (mechanical ventilated) or EMS setting. This is consistent with the population we expected to find; however, diagnostic accuracy may change according to the clinical setting, for example, clinicians may be able to perform the test more carefully in convalescent wards.
We considered that the mixture of gastric and transpyloric tube insertions had high concern regarding to applicability to the review question in 'patient selection domain' (Vigneau 2005). In addition, among include studies of 560 tube confirmations, misinterpretation of X‐ray was not reported. In reality, misinterpretation of X‐rays occurs especially when non‐radiologists read the X‐rays (ECRI and ISMP 2006; Lamont 2011).
Index test
We found various ultrasound methods regarding this review question. Brun 2014 used two‐point ultrasound; they first observed the tube in the oesophagus through the neck and then confirmed the depth of the tube through the epigastric area. In contrast, Chenaitia 2012 only observed the tube through the epigastric area. Gok 2015 reported the diagnostic accuracy of real‐time ultrasound during gastric tube insertion. Kim 2012 reported the diagnostic accuracy of ultrasound combined with saline and air insertion and Lock 2003 reported the accuracy of ultrasound combined with air injection. In addition, some studies did not report the method details ( Basile 2015; Nikandros 2006). Such heterogeneity of the index test might be a concern for the applicability of the findings to clinical practice.
We considered that the diagnostic accuracy of real‐time ultrasound during gastric tube insertion had high concern regarding to applicability to the review question (Gok 2015).
Reference standard
Most included studies used chest or abdominal X‐rays. Some reported just "X‐ray". No study reported misinterpretation or unclear results of X‐ray; however, in clinical settings, misinterpretation of X‐ray sometimes possible. Taking into account the misinterpretations, misplacement of tubes (especially in unconscious participants) might not be detected by X‐ray. These differences of reference standard may affect the diagnostic accuracy of ultrasound in this review.

Study flow diagram.
Risk of bias and applicability concerns graph: review authors' judgements about each domain presented as percentages across included studies.

Risk of bias and applicability concerns summary: review authors' judgements about each domain for each included study.

Forest plot of diagnostic accuracy of ultrasound in different ways. Four studies reported the diagnostic accuracy of ultrasound (Brun 2012; Chenaitia 2012; Gok 2015; Radulescu 2015), while the others reported the diagnostic accuracy of ultrasound combined with other methods. Gok 2015 reported the diagnostic accuracy of ultrasound during tube insertion (ultrasound‐guide insertion). We found three visualization methods (echo window) of ultrasound: neck (Gok 2015), epigastric (Brun 2012; Chenaitia 2012; Kim 2012; Lock 2003; Vigneau 2005), and a combination (Brun 2014; Radulescu 2015). Studies used air injection during ultrasound (Basile 2015; Brun 2014), saline injection (Vigneau 2005), both air and saline injection (Kim 2012), and dextrose and air injection (Nikandros 2006). Two studies did not report the echo window (Basile 2015; Nikandros 2006).
| Accuracy of ultrasound for confirmation of gastric tube placement | |||||||||
| Population | Adults in any settings (prehospital, ICU, EMS or unclear) | ||||||||
| Index test | Ultrasound (any methods) | ||||||||
| Reference standard | X‐ray | ||||||||
| Studies | Cross‐sectional study or unclear study designa | ||||||||
| Study ID | TPb | FPb | FNb | TNb | Participants | Sensitivity | Specificity | Methodc | Echo windowc |
| 17 | 10 | 17 | 2 | 46 | 0.50 (0.32 to 0.68) | 0.17 (0.02 to 0.48) | Ultrasound + air injection after insertion | NR | |
| Brun 2012a,d | 80 | 0 | 8 | 8 | 96 | 0.91 (0.83 to 0.96) | 1.00 (0.63 to 1.00) | Ultrasound after insertion | Epigastric |
| 27 | 0 | 1 | 4 | 32 | 0.96 (0.82 to 1.00) | 1.00 (0.40 to 1.00) | Ultrasound + air injection after insertion | Neck + epigastric | |
| 116 | 0 | 2 | 12 | 130 | 0.98 (0.94 to 1.00) | 1.00 (0.74 to 1.00) | Ultrasound after insertion | Epigastric | |
| 52 | 0 | 4 | 0 | 56 | 0.93 (0.83 to 0.98) | Not estimable | Ultrasound during insertion | Neck | |
| 38 | 1 | 6 | 2 | 47 | 0.86 (0.73 to 0.95) | 0.67 (0.09 to 0.99) | Ultrasound + saline and air injection | Neck + epigastric | |
| 43 | 0 | 15 | 2 | 55 (60 measurements)e | 0.74 (0.61 to 0.85) | 1.00 (0.16 to 1.00) | Ultrasound + air injection after insertion | Epigastric | |
| 15 | 0 | 1 | 0 | 16 | 0.94 (0.70 to 1.00) | Not estimable | Ultrasound + dextrose and air injection after insertion | NR | |
| 28 | 0 | 2 | 2 | 32 | 0.93 (0.78 to 0.99) | 1.00 (0.16 to 1.00) | Ultrasound after insertion | Neck + epigastric | |
| 34 | 0 | 1 | 0 | 35 | 0.97 (0.85 to 1.00) | Not estimable | Ultrasound + saline injection after insertion | Epigastric | |
| CI: confidence interval; EMS: emergency medical service; ICU: intensive care unit: FN: false negative; FP: false positive; NR: not reported; TN: true negative; TP: true positive. | |||||||||
| Accuracy of ultrasound for confirmation of gastric tube placement for drainage in settings where X‐ray facilities are not readily available | |||||||||
| Population | Adults underwent gastric tube insertion for drainage in settings where X‐ray facilities are not readily available (prehospital or EMS) | ||||||||
| Index test | Ultrasound (any methods) | ||||||||
| Reference standard | X‐ray | ||||||||
| Studies | Cross‐sectional study or unclear study designa | ||||||||
| Study ID | TPb | FPb | FNb | TNb | Participants | Sensitivity | Specificity | Methodc | Echo windowc |
| Brun 2012c,d | 80 | 0 | 8 | 8 | 96 | 0.91 (0.83 to 0.96) | 1.00 (0.63 to 1.00) | Ultrasound after insertion | Epigastric |
| 27 | 0 | 1 | 4 | 32 | 0.96 (0.82 to 1.00) | 1.00 (0.40 to 1.00) | Ultrasound+ air injection after insertion | Neck + epigastric | |
| 116 | 0 | 2 | 12 | 130 | 0.98 (0.94 to 1.00) | 1.00 (0.74 to 1.00) | Ultrasound after insertion | Epigastric | |
| 38 | 1 | 6 | 2 | 47 | 0.86 (0.73 to 0.95) | 0.67 (0.09 to 0.99) | Ultrasound + saline and air injection | Neck + epigastric | |
| CI: confidence interval; EMS: emergency medical service; FN: false negative; FP: false positive; TN: true negative; TP: true positive. | |||||||||
| Study ID | Male:female | Age | BMI | Children | Non‐sedated | Sedated | Intubated | Diameter | Setting |
| NR | NR | NR | NR | NR | NR | NR | NR | NR | |
| 56:24 | 52 ± 23 | NR | 0 | 0 | 96 | 96 | 14 or 16 | Prehospital | |
| 18:14 | 57 ± 17 | NR | 0 | 22 | 10 | 32 | 14 or 16 | Prehospital | |
| 77:53 | 55.7 ± 19.8 | NR | 0 | 0 | 130 | 130 | 14‐18 | Prehospital | |
| 32:24 | 48.4 ± 28.9 | 27.1 ± 6.4 | 0 | 0 | 56 | 56 | 10‐14 | ICU | |
| 28:19 | 57.6 ± 17.2 | NR | 0 | 0 | 47 | 27 | 16 | EMS | |
| NR | 59.2 ± 16.2 | NR | NR | NR | NR | 50 | 14 or 16 | ICU | |
| 9:7 | 66.3 ± 7.1 | NR | NR | 0 | 16 | 16 | NR | ICU | |
| NR | N/R | NR | NR | NR | NR | NR | NR | NR | |
| 18:16 | 62.2 ± 19.8 | 24.8 ± 5.8 | 0 | 14 | 19 | 26 | 12 | ICU | |
| BMI: body mass index; EMS: emergency medical service; ICU: intensive care unit; NR: not reported; SD: standard deviation. a Reports from the same research group. | |||||||||
| Test | No. of studies | No. of participants |
| 1 Ultrasound Show forest plot | 10 | 550 |