Scolaris Content Display Scolaris Content Display

Clinical pathway
Figuras y tablas -
Figure 1

Clinical pathway

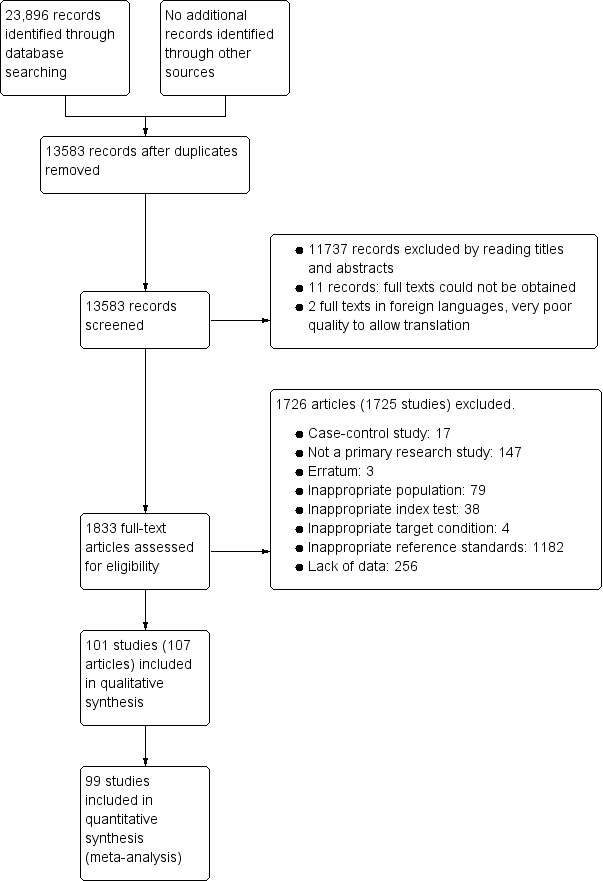
Study flow diagram.
Figuras y tablas -
Figure 2

Study flow diagram.

Risk of bias and applicability concerns graph: review authors' judgements about each domain presented as percentages across included studies. For each domain, the numbers shown on the bar represent the number of studies that were scored as high, unclear or low in terms of risk of bias or applicability concern.
Figuras y tablas -
Figure 3

Risk of bias and applicability concerns graph: review authors' judgements about each domain presented as percentages across included studies. For each domain, the numbers shown on the bar represent the number of studies that were scored as high, unclear or low in terms of risk of bias or applicability concern.

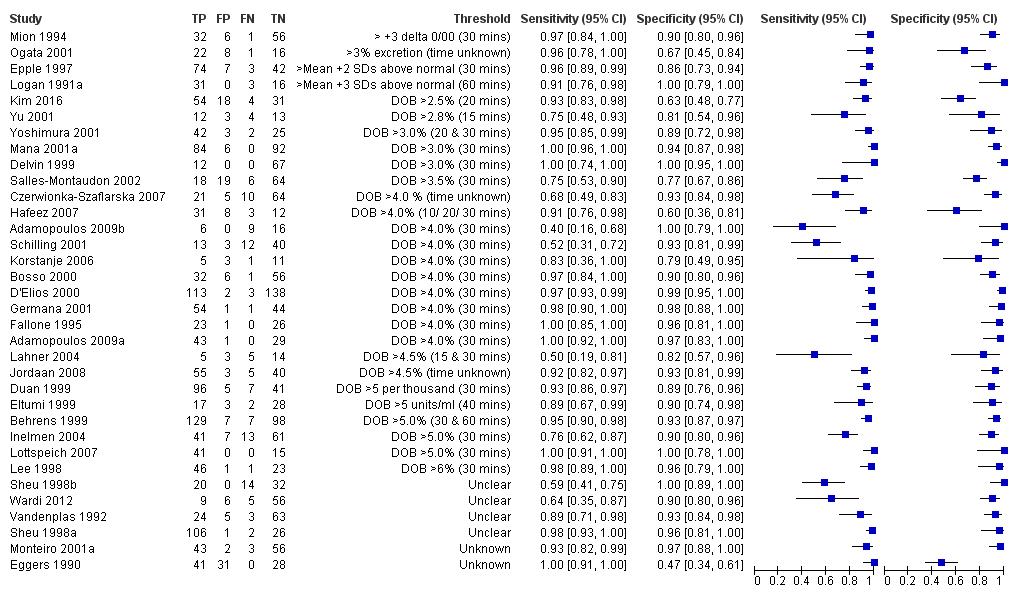
Forest plot of urea breath test‐13C.FN = false negative; FP = false positive; TN = true negative; TP = true positive. The forest plot shows an estimate of sensitivity and specificity from each study and the threshold used. Studies are sorted by threshold, sensitivity and specificity. For threshold, the number of minutes in brackets is the time after administration of urea.
Figuras y tablas -
Figure 4

Forest plot of urea breath test‐13C.FN = false negative; FP = false positive; TN = true negative; TP = true positive. The forest plot shows an estimate of sensitivity and specificity from each study and the threshold used. Studies are sorted by threshold, sensitivity and specificity. For threshold, the number of minutes in brackets is the time after administration of urea.

Forest plot of urea breath test‐13C at commonly reported thresholds. FN = false negative; FP = false positive; TN = true negative; TP = true positive. Thresholds are shown in brackets and the number of minutes in brackets is the time after administration of urea.
Figuras y tablas -
Figure 5

Forest plot of urea breath test‐13C at commonly reported thresholds. FN = false negative; FP = false positive; TN = true negative; TP = true positive. Thresholds are shown in brackets and the number of minutes in brackets is the time after administration of urea.

Forest plot of urea breath test‐14C. FN = false negative; FP = false positive; TN = true negative; TP = true positive. The forest plot shows an estimate of sensitivity and specificity from each study and the threshold used. Studies are sorted by threshold, sensitivity and specificity. For threshold, the number of minutes in brackets is the time after administration of urea.
Figuras y tablas -
Figure 6

Forest plot of urea breath test‐14C. FN = false negative; FP = false positive; TN = true negative; TP = true positive. The forest plot shows an estimate of sensitivity and specificity from each study and the threshold used. Studies are sorted by threshold, sensitivity and specificity. For threshold, the number of minutes in brackets is the time after administration of urea.

Forest plot of serology. FN = false negative; FP = false positive; SD = standard deviation; TN = true negative; TP = true positive. The forest plot shows an estimate of sensitivity and specificity from each study and the threshold used. Studies are sorted by threshold, sensitivity and specificity. Other threshold is staining of a 120kDa protein (CagA) gel band and/or at least two of five proteins between 28–33 kDa.
Figuras y tablas -
Figure 7

Forest plot of serology. FN = false negative; FP = false positive; SD = standard deviation; TN = true negative; TP = true positive. The forest plot shows an estimate of sensitivity and specificity from each study and the threshold used. Studies are sorted by threshold, sensitivity and specificity. Other threshold is staining of a 120kDa protein (CagA) gel band and/or at least two of five proteins between 28–33 kDa.

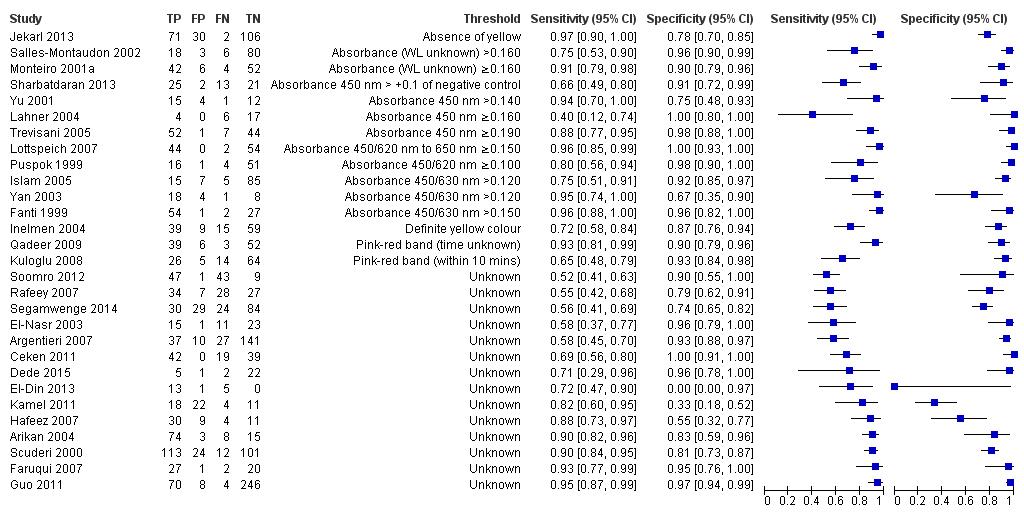
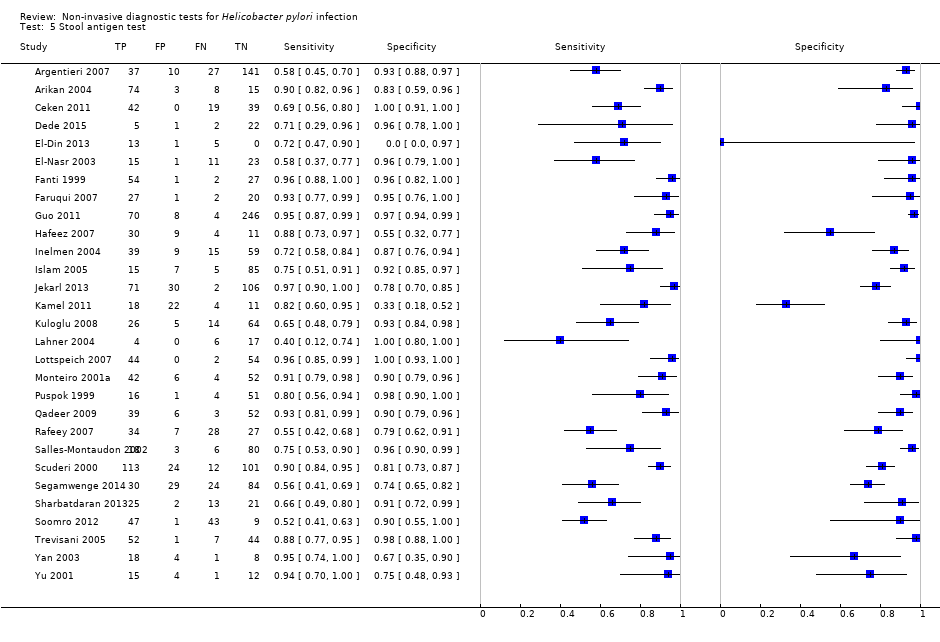
Forest plot of stool antigen test. FN = false negative; FP = false positive; TN = true negative; TP = true positive; WL = wavelength. The forest plot shows an estimate of sensitivity and specificity from each study and the threshold used. Studies are sorted by threshold, sensitivity and specificity.
Figuras y tablas -
Figure 8

Forest plot of stool antigen test. FN = false negative; FP = false positive; TN = true negative; TP = true positive; WL = wavelength. The forest plot shows an estimate of sensitivity and specificity from each study and the threshold used. Studies are sorted by threshold, sensitivity and specificity.

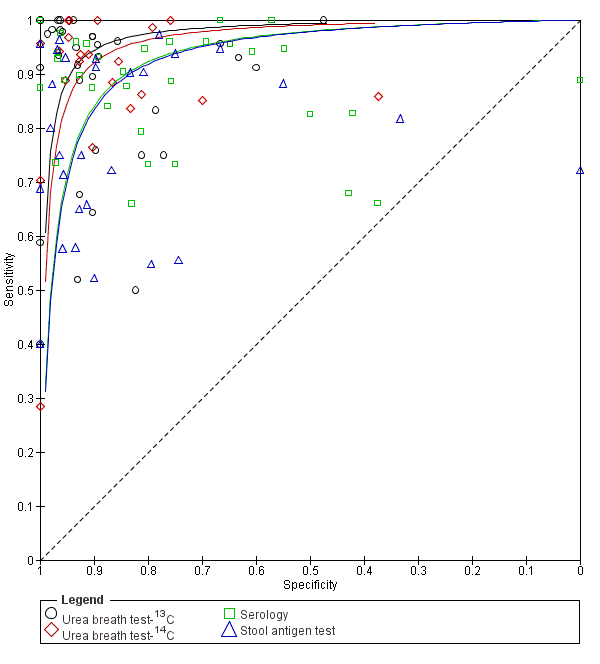
Summary ROC plot of non‐invasive tests for H pylori infection. The SROC curves for the four tests are parallel. The curve for each test is drawn within the range of estimates of specificity from the studies included for the test.
Figuras y tablas -
Figure 9

Summary ROC plot of non‐invasive tests for H pylori infection. The SROC curves for the four tests are parallel. The curve for each test is drawn within the range of estimates of specificity from the studies included for the test.

Summary ROC plot of direct comparisons of urea breath test‐13C and serology. Each summary curve was drawn restricted to the range of specificities for each test. The size of each symbol was scaled according to the precision of sensitivity and specificity in the study. A dotted line joins the pair of points for the two tests from each study.
Figuras y tablas -
Figure 10

Summary ROC plot of direct comparisons of urea breath test‐13C and serology. Each summary curve was drawn restricted to the range of specificities for each test. The size of each symbol was scaled according to the precision of sensitivity and specificity in the study. A dotted line joins the pair of points for the two tests from each study.

Summary ROC plot of direct comparisons of urea breath test‐13C and stool antigen test. Each summary curve was drawn restricted to the range of specificities for each test. The size of each symbol was scaled according to the precision of sensitivity and specificity in the study. A dotted line joins the pair of points for the two tests from each study.
Figuras y tablas -
Figure 11

Summary ROC plot of direct comparisons of urea breath test‐13C and stool antigen test. Each summary curve was drawn restricted to the range of specificities for each test. The size of each symbol was scaled according to the precision of sensitivity and specificity in the study. A dotted line joins the pair of points for the two tests from each study.

Risk of bias and applicability concerns summary: review authors' judgements about each domain for each study included for urea breath test‐13C
Figuras y tablas -
Figure 12

Risk of bias and applicability concerns summary: review authors' judgements about each domain for each study included for urea breath test‐13C

Risk of bias and applicability concerns summary: review authors' judgements about each domain for each study included for urea breath test‐14C.
Figuras y tablas -
Figure 13

Risk of bias and applicability concerns summary: review authors' judgements about each domain for each study included for urea breath test‐14C.

Risk of bias and applicability concerns summary: review authors' judgements about each domain for each study included for serology
Figuras y tablas -
Figure 14

Risk of bias and applicability concerns summary: review authors' judgements about each domain for each study included for serology

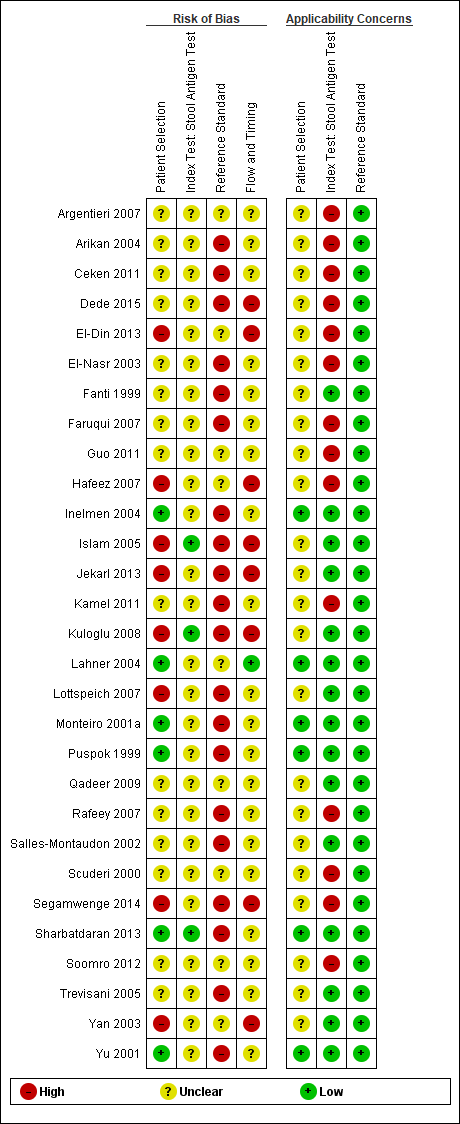
Risk of bias and applicability concerns summary: review authors' judgements about each domain for each study included for the stool antigen test
Figuras y tablas -
Figure 15

Risk of bias and applicability concerns summary: review authors' judgements about each domain for each study included for the stool antigen test

Urea breath test‐13C.
Figuras y tablas -
Test 1

Urea breath test‐13C.

Urea breath test‐14C.
Figuras y tablas -
Test 2

Urea breath test‐14C.

Urea breath test ‐ Unknown isotope.
Figuras y tablas -
Test 3

Urea breath test ‐ Unknown isotope.

Serology.
Figuras y tablas -
Test 4

Serology.

Stool antigen test.
Figuras y tablas -
Test 5

Stool antigen test.

Urea breath test‐13C (delta over baseline > 3% (20 minutes)).
Figuras y tablas -
Test 6

Urea breath test‐13C (delta over baseline > 3% (20 minutes)).

Urea breath test‐13C (delta over baseline > 3% (30 minutes)).
Figuras y tablas -
Test 7

Urea breath test‐13C (delta over baseline > 3% (30 minutes)).

Urea breath test‐13C (delta over baseline > 3.5% (30 minutes)).
Figuras y tablas -
Test 8

Urea breath test‐13C (delta over baseline > 3.5% (30 minutes)).

Urea breath test‐13C (delta over baseline > 4% (10 minutes)).
Figuras y tablas -
Test 9

Urea breath test‐13C (delta over baseline > 4% (10 minutes)).

Urea breath test‐13C (delta over baseline > 4% (20 minutes)).
Figuras y tablas -
Test 10

Urea breath test‐13C (delta over baseline > 4% (20 minutes)).

Urea breath test‐13C (delta over baseline > 4% (30 minutes)).
Figuras y tablas -
Test 11

Urea breath test‐13C (delta over baseline > 4% (30 minutes)).

Urea breath test‐13C (delta over baseline > 4.5% (30 minutes)).
Figuras y tablas -
Test 12

Urea breath test‐13C (delta over baseline > 4.5% (30 minutes)).

Urea breath test‐13C (delta over baseline > 5% (30 minutes)).
Figuras y tablas -
Test 13

Urea breath test‐13C (delta over baseline > 5% (30 minutes)).

Urea breath test‐14C (counts per minute > 50).
Figuras y tablas -
Test 14

Urea breath test‐14C (counts per minute > 50).

Urea breath test‐14C (disintegrations per minute > 200).
Figuras y tablas -
Test 15

Urea breath test‐14C (disintegrations per minute > 200).

Serology > 7 units/ml.
Figuras y tablas -
Test 16

Serology > 7 units/ml.

Serology ≥300 units.
Figuras y tablas -
Test 17

Serology ≥300 units.

Summary of findings Performance of non‐invasive tests for diagnosis of H pylori infection

What is the best non‐invasive test for diagnosis of H pylori infection?

Population

Children and adults with gastrointestinal symptoms

Setting

Primary care setting

Index tests

Urea breath test‐13C, Urea breath test‐14C, serology, and stool antigen test

Threshold

Various thresholds were used for each test

Role and purpose of test

Screening and diagnosis of H pylori

Reference standard

Endoscopic biopsy with Haemotoxylin & Eosin stain, special stains, or combination of Haemotoxylin & Eosin and special stains

Quality of evidence

Risk of bias was generally high or unclear with respect to the selection of participants, and the conduct and interpretation of the index tests and reference standard. Applicability concerns were also generally high or unclear with respect to selection of participants

Limitations

There was heterogeneity in thresholds and reference standards. Studies did not often prespecify or clearly report thresholds used

Pre‐test probability (prevalence of Helicobacter pylori)

Median (interquartile range) = 53.7% (42.0% to 66.5%)

Index test

Number of participants (studies)

Diagnostic odds ratio (95% CI)

Sensitivity (95% CI) at fixed specificity of 0.901

Missed H pylori cases per 1000 people tested (95% CI)2

Urea breath test‐13C

3139 participants

(34 studies)

153 (95% CI 73.7 to 316)

0.94 (0.89 to 0.97)

30 (15 to 58)

Urea breath test‐14C

1810 participants

(21 studies)

105 (95% CI 74.0 to 150)

0.92 (0.89 to 0.94)

42 (30 to 58)

Serology

4242 participants

(34 studies)

47.4 (95% CI 25.5 to 88.1)

0.84 (0.74 to 0.91)

86 (50 to 140)

Stool antigen test

2988 participants

(29 studies)

45.1 (95% CI 24.2 to 84.1)

0.83 (0.73 to 0.90)

89 (52 to 146)

Comparison of non‐invasive tests for H pylori infection

Based on an indirect comparison of the four tests using all the studies, there was statistical evidence of a difference in diagnostic accuracy (P = 0.024). Direct comparisons were based on few head‐to‐head studies. The ratios of diagnostic odds ratios (95% CI; P value) were 0.68 (95% CI 0.12 to 3.70; P = 0.56) for urea breath test‐13C versus serology (seven studies), and 0.88 (95% CI 0.14 to 5.56; P = 0.84) for urea breath test‐13C versus stool antigen test (seven studies). The 95% confidence intervals of these estimates overlap with those of the ratios of diagnostic odds ratios from the indirect comparison. Data were limited or unavailable for meta‐analysis of other direct comparisons.

Conclusions

In people with no history of gastrectomy and those who have not recently had antibiotics or proton pump inhibitors, urea breath tests had high diagnostic accuracy while serology and stool antigen tests had lower accuracy to detect H pylori infection. Although susceptible to bias due to confounding, this conclusion is based on evidence from indirect test comparisons as evidence from direct comparisons was based on few studies or was unavailable. It should be noted that studies were generally of poor methodological quality. The thresholds used for the tests were highly variable and there is currently insufficient evidence to recommend specific thresholds for use in clinical practice.

1The sensitivities were estimated along the SROC curves at the median specificity across the studies included for the four tests.

2Based on the sensitivity estimated at the median specificity of 0.90, and the median prevalence of 53.7% from the included studies, the numbers of missed H pylori cases were calculated using a hypothetical cohort of 1000 people suspected of having H pylori infection. The 95% CI for the number of missed cases is from the 95% CI for sensitivity. For a specificity of 0.90 and prevalence of 53.7%, there will be 46 false positives. See Table 3 for results for other values of specificity and prevalence.

Figuras y tablas -
Summary of findings Performance of non‐invasive tests for diagnosis of H pylori infection
Table 1. Summary of results at thresholds commonly reported for urea breath test‐13C, urea breath test‐14C and serology

Threshold

Studies

Number of participants (cases)

Sensitivity (95% CI)

Specificity (95% CI)

Urea breath test‐13C

Delta over baseline > 3% (20 minutes)

2

254 (128)

0.98 (0.90 to 1.00)

0.92 (0.82 to 0.97)

Delta over baseline > 3% (30 minutes)

3

333 (140)

0.99 (0.92 to 1.00)

0.95 (0.90 to 0.98)

Delta over baseline > 3.5% (30 minutes)

3

368 (120)

0.75 to 1.00

0.77 to 1.00

Delta over baseline > 4% (10 minutes)

2

236 (118)

0.91 to 1.00

0.60 to 0.95

Delta over baseline > 4% (20 minutes)

2

236 (118)

0.91 to 1.00

0.60 to 0.96

Delta over baseline > 4% (30 minutes)

10

958 (423)

0.95 (0.79 to 0.99)

0.95 (0.87 to 0.98)

Delta over baseline > 4.5% (30 minutes)

3

288 (106)

0.50 to 0.96

0.82 to 0.96

Delta over baseline > 5% (30 minutes)

4

601 (315)

0.95 (0.49 to 1.00)

0.94 (0.84 to 0.98)

Urea breath test‐14C

Counts per minute > 50 (10 minutes)

6

471 (231)

0.89 (0.55 to 0.98)

0.91 (0.79 to 0.96)

Disintegrations per minute > 200 (10 minutes)

4

296 (132)

0.95 (0.33 to 1.00)

0.95 (0.80 to 0.99)

Serology

> 7 units/ml

2

97 (48)

0.98 (0.74 to 1.00)

0.71 (0.51 to 0.86)

≥ 300 unit

2

234 (143)

0.91 (0.82 to 0.96)

0.86 (0.72 to 0.93)

Tests evaluated at the same threshold by more than one study are presented in the table. When there were two or three studies at the same threshold, and little or no heterogeneity was observed in ROC space, estimates of summary sensitivity and summary specificity were obtained by using univariate fixed‐effect logistic regression models to pool sensitivities and specificities separately. When there were two or three studies and we observed heterogeneity, we did not perform meta‐analysis but report the range of the sensitivities and specificities.

Figuras y tablas -
Table 1. Summary of results at thresholds commonly reported for urea breath test‐13C, urea breath test‐14C and serology
Table 2. Indirect comparison of the accuracy of non‐invasive tests for H pylori infection

Index tests

Studies;

participants (H pyloripresent)

DOR (95% CI)

Ratio of diagnostic odds ratios (95% CI), P value

Urea breath test‐13C

Urea breath test‐14C

Serology

Urea breath test‐13C

34; 3139 (1526)

153 (73.7 to 316)

Urea breath test‐14C

21; 1810 (1018)

105 (74.0 to 150)

1.45 (0.65 to 3.26),

P = 0.36

Serology

34; 4242 (2477)

47.4 (25.5 to 88.1)

3.22 (1.24 to 8.37),

P = 0.017

2.22 (1.09 to 4.51),

P = 0.028

Stool antigen test

29; 2988 (1311)

45.1 (24.2 to 84.1)

3.39 (1.30 to 8.83),

P = 0.013

2.33 (1.14 to 4.76),

P = 0.020

1.05 (0.44 to 2.53),

P = 0.91

The indirect comparison included all studies that evaluated at least one of the four tests, i.e. all available data. The ratio of diagnostic odds ratios is the diagnostic odds ratio (DOR) of the test in the column divided by the DOR of the test in the row. If the ratio is greater than one, then the test in the column is more accurate than the test in the row; if the ratio is less than one, the test in the row is more accurate than the test in the column.

Figuras y tablas -
Table 2. Indirect comparison of the accuracy of non‐invasive tests for H pylori infection
Table 3. Accuracy of non‐invasive tests for H pylori infection at different levels of prevalence

Prevalence (%)

Specificity

False positives1

Test

Sensitivity (95% CI)

Missed cases (95% CI)

42.0

0.79

122

Urea breath test‐13C

0.98 (0.95 to 0.99)

10 (5 to 20)

Urea breath test‐14C

0.97 (0.95 to 0.98)

15 (10 to 20)

Serology

0.93 (0.87 to 0.96)

31 (17 to 54)

Stool antigen test

0.92 (0.87 to 0.96)

32 (18 to 57)

53.7

0.79

97

Urea breath test‐13C

0.98 (0.95 to 0.99)

13 (6 to 26)

Urea breath test‐14C

0.97 (0.95 to 0.98)

19 (13 to 26)

Serology

0.93 (0.87 to 0.96)

39 (22 to 69)

Stool antigen test

0.92 (0.87 to 0.96)

41 (23 to 72)

66.5

0.79

70

Urea breath test‐13C

0.98 (0.95 to 0.99)

16 (8 to 32)

Urea breath test‐14C

0.97 (0.95 to 0.98)

23 (16 to 32)

Serology

0.93 (0.87 to 0.96)

49 (27 to 85)

Stool antigen test

0.92 (0.87 to 0.96)

51 (28 to 89)

42.0

0.90

58

Urea breath test‐13C

0.94 (0.89 to 0.97)

23 (12 to 46)

Urea breath test‐14C

0.92 (0.89 to 0.94)

33 (24 to 46)

Serology

0.84 (0.74 to 0.91)

67 (39 to 110)

Stool antigen test

0.83 (0.73 to 0.90)

70 (41 to 114)

53.7

0.90

46

Urea breath test‐13C

0.94 (0.89 to 0.97)

30 (15 to 58)

Urea breath test‐14C

0.92 (0.89 to 0.94)

42 (30 to 58)

Serology

0.84 (0.74 to 0.91)

86 (50 to 140)

Stool antigen test

0.83 (0.73 to 0.90)

89 (52 to 146)

66.5

0.90

34

Urea breath test‐13C

0.94 (0.89 to 0.97)

37 (18 to 72)

Urea breath test‐14C

0.92 (0.89 to 0.94)

53 (38 to 72)

Serology

0.84 (0.74 to 0.91)

106 (62 to 173)

Stool antigen test

0.83 (0.73 to 0.90)

111 (64 to 180)

42.0

0.96

23

Urea breath test‐13C

0.86 (0.75 to 0.93)

57 (30 to 103)

Urea breath test‐14C

0.81 (0.76 to 0.86)

78 (58 to 103)

Serology

0.66 (0.52 to 0.79)

141 (90 to 204)

Stool antigen test

0.65 (0.50 to 0.78)

146 (93 to 209)

53.7

0.96

19

Urea breath test‐13C

0.86 (0.75 to 0.93)

73 (38 to 132)

Urea breath test‐14C

0.81 (0.76 to 0.86)

100 (74 to 132)

Serology

0.66 (0.52 to 0.79)

181 (115 to 260)

Stool antigen test

0.65 (0.50 to 0.78)

187 (119 to 267)

66.5

0.96

13

Urea breath test‐13C

0.86 (0.75 to 0.93)

90 (47 to 163)

Urea breath test‐14C

0.81 (0.76 to 0.86)

124 (92 to 163)

Serology

0.66 (0.52 to 0.79)

224 (142 to 322)

Stool antigen test

0.65 (0.50 to 0.78)

231 (148 to 331)

1Average number of participants who are diagnosed with H pylori infection but do not have the infection per 1000 tested.

The sensitivities were estimated from the SROC curves at fixed values (lower quartile, median and upper quartile) of specificity from the included studies across all tests. Based on these sensitivities and specificities, and quartiles of prevalence from the included studies (across all tests), the numbers of missed H pylori cases and false positives (i.e. overdiagnosed people) were calculated using a hypothetical cohort of 1000 people suspected of having H pylori infection.

Figuras y tablas -
Table 3. Accuracy of non‐invasive tests for H pylori infection at different levels of prevalence
Table 4. Direct comparison of the accuracy of non‐invasive tests for H pylori infection

Test

Urea breath test‐13C

Urea breath test‐14C

Serology

Urea breath test‐13C

Urea breath test‐14C

N = 0

Serology

N = 7

DOR (95% CI) of urea breath test‐13C = 74.8 (95% CI 17.8 to 314)

DOR (95% CI) of serology = 111 (95% CI 41.2 to 297)

RDORs (95% CI) of urea breath test‐13C versus serology, P value = 0.68 (95% CI 0.12 to 3.70), P = 0.56

N = 1

Stool antigen test

N = 7
DOR (95% CI) of urea breath test‐13C = 46.6 (95% CI 3.30 to 658)

DOR (95% CI) of stool antigen test = 53.0 (95% CI 5.34 to 527)

RDORs (95% CI) of urea breath test‐13C versus stool antigen test, P value = 0.88 (95% CI 0.14 to 5.56), P = 0.84

N = 2

N = 4

DOR = diagnostic odds ratio; N = number of studies; RDORs = ratio of diagnostic odds ratios.

Due to paucity of data and substantial heterogeneity observed in ROC space which precluded the use of simpler meta‐analytic models, meta‐analyses were not possible for two test comparisons that had more than one study. For the single study of urea breath test‐14C versus serology (Mansour‐Ghanaei 2011), both tests had similar sensitivity, but specificity was higher for urea breath test‐14C than for serology. The ratio of diagnostic odds ratios is the DOR of the test in the column divided by the DOR of the test in the row. If the ratio is greater than one, then the test in the column is more accurate than the test in the row; if the ratio is less than one, the test in the row is more accurate than the test in the column.

Figuras y tablas -
Table 4. Direct comparison of the accuracy of non‐invasive tests for H pylori infection
Table Tests. Data tables by test

Test

No. of studies

No. of participants

1 Urea breath test‐13C Show forest plot

34

3139

2 Urea breath test‐14C Show forest plot

21

1810

3 Urea breath test ‐ Unknown isotope Show forest plot

2

127

4 Serology Show forest plot

34

4242

5 Stool antigen test Show forest plot

29

2988

6 Urea breath test‐13C (delta over baseline > 3% (20 minutes)) Show forest plot

2

254

7 Urea breath test‐13C (delta over baseline > 3% (30 minutes)) Show forest plot

3

333

8 Urea breath test‐13C (delta over baseline > 3.5% (30 minutes)) Show forest plot

3

368

9 Urea breath test‐13C (delta over baseline > 4% (10 minutes)) Show forest plot

2

236

10 Urea breath test‐13C (delta over baseline > 4% (20 minutes)) Show forest plot

2

236

11 Urea breath test‐13C (delta over baseline > 4% (30 minutes)) Show forest plot

10

958

12 Urea breath test‐13C (delta over baseline > 4.5% (30 minutes)) Show forest plot

3

288

13 Urea breath test‐13C (delta over baseline > 5% (30 minutes)) Show forest plot

4

601

14 Urea breath test‐14C (counts per minute > 50) Show forest plot

6

471

15 Urea breath test‐14C (disintegrations per minute > 200) Show forest plot

4

296

16 Serology > 7 units/ml Show forest plot

2

97

17 Serology ≥300 units Show forest plot

2

234

Figuras y tablas -
Table Tests. Data tables by test