无创诊断性测试用于诊断幽门螺杆菌感染
摘要
研究背景
幽门螺杆菌(H pylori)感染与许多恶性肿瘤和非恶性疾病有关,包括消化性溃疡、非溃疡性消化不良、复发性消化性溃疡出血、不明原因的缺铁性贫血、特发性血小板减少性紫癜和结直肠腺瘤。确诊诊断H pylori是通过内镜活检,然后使用苏木素和伊红(H&E)染色或特殊染色,如Giemsa染色和Warthin‐Starry染色进行组织病理学检查。特殊染色比H&E染色更准确。对于无创检测诊断幽门螺杆菌的准确性存在很大的不确定性。
研究目的
系统综述旨在比较单独或联合使用尿素呼气试验、血清学和粪便抗原试验诊断感染在有症状和无症状人群中诊断感染幽门螺杆菌的准确性,从而可以开始对幽门螺杆菌进行根除治疗。
检索策略
我们于2016年3月4日检索了MEDLINE、Embase、科学引文索引(Science Citation Index)和美国国立卫生研究院健康技术评价数据库(National Institute for Health Research Health Technology Assessment Database)。我们筛选纳入研究的参考文献以便纳入其他相关研究。我们还对相关研究进行了引文检索,最近一次是在2016年12月4日。在检索时,我们没有限制语言或出版情况,以及研究资料的收集情况(前瞻性或回顾性)。
纳入排除标准
我们纳入了诊断准确性的研究,这些研究对疑似感染H pylori患者的至少一项指标测试(用同位素如13C或14C的尿素呼气实验、血清学和粪便抗原检测)以及参考标准(使用H&E染色剂、特殊染色剂或免疫组织化学染色剂进行组织病理学检查)进行评价。
资料收集与分析
两位综述作者独立筛选参考文献以确定相关研究,并提取资料。我们使用QUADAS‐2工具评价了研究的方法学质量。我们使用分层汇总接收器操作特征(hierarchical summary receiver operating characteristic, HSROC)模型进行meta分析,以估计和比较SROC曲线。在适当的情况下,我们使用双变量或单变量逻辑回归模型来估计汇总敏感性和特异性。
主要结果
我们纳入了101项研究,涉及11003名受试者,其中5839名受试者(53.1%)感染了幽门螺杆菌。研究中幽门螺杆菌感染的患病率为15.2%至94.7%,患病率中位数为53.7%(四分位距为42.0%至66.5%)。大多数研究(57%)纳入了消化不良的受试者,53项研究排除了最近服用质子泵抑制剂或抗生素的受试者。每项研究至少存在不明确的偏倚风险或不明确的适用性问题。
在101项研究中,有15项比较了两种指标检验的准确性,2项研究比较了三种指标检验的准确性。三十四项研究(4242名受试者)评价了血清学;二十九项研究(2988名受试者)评价了粪便抗原检测;三十四项研究(3139名受试者)评价了尿素呼气试验‐13C;二十一项研究(1810名受试者)评价了尿素呼气试验 ‐14C;两项研究(127名受试者)评价了尿素呼气试验,但没有报告使用的同位素。用于定义测试阳性的阈值和用于组织病理学检查的染色技术(参考标准)因研究而异。由于报告的每个阈值资料稀疏,因此我们无法确定每个测试的最佳阈值。
在间接测试比较中使用99项研究的资料,有统计证据表明尿素呼气测试‐13C、尿素呼气测试‐14C、血清学和粪便抗原测试之间的诊断准确性存在差异(P=0.024)。尿素呼气试验‐13C、尿素呼气试验‐14C、血清学和粪便抗原试验的诊断比值比分别为153(95% 置信区间(confidence interval, CI)[73.7, 316])、105(95% CI [74.0, 150])、47.4(95% CI [25.5, 88.1])和45.1(95% CI [24.2, 84.1])。在0.90的固定特异性下(四项测试研究的中位数)估计的灵敏度(95% CI)尿素呼气试验‐13C为0.94(95% CI [0.89, 0.97]),尿素呼气试验‐14C为0.92(95% CI [0.89, 0.94])血清学为0.84(95% CI [0.74, 0.91]),粪便抗原测试为0.83(95% CI [0.73, 0.90])。这意味着平均而言,考虑到0.90的特异性和53.7%的患病率(研究中特异性和患病率的中位数),在1000名接受感染幽门螺杆菌检测的人中,将有46人假阳性(没有感染幽门螺杆菌的人会诊断为感染幽门螺杆菌)在这个假设的队列中,尿素呼气试验‐13C、尿素呼气试验‐14C、血清学和粪便抗原试验将分别给出30例(95% CI [15, 58])、42例(95% CI [30, 58])、86例(95% CI [50, 140])和89例(95% CI [52, 146])假阴性( 幽门螺杆菌感染者将被漏诊 幽门螺杆菌)。
直接比较是基于少数面对面的研究。尿素呼气试验‐13C与血清学(7项研究)比较的诊断比值比(diagnostic odds ratios, DORs)为0.68(95% CI [0.12, 3.70]; P=0.56),以及尿素呼气测试‐13C与粪便抗原测试(7项研究)比较的诊断比值比为0.88(95% CI [0.14, 5.56]; P=0.84 ) 。这些估计的95% CI与间接比较的DOR比率重叠。可用于其他直接比较的meta分析的资料有限或无法获得。
作者结论
在没有胃切除病史的人和最近没有使用过抗生素或泵抑制剂的人中,尿素呼气试验的诊断准确性很高,而血清学和粪便抗原试验对感染幽门螺杆菌的诊断准确性较低。这是基于间接的测试比较(由于混杂可能存在偏倚),因为来自直接比较的证据有限或不可使用。用于这些测试的阈值变化很大,我们无法确定可能在临床实践中有用的特定阈值。
我们需要进一步的高方法学质量的比较研究,以获得更可靠的证据,证明测试之间的相对准确性。此类研究应前瞻性地在具有代表性的受试者中进行,并明确报告以确保低偏倚风险。最重要的是,研究应预先指定并明确报告使用的阈值,并应避免不恰当的排除。
简语概要
不同无创方法用于诊断幽门螺杆菌的准确性
为什么知道是否患有幽门螺杆菌很重要?
幽门螺杆菌(H pylori)是一种可能存在于一些人胃中的细菌。幽门螺杆菌被认为会导致多种癌症,包括胃癌、胰腺癌和喉癌。幽门螺杆菌还与其他疾病有关,包括胃溃疡、胃灼热和腹胀感。如果在个体中发现幽门螺杆菌,则可以开始适当的治疗。
本系统综述的目的是什么?
比较三种不同类型测试幽门螺杆菌的准确性。它们是:尿素呼气测试、血液测试(特定的血液测试称为血清学)和粪便测试(在粪便中)。
本系统综述研究了什么?
有两种不同形式的尿素呼气测试,使用的两种不同形式的碳称为13C和14C,以及多种版本的血清学和粪便测试。
本系统综述的主要结果是什么?
我们发现了101项研究,其中包括11003名接受幽门螺杆菌检测的人。在这11003名受试者中,5839人(53.1%)感染了幽门螺杆菌。所有研究都使用了上面列出的三种测试中的一种,并将这些检查结果与内窥镜活检给出的诊断进行了比较。内窥镜活检包括使用通过口腔引入一根细软管从胃中获取组织,并在显微镜下检验幽门螺杆菌的存在。它是目前可用的最准确的测试,但它会导致受试者身体不适,并伴有相关的伤害风险。这与本系统综述中的替代性无创测试形成对比,后者的不适感显著降低,并且伤害风险为极小或无,如果它们在诊断幽门螺杆菌方面与内镜活检一样准确,那么可使其成为理想的替代方法。大多数研究纳入了患有胃灼热或胃部类似问题的受试者,并排除了先前接受过部分胃切除和接受幽门螺杆菌治疗受试者。
三十四项研究(4242名受试者)评价了血清学;二十九项研究(2988名受试者)评价了粪便抗原检测;三十四项研究(3139名受试者)评价了尿素呼气试验‐13C;二十一项研究(1810名受试者)评价了尿素呼气试验‐14C;两项研究(127名受试者)评价了尿素呼气试验,但没有报告使用的同位素。在判定幽门螺杆菌感染检测呈阳性之前,研究使用的限度和用于检查活检材料的染色类型各不相同。当我们查看所有资料时,我们发现尿素呼气测试比血液和粪便测试更准确。结果意味着,平均而言,如果对1000人进行检测,将有46个没有感染幽门螺杆菌的人被误诊为幽门螺杆菌。此外,将分别有30、42、86和89名H pylori感染者在尿素呼气试验‐13C、尿素呼气试验‐14C、血清学和粪便抗原试验中漏诊H pylori感染。当我们查看在同一受试者中比较尿素呼气测试‐13C和血清学,或尿素呼气测试‐13C和粪便抗原测试的七项研究时,结果并不确定且我们无法判断哪个测试更准确。
本系统综述结果的可信度如何?
除一项研究外,所有研究的方法学质量都很差,这使得研究的结果不可靠。
本系统综述结果的适用对象?
这些结果适用于疑似感染H pylori的儿童和成人,但仅适用于以前未接受过胃部手术和最近未接受过抗生素或H pylori感染治疗的人。
本系统综述的意义是什么?
尿素呼气测试、血液测试和粪便测试可能适用于确定某人是否感染了幽门螺杆菌 。然而,用于诊断感染幽门螺杆菌的尿素呼气试验、血液试验或粪便试验的结果水平仍不清楚。
本系统综述的时效性如何?
我们对报告这些不同测试准确性的研究进行了彻底的文献检索,截止日期为2016年3月4日。
Authors' conclusions
Summary of findings
| What is the best non‐invasive test for diagnosis of H pylori infection? | ||||
| Population | Children and adults with gastrointestinal symptoms | |||
| Setting | Primary care setting | |||
| Index tests | Urea breath test‐13C, Urea breath test‐14C, serology, and stool antigen test | |||
| Threshold | Various thresholds were used for each test | |||
| Role and purpose of test | Screening and diagnosis of H pylori | |||
| Reference standard | Endoscopic biopsy with Haemotoxylin & Eosin stain, special stains, or combination of Haemotoxylin & Eosin and special stains | |||
| Quality of evidence | Risk of bias was generally high or unclear with respect to the selection of participants, and the conduct and interpretation of the index tests and reference standard. Applicability concerns were also generally high or unclear with respect to selection of participants | |||
| Limitations | There was heterogeneity in thresholds and reference standards. Studies did not often prespecify or clearly report thresholds used | |||
| Pre‐test probability (prevalence of Helicobacter pylori) | Median (interquartile range) = 53.7% (42.0% to 66.5%) | |||
| Index test | Number of participants (studies) | Diagnostic odds ratio (95% CI) | Sensitivity (95% CI) at fixed specificity of 0.901 | Missed H pylori cases per 1000 people tested (95% CI)2 |
| Urea breath test‐13C | 3139 participants (34 studies) | 153 (95% CI 73.7 to 316) | 0.94 (0.89 to 0.97) | 30 (15 to 58) |
| Urea breath test‐14C | 1810 participants (21 studies) | 105 (95% CI 74.0 to 150) | 0.92 (0.89 to 0.94) | 42 (30 to 58) |
| Serology | 4242 participants (34 studies) | 47.4 (95% CI 25.5 to 88.1) | 0.84 (0.74 to 0.91) | 86 (50 to 140) |
| Stool antigen test | 2988 participants (29 studies) | 45.1 (95% CI 24.2 to 84.1) | 0.83 (0.73 to 0.90) | 89 (52 to 146) |
| Comparison of non‐invasive tests for H pylori infection Based on an indirect comparison of the four tests using all the studies, there was statistical evidence of a difference in diagnostic accuracy (P = 0.024). Direct comparisons were based on few head‐to‐head studies. The ratios of diagnostic odds ratios (95% CI; P value) were 0.68 (95% CI 0.12 to 3.70; P = 0.56) for urea breath test‐13C versus serology (seven studies), and 0.88 (95% CI 0.14 to 5.56; P = 0.84) for urea breath test‐13C versus stool antigen test (seven studies). The 95% confidence intervals of these estimates overlap with those of the ratios of diagnostic odds ratios from the indirect comparison. Data were limited or unavailable for meta‐analysis of other direct comparisons. | ||||
| Conclusions In people with no history of gastrectomy and those who have not recently had antibiotics or proton pump inhibitors, urea breath tests had high diagnostic accuracy while serology and stool antigen tests had lower accuracy to detect H pylori infection. Although susceptible to bias due to confounding, this conclusion is based on evidence from indirect test comparisons as evidence from direct comparisons was based on few studies or was unavailable. It should be noted that studies were generally of poor methodological quality. The thresholds used for the tests were highly variable and there is currently insufficient evidence to recommend specific thresholds for use in clinical practice. | ||||
| 1The sensitivities were estimated along the SROC curves at the median specificity across the studies included for the four tests. 2Based on the sensitivity estimated at the median specificity of 0.90, and the median prevalence of 53.7% from the included studies, the numbers of missed H pylori cases were calculated using a hypothetical cohort of 1000 people suspected of having H pylori infection. The 95% CI for the number of missed cases is from the 95% CI for sensitivity. For a specificity of 0.90 and prevalence of 53.7%, there will be 46 false positives. See Table 3 for results for other values of specificity and prevalence. | ||||
Background
Helicobacter pylori (H pylori) is a gram negative spiral bacterium (NCBI 2014). Approximately 13% to 81% of people have H pylori infection (Peleteiro 2014). Prevalence of the bacterium varies according to age (generally increasing with age, although infection rates tend to fall among older age groups in some Latin American and Northeast Asian countries); region (lower infection rates are seen in Australia and the UK, while higher rates are reported in Chile, China, Japan, Korea, and Latvia); race (more prevalent amongst Afrocarribeans compared to white people); and socioeconomic class (more common in poorer settings) (Graham 1991; Laszewicz 2014; Muhsen 2012; Peleteiro 2014).
Based on observational studies, H pylori infection has been implicated in a number of malignancies, including gastric cancer, premalignant lesions of the stomach (atrophic gastritis and intestinal metaplasia), gastric lymphoma, pancreatic cancer, colorectal cancer, and laryngeal cancer (Huang 1998; Huang 2003; Wu 2013; Xiao 2013; Xue 2001; Zhuo 2008). However, H pylori is associated with a lower incidence of oesophageal adenocarcinomas (Islami 2008). H pylori is also associated with a number of non‐malignant conditions, including peptic ulcers, non‐ulcer dyspepsia, recurrent peptic ulcer bleeding, unexplained iron deficiency anaemia, idiopathic thrombocytopaenia purpura, and colorectal adenomas (DuBois 2005; Franchini 2007; Gisbert 2004b; Huang 2002; Jaakkimainen 1999; Wu 2013).
Although a number of pathogenic factors such as cytotoxin‐associated gene A (CagA), vacuolating cytotoxin A (VacA), and blood group antigen binding adhesin (BabA) are associated with increased virulence of H pylori (Huang 2003; Malfertheiner 2012), detection of these pathogenic factors currently has no role in the management of H pylori infection (Malfertheiner 2012). The recommended initial treatment for H pylori infection is with a combination of a proton pump inhibitor, clarithromycin, and amoxicillin or metronidazole (triple therapy) in regions with low resistance to clarithromycin (< 20% resistance rate in the area), and the triple therapy along with bismuth (quadruple therapy) in regions with high resistance to clarithromycin (> 20% resistance rate in the area) (Malfertheiner 2012). If this results in failure of eradication, bismuth‐quadruple therapy or levofloxacin‐triple therapy (replacement of clarithromycin with levofloxacin in the classical triple therapy) when triple therapy was used as the initial treatment and levofloxacin‐triple therapy when bismuth quadruple therapy was used as the initial treatment is recommended (Malfertheiner 2012). If even this treatment fails to eradicate H pylori, then further treatment should be based on antibiotic susceptibility (Malfertheiner 2012). Eradication of H pylori might lead to a decrease in malignant and non‐malignant conditions associated with H pylori infection. Adverse events related to H pylori treatment include taste disturbance, diarrhoea, nausea, headache, skin rash, abdominal pain, dizziness, bloating, myalgias (muscle pain), and constipation (Ye 2014).
A glossary of terms is included in Appendix 1.
Target condition being diagnosed
Helicobacter pylori infection.
Index test(s)
Urea breath test
The urea breath test is based on the presence of urease enzyme in live H pylori which breaks down urea into ammonia and carbon dioxide (McNulty 2005; Ricci 2007). After ingestion of urea labelled with either 13C or 14C, breath samples are collected for up to 30 minutes by exhaling into a carbon dioxide‐trapping agent (Ricci 2007). The urea breath test is performed by the clinician or the clinician's assistant. The thresholds used include the percentage of carbon recovered during the collection time or counts per minute (Ferwana 2015). Threshold levels above 4% or 5% are commonly used to diagnose H pylori infection (Ferwana 2015). A wide range of threshold counts per minute, ranging from more than 25 counts per minute to 1000 counts per minute, have been used for diagnosis of H pylori infection (Ferwana 2015).
Serology
These tests are based on circulating antibodies to H pylori. There are three main methods for these tests: the enzyme‐linked immunosorbent assay (ELISA) test, latex agglutination tests, and Western blotting (Ricci 2007). Of these, ELISA is the most commonly used method. Total immunoglobulin, immunoglobulin subtypes, and antibody response to specific antigens can all be tested. Since they do not require any special equipment, they can be easily performed (Ricci 2007). However, serology may be positive because of the presence of active infection at the time of the test, previous infection, or because of non‐specific cross‐reacting antibodies (McNulty 2005). Tests that use whole blood (rather than serum) and other bedside tests (using a bedside centrifuge) are also available, although these whole‐blood tests and bedside serum tests are generally considered unreliable (Ricci 2007). Routine serum tests are performed by the laboratory technician and interpreted by the clinician. The bedside serum tests and whole‐blood tests are performed by the clinician or the clinician's assistant. Different researchers evaluating the prevalence of H pylori have used different thresholds to define the positivity of serology, for example Lindsetmo 2008 used a titre ≥ 300 while Granberg 1993 used a titre ≥ 500.
Stool antigen tests
These tests use monoclonal and polyclonal antibodies to detect the presence of H pylori antigen in stools and active H pylori infection can be diagnosed (McNulty 2005; Ricci 2007). Serum tests are performed by the laboratory technician and interpreted by the clinician. Several thresholds have been used for other tests, for example, an optical density of ≥ 0.15, ≥ 0.16, and ≥ 0.19 have all been used as thresholds for diagnosis of H pylori using monoclonal antibodies for stool antigen tests.
Clinical pathway
Evidence from randomised controlled trials (RCTs) showed that screening and eradication programmes for H pylori in populations at high risk of gastric cancer (e.g. East Asians) lowered the incidence of gastric cancer (Ford 2014). The Asia‐Pacific Gastric Cancer Consensus conference recommended that screening and eradication of H pylori was advisable in populations in countries at high risk of gastric cancer (i.e. Japan and Korea) (Talley 2008). The updated European Helicobacter Study Group (EHSG) Fourth Maastricht/Florence Consensus Conference guidelines suggest that people should be tested for H pylori, and eradication of H pylori (when present) has been recommended for the following conditions (Malfertheiner 2012):
-
People at high risk of gastric cancer.
-
Adults with dyspepsia with a locally‐determined age cut‐off point (depending on local incidence of gastric cancer in different age groups), and without ‘alarm’ symptoms or signs associated with an increased risk of gastric cancer such as weight loss, dysphagia, upper gastrointestinal bleeding, abdominal mass, or iron deficient anaemia.
-
Unexplained iron deficiency anaemia.
-
Idiopathic thrombocytopenic purpura.
-
Uninvestigated young patients with dyspepsia should also be considered for testing for H pylori when the prevalence of H pylori is high (≥ 20%).
The clinical pathway is shown in Figure 1.
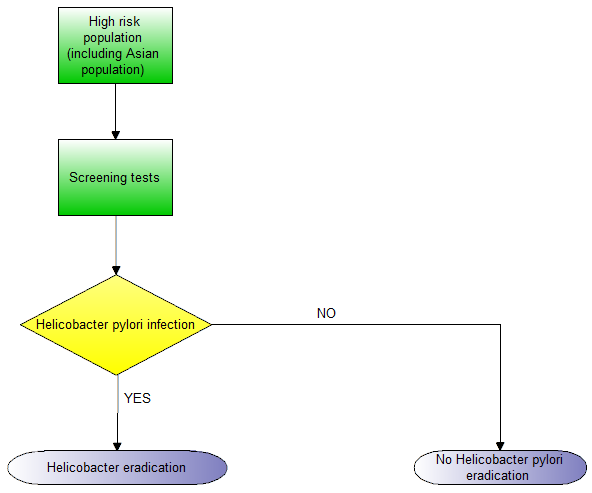
Clinical pathway
Prior test(s)
The index tests can be performed without any prior test.
Role of index test(s)
The index tests are used for screening and diagnosis of H pylori.
Alternative test(s)
Other tests used in the screening and diagnosis of H pylori infection include non‐invasive saliva and urine antigen‐based tests (Ricci 2007), and invasive gastric biopsy followed by Campylobacter‐like organism (CLO) test, culture, histology, and polymerase chain reaction (PCR) (Van Doorn 2000). We do not include non‐invasive saliva and urine antigen‐based tests in this review because these tests are not commonly used (Ricci 2007).
Rationale
Testing for H pylori and eradication of H pylori have been recommended for a number of population groups (Clinical pathway). These tests have to be non‐invasive so that a large number of people can be tested. People with undetected H pylori continue to be at high risk of gastric cancer or continue to have dyspepsia, anaemia, or purpura. Overdiagnosis (false positive test results) of H pylori means that patients are subject to unnecessary adverse events related to eradication therapy (approximately 27% of patients receiving eradication therapy develop mild adverse events such as bitter taste, nausea, diarrhoea, etc.). Comparing the diagnostic accuracy of different index tests will highlight the best test for the diagnosis of H pylori infection.
Objectives
To compare the diagnostic accuracy of urea breath test, serology, and stool antigen test, alone or in combination, for diagnosis of H pylori infection in symptomatic and asymptomatic people, so that eradication therapy for H pylori can be started.
Secondary objectives
To investigate the following potential sources of heterogeneity: type of reference standard, risk of bias, publication status, prospective versus retrospective studies, symptomatic versus asymptomatic participants, recent or current use of proton pump inhibitors or antibiotics, different subtypes of tests, and the interval between the index test and reference standard.
Methods
Criteria for considering studies for this review
Types of studies
We include studies that evaluate the accuracy of the index tests in the appropriate patient population (see Participants), regardless of language or publication status, or whether data were collected prospectively or retrospectively. However, we exclude reports that describe how the diagnosis of H pylori was made in an individual patient or group of patients, and which do not provide sufficient diagnostic test accuracy data (i.e. the number of true positives, false positives, false negatives, and true negatives). We also exclude case‐control studies because these are prone to bias (Whiting 2011).
Participants
Symptomatic and asymptomatic people in whom H pylori infection status is sought so that eradication therapy for H pylori can be started. We exclude studies that included only people with acute upper gastrointestinal bleeding because such patients are likely to undergo endoscopy and invasive testing can be performed, if required.
Index tests
Urea breath test‐14C, urea breath test‐13C, serology, and stool antigen test, alone or in combination. We included only initial testing and excluded repeat testing (monitoring success of treatment), since diagnostic accuracy may vary depending on the purpose of testing (Ricci 2007).
Target conditions
H pylori infection.
Reference standards
There is no gold standard for diagnosis of H pylori infection and the diagnosis is made by a combination of tests following endoscopic biopsy; endoscopic biopsy followed by histology, endoscopic biopsy followed by polymerase chain reaction (PCR), and endoscopic biopsy followed by rapid urease testing all have excellent sensitivity and specificity (Chey 2007). However, PCR methodology is not standardised across laboratories (Chey 2007); it is an unreliable reference standard. Endoscopic biopsy followed by rapid urease testing has poor sensitivity following treatment with proton pump inhibitors (Chey 2007). Endoscopic biopsy with culture has high specificity but poor sensitivity (Chey 2007). We therefore considered only endoscopic biopsy followed by histology (using haemotoxylin and eosin (H & E) stain, special histological stains such as Giemsa stain and Warthin‐Starry stain, or immunohistochemical stain) as the reference standard in this review.
Immunohistochemical stains are more accurate than special stains, while special stains and immunohistochemical stains are thought to have better specificity than H & E stains for diagnosis of H pylori infection (Laine 1997; Lee 2015b). For this reason,we considered endoscopic biopsy with histology using immunohistochemical stain as the best reference standard, and endoscopic biopsy with histology using H & E stain as the worst reference standard.
Search methods for identification of studies
We included all studies, irrespective of the language of publication and publication status. If we found articles in languages other than English, we obtained translations.
Electronic searches
We searched the following databases.
-
MEDLINE via OvidSP (January 1946 to 4 March 2016) (Appendix 2).
-
Embase via OvidSP (January 1947 to 4 March 2016) (Appendix 3).
-
Science Citation Index Expanded via Thomson Reuters Web of Science (January 1980 to 4 March 2016) (Appendix 4).
-
National Institute for Health Research (NIHR HTA) via Centre for Reviews and Dissemination, University of York. (www.crd.york.ac.uk/CRDWeb/) (4 March 2016) (Appendix 5).
Searching other resources
To identify additional studies, we examined references in the included studies to see if any might be relevant. We also searched for articles related to the included studies by using the 'related search' function in MEDLINE (OvidSP) and Embase (OvidSP). We conducted a 'citing reference' search (by searching articles which cited the included articles) (Sampson 2008) in MEDLINE (OvidSP) and Embase (OvidSP) on 4 December 2016.
Data collection and analysis
Selection of studies
Two review authors (KG and LB, SS, or AS) independently searched the references to identify relevant studies. We obtained the full text for references considered relevant by at least one of the two review authors. Two review authors independently screened the full‐text papers against the inclusion criteria, resolving any differences in study selection by discussion. We attempted to contact study authors if there were doubts about the eligibility of a study.
Data extraction and management
Two review authors (KG and LB, SS, or AS) independently extracted the following data from each included study, using a pre‐piloted data extraction form, and resolving differences by discussion.
-
First author.
-
Year of publication.
-
Study design (prospective or retrospective cohort studies; cross‐sectional studies or randomised controlled trials).
-
Inclusion and exclusion criteria for individual studies.
-
Total number of participants.
-
Number of female participants.
-
Average age of the participants.
-
Initial testing versus testing after eradication.
-
Number of people with bleeding ulcers, gastric atrophy, lymphoma, and recent or current use of proton pump inhibitors or antibiotics.
-
Number of symptomatic participants.
-
Tests carried out prior to the index test.
-
Description of the index test.
-
Threshold used for the index test.
-
Reference standard.
-
Number of true positives, false positives, false negatives, and true negatives (i.e. 2 x 2 data) at each threshold reported.
If a study reported multiple index tests, we extracted the 2 x 2 data for each index test at each threshold. For studies that reported test accuracy for different reference standards, we extracted 2 x 2 data for only one of the reference standards. For this purpose, due to the accuracy of the stains, we preferred the immunohistochemical stain over special stains, which in turn we preferred over the H & E stain.
Although the number of uninterpretable index test results may provide information on the applicability of the tests in clinical practice and may affect the cost effectiveness of a test, we had planned to exclude patients with uninterpretable index test results from the meta‐analyses. We made this decision because in clinical practice uninterpretable index test results would result in additional testing. Nevertheless, we would have extracted and reported such data if available from the studies.
If we suspected an overlap of participants between multiple reports due to common study authors and centres, we planned to contact the study authors for clarification; however, this was not required, since we could identify multiple reports of the same study using the information provided in the reports. We sought further information from study authors, if necessary.
Assessment of methodological quality
Two review authors independently assessed study quality using the QUADAS‐2 tool (Whiting 2006; Whiting 2011), resolving differences by discussion. The criteria used for the assessment are shown in Appendix 6. We considered studies classified as 'low risk of bias' and 'low concern' in all the domains of the QUADAS‐2 tool as studies with high methodological quality. It must be noted here that 'risk of bias' refers to internal validity (i.e. whether there were systematic errors in performing the study with respect to the particular domain), while 'applicability concern' refers to external validity (i.e. whether there were concerns that the population, index test or reference standard used in the studies matched the review question).
Statistical analysis and data synthesis
We plotted study estimates of sensitivity and specificity on forest plots and in receiver operating characteristic (ROC) space to explore between‐study variation in the accuracy of each test. We examined the thresholds reported for each test and the reference standards used. Due to between‐study variation in thresholds, we performed meta‐analyses by using the hierarchical summary receiver operating characteristics (HSROC) model to estimate SROC curves (Rutter 2001). For these analyses, if a study reported test accuracy at multiple thresholds, we selected the threshold used by the study authors for their primary analysis.
Prior to comparative meta‐analyses of the tests, we performed meta‐analysis of each test separately for preliminary investigation of the shape of the SROC curve of each test and to assess heterogeneity in test performance. We used this approach to understand the data and to guide modelling assumptions we may need to make in the comparative meta‐analysis. These preliminary analyses were done noting the availability of comparative studies. To compare the accuracy of the index tests, we added test type as a covariate to the HSROC model (Macaskill 2013). For the indirect comparison where we used all available data (i.e. not restricted to comparative studies), we assessed the effect of test type on the accuracy, threshold, and shape parameters of the HSROC model. We also explored the effect of test type on the variance of the random effects for accuracy and threshold. To determine the final meta‐analytic model, we used likelihood ratio tests to assess model fit. Likelihood ratio tests were also used to determine the statistical significance of differences in test accuracy. When SROC curves are symmetric (i.e. HSROC model without the shape parameter), each curve can be described using the diagnostic odds ratio (DOR) to quantify the accuracy of the test. We used the ratio of DORs as a summary of the relative accuracy of two tests.
Summary sensitivities and specificities can be obtained from a HSROC model but they are not clinically interpretable here because we included studies with different thresholds. We therefore estimated sensitivities at points on the SROC curves that correspond to the lower quartile, median and upper quartile of the specificities from the studies included in the meta‐analysis. When comparative studies that had evaluated two tests head‐to‐head were available, we performed direct comparisons of the tests (Takwoingi 2013). For these analyses, we fitted HSROC models with symmetric SROC curves, as the available data were insufficient for reliable estimation of the shape of the SROC curves (Takwoingi 2017).
If there were at least two studies that reported the accuracy of a test at the same threshold, we considered meta‐analysis to obtain summary estimates of sensitivity and specificity. Due to the small number of studies in these analyses, we performed meta‐analyses using univariate fixed‐effect or random‐effects logistic regression models, depending on the extent of heterogeneity observed in forest plots and in ROC space (Takwoingi 2017). When there were only two or three studies at the same threshold, and little or no heterogeneity observed in ROC space, we used univariate fixed‐effect logistic regression models to pool sensitivities and specificities separately. When there were two or three studies and we observed heterogeneity, we did not perform meta‐analysis, as random‐effects models would be more appropriate in such situations. However, random effects cannot be reliably estimated with very few studies.
We performed meta‐analyses using the NLMIXED procedure in SAS.
Investigations of heterogeneity
We used forest plots and scatter plots of sensitivity against specificity for preliminary investigation of potential sources of heterogeneity such as:
-
Type of reference standard (different histological stains).
-
Studies at low risk of bias in all the QUADAS‐2 domains versus those at unclear or high risk of bias.
-
Full‐text publications versus abstracts (may provide insight into publication bias if there is an association between the results of a study and full publication of the study) (Eloubeidi 2001).
-
Prospective versus retrospective studies.
-
Symptomatic versus asymptomatic participants.
-
Recent or current use of proton pump inhibitors or antibiotics, as these patients are at higher risk of false negative results for the urea breath test and stool antigen test, with serology being the only non‐invasive test unaffected by the use of proton pump inhibitors or antibiotics (Malfertheiner 2012; Ricci 2007).
-
Different subtypes of tests (ELISA, latex agglutination test, and Western blot methods of serological tests; formal serological tests versus bedside serological tests; and monoclonal versus polyclonal antibodies for stool antigen tests).
-
Interval between index test and reference standard. Resolution of H pylori infection in people with H pylori infection (usually with treatment) and infection in those without H pylori infection may occur if there was a long interval between the index test and reference standard.
We formally investigated heterogeneity for each test by adding a covariate to a HSROC model (meta‐regression). We used likelihood ratio tests to assess the statistical significance of differences in test accuracy by comparing models with and without the covariate.
Sensitivity analyses
We planned to examine the impact of data inconsistencies on the meta‐analytic findings. For example, if test accuracy data reported in the text of a paper differed from those in the figures, we planned to assess the impact of using different data in sensitivity analyses; however, we did not find such inconsistencies.
Assessment of reporting bias
Due to limited data, we were unable to formally investigate whether test accuracy differed between studies that were published as full texts and those available only as abstracts.
Results
Results of the search
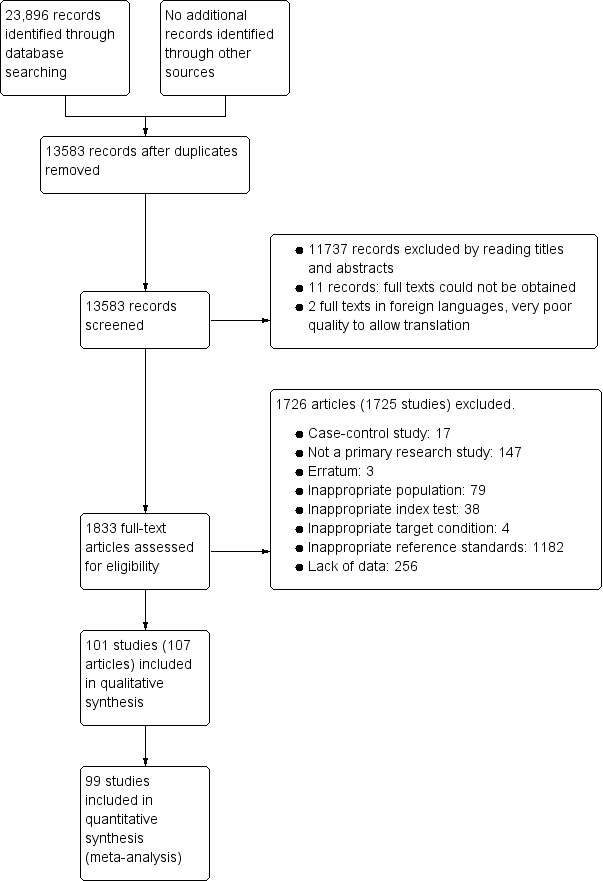
We identified 23,896 references through electronic searches of MEDLINE, Embase, Science Citation Index, and NIHR HTA. We did not identify additional references through other searches. The flow of studies through the screening process is shown in Figure 2. After removing 10,313 duplicates, there were 13,583 references. Of these, we dropped 11,737 irrelevant references through reading the titles and abstracts. We could not obtain the full text of 11 references. The quality of copies of two references was too poor to allow translation and we were unable to obtain better copies. We assessed the full text of the remaining 1833 references. We excluded 1728 references (1727 studies) for reasons stated in Appendix 7 (also see Characteristics of excluded studies below). The remaining 107 references (101 studies) met our inclusion criteria. Two references reported diagnostic accuracy data separately for people who underwent gastrectomy and those who did not undergo gastrectomy, and so we considered these subgroups as separate studies (Adamopoulos 2009a; Adamopoulos 2009b; Sheu 1998a; Sheu 1998b).

Study flow diagram.
Characteristics of included studies
We summarise the characteristics of the 101 included studies in the Characteristics of included studies table. The studies included 11,003 participants, of which 5839 participants (53.1%) had H pylori infection. The prevalence of H pylori infection ranged from 15.2% to 94.7% with a median of 53.7% (interquartile range: 42.0% to 66.5%).
Of the 101 studies, 34 evaluated urea breath test‐13C; 21 evaluated urea breath test‐14C; two evaluated urea breath test but did not report the isotope used; 34 evaluated serology; and 29 evaluated stool antigen test. Seventeen studies evaluated more than one test. Of these, 15 evaluated two tests (Dede 2015; El‐Din 2013; Eltumi 1999; Hafeez 2007; Inelmen 2004; Korstanje 2006; Kuloglu 2008; Lahner 2004; Lottspeich 2007; Mansour‐Ghanaei 2011; Ogata 2001; Soomro 2012; Vandenplas 1992; Yoshimura 2001; Yu 2001), and two evaluated three tests (Monteiro 2001a; Salles‐Montaudon 2002). Studies used different thresholds, with 15 studies reporting test accuracy at more than one threshold (Chey 1998; Dede 2015; Delvin 1999; Formichella 2013; Ladas 2002a; Mana 2001a; Misawa 1998; Monteiro 2001a; Morales 1995; Noguera 1998; Novis 1991; Ozturk 2003; Trevisani 2005; Weiss 1994; Yu 2001).
Eleven studies were prospective (Adamopoulos 2009a; Adamopoulos 2009b; Al‐Fadda 2000; Arikan 2004; Dede 2015; Eltumi 1999; Fallone 1995; Kalach 1998a; Kuloglu 2008; Ogata 2001; Qadeer 2009); six studies were retrospective (Bosso 2000; Czerwionka‐Szaflarska 2007; Graham 1996a; Iqbal 2013; Mion 1994; Wardi 2012), while the remaining 84 studies did not state whether they were prospective or retrospective studies. Six studies were published as abstracts only (Han 2012; Mohammadian 2007; Rathbone 1986; Sheu 1998a; Sheu 1998b; Thobani 1995), and the remaining 95 were full‐text publications.
Fourteen studies included only children (Argentieri 2007; Behrens 1999; Czerwionka‐Szaflarska 2007; Delvin 1999; Dinler 1999; Eltumi 1999; Hafeez 2007; Kalach 1998a; Kuloglu 2008; Lottspeich 2007; Ogata 2001; Rafeey 2007; Vandenplas 1992; Yoshimura 2001). Five studies clearly included only adults (Atli 2012; Chen 1991; Kamel 2011; Safe 1993; Salles‐Montaudon 2002). Although not clearly specified in the remaining 82 studies, it appeared that most or all of the participants were adults. The mean or median age of the participants included in these studies ranged between 31 years and 85 years in the 45 studies that reported this information. One study included only participants without symptoms (Wang 2008). Fifty‐eight studies included only participants with symptoms, usually abdominal pain or dyspepsia (Adamopoulos 2009a; Adamopoulos 2009b; Aguilar 2007; Al‐Fadda 2000; Allardyce 1997; Behrens 1999; Bosso 2000; Ceken 2011; Chen 1991; Czerwionka‐Szaflarska 2007; D'Elios 2000; Delvin 1999; Dinler 1999; Ekesbo 2006; El‐Din 2013; El‐Mekki 2011; El‐Nasr 2003; Eltumi 1999; Fanti 1999; Faruqui 2007; Ferrara 1998; Germana 2001; Guo 2011; Gurbuz 2005; Hafeez 2007; Jordaan 2008; Kamel 2011; Kuloglu 2008; Ladas 2002a; Lahner 2004; Lee 1998; Lottspeich 2007; Mansour‐Ghanaei 2011; Mion 1994; Misawa 1998; Mohammadian 2007; Morales 1995; Novis 1991; Ogata 2001; Ozturk 2003; Peitz 2001; Qadeer 2009; Rafeey 2007; Rasool 2007; Rathbone 1986; Safe 1993; Scuderi 2000; Segamwenge 2014; Selcukcan 2011; Sharbatdaran 2013; Sheu 1998a; Soomro 2012; Surveyor 1989; Thobani 1995; Vandenplas 1992; Villalobos 1992; Weiss 1994; Yoshimura 2001). The remaining 42 studies did not report the type of participants included. Five studies included only participants who had previously undergone gastrectomy (Adamopoulos 2009b; Lombardo 2003; Schilling 2001; Sheu 1998b; Wardi 2012). Two studies included only participants with atrophic gastritis (Korstanje 2006; Ogata 2001). It was clear that participants who received recent proton pump inhibitors or antibiotics were excluded from 53 studies (Ceken 2011; Chey 1998; Debongnie 1991; D'Elios 2000; Delvin 1999; Duan 1999; El‐Mekki 2011; El‐Nasr 2003; Eltumi 1999; Fallone 1996; Fanti 1999; Ferrara 1998; Formichella 2013; Germana 2001; Guo 2011; Gurbuz 2005; Jekarl 2013; Jensen 1998; Jordaan 2008; Kalach 1998a; Kim 2016; Kuloglu 2008; Ladas 2002a; Lahner 2004; Lee 1998; Lombardo 2003; Lottspeich 2007; Mana 2001a; Mansour‐Ghanaei 2011; Monteiro 2001a; Ogata 2001; Ozturk 2003; Peitz 2001; Peura 1996; Puspok 1999; Qadeer 2009; Rafeey 2007; Rasool 2007; Schilling 2001; Segamwenge 2014; Selcukcan 2011; Sharbatdaran 2013; Shin 2009; Tiwari 2014; Trevisani 2005; Vandenplas 1992; Villalobos 1992; Wang 2008; Weiss 1994; Yan 2003; Yoshimura 2001; Yu 1999; Yu 2001). It was not clear whether such participants were included or excluded in the remaining 48 studies.
Thirty‐two studies used H & E stain as a reference standard (Aguilar 2007; Al‐Fadda 2000; Arikan 2004; Atli 2012; Behrens 1999; Ceken 2011; Chen 1991; Chey 1998; Czerwionka‐Szaflarska 2007; D'Elios 2000; Dinler 1999; Eggers 1990; El‐Nasr 2003; Fallone 1996; Faruqui 2007; Graham 1996a; Gramley 1999; Gurbuz 2005; Iqbal 2013; Jordaan 2008; Kalach 1998a; Kamel 2011; Lee 1998; Logan 1991a; Noguera 1998; Puspok 1999; Segamwenge 2014; Selcukcan 2011; Sheu 1998a; Sheu 1998b; Tiwari 2014; Yu 2001); 24 studies used special stains such as Warthin‐Starry stain, Giemsa stain, or silver stain (Argentieri 2007; Bosso 2000; El‐Din 2013; Fallone 1995; Guo 2011; Hafeez 2007; Han 2012; Ivanova 2010; Kim 2016; Ladas 2002a; Lahner 2004; Mion 1994; Mohammadian 2007; Morales 1995; Novis 1991; Ozturk 2003; Peura 1996; Qadeer 2009; Schilling 2001; Scuderi 2000; Shin 2009; Soomro 2012; Villalobos 1992; Yan 2003); two studies used immunohistochemical staining (Ekesbo 2006; Misawa 1998); and the remaining 43 studies used a combination of different stains.
The interval between the index test and reference standard was reported only in 21 studies. The interval was less than two weeks in 19 of the 21 studies (Adamopoulos 2009a; Adamopoulos 2009b; Bosso 2000; Debongnie 1991; Duan 1999; Fallone 1995; Fallone 1996; Formichella 2013; Gurbuz 2005; Hafeez 2007; Lahner 2004; Lee 1998; Logan 1991a; Lottspeich 2007; Mansour‐Ghanaei 2011; Mion 1994; Ozturk 2003; Peura 1996; Safe 1993), and was between 15 days and 23 days in one study (Dede 2015); it was within 30 days in the remaining study (Lombardo 2003).
Characteristics of excluded studies
We excluded 1726 references (1725 studies). The reason for exclusion is stated for each study in Appendix 7 and summarised below.
-
Case‐control study: 17
-
Not a primary research study: 147
-
Erratum: 3
-
Inappropriate population: 79
-
In monitoring: 33
-
Not in humans: 1
-
Only in H pylori negative people: 2
-
Only in H pylori positive people: 39
-
Only in people with gastrointestinal bleeding: 2
-
Selection of participants was based on the results of other H pylori tests: 1
-
Includes people who were being monitored for H pylori status: 1
-
-
Inappropriate index test: 38
-
Inappropriate target condition: 4
-
Inappropriate reference standards: 1182
-
Lack of data: 256
-
Insufficient diagnostic test accuracy data: 25
-
No diagnostic accuracy data: 42
-
Not a diagnostic test accuracy study of non‐invasive H pylori diagnosis: 188
-
Incorrect data (correct information could not be obtained): 1
-
Methodological quality of included studies
The methodological quality of the included studies is summarised across all studies in Figure 3. None of the included studies was of high methodological quality (i.e. low risk of bias in all the domains). Appendix 8 shows the results for individual studies for urea breath test‐13C, urea breath test‐14C, serology and the stool antigen test, respectively.

Risk of bias and applicability concerns graph: review authors' judgements about each domain presented as percentages across included studies. For each domain, the numbers shown on the bar represent the number of studies that were scored as high, unclear or low in terms of risk of bias or applicability concern.
Patient selection domain
In the patient selection domain, 23, 15 and 63 studies were at low, high and unclear risk of bias, respectively. All 15 studies were at high risk of bias because they did not include a consecutive or random series of participants.
Twenty‐five, seven and 69 studies were of low, high and unclear applicability concern. In the 69 studies of unclear applicability concern it was not clear whether participants similar to those seen in the clinical setting where the test is used were excluded, while the seven studies of high concern clearly excluded such participants. In these seven studies, only people who had undergone gastrectomy or those with atrophic gastritis were included.
Index test domain
In the index test domain, studies generally had an unclear risk of bias because it was unclear whether the index test results were interpreted without the knowledge of the results of the reference standard, and/or it was unclear whether a threshold was prespecified.
Urea breath test
None of the studies that evaluated the urea breath test (13C, 14C, or unknown isotope) were at low risk of bias. The risk of bias was unclear in the two studies that did not report the type of isotope (Han 2012; Lombardo 2003). Of the 34 studies that evaluated urea breath test‐13C, seven (21%) had a high risk of bias while 27 (79%) had unclear risk of bias. There were 21 studies of urea breath test‐14C, 16 (76%) of which had unclear risk of bias while five (24%) had high risk of bias.
For the two studies with unknown isotope, applicability concern was high in one study and low in the other. Of the 34 urea breath test‐13C studies, applicability concerns were unclear for two (6%) studies, high for six (18%) studies and low for 26 (76%) studies. For urea breath test‐14C, applicability concerns were generally low (18/21; 86%) with only three studies having high applicability concerns (Selcukcan 2011; Surveyor 1989; Yu 1999) .
Serology
One study (Ladas 2002a), had a low risk of bias.and another study (Rathbone 1986), had a high risk of bias. The risk of bias for the remaining 32 (94%) studies was unclear. Applicability concerns were low in 19 (56%) studies and high in 15 (44%) studies.
Stool antigen test
None of the 29 studies had a high risk of bias. Most of the studies (26/29; 90%) had an unclear risk of bias; three studies (Islam 2005; Kuloglu 2008; Sharbatdaran 2013), had a low risk of bias. All the studies were of low applicability concern.
Reference standard domain
Two studies were at low risk of bias in the reference standard domain (Fallone 1995; Ladas 2002a). For 27 studies, the risk of bias was unclear because it was not clear whether reference standard results were interpreted without knowledge of the results of the index tests. The remaining 72 studies were at high risk of bias because the reference standard was endoscopic biopsy with H & E stain in some or all participants.
All the studies were of low applicability concern.
Flow and timing domain
Seven studies were at low risk of bias in the flow and timing domain. The risk of bias was unclear for 74 studies because the interval between the index test and reference standard was unclear or it was unclear whether all participants were included in the analysis. The remaining 20 studies were at high risk of bias because some participants were clearly excluded from the analysis. These studies did not report the reference standard results for the excluded participants. None of the studies reported indeterminate results (i.e. there were no indeterminate index test results in studies which provided a clear participant flow and none of the exclusions were due to indeterminate index test results).
Findings
Urea breath test‐13C
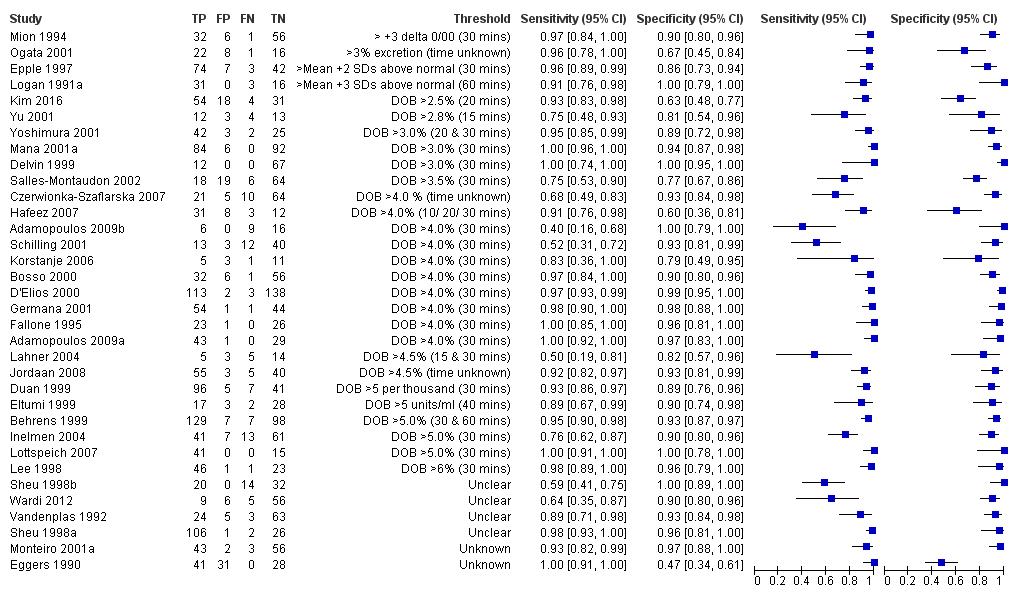
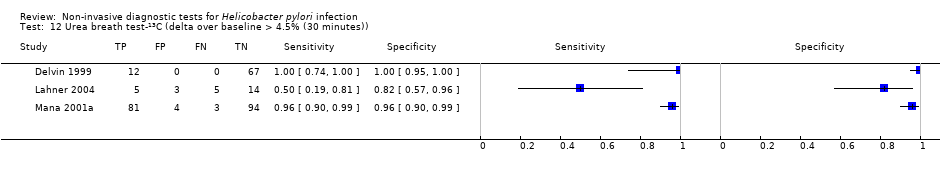
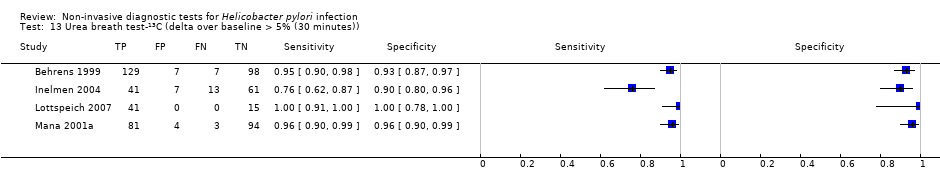
The 34 studies of urea breath test‐13C included 3139 participants, of whom 1526 had H pylori infection (Figure 4). The threshold used in six studies was either unknown (Eggers 1990; Monteiro 2001a), or unclear (Sheu 1998a; Sheu 1998b; Vandenplas 1992; Wardi 2012). At the most commonly reported threshold of delta over baseline > 4% (30 minutes after administration of urea), the summary sensitivity (95% confidence interval (CI)) and specificity (95% CI) from 10 studies (958 participants) were 0.95 (95% CI 0.79 to 0.99) and 0.95 (95% CI 0.87 to 0.98). Other thresholds were used by a limited number of studies (Figure 5; Appendix 9). When possible we performed meta‐analysis to estimate summary sensitivities and specificities at these common thresholds. The results are presented in Table 1.

Forest plot of urea breath test‐13C.FN = false negative; FP = false positive; TN = true negative; TP = true positive. The forest plot shows an estimate of sensitivity and specificity from each study and the threshold used. Studies are sorted by threshold, sensitivity and specificity. For threshold, the number of minutes in brackets is the time after administration of urea.

Forest plot of urea breath test‐13C at commonly reported thresholds. FN = false negative; FP = false positive; TN = true negative; TP = true positive. Thresholds are shown in brackets and the number of minutes in brackets is the time after administration of urea.
| Threshold | Studies | Number of participants (cases) | Sensitivity (95% CI) | Specificity (95% CI) |
| Urea breath test‐13C | ||||
| Delta over baseline > 3% (20 minutes) | 2 | 254 (128) | 0.98 (0.90 to 1.00) | 0.92 (0.82 to 0.97) |
| Delta over baseline > 3% (30 minutes) | 3 | 333 (140) | 0.99 (0.92 to 1.00) | 0.95 (0.90 to 0.98) |
| Delta over baseline > 3.5% (30 minutes) | 3 | 368 (120) | 0.75 to 1.00 | 0.77 to 1.00 |
| Delta over baseline > 4% (10 minutes) | 2 | 236 (118) | 0.91 to 1.00 | 0.60 to 0.95 |
| Delta over baseline > 4% (20 minutes) | 2 | 236 (118) | 0.91 to 1.00 | 0.60 to 0.96 |
| Delta over baseline > 4% (30 minutes) | 10 | 958 (423) | 0.95 (0.79 to 0.99) | 0.95 (0.87 to 0.98) |
| Delta over baseline > 4.5% (30 minutes) | 3 | 288 (106) | 0.50 to 0.96 | 0.82 to 0.96 |
| Delta over baseline > 5% (30 minutes) | 4 | 601 (315) | 0.95 (0.49 to 1.00) | 0.94 (0.84 to 0.98) |
| Urea breath test‐14C | ||||
| Counts per minute > 50 (10 minutes) | 6 | 471 (231) | 0.89 (0.55 to 0.98) | 0.91 (0.79 to 0.96) |
| Disintegrations per minute > 200 (10 minutes) | 4 | 296 (132) | 0.95 (0.33 to 1.00) | 0.95 (0.80 to 0.99) |
| Serology | ||||
| > 7 units/ml | 2 | 97 (48) | 0.98 (0.74 to 1.00) | 0.71 (0.51 to 0.86) |
| ≥ 300 unit | 2 | 234 (143) | 0.91 (0.82 to 0.96) | 0.86 (0.72 to 0.93) |
Tests evaluated at the same threshold by more than one study are presented in the table. When there were two or three studies at the same threshold, and little or no heterogeneity was observed in ROC space, estimates of summary sensitivity and summary specificity were obtained by using univariate fixed‐effect logistic regression models to pool sensitivities and specificities separately. When there were two or three studies and we observed heterogeneity, we did not perform meta‐analysis but report the range of the sensitivities and specificities.
Urea breath test‐14C
Figure 6 shows the 21 studies of urea breath test‐14C. The studies included 1810 participants (involving 1018 H pylori cases). Three studies did not state the thresholds used (Selcukcan 2011; Surveyor 1989; Yu 1999). The two most commonly used thresholds were counts per minute > 50 (10 minutes after administration of urea) in six studies (471 participants) and disintegrations per minute > 200 (10 minutes) in four studies (296 participants) (Table 1). Test accuracy results for other thresholds are shown in Appendix 9. The summary sensitivity (95% CI) and specificity (95% CI) at the counts per minute > 50 threshold were 0.89 (95% CI 0.55 to 0.98) and 0.91 (95% CI 0.79 to 0.96). For the disintegrations per minute > 200 threshold, the summary sensitivity (95% CI) and specificity (95% CI) were 0.95 (95% CI 0.33 to 1.00) and 0.95 (95% CI 0.80 to 0.99).

Forest plot of urea breath test‐14C. FN = false negative; FP = false positive; TN = true negative; TP = true positive. The forest plot shows an estimate of sensitivity and specificity from each study and the threshold used. Studies are sorted by threshold, sensitivity and specificity. For threshold, the number of minutes in brackets is the time after administration of urea.
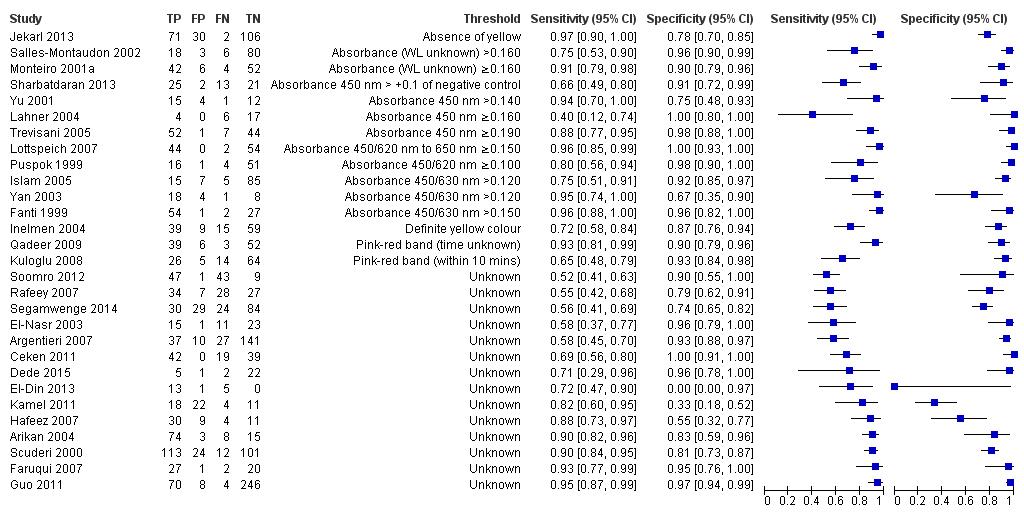
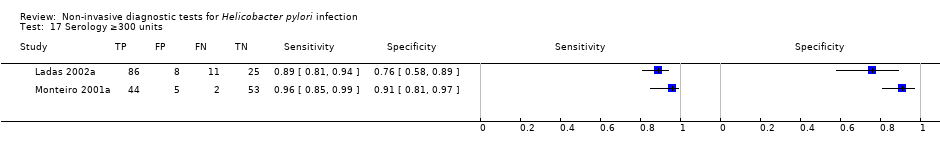
Serology
Serology was evaluated in 34 studies with a total of 4242 participants, of whom 2477 had H pylori infection (Figure 7). There was considerable variation in the thresholds used but 14 (41%) studies did not state the thresholds used. A threshold of > 7 units/ml was used in two studies (Iqbal 2013; Ogata 2001), involving 97 participants, and two studies involving 234 participants (Ladas 2002a; Monteiro 2001a) used a threshold of ≥ 300 units (Table 1). The summary sensitivity (95% CI) and specificity (95% CI) at the > 7 units/mL threshold were 0.98 (95% CI 0.74 to 1.00) and 0.71 (95% CI 0.51 to 0.86), and 0.91 (95% CI 0.82 to 0.96) and 0.86 (95% CI 0.72 to 0.93) for the ≥ 300 units threshold.

Forest plot of serology. FN = false negative; FP = false positive; SD = standard deviation; TN = true negative; TP = true positive. The forest plot shows an estimate of sensitivity and specificity from each study and the threshold used. Studies are sorted by threshold, sensitivity and specificity. Other threshold is staining of a 120kDa protein (CagA) gel band and/or at least two of five proteins between 28–33 kDa.
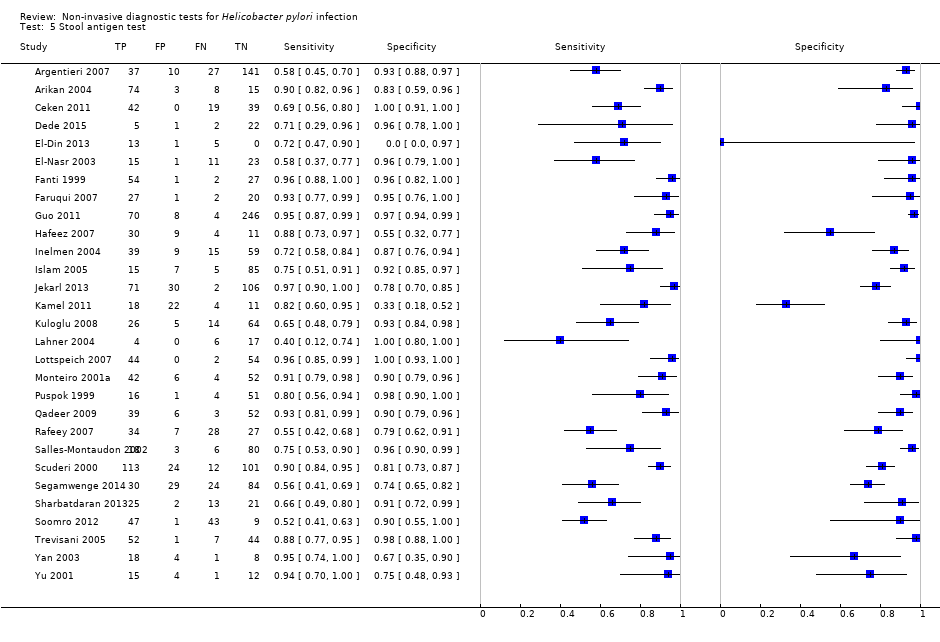
Stool antigen test
Twenty‐nine studies assessed the stool antigen test in 2988 participants (including 1311 H pylori cases) (Figure 8). The threshold used was unknown in almost half of the studies (14/29, 48%). None of the thresholds reported were used by more than one study. Summary estimates of sensitivity and specificity were therefore not obtained at a common threshold.

Forest plot of stool antigen test. FN = false negative; FP = false positive; TN = true negative; TP = true positive; WL = wavelength. The forest plot shows an estimate of sensitivity and specificity from each study and the threshold used. Studies are sorted by threshold, sensitivity and specificity.
Comparative accuracy of non‐invasive tests for H pylori infection
Comparison based on all studies (Indirect test comparison)
Across the four tests (urea breath test‐13C, urea breath test‐14C, serology and stool antigen test) 99 studies (5694 cases; 10799 participants) were included in this comparative meta‐analysis (Figure 9). Preliminary assessment of each test separately indicated there was no significant association between test accuracy and threshold, and so a symmetric SROC curve is plausible for each test. Based on these preliminary assessments, and likelihood ratio tests comparing different HSROC meta‐regression models with covariate terms for test type and examination of the variance parameters in these models, the final model we fitted allowed for differences in accuracy and threshold as random effects (i.e. unequal variances for the random effects) with symmetric SROC curves for the tests. Overall, there was statistical evidence of a difference in accuracy (P = 0.024). The DORs (95% CI) for urea breath test‐13C, urea breath test‐14C, serology and stool antigen test were 153 (95% CI 73.7 to 316), 105 (95% CI 74.0 to 150), 47.4 (95% CI 25.5 to 88.1) and 45.1 (95% CI 24.2 to 84.1) respectively (Table 2). The accuracy of urea breath tests (13C and 14C) was significantly higher than that of serology and stool antigen test. For example, the ratio of DORs (95%) for urea breath test‐13C compared to serology was 3.22 (95% CI 1.24 to 8.37), P = 0.017.
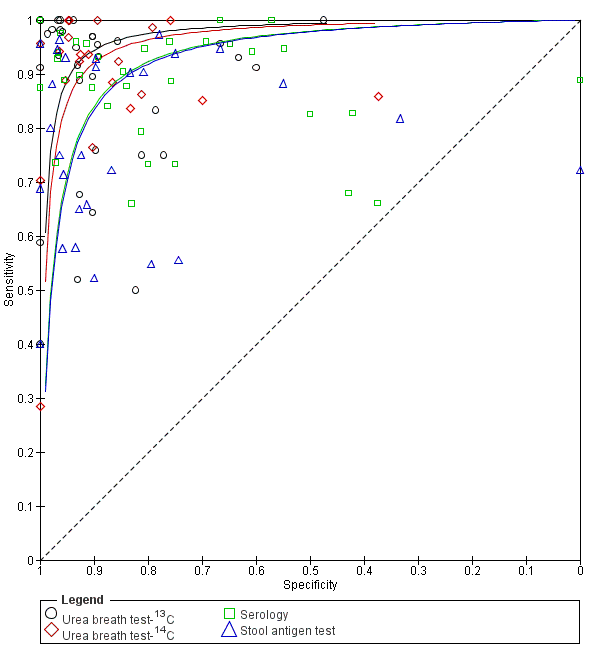
Summary ROC plot of non‐invasive tests for H pylori infection. The SROC curves for the four tests are parallel. The curve for each test is drawn within the range of estimates of specificity from the studies included for the test.
| Index tests | Studies; participants (H pyloripresent) | DOR (95% CI) | Ratio of diagnostic odds ratios (95% CI), P value | ||
| Urea breath test‐13C | Urea breath test‐14C | Serology | |||
| Urea breath test‐13C | 34; 3139 (1526) | 153 (73.7 to 316) | ‐ | ‐ | ‐ |
| Urea breath test‐14C | 21; 1810 (1018) | 105 (74.0 to 150) | 1.45 (0.65 to 3.26), P = 0.36 | ‐ | ‐ |
| Serology | 34; 4242 (2477) | 47.4 (25.5 to 88.1) | 3.22 (1.24 to 8.37), P = 0.017 | 2.22 (1.09 to 4.51), P = 0.028 | ‐ |
| Stool antigen test | 29; 2988 (1311) | 45.1 (24.2 to 84.1) | 3.39 (1.30 to 8.83), P = 0.013 | 2.33 (1.14 to 4.76), P = 0.020 | 1.05 (0.44 to 2.53), P = 0.91 |
The indirect comparison included all studies that evaluated at least one of the four tests, i.e. all available data. The ratio of diagnostic odds ratios is the diagnostic odds ratio (DOR) of the test in the column divided by the DOR of the test in the row. If the ratio is greater than one, then the test in the column is more accurate than the test in the row; if the ratio is less than one, the test in the row is more accurate than the test in the column.
Table 3 shows the clinical implications of using each of the four tests in a hypothetical cohort of 1000 people with different levels of prevalence of H pylori infection. For example, given a prevalence of 53.7% and a specificity of 0.90, 46 people who do not have H pylori infection will be treated and urea breath test‐13C, urea breath test‐14C, serology and stool antigen test will miss 30, 42, 86 and 89 people respectively who have H pylori infection.
| Prevalence (%) | Specificity | False positives1 | Test | Sensitivity (95% CI) | Missed cases (95% CI) |
| 42.0 | 0.79 | 122 | Urea breath test‐13C | 0.98 (0.95 to 0.99) | 10 (5 to 20) |
| Urea breath test‐14C | 0.97 (0.95 to 0.98) | 15 (10 to 20) | |||
| Serology | 0.93 (0.87 to 0.96) | 31 (17 to 54) | |||
| Stool antigen test | 0.92 (0.87 to 0.96) | 32 (18 to 57) | |||
| 53.7 | 0.79 | 97 | Urea breath test‐13C | 0.98 (0.95 to 0.99) | 13 (6 to 26) |
| Urea breath test‐14C | 0.97 (0.95 to 0.98) | 19 (13 to 26) | |||
| Serology | 0.93 (0.87 to 0.96) | 39 (22 to 69) | |||
| Stool antigen test | 0.92 (0.87 to 0.96) | 41 (23 to 72) | |||
| 66.5 | 0.79 | 70 | Urea breath test‐13C | 0.98 (0.95 to 0.99) | 16 (8 to 32) |
| Urea breath test‐14C | 0.97 (0.95 to 0.98) | 23 (16 to 32) | |||
| Serology | 0.93 (0.87 to 0.96) | 49 (27 to 85) | |||
| Stool antigen test | 0.92 (0.87 to 0.96) | 51 (28 to 89) | |||
| 42.0 | 0.90 | 58 | Urea breath test‐13C | 0.94 (0.89 to 0.97) | 23 (12 to 46) |
| Urea breath test‐14C | 0.92 (0.89 to 0.94) | 33 (24 to 46) | |||
| Serology | 0.84 (0.74 to 0.91) | 67 (39 to 110) | |||
| Stool antigen test | 0.83 (0.73 to 0.90) | 70 (41 to 114) | |||
| 53.7 | 0.90 | 46 | Urea breath test‐13C | 0.94 (0.89 to 0.97) | 30 (15 to 58) |
| Urea breath test‐14C | 0.92 (0.89 to 0.94) | 42 (30 to 58) | |||
| Serology | 0.84 (0.74 to 0.91) | 86 (50 to 140) | |||
| Stool antigen test | 0.83 (0.73 to 0.90) | 89 (52 to 146) | |||
| 66.5 | 0.90 | 34 | Urea breath test‐13C | 0.94 (0.89 to 0.97) | 37 (18 to 72) |
| Urea breath test‐14C | 0.92 (0.89 to 0.94) | 53 (38 to 72) | |||
| Serology | 0.84 (0.74 to 0.91) | 106 (62 to 173) | |||
| Stool antigen test | 0.83 (0.73 to 0.90) | 111 (64 to 180) | |||
| 42.0 | 0.96 | 23 | Urea breath test‐13C | 0.86 (0.75 to 0.93) | 57 (30 to 103) |
| Urea breath test‐14C | 0.81 (0.76 to 0.86) | 78 (58 to 103) | |||
| Serology | 0.66 (0.52 to 0.79) | 141 (90 to 204) | |||
| Stool antigen test | 0.65 (0.50 to 0.78) | 146 (93 to 209) | |||
| 53.7 | 0.96 | 19 | Urea breath test‐13C | 0.86 (0.75 to 0.93) | 73 (38 to 132) |
| Urea breath test‐14C | 0.81 (0.76 to 0.86) | 100 (74 to 132) | |||
| Serology | 0.66 (0.52 to 0.79) | 181 (115 to 260) | |||
| Stool antigen test | 0.65 (0.50 to 0.78) | 187 (119 to 267) | |||
| 66.5 | 0.96 | 13 | Urea breath test‐13C | 0.86 (0.75 to 0.93) | 90 (47 to 163) |
| Urea breath test‐14C | 0.81 (0.76 to 0.86) | 124 (92 to 163) | |||
| Serology | 0.66 (0.52 to 0.79) | 224 (142 to 322) | |||
| Stool antigen test | 0.65 (0.50 to 0.78) | 231 (148 to 331) |
1Average number of participants who are diagnosed with H pylori infection but do not have the infection per 1000 tested.
The sensitivities were estimated from the SROC curves at fixed values (lower quartile, median and upper quartile) of specificity from the included studies across all tests. Based on these sensitivities and specificities, and quartiles of prevalence from the included studies (across all tests), the numbers of missed H pylori cases and false positives (i.e. overdiagnosed people) were calculated using a hypothetical cohort of 1000 people suspected of having H pylori infection.
Direct comparisons (restricted to comparative studies)
Direct comparisons were based on few studies. Table 4 shows the number of studies (N) for each pairwise comparison and, where meta‐analysis was possible, the ratio of DORs with 95% CIs and P value. There were no comparative studies of urea breath test‐13C and urea breath test‐14C. All other comparisons were based on seven or fewer studies. Each pair of tests were evaluated as follows:
| Test | Urea breath test‐13C | Urea breath test‐14C | Serology |
| Urea breath test‐13C | ‐ | ‐ | ‐ |
| Urea breath test‐14C | N = 0 | ‐ | ‐ |
| Serology | N = 7 DOR (95% CI) of urea breath test‐13C = 74.8 (95% CI 17.8 to 314) DOR (95% CI) of serology = 111 (95% CI 41.2 to 297) RDORs (95% CI) of urea breath test‐13C versus serology, P value = 0.68 (95% CI 0.12 to 3.70), P = 0.56 | N = 1 | ‐ |
| Stool antigen test | N = 7 DOR (95% CI) of stool antigen test = 53.0 (95% CI 5.34 to 527) RDORs (95% CI) of urea breath test‐13C versus stool antigen test, P value = 0.88 (95% CI 0.14 to 5.56), P = 0.84 | N = 2 | N = 4 |
DOR = diagnostic odds ratio; N = number of studies; RDORs = ratio of diagnostic odds ratios.
Due to paucity of data and substantial heterogeneity observed in ROC space which precluded the use of simpler meta‐analytic models, meta‐analyses were not possible for two test comparisons that had more than one study. For the single study of urea breath test‐14C versus serology (Mansour‐Ghanaei 2011), both tests had similar sensitivity, but specificity was higher for urea breath test‐14C than for serology. The ratio of diagnostic odds ratios is the DOR of the test in the column divided by the DOR of the test in the row. If the ratio is greater than one, then the test in the column is more accurate than the test in the row; if the ratio is less than one, the test in the row is more accurate than the test in the column.
-
Urea breath test‐13C versus serology (Figure 10): seven studies (Eltumi 1999; Korstanje 2006; Monteiro 2001a; Ogata 2001; Salles‐Montaudon 2002; Vandenplas 1992; Yoshimura 2001).
-
Urea breath test‐13C versus stool antigen test (Figure 11): seven studies (Hafeez 2007; Inelmen 2004; Lahner 2004; Lottspeich 2007; Monteiro 2001a; Salles‐Montaudon 2002; Yu 2001).
-
Urea breath test‐14C versus serology: two studies (Dede 2015; Kuloglu 2008).
-
Urea breath test‐14C versus serology: one study (Mansour‐Ghanaei 2011).
-
Serology versus stool antigen test: four studies (El‐Din 2013; Monteiro 2001a; Salles‐Montaudon 2002; Soomro 2012).

Summary ROC plot of direct comparisons of urea breath test‐13C and serology. Each summary curve was drawn restricted to the range of specificities for each test. The size of each symbol was scaled according to the precision of sensitivity and specificity in the study. A dotted line joins the pair of points for the two tests from each study.
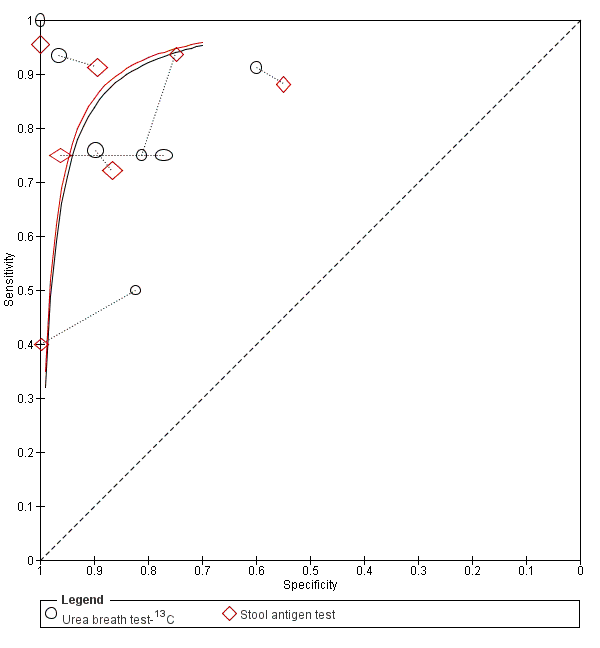
Summary ROC plot of direct comparisons of urea breath test‐13C and stool antigen test. Each summary curve was drawn restricted to the range of specificities for each test. The size of each symbol was scaled according to the precision of sensitivity and specificity in the study. A dotted line joins the pair of points for the two tests from each study.
The ratios of DORs (95% CI; P value) were 0.68 (95% CI 0.12 to 3.70; P = 0.56) for urea breath test‐13C versus serology, and 0.88 (95% CI 0.14 to 5.56; P = 0.84) for urea breath test‐13C versus stool antigen test. Due to paucity of data and substantial heterogeneity observed in ROC space which precluded the use of simpler meta‐analytic models, meta‐analyses were not possible for the other two test comparisons that had more than one study. For the single study of urea breath test‐14C versus serology (Mansour‐Ghanaei 2011), both tests had similar sensitivity, but specificity was higher for urea breath test‐14C than for serology.
Investigation of heterogeneity
We were unable to investigate subtype of tests because most of the serological tests were ELISA (17/20 (85%) studies that provided the type of serology test) and most studies (24/29 (83%) studies) did not report whether monoclonal or polyclonal antibodies were used for stool antigen tests. Studies did not report the precise interval between index test and reference standard (unless they were performed on the same day), i.e. many studies did not report the interval at all, while some reported that the tests were performed within a few days of each other without stating the exact time interval. Of those that reported the interval, only two studies had an interval of more than two weeks (Dede 2015; Lombardo 2003). For each of the four tests, Appendix 10 shows the number of studies in each subgroup of other factors we had planned to investigate. Given the availability of data, we were only able to perform meta‐regression to investigate the effect of reference standard on the accuracy of each test. Of the 99 studies, 42 (42%) used a combination of stains and there were few data for Immunohistochemical stains (2/99; 2%). The analyses were therefore limited to comparisons of H & E stain versus special stain for each test (Appendix 11). Although the effect of reference standard was not consistent across tests, there was no statistical evidence of a difference in test accuracy for any of the tests. For urea breath test‐14C, the DOR for special stain was higher than for H & E stain, while for the other tests the DOR of both types of stain were similar or higher for H & E (Appendix 11).
Discussion
Summary of main results
We included 101 studies (11,003 participants) that evaluated the diagnostic accuracy of different non‐invasive methods for the diagnosis of H pylori. Of these 11,003 participants, 5839 participants (53.1%) had H pylori infection. The prevalence of H pylori infection ranged from 15.2% to 94.7%. The median prevalence was 53.7% (lower quartile: 42.0% and upper quartile: 66.5%).
The summary of results for urea breath test‐13C, urea breath test‐14C, serology and stool antigen test is given in summary of findings Table. The studies used different thresholds and reference standards. As a result, there were few data for pooling sensitivities and specificities at specific thresholds, and we mainly estimated and compared SROC curves. The test comparison based on all available data (99 studies) for the four tests showed a statistically significant difference in diagnostic accuracy between the test (P = 0.024). There was no statistical evidence of a difference in diagnostic accuracy between urea breath test‐13C and urea breath test‐14C, while serology and stool antigen test were inferior to both urea breath tests. Direct comparisons are more reliable than indirect comparisons, due to the potential for confounding in indirect comparisons (Takwoingi 2013). However, we found few head‐to‐head studies and meta‐analysis was possible for only two pairwise comparisons (urea breath test‐13C versus serology, seven studies; and urea breath test‐13C versus stool antigen test, seven studies).
Most of the tests that used visual assessment (for example, appearance of a pink‐red line) were stool antigen tests, although some serology tests also used visual assessment. Some serology and stool antigen tests are therefore easy to use (stool antigen test is easier to use as described below), but low diagnostic accuracy is a disadvantage when compared to urea breath tests. Urea breath test is a cumbersome test and involves the use of radioisotopes; however, urea breath test‐13C may be the most accurate test among the non‐invasive tests. This has implications in the screening of individuals for H pylori as a decision has to be made regarding the use of a cumbersome and relatively costly test but with good diagnostic accuracy versus cheap tests that can be performed easily but with lower diagnostic accuracy. A further decision to make if one opts for easy‐to‐use tests is the threshold at which the test should be used. For example, one can use a threshold that provides higher sensitivity (at the cost of lower specificity, necessitating endoscopic biopsy confirmation or treatment) or a threshold that provides higher specificity (at the cost of lower sensitivity, resulting in people with H pylori not being treated). Although at first sight it appears that the treatment for H pylori is relatively harmless and one would prefer a threshold at which the test has higher sensitivity rather than higher specificity, the decision to give antibiotics is not a straightforward one, because of the association between unnecessary antibiotic use and development of antimicrobial resistance (Llor 2014). Serology and stool antigen test have similar diagnostic test accuracy and the choice between the two may be made based on ease of carrying out the tests. Only one study included in this review used whole blood for performing serology (Chey 1998). Even this test required a laboratory technician to interpret the test result (Chey 1998). So, there are no bedside tests available for serology testing. On the other hand, bedside kits with easy interpretation by colour changes are available for stool antigen tests, making them easy to administer (Inelmen 2004; Jekarl 2013; Kuloglu 2008; Qadeer 2009; Trevisani 2005). A cost‐effectiveness study may clarify the most cost‐effective non‐invasive test in people with suspected H pylori, but it is difficult to factor in the price of antimicrobial resistance to an individual as the price of antimicrobial resistance is paid by future generations (through increased mortality and decreased productivity), rather than the individual for whom the treatment decision has to be made (Taylor 2014).
Strengths and weaknesses of the review
We conducted a thorough literature search and included full‐text publications and abstracts without any language restrictions. There are currently no reliable search strategies to identify diagnostic test accuracy studies (Beynon 2013). We did not use any diagnostic filter in our search strategy, thereby ensuring that studies on the topic were identified. Two review authors independently identified and extracted data from the studies, potentially decreasing errors related to single data extraction. PCR methodology is not standardised across laboratories and it is an unreliable reference standard (Chey 2007). Endoscopic biopsy followed by rapid urease testing has poor sensitivity following treatment with proton pump inhibitors, and endoscopic biopsy with culture has high specificity but poor sensitivity (Chey 2007). We used a strict reference standard (histology) which is likely to diagnose the target condition with a high degree of accuracy. These are the major strengths of the review.
A major limitation was the diversity of thresholds used in the studies. As a result, data were sparse for each threshold, which limited estimation of summary sensitivities and specificities. Therefore there is insufficient evidence to recommend specific thresholds for each of the tests. Nonetheless, we were able to estimate and compare SROC curves by including studies with different thresholds. There was a high proportion of studies at high risk of bias and with high concern regarding applicability in all the four domains of the QUADAS‐2 tool. This makes the validity and applicability of the results questionable. The major concerns were lack of reporting of the threshold used or when the thresholds were reported, there was no information to judge whether the thresholds were prespecified. Despite the lack of statistical evidence of an effect of type of reference standard on test accuracy, as there were few studies for each subgroup and other differences between studies, we cannot conclude that diagnostic accuracy does not depend on type of reference standard.
Comparison with other systematic reviews
We identified several relevant systematic reviews (Ferwana 2015; Gisbert 2001; Gisbert 2004a; Loy 1996; Zhou 2014; Zhou 2017). The findings from this review support those of Zhou 2017, and Ferwana 2015, that urea breath test has high diagnostic accuracy and that there was significant heterogeneity in the diagnostic accuracy of the urea breath test (Zhou 2017). Our findings agree with those of Zhou 2014 that stool antigen test has only modest diagnostic test accuracy. The review findings are contrary to those of Gisbert 2001, and Gisbert 2004a, which suggested that stool antigen tests are highly accurate. This difference may be due to the strict reference standards that we used in this review and how we handled the issue of heterogeneity in thresholds. In agreement with the findings of Loy 1996, the role of serology in clinical practice is uncertain, as stool antigen tests provide equivalent diagnostic accuracy to serology and are easier to interpret.
Applicability of findings to the review question
This review included adults and children who underwent non‐invasive tests for the diagnosis of H pylori. Most of the studies included only symptomatic people and so the findings of this review are applicable only to people with symptoms. Most studies excluded people who had previous gastrectomy and those who had recent antibiotics or proton pump inhibitors. Hence, the findings of this review are not applicable in these populations.

Clinical pathway
Study flow diagram.

Risk of bias and applicability concerns graph: review authors' judgements about each domain presented as percentages across included studies. For each domain, the numbers shown on the bar represent the number of studies that were scored as high, unclear or low in terms of risk of bias or applicability concern.
Forest plot of urea breath test‐13C.FN = false negative; FP = false positive; TN = true negative; TP = true positive. The forest plot shows an estimate of sensitivity and specificity from each study and the threshold used. Studies are sorted by threshold, sensitivity and specificity. For threshold, the number of minutes in brackets is the time after administration of urea.

Forest plot of urea breath test‐13C at commonly reported thresholds. FN = false negative; FP = false positive; TN = true negative; TP = true positive. Thresholds are shown in brackets and the number of minutes in brackets is the time after administration of urea.

Forest plot of urea breath test‐14C. FN = false negative; FP = false positive; TN = true negative; TP = true positive. The forest plot shows an estimate of sensitivity and specificity from each study and the threshold used. Studies are sorted by threshold, sensitivity and specificity. For threshold, the number of minutes in brackets is the time after administration of urea.

Forest plot of serology. FN = false negative; FP = false positive; SD = standard deviation; TN = true negative; TP = true positive. The forest plot shows an estimate of sensitivity and specificity from each study and the threshold used. Studies are sorted by threshold, sensitivity and specificity. Other threshold is staining of a 120kDa protein (CagA) gel band and/or at least two of five proteins between 28–33 kDa.
Forest plot of stool antigen test. FN = false negative; FP = false positive; TN = true negative; TP = true positive; WL = wavelength. The forest plot shows an estimate of sensitivity and specificity from each study and the threshold used. Studies are sorted by threshold, sensitivity and specificity.

Summary ROC plot of non‐invasive tests for H pylori infection. The SROC curves for the four tests are parallel. The curve for each test is drawn within the range of estimates of specificity from the studies included for the test.

Summary ROC plot of direct comparisons of urea breath test‐13C and serology. Each summary curve was drawn restricted to the range of specificities for each test. The size of each symbol was scaled according to the precision of sensitivity and specificity in the study. A dotted line joins the pair of points for the two tests from each study.

Summary ROC plot of direct comparisons of urea breath test‐13C and stool antigen test. Each summary curve was drawn restricted to the range of specificities for each test. The size of each symbol was scaled according to the precision of sensitivity and specificity in the study. A dotted line joins the pair of points for the two tests from each study.

Risk of bias and applicability concerns summary: review authors' judgements about each domain for each study included for urea breath test‐13C

Risk of bias and applicability concerns summary: review authors' judgements about each domain for each study included for urea breath test‐14C.

Risk of bias and applicability concerns summary: review authors' judgements about each domain for each study included for serology
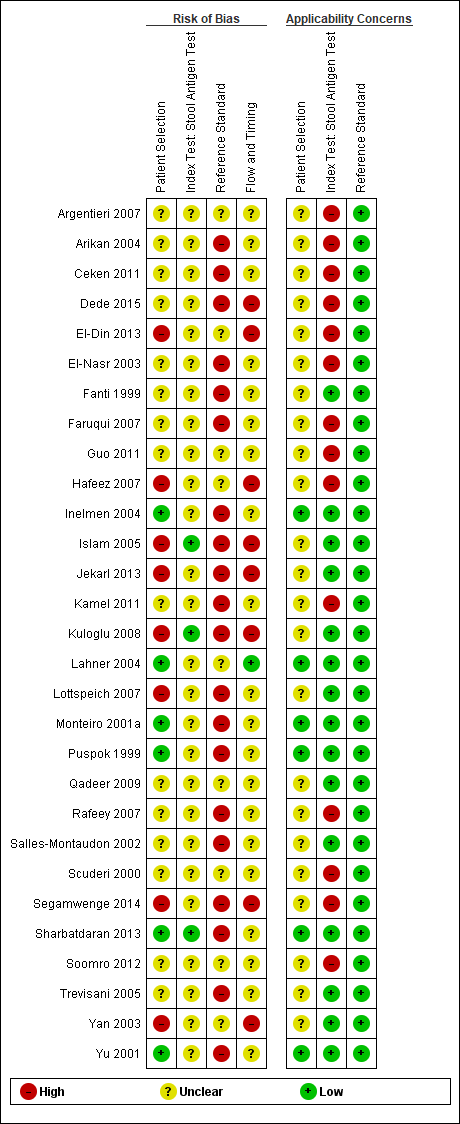
Risk of bias and applicability concerns summary: review authors' judgements about each domain for each study included for the stool antigen test

Urea breath test‐13C.

Urea breath test‐14C.

Urea breath test ‐ Unknown isotope.

Stool antigen test.

Urea breath test‐13C (delta over baseline > 3% (20 minutes)).

Urea breath test‐13C (delta over baseline > 3% (30 minutes)).

Urea breath test‐13C (delta over baseline > 3.5% (30 minutes)).

Urea breath test‐13C (delta over baseline > 4% (10 minutes)).

Urea breath test‐13C (delta over baseline > 4% (20 minutes)).

Urea breath test‐13C (delta over baseline > 4% (30 minutes)).
Urea breath test‐13C (delta over baseline > 4.5% (30 minutes)).
Urea breath test‐13C (delta over baseline > 5% (30 minutes)).

Urea breath test‐14C (counts per minute > 50).

Urea breath test‐14C (disintegrations per minute > 200).

Serology > 7 units/ml.
Serology ≥300 units.
| What is the best non‐invasive test for diagnosis of H pylori infection? | ||||
| Population | Children and adults with gastrointestinal symptoms | |||
| Setting | Primary care setting | |||
| Index tests | Urea breath test‐13C, Urea breath test‐14C, serology, and stool antigen test | |||
| Threshold | Various thresholds were used for each test | |||
| Role and purpose of test | Screening and diagnosis of H pylori | |||
| Reference standard | Endoscopic biopsy with Haemotoxylin & Eosin stain, special stains, or combination of Haemotoxylin & Eosin and special stains | |||
| Quality of evidence | Risk of bias was generally high or unclear with respect to the selection of participants, and the conduct and interpretation of the index tests and reference standard. Applicability concerns were also generally high or unclear with respect to selection of participants | |||
| Limitations | There was heterogeneity in thresholds and reference standards. Studies did not often prespecify or clearly report thresholds used | |||
| Pre‐test probability (prevalence of Helicobacter pylori) | Median (interquartile range) = 53.7% (42.0% to 66.5%) | |||
| Index test | Number of participants (studies) | Diagnostic odds ratio (95% CI) | Sensitivity (95% CI) at fixed specificity of 0.901 | Missed H pylori cases per 1000 people tested (95% CI)2 |
| Urea breath test‐13C | 3139 participants (34 studies) | 153 (95% CI 73.7 to 316) | 0.94 (0.89 to 0.97) | 30 (15 to 58) |
| Urea breath test‐14C | 1810 participants (21 studies) | 105 (95% CI 74.0 to 150) | 0.92 (0.89 to 0.94) | 42 (30 to 58) |
| Serology | 4242 participants (34 studies) | 47.4 (95% CI 25.5 to 88.1) | 0.84 (0.74 to 0.91) | 86 (50 to 140) |
| Stool antigen test | 2988 participants (29 studies) | 45.1 (95% CI 24.2 to 84.1) | 0.83 (0.73 to 0.90) | 89 (52 to 146) |
| Comparison of non‐invasive tests for H pylori infection Based on an indirect comparison of the four tests using all the studies, there was statistical evidence of a difference in diagnostic accuracy (P = 0.024). Direct comparisons were based on few head‐to‐head studies. The ratios of diagnostic odds ratios (95% CI; P value) were 0.68 (95% CI 0.12 to 3.70; P = 0.56) for urea breath test‐13C versus serology (seven studies), and 0.88 (95% CI 0.14 to 5.56; P = 0.84) for urea breath test‐13C versus stool antigen test (seven studies). The 95% confidence intervals of these estimates overlap with those of the ratios of diagnostic odds ratios from the indirect comparison. Data were limited or unavailable for meta‐analysis of other direct comparisons. | ||||
| Conclusions In people with no history of gastrectomy and those who have not recently had antibiotics or proton pump inhibitors, urea breath tests had high diagnostic accuracy while serology and stool antigen tests had lower accuracy to detect H pylori infection. Although susceptible to bias due to confounding, this conclusion is based on evidence from indirect test comparisons as evidence from direct comparisons was based on few studies or was unavailable. It should be noted that studies were generally of poor methodological quality. The thresholds used for the tests were highly variable and there is currently insufficient evidence to recommend specific thresholds for use in clinical practice. | ||||
| 1The sensitivities were estimated along the SROC curves at the median specificity across the studies included for the four tests. 2Based on the sensitivity estimated at the median specificity of 0.90, and the median prevalence of 53.7% from the included studies, the numbers of missed H pylori cases were calculated using a hypothetical cohort of 1000 people suspected of having H pylori infection. The 95% CI for the number of missed cases is from the 95% CI for sensitivity. For a specificity of 0.90 and prevalence of 53.7%, there will be 46 false positives. See Table 3 for results for other values of specificity and prevalence. | ||||
| Threshold | Studies | Number of participants (cases) | Sensitivity (95% CI) | Specificity (95% CI) |
| Urea breath test‐13C | ||||
| Delta over baseline > 3% (20 minutes) | 2 | 254 (128) | 0.98 (0.90 to 1.00) | 0.92 (0.82 to 0.97) |
| Delta over baseline > 3% (30 minutes) | 3 | 333 (140) | 0.99 (0.92 to 1.00) | 0.95 (0.90 to 0.98) |
| Delta over baseline > 3.5% (30 minutes) | 3 | 368 (120) | 0.75 to 1.00 | 0.77 to 1.00 |
| Delta over baseline > 4% (10 minutes) | 2 | 236 (118) | 0.91 to 1.00 | 0.60 to 0.95 |
| Delta over baseline > 4% (20 minutes) | 2 | 236 (118) | 0.91 to 1.00 | 0.60 to 0.96 |
| Delta over baseline > 4% (30 minutes) | 10 | 958 (423) | 0.95 (0.79 to 0.99) | 0.95 (0.87 to 0.98) |
| Delta over baseline > 4.5% (30 minutes) | 3 | 288 (106) | 0.50 to 0.96 | 0.82 to 0.96 |
| Delta over baseline > 5% (30 minutes) | 4 | 601 (315) | 0.95 (0.49 to 1.00) | 0.94 (0.84 to 0.98) |
| Urea breath test‐14C | ||||
| Counts per minute > 50 (10 minutes) | 6 | 471 (231) | 0.89 (0.55 to 0.98) | 0.91 (0.79 to 0.96) |
| Disintegrations per minute > 200 (10 minutes) | 4 | 296 (132) | 0.95 (0.33 to 1.00) | 0.95 (0.80 to 0.99) |
| Serology | ||||
| > 7 units/ml | 2 | 97 (48) | 0.98 (0.74 to 1.00) | 0.71 (0.51 to 0.86) |
| ≥ 300 unit | 2 | 234 (143) | 0.91 (0.82 to 0.96) | 0.86 (0.72 to 0.93) |
| Tests evaluated at the same threshold by more than one study are presented in the table. When there were two or three studies at the same threshold, and little or no heterogeneity was observed in ROC space, estimates of summary sensitivity and summary specificity were obtained by using univariate fixed‐effect logistic regression models to pool sensitivities and specificities separately. When there were two or three studies and we observed heterogeneity, we did not perform meta‐analysis but report the range of the sensitivities and specificities. | ||||
| Index tests | Studies; participants (H pyloripresent) | DOR (95% CI) | Ratio of diagnostic odds ratios (95% CI), P value | ||
| Urea breath test‐13C | Urea breath test‐14C | Serology | |||
| Urea breath test‐13C | 34; 3139 (1526) | 153 (73.7 to 316) | ‐ | ‐ | ‐ |
| Urea breath test‐14C | 21; 1810 (1018) | 105 (74.0 to 150) | 1.45 (0.65 to 3.26), P = 0.36 | ‐ | ‐ |
| Serology | 34; 4242 (2477) | 47.4 (25.5 to 88.1) | 3.22 (1.24 to 8.37), P = 0.017 | 2.22 (1.09 to 4.51), P = 0.028 | ‐ |
| Stool antigen test | 29; 2988 (1311) | 45.1 (24.2 to 84.1) | 3.39 (1.30 to 8.83), P = 0.013 | 2.33 (1.14 to 4.76), P = 0.020 | 1.05 (0.44 to 2.53), P = 0.91 |
| The indirect comparison included all studies that evaluated at least one of the four tests, i.e. all available data. The ratio of diagnostic odds ratios is the diagnostic odds ratio (DOR) of the test in the column divided by the DOR of the test in the row. If the ratio is greater than one, then the test in the column is more accurate than the test in the row; if the ratio is less than one, the test in the row is more accurate than the test in the column. | |||||
| Prevalence (%) | Specificity | False positives1 | Test | Sensitivity (95% CI) | Missed cases (95% CI) |
| 42.0 | 0.79 | 122 | Urea breath test‐13C | 0.98 (0.95 to 0.99) | 10 (5 to 20) |
| Urea breath test‐14C | 0.97 (0.95 to 0.98) | 15 (10 to 20) | |||
| Serology | 0.93 (0.87 to 0.96) | 31 (17 to 54) | |||
| Stool antigen test | 0.92 (0.87 to 0.96) | 32 (18 to 57) | |||
| 53.7 | 0.79 | 97 | Urea breath test‐13C | 0.98 (0.95 to 0.99) | 13 (6 to 26) |
| Urea breath test‐14C | 0.97 (0.95 to 0.98) | 19 (13 to 26) | |||
| Serology | 0.93 (0.87 to 0.96) | 39 (22 to 69) | |||
| Stool antigen test | 0.92 (0.87 to 0.96) | 41 (23 to 72) | |||
| 66.5 | 0.79 | 70 | Urea breath test‐13C | 0.98 (0.95 to 0.99) | 16 (8 to 32) |
| Urea breath test‐14C | 0.97 (0.95 to 0.98) | 23 (16 to 32) | |||
| Serology | 0.93 (0.87 to 0.96) | 49 (27 to 85) | |||
| Stool antigen test | 0.92 (0.87 to 0.96) | 51 (28 to 89) | |||
| 42.0 | 0.90 | 58 | Urea breath test‐13C | 0.94 (0.89 to 0.97) | 23 (12 to 46) |
| Urea breath test‐14C | 0.92 (0.89 to 0.94) | 33 (24 to 46) | |||
| Serology | 0.84 (0.74 to 0.91) | 67 (39 to 110) | |||
| Stool antigen test | 0.83 (0.73 to 0.90) | 70 (41 to 114) | |||
| 53.7 | 0.90 | 46 | Urea breath test‐13C | 0.94 (0.89 to 0.97) | 30 (15 to 58) |
| Urea breath test‐14C | 0.92 (0.89 to 0.94) | 42 (30 to 58) | |||
| Serology | 0.84 (0.74 to 0.91) | 86 (50 to 140) | |||
| Stool antigen test | 0.83 (0.73 to 0.90) | 89 (52 to 146) | |||
| 66.5 | 0.90 | 34 | Urea breath test‐13C | 0.94 (0.89 to 0.97) | 37 (18 to 72) |
| Urea breath test‐14C | 0.92 (0.89 to 0.94) | 53 (38 to 72) | |||
| Serology | 0.84 (0.74 to 0.91) | 106 (62 to 173) | |||
| Stool antigen test | 0.83 (0.73 to 0.90) | 111 (64 to 180) | |||
| 42.0 | 0.96 | 23 | Urea breath test‐13C | 0.86 (0.75 to 0.93) | 57 (30 to 103) |
| Urea breath test‐14C | 0.81 (0.76 to 0.86) | 78 (58 to 103) | |||
| Serology | 0.66 (0.52 to 0.79) | 141 (90 to 204) | |||
| Stool antigen test | 0.65 (0.50 to 0.78) | 146 (93 to 209) | |||
| 53.7 | 0.96 | 19 | Urea breath test‐13C | 0.86 (0.75 to 0.93) | 73 (38 to 132) |
| Urea breath test‐14C | 0.81 (0.76 to 0.86) | 100 (74 to 132) | |||
| Serology | 0.66 (0.52 to 0.79) | 181 (115 to 260) | |||
| Stool antigen test | 0.65 (0.50 to 0.78) | 187 (119 to 267) | |||
| 66.5 | 0.96 | 13 | Urea breath test‐13C | 0.86 (0.75 to 0.93) | 90 (47 to 163) |
| Urea breath test‐14C | 0.81 (0.76 to 0.86) | 124 (92 to 163) | |||
| Serology | 0.66 (0.52 to 0.79) | 224 (142 to 322) | |||
| Stool antigen test | 0.65 (0.50 to 0.78) | 231 (148 to 331) | |||
| 1Average number of participants who are diagnosed with H pylori infection but do not have the infection per 1000 tested. The sensitivities were estimated from the SROC curves at fixed values (lower quartile, median and upper quartile) of specificity from the included studies across all tests. Based on these sensitivities and specificities, and quartiles of prevalence from the included studies (across all tests), the numbers of missed H pylori cases and false positives (i.e. overdiagnosed people) were calculated using a hypothetical cohort of 1000 people suspected of having H pylori infection. | |||||
| Test | Urea breath test‐13C | Urea breath test‐14C | Serology |
| Urea breath test‐13C | ‐ | ‐ | ‐ |
| Urea breath test‐14C | N = 0 | ‐ | ‐ |
| Serology | N = 7 DOR (95% CI) of urea breath test‐13C = 74.8 (95% CI 17.8 to 314) DOR (95% CI) of serology = 111 (95% CI 41.2 to 297) RDORs (95% CI) of urea breath test‐13C versus serology, P value = 0.68 (95% CI 0.12 to 3.70), P = 0.56 | N = 1 | ‐ |
| Stool antigen test | N = 7 DOR (95% CI) of stool antigen test = 53.0 (95% CI 5.34 to 527) RDORs (95% CI) of urea breath test‐13C versus stool antigen test, P value = 0.88 (95% CI 0.14 to 5.56), P = 0.84 | N = 2 | N = 4 |
| DOR = diagnostic odds ratio; N = number of studies; RDORs = ratio of diagnostic odds ratios. Due to paucity of data and substantial heterogeneity observed in ROC space which precluded the use of simpler meta‐analytic models, meta‐analyses were not possible for two test comparisons that had more than one study. For the single study of urea breath test‐14C versus serology (Mansour‐Ghanaei 2011), both tests had similar sensitivity, but specificity was higher for urea breath test‐14C than for serology. The ratio of diagnostic odds ratios is the DOR of the test in the column divided by the DOR of the test in the row. If the ratio is greater than one, then the test in the column is more accurate than the test in the row; if the ratio is less than one, the test in the row is more accurate than the test in the column. | |||
| Test | No. of studies | No. of participants |
| 1 Urea breath test‐13C Show forest plot | 34 | 3139 |
| 2 Urea breath test‐14C Show forest plot | 21 | 1810 |
| 3 Urea breath test ‐ Unknown isotope Show forest plot | 2 | 127 |
| 4 Serology Show forest plot | 34 | 4242 |
| 5 Stool antigen test Show forest plot | 29 | 2988 |
| 6 Urea breath test‐13C (delta over baseline > 3% (20 minutes)) Show forest plot | 2 | 254 |
| 7 Urea breath test‐13C (delta over baseline > 3% (30 minutes)) Show forest plot | 3 | 333 |
| 8 Urea breath test‐13C (delta over baseline > 3.5% (30 minutes)) Show forest plot | 3 | 368 |
| 9 Urea breath test‐13C (delta over baseline > 4% (10 minutes)) Show forest plot | 2 | 236 |
| 10 Urea breath test‐13C (delta over baseline > 4% (20 minutes)) Show forest plot | 2 | 236 |
| 11 Urea breath test‐13C (delta over baseline > 4% (30 minutes)) Show forest plot | 10 | 958 |
| 12 Urea breath test‐13C (delta over baseline > 4.5% (30 minutes)) Show forest plot | 3 | 288 |
| 13 Urea breath test‐13C (delta over baseline > 5% (30 minutes)) Show forest plot | 4 | 601 |
| 14 Urea breath test‐14C (counts per minute > 50) Show forest plot | 6 | 471 |
| 15 Urea breath test‐14C (disintegrations per minute > 200) Show forest plot | 4 | 296 |
| 16 Serology > 7 units/ml Show forest plot | 2 | 97 |
| 17 Serology ≥300 units Show forest plot | 2 | 234 |