| 1 Awareness of prolapse (1‐3 years) Show forest plot | 12 | 1614 | Risk Ratio (M‐H, Fixed, 95% CI) | 0.66 [0.54, 0.81] |
|
| 1.1 Anterior compartment:mesh vs native tissue | 9 | 1172 | Risk Ratio (M‐H, Fixed, 95% CI) | 0.65 [0.51, 0.84] |
| 1.2 Multicompartment: mesh vs native tissue | 4 | 442 | Risk Ratio (M‐H, Fixed, 95% CI) | 0.67 [0.46, 0.97] |
| 2 Repeat surgery (1‐3 years) Show forest plot | 14 | | Risk Ratio (M‐H, Fixed, 95% CI) | Subtotals only |
|
| 2.1 Prolapse | 12 | 1675 | Risk Ratio (M‐H, Fixed, 95% CI) | 0.53 [0.31, 0.88] |
| 2.2 Continence surgery | 9 | 1284 | Risk Ratio (M‐H, Fixed, 95% CI) | 1.07 [0.62, 1.83] |
| 2.3 Surgery for prolapse, SUI or mesh exposure | 7 | 867 | Risk Ratio (M‐H, Fixed, 95% CI) | 2.40 [1.51, 3.81] |
| 3 Recurrent prolapse (any) at 1‐3 years Show forest plot | 21 | 2494 | Risk Ratio (M‐H, Random, 95% CI) | 0.40 [0.30, 0.53] |
|
| 3.1 Anterior compartment repair: mesh versus native tissue | 15 | 1748 | Risk Ratio (M‐H, Random, 95% CI) | 0.33 [0.26, 0.40] |
| 3.2 Multi‐compartment repair: mesh versus native tissue | 6 | 746 | Risk Ratio (M‐H, Random, 95% CI) | 0.59 [0.40, 0.87] |
| 4 Injuries bladder or bowel Show forest plot | 11 | | Risk Ratio (M‐H, Fixed, 95% CI) | Subtotals only |
|
| 4.1 Bladder injury | 11 | 1514 | Risk Ratio (M‐H, Fixed, 95% CI) | 3.92 [1.62, 9.50] |
| 4.2 Bowel injury | 1 | 169 | Risk Ratio (M‐H, Fixed, 95% CI) | 3.26 [0.13, 78.81] |
| 5 Objective failure of anterior compartment (cystocoele) Show forest plot | 13 | 1406 | Risk Ratio (M‐H, Fixed, 95% CI) | 0.45 [0.36, 0.55] |
|
| 5.1 Anterior compartment repair: mesh versus native tissue | 9 | 1004 | Risk Ratio (M‐H, Fixed, 95% CI) | 0.36 [0.28, 0.47] |
| 5.2 Multi‐compartment repair: mesh versus native tissue | 4 | 402 | Risk Ratio (M‐H, Fixed, 95% CI) | 0.73 [0.51, 1.06] |
| 6 Objective failure of posterior compartment (rectocoele) Show forest plot | 3 | 226 | Risk Ratio (M‐H, Fixed, 95% CI) | 0.64 [0.29, 1.42] |
|
| 6.1 Mesh vs native tissue | 3 | 226 | Risk Ratio (M‐H, Fixed, 95% CI) | 0.64 [0.29, 1.42] |
| 7 POPQ assessment (any mesh) Show forest plot | 10 | | Mean Difference (IV, Random, 95% CI) | Subtotals only |
|
| 7.1 Point Ba POPQ | 10 | 1125 | Mean Difference (IV, Random, 95% CI) | ‐0.93 [‐1.27, ‐0.59] |
| 7.2 Point C POPQ | 8 | 925 | Mean Difference (IV, Random, 95% CI) | ‐0.45 [‐1.13, 0.23] |
| 7.3 Point Bp | 7 | 832 | Mean Difference (IV, Random, 95% CI) | 0.05 [‐0.34, 0.44] |
| 7.4 total vaginal length | 5 | 611 | Mean Difference (IV, Random, 95% CI) | 0.07 [‐0.25, 0.40] |
| 8 Bladder function: de novo stress urinary incontinence (1‐3 years) Show forest plot | 12 | 1512 | Risk Ratio (M‐H, Fixed, 95% CI) | 1.39 [1.06, 1.82] |
|
| 8.1 Anterior compartment: mesh vs native tissue | 8 | 1205 | Risk Ratio (M‐H, Fixed, 95% CI) | 1.45 [1.00, 2.11] |
| 8.2 Multi compartment : mesh vs native tissue | 4 | 307 | Risk Ratio (M‐H, Fixed, 95% CI) | 1.31 [0.90, 1.92] |
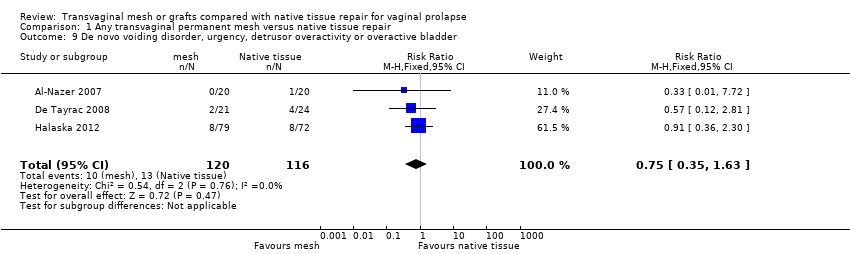
| 9 De novo voiding disorder, urgency, detrusor overactivity or overactive bladder Show forest plot | 3 | 236 | Risk Ratio (M‐H, Fixed, 95% CI) | 0.75 [0.35, 1.63] |
|
| 10 De novo dyspareunia (1‐3 years) Show forest plot | 11 | 764 | Risk Ratio (M‐H, Fixed, 95% CI) | 0.92 [0.58, 1.47] |
|
| 10.1 Anterior compartment: mesh vs native tissue | 8 | 643 | Risk Ratio (M‐H, Fixed, 95% CI) | 1.08 [0.60, 1.93] |
| 10.2 Multicompartment: mesh vs native tissue | 3 | 121 | Risk Ratio (M‐H, Fixed, 95% CI) | 0.65 [0.29, 1.42] |
| 11 Sexual function (1‐3 years) Show forest plot | 7 | | Mean Difference (IV, Fixed, 95% CI) | Subtotals only |
|
| 11.1 PISQ score | 7 | 857 | Mean Difference (IV, Fixed, 95% CI) | ‐0.13 [‐0.40, 0.13] |
| 12 Quality of life: continuous data (1‐2 years): Show forest plot | 7 | 665 | Std. Mean Difference (IV, Random, 95% CI) | 0.05 [‐0.20, 0.30] |
|
| 12.1 PQOL end score | 3 | 331 | Std. Mean Difference (IV, Random, 95% CI) | 0.09 [‐0.31, 0.49] |
| 12.2 Pelvic floor impact questionnaire end score | 4 | 334 | Std. Mean Difference (IV, Random, 95% CI) | 0.02 [‐0.34, 0.37] |
| 13 Quality of life: dichotomous data "much or very much better" Show forest plot | 1 | 168 | Risk Ratio (M‐H, Fixed, 95% CI) | 1.0 [0.80, 1.25] |
|
| 13.1 PGI‐I | 1 | 168 | Risk Ratio (M‐H, Fixed, 95% CI) | 1.0 [0.80, 1.25] |
| 14 Operating time (minutes) Show forest plot | 13 | | Mean Difference (IV, Random, 95% CI) | Totals not selected |
|
| 14.1 Anterior compartment: mesh vs native tissue | 10 | | Mean Difference (IV, Random, 95% CI) | 0.0 [0.0, 0.0] |
| 14.2 Multicompartment: mesh vs native tissue | 3 | | Mean Difference (IV, Random, 95% CI) | 0.0 [0.0, 0.0] |
| 15 Blood transfusion Show forest plot | 6 | 723 | Risk Ratio (M‐H, Fixed, 95% CI) | 1.55 [0.88, 2.72] |
|
| 16 Length of stay in hospital (days) Show forest plot | 7 | 953 | Mean Difference (IV, Random, 95% CI) | ‐0.06 [‐0.30, 0.18] |
|