Mrežice ili transplatati koji se postavljaju kroz rodnicu u usporedbi s popravkom prirodnim tkivom u svrhu sprječavanja ispadanja organa male zdjelice kroz vaginalni otvor
Appendices
Appendix 1. Types of operations
Sacral colpopexy
Aim
to correct upper genital tract prolapse
Indication
Usually reserved for recurrent prolapse of the upper vagina (recurrent cystocele, vault or enterocele) or massive vaginal eversion
Surgical technique
-
Usually performed under general anaesthesia
-
Performed through an incision on the lower abdomen or keyhole
-
The bladder and rectum are freed from the vagina and permanent mesh supports the front and back wall of the vagina
-
This mesh is secured to the sacrum (upper tailbone)
-
Peritoneum (lining of the abdominal cavity) is closed over the mesh
-
Other repairs are performed as required at the same time including paravaginal repair, perineoplasty, colposuspension or rectopexy
-
Bowel preparation is required prior to the surgery
McCall culdoplasty
Indications
-
Vault prolapse or an enterocele
-
Often performed at the time of vaginal hysterectomy to prevent future prolapse
Surgical technique
-
After the uterus is removed at the time of hysterectomy the uterosacral ligaments are identified and incorporated into the closure of the peritoneum and upper vagina using one to two sutures
-
An anterior or posterior vaginal repair is often performed at the same time
Sacrospinous fixation
Aim
This surgery offers support to the upper vagina, minimising risk of recurrent prolapse at this site. The advantage of this surgery is that vaginal length is maintained.
Indication
Upper vaginal prolapse (uterine or vault prolapse, enteroceles)
This procedure can be used in reconstructive vaginal surgery where increased vaginal length is required.
Procedure
-
The procedure can be performed under regional or general anaesthesia
-
A routine posterior vaginal incision is made and extended to the top of the vagina
-
Using sharp dissection, the vagina is freed from the underlying rectovaginal fascia and rectum until the pelvic floor (puborectalis) muscle is seen
-
Using sharp and blunt dissection, the sacrospinous ligament running from the ischial spine to the sacral bone is palpated and identified
-
Two sutures are placed through the strong ligament and secured to the top of the vagina. This results in increased support to the upper vagina. There is no shortening of the vagina
-
Other fascial defects in the vagina are repaired, and the vaginal skin is closed
Anterior vaginal repair (colporrhaphy)
Indication
-
Prolapse of the bladder or urethra
-
Sometimes used to treat urinary stress incontinence
Surgical technique
-
The procedure can be performed under regional or general anaesthesia
-
The vagina overlying the bladder and urethra is incised in the midline
-
Dissection in a plane directly below the vagina allows the damaged fascia supporting the bladder and urethra to be exposed
-
The fascia is plicated in the midline using delayed absorbable or permanent sutures
-
Sometimes excessive vaginal skin is removed
-
The vaginal skin is then closed
-
Other sites of prolapse are then repaired as required
Posterior vaginal repair and perineoplasty
Indications
Treatment of rectocele (rectum bulges or herniates forward into the vagina) and defects of the perineum (area separating entrance of the vagina and anus)
Aim
correct defects in the rectovaginal fascia separating rectum and vagina while allowing bowel function to be maintained or corrected without interfering with sexual function
Surgical technique
-
An incision is made on the posterior wall of the vagina starting at the entrance and finishing at the top of the vagina
-
Dissecting the vagina and rectovaginal fascia from the vagina until the pelvic floor muscles (puborectalis) are located
-
Defects in the fascia are corrected by centrally plicating the fascia using delayed absorption sutures
-
The perineal defects are repaired by placing deep sutures into the perineal muscles to build up the perineal body
-
The overlying vaginal and vulval skin is then closed
-
A pack is usually placed into the vagina and a catheter into the bladder at the end of surgery
Anterior or posterior vaginal repair, or both (colporrhaphy)
Indications:
Anterior repair: treatment for prolapse of bladder (bladder bulges forward into the vagina; cystocele) or urethra.
Posterior repair: correction of bowel prolapse (rectum bulges forward into the vagina; rectocele).
Vault repair: treat prolapse of upper vagina.
Depending on the side of the defect, the repair can either be anterior, posterior, vault, or total. The repair is achieved by the placement of permanent mesh, which may result in a stronger repair.
Surgical technique
The procedure can be performed under regional or general anaesthesia.
Anterior vaginal repair
-
Midline incision to the vagina overlying the bladder and urethra
-
Dissection in a plane directly below the vagina and lateral of the bladder allows the damaged fascia supporting the bladder to be exposed
-
The fascia is plicated in the midline using sutures
-
Mesh can be used to reinforce the repair and can be used as an inlay or anchored through the obturator foramen and exiting through small incisions at both sides of the upper inner thigh
-
The vaginal skin is closed
Posterior and vault repair
-
An incision is made to the posterior wall of the vagina
-
Dissection below the vagina identifies the rectovaginal fascia and opens the space between the rectum and the pelvic floor muscle to the sacrospinous ligaments
-
Defects in the fascia are corrected by centrally plicating the fascia using sutures
-
Mesh can be used to reinforce the repair and can be used as an inlay or anchored bilaterally to the pelvic side wall and exiting through a small incision approximately 3 cm lateral and down from the anus
-
The vaginal skin is then closed
Vaginal paravaginal repair
Aim
The objective of this surgery is to reattach detached lateral vaginal fascia to its normal point of insertion on the lateral side wall. This firm area of attachment is termed the white line or arcus tendineus fascia pelvis.
Indication
The repair of anterior wall prolapse due to defects of the lateral supporting tissues
Procedure
The procedure can be performed under regional or general anaesthesia.
Routine anterior repair
The sharp dissection of the vagina from the bladder fascia continues laterally until the pelvic side wall can be identified.
Permanent or delayed absorbable sutures are placed from the lateral vagina to the firm pelvic side wall tissue (white line or arcus tendineus fascia pelvis). Three to four sutures are placed on each side.
A routine anterior repair with midline plication of the fascia, trimming of excess vaginal skin as required, and closure of the vaginal skin.
Appendix 2. Searches
Search strategy:
The Incontinence Group Specialised Register was searched using the Group's own keyword system (all searches were of the keyword field of Reference Manager 2012). The search terms used were:
({design.cct*} OR {design.rct*})
AND
({topic.prolapse*})
AND
({intvent.surg*})
Date of the most recent search of the register for this review: 6 July 2015.
Search registered trials: clinicaltrials.gov: date 1/6/2015 Terms: "Vaginal prolapse" "Surgery prolapse" with 175 trials identified

PRISMA study flow diagram.

Risk of bias summary: review authors' judgements about each risk of bias item for each included study.

Risk of bias graph: review authors' judgements about each risk of bias item presented as percentages across all included studies.

Forest plot of comparison: 1 Any transvaginal permanent mesh versus native tissue repair, outcome: 1.1 Awareness of prolapse (1 to 3 years).

Forest plot of comparison: 3 Biological repair versus native tissue repair, outcome: 3.1 Awareness of prolapse (1 to 3 years).

Funnel plot of comparison: 1 Any transvaginal permanent mesh versus native tissue repair, outcome: 1.3 Recurrent prolapse (any) at 1 to 3 years.

Comparison 1 Any transvaginal permanent mesh versus native tissue repair, Outcome 1 Awareness of prolapse (1‐3 years).

Comparison 1 Any transvaginal permanent mesh versus native tissue repair, Outcome 2 Repeat surgery (1‐3 years).

Comparison 1 Any transvaginal permanent mesh versus native tissue repair, Outcome 3 Recurrent prolapse (any) at 1‐3 years.

Comparison 1 Any transvaginal permanent mesh versus native tissue repair, Outcome 4 Injuries bladder or bowel.

Comparison 1 Any transvaginal permanent mesh versus native tissue repair, Outcome 5 Objective failure of anterior compartment (cystocoele).

Comparison 1 Any transvaginal permanent mesh versus native tissue repair, Outcome 6 Objective failure of posterior compartment (rectocoele).

Comparison 1 Any transvaginal permanent mesh versus native tissue repair, Outcome 7 POPQ assessment (any mesh).

Comparison 1 Any transvaginal permanent mesh versus native tissue repair, Outcome 8 Bladder function: de novo stress urinary incontinence (1‐3 years).
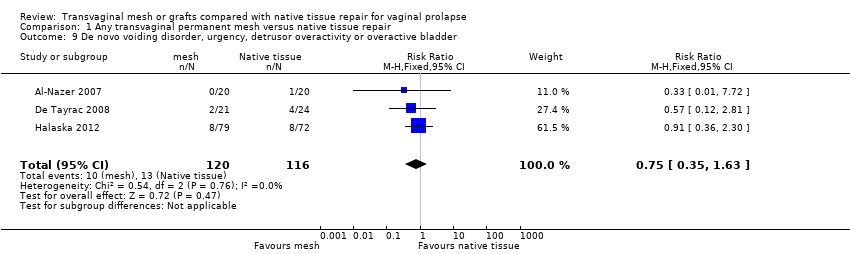
Comparison 1 Any transvaginal permanent mesh versus native tissue repair, Outcome 9 De novo voiding disorder, urgency, detrusor overactivity or overactive bladder.

Comparison 1 Any transvaginal permanent mesh versus native tissue repair, Outcome 10 De novo dyspareunia (1‐3 years).

Comparison 1 Any transvaginal permanent mesh versus native tissue repair, Outcome 11 Sexual function (1‐3 years).

Comparison 1 Any transvaginal permanent mesh versus native tissue repair, Outcome 12 Quality of life: continuous data (1‐2 years):.

Comparison 1 Any transvaginal permanent mesh versus native tissue repair, Outcome 13 Quality of life: dichotomous data "much or very much better".

Comparison 1 Any transvaginal permanent mesh versus native tissue repair, Outcome 14 Operating time (minutes).

Comparison 1 Any transvaginal permanent mesh versus native tissue repair, Outcome 15 Blood transfusion.

Comparison 1 Any transvaginal permanent mesh versus native tissue repair, Outcome 16 Length of stay in hospital (days).

Comparison 2 Absorbable mesh versus native tissue repair, Outcome 1 Awareness of prolapse (2 year review).

Comparison 2 Absorbable mesh versus native tissue repair, Outcome 2 Repeat surgery for prolapse (2 years).
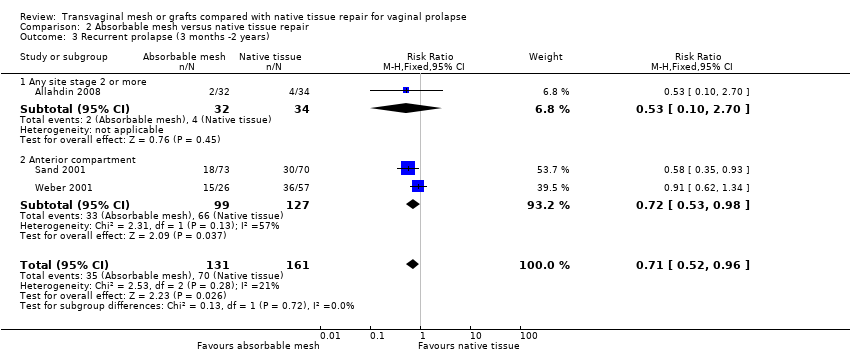
Comparison 2 Absorbable mesh versus native tissue repair, Outcome 3 Recurrent prolapse (3 months ‐2 years).

Comparison 2 Absorbable mesh versus native tissue repair, Outcome 4 Death.

Comparison 2 Absorbable mesh versus native tissue repair, Outcome 5 Objective failure of anterior compartment (cystocoele).

Comparison 2 Absorbable mesh versus native tissue repair, Outcome 6 Objective failure of posterior compartment (rectocoele).
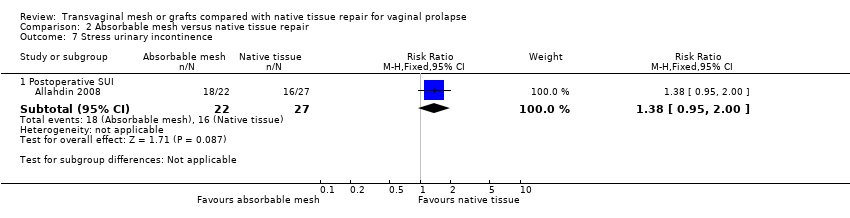
Comparison 2 Absorbable mesh versus native tissue repair, Outcome 7 Stress urinary incontinence.

Comparison 2 Absorbable mesh versus native tissue repair, Outcome 8 Quality of life (2 years).

Comparison 3 Biological repair versus native tissue repair, Outcome 1 Awareness of prolapse (1‐3 year).
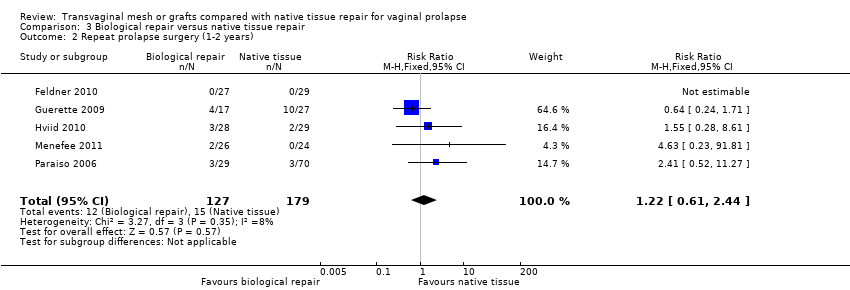
Comparison 3 Biological repair versus native tissue repair, Outcome 2 Repeat prolapse surgery (1‐2 years).

Comparison 3 Biological repair versus native tissue repair, Outcome 3 Recurrent prolapse (1 year).

Comparison 3 Biological repair versus native tissue repair, Outcome 4 Injuries to bladder or bowel.

Comparison 3 Biological repair versus native tissue repair, Outcome 5 Objective failure of anterior compartment (cystocele).

Comparison 3 Biological repair versus native tissue repair, Outcome 6 Objective failure of posterior compartment (rectocele).

Comparison 3 Biological repair versus native tissue repair, Outcome 7 POPQ assessment.

Comparison 3 Biological repair versus native tissue repair, Outcome 8 De novo urinary stress incontinence.

Comparison 3 Biological repair versus native tissue repair, Outcome 9 De novo voiding disorders, urgency, detrusor overactivity or overactive bladder.

Comparison 3 Biological repair versus native tissue repair, Outcome 10 De novo dyspareunia (1 year).

Comparison 3 Biological repair versus native tissue repair, Outcome 11 Sexual function (1 year).

Comparison 3 Biological repair versus native tissue repair, Outcome 12 Quality of life (1 year).

Comparison 3 Biological repair versus native tissue repair, Outcome 13 Operating time (minutes).

Comparison 3 Biological repair versus native tissue repair, Outcome 14 Blood transfusion.
| Any transvaginal permanent mesh versus native tissue repair for vaginal prolapse | ||||||
| Population: women with vaginal prolapse | ||||||
| Outcomes | Illustrative comparative risks* (95% CI) | Relative effect | No of Participants | Quality of the evidence | Comments | |
| Assumed risk | Corresponding risk | |||||
| Native tissue repair | Any transvaginal permanent mesh | |||||
| Awareness of prolapse review 1 to 3 years | 188 per 1000 | 124 per 1000 | RR 0.66 (0.54 to 0.81) | 1614 (12 RCTs) | ⊕⊕⊕⊝ | |
| Repeat surgery ‐ prolapse review 1 to 3 years | 32 per 1000 | 17 per 1000 | RR 0.53 | 1675 | ⊕⊕⊕⊝ | |
| Repeat surgery ‐ continence surgery | 26 per 1000 | 28 per 1000 (16 to 48) | RR 1.07 (0.62 to 1.83) | 1284 (9 RCTs) | ⊕⊕⊝⊝ | |
| Repeat surgery ‐ surgery for prolapse, SUI, or mesh exposure review 1 to 3 years | 48 per 1000 | 114 per 1000 | RR 2.40 | 867 | ⊕⊕⊕⊝ | |
| Recurrent prolapse review 1 to 3 years | 381 per 1000 | 152 per 1000 | RR 0.40 | 2494 | ⊕⊕⊝⊝ | I2 = 73% |
| Bladder injury | 5 per 1000 | 21 per 1000 | RR 3.92 | 1514 | ⊕⊕⊕⊝ | |
| De novo dyspareunia (pain during sexual intercourse) review 1 to 3 years | 95 per 1000 | 88 per 1000 | RR 0.92 | 764 | ⊕⊕⊝⊝ | |
| De novo stress urinary incontinence review 1 to 3 years | 96 per 1000 | 133 per 1000 | RR 1.39 | 1512 | ⊕⊕⊝⊝ | |
| Quality of life review 1 to 2 years | The mean quality of life in the mesh groups was 0.05 standard deviations higher (0.20 lower to 0.30 higher). This is an imprecise finding that is consistent with a small benefit in either group, or else no difference between the groups | 665 (7 studies) | ⊕⊝⊝⊝ very low1, 2,4 | I2 = 60% | ||
| *The basis for the assumed risk is the median control group risk across studies The corresponding risk (and its 95% confidence interval) is based on the assumed risk in the comparison group and the relative effect of the intervention (and its 95% CI). | ||||||
| GRADE Working Group grades of evidence | ||||||
| 1Downgraded one level due to serious risk of bias: most of the studies were at unclear or high risk of bias associated with poor reporting of methods, including failure by many to describe satisfactory methods of allocation concealment or blinding. A minority of studies did not report use of blinding at all. 2Downgraded one level due to serious imprecision: findings compatible with benefit in either group or with no clinically meaningful difference between the groups. 3Downgraded one level due to serious imprecision: findings compatible with benefit in native tissue group or with no clinically meaningful difference between the groups. 4Downgraded one level due to serious inconsistency: substantial statistical heterogeneity. | ||||||
| Absorbable mesh versus native tissue repair for vaginal prolapse | ||||||
| Population: women with vaginal prolapse Control: native tissue repair | ||||||
| Outcomes | Illustrative comparative risks* (95% CI) | Relative effect | No of Participants | Quality of the evidence | Comments | |
| Assumed risk | Corresponding risk | |||||
| Native tissue repair | Absorbable mesh | |||||
| Awareness of prolapse at 2 years | 724 per 1000 | 760 per 1000 | RR 1.05 | 54 | ⊕⊝⊝⊝ | |
| Repeat surgery for prolapse (stage 2 or more) at 2 years | 125 per 1000 | 59 per 1000 | RR 0.47 | 66 | ⊕⊝⊝⊝ | |
| Recurrent prolapse at 3 months to 2 years | 429 per 1000 | 304 per 1000 | RR 0.71 | 292 | ⊕⊕⊝⊝ | |
| Bladder injury | Not reported in the included studies | |||||
| De novo dyspareunia (pain during sexual intercourse) review 1 to 3 years | Not reported in the included studies | |||||
| Stress urinary incontinence at 2 years | 593 per 1000 | 818 per 1000 | RR 1.38 | 49 | ⊕⊝⊝⊝ | |
| Quality of life at 2 years | The mean quality of life score was the same in both groups, when measured using a severity score of 1 to 10 (mean difference 0, 95% CI ‐2.82 to 2.82) | 54 | ⊕⊝⊝⊝ | |||
| *The basis for the assumed risk (e.g. the median control group risk across studies) is provided in footnotes. The corresponding risk (and its 95% confidence interval) is based on the assumed risk in the comparison group and the relative effect of the intervention (and its 95% CI). | ||||||
| GRADE Working Group grades of evidence | ||||||
| 1Downgraded one level due to serious risk of attrition bias: at two years 18% not included in analysis. | ||||||
| Biological repair versus native tissue repair for vaginal prolapse | ||||||
| Population: women with vaginal prolapse Control: native tissue repair | ||||||
| Outcomes | Illustrative comparative risks* (95% CI) | Relative effect | No of Participants | Quality of the evidence | Comments | |
| Assumed risk | Corresponding risk | |||||
| Native tissue repair | Biological repair | |||||
| Awareness of prolapse at 1 to 3 years | 105 per 1000 | 102 per 1000 | RR 0.97 | 777 | ⊕⊕⊝⊝ | |
| Repeat prolapse surgery 1 to 2 years | 43 per 1000 | 52 per 1000 | RR 1.22 | 306 | ⊕⊕⊝⊝ | |
| Recurrent prolapse at 1 year | 295 per 1000 | 277 per 1000 | RR 0.94 | 587 | ⊕⊝⊝⊝ | |
| Bladder injury | Not estimable as only 1 event occurred (in the native tissue group) | 137 (1 study) | ||||
| Bowel injury | Not estimable as only 1 event occurred (in the biological repair group) | 137 (1 study) | ||||
| De novo dyspareunia (pain during sexual intercourse) review 1 to 3 years | 177 per 1000 | 150 per 1000 | RR 0.85 | 37 | ⊕⊝⊝⊝ | |
| De novo urinary stress incontinence at 1 year | Not estimable ‐ no events occurred | 56 | ||||
| Quality of life at 1 year | The mean quality of life in the biological repair group was 0.05 standard deviations lower (0.48 lower to 0.38 higher). This is an imprecise finding that is consistent with a small benefit in either group, or else no difference between the groups | 84 | ⊕⊝⊝⊝ | |||
| *The basis for the assumed risk is the median control group risk across studies. The corresponding risk (and its 95% confidence interval) is based on the assumed risk in the comparison group and the relative effect of the intervention (and its 95% CI). | ||||||
| GRADE Working Group grades of evidence | ||||||
| 1Downgraded one level due to serious risk of bias: four of the studies at high or unclear risk of bias associated with blinding status. 7Downgraded one level due to serious risk of bias: blinding status unclear. 8Downgraded two levels due to very serious imprecision: single small study, only six events. 9Downgraded one level due to serious risk of attrition bias, and a further two levels due to very serious imprecision: only 84 participants. | ||||||
| Study ID | Repair events | Repair total | Exposure events | Exposure total |
| Ali 2006 abstract | 0 | 43 | 3 | 46 |
| 0 | 23 | 1 | 21 | |
| 0 | 182 | 21 | 183 | |
| 0 | 60 | 5 | 62 | |
| 0 | 81 | 18 | 88 | |
| 0 | 39 | 2 | 40 | |
| 0 | 54 | 4 | 44 | |
| 0 | 72 | 16 | 79 | |
| 0 | 33 | 5 | 32 | |
| 0 | 35 | 2 | 33 | |
| 0 | 24 | 2 | 28 | |
| 0 | 38 | 2 | 37 | |
| 0 | 96 | 18 | 104 | |
| Qatawneh 2013 | 0 | 63 | 4 | 53 |
| 0 | 42 | 3 | 43 | |
| Thijs 2010 abstract | 0 | 48 | 9 | 48 |
| 0 | 20 | 3 | 20 | |
| 0 | 51 | 2 | 53 | |
| 0 | 84 | 14 | 83 | |
| Total | 134 | 1097 |
| Study ID | Repair events | Repair total | Exposure events | Exposure total |
| Ali 2006 abstract | 0 | 43 | 3 | 46 |
| 0 | 23 | 1 | 21 | |
| 0 | 182 | 21 | 183 | |
| 0 | 39 | 2 | 40 | |
| 0 | 54 | 4 | 44 | |
| 0 | 35 | 2 | 33 | |
| 0 | 24 | 2 | 28 | |
| 0 | 38 | 2 | 37 | |
| 0 | 96 | 18 | 104 | |
| Qatawneh 2013 | 0 | 63 | 4 | 53 |
| 0 | 42 | 3 | 43 | |
| Thijs 2010 abstract | 0 | 48 | 9 | 48 |
| 0 | 20 | 3 | 20 | |
| 0 | 51 | 2 | 53 | |
| Total | 76 | 753 |
| Study ID | Repair events | Repair total | Exposure events | Exposure total |
| 0 | 60 | 5 | 62 | |
| 0 | 81 | 18 | 88 | |
| 0 | 72 | 16 | 79 | |
| 0 | 33 | 5 | 32 | |
| 0 | 84 | 14 | 83 | |
| Total | 58 | 344 |
| Study ID | Surgery for mesh exposure | Total number of women in mesh group |
| 6 | 186 | |
| 3 | 62 | |
| 7 | 88 | |
| 4 | 66 | |
| 2 | 40 | |
| 2 | 44 | |
| 10 | 79 | |
| 3 | 32 | |
| 2 | 33 | |
| 2 | 37 | |
| 14 | 104 | |
| Qatawneh 2013 | 4 | 53 |
| 5 | 78 | |
| 3 | 43 | |
| 2 | 36 | |
| 7 | 42 | |
| Thijs 2010 abstract | 4 | 48 |
| 3 | 20 | |
| 2 | 53 | |
| 5 | 83 | |
| Total | 100 | 1227 |
| Outcome or subgroup title | No. of studies | No. of participants | Statistical method | Effect size |
| 1 Awareness of prolapse (1‐3 years) Show forest plot | 12 | 1614 | Risk Ratio (M‐H, Fixed, 95% CI) | 0.66 [0.54, 0.81] |
| 1.1 Anterior compartment:mesh vs native tissue | 9 | 1172 | Risk Ratio (M‐H, Fixed, 95% CI) | 0.65 [0.51, 0.84] |
| 1.2 Multicompartment: mesh vs native tissue | 4 | 442 | Risk Ratio (M‐H, Fixed, 95% CI) | 0.67 [0.46, 0.97] |
| 2 Repeat surgery (1‐3 years) Show forest plot | 14 | Risk Ratio (M‐H, Fixed, 95% CI) | Subtotals only | |
| 2.1 Prolapse | 12 | 1675 | Risk Ratio (M‐H, Fixed, 95% CI) | 0.53 [0.31, 0.88] |
| 2.2 Continence surgery | 9 | 1284 | Risk Ratio (M‐H, Fixed, 95% CI) | 1.07 [0.62, 1.83] |
| 2.3 Surgery for prolapse, SUI or mesh exposure | 7 | 867 | Risk Ratio (M‐H, Fixed, 95% CI) | 2.40 [1.51, 3.81] |
| 3 Recurrent prolapse (any) at 1‐3 years Show forest plot | 21 | 2494 | Risk Ratio (M‐H, Random, 95% CI) | 0.40 [0.30, 0.53] |
| 3.1 Anterior compartment repair: mesh versus native tissue | 15 | 1748 | Risk Ratio (M‐H, Random, 95% CI) | 0.33 [0.26, 0.40] |
| 3.2 Multi‐compartment repair: mesh versus native tissue | 6 | 746 | Risk Ratio (M‐H, Random, 95% CI) | 0.59 [0.40, 0.87] |
| 4 Injuries bladder or bowel Show forest plot | 11 | Risk Ratio (M‐H, Fixed, 95% CI) | Subtotals only | |
| 4.1 Bladder injury | 11 | 1514 | Risk Ratio (M‐H, Fixed, 95% CI) | 3.92 [1.62, 9.50] |
| 4.2 Bowel injury | 1 | 169 | Risk Ratio (M‐H, Fixed, 95% CI) | 3.26 [0.13, 78.81] |
| 5 Objective failure of anterior compartment (cystocoele) Show forest plot | 13 | 1406 | Risk Ratio (M‐H, Fixed, 95% CI) | 0.45 [0.36, 0.55] |
| 5.1 Anterior compartment repair: mesh versus native tissue | 9 | 1004 | Risk Ratio (M‐H, Fixed, 95% CI) | 0.36 [0.28, 0.47] |
| 5.2 Multi‐compartment repair: mesh versus native tissue | 4 | 402 | Risk Ratio (M‐H, Fixed, 95% CI) | 0.73 [0.51, 1.06] |
| 6 Objective failure of posterior compartment (rectocoele) Show forest plot | 3 | 226 | Risk Ratio (M‐H, Fixed, 95% CI) | 0.64 [0.29, 1.42] |
| 6.1 Mesh vs native tissue | 3 | 226 | Risk Ratio (M‐H, Fixed, 95% CI) | 0.64 [0.29, 1.42] |
| 7 POPQ assessment (any mesh) Show forest plot | 10 | Mean Difference (IV, Random, 95% CI) | Subtotals only | |
| 7.1 Point Ba POPQ | 10 | 1125 | Mean Difference (IV, Random, 95% CI) | ‐0.93 [‐1.27, ‐0.59] |
| 7.2 Point C POPQ | 8 | 925 | Mean Difference (IV, Random, 95% CI) | ‐0.45 [‐1.13, 0.23] |
| 7.3 Point Bp | 7 | 832 | Mean Difference (IV, Random, 95% CI) | 0.05 [‐0.34, 0.44] |
| 7.4 total vaginal length | 5 | 611 | Mean Difference (IV, Random, 95% CI) | 0.07 [‐0.25, 0.40] |
| 8 Bladder function: de novo stress urinary incontinence (1‐3 years) Show forest plot | 12 | 1512 | Risk Ratio (M‐H, Fixed, 95% CI) | 1.39 [1.06, 1.82] |
| 8.1 Anterior compartment: mesh vs native tissue | 8 | 1205 | Risk Ratio (M‐H, Fixed, 95% CI) | 1.45 [1.00, 2.11] |
| 8.2 Multi compartment : mesh vs native tissue | 4 | 307 | Risk Ratio (M‐H, Fixed, 95% CI) | 1.31 [0.90, 1.92] |
| 9 De novo voiding disorder, urgency, detrusor overactivity or overactive bladder Show forest plot | 3 | 236 | Risk Ratio (M‐H, Fixed, 95% CI) | 0.75 [0.35, 1.63] |
| 10 De novo dyspareunia (1‐3 years) Show forest plot | 11 | 764 | Risk Ratio (M‐H, Fixed, 95% CI) | 0.92 [0.58, 1.47] |
| 10.1 Anterior compartment: mesh vs native tissue | 8 | 643 | Risk Ratio (M‐H, Fixed, 95% CI) | 1.08 [0.60, 1.93] |
| 10.2 Multicompartment: mesh vs native tissue | 3 | 121 | Risk Ratio (M‐H, Fixed, 95% CI) | 0.65 [0.29, 1.42] |
| 11 Sexual function (1‐3 years) Show forest plot | 7 | Mean Difference (IV, Fixed, 95% CI) | Subtotals only | |
| 11.1 PISQ score | 7 | 857 | Mean Difference (IV, Fixed, 95% CI) | ‐0.13 [‐0.40, 0.13] |
| 12 Quality of life: continuous data (1‐2 years): Show forest plot | 7 | 665 | Std. Mean Difference (IV, Random, 95% CI) | 0.05 [‐0.20, 0.30] |
| 12.1 PQOL end score | 3 | 331 | Std. Mean Difference (IV, Random, 95% CI) | 0.09 [‐0.31, 0.49] |
| 12.2 Pelvic floor impact questionnaire end score | 4 | 334 | Std. Mean Difference (IV, Random, 95% CI) | 0.02 [‐0.34, 0.37] |
| 13 Quality of life: dichotomous data "much or very much better" Show forest plot | 1 | 168 | Risk Ratio (M‐H, Fixed, 95% CI) | 1.0 [0.80, 1.25] |
| 13.1 PGI‐I | 1 | 168 | Risk Ratio (M‐H, Fixed, 95% CI) | 1.0 [0.80, 1.25] |
| 14 Operating time (minutes) Show forest plot | 13 | Mean Difference (IV, Random, 95% CI) | Totals not selected | |
| 14.1 Anterior compartment: mesh vs native tissue | 10 | Mean Difference (IV, Random, 95% CI) | 0.0 [0.0, 0.0] | |
| 14.2 Multicompartment: mesh vs native tissue | 3 | Mean Difference (IV, Random, 95% CI) | 0.0 [0.0, 0.0] | |
| 15 Blood transfusion Show forest plot | 6 | 723 | Risk Ratio (M‐H, Fixed, 95% CI) | 1.55 [0.88, 2.72] |
| 16 Length of stay in hospital (days) Show forest plot | 7 | 953 | Mean Difference (IV, Random, 95% CI) | ‐0.06 [‐0.30, 0.18] |
| Outcome or subgroup title | No. of studies | No. of participants | Statistical method | Effect size |
| 1 Awareness of prolapse (2 year review) Show forest plot | 1 | 54 | Risk Ratio (M‐H, Fixed, 95% CI) | 1.05 [0.77, 1.44] |
| 2 Repeat surgery for prolapse (2 years) Show forest plot | 1 | 66 | Risk Ratio (M‐H, Fixed, 95% CI) | 0.47 [0.09, 2.40] |
| 3 Recurrent prolapse (3 months ‐2 years) Show forest plot | 3 | 292 | Risk Ratio (M‐H, Fixed, 95% CI) | 0.71 [0.52, 0.96] |
| 3.1 Any site stage 2 or more | 1 | 66 | Risk Ratio (M‐H, Fixed, 95% CI) | 0.53 [0.10, 2.70] |
| 3.2 Anterior compartment | 2 | 226 | Risk Ratio (M‐H, Fixed, 95% CI) | 0.72 [0.53, 0.98] |
| 4 Death Show forest plot | 2 | 175 | Risk Ratio (M‐H, Fixed, 95% CI) | 0.0 [0.0, 0.0] |
| 4.1 absorbable mesh versus native tissue repair | 2 | 175 | Risk Ratio (M‐H, Fixed, 95% CI) | 0.0 [0.0, 0.0] |
| 5 Objective failure of anterior compartment (cystocoele) Show forest plot | 2 | 226 | Risk Ratio (M‐H, Fixed, 95% CI) | 0.72 [0.53, 0.98] |
| 5.1 Anterior compartment repair: absorbable mesh versus native tissue | 1 | 83 | Risk Ratio (M‐H, Fixed, 95% CI) | 0.91 [0.62, 1.34] |
| 5.2 Multi‐compartment repair: absorbable mesh versus native tissue | 1 | 143 | Risk Ratio (M‐H, Fixed, 95% CI) | 0.58 [0.35, 0.93] |
| 6 Objective failure of posterior compartment (rectocoele) Show forest plot | 1 | 132 | Risk Ratio (M‐H, Fixed, 95% CI) | 1.13 [0.40, 3.19] |
| 6.1 Multi‐compartment repair: absorbable mesh versus native tissue | 1 | 132 | Risk Ratio (M‐H, Fixed, 95% CI) | 1.13 [0.40, 3.19] |
| 7 Stress urinary incontinence Show forest plot | 1 | Risk Ratio (M‐H, Fixed, 95% CI) | Subtotals only | |
| 7.1 Postoperative SUI | 1 | 49 | Risk Ratio (M‐H, Fixed, 95% CI) | 1.38 [0.95, 2.00] |
| 8 Quality of life (2 years) Show forest plot | 1 | 54 | Mean Difference (IV, Fixed, 95% CI) | 0.0 [‐2.82, 2.82] |
| 8.1 VAS QoL | 1 | 54 | Mean Difference (IV, Fixed, 95% CI) | 0.0 [‐2.82, 2.82] |
| Outcome or subgroup title | No. of studies | No. of participants | Statistical method | Effect size |
| 1 Awareness of prolapse (1‐3 year) Show forest plot | 7 | 777 | Risk Ratio (M‐H, Fixed, 95% CI) | 0.97 [0.65, 1.43] |
| 1.1 Anterior compartment repair: biological graft vs native tissue | 4 | 429 | Risk Ratio (M‐H, Fixed, 95% CI) | 0.75 [0.45, 1.23] |
| 1.2 Multicompartment repair: biological graft vs native tissue | 1 | 126 | Risk Ratio (M‐H, Fixed, 95% CI) | 4.55 [1.04, 19.92] |
| 1.3 Posterior compartment repair: biological graft vs native tissue | 2 | 222 | Risk Ratio (M‐H, Fixed, 95% CI) | 0.90 [0.41, 1.94] |
| 2 Repeat prolapse surgery (1‐2 years) Show forest plot | 5 | 306 | Risk Ratio (M‐H, Fixed, 95% CI) | 1.22 [0.61, 2.44] |
| 3 Recurrent prolapse (1 year) Show forest plot | 7 | 587 | Risk Ratio (M‐H, Random, 95% CI) | 0.94 [0.60, 1.47] |
| 3.1 Anterior compartment repair: biological graft vs native tissue | 5 | 369 | Risk Ratio (M‐H, Random, 95% CI) | 0.75 [0.54, 1.05] |
| 3.2 Posterior compartment repair: biological graft vs native tissue | 2 | 218 | Risk Ratio (M‐H, Random, 95% CI) | 2.09 [1.18, 3.70] |
| 4 Injuries to bladder or bowel Show forest plot | 1 | Risk Ratio (M‐H, Fixed, 95% CI) | Subtotals only | |
| 4.1 bladder injury | 1 | 137 | Risk Ratio (M‐H, Fixed, 95% CI) | 0.35 [0.01, 8.40] |
| 4.2 bowel injury | 1 | 137 | Risk Ratio (M‐H, Fixed, 95% CI) | 3.13 [0.13, 75.57] |
| 5 Objective failure of anterior compartment (cystocele) Show forest plot | 6 | 570 | Risk Ratio (M‐H, Random, 95% CI) | 0.66 [0.46, 0.96] |
| 6 Objective failure of posterior compartment (rectocele) Show forest plot | 3 | 283 | Risk Ratio (M‐H, Random, 95% CI) | 1.16 [0.39, 3.51] |
| 7 POPQ assessment Show forest plot | 1 | Mean Difference (IV, Fixed, 95% CI) | Subtotals only | |
| 7.1 Ba POPQ | 1 | 56 | Mean Difference (IV, Fixed, 95% CI) | ‐0.5 [‐0.98, ‐0.02] |
| 7.2 Point C | 1 | 56 | Mean Difference (IV, Fixed, 95% CI) | ‐0.60 [‐1.28, 0.08] |
| 7.3 Bp POPQ | 1 | 56 | Mean Difference (IV, Fixed, 95% CI) | 0.10 [‐0.27, 0.47] |
| 7.4 total vaginal length | 1 | 56 | Mean Difference (IV, Fixed, 95% CI) | 0.60 [0.06, 1.14] |
| 8 De novo urinary stress incontinence Show forest plot | 1 | 56 | Risk Ratio (M‐H, Fixed, 95% CI) | 0.0 [0.0, 0.0] |
| 9 De novo voiding disorders, urgency, detrusor overactivity or overactive bladder Show forest plot | 2 | 93 | Risk Ratio (M‐H, Fixed, 95% CI) | 0.81 [0.29, 2.26] |
| 10 De novo dyspareunia (1 year) Show forest plot | 1 | 37 | Risk Ratio (M‐H, Fixed, 95% CI) | 0.85 [0.20, 3.67] |
| 11 Sexual function (1 year) Show forest plot | 1 | 35 | Mean Difference (IV, Fixed, 95% CI) | 1.0 [‐2.33, 4.33] |
| 11.1 PISQ | 1 | 35 | Mean Difference (IV, Fixed, 95% CI) | 1.0 [‐2.33, 4.33] |
| 12 Quality of life (1 year) Show forest plot | 2 | 84 | Std. Mean Difference (IV, Fixed, 95% CI) | ‐0.05 [‐0.48, 0.38] |
| 12.1 PQOL score | 1 | 56 | Std. Mean Difference (IV, Fixed, 95% CI) | 0.10 [‐0.42, 0.63] |
| 12.2 PFDI‐20 | 1 | 28 | Std. Mean Difference (IV, Fixed, 95% CI) | ‐0.36 [‐1.11, 0.39] |
| 13 Operating time (minutes) Show forest plot | 4 | 232 | Mean Difference (IV, Fixed, 95% CI) | 10.34 [6.31, 14.36] |
| 14 Blood transfusion Show forest plot | 1 | 100 | Risk Ratio (M‐H, Fixed, 95% CI) | 2.13 [0.14, 32.90] |