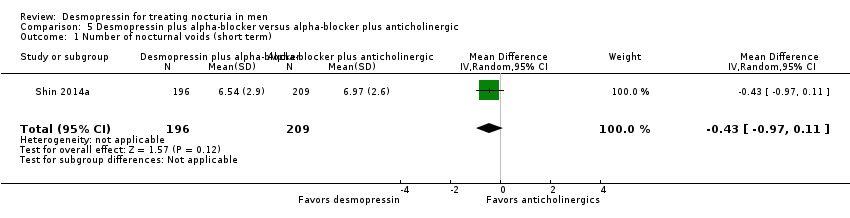
| 1 Number of nocturnal voids (short term) (subgroup route) Show forest plot | 6 | 1982 | Mean Difference (IV, Random, 95% CI) | ‐0.61 [‐0.96, ‐0.27] |
|
| 1.1 Intranasal | 1 | 870 | Mean Difference (IV, Random, 95% CI) | ‐0.20 [‐0.34, ‐0.06] |
| 1.2 Sublingual | 3 | 851 | Mean Difference (IV, Random, 95% CI) | ‐0.37 [‐0.71, ‐0.03] |
| 1.3 Oral | 2 | 261 | Mean Difference (IV, Random, 95% CI) | ‐1.14 [‐1.41, ‐0.86] |
| 2 Number of nocturnal voids (intermediate term) Show forest plot | 1 | 115 | Mean Difference (IV, Random, 95% CI) | ‐0.85 [‐1.17, ‐0.53] |
|
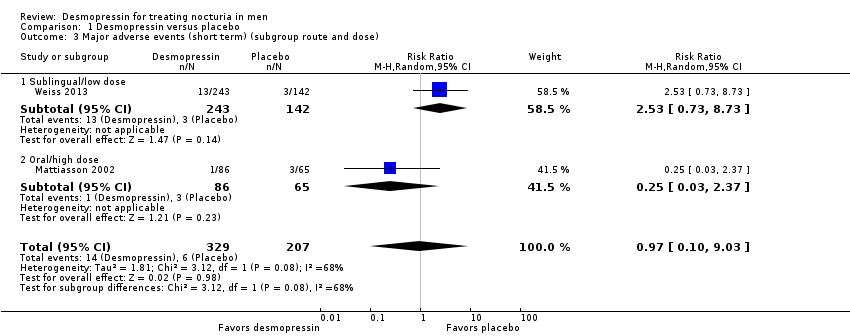
| 3 Major adverse events (short term) (subgroup route and dose) Show forest plot | 2 | 536 | Risk Ratio (M‐H, Random, 95% CI) | 0.97 [0.10, 9.03] |
|
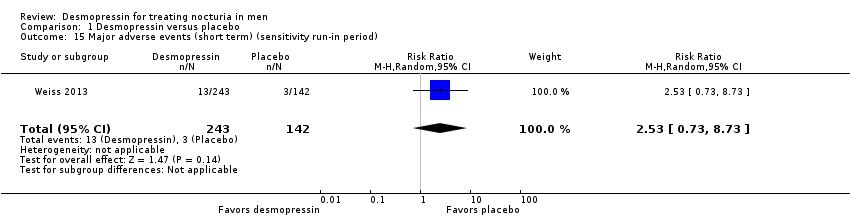
| 3.1 Sublingual/low dose | 1 | 385 | Risk Ratio (M‐H, Random, 95% CI) | 2.53 [0.73, 8.73] |
| 3.2 Oral/high dose | 1 | 151 | Risk Ratio (M‐H, Random, 95% CI) | 0.25 [0.03, 2.37] |
| 4 Major adverse events (intermediate term) Show forest plot | 1 | 115 | Risk Ratio (M‐H, Random, 95% CI) | 3.05 [0.13, 73.39] |
|
| 5 Duration of first sleep episode (short term) Show forest plot | 4 | 652 | Mean Difference (IV, Random, 95% CI) | 54.61 [13.97, 95.25] |
|
| 6 Duration of first sleep episode (intermediate term) Show forest plot | 1 | 115 | Mean Difference (IV, Random, 95% CI) | 18.40 [11.60, 25.20] |
|
| 7 Time to first void (short term) [minutes] Show forest plot | 1 | 383 | Mean Difference (IV, Random, 95% CI) | 40.8 [17.07, 64.53] |
|
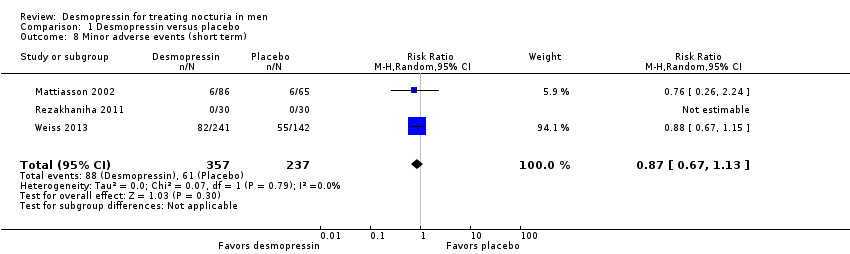
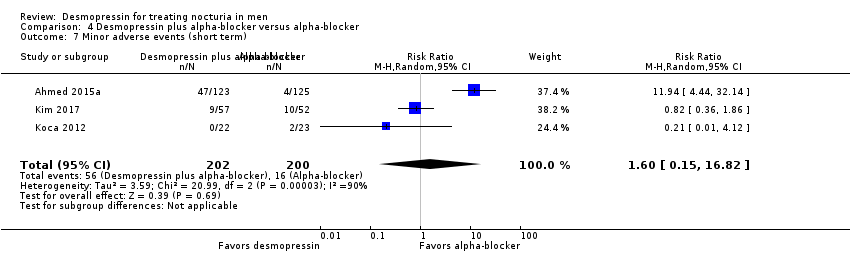
| 8 Minor adverse events (short term) Show forest plot | 3 | 594 | Risk Ratio (M‐H, Random, 95% CI) | 0.87 [0.67, 1.13] |
|
| 9 Minor adverse events (intermediate term) Show forest plot | 1 | 115 | Risk Ratio (M‐H, Random, 95% CI) | 0.86 [0.49, 1.49] |
|
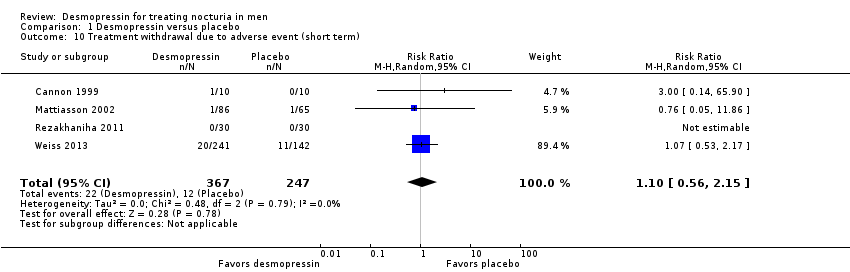
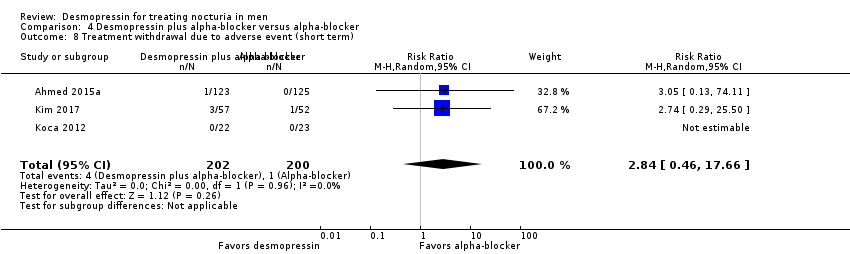
| 10 Treatment withdrawal due to adverse event (short term) Show forest plot | 4 | 614 | Risk Ratio (M‐H, Random, 95% CI) | 1.10 [0.56, 2.15] |
|
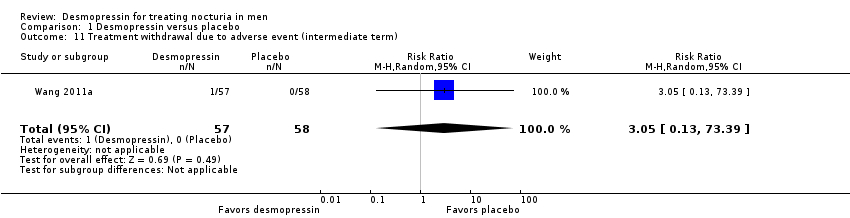
| 11 Treatment withdrawal due to adverse event (intermediate term) Show forest plot | 1 | 115 | Risk Ratio (M‐H, Random, 95% CI) | 3.05 [0.13, 73.39] |
|
| 12 Number of nocturnal voids (short term) (subgroup dose) Show forest plot | 6 | 1982 | Mean Difference (IV, Random, 95% CI) | ‐0.65 [‐0.98, ‐0.33] |
|
| 12.1 Very low dose (≤ 1.5 μg) | 1 | 870 | Mean Difference (IV, Random, 95% CI) | ‐0.20 [‐0.34, ‐0.06] |
| 12.2 Low dose (< 100 μg) | 3 | 711 | Mean Difference (IV, Random, 95% CI) | ‐0.33 [‐0.72, 0.06] |
| 12.3 High dose (≥ 100 μg) | 4 | 401 | Mean Difference (IV, Random, 95% CI) | ‐1.03 [‐1.41, ‐0.66] |
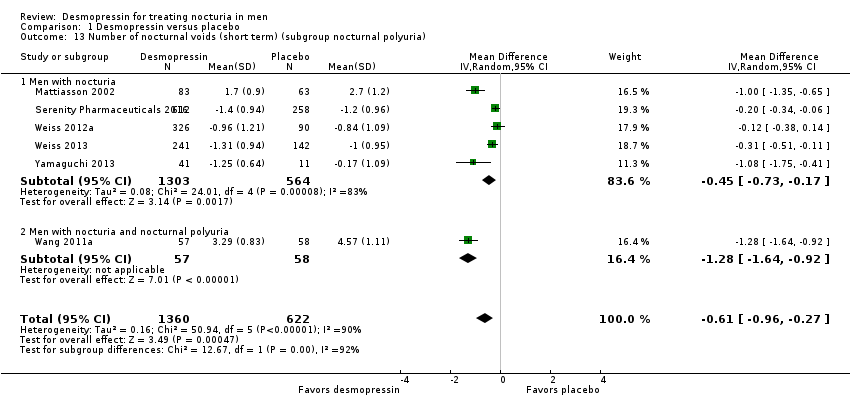
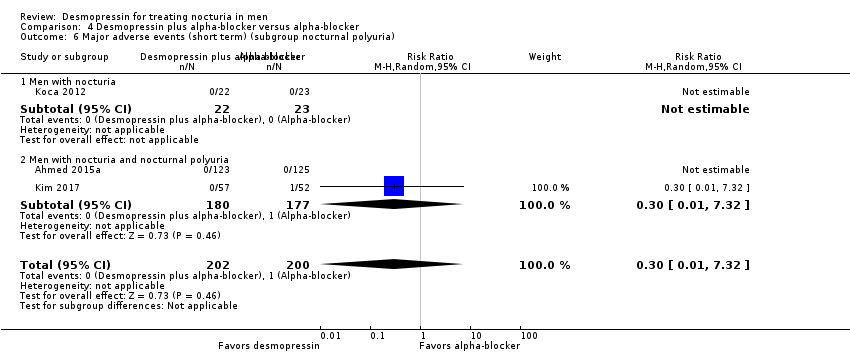
| 13 Number of nocturnal voids (short term) (subgroup nocturnal polyuria) Show forest plot | 6 | 1982 | Mean Difference (IV, Random, 95% CI) | ‐0.61 [‐0.96, ‐0.27] |
|
| 13.1 Men with nocturia | 5 | 1867 | Mean Difference (IV, Random, 95% CI) | ‐0.45 [‐0.73, ‐0.17] |
| 13.2 Men with nocturia and nocturnal polyuria | 1 | 115 | Mean Difference (IV, Random, 95% CI) | ‐1.28 [‐1.64, ‐0.92] |
| 14 Number of nocturnal voids (short term) (sensitivity run‐in period) Show forest plot | 4 | 966 | Mean Difference (IV, Random, 95% CI) | ‐0.66 [‐1.17, ‐0.14] |
|
| 15 Major adverse events (short term) (sensitivity run‐in period) Show forest plot | 1 | 385 | Risk Ratio (M‐H, Random, 95% CI) | 2.53 [0.73, 8.73] |
|
| 16 Number of nocturnal voids (short term) (sensitivity clinical dosage) Show forest plot | 6 | 1586 | Mean Difference (IV, Random, 95% CI) | ‐0.76 [‐1.15, ‐0.38] |
|
| 17 Major adverse events (short term) (sensitivity clinical dosage) Show forest plot | 2 | 417 | Risk Ratio (M‐H, Random, 95% CI) | 0.98 [0.10, 9.71] |
|
| 17.1 Sublingual/low dose | 1 | 266 | Risk Ratio (M‐H, Random, 95% CI) | 2.67 [0.71, 10.11] |
| 17.2 Oral/high dose | 1 | 151 | Risk Ratio (M‐H, Random, 95% CI) | 0.25 [0.03, 2.37] |


![Comparison 1 Desmopressin versus placebo, Outcome 7 Time to first void (short term) [minutes].](/es/cdsr/doi/10.1002/14651858.CD012059.pub2/media/CDSR/CD012059/image_n/nCD012059-CMP-001-07.png)