Providing physicians with feedback on medication adherence for people with chronic diseases taking long‐term medication
Appendices
Appendix 1. Search strategies
Medline (OVID)
Epub Ahead of Print, In‐Process & Other Non‐Indexed Citations, Ovid MEDLINE(R) Daily and Ovid MEDLINE(R) 1946 to Present
| No. | Search terms | Results |
| 1 | exp patient compliance/ | 69706 |
| 2 | ((medication? or pharmaceutical? or drug? or medicament? or medicine?) adj2 (adhere* or complian* or nonadhere* or noncomplian*)).ti,ab. | 15546 |
| 3 | or/1‐2 | 76648 |
| 4 | exp feedback/ | 52053 |
| 5 | (feedback or feed back or fed back).ti,ab. | 120122 |
| 6 | or/4‐5 | 143509 |
| 7 | (refill* adj2 (adhere* or complian* or nonadhere* or noncomplian* or feedback or data or persistence)).ti,ab. | 398 |
| 8 | ((prescriber* or provider* or physician* or clinician* or doctor*) adj5 (know* or furnish* or deliver* or fax* or email* or facsimile or share* or provid* or feed back or feedback or fed back or phone or telephone or alert* or notify* or notifi* or supply* or suppli* or inform* or report* or disclos* or result* or recei* or summar* or availab* or data) adj5 (complian* or adhere* or noncomplian* or nonadhere* or persistence)).ti,ab. | 2307 |
| 9 | 3 and 6 | 950 |
| 10 | or/7‐9 | 3588 |
| 11 | randomized controlled trial.pt. | 469812 |
| 12 | controlled clinical trial.pt. | 95075 |
| 13 | multicenter study.pt. | 236210 |
| 14 | pragmatic clinical trial.pt. | 496 |
| 15 | (randomis* or randomiz* or randomly).ti,ab. | 759953 |
| 16 | groups.ab. | 1763247 |
| 17 | (trial or multicenter or multi center or multicentre or multi centre).ti. | 210243 |
| 18 | (intervention? or effect? or impact? or controlled or control group? or (before adj5 after) or (pre adj5 post) or ((pretest or pre test) and (posttest or post test)) or quasiexperiment* or quasi experiment* or pseudo experiment* or pseudoexperiment* or evaluat* or time series or time point? or repeated measur*).ti,ab. | 8379824 |
| 19 | non‐randomized controlled trials as topic/ | 104 |
| 20 | interrupted time series analysis/ | 261 |
| 21 | controlled before‐after studies/ | 208 |
| 22 | or/11‐21 | 9363290 |
| 23 | exp animals/ | 22100570 |
| 24 | humans/ | 17431084 |
| 25 | 23 not (23 and 24) | 4669486 |
| 26 | review.pt. | 2358156 |
| 27 | meta analysis.pt. | 81219 |
| 28 | news.pt. | 195263 |
| 29 | comment.pt. | 722035 |
| 30 | editorial.pt. | 445704 |
| 31 | cochrane database of systematic reviews.jn. | 16739 |
| 32 | comment on.cm. | 722036 |
| 33 | (systematic review or literature review).ti. | 92921 |
| 34 | or/25‐33 | 8067793 |
| 35 | 22 not 34 | 6498732 |
| 36 | 10 and 35 | 2292 |
Embase (OVID)
Embase 1974 to 2016 December 05
| No. | Search terms | Results |
| 1 | *patient compliance/ | 21616 |
| 2 | *medication compliance/ | 5111 |
| 3 | ((medication? or pharmaceutical? or drug? or medicament? or medicine?) adj2 (adhere* or complian* or nonadhere* or noncomplian*)).ti,ab. | 21710 |
| 4 | or/1‐3 | 40912 |
| 5 | *feedback system/ | 18750 |
| 6 | (feedback or feed back or fed back).ti,ab. | 130669 |
| 7 | or/5‐6 | 135895 |
| 8 | 4 and 7 | 585 |
| 9 | (refill* adj2 (adhere* or complian* or nonadhere* or noncomplian* or feedback or data or persistence)).ti,ab. | 594 |
| 10 | ((prescriber* or provider* or physician* or clinician* or doctor*) adj5 (know* or furnish* or deliver* or fax* or email* or facsimile or share* or provid* or feed back or feedback or fed back or phone or telephone or alert* or notify* or notifi* or supply* or suppli* or inform* or report* or disclos* or result* or recei* or summar* or availab* or data) adj5 (complian* or adhere* or noncomplian* or nonadhere* or persistence)).ti,ab. | 3141 |
| 11 | or/8‐10 | 4234 |
| 12 | randomized controlled trial/ | 466151 |
| 13 | controlled clinical trial/ | 456651 |
| 14 | quasi experimental study/ | 4234 |
| 15 | pretest posttest control group design/ | 342 |
| 16 | time series analysis/ | 23780 |
| 17 | experimental design/ | 24788 |
| 18 | multicenter study/ | 158722 |
| 19 | (randomis* or randomiz* or randomly).ti,ab. | 945950 |
| 20 | groups.ab. | 2190863 |
| 21 | (trial or multicentre or multicenter or multi centre or multi center).ti. | 261940 |
| 22 | (intervention? or effect? or impact? or controlled or control group? or (before adj5 after) or (pre adj5 post) or ((pretest or pre test) and (posttest or post test)) or quasiexperiment* or quasi experiment* or pseudo experiment* or pseudoexperiment* or evaluat* or time series or time point? or repeated measur*).ti,ab. | 9769307 |
| 23 | or/12‐22 | 10912010 |
| 24 | (systematic review or literature review).ti. | 104048 |
| 25 | "cochrane database of systematic reviews".jn. | 5102 |
| 26 | exp animals/ or exp invertebrate/ or animal experiment/ or animal model/ or animal tissue/ or animal cell/ or nonhuman/ | 24171479 |
| 27 | human/ or normal human/ or human cell/ | 18326884 |
| 28 | 26 not (26 and 27) | 5891413 |
| 29 | 24 or 25 or 28 | 5999800 |
| 30 | 23 not 29 | 8360987 |
| 31 | 11 and 30 | 3006 |
The Cochrane Library
| No. | Search terms | Results |
| #1 | [mh "patient compliance"] | 10372 |
| #2 | ((medication* or pharmaceutical* or drug* or medicament* or medicine*) near/2 (adhere* or complian* or nonadhere* or noncomplian*)):ti,ab | 3016 |
| #3 | {or #1‐#2} | 12149 |
| #4 | [mh feedback] | 2744 |
| #5 | (feedback or feed back or fed back):ti,ab | 6998 |
| #6 | {or #4‐#5} | 8155 |
| #7 | (refill* near/2 (adhere* or complian* or nonadhere* or noncomplian* or feedback or data or persistence)):ti,ab | 65 |
| #8 | ((prescriber* or provider* or physician* or clinician* or doctor*) near/5 (know* or furnish* or deliver* or fax* or email* or facsimile or share* or provid* or feed back or feedback or fed back or phone or telephone or alert* or notify* or notifi* or supply* or suppli* or inform* or report* or disclos* or result* or recei* or summar* or availab* or data) near/5 (complian* or adhere* or noncomplian* or nonadhere* or persistence)):ti,ab | 241 |
| #9 | #3 and #6 | 275 |
| #10 | {or #7‐#9} | 564 |
Appendix 2. Assessing the relative importance of outcomes and deciding which ones to include in the Summary of Findings table
| Outcome | Initials of people assessing the relative importance of the outcomes | Consensus | |||
| VZ | VKS | PD | BS | ||
| Relative importance (1‐9) | |||||
| Medication adherence | 9 | 9 | 9 | 9 | 9 |
| Patient outcomes | 8 | 8 | 7 | 8 | 8 |
| Health resource use | 5 | 7 | 7 | 7 | 6 |
| Processes of care | 8 | 8 | 7 | 7 | 7 |
| Adverse events | 4 | 6 | 5 | 5 | 5 |
| Relative importance for each outcome on a 9‐point scale ranging from 1 (not important) to 9 (critical). 1‐3: not important and not included in the SoF table 4‐6: important but not critical for making a decision (inclusion in the 'Summary of findings' table may depend on 7‐9: critical for making a decision and should definitely be included in the 'Summary of findings' table | |||||
Appendix 3. Certainty assessment of evidence for each outcome
| No of studies | Design (initial quality rating) | Risk of bias | Inconsistency | Indirectnessa | Imprecision | Otherb | Certainty (overall score)c |
| Outcome: medication adherence | |||||||
| 7 | 6 RT + 1 ITS (High) | High risk of contamination bias (downgraded 1 level) | No serious inconsistency | Applicability: most studies used pharmacy refill data to measure adherence, while other methods could be used in other settings (downgraded 1 level) | Not applicable | None | Low |
| Outcome: patient outcomes | |||||||
| 2 | RT (High) | High risk of contamination bias (downgraded 1 level) | No serious inconsistency | Applicability: most studies used pharmacy refill data to measure adherence, while other methods could be used in other settings (downgraded 1 level) | Not applicable | None | Low |
| Outcome: health resource use | |||||||
| 2 | RT (High) | High risk of contamination bias (downgraded 1 level) | No serious inconsistency | Applicability: most studies used pharmacy refill data to measure adherence, while other methods could be used in other settings (downgraded 1 level) | Not applicable | None | Low |
| Outcome: processes of care | |||||||
| 4 | RT (High) | High risk of contamination bias, but results would suggest an effect of the intervention (no downgrading) | Unexplained heterogeneity or inconsistency of results (downgraded 1 level) | Applicability: most studies used pharmacy refill data to measure adherence, while other methods could be used in other settings (downgraded 1 level) | Not applicable | None | Low |
| Outcome: adverse events | |||||||
| Not applicable | |||||||
aIndirectness includes consideration of indirectness between study comparisons, indirect surrogate outcomes, and applicability (study populations, interventions or comparisons that are different than those of interest).
bOther considerations for downgrading include publication bias. Other considerations for upgrading include a strong association with no plausible confounders, a dose‐response relationship, and if all plausible confounders or biases would decrease the size of the effect (if there is evidence of an effect), or increase it if there is evidence of no harmful effect (safety).
cGRADE Working Group grades of evidence
High quality: this research provides a very good indication of the likely effect. The likelihood that the effect will be substantially different* is low.
Moderate quality: this research provides a good indication of the likely effect. The likelihood that the effect will be substantially different* is moderate.
Low quality: this research provides some indication of the likely effect. However, the likelihood that it will be substantially different* is high.
Very low quality: this research does not provide a reliable indication of the likely effect. The likelihood that the effect will be substantially different* is very high.
*Substantially different = a large enough difference that it might affect a decision.
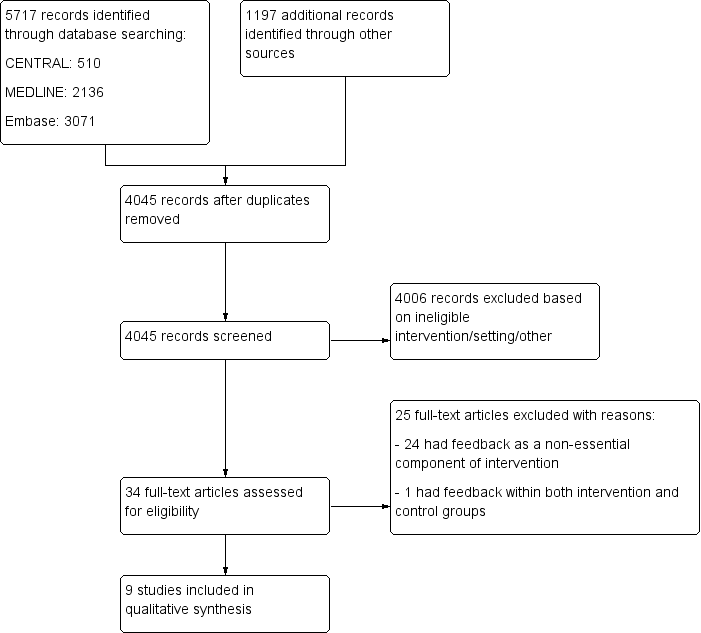
Flow diagram for study selection.

Risk of bias graph: review authors' judgements about each risk of bias item presented as percentages across all included studies.

Risk of bias summary: review authors' judgements about each risk of bias item for each included study.
| Feedback on medication adherence to physicians versus usual care | |||
| Patient or population: any physician, and any patient treated for chronic diseases with long‐term medication use Settings: hospitals or community, USA and Canada Intervention: feedback on medication adherence to physicians Comparison: usual care | |||
| Outcomes | Effect of providing feedback on medication adherence to physicians | No of patients | Certainty of the evidence |
| Medication adherence Percentage of 'days covered' by medication (medication possession ratio), percentage of 'time covered', percentage of non‐adherent patients, 'time‐to‐refill' (i.e. the number of days between the date where the patient was declared 7 days overdue, and the date of the next refill) | Intervention may lead to little or no difference to medication adherence | 22,924 (7 studies) | ⊕⊕⊝⊝ |
| Patient outcomes Lipid levels, HbA1C level, HIV viral load, number of major atherosclerosis disease events | Intervention may lead to little or no difference to patient outcomes | 1292 | ⊕⊕⊝⊝ |
| Health resource use Rate of hospitalisations, rate of emergency department encounters, rate of outpatient encounters, rate of oral steroid use | Intervention may lead to little or no difference to health resource use | 4181 | ⊕⊕⊝⊝ |
| Processes of care Rate of medication change (medication discontinued, added, replaced), proportion of visits with appropriate management of uncontrolled hypertension, patient rating (quality of care, duration of the visit, communication with physician), patient‐physician dialogue (utterance related to treatment, medication adherence, side effects) | Intervention may improve processes of care. | 2780 | ⊕⊕⊝⊝ |
| Adverse events | None of the 9 studies reported an adverse event due to the intervention. | — | — |
| GRADE Working Group grades of evidence *Substantially different = a large enough difference that it might affect a decision. | |||
| aEvidence downgraded one level due to limitations in the design and implementation: high risk of contamination bias. | |||
| Study/country | Study type | Medication | Feedback type/delivery approach | Data source | Intervention description | Intervention received by control group of physicians group | N patients (N physicians)a |
| USA | ITS analysis | Antidepressants | Alert/faxed | Pharmacy refill data | Physicians were alerted via fax in real‐time when their patient had a gap of more than 10 days in refilling antidepressant prescription. | No intervention | 13,128 (NR) |
| USA | Cluster‐RT | Any medication | Systematic/printed report | Pharmacy refill data | A printed medication refill history report was provided to physicians before the patient's encounter. | No intervention | 231 (32) |
| USA | Cluster‐RT | Antihypertensive drugs | Systematic/printed report | Electronic device | A printed adherence report was provided to physicians before the patient's encounter. The report also provided clinical decision support by listing suggested clinical actions according to adherence status. | No intervention | 100 (49) |
| USA | RT | Medication used to treat diabetes, hypertension, hyperlipidaemia, heart failure, depression, or psychosis. | Alert/faxed | Pharmacy refill data | Physicians were alerted via fax once per week about patients with a gap of more than 7 days in refilling medication. Fax included patient adherence data and prompts to assist the patient. | No intervention | 2030 (175) |
| USA | RT | Oral diabetes medication and a lipid‐lowering medication | Systematic/electronic prescription software | Pharmacy refill data | Physicians were provided, via electronic prescription software, with medication adherence of their patients, along with HbA1C (glycated haemoglobin) and LDL‐C (low‐density lipoprotein cholesterol) measurements. Physicians could also view trends in a patient's medication adherence over time by drug class. Physicians were given instruction on how to interpret and discuss this information with patients. | No intervention | 1136 (NR) |
| Canada | RT | Lipid‐lowering or antihypertensive drugs | Systematic/Electronic prescription software | Pharmacy refill data | Physicians were provided, via electronic prescription software, with the list of prescribed and dispensed drugs; medication adherence for each drug; drug costs; out‐of‐pocket expenses; and received an alert for non‐adherent patients. | List of prescribed and dispensed drugs in the electronic prescription software. | 2293 (NR) |
| USA | Cluster‐RT | Anti‐asthma drugs | Systematic/electronic prescription software | Pharmacy refill data | Physicians were provided, via electronic prescription software, with adherence data for inhaled corticosteroid (ICS) use; the frequency of short‐acting beta‐agonist use; and the strength of each patient's current ICS prescription. In addition, the physician received asthma guidelines and methods for discussing non‐adherence with patients. | The physician received asthma guidelines and methods for discussing non‐adherence with patients. | 2698 (193) |
| USA | RT | Medication used to treat asthma, diabetes, hypertension, congestive heart failure, ischemic heart disease or stroke | Systematic/Printed report | Pharmacy refill data | A printed report was provided to physicians before the patient's encounter. The report contained a list of dispensed drugs with a calculation and a graphical depiction of adherence, and recommendations addressing possible deficiencies relative to pharmacotherapy guidelines. | No intervention | 1483 (NR) |
| USA | Cross‐over‐RT | Antiretroviral drugs | Systematic/Printed report | Electronic device + self report | A printed report was provided to physicians before the patient's encounter. The report included electronic adherence data and patient survey data (self‐reported adherence, reminder use, beliefs about antiretroviral drugs, reasons for missed doses, alcohol and drug use, and depression). | No intervention | 156 (41) |
| ITS: Interrupted time series; MPR: medication possession ratio; NR: not reported; RT: randomised (controlled) trial. | |||||||
| Study | Definitions of the outcome 'medication adherence' | Result |
| Rate of patients more than 30 days overdue for prescription refilla | Immediate decrease of 2% (P = 0.15) then increase of 0.3% (P = 0.22) each month during the intervention. Over the entire study period, constant average of 75% (95% CI 72.7% to 77.3%) | |
| Proportion of days without treatment ('days uncovered')a | Immediate decrease of 2% (P = 0.15) then increase of 0.4% (P = 0.04) each month during the intervention. Over the entire study period, constant average of 40% (95% CI 38.4% to 41.6%) | |
| Median number of days from alert date to the next date of refill for any medication indicated for the patient's index disease (time‐to‐refill)a | Intervention group: 116 days; control group: 106 days HR 0.87 (98.3% CI 0.76 to 1.00; P > 0.05) | |
| Within 30 days of index date, filled prescription for any medication indicated for the patient's index disease | Intervention group: N = 213 (21.0%); control group: N = 243 (24.0%) OR 0.83 (97.5% CI 0.65 to 1.06; P > 0.05) | |
| Within 60 days of index date, filled prescription for any medication indicated for the patient's index disease | Intervention group: N = 342 (33.7%); control group: N = 373 (36.8%) OR 0.83 (98.3% CI 0.65 to 1.07; P > 0.05) | |
| Within 30 days of index date, filled prescription for any medication | Intervention group: N = 484 (47.6%); control group: N = 490 (48.3%) OR 0.99 (95% CI 0.81 to 1.19; P > 0.05) | |
| Adherence to oral diabetes medications at 6 months (MPR) | Intervention group: 0.74 ± 0.36; control group: 0.75 ± 0.35 Postintervention MD −0.01 (95% CI −0.72 to 0.70; P = 0.67) | |
| Adherence to oral diabetes medications at 12 months (MPR) | Intervention group: 0.74 ± 0.36; control group: 0.75 ± 0.35. Postintervention MD −0.01 (95% CI −0.72 to 0.70; P = 0.57) | |
| Adherence to oral diabetes medications at 18 months (MPR) | Intervention group: 0.73 ± 0.37; control group: 0.75 ± 0.36 Postintervention MD −0.02 (95% CI −0.75 to 0.71; P = 0.47) | |
| Adherence to lipid lowing medications at 6 months (MPR) | Intervention group: 0.69 ± 0.36; control group: 0.70 ± 0.37 Postintervention MD −0.01 (95% CI −0.74 to 0.72; P = 0.88) | |
| Adherence to lipid lowing medications at 12 months (MPR) | Intervention group: 0.69 ± 0.37; control group: 0.70 ± 0.36 Postintervention MD −0.01 (95% CI −0.74 to 0.72; P = 0.78) | |
| Adherence to lipid lowing medications at 18 months (MPR) | Intervention group: 0.70 ± 0.37; control group: 0.70 ± 0.37 Postintervention MD 0.00 (95% CI −0.74 to 0.74; P = 0.95) | |
| Change in medication adherence (MPR) | Difference between postintervention and preintervention periods, intervention group: −6.2% (95% CI 79.7% to 73.5%); control group: −6.4% (95% CI −79.2% to 72.9%). Adjusted postintervention MD 0.11% (95% CI −1.8 to 2.1; P = 0.90) | |
| Inhaled corticosteroid adherence at the end of the study (MPR)a | Intervention group: 23.3% ± 2.2; control group: 21.3 % ± 2.5 (P = 0.55) Difference between study end and preintervention period, intervention group: −4.4% ± 1.2; control group: −4.4% ± 0.7. Postintervention MD 0.0% (95% CI −1.9 to 1.9; P = 0.99) | |
| Overall medication adherence (MPR)a | Data not provided | |
| Medication adherence by drug class (MPR) | 'All medication classes': intervention group: 41.2%; control group: 41.3% Postintervention MD −0.01% (P = 0.82) | |
| Medication adherence by disease condition (MPR) | 'All diseases': intervention group: 40.6%; control group: 39.3% Postintervention MD 1.3% (P = 0.77) | |
| Antiretroviral adherence, electronic data (percentage of 'time covered') between the first physician visit and the crossover physician visita | Postintervention MD 2.0% (95% CI −5.1 to 9.1; P = 0.57) | |
| Medication adherence, self‐report data | No significant difference, i.e. P > 0.05 (data not shown in study) | |
| CI: confidence interval; HR: hazard ratio; MD: mean difference; MPR: medication possession ratio; OR: odds ratio. | ||
| Study | Definitions of the patient outcome | Result |
| HbA1C at 18 months (%)a | Intervention group: 7.91 ± 1.53; control group: 7.88 ± 1.53 Postintervention MD 0.03% (95% CI −3.03 to 3.09; P = 0.76) | |
| LDL‐C at 18 months (%)a | Intervention group: 87.27 ± 35.67; control group: 89.02 ± 32.11 Postintervention MD −1.75% (95% CI −69.53 to 66.03; P = 0.38) | |
| HbA1C at 6 months (%) | Intervention group: 7.90 ± 1.44; control group: 7.81 ± 1.42 Postintervention MD 0.09% (95% CI −2.77 to 2.95; P = 0.29) | |
| HbA1C at 12 months (%) | Intervention group: 7.96 ± 1.54; control group: 7.94 ± 1.60 Postintervention MD 0.02% (95% CI −3.12 to 3.16; P = 0.83) | |
| LDL‐C at 6 months (%) | Intervention group: 92.07 ± 36.68; control group: 92.92 ± 32.33 Postintervention MD ‐0.85% (95% CI −69.86 to 68.16; P = 0.67) | |
| LDL‐C at 12 months (%) | Intervention group: 90.70 ± 36.90; control group: 90.63 ± 32.41 Postintervention MD 0.07% (95% CI −69.24 to 69.38; P = 0.97) | |
| Number of major atherosclerosis disease event by 18 months | Intervention group: 43 (7.6%); control group: 29 (5.1%) Postintervention MD 1.49% (P = 0.091) | |
| Number of major atherosclerosis disease event by 24 months | Intervention group: 80 (14.1%); control group: 63 (11.1%) Postintervention MD 1.27% (P = 0.13) | |
| Number of major atherosclerosis disease event by 36 months | Intervention group: 112 (19.7%); control group: 101 (17.8%) Postintervention MD 1.11% (P = 0.42) | |
| Plasma HIV RNA viral loads | No significant difference between the intervention and control groups, i.e. P > 0.05 (data not shown) | |
| CI: confidence interval; HbA1C: glycated haemoglobin; LDL‐C: low density lipoprotein cholesterol; MD: mean difference; RNA: ribonucleic acid. | ||
| Study | Definitions of the outcome 'health resource use' | Result |
| Rate of asthma‐related emergency room visits | RR 1.13 (95% CI 0.71 to 1.80; P = 0.61) | |
| Rate of asthma‐related hospitalisations | RR 0.93 (95% CI 0.34 to 2.56; P = 0.89) | |
| Rate of oral steroid use | RR 1.07 (95% CI 0.89 to 1.29; P = 0.45) | |
| Rate of outpatient encounters (per 100 participants during 6 months) | Intervention group: 46.6%; control group: 46.0% RR 1.01 (P = 0.42) | |
| Rate of emergency department encounters (per 100 participants during 6 months) | Intervention group: 0.84%; control group: 0.87% RR 0.97 (P = 0.77) | |
| Rate of hospitalisations (per 100 participants during 6 months) | Intervention group: 0.21%; control group: 0.19% RR 1.11 (P = 0.96) | |
| CI: confidence interval; RR: relative rate. | ||
| Study | Definitions of the outcome 'processes of care' | Result |
| Rate of patients with medication change | Intervention group: 70.5%; control group: 22.2% RR 3.18 (P = 0.001) | |
| Rate of patients with dosage change | Intervention group: 21.0%; control group: 7.1% RR 2.96 (P = 0.002) | |
| Rate of patients with change in medication usage directions | Intervention group: 1.9%; control group: 0% RR not calculable (P = 0.16) | |
| Rate of patient with medication added | Intervention group: 41.9%; control group: 13.5% RR 3.10 (P = 0.001) | |
| Rate of patients with medication discontinued | Intervention group: 15.2%; control group: 4% RR 3.8 (P = 0.008) | |
| Rate of patients with a non‐formulary medication replaced with a formulary agent | Intervention group: 18.1%; control group: 0% RR not calculable (P = 0.001) | |
| Proportion of visits with appropriate management of uncontrolled hypertensiona | Intervention group: 69%; control group: 34% RR 2.03 (P = 0.001) | |
| Patient rating: quality of care during the visit | Intervention group: 71%; control group: 53% RR 1.34 (P = 0.05) | |
| Patient rating: satisfaction with the amount of time spent during the visit | Intervention group: 92%; control group: 80% RR 1.15 (P = 0.11) | |
| Patient rating: perceptions of patient‐centred communication | Intervention group: 59%; control group: 37% RR 1.59 (P = 0.001) | |
| Patient rating: perceptions of collaborative communication | Intervention group: 49%; control group: 29% RR 1.69 (P = 0.02) | |
| Rate of access to the list of prescribed and dispensed drugs ('drug profile review')a | Intervention group: 44.5%; control group: 35.5% OR 1.46 (95% CI 1.21 to 1.76; P < 0.001) | |
| Change in therapy: rate of increase in therapya | Intervention group: 28.5%; control group: 29.1% OR: 0.98 (95% CI 0.80 to 1.21; P = 0.86) | |
| Change in therapy: rate of discontinuation due to adverse effectsa | Intervention group: 2.3%; control group: 2.0% OR: 1.18 (95% CI 0.63 to 2.19; P = 0.61) | |
| Median number of ART‐related utterances in patient‐physician dialogue | Intervention group: 76 (IQR 52 to 127); control group: 49.5 (IQR 28 to 113) (P = 0.07) | |
| Median number of utterances about adherence to the ART regimen | Intervention group: 51.5 (IQR 37 to 77); control group: 32.5 (IQR 17 to 52) (P < 0.001) | |
| Median number of utterances about ART side effects | Intervention group: 0 (IQR 0 to 11); control group: 0 (IQR 0 to 8) (P = 0.96) | |
| Median number of utterances about ART prescription | Intervention group: 0 (IQR 0 to 15); control group: 0 (IQR 0 to 17) (P = 1.00) | |
| Median number of utterances classified as 'ART problem solving' | Intervention group: 0 (IQR 0 to 12); control group: 0 (IQR 0 to 2) (P = 0.05) | |
| ART: antiretroviral therapy; CI: confidence interval;IQR: interquartile range; OR: odds ratio; RR: relative rate. | ||