การให้โปรเจสเตอโรนเพื่อป้องกันการคลอดก่อนกำหนดที่เกิดขึ้นเองสำหรับสตรีตั้งครรภ์แฝด
Información
- DOI:
- https://doi.org/10.1002/14651858.CD012024.pub2Copiar DOI

- Base de datos:
-
- Cochrane Database of Systematic Reviews
- Versión publicada:
-
- 31 octubre 2017see what's new
- Tipo:
-
- Intervention
- Etapa:
-
- Review
- Grupo Editorial Cochrane:
-
Grupo Cochrane de Embarazo y parto
- Copyright:
-
- Copyright © 2017 The Cochrane Collaboration. Published by John Wiley & Sons, Ltd.
Cifras del artículo
Altmetric:
Citado por:
Autores
Contributions of authors
Jodie M Dodd drafted the original text of the protocol.
Therese Dowswell contributed to the text and commented on drafts.
Rosalie M Grivell, Cecelia M OBrien and Andrea R Deussen commented on drafts of the protocol.
Sources of support
Internal sources
-
(TD) Cochrane Pregnancy and Childbirth Group, Department of Women's and Children's Health, The University of Liverpool, Liverpool, UK.
External sources
-
National Institute for Health Research (NIHR), UK.
NIHR Cochrane Programme Grant Project: 13/89/05 – Pregnancy and childbirth systematic reviews to support clinical guidelines
Declarations of interest
Jodie M Dodd is an investigator on the PROGRESS randomised trial, which may contribute data to this review.
Rosalie M Grivell: No conflicts of interest.
Cecelia M OBrien: No conflicts of interest.
Andrea R Deussen: No conflicts of interest.
Therese Dowswell is paid from a grant from her institution to work on this and other Cochrane Reviews. In the last 36 months she has been paid by WHO for work on other reviews.
Acknowledgements
As part of the prepublication editorial process, this protocol has been commented on by two peers (an editor and referee who is external to the editorial team), a member of the Pregnancy and Childbirth Group's international panel of consumers and the Group's Statistical Adviser.
This project was supported by the National Institute for Health Research, through Cochrane Infrastructure and Cochrane Programme Grant funding to Cochrane Pregnancy and Childbirth. The views and opinions expressed therein are those of the authors and do not necessarily reflect those of the Systematic Reviews Programme, NIHR, NHS or the Department of Health.
Therese Dowswell's work is supported by an NIHR Cochrane Programme Grant Project: 13/89/05 – Pregnancy and childbirth systematic reviews to support clinical guidelines.
Version history
| Published | Title | Stage | Authors | Version |
| 2019 Nov 20 | Prenatal administration of progestogens for preventing spontaneous preterm birth in women with a multiple pregnancy | Review | Jodie M Dodd, Rosalie M Grivell, Cecelia M OBrien, Therese Dowswell, Andrea R Deussen | |
| 2017 Oct 31 | Prenatal administration of progestogens for preventing spontaneous preterm birth in women with a multiple pregnancy | Review | Jodie M Dodd, Rosalie M Grivell, Cecelia M OBrien, Therese Dowswell, Andrea R Deussen | |
| 2016 Jan 02 | Prenatal administration of progestogens for preventing preterm birth in women with a multiple pregnancy | Protocol | Jodie M Dodd, Rosalie M Grivell, Cecelia M OBrien, Therese Dowswell, Andrea R Deussen | |
Differences between protocol and review
In the protocol we stated that we would carry out subgroup analysis by route of administration. After consideration, we decided that drugs administered by different routes have different uptake and the effects of different types of progestogens (administered by different routes) are likely to be different. Therefore, in this review we have not carried out pooled analysis, but rather we have set out results for progestogens administered by different routes in separate comparisons.
In the original protocol we had not planned subgroup analysis by short cervix. We have added this so that this review is compatible with a related review examining progestogens in singleton pregnancy, and to reflect increasing interest in interventions in women with multiple risk factors.
In the review, the following outcomes are now listed as maternal, rather than as infant outcomes:
-
Preterm birth (less than 34 weeks' gestation)
-
Birth before 37 completed weeks
-
Birth before 28 completed weeks
-
Mean gestational age at birth
In the review, we have removed the following outcomes from the GRADE methods:
-
Adverse drug reaction
-
Prelabour rupture of membranes (PROM)
We have added the following outcome to the GRADE methods:
-
Infant birthweight less than 2500 g
This was changed because for multiple pregnancy infant birthweight less than 2500 g is a more clinically relevant and meaningful outcome than either drug reaction or PROM.
We changed the following outcomes:
-
Birth before 37 completed weeks
-
Birth before 28 completed weeks
to:
-
Preterm birth less than 37 weeks
-
Preterm birth less than 28 weeks
Keywords
MeSH
Medical Subject Headings (MeSH) Keywords
- Administration, Intravaginal;
- Infant, Low Birth Weight;
- Infant, Premature;
- Injections, Intramuscular;
- Perinatal Mortality;
- *Pregnancy, Multiple;
- Premature Birth [*prevention & control];
- *Prenatal Care;
- Progesterone [*administration & dosage];
- Progestins [*administration & dosage];
- Randomized Controlled Trials as Topic;
Medical Subject Headings Check Words
Female; Humans; Infant, Newborn; Pregnancy;
PICO

Study flow diagram.

Risk of bias summary: review authors' judgements about each risk of bias item for each included study.

Comparison 1 Intramuscular (IM) progesterone versus no treatment or placebo, Outcome 1 Preterm birth less than 34 weeks.
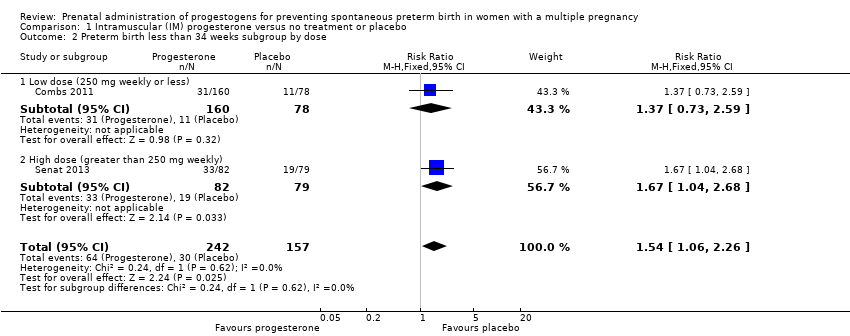
Comparison 1 Intramuscular (IM) progesterone versus no treatment or placebo, Outcome 2 Preterm birth less than 34 weeks subgroup by dose.

Comparison 1 Intramuscular (IM) progesterone versus no treatment or placebo, Outcome 3 Preterm birth less than 34 week subgroup by timing.

Comparison 1 Intramuscular (IM) progesterone versus no treatment or placebo, Outcome 4 Perinatal death.
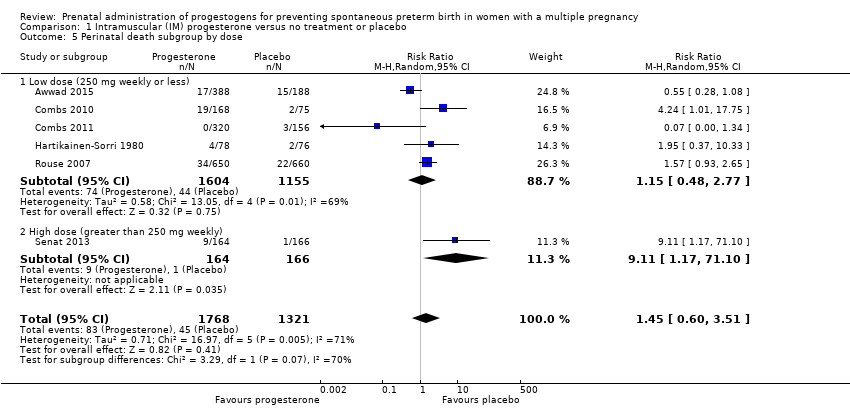
Comparison 1 Intramuscular (IM) progesterone versus no treatment or placebo, Outcome 5 Perinatal death subgroup by dose.

Comparison 1 Intramuscular (IM) progesterone versus no treatment or placebo, Outcome 6 Perinatal death subgroup by timing.

Comparison 1 Intramuscular (IM) progesterone versus no treatment or placebo, Outcome 7 Prelabour rupture of the membranes.
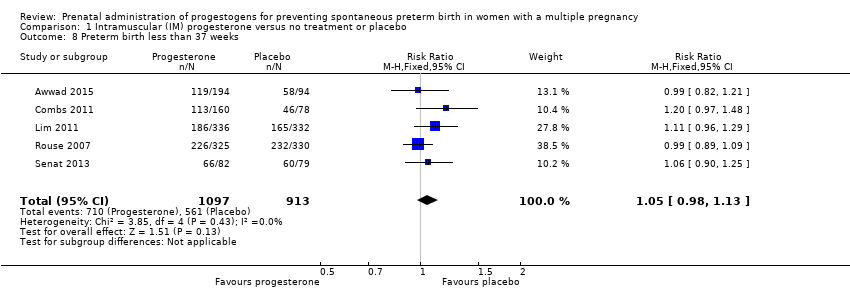
Comparison 1 Intramuscular (IM) progesterone versus no treatment or placebo, Outcome 8 Preterm birth less than 37 weeks.

Comparison 1 Intramuscular (IM) progesterone versus no treatment or placebo, Outcome 9 Preterm birth less than 28 weeks.

Comparison 1 Intramuscular (IM) progesterone versus no treatment or placebo, Outcome 10 Adverse drug reaction.

Comparison 1 Intramuscular (IM) progesterone versus no treatment or placebo, Outcome 11 Caesarean section.

Comparison 1 Intramuscular (IM) progesterone versus no treatment or placebo, Outcome 12 Antenatal tocolysis.

Comparison 1 Intramuscular (IM) progesterone versus no treatment or placebo, Outcome 13 Antenatal corticosteroids.

Comparison 1 Intramuscular (IM) progesterone versus no treatment or placebo, Outcome 14 Infant birthweight less than 2500 g.

Comparison 1 Intramuscular (IM) progesterone versus no treatment or placebo, Outcome 15 Apgar score < 7 at 5 minutes.

Comparison 1 Intramuscular (IM) progesterone versus no treatment or placebo, Outcome 16 Neonatal sepsis.

Comparison 1 Intramuscular (IM) progesterone versus no treatment or placebo, Outcome 17 Respiratory distress syndrome.

Comparison 1 Intramuscular (IM) progesterone versus no treatment or placebo, Outcome 18 Use of mechanical ventilation.

Comparison 1 Intramuscular (IM) progesterone versus no treatment or placebo, Outcome 19 Intraventricular haemorrhage ‐ all grades.

Comparison 1 Intramuscular (IM) progesterone versus no treatment or placebo, Outcome 20 Retinopathy of prematurity.

Comparison 1 Intramuscular (IM) progesterone versus no treatment or placebo, Outcome 21 Chronic lung disease.

Comparison 1 Intramuscular (IM) progesterone versus no treatment or placebo, Outcome 22 Necrotising enterocolitis.

Comparison 1 Intramuscular (IM) progesterone versus no treatment or placebo, Outcome 23 Fetal death.

Comparison 1 Intramuscular (IM) progesterone versus no treatment or placebo, Outcome 24 Neonatal death.
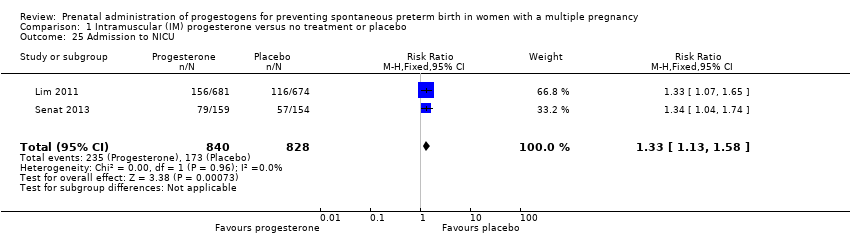
Comparison 1 Intramuscular (IM) progesterone versus no treatment or placebo, Outcome 25 Admission to NICU.
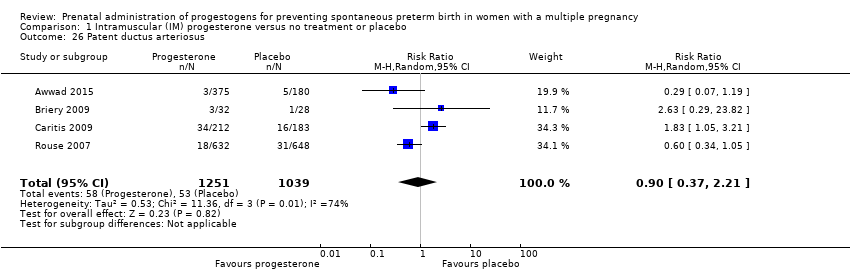
Comparison 1 Intramuscular (IM) progesterone versus no treatment or placebo, Outcome 26 Patent ductus arteriosus.

Comparison 1 Intramuscular (IM) progesterone versus no treatment or placebo, Outcome 27 Sensitivity analysis for perinatal death (assuming total dependence).

Comparison 1 Intramuscular (IM) progesterone versus no treatment or placebo, Outcome 28 Sensitivity analysis for perinatal death (assuming 1% dependence).

Comparison 2 Vaginal progesterone versus no treatment or placebo, Outcome 1 Preterm birth less than 34 weeks.

Comparison 2 Vaginal progesterone versus no treatment or placebo, Outcome 2 Preterm birth less than 34 weeks subgroup by dose.

Comparison 2 Vaginal progesterone versus no treatment or placebo, Outcome 3 Preterm birth less than 34 weeks subgroup by timing.

Comparison 2 Vaginal progesterone versus no treatment or placebo, Outcome 4 Perinatal death.
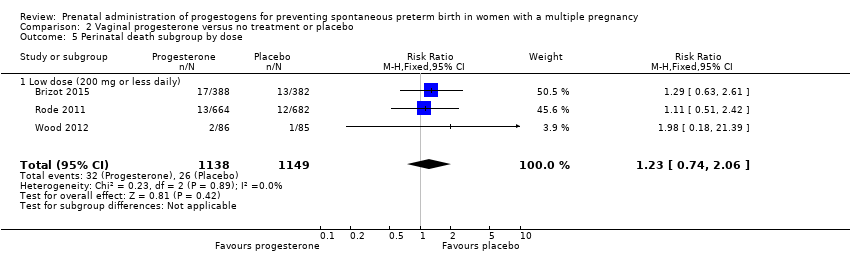
Comparison 2 Vaginal progesterone versus no treatment or placebo, Outcome 5 Perinatal death subgroup by dose.

Comparison 2 Vaginal progesterone versus no treatment or placebo, Outcome 6 Perinatal death subgroup by timing.

Comparison 2 Vaginal progesterone versus no treatment or placebo, Outcome 7 Prelabour rupture of the membranes.
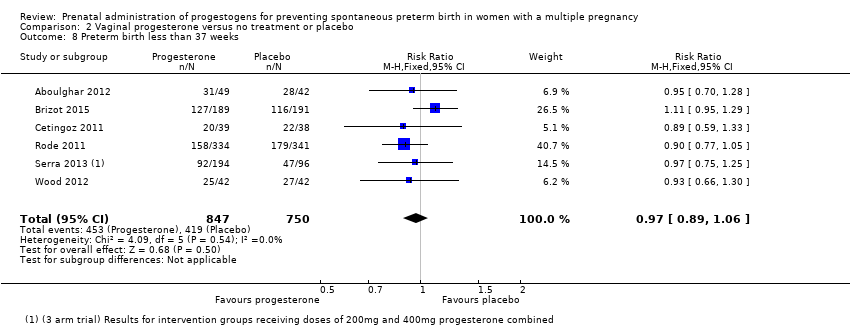
Comparison 2 Vaginal progesterone versus no treatment or placebo, Outcome 8 Preterm birth less than 37 weeks.

Comparison 2 Vaginal progesterone versus no treatment or placebo, Outcome 9 Preterm birth less than 28 weeks.

Comparison 2 Vaginal progesterone versus no treatment or placebo, Outcome 10 Adverse drug reaction.

Comparison 2 Vaginal progesterone versus no treatment or placebo, Outcome 11 Caesarean section.

Comparison 2 Vaginal progesterone versus no treatment or placebo, Outcome 12 Satisfaction with therapy.
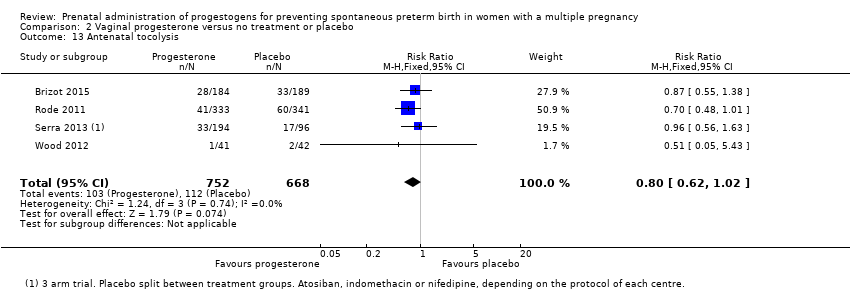
Comparison 2 Vaginal progesterone versus no treatment or placebo, Outcome 13 Antenatal tocolysis.

Comparison 2 Vaginal progesterone versus no treatment or placebo, Outcome 14 Antenatal corticosteroids.
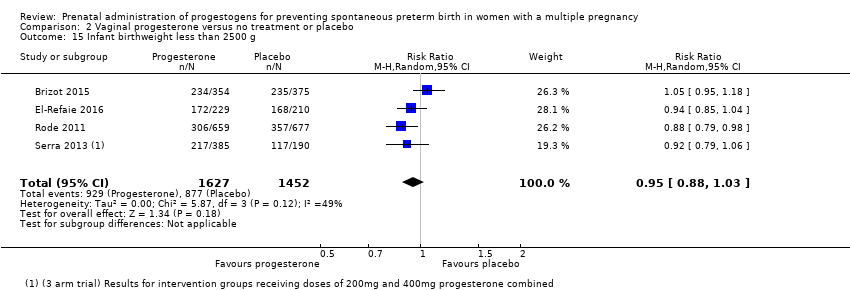
Comparison 2 Vaginal progesterone versus no treatment or placebo, Outcome 15 Infant birthweight less than 2500 g.

Comparison 2 Vaginal progesterone versus no treatment or placebo, Outcome 16 Apgar score < 7 at 5 minutes.

Comparison 2 Vaginal progesterone versus no treatment or placebo, Outcome 17 Respiratory distress syndrome.

Comparison 2 Vaginal progesterone versus no treatment or placebo, Outcome 18 Use of mechanical ventilation.

Comparison 2 Vaginal progesterone versus no treatment or placebo, Outcome 19 Intraventricular haemorrhage ‐ all grades.

Comparison 2 Vaginal progesterone versus no treatment or placebo, Outcome 20 Retinopathy of prematurity.

Comparison 2 Vaginal progesterone versus no treatment or placebo, Outcome 21 Necrotising enterocolitis.

Comparison 2 Vaginal progesterone versus no treatment or placebo, Outcome 22 Neonatal sepsis.

Comparison 2 Vaginal progesterone versus no treatment or placebo, Outcome 23 Fetal death.

Comparison 2 Vaginal progesterone versus no treatment or placebo, Outcome 24 Neonatal death.

Comparison 2 Vaginal progesterone versus no treatment or placebo, Outcome 25 Admission to NICU.

Comparison 2 Vaginal progesterone versus no treatment or placebo, Outcome 26 Patent ductus arteriosus.

Comparison 2 Vaginal progesterone versus no treatment or placebo, Outcome 27 Sensitivity analysis for perinatal death (assuming total non‐independence).

Comparison 2 Vaginal progesterone versus no treatment or placebo, Outcome 28 Sensitivity analysis for perinatal death (assuming 1% non‐independence).

Comparison 3 Intramuscular (IM) progesterone versus no treatment: multiple pregnancy and short cervix, Outcome 1 Preterm birth less than 34 weeks.

Comparison 3 Intramuscular (IM) progesterone versus no treatment: multiple pregnancy and short cervix, Outcome 2 Perinatal death.

Comparison 3 Intramuscular (IM) progesterone versus no treatment: multiple pregnancy and short cervix, Outcome 3 Prelabour rupture of the membranes.

Comparison 3 Intramuscular (IM) progesterone versus no treatment: multiple pregnancy and short cervix, Outcome 4 Preterm birth less than 37 weeks.
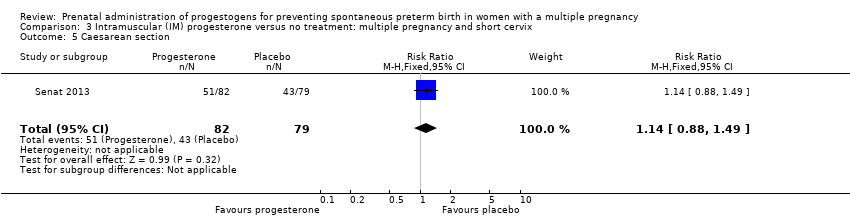
Comparison 3 Intramuscular (IM) progesterone versus no treatment: multiple pregnancy and short cervix, Outcome 5 Caesarean section.

Comparison 3 Intramuscular (IM) progesterone versus no treatment: multiple pregnancy and short cervix, Outcome 6 Antenatal tocolysis.

Comparison 3 Intramuscular (IM) progesterone versus no treatment: multiple pregnancy and short cervix, Outcome 7 Antenatal corticosteroids.

Comparison 3 Intramuscular (IM) progesterone versus no treatment: multiple pregnancy and short cervix, Outcome 8 Neonatal sepsis.

Comparison 3 Intramuscular (IM) progesterone versus no treatment: multiple pregnancy and short cervix, Outcome 9 Respiratory distress syndrome.

Comparison 3 Intramuscular (IM) progesterone versus no treatment: multiple pregnancy and short cervix, Outcome 10 Retinopathy of prematurity.

Comparison 3 Intramuscular (IM) progesterone versus no treatment: multiple pregnancy and short cervix, Outcome 11 Neonatal death.

Comparison 3 Intramuscular (IM) progesterone versus no treatment: multiple pregnancy and short cervix, Outcome 12 Admission to NICU.

Comparison 3 Intramuscular (IM) progesterone versus no treatment: multiple pregnancy and short cervix, Outcome 13 Sensitivity analysis for perinatal death (assuming total dependence).

Comparison 3 Intramuscular (IM) progesterone versus no treatment: multiple pregnancy and short cervix, Outcome 14 Sensitivity analysis for perinatal death (assuming 1% dependence).

Comparison 4 Vaginal progesterone versus no treatment: multiple pregnancy and short cervix, Outcome 1 Preterm birth less than 34 weeks.

Comparison 4 Vaginal progesterone versus no treatment: multiple pregnancy and short cervix, Outcome 2 Prelabour rupture of the membranes.
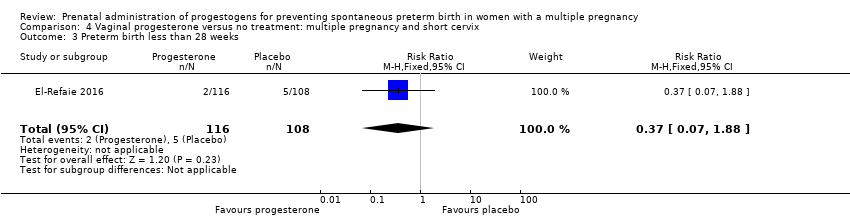
Comparison 4 Vaginal progesterone versus no treatment: multiple pregnancy and short cervix, Outcome 3 Preterm birth less than 28 weeks.
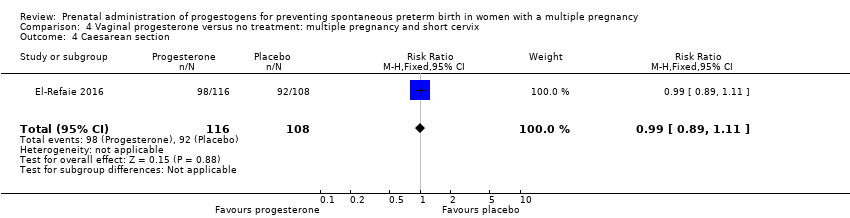
Comparison 4 Vaginal progesterone versus no treatment: multiple pregnancy and short cervix, Outcome 4 Caesarean section.

Comparison 4 Vaginal progesterone versus no treatment: multiple pregnancy and short cervix, Outcome 5 Infant birthweight less than 2500 g.

Comparison 4 Vaginal progesterone versus no treatment: multiple pregnancy and short cervix, Outcome 6 Respiratory distress syndrome.

Comparison 4 Vaginal progesterone versus no treatment: multiple pregnancy and short cervix, Outcome 7 Use of mechanical ventilation.

Comparison 4 Vaginal progesterone versus no treatment: multiple pregnancy and short cervix, Outcome 8 Admission to NICU.
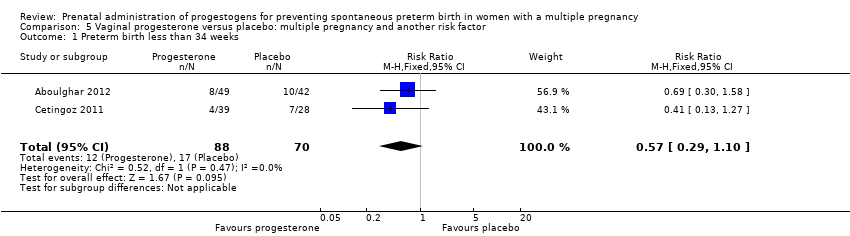
Comparison 5 Vaginal progesterone versus placebo: multiple pregnancy and another risk factor, Outcome 1 Preterm birth less than 34 weeks.

Comparison 5 Vaginal progesterone versus placebo: multiple pregnancy and another risk factor, Outcome 2 Preterm birth less than 37 weeks.
| Intramuscular (IM) progesterone compared to no treatment or placebo for preventing spontaneous preterm birth in women with a multiple pregnancy | ||||||
| Patient or population: Women with a multiple pregnancy | ||||||
| Outcomes | Anticipated absolute effects* (95% CI) | Relative effect | № of participants | Quality of the evidence | Comments | |
| Risk with no treatment or placebo | Risk with intramuscular (IM) progesterone | |||||
| Perinatal death | Study population | RR 1.45 | 3089 | ⊕⊕⊝⊝ LOW 1, 2 | ‐ | |
| 34 per 1000 | 49 per 1000 | |||||
| Preterm birth less than 34 weeks | Study population | RR 1.54 | 399 | ⊕⊕⊝⊝ | ‐ | |
| 191 per 1000 | 298 per 1000 | |||||
| Major neurodevelopmental disability at childhood follow‐up | Study population | ‐ | (0 studies) | ‐ | None of the included trial reported this outcome | |
| see comment | see comment | |||||
| Infant birthweight less than 2500 g | Study population | RR 0.99 | 4071 | ⊕⊕⊕⊝ | ‐ | |
| 620 per 1000 | 613 per 1000 | |||||
| Preterm birth less than 28 weeks | Study population | RR 1.08 | 1920 | ⊕⊕⊕⊝ | ‐ | |
| ‐58 per 1000 | 62 per 1000 | |||||
| Preterm birth less than 37 weeks | Study population | RR 1.05 | 2010 | ⊕⊕⊕⊕ | ‐ | |
| 614 per 1000 | 639 per 1000 | |||||
| *The risk in the intervention group (and its 95% confidence interval) is based on the assumed risk in the comparison group and the relative effect of the intervention (and its 95% CI). | ||||||
| GRADE Working Group grades of evidence | ||||||
| 1Statistical heterogeneity (I2 > 60%). Variation in size and direction of effect (‐1). | ||||||
| Vaginal progesterone compared to no treatment or placebo for preventing spontaneous preterm birth in women with a multiple pregnancy | ||||||
| Patient or population: Women with a multiple pregnancy | ||||||
| Outcomes | Anticipated absolute effects* (95% CI) | Relative effect | № of participants | Quality of the evidence | Comments | |
| Risk with no treatment or placebo | Risk with vaginal progesterone | |||||
| Perinatal death | Study population | RR 1.23 | 2287 | ⊕⊕⊝⊝ | ‐ | |
| 23 per 1000 | 28 per 1000 | |||||
| Preterm birth less than 34 weeks | Study population | RR 0.83 | 1727 | ⊕⊕⊝⊝ | ‐ | |
| 227 per 1000 | 188 per 1000 | |||||
| Major neurodevelopmental disability at childhood follow‐up | Study population | ‐ | (0 study) | ‐ | None of the included trial reported this outcome. | |
| see comment | see comment | |||||
| Infant birthweight less than 2500 g | Study population | RR 0.95 | 3079 | ⊕⊕⊕⊝ | ‐ | |
| 604 per 1000 | 574 per 1000 | |||||
| Preterm birth less than 37 weeks | Study population | RR 0.97 | 1597 | ⊕⊕⊕⊝ | ‐ | |
| 559 per 1000 | 547 per 1000 | |||||
| Preterm birth less than 28 weeks | Study population | RR 1.22 | 1569 | ⊕⊕⊝⊝ | ‐ | |
| 26 per 1000 | 31 per 1000 | |||||
| *The risk in the intervention group (and its 95% confidence interval) is based on the assumed risk in the comparison group and the relative effect of the intervention (and its 95% CI). | ||||||
| GRADE Working Group grades of evidence | ||||||
| 1One study contributing data with design limitations (weight of 52.1%) (‐1). | ||||||
| Trial | Fetal death (FD) | Intrapartum death | Stillbirth | Neonatal death (NND) | Perinatal death (PND) | Included in Dodd 2013? | Decision for PND for multiples review? |
| ‐ | ‐ | ‐ | Reported as maternal outcome. From text appears as if at least one pregnancy affected by demise of both twins | ‐ | Yes | Cannot reliably convert maternal denominator for neonatal outcome. Data not included | |
| Yes | ‐ | ‐ | ‐ | Yes, as a baby outcome. | N/A | Include | |
| No death data | ‐ | ‐ | ‐ | ‐ | No PND reported | N/A | |
| No death data | ‐ | ‐ | ‐ | ‐ | No PND reported | N/A | |
| Fetal death reported as maternal outcome and only as a single co‐twin demise outcome. Unsure if any pregnancies where both twins died | ‐ | ‐ | Yes, as a baby outcome | Not reported. Cannot convert fetal death into a baby outcome because only reported if single twin demise likely to underestimate | Yes | Data not included. | |
| Reported as a maternal outcome and denominator not clear | ‐ | ‐ | Yes | No | No | No | |
| Yes. as maternal outcome but specifies only 1 twin affected in each of those pregnancies | ‐ | ‐ | Yes | In text | Yes | Yes | |
| ‐ | ‐ | ‐ | ‐ | Yes, as infant outcome | N/A | Yes | |
| ‐ | ‐ | Yes | Yes | Yes, as infant outcome | N/A | Yes | |
| ‐ | ‐ | ‐ | Yes | ‐ | No PND reported | N/A | |
| Combs 2010 triplets | ‐ | ‐ | ‐ | Yes | Yes | Yes | Yes |
| Combs 2011 twins | ‐ | ‐ | ‐ | Yes | Yes | Yes | Yes |
| ‐ | ‐ | ‐ | ‐ | Yes in text | Yes | Yes | |
| ‐ | 1 or more died during delivery after 24 wks and also any IUD before onset labour or onset delivery | Reported “all live births” | ‐ | No, and cannot be reliably added up from data presented | Yes | Data not included | |
| Yes | ‐ | ‐ | Yes | Yes, from text (not in table) | No ‐ not sure why data not included | Yes | |
| Yes | Yes | ‐ | Yes | Can add NND and FD (IP and IU); all Ns clear | No ‐ not sure why data not included | Yes. Extrapolated from text and checked | |
| Yes, as a maternal outcome | ‐ | ‐ | Yes | Cannot add FD and NND because FD reported as a maternal outcome | No | Data not included | |
| IP: intrapartum | |||||||
| Outcome or subgroup title | No. of studies | No. of participants | Statistical method | Effect size |
| 1 Preterm birth less than 34 weeks Show forest plot | 2 | 399 | Risk Ratio (M‐H, Fixed, 95% CI) | 1.54 [1.06, 2.26] |
| 2 Preterm birth less than 34 weeks subgroup by dose Show forest plot | 2 | 399 | Risk Ratio (M‐H, Fixed, 95% CI) | 1.54 [1.06, 2.26] |
| 2.1 Low dose (250 mg weekly or less) | 1 | 238 | Risk Ratio (M‐H, Fixed, 95% CI) | 1.37 [0.73, 2.59] |
| 2.2 High dose (greater than 250 mg weekly) | 1 | 161 | Risk Ratio (M‐H, Fixed, 95% CI) | 1.67 [1.04, 2.68] |
| 3 Preterm birth less than 34 week subgroup by timing Show forest plot | 2 | 399 | Risk Ratio (M‐H, Fixed, 95% CI) | 1.54 [1.06, 2.26] |
| 3.1 Commencing after 20 weeks' gestation | 1 | 161 | Risk Ratio (M‐H, Fixed, 95% CI) | 1.67 [1.04, 2.68] |
| 3.2 Mixed timing of commencement | 1 | 238 | Risk Ratio (M‐H, Fixed, 95% CI) | 1.37 [0.73, 2.59] |
| 4 Perinatal death Show forest plot | 6 | 3089 | Risk Ratio (M‐H, Random, 95% CI) | 1.45 [0.60, 3.51] |
| 5 Perinatal death subgroup by dose Show forest plot | 6 | 3089 | Risk Ratio (M‐H, Random, 95% CI) | 1.45 [0.60, 3.51] |
| 5.1 Low dose (250 mg weekly or less) | 5 | 2759 | Risk Ratio (M‐H, Random, 95% CI) | 1.15 [0.48, 2.77] |
| 5.2 High dose (greater than 250 mg weekly) | 1 | 330 | Risk Ratio (M‐H, Random, 95% CI) | 9.11 [1.17, 71.10] |
| 6 Perinatal death subgroup by timing Show forest plot | 6 | 3089 | Risk Ratio (M‐H, Random, 95% CI) | 1.45 [0.60, 3.51] |
| 6.1 Starting before 20 weeks' gestation | 2 | 1886 | Risk Ratio (M‐H, Random, 95% CI) | 0.95 [0.34, 2.66] |
| 6.2 Starting after 20 weeks' gestation | 2 | 484 | Risk Ratio (M‐H, Random, 95% CI) | 3.76 [0.81, 17.46] |
| 6.3 Mixed timing of start | 2 | 719 | Risk Ratio (M‐H, Random, 95% CI) | 0.67 [0.01, 37.74] |
| 7 Prelabour rupture of the membranes Show forest plot | 6 | 1257 | Risk Ratio (M‐H, Fixed, 95% CI) | 1.17 [0.84, 1.63] |
| 8 Preterm birth less than 37 weeks Show forest plot | 5 | 2010 | Risk Ratio (M‐H, Fixed, 95% CI) | 1.05 [0.98, 1.13] |
| 9 Preterm birth less than 28 weeks Show forest plot | 5 | 1920 | Risk Ratio (M‐H, Fixed, 95% CI) | 1.08 [0.75, 1.55] |
| 10 Adverse drug reaction Show forest plot | 2 | 1316 | Risk Ratio (M‐H, Random, 95% CI) | 0.91 [0.63, 1.32] |
| 11 Caesarean section Show forest plot | 7 | 2222 | Risk Ratio (M‐H, Fixed, 95% CI) | 1.01 [0.95, 1.08] |
| 12 Antenatal tocolysis Show forest plot | 7 | 2218 | Risk Ratio (M‐H, Fixed, 95% CI) | 0.97 [0.85, 1.10] |
| 13 Antenatal corticosteroids Show forest plot | 7 | 2221 | Risk Ratio (M‐H, Fixed, 95% CI) | 0.99 [0.88, 1.11] |
| 14 Infant birthweight less than 2500 g Show forest plot | 5 | 4071 | Risk Ratio (M‐H, Random, 95% CI) | 0.99 [0.90, 1.08] |
| 15 Apgar score < 7 at 5 minutes Show forest plot | 4 | 3606 | Risk Ratio (M‐H, Fixed, 95% CI) | 0.89 [0.68, 1.15] |
| 16 Neonatal sepsis Show forest plot | 6 | 3327 | Risk Ratio (M‐H, Random, 95% CI) | 1.02 [0.41, 2.51] |
| 17 Respiratory distress syndrome Show forest plot | 8 | 4670 | Risk Ratio (M‐H, Random, 95% CI) | 1.07 [0.85, 1.34] |
| 18 Use of mechanical ventilation Show forest plot | 3 | 2233 | Risk Ratio (M‐H, Random, 95% CI) | 0.90 [0.69, 1.17] |
| 19 Intraventricular haemorrhage ‐ all grades Show forest plot | 1 | 1355 | Risk Ratio (M‐H, Fixed, 95% CI) | 1.98 [0.36, 10.77] |
| 20 Retinopathy of prematurity Show forest plot | 5 | 2807 | Risk Ratio (M‐H, Fixed, 95% CI) | 0.34 [0.16, 0.74] |
| 21 Chronic lung disease Show forest plot | 2 | 681 | Risk Ratio (M‐H, Random, 95% CI) | 1.91 [0.13, 27.80] |
| 22 Necrotising enterocolitis Show forest plot | 5 | 2610 | Risk Ratio (M‐H, Fixed, 95% CI) | 0.74 [0.36, 1.51] |
| 23 Fetal death Show forest plot | 4 | 3536 | Risk Ratio (M‐H, Random, 95% CI) | 0.93 [0.39, 2.20] |
| 24 Neonatal death Show forest plot | 7 | 3399 | Risk Ratio (M‐H, Random, 95% CI) | 0.92 [0.44, 1.91] |
| 25 Admission to NICU Show forest plot | 2 | 1668 | Risk Ratio (M‐H, Fixed, 95% CI) | 1.33 [1.13, 1.58] |
| 26 Patent ductus arteriosus Show forest plot | 4 | 2290 | Risk Ratio (M‐H, Random, 95% CI) | 0.90 [0.37, 2.21] |
| 27 Sensitivity analysis for perinatal death (assuming total dependence) Show forest plot | 6 | 1517 | Risk Ratio (M‐H, Random, 95% CI) | 1.35 [0.57, 3.20] |
| 28 Sensitivity analysis for perinatal death (assuming 1% dependence) Show forest plot | 6 | 3021 | Risk Ratio (M‐H, Random, 95% CI) | 1.45 [0.60, 3.49] |
| Outcome or subgroup title | No. of studies | No. of participants | Statistical method | Effect size |
| 1 Preterm birth less than 34 weeks Show forest plot | 6 | 1727 | Risk Ratio (M‐H, Random, 95% CI) | 0.83 [0.63, 1.09] |
| 2 Preterm birth less than 34 weeks subgroup by dose Show forest plot | 6 | 1727 | Risk Ratio (M‐H, Random, 95% CI) | 0.83 [0.64, 1.07] |
| 2.1 Low dose (200 mg or less daily) | 4 | 1267 | Risk Ratio (M‐H, Random, 95% CI) | 0.93 [0.63, 1.37] |
| 2.2 High dose (more than 200 mg daily) | 3 | 460 | Risk Ratio (M‐H, Random, 95% CI) | 0.68 [0.52, 0.90] |
| 3 Preterm birth less than 34 weeks subgroup by timing Show forest plot | 6 | 1727 | Risk Ratio (M‐H, Random, 95% CI) | 0.83 [0.63, 1.09] |
| 3.1 Starting before 20 weeks' gestation | 1 | 91 | Risk Ratio (M‐H, Random, 95% CI) | 0.69 [0.30, 1.58] |
| 3.2 Starting after 20 weeks' gestation | 4 | 1256 | Risk Ratio (M‐H, Random, 95% CI) | 0.74 [0.60, 0.91] |
| 3.3 Mixed timing of start | 1 | 380 | Risk Ratio (M‐H, Random, 95% CI) | 1.35 [0.90, 2.02] |
| 4 Perinatal death Show forest plot | 3 | 2287 | Risk Ratio (M‐H, Fixed, 95% CI) | 1.23 [0.74, 2.06] |
| 5 Perinatal death subgroup by dose Show forest plot | 3 | 2287 | Risk Ratio (M‐H, Fixed, 95% CI) | 1.23 [0.74, 2.06] |
| 5.1 Low dose (200 mg or less daily) | 3 | 2287 | Risk Ratio (M‐H, Fixed, 95% CI) | 1.23 [0.74, 2.06] |
| 6 Perinatal death subgroup by timing Show forest plot | 3 | 2287 | Risk Ratio (M‐H, Fixed, 95% CI) | 1.23 [0.74, 2.06] |
| 6.1 Starting before 20 weeks' gestation | 1 | 171 | Risk Ratio (M‐H, Fixed, 95% CI) | 1.98 [0.18, 21.39] |
| 6.2 Starting after 20 weeks' gestation | 1 | 1346 | Risk Ratio (M‐H, Fixed, 95% CI) | 1.11 [0.51, 2.42] |
| 6.3 Mixed timing of start | 1 | 770 | Risk Ratio (M‐H, Fixed, 95% CI) | 1.29 [0.63, 2.61] |
| 7 Prelabour rupture of the membranes Show forest plot | 2 | 514 | Risk Ratio (M‐H, Fixed, 95% CI) | 0.61 [0.23, 1.60] |
| 8 Preterm birth less than 37 weeks Show forest plot | 6 | 1597 | Risk Ratio (M‐H, Fixed, 95% CI) | 0.97 [0.89, 1.06] |
| 9 Preterm birth less than 28 weeks Show forest plot | 4 | 1569 | Risk Ratio (M‐H, Fixed, 95% CI) | 1.22 [0.68, 2.21] |
| 10 Adverse drug reaction Show forest plot | 2 | 562 | Risk Ratio (M‐H, Fixed, 95% CI) | 0.99 [0.90, 1.09] |
| 11 Caesarean section Show forest plot | 6 | 2143 | Risk Ratio (M‐H, Fixed, 95% CI) | 0.93 [0.88, 0.98] |
| 12 Satisfaction with therapy Show forest plot | 1 | 494 | Mean Difference (IV, Fixed, 95% CI) | 0.0 [‐0.35, 0.35] |
| 13 Antenatal tocolysis Show forest plot | 4 | 1420 | Risk Ratio (M‐H, Fixed, 95% CI) | 0.80 [0.62, 1.02] |
| 14 Antenatal corticosteroids Show forest plot | 4 | 1422 | Risk Ratio (M‐H, Fixed, 95% CI) | 0.87 [0.71, 1.06] |
| 15 Infant birthweight less than 2500 g Show forest plot | 4 | 3079 | Risk Ratio (M‐H, Random, 95% CI) | 0.95 [0.88, 1.03] |
| 16 Apgar score < 7 at 5 minutes Show forest plot | 3 | 2410 | Risk Ratio (M‐H, Fixed, 95% CI) | 0.65 [0.35, 1.19] |
| 17 Respiratory distress syndrome Show forest plot | 4 | 2560 | Risk Ratio (M‐H, Random, 95% CI) | 0.84 [0.64, 1.10] |
| 18 Use of mechanical ventilation Show forest plot | 5 | 3134 | Risk Ratio (M‐H, Fixed, 95% CI) | 0.61 [0.48, 0.77] |
| 19 Intraventricular haemorrhage ‐ all grades Show forest plot | 1 | 1333 | Risk Ratio (M‐H, Fixed, 95% CI) | 1.70 [0.62, 4.66] |
| 20 Retinopathy of prematurity Show forest plot | 2 | 1945 | Risk Ratio (M‐H, Fixed, 95% CI) | 1.07 [0.45, 2.54] |
| 21 Necrotising enterocolitis Show forest plot | 3 | 2117 | Risk Ratio (M‐H, Fixed, 95% CI) | 0.52 [0.13, 2.06] |
| 22 Neonatal sepsis Show forest plot | 2 | 1944 | Risk Ratio (M‐H, Fixed, 95% CI) | 1.41 [0.86, 2.33] |
| 23 Fetal death Show forest plot | 3 | 2328 | Risk Ratio (M‐H, Fixed, 95% CI) | 1.38 [0.65, 2.90] |
| 24 Neonatal death Show forest plot | 3 | 2905 | Risk Ratio (M‐H, Fixed, 95% CI) | 1.53 [0.75, 3.15] |
| 25 Admission to NICU Show forest plot | 5 | 4052 | Risk Ratio (M‐H, Fixed, 95% CI) | 0.93 [0.87, 1.00] |
| 26 Patent ductus arteriosus Show forest plot | 2 | 1946 | Risk Ratio (M‐H, Fixed, 95% CI) | 0.76 [0.47, 1.22] |
| 27 Sensitivity analysis for perinatal death (assuming total non‐independence) Show forest plot | 3 | 1144 | Risk Ratio (M‐H, Fixed, 95% CI) | 1.22 [0.61, 2.44] |
| 28 Sensitivity analysis for perinatal death (assuming 1% non‐independence) Show forest plot | 3 | 2263 | Risk Ratio (M‐H, Fixed, 95% CI) | 1.23 [0.74, 2.06] |
| Outcome or subgroup title | No. of studies | No. of participants | Statistical method | Effect size |
| 1 Preterm birth less than 34 weeks Show forest plot | 1 | 161 | Risk Ratio (M‐H, Fixed, 95% CI) | 1.67 [1.04, 2.68] |
| 2 Perinatal death Show forest plot | 1 | 330 | Risk Ratio (M‐H, Fixed, 95% CI) | 9.11 [1.17, 71.10] |
| 3 Prelabour rupture of the membranes Show forest plot | 1 | 161 | Risk Ratio (M‐H, Fixed, 95% CI) | 1.14 [0.63, 2.06] |
| 4 Preterm birth less than 37 weeks Show forest plot | 1 | 161 | Risk Ratio (M‐H, Fixed, 95% CI) | 1.06 [0.90, 1.25] |
| 5 Caesarean section Show forest plot | 1 | 161 | Risk Ratio (M‐H, Fixed, 95% CI) | 1.14 [0.88, 1.49] |
| 6 Antenatal tocolysis Show forest plot | 1 | 158 | Risk Ratio (M‐H, Fixed, 95% CI) | 1.37 [0.76, 2.45] |
| 7 Antenatal corticosteroids Show forest plot | 1 | 159 | Risk Ratio (M‐H, Fixed, 95% CI) | 0.93 [0.64, 1.36] |
| 8 Neonatal sepsis Show forest plot | 1 | 303 | Risk Ratio (M‐H, Fixed, 95% CI) | 5.03 [0.60, 42.57] |
| 9 Respiratory distress syndrome Show forest plot | 1 | 309 | Risk Ratio (M‐H, Fixed, 95% CI) | 1.46 [1.00, 2.12] |
| 10 Retinopathy of prematurity Show forest plot | 1 | 302 | Risk Ratio (M‐H, Fixed, 95% CI) | 0.20 [0.01, 4.19] |
| 11 Neonatal death Show forest plot | 1 | 307 | Risk Ratio (M‐H, Fixed, 95% CI) | 4.03 [0.46, 35.61] |
| 12 Admission to NICU Show forest plot | 1 | 313 | Risk Ratio (M‐H, Fixed, 95% CI) | 1.34 [1.04, 1.74] |
| 13 Sensitivity analysis for perinatal death (assuming total dependence) Show forest plot | 1 | 163 | Risk Ratio (M‐H, Fixed, 95% CI) | 5.06 [0.60, 42.38] |
| 14 Sensitivity analysis for perinatal death (assuming 1% dependence) Show forest plot | 1 | 322 | Risk Ratio (M‐H, Fixed, 95% CI) | 9.11 [1.17, 71.10] |
| Outcome or subgroup title | No. of studies | No. of participants | Statistical method | Effect size |
| 1 Preterm birth less than 34 weeks Show forest plot | 1 | 224 | Risk Ratio (M‐H, Fixed, 95% CI) | 0.67 [0.49, 0.91] |
| 2 Prelabour rupture of the membranes Show forest plot | 1 | 224 | Risk Ratio (M‐H, Fixed, 95% CI) | 0.47 [0.12, 1.82] |
| 3 Preterm birth less than 28 weeks Show forest plot | 1 | 224 | Risk Ratio (M‐H, Fixed, 95% CI) | 0.37 [0.07, 1.88] |
| 4 Caesarean section Show forest plot | 1 | 224 | Risk Ratio (M‐H, Fixed, 95% CI) | 0.99 [0.89, 1.11] |
| 5 Infant birthweight less than 2500 g Show forest plot | 1 | 439 | Risk Ratio (M‐H, Fixed, 95% CI) | 0.94 [0.85, 1.04] |
| 6 Respiratory distress syndrome Show forest plot | 1 | 439 | Risk Ratio (M‐H, Fixed, 95% CI) | 0.68 [0.55, 0.84] |
| 7 Use of mechanical ventilation Show forest plot | 1 | 439 | Risk Ratio (M‐H, Fixed, 95% CI) | 0.47 [0.32, 0.69] |
| 8 Admission to NICU Show forest plot | 1 | 439 | Risk Ratio (M‐H, Fixed, 95% CI) | 0.91 [0.82, 1.01] |
| Outcome or subgroup title | No. of studies | No. of participants | Statistical method | Effect size |
| 1 Preterm birth less than 34 weeks Show forest plot | 2 | 158 | Risk Ratio (M‐H, Fixed, 95% CI) | 0.57 [0.29, 1.10] |
| 2 Preterm birth less than 37 weeks Show forest plot | 2 | 168 | Risk Ratio (M‐H, Fixed, 95% CI) | 0.92 [0.72, 1.18] |