Administración prenatal de progestágenos para la prevención del parto prematuro espontáneo en pacientes con un embarazo múltiple
Resumen
Antecedentes
El embarazo múltiple es un factor de riesgo importante del parto prematuro, y en más del 50% de las pacientes con un embarazo gemelar el parto se producirá antes de las 37 semanas de gestación. Se sabe que los lactantes que nacen de forma prematura tienen un aumento en el riesgo de muchos resultados adversos de salud, que contribuyen con más de la mitad de la mortalidad perinatal general. La progesterona se produce de forma natural en el cuerpo y tiene una función en la preservación del embarazo, aunque no está claro si la administración de progestágenos a las pacientes con un embarazo múltiple con alto riesgo de parto prematuro es efectiva y segura.
Objetivos
Evaluar los efectos beneficiosos y perjudiciales de la administración de progesterona para la prevención del parto prematuro en pacientes con un embarazo múltiple.
Métodos de búsqueda
Se hicieron búsquedas en el registro de ensayos del Grupo Cochrane de Embarazo y Parto (Cochrane Pregnancy and Childbirth Group) ClinicalTrials.gov y en la WHO International Clinical Trials Registry Platform (ICTRP) (1 noviembre 2016) y en listas de referencias de estudios recuperados.
Criterios de selección
Se incluyeron los ensayos controlados aleatorios que examinaron la administración de un progestágeno por cualquier vía para la prevención del parto prematuro en pacientes con un embarazo múltiple. No se incluyeron los ensayos cuasialeatorios ni los ensayos cruzados.
Obtención y análisis de los datos
Dos autores de la revisión de forma independiente evaluaron la elegibilidad de los informes identificados mediante la búsqueda, extrajeron los datos, evaluaron el riesgo de sesgo y calificaron la calidad de la evidencia.
Resultados principales
Se incluyeron 17 ensayos que compararon progesterona vaginal o intramuscular con un placebo o ningún tratamiento y que reclutaron a 4773 pacientes. El riesgo de sesgo de la mayoría de los estudios incluidos fue bajo, con la excepción de cuatro estudios que tuvieron un cegamiento insuficiente, o una pérdida significativa durante el seguimiento, o ambos, o el informe no fue suficiente para poder evaluarlo. La calidad de la evidencia se consideró baja a alta, y se disminuyó por la heterogeneidad estadística, las limitaciones en el diseño de algunos de los estudios que contribuyeron con datos y la imprecisión de la estimación del efecto.
1 Progesterona intramuscular versus ningún tratamiento o placebo
Más pacientes del grupo de progesterona intramuscular tuvieron el parto con menos de 34 semanas de gestación en comparación con placebo (cociente de riesgos [CR] 1,54; intervalo de confianza [IC] del 95%: 1,06 a 2,26; mujeres = 399; estudios = 2; evidencia de baja calidad). Aunque la incidencia de muerte perinatal en el grupo de progesterona fue mayor, hubo una incertidumbre considerable alrededor de la estimación del efecto y heterogeneidad alta entre los estudios (CR promedio 1,45; IC del 95%: 0,60 a 3,51; lactantes = 3089; estudios = 6; I2 = 71%; evidencia de baja calidad). Ningún estudio informó mortalidad materna ni discapacidad grave del desarrollo neurológico al seguimiento en la niñez.
. No se encontraron diferencias claras entre los grupos en ninguno de los otros resultados maternos ni infantiles (parto prematuro con menos de 37 semanas (CR 1,05; IC del 95%: 0,98 a 1,13; mujeres = 2010; estudios = 5; evidencia de alta calidad); parto prematuro con menos de 28 semanas (CR 1,08; IC del 95%: 0,75 a 1,55; mujeres = 1920; estudios = 5; evidencia de calidad moderada); peso al nacer menor de 2500 g (CR 0,99; IC del 95%: 0,90 a 1,08; lactantes = 4071; estudios = 5; I2 = 76%, evidencia de calidad moderada)). En los ensayos no se informaron resultados de la niñez.
2 Progesterona vaginal versus ningún tratamiento o placebo por dosis
No hubo diferencias claras en la incidencia de parto prematuro antes de las 34 semanas (CR promedio 0,83; IC del 95%: 0,63 a 1,09; mujeres = 1727; estudios = 6; I2 = 46%; evidencia de baja calidad). Aunque parecieron ocurrir menos partos antes de las 34 semanas en el grupo de progesterona, los IC cruzaron la línea de ningún efecto. La incidencia de muerte perinatal fue mayor en el grupo de progesterona, aunque hubo una incertidumbre considerable en la estimación del efecto y la calidad de la evidencia fue baja para este resultado (CR 1,23; IC del 95%: 0,74 a 2,06; lactantes = 2287; estudios = 3; evidencia de baja calidad). Ningún estudio informó sobre mortalidad materna ni discapacidad grave del desarrollo neurológico al seguimiento en la niñez.
No se encontraron diferencias claras entre los grupos en ninguno de los otros resultados maternos ni infantiles (parto prematuro con menos de 37 semanas (CR promedio 0,97; IC del 95%: 0,89 a 1,06; mujeres = 1597; estudios = 6; evidencia de calidad moderada); parto prematuro con menos de 28 semanas (CR 1,22; IC del 95%: 0,68 a 2,21; mujeres = 1569; estudios = 4; evidencia de baja calidad); peso al nacer menor de 2500 g (CR 0,95; IC del 95%: 0,88 a 1,03; lactantes = 3079; estudios = 4; I2 = 49%, evidencia de calidad moderada)). En los ensayos no se informaron resultados de la niñez.
En los resultados secundarios no se encontraron diferencias claras entre los grupos en ninguno de los otros resultados maternos, excepto en la cesárea, donde en el grupo de pacientes que recibieron progesterona vaginal no se realizaron tantas cesáreas como en el grupo placebo, aunque la diferencia entre los grupos no fue grande (7%) (CR 0,93; IC del 95%: 0,88 a 0,98; mujeres = 2143; estudios = 6; I2 = 0%). No se encontraron diferencias claras entre los grupos en ninguno de los resultados infantiles, excepto en la ventilación asistida, que fue necesaria en menos lactantes del grupo de pacientes que recibieron progesterona vaginal (CR 0,61; IC del 95%: 0,48 a 0,77; lactantes = 3134; estudios = 5).
Conclusiones de los autores
En general, la administración de progesterona (por vía intramuscular o vaginal) en las pacientes con un embarazo múltiple no parece asociarse con una reducción en el riesgo de parto prematuro ni con mejores resultados neonatales.
Los estudios de investigación futuros se podrían centrar en un metanálisis integral de los datos de participantes individuales que incluya todos los datos disponibles relacionados con la administración de progesterona intramuscular y vaginal en las pacientes con un embarazo múltiple, antes de considerar la necesidad de realizar ensayos en subgrupos de pacientes con alto riesgo (por ejemplo, pacientes con un embarazo múltiple y una longitud cervical corta detectada mediante ecografía).
PICO
Resumen en términos sencillos
Progestágenos prenatales para la prevención del parto prematuro en pacientes con un embarazo múltiple
¿Cuál es el problema?
Más de la mitad de las pacientes con un embarazo gemelar tienen el parto antes de las 37 semanas de embarazo (prematuro), y las pacientes que esperan trillizos tienen aún más probabilidades de tener un parto prematuro. Los lactantes nacidos de forma prematura tienen mayores probabilidades de morir o presentar problemas de salud en comparación con los nacidos a término. La progesterona se produce de forma natural en el cuerpo y se piensa que ayuda a mantener el embarazo.
¿Por qué es importante?
No se sabe si proporcionar progesterona (por inyección, por vía oral o por supositorios o geles vaginales) a las pacientes con un embarazo múltiple durante el embarazo es beneficioso o perjudicial para la paciente y los fetos.
¿Qué evidencia se encontró?
Se buscó evidencia el 1 de noviembre de 2016 y se identificaron 17 ensayos controlados aleatorios con 4773 mujeres para su inclusión en la revisión.
En los estudios en los que las pacientes recibieron la progesterona mediante inyección en el músculo en comparación con placebo (tratamiento simulado) más pacientes tuvieron el parto antes de las 34 semanas de embarazo en el grupo de progesterona (evidencia de baja calidad). No hubo diferencias claras entre los grupos en la probabilidad de que se produjera una muerte fetal o poco después del nacimiento (evidencia de baja calidad). Ningún estudio informó si alguna paciente murió ni si algún niño presentó problemas del desarrollo o discapacidad a más largo plazo. Parece que hubo poca o ninguna diferencia entre las pacientes que recibieron progesterona o placebo en otros resultados importantes como parto prematuro antes de las 37 semanas (evidencia de calidad alta); parto prematuro antes de las 28 semanas (evidencia de calidad moderada) o peso al nacer menor de 2500 g (evidencia de calidad moderada). En los ensayos no se informaron resultados de la niñez.
En los estudios donde las pacientes recibieron progesterona vaginal es posible que haya habido poca o ninguna diferencia entre las pacientes que recibieron progesterona o placebo en el parto prematuro antes de las 34 semanas (evidencia de baja calidad); aunque ocurrieron menos partos antes de las 34 semanas en el grupo de progesterona, este resultado puede haber ocurrido por casualidad. El número de muertes fetales o muertes poco después del nacimiento fue similar en ambos grupos (evidencia de baja calidad). Ningún estudio informó muertes maternas ni resultados a más largo plazo de los niños. Es posible que haya habido poca o ninguna diferencia entre los grupos que recibieron progesterona vaginal versus placebo en otros resultados importantes (parto prematuro antes de las 37 semanas [evidencia de calidad moderada]; parto prematuro antes de las 28 semanas [evidencia de baja calidad]; o peso al nacer menor de 2500 g [evidencia de calidad moderada]). En los ensayos no se informaron resultados de la niñez. En otros resultados no se encontraron diferencias claras entre los grupos excepto en la cesárea, donde en el grupo de pacientes que recibieron progesterona vaginal no se realizaron tantas cesáreas como en el grupo placebo (aunque la diferencia entre los grupos no fue grande [7%]). Menos lactantes de madres que habían recibido progesterona vaginal necesitaron ayuda mecánica para respirar.
No se encontraron estudios que analizaran la progesterona administrada por vía oral.
¿Qué significa esto?
En general, en las pacientes con un embarazo múltiple el tratamiento con progesterona (intramuscular o vaginal) no parece reducir la probabilidad de parto prematuro ni mejorar los resultados de los niños.
Los estudios de investigación futuros se podrían centrar en analizar la información relacionada con las pacientes individuales que participan en los estudios, para que todo lo que esté disponible acerca de los tratamientos con progesterona intramuscular y vaginal en las pacientes con un embarazo múltiple se pueda considerar en conjunto.
Authors' conclusions
Summary of findings
| Intramuscular (IM) progesterone compared to no treatment or placebo for preventing spontaneous preterm birth in women with a multiple pregnancy | ||||||
| Patient or population: Women with a multiple pregnancy | ||||||
| Outcomes | Anticipated absolute effects* (95% CI) | Relative effect | № of participants | Quality of the evidence | Comments | |
| Risk with no treatment or placebo | Risk with intramuscular (IM) progesterone | |||||
| Perinatal death | Study population | RR 1.45 | 3089 | ⊕⊕⊝⊝ LOW 1, 2 | ‐ | |
| 34 per 1000 | 49 per 1000 | |||||
| Preterm birth less than 34 weeks | Study population | RR 1.54 | 399 | ⊕⊕⊝⊝ | ‐ | |
| 191 per 1000 | 298 per 1000 | |||||
| Major neurodevelopmental disability at childhood follow‐up | Study population | ‐ | (0 studies) | ‐ | None of the included trial reported this outcome | |
| see comment | see comment | |||||
| Infant birthweight less than 2500 g | Study population | RR 0.99 | 4071 | ⊕⊕⊕⊝ | ‐ | |
| 620 per 1000 | 613 per 1000 | |||||
| Preterm birth less than 28 weeks | Study population | RR 1.08 | 1920 | ⊕⊕⊕⊝ | ‐ | |
| ‐58 per 1000 | 62 per 1000 | |||||
| Preterm birth less than 37 weeks | Study population | RR 1.05 | 2010 | ⊕⊕⊕⊕ | ‐ | |
| 614 per 1000 | 639 per 1000 | |||||
| *The risk in the intervention group (and its 95% confidence interval) is based on the assumed risk in the comparison group and the relative effect of the intervention (and its 95% CI). | ||||||
| GRADE Working Group grades of evidence | ||||||
| 1Statistical heterogeneity (I2 > 60%). Variation in size and direction of effect (‐1). | ||||||
| Vaginal progesterone compared to no treatment or placebo for preventing spontaneous preterm birth in women with a multiple pregnancy | ||||||
| Patient or population: Women with a multiple pregnancy | ||||||
| Outcomes | Anticipated absolute effects* (95% CI) | Relative effect | № of participants | Quality of the evidence | Comments | |
| Risk with no treatment or placebo | Risk with vaginal progesterone | |||||
| Perinatal death | Study population | RR 1.23 | 2287 | ⊕⊕⊝⊝ | ‐ | |
| 23 per 1000 | 28 per 1000 | |||||
| Preterm birth less than 34 weeks | Study population | RR 0.83 | 1727 | ⊕⊕⊝⊝ | ‐ | |
| 227 per 1000 | 188 per 1000 | |||||
| Major neurodevelopmental disability at childhood follow‐up | Study population | ‐ | (0 study) | ‐ | None of the included trial reported this outcome. | |
| see comment | see comment | |||||
| Infant birthweight less than 2500 g | Study population | RR 0.95 | 3079 | ⊕⊕⊕⊝ | ‐ | |
| 604 per 1000 | 574 per 1000 | |||||
| Preterm birth less than 37 weeks | Study population | RR 0.97 | 1597 | ⊕⊕⊕⊝ | ‐ | |
| 559 per 1000 | 547 per 1000 | |||||
| Preterm birth less than 28 weeks | Study population | RR 1.22 | 1569 | ⊕⊕⊝⊝ | ‐ | |
| 26 per 1000 | 31 per 1000 | |||||
| *The risk in the intervention group (and its 95% confidence interval) is based on the assumed risk in the comparison group and the relative effect of the intervention (and its 95% CI). | ||||||
| GRADE Working Group grades of evidence | ||||||
| 1One study contributing data with design limitations (weight of 52.1%) (‐1). | ||||||
Background
Description of the condition
The rates of multiple pregnancies that occur naturally vary in different maternal age and ethnic groups; however, since the early 1980s the development of assisted reproduction techniques have led to a large increase in multiple births in high‐resource settings (Collins 2007; Umstad 2013). For example, in the 1980s in England and Wales twin pregnancies accounted for approximately 0.9% of births, but by the late 1990s this had increased to 1.4% (Smith 2014). In Australia in 2010, multiple births accounted for 3.1% of all births (Umstad 2013). These trends have been reflected in many settings across the globe, although in many countries recent policies to restrict the number of embryos transferred during assisted conception may reverse this upward trend (Collins 2007; Umstad 2013).
Multiple pregnancy is a strong risk factor for preterm birth. A woman with a multiple pregnancy is likely to have an over‐distended uterus in addition to any other risk factors which may occur in women with a singleton pregnancy. The risk of early birth before 37 weeks for women with a singleton pregnancy is 7.5% compared with 100% for women with a triplet pregnancy (AIHW 2014). More than 50% of women with a twin pregnancy will give birth prior to 37 weeks' gestation (AIHW 2014).
Infants born preterm are recognised to be at increased risk of many adverse health outcomes, contributing to more than 50% of overall perinatal mortality (AIHW 2003), as well as being at greater risk of dying in their first year of life (Martin 2015). For those preterm infants who initially survive the neonatal period, there is an increased risk of death during childhood due to increased risks of infection and other illnesses (Blencowe 2013; Howson 2013). In addition, infants born preterm are at increased risk of repeated admission to hospital (Elder 1999) and adverse outcomes, including blindness, hearing impairment, chronic lung disease, cerebral palsy and long‐term disability (Blencowe 2013; Hack 1999; Stanley 1992), creating a significant burden upon the community (McCormick 2011). Even accounting for gestational age at birth, infants of a twin pregnancy are at greater risk of complications relating to prematurity than are singleton infants born at the same gestation. For example, the risk of cerebral palsy in all pregnancies is approximately 2/1000, but for twins this increases to 9/1000 and to 31/1000 for triplets (Bromer 2011).
Description of the intervention
Progestogens are a group of hormones that act by binding to and activating the progesterone receptor, and are described as naturally occurring or synthetic agents (Schindler 2008). Progesterone and its metabolite, 17‐hydroxyprogesterone, is naturally occurring, and is produced by the body during pregnancy in high concentrations (Feghali 2014). In contrast, 17‐hydroxyprogesterone caproate is a synthetic progestin that is protein‐bound and lipophilic, and requires metabolism by the liver (Feghali 2014). The metabolites of 17‐hydroxyprogesterone caproate also differ from those of both progesterone and 17‐hydroxyprogesterone (Feghali 2014).
Progestogen compounds may be administered in various forms and by various routes, with different formulations and mode of administration affecting absorption and therefore conferring potentially different bio‐effects (Feghali 2014). For example, 17‐hydroxyprogesterone caproate is administered by intramuscular injection, and has a half‐life of 16 days, with the drug remaining detectable several weeks after intramuscular injection (Caritis 2012). In contrast, progesterone, when administered orally, undergoes significant first‐pass metabolism within the liver, although vaginal administration reduces this effect, with a half‐life of the order of 16 to 18 hours (Stanczyk 2013).
A number of case‐control studies have not identified an increased risk of congenital anomalies following the use of natural progesterone (Raman‐Wilms 1995; Schardein 1980), or 17‐hydroxyprogesterone caproate (Michaelis 1983; Resseguie 1985; Varma 1982) in pregnancy. However, a large population‐based study evaluating the use of progesterone prior to conception indicates an association with some childhood cancers (Hargreave 2015).
Maternal side‐effects from progesterone therapy include headache, breast tenderness, nausea, cough and local irritation if administered intramuscularly. At present, there is little information available about the optimal dose of progesterone, mode of administration, gestational age at which to begin therapy, or duration of therapy (Greene 2003; Iams 2003).
How the intervention might work
Progesterone has a role in maintaining pregnancy (Haluska 1997; Peiber 2001; Pepe 1995), and is thought to act by suppressing smooth muscle activity in the uterus (Astle 2003; Grazzini 1998). In many animal species, there is a reduction in the amount of circulating progesterone before the onset of labour. While these changes have not been shown to occur in women (Astle 2003; Block 1984; Lopez‐Bernal 2003; Peiber 2001; Smit 1984), it has been suggested that there is a 'functional' withdrawal of progesterone related to changes in the expression of progesterone receptors in the uterus (Astle 2003; Condon 2003; Haluska 2002; Peiber 2001). There have been relatively recent reports in the literature advocating the use of progesterone to reduce the risk of preterm birth (Da Fonseca 2003; Meis 2003a), rekindling interest that dates back to the 1960s (Le Vine 1964), although no progestogen deficiency state has been described in women delivering preterm, either with singletons or multiple pregnancy.
Why it is important to do this review
Preterm birth and its consequences for women and their babies is a significant health problem in pregnancy and childbirth. While the suppression or prevention of preterm labour should lead to improved survival through a lower incidence of premature birth, there are theoretical reasons why a fetus may not survive without disability. It is possible that an intrauterine mechanism that would trigger preterm labour could also cause neurological injury to the fetus and that progesterone may prevent labour, but not fetal injury. The purpose of this review is to assess the benefits and harms of progesterone administration for the prevention of preterm birth for both women and their infants, when considering the risk factors present for preterm birth.
An existing Cochrane Review examined the prenatal administration of progesterone for preventing preterm birth in women considered to be at risk of preterm birth (Dodd 2013). This review included women considered at high risk because of multiple pregnancy, as well as women with singleton pregnancies considered at high risk for various clinical reasons (history of preterm birth, short cervix, threatened preterm labour and other risk factors). The review included 36 trials, with several trials recruiting only women with multiple pregnancies. Results of the review may be easier to interpret and more clinically relevant if the results for women with multiple and singleton pregnancy are assessed and reported separately. Consequently, the review has been divided into two reviews, with this review focusing on women with a multiple pregnancy and the other examining the effects of progesterone in women with singleton pregnancies considered to be at high risk of preterm birth.
Objectives
To assess the benefits and harms of progesterone administration for the prevention of preterm birth in women with a multiple pregnancy.
Methods
Criteria for considering studies for this review
Types of studies
We included all published and unpublished randomised controlled trials (including those using a cluster‐randomised design), in which a progestogen was administered for the prevention of preterm birth in women with multiple pregnancies. We included studies published as abstracts or brief reports, provided there was sufficient information available to assess risks of bias.
Trials were excluded if:
-
a quasi‐randomised methodology or cross‐over design was used;
-
a progestogen was administered for the acute treatment of actual or threatened preterm labour (that is, where progesterone was administered as an acute tocolytic medication); or
-
a progestogen was administered in the first trimester of pregnancy only for preventing miscarriage.
Types of participants
Pregnant women considered to be at increased risk of preterm birth because of a multiple pregnancy. Women with multiple pregnancy may also have additional risk factors such as short cervix, and we have included studies which include women with multiple risk factors.
We planned to include studies which recruited women with either a singleton or multiple pregnancy who were considered to be at high risk of preterm birth for other obstetric reasons, provided that randomisation was stratified by plurality of the pregnancy and that findings for women with multiple pregnancies were reported separately, or could be obtained from trial authors.
Types of interventions
Administration of a progestogen by any route (intravenous (IV), intramuscular (IM), oral or vaginal) for the prevention of preterm birth compared with placebo or no treatment. Where data were available, we have presented results separately according to route of administration, as progestogens administered by different routes may have a different effect.
Types of outcome measures
Primary outcomes
Maternal
-
Maternal mortality
-
Preterm birth (less than 34 weeks' gestation)
Infant
-
Perinatal mortality
-
Major neurodevelopmental disability at childhood follow‐up
Secondary outcomes
Maternal
-
Preterm birth less than 37 weeks
-
Preterm birth less than 28 weeks
-
Mean gestational age at birth
-
Threatened preterm labour (as defined by trial authors)
-
Prelabour spontaneous rupture of membranes
-
Adverse drug reaction
-
Pregnancy prolongation (interval between randomisation and birth)
-
Mode of birth
-
Number of antenatal hospital admissions
-
Satisfaction with the therapy
-
Use of tocolysis
-
Maternal infection
-
Antenatal corticosteroids
-
Maternal quality of life
Infant
-
Birthweight less than the third centile for gestational age
-
Birthweight less than 2500 g
-
Mean birthweight
-
Apgar score of less than seven at five minutes
-
Respiratory distress syndrome
-
Use of mechanical ventilation
-
Duration of mechanical ventilation
-
Intraventricular haemorrhage ‐ grades III or IV
-
Periventricular leucomalacia
-
Retinopathy of prematurity
-
Retinopathy of prematurity ‐ grades III or IV
-
Chronic lung disease
-
Necrotising enterocolitis
-
Neonatal sepsis
-
Fetal death
-
Neonatal death
-
Admission to neonatal intensive care unit
-
Neonatal length of hospital stay
-
Teratogenic effects (including virilisation in female infants)
-
Patent ductus arteriosus
Child
-
Major sensorineural disability (defined as any of legal blindness, sensorineural deafness requiring hearing aids, moderate or severe cerebral palsy, or developmental delay or intellectual impairment (defined as developmental quotient or intelligence quotient less than ‐2 standard deviations below mean))
-
Developmental delay (however defined by the authors)
-
Intellectual impairment
-
Motor impairment
-
Visual impairment
-
Blindness
-
Deafness
-
Hearing impairment
-
Cerebral palsy
-
Child behaviour
-
Child temperament
-
Learning difficulties
-
Growth assessments at childhood follow‐up (weight, head circumference, length, skin‐fold thickness)
Search methods for identification of studies
The following Methods section of this protocol is based on a standard template used by Cochrane Pregnancy and Childbirth.
Electronic searches
We searched Cochrane Pregnancy and Childbirth’s Trials Register by contacting their Information Specialist (1 November 2016).
The Register is a database containing over 22,000 reports of controlled trials in the field of pregnancy and childbirth. For full search methods used to populate Pregnancy and Childbirth’s Trials Register including the detailed search strategies for CENTRAL, MEDLINE, Embase and CINAHL; the list of handsearched journals and conference proceedings, and the list of journals reviewed via the current awareness service, please follow this link to the editorial information about the Cochrane Pregnancy and Childbirth in the Cochrane Library and select the ‘Specialized Register ’ section from the options on the left side of the screen.
Briefly, Cochrane Pregnancy and Childbirth’s Trials Register is maintained by their Information Specialist and contains trials identified from:
-
monthly searches of the Cochrane Central Register of Controlled Trials (CENTRAL);
-
weekly searches of MEDLINE (Ovid);
-
weekly searches of Embase (Ovid);
-
monthly searches of CINAHL (EBSCO);
-
handsearches of 30 journals and the proceedings of major conferences;
-
weekly current awareness alerts for a further 44 journals plus monthly BioMed Central email alerts.
Two people screen the search results and review the full text of all relevant trial reports identified through the searching activities described above. Based on the intervention described, each trial report is assigned a number that corresponds to a specific Pregnancy and Childbirth review topic (or topics), and is then added to the Register. The Information Specialist searches the Register for each review using this topic number rather than keywords. This results in a more specific search set which has been fully accounted for in the relevant review sections (Included studies; Excluded studies; Studies awaiting classification; Ongoing studies).
In addition, we searched ClinicalTrials.gov and the WHO International Clinical Trials Registry Platform (ICTRP) (1 November 2016) for unpublished, planned and ongoing trial reports using the search methods in Appendix 1.
Searching other resources
We searched the reference lists of retrieved studies.
We did not apply any language or date restrictions.
Data collection and analysis
The following Methods section of this review is based on a standard template used by Cochrane Pregnancy and Childbirth.
Selection of studies
Two review authors independently assessed for inclusion all the studies we identified as a result of the search strategy. We resolved any disagreement through discussion or consulted a third review author.
We created a study flow diagram to map out the number of records identified, included and excluded (see Figure 1).
Data extraction and management
We designed a form to extract the data, used by two review authors for eligible studies. We resolved discrepancies through discussion or, if required, consulted a third member of the review team. We entered data into Review Manager 5 software (RevMan 2014) and checked them for accuracy. When information regarding any of the above was unclear, we attempted to contact authors of the original reports to provide further details.
Assessment of risk of bias in included studies
Two review authors independently assessed risks of bias for each study using the criteria outlined in the Cochrane Handbook for Systematic Reviews of Interventions (Higgins 2011). We resolved any disagreement by discussion or by involving a third assessor.
(1) Random sequence generation (checking for possible selection bias)
We described the method used to generate the allocation sequence in sufficient detail to allow an assessment of whether it should produce comparable groups.
For each included study we assessed the method as being at:
-
low risk of bias (any truly random process, e.g. random number table; computer random‐number generator);
-
high risk of bias (any non‐random process, e.g. odd or even date of birth; hospital or clinic record number);
-
unclear risk of bias.
(2) Allocation concealment (checking for possible selection bias)
For each included study we described the method used to conceal allocation to interventions prior to assignment and assessed whether intervention allocation could have been foreseen in advance of or during recruitment, or changed after assignment.
We assessed the methods as being at:
-
low risk of bias (e.g. telephone or central randomisation; consecutively‐numbered sealed opaque envelopes);
-
high risk of bias (open random allocation; unsealed or non‐opaque envelopes; alternation; date of birth);
-
unclear risk of bias.
(3.1) Blinding of participants and personnel (checking for possible performance bias)
For each included study we described the methods used, if any, to blind study participants and personnel from knowledge of which intervention a participant received. We considered that studies were at low risk of bias if they were blinded, or if we judged that the lack of blinding was unlikely to affect results. We assessed blinding separately for different outcomes or classes of outcomes.
We assessed the methods as being at:
-
low, high or unclear risk of bias for participants;
-
low, high or unclear risk of bias for personnel.
(3.2) Blinding of outcome assessment (checking for possible detection bias)
For each included study we described the methods used, if any, to blind outcome assessors from knowledge of which intervention a participant received. We assessed blinding separately for different outcomes or classes of outcomes.
We assessed methods used to blind outcome assessment as being at:
-
low, high or unclear risk of bias.
(4) Incomplete outcome data (checking for possible attrition bias due to the amount, nature and handling of incomplete outcome data)
For each included study, and for each outcome or class of outcomes, we described the completeness of data including attrition and exclusions from the analysis. We stated whether attrition and exclusions were reported and the numbers included in the analysis at each stage (compared with the total randomised participants), reasons for attrition or exclusion where reported, and whether missing data were balanced across groups or were related to outcomes. Where sufficient information was reported, or could be supplied by the trial authors, we planned to re‐include missing data in the analyses that we undertook.
We assessed methods as being at:
-
low risk of bias (e.g. no missing outcome data; missing outcome data balanced across groups);
-
high risk of bias (e.g. numbers or reasons for missing data imbalanced across groups; ‘as treated’ analysis done with substantial departure of intervention received from that assigned at randomisation);
-
unclear risk of bias.
(5) Selective reporting (checking for reporting bias)
For each included study we described how we investigated the possibility of selective outcome reporting bias and what we found.
We assessed the methods as being at:
-
low risk of bias (where it was clear that all of the study’s prespecified outcomes and all expected outcomes of interest to the review have been reported);
-
high risk of bias (where not all the study’s prespecified outcomes were reported; one or more reported primary outcomes were not prespecified; outcomes of interest were reported incompletely and so could not be used; study failed to include results of a key outcome that would have been expected to have been reported);
-
unclear risk of bias.
(6) Other bias (checking for bias due to problems not covered by (1) to (5) above)
For each included study we described any important concerns we had about other possible sources of bias.
We assessed whether each study was free of other problems that could put it at risk of bias:
-
low risk of other bias;
-
high risk of other bias;
-
unclear whether there is risk of other bias.
(7) Overall risk of bias
We made explicit judgements about whether studies were at high risk of bias, according to the criteria given in the Cochrane Handbook for Systematic Reviews of Interventions (Higgins 2011). With reference to (1) to (6) above, we planned to assess the likely magnitude and direction of the bias and whether we considered it was likely to have an impact on the findings. In future updates, we will explore the impact of the level of bias through undertaking sensitivity analyses (Sensitivity analysis).
Assessment of the quality of the evidence using GRADE
We assessed the overall quality of the evidence using the GRADE approach, as outlined in the GRADE handbook for the main comparison: administration of progesterone by any route for the prevention of preterm birth compared with placebo or no treatment.
We assessed the quality of the evidence for the following outcomes:
-
Perinatal mortality
-
Preterm birth (less than 34 weeks' gestation)
-
Major neurodevelopmental disability at childhood follow‐up
-
Infant birthweight less than 2500 g
-
Preterm birth less than 37 weeks
-
Preterm birth less than 28 weeks
We used the GRADEpro Guideline Development Tool to import data from Review Manager 5 (RevMan 2014) in order to create ’Summary of findings’ tables. We produced a summary of the intervention effect and a measure of quality for each of the above outcomes using GRADE methodology. The GRADE approach uses five considerations (study limitations, consistency of effect, imprecision, indirectness and publication bias) to assess the quality of the body of evidence for each outcome. The evidence can be downgraded from 'high quality' by one level for serious (or by two levels for very serious) limitations, depending on assessments of risk of bias, indirectness of evidence, serious inconsistency, imprecision of effect estimates or potential publication bias.
Measures of treatment effect
Dichotomous data
For dichotomous data, we present results as a summary risk ratio (RR) with a 95% confidence interval (CI).
Continuous data
For continuous data, we have used the mean difference (MD) if outcomes were measured in the same way between trials. We planned to use the standardised mean difference (SMD) to combine trials that measure the same outcome, but use different methods.
Unit of analysis issues
Cluster‐randomised trials
There were no cluster‐randomised trials identified during the search. In future updates of this review, we will include cluster‐randomised trials in the analyses along with individually‐randomised trials. We plan to adjust their sample sizes using the methods described in the Handbook using an estimate of the intracluster correlation co‐efficient (ICC) derived from the trial (if possible), from a similar trial or from a study of a similar population. If we use ICCs from other sources, we will report this and conduct sensitivity analyses to investigate the effect of variation in the ICC. If we identify both cluster‐randomised trials and individually‐randomised trials, we plan to synthesise the relevant information. We will consider it reasonable to combine the results from both if there is little heterogeneity between the study designs and we consider the interaction between the effect of intervention and the choice of randomisation unit to be unlikely.
We will also acknowledge heterogeneity in the randomisation unit and perform a sensitivity analysis to investigate the effects of the randomisation unit.
Multiple pregnancy
Special methods are needed when carrying out analysis of outcomes for babies from multiple pregnancies (Gates 2004). Outcomes in babies from multiple pregnancies are not independent. For many outcomes there will be a higher correlation between babies from the same pregnancy than between babies from different pregnancies. The degree of non‐independence of outcomes for babies from multiple pregnancies will vary considerably, depending on the outcome and the type of multiple pregnancy; for some outcomes an adverse event in one twin will almost invariably be associated with the same event in the other (e.g. preterm birth); for other outcomes the degree of correlation will be lower (e.g. fetal death), but still higher than for babies from different pregnancies. In view of this non‐independence, we treated babies from the same pregnancy as clusters and adjusted the data. We planned to obtain ICCs from the trials, or use ICCs from similar studies. However, published ICCs for multiple pregnancies were not available. We therefore estimated ICCs (based on clinical knowledge and data from observational studies) and carried out sensitivity analysis. We tested the effect of using two extremes of ICC. The first assumed complete dependence between twin infants; effectively we divided the number of events and the sample size by two (i.e. to reduce the sample size to the number of women rather than the number of infants). A second sensitivity analysis imagined a very low rate of dependence (1%) between twins; for this analysis we adjusted the events and sample sizes by dividing each by 1.01.
Cross‐over trials
Cross‐over trials are not a suitable design for this type of intervention and have not been included.
Dealing with missing data
For included studies, we have noted levels of attrition. If sufficient data had been available, we would have explored the impact of including studies with high levels of missing data in the overall assessment of treatment effect by using sensitivity analysis.
For all outcomes, we carried out analyses, as far as possible, on an intention‐to‐treat basis, i.e. we attempted to include all participants randomised to each group in the analyses, and analysed all participants in the group to which they were allocated, regardless of whether or not they received the allocated intervention. The denominator for each outcome in each trial was the number randomised minus any participants whose outcomes are known to be missing.
Assessment of heterogeneity
We assessed statistical heterogeneity in each meta‐analysis using the Tau2, I2 and Chi2 statistics. We regarded heterogeneity as substantial if the I2 was greater than 30% and either the Tau2 was greater than zero, or there was a low P value (less than 0.10) in the Chi2 test for heterogeneity.
Assessment of reporting biases
In future updates, if there are 10 or more studies in the meta‐analysis, we will investigate reporting biases (such as publication bias) using funnel plots. We will assess funnel plot asymmetry visually. If asymmetry is suggested by a visual assessment, we will seek statistical advice on further analysis. We will also report whether the trial was prospectively registered and check that outcomes in the trial registration and subsequent publications are the same.
Data synthesis
We carried out statistical analysis using Review Manager 5 software (RevMan 2014). We used fixed‐effect meta‐analysis for combining data where it was reasonable to assume that studies were estimating the same underlying treatment effect, i.e. where trials were examining the same intervention, and we judged the trials’ populations and methods to be sufficiently similar. If there was clinical heterogeneity sufficient to expect that the underlying treatment effects differed between trials, or if we found substantial statistical heterogeneity, we used random‐effects meta‐analysis to produce an overall summary, if we considered an average treatment effect across trials clinically meaningful. We treated the random‐effects summary as the average of the range of possible treatment effects and we have discussed the clinical implications of treatment effects differing between trials. If the average treatment effect was not clinically meaningful, we did not combine trials.
Where we used random‐effects analyses, the results are presented as the average treatment effect with a 95% confidence interval, and the estimates of Tau2 and I2.
Subgroup analysis and investigation of heterogeneity
Where we identified substantial heterogeneity, we investigated it using subgroup analyses and sensitivity analyses. We considered whether an overall summary was meaningful, and if it was, used random‐effects analysis to produce it.
We carried out, where possible, the following subgroup analyses:
-
Time of treatment beginning (before 20 weeks' gestation versus after 20 weeks' gestation)
-
Different dosage regimens (divided arbitrarily into a cumulative dose of less than 500 mg per week versus a dose greater than or equal to 500 mg per week)
We used the following outcomes, where possible, in subgroup analysis:
-
Perinatal mortality
-
Preterm birth (less than 34 weeks' gestation)
-
Major neurodevelopmental disability at childhood follow‐up
We assessed subgroup differences by interaction tests available within Review Manager 5 (RevMan 2014). We reported the results of subgroup analyses quoting the Chi2 statistic and P value, and the interaction test I2 value.
Sensitivity analysis
For perinatal death we carried out sensitivity analysis by testing the effect of using two extremes of ICC. The first assumed complete dependence between twin infants; effectively we divided all events and the sample size by two to reduce the sample size to the number of women rather than the number of infants. A second sensitivity analysis assumed a very low rate of dependence (1%) between twins; for this analysis we adjusted the events and sample sizes by dividing each by 1.01.
For our primary outcomes we planned to carry out sensitivity analysis examining the impact of risk of bias on results; studies that were at high risk of bias due to high sample attrition (> 20% at childhood follow‐up) were to be temporarily excluded from the analysis. Where we have conducted this sensitivity analysis, we have reported the result in the text for our primary analysis in Comparison 1.
Results
Description of studies
Results of the search
See: Figure 1.
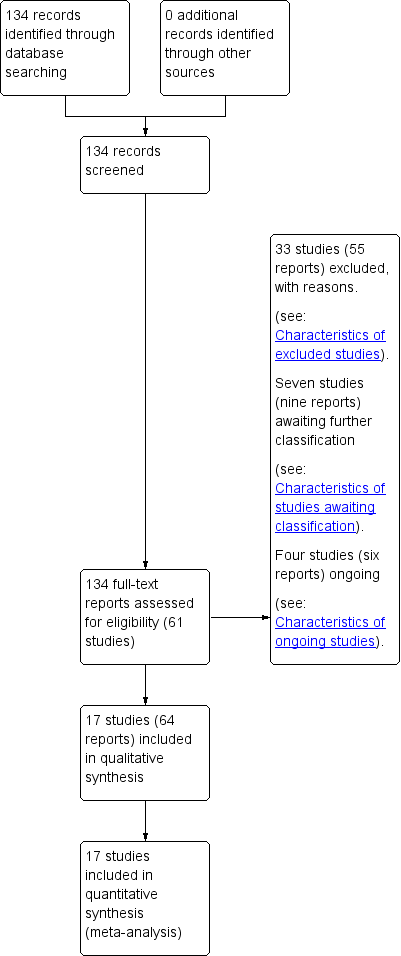
Study flow diagram.
Our search strategy identified 61 studies for consideration (some studies published multiple reports). We include 17 randomised trials in this review (Aboulghar 2012; Awwad 2015; Briery 2009; Brizot 2015; Caritis 2009; Cetingoz 2011; Combs 2010; Combs 2011; El‐Refaie 2016; Hartikainen‐Sorri 1980; Lim 2011; Norman 2009; Rode 2011; Rouse 2007; Senat 2013; Serra 2013; Wood 2012). We excluded 33 studies, seven are awaiting further assessment and four studies are ongoing.
Included studies
Design
All 17 randomised trials included in this review were placebo‐controlled and double‐blind, with the exception of two unblinded studies (El‐Refaie 2016; Senat 2013). All trials compared progesterone with placebo or no treatment; Serra 2013 conducted a three‐arm trial comparing two different doses of progesterone with placebo.
Sample sizes
Seventeen included trials randomised 4773 women with a multiple pregnancy. Sample sizes from the individual trials ranged from n = 30 (Briery 2009) to n = 677 (Rode 2011), with a median of n = 225 participants.
Setting
Trials took place in hospital clinics in the following countries: Austria, Brazil, Canada, Denmark, Egypt (two), Finland, France, Lebanon, Netherlands, Spain, Turkey, the UK and the USA (five). One trial took place in Austria and Denmark (Rode 2011). Several additional trials were conducted at multiple sites (Caritis 2009; Combs 2011; Lim 2011; Norman 2009; Rode 2011; Rouse 2007; Senat 2013; Wood 2012). Women receiving intramuscular (IM) injections often had these administered weekly following presentation to an antenatal clinic. Women allocated to daily progesterone suppositories or gels often self‐administered this medication at home.
Dates of trials, funding and conflicts of interest
Women were recruited to trials between 2004 to 2011, except for El‐Refaie 2016, when recruitment was at a later date (2012 to 2014), and in Briery 2009 and Hartikainen‐Sorri 1980, where dates of recruitment were not clear.
Four trials did not report whether or not trialists had any conflicts of interest (Cetingoz 2011; Combs 2010; Combs 2011; Hartikainen‐Sorri 1980). All remaining trials reported that there were no conflicts of interest.
Funding sources were not reported in four trials (Aboulghar 2012; Brizot 2015; Cetingoz 2011; Hartikainen‐Sorri 1980). Briery 2009 and Wood 2012 reported that pharmaceutical companies had supplied the study drugs, and Combs 2010, Combs 2011, and Serra 2013 appeared to be supported by grants from pharmaceutical companies. All remaining trials appeared to be funded by grants from university or government research funds.
Participants
One trial recruited only women with a triplet pregnancy (Combs 2010). Women with a triplet pregnancy were also eligible for inclusion in Caritis 2009, Lim 2011 and Wood 2012. All remaining trials were of women with a twin pregnancy. Most studies involving women with a twin pregnancy specifically excluded monochorionic twins or women at risk of twin‐transfusion syndrome. However, Lim 2011 included some women with a monochorionic twin pregnancy. Most trials excluded pregnant women with medical conditions, ruptured membranes, the presence of a cervical cerclage, or women who presented with symptoms or signs of labour. All trials excluded pregnant women where a fetal anomaly had been identified.
Assessment of risk of preterm birth varied across trials. Aboulghar 2012 recruited women who conceived following assisted reproduction (predominantly through IVF or ICSI). Cetingoz 2011 recruited pregnant women with a history of one previous spontaneous preterm birth. El‐Refaie 2016 recruited pregnant women with an ultrasound‐identified short cervix (defined as < 25 mm) between 20 and 24 weeks' gestation; approximately 24% of women in this trial had also had a previous preterm birth. Senat 2013 recruited women with an ultrasound‐identified short cervix (defined as < 25 mm), between 24 and 31 weeks' gestation. In contrast, Lim 2011 excluded women with a previous spontaneous preterm birth prior to 34 weeks' gestation, and Brizot 2015 recruited only women who conceived twins spontaneously, and with no history of preterm birth before 37 weeks.
Gestational age at the time of trial entry varied across the included trials. Awwad 2015, Caritis 2009, Lim 2011, Rouse 2007 and Wood 2012 all randomised women at between 16 and 20 weeks' gestation. Combs 2010 randomised women between 16 and 22 weeks, while Combs 2011 included women between 15 and 23 weeks' gestation. Aboulghar 2012, Cetingoz 2011, El‐Refaie 2016, Rode 2011 and Serra 2013 included pregnant women from between 18 or 20 weeks' and 24 weeks' gestation. The remaining trials randomised pregnant women at later gestational ages: Briery 2009 between 20 and 30 weeks; Cetingoz 2011 between 24 and 34 weeks; Senat 2013 between 24 and 31 weeks; Hartikainen‐Sorri 1980 between 28 and 37 weeks; and Norman 2009 between 24 and 34 weeks' gestation.
Interventions and comparisons
Vaginal progesterone
Eight trials (Aboulghar 2012; Brizot 2015; Cetingoz 2011; El‐Refaie 2016; Norman 2009; Rode 2011; Serra 2013; Wood 2012) evaluated vaginal progesterone suppositories, ovules or gel. Daily doses ranged from 90 mg per day (Norman 2009; Wood 2012) up to 400 mg per day (Aboulghar 2012; El‐Refaie 2016).
IM progesterone
Nine trials (Awwad 2015; Briery 2009; Caritis 2009; Combs 2010; Combs 2011; Hartikainen‐Sorri 1980; Lim 2011; Rouse 2007; Senat 2013) evaluated weekly IM injection of 17‐hydroxyprogesterone caproate. All used a single weekly dose of 250 mg, with the exception of Senat 2013, which used twice‐weekly administration of 500 mg.
Outcomes
All included trials contributed data to the meta‐analyses of the prespecified outcomes in the review.
Reporting of the primary outcome varied across the individual trials, although most identified preterm birth prior to 34 weeks (Aboulghar 2012; Brizot 2015; Cetingoz 2011; Combs 2011; El‐Refaie 2016; Rode 2011; Senat 2013; Serra 2013), 35 weeks (Briery 2009; Caritis 2009), or 37 weeks gestation (Aboulghar 2012; Awwad 2015; Brizot 2015; Cetingoz 2011; Combs 2011; Lim 2011; Rode 2011; Rouse 2007; Senat 2013; Serra 2013; Wood 2012). Five trials used a composite primary outcome, including death or birth prior to 34 weeks' gestation (Norman 2009), death or birth prior to 35 weeks' gestation (Rouse 2007), or a composite of neonatal adverse outcomes (Combs 2010; Combs 2011; Lim 2011) (seeTable 1). Gestational age at birth was the primary outcome for three additional trials (Brizot 2015; Caritis 2009; Wood 2012), and one trial reported the interval from randomisation to birth (Senat 2013). The primary outcome for the trial by Hartikainen‐Sorri 1980 was unclear.
| Trial | Fetal death (FD) | Intrapartum death | Stillbirth | Neonatal death (NND) | Perinatal death (PND) | Included in Dodd 2013? | Decision for PND for multiples review? |
| ‐ | ‐ | ‐ | Reported as maternal outcome. From text appears as if at least one pregnancy affected by demise of both twins | ‐ | Yes | Cannot reliably convert maternal denominator for neonatal outcome. Data not included | |
| Yes | ‐ | ‐ | ‐ | Yes, as a baby outcome. | N/A | Include | |
| No death data | ‐ | ‐ | ‐ | ‐ | No PND reported | N/A | |
| No death data | ‐ | ‐ | ‐ | ‐ | No PND reported | N/A | |
| Fetal death reported as maternal outcome and only as a single co‐twin demise outcome. Unsure if any pregnancies where both twins died | ‐ | ‐ | Yes, as a baby outcome | Not reported. Cannot convert fetal death into a baby outcome because only reported if single twin demise likely to underestimate | Yes | Data not included. | |
| Reported as a maternal outcome and denominator not clear | ‐ | ‐ | Yes | No | No | No | |
| Yes. as maternal outcome but specifies only 1 twin affected in each of those pregnancies | ‐ | ‐ | Yes | In text | Yes | Yes | |
| ‐ | ‐ | ‐ | ‐ | Yes, as infant outcome | N/A | Yes | |
| ‐ | ‐ | Yes | Yes | Yes, as infant outcome | N/A | Yes | |
| ‐ | ‐ | ‐ | Yes | ‐ | No PND reported | N/A | |
| Combs 2010 triplets | ‐ | ‐ | ‐ | Yes | Yes | Yes | Yes |
| Combs 2011 twins | ‐ | ‐ | ‐ | Yes | Yes | Yes | Yes |
| ‐ | ‐ | ‐ | ‐ | Yes in text | Yes | Yes | |
| ‐ | 1 or more died during delivery after 24 wks and also any IUD before onset labour or onset delivery | Reported “all live births” | ‐ | No, and cannot be reliably added up from data presented | Yes | Data not included | |
| Yes | ‐ | ‐ | Yes | Yes, from text (not in table) | No ‐ not sure why data not included | Yes | |
| Yes | Yes | ‐ | Yes | Can add NND and FD (IP and IU); all Ns clear | No ‐ not sure why data not included | Yes. Extrapolated from text and checked | |
| Yes, as a maternal outcome | ‐ | ‐ | Yes | Cannot add FD and NND because FD reported as a maternal outcome | No | Data not included |
IP: intrapartum
IU: intra‐uterine
IUD: intra‐uterine death
N/A: not applicable
wk: week
Excluded studies
Most trials were excluded as they did not include women with a multiple pregnancy, or where the methodology adopted was clearly not randomised (e.g. secondary analysis or quasi‐randomisation). We also excluded trials if progesterone was intended as a tocolytic or used solely in the first trimester to prevent miscarriage. Please see the Excluded studies table for further details.
Risk of bias in included studies
Allocation
An adequate process of random sequence generation was described for most included trials, although risk of bias was unclear in the trial conducted by Hartikainen‐Sorri 1980. We rated allocation concealment at low risk of bias for all trials; trialists described using sealed opaque envelopes (Aboulghar 2012; Awwad 2015; Briery 2009; El‐Refaie 2016), a centralised allocation process (Cetingoz 2011; Senat 2013), or the use of identical‐appearing treatment packs (Brizot 2015; Caritis 2009; Combs 2010; Combs 2011; Hartikainen‐Sorri 1980; Lim 2011; Norman 2009; Rode 2011; Rouse 2007; Serra 2013; Wood 2012) to conceal allocation.
Blinding
Most of the trials were placebo‐controlled and we assessed them at low risk of performance and outcome detection bias. Blinding of participants, caregivers and staff was not achieved in El‐Refaie 2016 and Senat 2013, and was unclear for Hartikainen‐Sorri 1980. Blinding of outcome assessors was unclear in El‐Refaie 2016, Hartikainen‐Sorri 1980, and Senat 2013.
Incomplete outcome data
There were 10% or less missing outcome data for most of the included trials (Aboulghar 2012; Awwad 2015; Briery 2009; Caritis 2009; Cetingoz 2011; Combs 2010; Combs 2011; Hartikainen‐Sorri 1980; Lim 2011; Norman 2009; Rode 2011; Rouse 2007; Senat 2013; Serra 2013; Wood 2012). Missing outcome data were 10.4% in El‐Refaie 2016, and more than 20% in Brizot 2015.
Selective reporting
We judged six trials (Aboulghar 2012 ; Briery 2009; Cetingoz 2011; Combs 2011; El‐Refaie 2016; Hartikainen‐Sorri 1980) to be at high risk of selective outcome reporting, as the study was either registered retrospectively (Aboulghar 2012; El‐Refaie 2016) or was not registered and did not have a published protocol (Briery 2009; Cetingoz 2011; Combs 2011; Hartikainen‐Sorri 1980). We rated Serra 2013 at unclear risk and the remaining trials at low risk of bias for this domain.
Other potential sources of bias
There was no clear evidence of other potential sources of bias, although some trials provided limited information on methods.
See Figure 2 for an overall summary of risk of bias assessments.
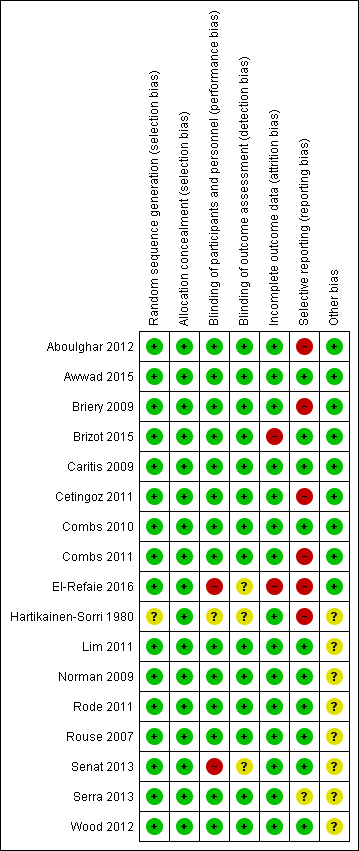
Risk of bias summary: review authors' judgements about each risk of bias item for each included study.
Effects of interventions
See: Summary of findings for the main comparison Intramuscular (IM) progesterone compared to no treatment or placebo for preventing spontaneous preterm birth in women with a multiple pregnancy; Summary of findings 2 Vaginal progesterone compared to no treatment or placebo for preventing spontaneous preterm birth in women with a multiple pregnancy
For a summary of main findings with an assessment of the quality of the evidence for key outcomes for the main comparisons (1) IM progesterone versus placebo or no treatment, and (2) vaginal progesterone versus placebo or no treatment, please seesummary of findings Table for the main comparison and summary of findings Table 2.
Outcomes are presented for the following comparisons.
-
IM progesterone versus placebo (subgroup by weekly dose and subgroup by timing of start of therapy)
-
Vaginal progesterone versus placebo (subgroup by weekly dose and subgroup by timing of start of therapy)
-
IM progesterone versus no treatment (multiple pregnancy and short cervix)
-
Vaginal progesterone versus placebo (multiple pregnancy and short cervix)
-
Vaginal progesterone versus placebo (multiple pregnancy and other risk factor)
We report the results for each subgroup. Where there is evidence of subgroup differences, we report the results of the interaction tests and the effect estimates in subgroups.
Comparison 1: Intramuscular (IM) progesterone versus placebo
Subgroup by weekly dose (≤ 250 mg per week OR > 250 mg per week)
Subgroup by timing of start of therapy (< 20 weeks versus > 20 weeks versus mixed gestational age)
Primary outcomes
1.1 Maternal mortality
There were no trials included in this review which reported maternal mortality.
1.2 Preterm birth less than 34 weeks
IM progesterone was associated with an increase in risk of preterm birth prior to 34 weeks' gestation (risk ratio (RR) 1.54, 95% confidence interval (CI) 1.06 to 2.26; women = 399; studies = 2; I2 = 0%; Analysis 1.1, low‐quality evidence) when compared with placebo or no treatment, reflecting the increased risk of preterm birth observed in Senat 2013, which used a higher weekly dose of 500 mg (RR 1.67, 95% CI 1.04 to 2.68; women = 161; studies = 1; Analysis 1.2). There were no clear group differences relating to the timing of the start of IM progesterone therapy for the risk of preterm birth before 34 weeks' gestation (test for subgroup differences: Chi2 = 0.24, df = 1 (P = 0.62), I2 = 0%; Analysis 1.3).
1.3 Perinatal death
There was no clear evidence that the use of IM progesterone was protective against perinatal death (average RR 1.45, 95% CI 0.60 to 3.51; infants = 3089; studies = 6; I2 = 71%; low‐quality evidence;Analysis 1.4) when compared with placebo or no treatment. Subgroup analysis by dose did not show a clear difference between high‐ and low‐dose subgroups; only one trial with a relatively small sample size used a higher weekly dose of progesterone (Senat 2013) Analysis 1.5) (test for subgroup differences: Chi2 = 3.29, df = 1 (P = 0.07), I2 = 69.6%). There were no apparent subgroup differences relating to the timing of the start of IM progesterone therapy and risk of perinatal death (test for subgroup differences: Chi2 = 2.26, df = 2 (P = 0.32), I2 = 11.6%; Analysis 1.6). (Sensitivity analysis assuming either complete dependence between multiples from the same pregnancy, or a low correlation between outcomes for multiples corresponded closely with the main analysis; Analysis 1.27; Analysis 1.28).
1.4 Major neurodevelopmental disability at childhood follow‐up
There were no trials included in this review which reported childhood neurodevelopmental outcome.
Secondary outcomes ‐ Maternal
Prelabour ruptured membranes
Women who received IM progesterone, placebo or no treatment had similar rates of prelabour ruptured membranes (RR 1.17, 95% CI 0.84 to 1.63; women = 1257; studies = 6; I2 = 0%; Analysis 1.7).
Preterm birth less than 37 weeks
Women who received IM progesterone, placebo or no treatment had similar rates of preterm birth before 37 weeks' gestation (RR 1.05, 95% CI 0.98 to 1.13; women = 2010; studies = 5; I2 = 0%; high‐quality evidence;Analysis 1.8).
Preterm birth less than 28 weeks
Women who received IM progesterone, placebo or no treatment had similar rates of risk of preterm birth before 28 weeks' gestation (RR 1.08, 95% CI 0.75 to 1.55; women = 1920; studies = 5; I2 = 0%; moderate‐quality evidence;Analysis 1.9).
Adverse drug reaction
There were no clear group differences between women who received IM progesterone and those women who did not, in the experience of adverse effects relating to drug administration (average RR 0.91, 95% CI 0.63 to 1.32; women = 1316; studies = 2; I2 = 81%; Analysis 1.10).
Caesarean birth
Women who received IM progesterone, placebo or no treatment had similar rates of caesarean birth (RR 1.01, 95% CI 0.95 to 1.08; women = 2222; studies = 7; I2 = 0%; Analysis 1.11).
Antenatal tocolysis
There were no clear differences between women who received IM progesterone and those women who did not, in their need for antenatal tocolysis (RR 0.97, 95% CI 0.85 to 1.10; women = 2218; studies = 7; I2 = 19%; Analysis 1.12).
Antenatal corticosteroids
There were no clear differences between women who received IM progesterone and those women who did not, in their need for antenatal corticosteroid administration (RR 0.99, 95% CI 0.88 to 1.11; women = 2221; studies = 7; I2 = 0%; Analysis 1.13).
Secondary outcomes ‐ Infant
Infant birthweight less than 2500 g
Infants born to women who received IM progesterone and those who did not had similar rates of birthweight less than 2500 g (average RR 0.99, 95% CI 0.90 to 1.08; infants = 4071; studies = 5; I2 = 76%; moderate‐quality evidence; Analysis 1.14).
Apgar score less than seven at five minutes of age
Infants born to women who received IM progesterone and those who did not had similar rates of Apgar score less than seven at five minutes of age (RR 0.89, 95% CI 0.68 to 1.15; infants = 3606; studies = 4; I2 = 0%; Analysis 1.15).
Neonatal sepsis
Infants born to women who received IM progesterone and those who did not had similar rates of neonatal sepsis (average RR 1.02, 95% CI 0.41 to 2.51; infants = 3327; studies = 6; I2 = 79%; Analysis 1.16).
Respiratory distress syndrome
Infants born to women who received IM progesterone and those who did not had similar rates of respiratory distress syndrome (average RR 1.07, 95% CI 0.85 to 1.34; participants = 4670; studies = 8; I² = 66%; Analysis 1.17).
Use of mechanical ventilation
Infants born to women who received IM progesterone and those who did not had similar rates of mechanical ventilation (average RR 0.90, 95% CI 0.69 to 1.17; infants = 2233; studies = 3; I2 = 43%; Analysis 1.18).
Intraventricular haemorrhage
There were no group differences between infants born to women who received IM progesterone and those who did not, for the risk of intraventricular haemorrhage (RR 1.98, 95% CI 0.36 to 10.77; infants = 1355; studies = 1; Analysis 1.19), reported in a single study only.
Retinopathy of prematurity
Infants born to women who received IM progesterone were at reduced risk of retinopathy of prematurity, although event rates were fairly low for this outcome (RR 0.34, 95% CI 0.16 to 0.74; infants = 2807; studies = 5; I2 = 0%; Analysis 1.20).
Chronic lung disease
There were no clear group difference between infants born to women who received IM progesterone and those who did not for the risk of chronic lung disease (average RR 1.91, 95% CI 0.13 to 27.80; infants = 681; studies = 2; I2 = 71%; Analysis 1.21).
Necrotising enterocolitis
There was no clear difference in the rate of necrotising enterocolitis comparing infants born to women who received IM progesterone and those who did not (RR 0.74, 95% CI 0.36 to 1.51; infants = 2610; studies = 5; I2 = 0%; Analysis 1.22).
Fetal death
There was no clear difference in the rate of fetal death comparing infants born to women who received IM progesterone and those who did not (average RR 0.93, 95% CI 0.39 to 2.20; infants = 3536; studies = 4; I2 = 56%; Analysis 1.23).
Neonatal death
There was no clear difference in the rate of neonatal death comparing infants born to women who received IM progesterone with those who did not (average RR 0.92, 95% CI 0.44 to 1.91; infants = 3399; studies = 7; I2 = 35%; Analysis 1.24).
Admission to neonatal intensive care unit
Infants born to women who received IM progesterone were more likely to require admission to the neonatal intensive care unit compared with infants born to women who did not (RR 1.33, 95% CI 1.13 to 1.58; infants = 1668; studies = 2; I2 = 0%; Analysis 1.25).
Patent ductus arteriosus
Infants born to women who received IM progesterone and those who did not had a similar rate of patent ductus arteriosus (average RR 0.90, 95% CI 0.37 to 2.21; infants = 2290; studies = 4; I2 = 74%; Analysis 1.26).
Secondary outcomes ‐ Child
None of the included studies evaluating IM progesterone reported childhood outcomes.
Comparison 2: Vaginal progesterone versus placebo
Subgroup by daily dose (≤ 200 mg per day versus > 200 mg per day)
Subgroup by timing of start of therapy (< 20 weeks versus > 20 weeks versus mixed gestational age)
Primary outcomes
2.1 Maternal mortality
There were no trials included in this review reporting maternal mortality.
2.2 Preterm birth less than 34 weeks
Women who received vaginal progesterone and those who did not had a similar risk of preterm birth before 34 weeks' gestation (average RR 0.83, 95% CI 0.63 to 1.09; women = 1727; studies = 6; I2 = 46%; low‐quality evidence, Analysis 2.1). We carried out subgroup analysis by higher and lower weekly dose (Analysis 2.2), with the subgroup interaction test suggesting no meaningful differences between subgroups (test for subgroup differences: Chi2 = 1.66, df = 1 (P = 0.20), I2 = 39.7%). Starting vaginal progesterone after 20 weeks' gestation was associated with a reduction in preterm birth before 34 weeks' gestation, compared with starting prior to 20 weeks' gestation, or at mixed gestational age (RR 0.69, 95% CI 0.30 to 1.58; women = 91; studies = 1; Analysis 2.3). However, although the interaction test suggested differences between subgroups, only one study contributed data to the 'before 20 weeks'' subgroup (test for subgroup differences: Chi2 = 7.02, df = 2 (P = 0.03), I2 = 71.5%).
2.3 Perinatal death
There was no clear evidence to suggest that the use of vaginal progesterone was protective against perinatal death (RR 1.23, 95% CI 0.74 to 2.06; infants = 2287; studies = 3; I² = 0%; low‐quality evidence;Analysis 2.4), with all studies reporting this outcome using a daily dose of vaginal progesterone of 200 mg or less. There was no evidence of a different effect relating to the timing of starting progesterone therapy (Analysis 2.6) (test for subgroup differences: Chi2 = 0.23, df = 2 (P = 0.89), I2 = 0%). Sensitivity analysis assuming either complete dependence between multiples from the same pregnancy, or a low correlation between outcomes for multiples corresponded closely with the main analysis; Analysis 2.27; Analysis 2.28).
2.4 Major neurodevelopmental disability at childhood follow‐up
There were no trials included in this review reporting childhood neurodevelopmental outcomes.
Secondary outcomes ‐ Maternal
Prelabour ruptured membranes
Women who received vaginal progesterone, placebo or no treatment had similar rates of prelabour ruptured membranes (RR 0.61, 95% CI 0.23 to 1.60; women = 514; studies = 2; I2 = 0%; Analysis 2.7).
Preterm birth less than 37 weeks
Women who received vaginal progesterone, placebo or no treatment had similar rates of preterm birth before 37 weeks' gestation (RR 0.97, 95% CI 0.89 to 1.06; women = 1597; studies = 6; I2 = 0%; moderate‐quality evidence;Analysis 2.8).
Preterm birth less than 28 weeks
Women who received vaginal progesterone, placebo or no treatment had similar rates of preterm birth before 28 weeks' gestation (RR 1.22, 95% CI 0.68 to 2.21; women = 1569; studies = 4; I2 = 0%; low‐quality evidence;Analysis 2.9).
Adverse drug reaction
There were no group differences in the reporting of adverse effects relating to drug administration between women who received vaginal progesterone and those who did not (RR 0.99, 95% CI 0.90 to 1.09; women = 562; studies = 2; I2 = 16%; Analysis 2.10).
Caesarean birth
Women who received vaginal progesterone were less likely to give birth by caesarean section compared with women who did not (RR 0.93, 95% CI 0.88 to 0.98; women = 2143; studies = 6; I2 = 0%; Analysis 2.11).
Maternal satisfaction with therapy
There was one study that reported a similar degree of satisfaction between women who received vaginal progesterone and those who did not (mean difference (MD) 0.00, 95% CI ‐0.35 to 0.35; women = 494; studies = 1; Analysis 2.12; Norman 2009).
Antenatal tocolysis
Women who received vaginal progesterone, placebo or no treatment had similar rates of antenatal tocolysis (RR 0.80, 95% CI 0.62 to 1.02; women = 1420; studies = 4; I2 = 0%; Analysis 2.13).
Antenatal corticosteroids
Women who received vaginal progesterone, placebo or no treatment had similar rates of antenatal corticosteroid administration (RR 0.87, 95% CI 0.71 to 1.06; women = 1422; studies = 4; I2 = 26%; Analysis 2.14).
Secondary outcomes ‐ Infant
Infant birthweight less than 2500 g
Infants born to women who received vaginal progesterone compared to those who did not had similar rates of birthweight less than 2500 g (average RR 0.95, 95% CI 0.88 to 1.03; infants = 3079; studies = 4; I2 = 49%; moderate‐quality evidence;Analysis 2.15).
Apgar score less than seven at five minutes of age
Infants born to women who received vaginal progesterone had similar rates of Apgar score less than seven at five minutes of age compared with those born to women who did not receive vaginal progesterone (RR 0.65, 95% CI 0.35 to 1.19; infants = 2410; studies = 3; I2 = 0%; Analysis 2.16).
Respiratory distress syndrome
There were no clear differences between infants born to women who received vaginal progesterone and those who did not, for risk of respiratory distress syndrome (average RR 0.84, 95% CI 0.64 to 1.10; infants = 2560; studies = 4; I2 = 59%; Analysis 2.17).
Use of mechanical ventilation
Infants born to women who received vaginal progesterone were less likely to require mechanical ventilation than infants born to women who did not (RR 0.61, 95% CI 0.48 to 0.77; infants = 3134; studies = 5; I2 = 0%; Analysis 2.18).
Intraventricular haemorrhage
Infants born to women who received vaginal progesterone compared to those who did not had similar rates of intraventricular haemorrhage (RR 1.70, 95% CI 0.62 to 4.66; infants = 1333; studies = 1; Analysis 2.19).
Retinopathy of prematurity
Infants born to women who received vaginal progesterone compared to those who did not had similar rates of retinopathy of prematurity (RR 1.07, 95% CI 0.45 to 2.54; infants = 1945; studies = 2; I2 = 0%; Analysis 2.20).
Necrotising enterocolitis
Infants born to women who received vaginal progesterone compared to those who did not had similar rates of necrotising enterocolitis (RR 0.52, 95% CI 0.13 to 2.06; infants = 2117; studies = 3; I2 = 0%; Analysis 2.21).
Neonatal sepsis
There were no clear differences between infants born to women who received vaginal progesterone and those who did not, for risk of neonatal sepsis (RR 1.41, 95% CI 0.86 to 2.33; infants = 1944; studies = 2; I2 = 19%; Analysis 2.22).
Fetal death
There were no clear differences in the rate of fetal death between infants born to women who received vaginal progesterone and those who did not (RR 1.38, 95% CI 0.65 to 2.90; participants = 2328; studies = 3; I2 = 0%; Analysis 2.23).
Neonatal death
There were no clear differences in the rate of neonatal death between infants born to women who received vaginal progesterone and those who did not (RR 1.53, 95% CI 0.75 to 3.15; infants = 2905; studies = 3; I2 = 0%; Analysis 2.24).
Admission to neonatal intensive care unit (NICU)
There were no clear differences between infants born to women who received vaginal progesterone and those did not, for admission to the neonatal intensive care unit (RR 0.93, 95% CI 0.87 to 1.00; infants = 4052; studies = 5; I2 = 25%; Analysis 2.25).
Patent ductus arteriosus
There were no clear differences between infants born to women who received vaginal progesterone for patent ductus arteriosus, compared with infants born to women who did not (RR 0.76, 95% CI 0.47 to 1.22; infants = 1946; studies = 2; I2 = 0%; Analysis 2.26).
Secondary outcomes ‐ Child
None of the included studies evaluating vaginal progesterone reported childhood outcomes.
Further analysis by indication
All of the trials included in this review recruited and reported results for women with multiple pregnancy. However, in some trials there were additional clinical indications for the administration of progesterone, such as short cervix, or trials included only women from a particular population subgroup, such as women undergoing IVF. We therefore looked separately at trials where there were other indications, in comparisons 3 to 5; as in the main analysis, we examined IM and vaginal progesterone administration in separate comparisons.
Comparison 3: IM progesterone versus no treatment: multiple pregnancy and short cervix
A single trial (Senat 2013) contributed data to this comparison. In Senat 2013 165 women with twin pregnancy and short cervix (25 mm or less) were recruited and treatment began at between 24 and 31+6 weeks' gestation; 500 mg of IM 17‐alpha‐hydroxyprogesterone caproate was administered twice weekly until 36 weeks or preterm delivery, whichever occurred first (high dose).
Preterm birth less than 34 weeks
IM progesterone appeared to increase the risk of preterm birth before 34 weeks, although 95% CIs were wide (RR 1.67, 95% CI 1.04 to 2.68; women = 161; studies = 1; Analysis 3.1).
Perinatal death
Perinatal death was also increased in the progesterone group in this trial with 9/164 and 1/166 deaths in the intervention and control groups respectively (RR 9.11, 95% CI 1.17 to 71.10; infants = 330; studies = 1; Analysis 3.2).
Prelabour rupture of the membranes
There was no clear difference in the risk of prelabour rupture of the membranes between the women who received progesterone compared with women who received placebo (RR 1.14, 95% CI 0.63 to 2.06; women = 161; studies = 1; Analysis 3.3).
Preterm birth less than 37 weeks
Women who received IM progesterone had similar rates of preterm birth before 37 weeks' gestation compared with women who received placebo (RR 1.06, 95% CI 0.90 to 1.25; women = 161; studies = 1; Analysis 3.4).
Caesarean section
Women who received IM progesterone had similar rates of caesarean birth compared with women who received placebo (RR 1.14, 95% CI 0.88 to 1.49; women = 161; studies = 1; Analysis 3.5).
Antenatal tocolysis
There was no clear difference in the numbers of women who required antenatal tocolysis between those who received IM progesterone compared with those who did not (RR 1.36, 95% CI 0.76 to 2.45; women = 158; studies = 1; Analysis 3.6).
Antenatal corticosteroids
There was no clear difference in the numbers of women who required antenatal corticosteroids between those who received IM progesterone compared with those who did not (RR 0.93, 95% CI 0.64 to 1.36; women = 159; studies = 1; Analysis 3.7).
Neonatal sepsis
Infants born to women who received progesterone had a similar incidence of sepsis to infants of women who did not receive progesterone (RR 5.03, 95% CI 0.60 to 42.57; infants = 303; studies = 1; Analysis 3.8).
Respiratory distress syndrome
Infants born to women who received progesterone were slightly more likely to have respiratory distress syndrome compared with infants of women who did not receive progesterone (RR 1.46, 95% CI 1.00 to 2.12; infants = 309; studies = 1; Analysis 3.9).
Retinopathy of prematurity
There was no clear difference in the number of infants with retinopathy of prematurity when comparing infants of women who received progesterone with infants of women who did not (RR 0.20, 95% CI 0.01 to 4.19); infants = 302; studies = 1; Analysis 3.10).
Neonatal death
There was no clear difference in the risk of death in the neonatal period for infants of women who received progesterone compared with infants of women who did not (RR 4.03, 95% CI 0.46 to 35.61; infants = 307; studies = 1; Analysis 3.11).
Admission to neonatal intensive care unit
There were more infants of women who received progesterone admitted to the neonatal intensive care unit compared with infants of women who did not receive progesterone (RR 1.34, 95% CI 1.04 to 1.74; infants = 313; studies = 1; Analysis 3.12).
For perinatal death we carried out sensitivity analyses assuming total dependence and low dependence of outcomes for babies from the same pregnancy. If total dependence is assumed (i.e. all babies from the same pregnancy either survive or die) the evidence of a difference between groups for perinatal death was no longer statistically significant (RR 5.06, 95% CI 0.60 to 42.38; Analysis 3.14).
Comparison 4: Vaginal progesterone versus no treatment: multiple pregnancy and short cervix.
A single study (El‐Refaie 2016) recruiting 225 women with multiple pregnancy and short cervix contributed data to this comparison. In this study the intervention group received vaginal progesterone suppositories (400 mg daily, high dose) starting at 20 to 24 weeks' gestation until 37 weeks, while women in the control group received standard antenatal care.
For our primary outcomes, maternal and perinatal mortality were not reported.
Preterm birth less than 34 weeks
For women receiving vaginal progesterone, there appeared to be a decrease in the risk of preterm birth before 34 weeks compared with women who received placebo (RR 0.67, 95% CI 0.49 to 0.91: women = 224; studies = 1; Analysis 4.1).
Prelabour rupture of the membranes
There was no clear difference in the risk of prelabour rupture of the membranes between the women who received progesterone compared with women who received placebo (RR 0.47, 95% CI 0.12 to 1.82; women = 224; studies = 1; Analysis 4.2).
Preterm birth less than 28 weeks
Women who received vaginal progesterone had similar rates of preterm birth before 28 weeks' gestation compared with women who received placebo (RR 0.37, 95% CI 0.07 to 1.88; women = 224; studies = 1; Analysis 4.3).
Caesarean section
Women who received vaginal progesterone had similar rates of caesarean birth compared with women who did not receive progesterone (RR 0.99, 95% CI 0.89 to 1.11; women = 224; studies = 1; Analysis 4.4).
Infant birthweight less than 2500 g
There was no clear difference in the risk of infant birthweight less than 2500 g between infants of women who received vaginal progesterone and infants of those who did not (RR 0.94, 95% CI 0.85 to 1.04; infants = 439; studies = 1; Analysis 4.5).
Respiratory distress syndrome
Infants born to women who received vaginal progesterone were less likely to have respiratory distress syndrome compared with infants of those who did not receive progesterone (RR 0.68, 95% CI 0.55 to 0.84; infants = 439; studies = 1; Analysis 4.6).
Use of mechanical ventilation
Infants born to women who received vaginal progesterone were less likely to require mechanical ventilation compared with infants of those who did not receive progesterone (RR 0.47, 95% CI 0.32 to 0.69; infants = 439; studies = 1; Analysis 4.7).
Admission to neonatal intensive care unit
There were no clear differences in the number of infants admitted to intensive care between infants of women who received vaginal progesterone and infants of those who did not (RR 0.91, 95% CI 0.82 to 1.01; infants = 439; studies = 1; Analysis 4.8).
Comparison 5: Vaginal progesterone versus placebo: multiple pregnancy with another risk factor
Two studies are included in this comparison. Aboulghar 2012 included 313 women at high risk of preterm birth, including 91 with twin pregnancy, with pregnancies conceived by IVF or ICSI. Women in the intervention group received vaginal progesterone 200 mg twice daily from randomisation until delivery or 37 weeks’ gestation, while controls received placebo. Cetingoz 2011 recruited women with twin pregnancies with other risk factors (previous history of preterm birth or uterine malformation or both (results not separated)). Women in the intervention group received micronised progesterone (100 mg) administered daily by vaginal suppository between 24 and 34 weeks of gestation; controls received placebo.
Only two of our prespecified outcomes were reported in these studies: preterm birth at less than 34 and 37 weeks. There were no clear differences between groups in these studies, either individually or pooled, for either of these outcomes (preterm birth less than 34 weeks: RR 0.57, 95% CI 0.29 to 1.10; preterm birth less than 37 weeks: RR 0.92, 95% CI 0.72 to 1.18).
Discussion
Summary of main results
Seventeen studies met our criteria for inclusion in the review; all of the identified trials contributed data to the analyses, with a combined sample size of 4773 women. Studies examined two main comparisons: intramuscular (IM) or vaginal progesterone versus placebo or no treatment. We also examined outcomes in women with additional risk factors for preterm birth, including short cervical length measured by ultrasound, and other risk factors.
Overall across all comparisons, there were few clear differences between women receiving progesterone and women in the control groups, reflecting in part the small number of studies contributing data.
In studies where women received IM progesterone compared with placebo, more women gave birth before the 34th week of pregnancy in the progesterone group than in the placebo group (low‐quality evidence). There was no clear difference in the incidence of perinatal death between the groups (low‐quality evidence). No studies reported whether any women died or whether the babies had longer‐term developmental problems or disability. There were no clear differences between women receiving progesterone or placebo for other important outcomes such as preterm birth less than 37 weeks (high‐quality evidence); preterm birth less than 28 weeks (moderate‐quality evidence) or infant birthweight less than 2500 g (moderate‐quality evidence). None of the prespecified childhood outcomes were reported in the trials.
In studies where women received vaginal progesterone there were no clear differences between women receiving progesterone or placebo in preterm birth less than 34 weeks (low‐quality evidence). Although there seemed to be fewer births before 34 weeks in the progesterone group, this finding may have occurred by chance. Incidence of perinatal death was similar in both groups (low‐quality evidence). No studies reported maternal death or longer‐term outcomes in the babies. There were no clear differences between groups receiving vaginal progesterone versus placebo in any other important outcomes (preterm birth less than 37 weeks (moderate‐quality evidence); preterm birth less than 28 weeks (low‐quality evidence); infant birthweight less than 2500 g (moderate‐quality evidence)). None of the prespecified childhood outcomes were reported in the trials. For other outcomes, there were no clear group differences found except for caesarean section, where women who received vaginal progesterone did not have as many caesarean sections as those in the placebo group, although the difference between groups was not large (7%). Fewer infants whose mothers had received vaginal progesterone needed mechanical ventilation.
In summary, for women with a multiple pregnancy, IM progesterone was associated with an increase in the risk of preterm birth prior to 34 weeks' gestation when compared to placebo or no treatment. For this comparison, where data were present (for secondary maternal and infant outcomes), there were no other differences identified. Vaginal progesterone was associated with similar risks of all relevant outcomes when compared with placebo or no treatment.
For women with a multiple pregnancy and a short cervix, IM progesterone was associated with an apparent increase in the risk of preterm birth at less than 34 weeks, perinatal death and neonatal intensive care unit admission. In contrast, however, for women with a multiple pregnancy and a short cervix who received vaginal progesterone therapy, there appeared to be a reduced risk of preterm birth before 34 weeks, and a reduction in the risk of respiratory distress syndrome. However, these findings should be interpreted with considerable caution, based as they are on a single trial in each case.
Long‐term follow‐up was lacking in most of the included trials, and will be necessary to inform any impact on outcomes beyond the immediate neonatal period.
Overall completeness and applicability of evidence
The applicability of findings from this systematic review and meta‐analysis in women with a multiple pregnancy is broadly consistent with the findings reported in an individual participant data meta‐analysis (IPD‐MA) (Schuit 2014). This individual participant review included data from 13 randomised trials, involving 3768 women and 7536 infants, where women were administered either IM or vaginal progesterone, or placebo. Overall, progesterone administration was not associated with any improvements in infant outcomes or reduction in the risk of preterm birth (Schuit 2014).
Outcomes for women with a triplet pregnancy remain under‐represented in this systematic review. Women with a triplet pregnancy were recruited exclusively in a single trial (Combs 2010). While three trials (Caritis 2009; Lim 2011; Wood 2012) included women with both a twin or a triplet pregnancy, outcome data were not reported separately according to plurality of the pregnancy, precluding further detailed assessment of the role of progesterone in this setting.
An IPD‐MA has been performed in women with a triplet pregnancy, who received IM 17‐hydroxyprogesterone caproate or placebo (Combs 2016). This IPD‐MA sourced data from three trials (Caritis 2009; Combs 2010; Lim 2011), involving 232 women and 969 infants. Findings from this analysis did not indicate any beneficial effect of IM progesterone for risk of preterm birth prior to 34 (IM progesterone 86/136 (63%) versus placebo 64/96 (67%); risk ratio (RR) 0.95, 95% confidence interval (CI) 0.78 to 1.2) or 28 weeks' gestation (IM progesterone 15/136 (11%) versus placebo 12/96 (12%); RR 0.88, 95% CI 0.43 to 1.8), or in the occurrence of an adverse perinatal composite outcome comprising perinatal death, respiratory distress syndrome, bronchopulmonary dysplasia, intraventricular haemorrhage, necrotising enterocolitis or neonatal sepsis (IM progesterone 140/408 (34%) versus placebo 101/288 (35%); RR 0.98, 95% CI 0.79 to 1.2) (Combs 2016).
It was difficult to assess any additional contribution to the risk of preterm birth for women with a multiple pregnancy, due to the presence of further clinical risk factors, reflecting variable reporting in the original trials. A single trial (Senat 2013) specifically recruited women with a multiple pregnancy and a short cervical length identified by ultrasound assessment (less than 25 mm). While other trials included women with a short cervical length (El‐Refaie 2016) or the presence of a cervical cerclage (Brizot 2015), most trials specifically excluded women with evidence of cervical dilatation, or planned or current placement of a cervical suture (Awwad 2015; Briery 2009; Caritis 2009; Cetingoz 2011; Combs 2010; El‐Refaie 2016; Lim 2011; Norman 2009; Rouse 2007; Serra 2013). Furthermore, El‐Refaie 2016 did not specifically present data according cervical length at trial entry.
The IPD‐MA by Schuit 2014, while identifying no apparent benefit following progesterone therapy overall, did identify a suggestion of benefit from the subgroup of women with a multiple pregnancy and cervical length below 25 mm on ultrasound examination at the time of randomisation following vaginal progesterone administration, with a reduction in the risk of adverse perinatal outcome (vaginal progesterone 15/56 versus placebo 22/60; RR 0.57, 95% CI 0.47 to 0.70) (Schuit 2014). In a subsequent updated IPD‐MA involving data from five randomised trials (Brizot 2015; Cetingoz 2011; El‐Refaie 2016; Rode 2011; Serra 2013) specifically recruiting women with a multiple pregnancy, and additional data from a trial involving a small number of women with a multiple pregnancy and short cervix (Fonseca 2007), data were available from 303 women with a multiple pregnancy and their 606 infants (Romero 2017). Women who received vaginal progesterone therapy with a short cervical length appeared less likely to give birth before 34 weeks' gestation (vaginal progesterone 63/159 versus placebo 78/144; RR 0.71, 95% CI 0.56 to 0.91), with a reduction in risk of a composite adverse perinatal outcome (vaginal progesterone 23/84 versus placebo 28/70; RR 0.61, 95% CI 0.34 to 0.98), accounting for non‐independence of outcomes between infants of a multiple pregnancy (Romero 2017). Some of the significant findings reported in this IPD‐MA (namely, preterm birth prior to 33 weeks' gestation, and neonatal death) became statistically non‐significant when accounting for trial quality and blinding of participants, staff and outcome assessors (Romero 2017).
While IPD‐MA can be used to identify particular subgroups for whom an intervention may be effective (Stewart 2011), interpretation of findings should consider the overall impact of the intervention, recognising the implications of the relatively small sample size and issues relating to adequate statistical power (Sun 2014; Yusuf 1991). The two IPD reviews have included a relatively small subgroup of women with a multiple pregnancy who received progesterone therapy, and while there is a suggestion of benefit, results should be interpreted with caution. Although preterm birth is recognised to be a heterogeneous condition (Romero 2006), consideration should also be given to the possible biological mechanism whereby benefit is only observed in a very specific subgroup of women.
The longer‐term effects of exposure to progesterone during pregnancy have so far been reported in a limited number of studies (McNamara 2015; Vedel 2016), although the available evidence does not suggest an increased risk of harms extending into childhood. In the follow‐up of the STOPPIT trial (McNamara 2015), record linkage studies were performed to assess outcomes at three to six years of age, with data available for 97% of participants. Using these data, there were no differences in risk of death, hospitalisation, congenital anomalies, or outcomes at routine childhood health assessments (McNamara 2015). Follow‐up of the Rode 2011 trial (Vedel 2016) performed neurophysiological assessment at 48 or 60 months of age. There were no apparent differences in the number of hospital admissions or risk of low score using the Ages and Stages Questionnaire to screen for neurodevelopment (Vedel 2016). Further data relating to childhood follow‐up from other randomised trials would be beneficial.
Quality of the evidence
Overall, we rated the included studies at low risk of bias, although six studies were assessed at high risk of bias for selective outcome reporting (Aboulghar 2012; Briery 2009; Cetingoz 2011; Combs 2011; El‐Refaie 2016; Hartikainen‐Sorri 1980). We judged sequence generation to be adequate in most of the included studies, and appropriate blinding was also achieved. Most included studies had less than 10% sample attrition.
We used GRADE to assess the outcomes of perinatal mortality, preterm birth less than 34 weeks, major neurodevelopmental disability at childhood follow‐up, infant birthweight less than 2500 g, birth before 37 completed weeks and birth before 28 completed weeks. The 'Summary of findings' tables show the quality of evidence across these critical outcomes to be low to moderate. The main reason for downgrading the quality of the evidence was due to imprecision in the effect estimates, and for some outcomes design limitations in some of the studies contributing data.
Potential biases in the review process
The inclusion criteria for this review were reasonably broad, in order to evaluate the available evidence, which always includes trials with a range of inclusion criteria. The individual trial characteristics highlight the variation in inclusion criteria, the timing of starting progesterone therapy, the route of progesterone administration and the dose of progesterone given. The available information for specific subgroups of women with a multiple pregnancy are inevitably limited by the characteristics of the included studies.
We acknowledge that there is the potential for bias at all stages of performing a systematic review. We attempted to minimise bias in a number of ways; for example, two review authors independently carried out data extraction and assessed risk of bias.
Agreements and disagreements with other studies or reviews
As highlighted above, the findings of our review are broadly consistent with the IPD‐MA reported by Schuit 2014, derived from a smaller number of included trials and participants, but concluding that the overall administration of progesterone to women with a multiple pregnancy was not associated with any improvements in infant outcomes or reduction in risk of preterm birth. Furthermore, the evidence presented by Combs 2016 does not suggest that there is a benefit associated with IM progesterone, specifically in women with a triplet pregnancy. The effect of vaginal progesterone in women with a triplet pregnancy has so far been underevaluated. While there is a suggestion that vaginal progesterone may be associated with a reduction in risk of preterm birth and improved neonatal outcomes in women with a multiple pregnancy and short cervical length (Romero 2017; Schuit 2014), these IPD‐MAs reflect subgroups of women only, and have involved relatively small numbers of participants.

Study flow diagram.

Risk of bias summary: review authors' judgements about each risk of bias item for each included study.

Comparison 1 Intramuscular (IM) progesterone versus no treatment or placebo, Outcome 1 Preterm birth less than 34 weeks.
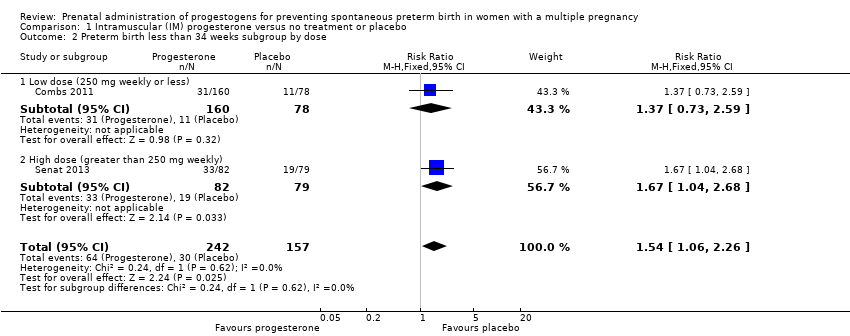
Comparison 1 Intramuscular (IM) progesterone versus no treatment or placebo, Outcome 2 Preterm birth less than 34 weeks subgroup by dose.

Comparison 1 Intramuscular (IM) progesterone versus no treatment or placebo, Outcome 3 Preterm birth less than 34 week subgroup by timing.

Comparison 1 Intramuscular (IM) progesterone versus no treatment or placebo, Outcome 4 Perinatal death.
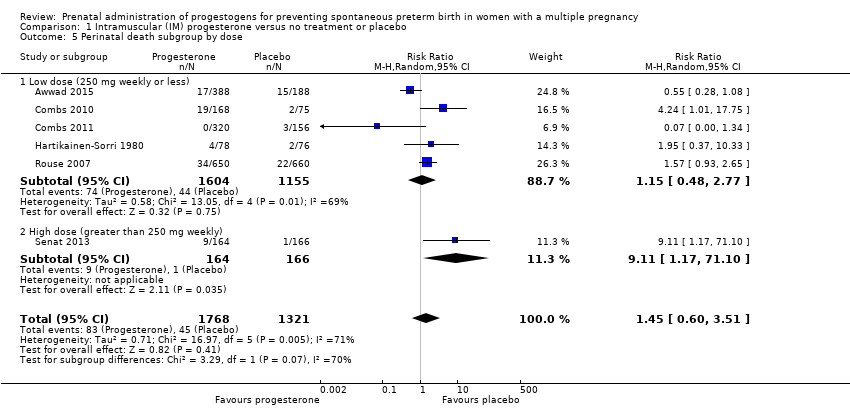
Comparison 1 Intramuscular (IM) progesterone versus no treatment or placebo, Outcome 5 Perinatal death subgroup by dose.

Comparison 1 Intramuscular (IM) progesterone versus no treatment or placebo, Outcome 6 Perinatal death subgroup by timing.

Comparison 1 Intramuscular (IM) progesterone versus no treatment or placebo, Outcome 7 Prelabour rupture of the membranes.
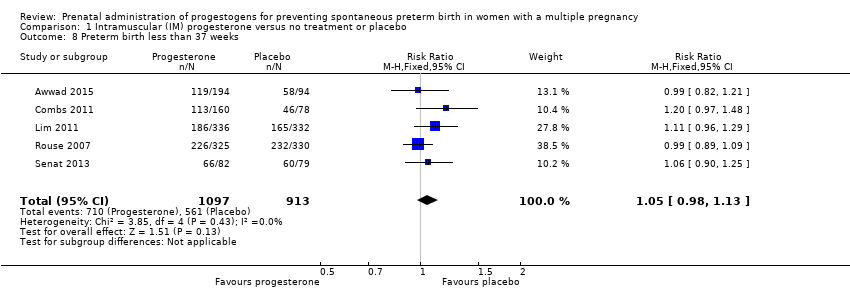
Comparison 1 Intramuscular (IM) progesterone versus no treatment or placebo, Outcome 8 Preterm birth less than 37 weeks.

Comparison 1 Intramuscular (IM) progesterone versus no treatment or placebo, Outcome 9 Preterm birth less than 28 weeks.

Comparison 1 Intramuscular (IM) progesterone versus no treatment or placebo, Outcome 10 Adverse drug reaction.

Comparison 1 Intramuscular (IM) progesterone versus no treatment or placebo, Outcome 11 Caesarean section.

Comparison 1 Intramuscular (IM) progesterone versus no treatment or placebo, Outcome 12 Antenatal tocolysis.

Comparison 1 Intramuscular (IM) progesterone versus no treatment or placebo, Outcome 13 Antenatal corticosteroids.

Comparison 1 Intramuscular (IM) progesterone versus no treatment or placebo, Outcome 14 Infant birthweight less than 2500 g.

Comparison 1 Intramuscular (IM) progesterone versus no treatment or placebo, Outcome 15 Apgar score < 7 at 5 minutes.

Comparison 1 Intramuscular (IM) progesterone versus no treatment or placebo, Outcome 16 Neonatal sepsis.

Comparison 1 Intramuscular (IM) progesterone versus no treatment or placebo, Outcome 17 Respiratory distress syndrome.

Comparison 1 Intramuscular (IM) progesterone versus no treatment or placebo, Outcome 18 Use of mechanical ventilation.

Comparison 1 Intramuscular (IM) progesterone versus no treatment or placebo, Outcome 19 Intraventricular haemorrhage ‐ all grades.

Comparison 1 Intramuscular (IM) progesterone versus no treatment or placebo, Outcome 20 Retinopathy of prematurity.

Comparison 1 Intramuscular (IM) progesterone versus no treatment or placebo, Outcome 21 Chronic lung disease.

Comparison 1 Intramuscular (IM) progesterone versus no treatment or placebo, Outcome 22 Necrotising enterocolitis.

Comparison 1 Intramuscular (IM) progesterone versus no treatment or placebo, Outcome 23 Fetal death.

Comparison 1 Intramuscular (IM) progesterone versus no treatment or placebo, Outcome 24 Neonatal death.
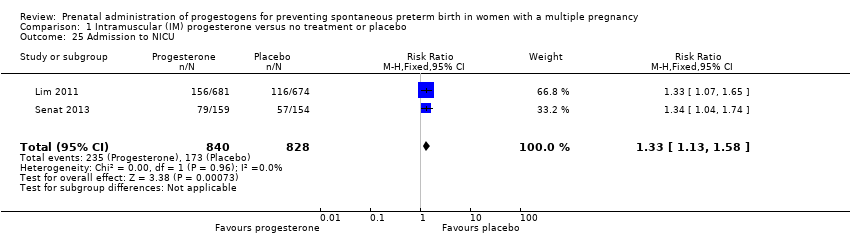
Comparison 1 Intramuscular (IM) progesterone versus no treatment or placebo, Outcome 25 Admission to NICU.
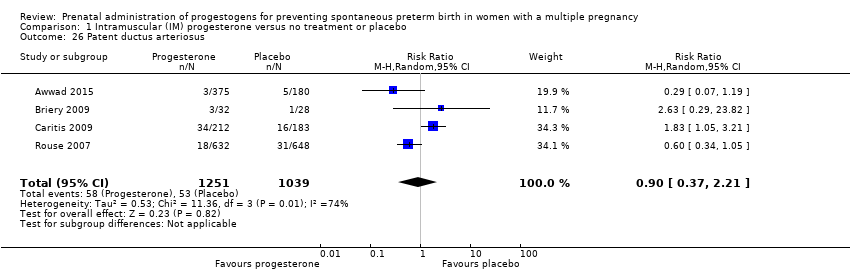
Comparison 1 Intramuscular (IM) progesterone versus no treatment or placebo, Outcome 26 Patent ductus arteriosus.

Comparison 1 Intramuscular (IM) progesterone versus no treatment or placebo, Outcome 27 Sensitivity analysis for perinatal death (assuming total dependence).

Comparison 1 Intramuscular (IM) progesterone versus no treatment or placebo, Outcome 28 Sensitivity analysis for perinatal death (assuming 1% dependence).

Comparison 2 Vaginal progesterone versus no treatment or placebo, Outcome 1 Preterm birth less than 34 weeks.

Comparison 2 Vaginal progesterone versus no treatment or placebo, Outcome 2 Preterm birth less than 34 weeks subgroup by dose.

Comparison 2 Vaginal progesterone versus no treatment or placebo, Outcome 3 Preterm birth less than 34 weeks subgroup by timing.

Comparison 2 Vaginal progesterone versus no treatment or placebo, Outcome 4 Perinatal death.
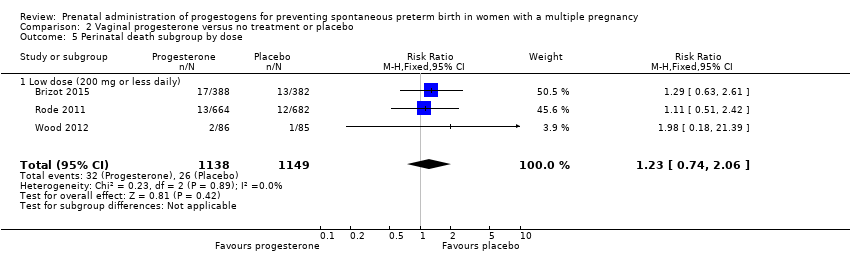
Comparison 2 Vaginal progesterone versus no treatment or placebo, Outcome 5 Perinatal death subgroup by dose.

Comparison 2 Vaginal progesterone versus no treatment or placebo, Outcome 6 Perinatal death subgroup by timing.

Comparison 2 Vaginal progesterone versus no treatment or placebo, Outcome 7 Prelabour rupture of the membranes.
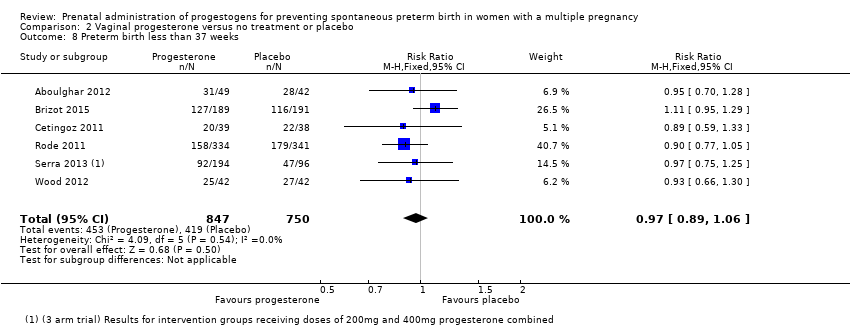
Comparison 2 Vaginal progesterone versus no treatment or placebo, Outcome 8 Preterm birth less than 37 weeks.

Comparison 2 Vaginal progesterone versus no treatment or placebo, Outcome 9 Preterm birth less than 28 weeks.

Comparison 2 Vaginal progesterone versus no treatment or placebo, Outcome 10 Adverse drug reaction.

Comparison 2 Vaginal progesterone versus no treatment or placebo, Outcome 11 Caesarean section.

Comparison 2 Vaginal progesterone versus no treatment or placebo, Outcome 12 Satisfaction with therapy.
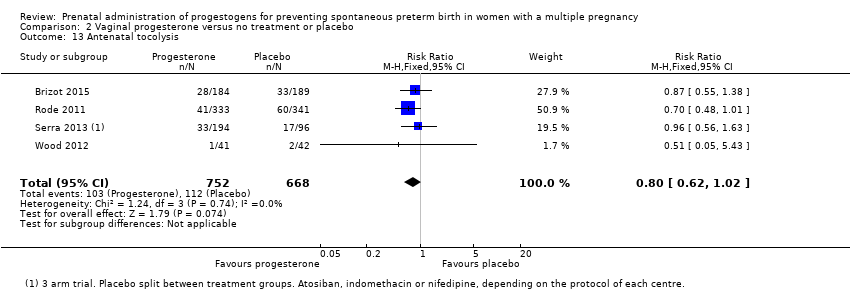
Comparison 2 Vaginal progesterone versus no treatment or placebo, Outcome 13 Antenatal tocolysis.

Comparison 2 Vaginal progesterone versus no treatment or placebo, Outcome 14 Antenatal corticosteroids.
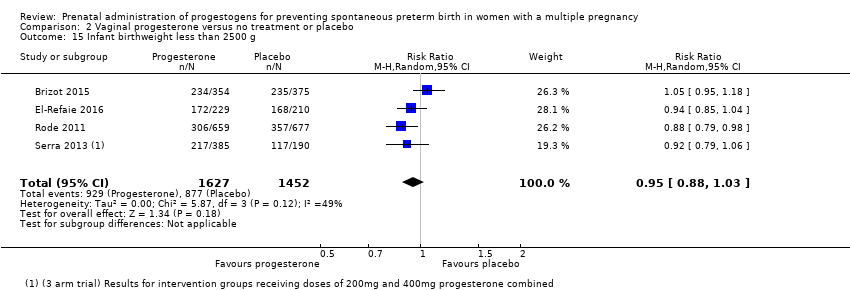
Comparison 2 Vaginal progesterone versus no treatment or placebo, Outcome 15 Infant birthweight less than 2500 g.

Comparison 2 Vaginal progesterone versus no treatment or placebo, Outcome 16 Apgar score < 7 at 5 minutes.

Comparison 2 Vaginal progesterone versus no treatment or placebo, Outcome 17 Respiratory distress syndrome.

Comparison 2 Vaginal progesterone versus no treatment or placebo, Outcome 18 Use of mechanical ventilation.

Comparison 2 Vaginal progesterone versus no treatment or placebo, Outcome 19 Intraventricular haemorrhage ‐ all grades.

Comparison 2 Vaginal progesterone versus no treatment or placebo, Outcome 20 Retinopathy of prematurity.

Comparison 2 Vaginal progesterone versus no treatment or placebo, Outcome 21 Necrotising enterocolitis.

Comparison 2 Vaginal progesterone versus no treatment or placebo, Outcome 22 Neonatal sepsis.

Comparison 2 Vaginal progesterone versus no treatment or placebo, Outcome 23 Fetal death.

Comparison 2 Vaginal progesterone versus no treatment or placebo, Outcome 24 Neonatal death.

Comparison 2 Vaginal progesterone versus no treatment or placebo, Outcome 25 Admission to NICU.

Comparison 2 Vaginal progesterone versus no treatment or placebo, Outcome 26 Patent ductus arteriosus.

Comparison 2 Vaginal progesterone versus no treatment or placebo, Outcome 27 Sensitivity analysis for perinatal death (assuming total non‐independence).

Comparison 2 Vaginal progesterone versus no treatment or placebo, Outcome 28 Sensitivity analysis for perinatal death (assuming 1% non‐independence).

Comparison 3 Intramuscular (IM) progesterone versus no treatment: multiple pregnancy and short cervix, Outcome 1 Preterm birth less than 34 weeks.

Comparison 3 Intramuscular (IM) progesterone versus no treatment: multiple pregnancy and short cervix, Outcome 2 Perinatal death.

Comparison 3 Intramuscular (IM) progesterone versus no treatment: multiple pregnancy and short cervix, Outcome 3 Prelabour rupture of the membranes.

Comparison 3 Intramuscular (IM) progesterone versus no treatment: multiple pregnancy and short cervix, Outcome 4 Preterm birth less than 37 weeks.
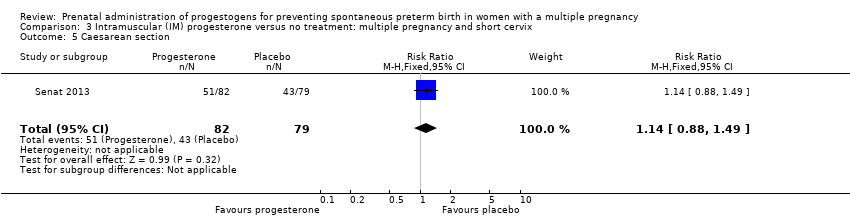
Comparison 3 Intramuscular (IM) progesterone versus no treatment: multiple pregnancy and short cervix, Outcome 5 Caesarean section.

Comparison 3 Intramuscular (IM) progesterone versus no treatment: multiple pregnancy and short cervix, Outcome 6 Antenatal tocolysis.

Comparison 3 Intramuscular (IM) progesterone versus no treatment: multiple pregnancy and short cervix, Outcome 7 Antenatal corticosteroids.

Comparison 3 Intramuscular (IM) progesterone versus no treatment: multiple pregnancy and short cervix, Outcome 8 Neonatal sepsis.

Comparison 3 Intramuscular (IM) progesterone versus no treatment: multiple pregnancy and short cervix, Outcome 9 Respiratory distress syndrome.

Comparison 3 Intramuscular (IM) progesterone versus no treatment: multiple pregnancy and short cervix, Outcome 10 Retinopathy of prematurity.

Comparison 3 Intramuscular (IM) progesterone versus no treatment: multiple pregnancy and short cervix, Outcome 11 Neonatal death.

Comparison 3 Intramuscular (IM) progesterone versus no treatment: multiple pregnancy and short cervix, Outcome 12 Admission to NICU.

Comparison 3 Intramuscular (IM) progesterone versus no treatment: multiple pregnancy and short cervix, Outcome 13 Sensitivity analysis for perinatal death (assuming total dependence).

Comparison 3 Intramuscular (IM) progesterone versus no treatment: multiple pregnancy and short cervix, Outcome 14 Sensitivity analysis for perinatal death (assuming 1% dependence).

Comparison 4 Vaginal progesterone versus no treatment: multiple pregnancy and short cervix, Outcome 1 Preterm birth less than 34 weeks.

Comparison 4 Vaginal progesterone versus no treatment: multiple pregnancy and short cervix, Outcome 2 Prelabour rupture of the membranes.
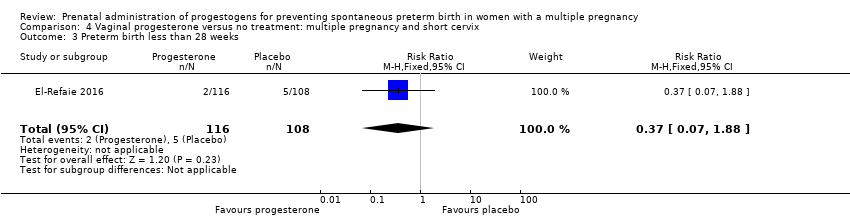
Comparison 4 Vaginal progesterone versus no treatment: multiple pregnancy and short cervix, Outcome 3 Preterm birth less than 28 weeks.
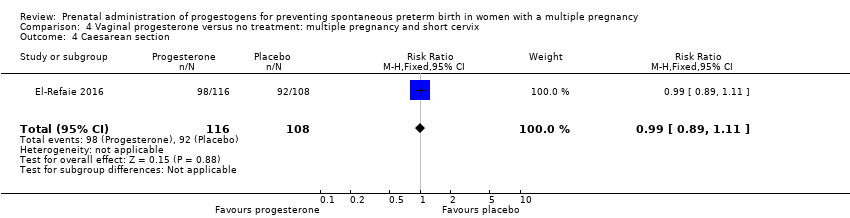
Comparison 4 Vaginal progesterone versus no treatment: multiple pregnancy and short cervix, Outcome 4 Caesarean section.

Comparison 4 Vaginal progesterone versus no treatment: multiple pregnancy and short cervix, Outcome 5 Infant birthweight less than 2500 g.

Comparison 4 Vaginal progesterone versus no treatment: multiple pregnancy and short cervix, Outcome 6 Respiratory distress syndrome.

Comparison 4 Vaginal progesterone versus no treatment: multiple pregnancy and short cervix, Outcome 7 Use of mechanical ventilation.

Comparison 4 Vaginal progesterone versus no treatment: multiple pregnancy and short cervix, Outcome 8 Admission to NICU.
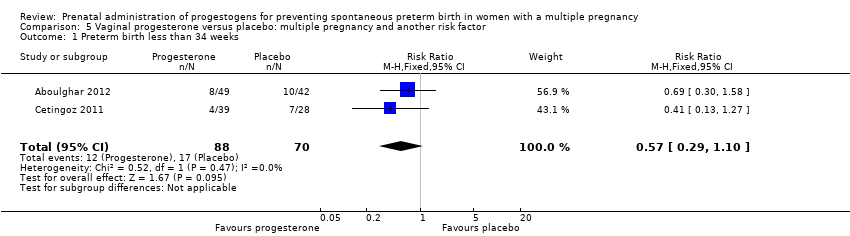
Comparison 5 Vaginal progesterone versus placebo: multiple pregnancy and another risk factor, Outcome 1 Preterm birth less than 34 weeks.

Comparison 5 Vaginal progesterone versus placebo: multiple pregnancy and another risk factor, Outcome 2 Preterm birth less than 37 weeks.
| Intramuscular (IM) progesterone compared to no treatment or placebo for preventing spontaneous preterm birth in women with a multiple pregnancy | ||||||
| Patient or population: Women with a multiple pregnancy | ||||||
| Outcomes | Anticipated absolute effects* (95% CI) | Relative effect | № of participants | Quality of the evidence | Comments | |
| Risk with no treatment or placebo | Risk with intramuscular (IM) progesterone | |||||
| Perinatal death | Study population | RR 1.45 | 3089 | ⊕⊕⊝⊝ LOW 1, 2 | ‐ | |
| 34 per 1000 | 49 per 1000 | |||||
| Preterm birth less than 34 weeks | Study population | RR 1.54 | 399 | ⊕⊕⊝⊝ | ‐ | |
| 191 per 1000 | 298 per 1000 | |||||
| Major neurodevelopmental disability at childhood follow‐up | Study population | ‐ | (0 studies) | ‐ | None of the included trial reported this outcome | |
| see comment | see comment | |||||
| Infant birthweight less than 2500 g | Study population | RR 0.99 | 4071 | ⊕⊕⊕⊝ | ‐ | |
| 620 per 1000 | 613 per 1000 | |||||
| Preterm birth less than 28 weeks | Study population | RR 1.08 | 1920 | ⊕⊕⊕⊝ | ‐ | |
| ‐58 per 1000 | 62 per 1000 | |||||
| Preterm birth less than 37 weeks | Study population | RR 1.05 | 2010 | ⊕⊕⊕⊕ | ‐ | |
| 614 per 1000 | 639 per 1000 | |||||
| *The risk in the intervention group (and its 95% confidence interval) is based on the assumed risk in the comparison group and the relative effect of the intervention (and its 95% CI). | ||||||
| GRADE Working Group grades of evidence | ||||||
| 1Statistical heterogeneity (I2 > 60%). Variation in size and direction of effect (‐1). | ||||||
| Vaginal progesterone compared to no treatment or placebo for preventing spontaneous preterm birth in women with a multiple pregnancy | ||||||
| Patient or population: Women with a multiple pregnancy | ||||||
| Outcomes | Anticipated absolute effects* (95% CI) | Relative effect | № of participants | Quality of the evidence | Comments | |
| Risk with no treatment or placebo | Risk with vaginal progesterone | |||||
| Perinatal death | Study population | RR 1.23 | 2287 | ⊕⊕⊝⊝ | ‐ | |
| 23 per 1000 | 28 per 1000 | |||||
| Preterm birth less than 34 weeks | Study population | RR 0.83 | 1727 | ⊕⊕⊝⊝ | ‐ | |
| 227 per 1000 | 188 per 1000 | |||||
| Major neurodevelopmental disability at childhood follow‐up | Study population | ‐ | (0 study) | ‐ | None of the included trial reported this outcome. | |
| see comment | see comment | |||||
| Infant birthweight less than 2500 g | Study population | RR 0.95 | 3079 | ⊕⊕⊕⊝ | ‐ | |
| 604 per 1000 | 574 per 1000 | |||||
| Preterm birth less than 37 weeks | Study population | RR 0.97 | 1597 | ⊕⊕⊕⊝ | ‐ | |
| 559 per 1000 | 547 per 1000 | |||||
| Preterm birth less than 28 weeks | Study population | RR 1.22 | 1569 | ⊕⊕⊝⊝ | ‐ | |
| 26 per 1000 | 31 per 1000 | |||||
| *The risk in the intervention group (and its 95% confidence interval) is based on the assumed risk in the comparison group and the relative effect of the intervention (and its 95% CI). | ||||||
| GRADE Working Group grades of evidence | ||||||
| 1One study contributing data with design limitations (weight of 52.1%) (‐1). | ||||||
| Trial | Fetal death (FD) | Intrapartum death | Stillbirth | Neonatal death (NND) | Perinatal death (PND) | Included in Dodd 2013? | Decision for PND for multiples review? |
| ‐ | ‐ | ‐ | Reported as maternal outcome. From text appears as if at least one pregnancy affected by demise of both twins | ‐ | Yes | Cannot reliably convert maternal denominator for neonatal outcome. Data not included | |
| Yes | ‐ | ‐ | ‐ | Yes, as a baby outcome. | N/A | Include | |
| No death data | ‐ | ‐ | ‐ | ‐ | No PND reported | N/A | |
| No death data | ‐ | ‐ | ‐ | ‐ | No PND reported | N/A | |
| Fetal death reported as maternal outcome and only as a single co‐twin demise outcome. Unsure if any pregnancies where both twins died | ‐ | ‐ | Yes, as a baby outcome | Not reported. Cannot convert fetal death into a baby outcome because only reported if single twin demise likely to underestimate | Yes | Data not included. | |
| Reported as a maternal outcome and denominator not clear | ‐ | ‐ | Yes | No | No | No | |
| Yes. as maternal outcome but specifies only 1 twin affected in each of those pregnancies | ‐ | ‐ | Yes | In text | Yes | Yes | |
| ‐ | ‐ | ‐ | ‐ | Yes, as infant outcome | N/A | Yes | |
| ‐ | ‐ | Yes | Yes | Yes, as infant outcome | N/A | Yes | |
| ‐ | ‐ | ‐ | Yes | ‐ | No PND reported | N/A | |
| Combs 2010 triplets | ‐ | ‐ | ‐ | Yes | Yes | Yes | Yes |
| Combs 2011 twins | ‐ | ‐ | ‐ | Yes | Yes | Yes | Yes |
| ‐ | ‐ | ‐ | ‐ | Yes in text | Yes | Yes | |
| ‐ | 1 or more died during delivery after 24 wks and also any IUD before onset labour or onset delivery | Reported “all live births” | ‐ | No, and cannot be reliably added up from data presented | Yes | Data not included | |
| Yes | ‐ | ‐ | Yes | Yes, from text (not in table) | No ‐ not sure why data not included | Yes | |
| Yes | Yes | ‐ | Yes | Can add NND and FD (IP and IU); all Ns clear | No ‐ not sure why data not included | Yes. Extrapolated from text and checked | |
| Yes, as a maternal outcome | ‐ | ‐ | Yes | Cannot add FD and NND because FD reported as a maternal outcome | No | Data not included | |
| IP: intrapartum | |||||||
| Outcome or subgroup title | No. of studies | No. of participants | Statistical method | Effect size |
| 1 Preterm birth less than 34 weeks Show forest plot | 2 | 399 | Risk Ratio (M‐H, Fixed, 95% CI) | 1.54 [1.06, 2.26] |
| 2 Preterm birth less than 34 weeks subgroup by dose Show forest plot | 2 | 399 | Risk Ratio (M‐H, Fixed, 95% CI) | 1.54 [1.06, 2.26] |
| 2.1 Low dose (250 mg weekly or less) | 1 | 238 | Risk Ratio (M‐H, Fixed, 95% CI) | 1.37 [0.73, 2.59] |
| 2.2 High dose (greater than 250 mg weekly) | 1 | 161 | Risk Ratio (M‐H, Fixed, 95% CI) | 1.67 [1.04, 2.68] |
| 3 Preterm birth less than 34 week subgroup by timing Show forest plot | 2 | 399 | Risk Ratio (M‐H, Fixed, 95% CI) | 1.54 [1.06, 2.26] |
| 3.1 Commencing after 20 weeks' gestation | 1 | 161 | Risk Ratio (M‐H, Fixed, 95% CI) | 1.67 [1.04, 2.68] |
| 3.2 Mixed timing of commencement | 1 | 238 | Risk Ratio (M‐H, Fixed, 95% CI) | 1.37 [0.73, 2.59] |
| 4 Perinatal death Show forest plot | 6 | 3089 | Risk Ratio (M‐H, Random, 95% CI) | 1.45 [0.60, 3.51] |
| 5 Perinatal death subgroup by dose Show forest plot | 6 | 3089 | Risk Ratio (M‐H, Random, 95% CI) | 1.45 [0.60, 3.51] |
| 5.1 Low dose (250 mg weekly or less) | 5 | 2759 | Risk Ratio (M‐H, Random, 95% CI) | 1.15 [0.48, 2.77] |
| 5.2 High dose (greater than 250 mg weekly) | 1 | 330 | Risk Ratio (M‐H, Random, 95% CI) | 9.11 [1.17, 71.10] |
| 6 Perinatal death subgroup by timing Show forest plot | 6 | 3089 | Risk Ratio (M‐H, Random, 95% CI) | 1.45 [0.60, 3.51] |
| 6.1 Starting before 20 weeks' gestation | 2 | 1886 | Risk Ratio (M‐H, Random, 95% CI) | 0.95 [0.34, 2.66] |
| 6.2 Starting after 20 weeks' gestation | 2 | 484 | Risk Ratio (M‐H, Random, 95% CI) | 3.76 [0.81, 17.46] |
| 6.3 Mixed timing of start | 2 | 719 | Risk Ratio (M‐H, Random, 95% CI) | 0.67 [0.01, 37.74] |
| 7 Prelabour rupture of the membranes Show forest plot | 6 | 1257 | Risk Ratio (M‐H, Fixed, 95% CI) | 1.17 [0.84, 1.63] |
| 8 Preterm birth less than 37 weeks Show forest plot | 5 | 2010 | Risk Ratio (M‐H, Fixed, 95% CI) | 1.05 [0.98, 1.13] |
| 9 Preterm birth less than 28 weeks Show forest plot | 5 | 1920 | Risk Ratio (M‐H, Fixed, 95% CI) | 1.08 [0.75, 1.55] |
| 10 Adverse drug reaction Show forest plot | 2 | 1316 | Risk Ratio (M‐H, Random, 95% CI) | 0.91 [0.63, 1.32] |
| 11 Caesarean section Show forest plot | 7 | 2222 | Risk Ratio (M‐H, Fixed, 95% CI) | 1.01 [0.95, 1.08] |
| 12 Antenatal tocolysis Show forest plot | 7 | 2218 | Risk Ratio (M‐H, Fixed, 95% CI) | 0.97 [0.85, 1.10] |
| 13 Antenatal corticosteroids Show forest plot | 7 | 2221 | Risk Ratio (M‐H, Fixed, 95% CI) | 0.99 [0.88, 1.11] |
| 14 Infant birthweight less than 2500 g Show forest plot | 5 | 4071 | Risk Ratio (M‐H, Random, 95% CI) | 0.99 [0.90, 1.08] |
| 15 Apgar score < 7 at 5 minutes Show forest plot | 4 | 3606 | Risk Ratio (M‐H, Fixed, 95% CI) | 0.89 [0.68, 1.15] |
| 16 Neonatal sepsis Show forest plot | 6 | 3327 | Risk Ratio (M‐H, Random, 95% CI) | 1.02 [0.41, 2.51] |
| 17 Respiratory distress syndrome Show forest plot | 8 | 4670 | Risk Ratio (M‐H, Random, 95% CI) | 1.07 [0.85, 1.34] |
| 18 Use of mechanical ventilation Show forest plot | 3 | 2233 | Risk Ratio (M‐H, Random, 95% CI) | 0.90 [0.69, 1.17] |
| 19 Intraventricular haemorrhage ‐ all grades Show forest plot | 1 | 1355 | Risk Ratio (M‐H, Fixed, 95% CI) | 1.98 [0.36, 10.77] |
| 20 Retinopathy of prematurity Show forest plot | 5 | 2807 | Risk Ratio (M‐H, Fixed, 95% CI) | 0.34 [0.16, 0.74] |
| 21 Chronic lung disease Show forest plot | 2 | 681 | Risk Ratio (M‐H, Random, 95% CI) | 1.91 [0.13, 27.80] |
| 22 Necrotising enterocolitis Show forest plot | 5 | 2610 | Risk Ratio (M‐H, Fixed, 95% CI) | 0.74 [0.36, 1.51] |
| 23 Fetal death Show forest plot | 4 | 3536 | Risk Ratio (M‐H, Random, 95% CI) | 0.93 [0.39, 2.20] |
| 24 Neonatal death Show forest plot | 7 | 3399 | Risk Ratio (M‐H, Random, 95% CI) | 0.92 [0.44, 1.91] |
| 25 Admission to NICU Show forest plot | 2 | 1668 | Risk Ratio (M‐H, Fixed, 95% CI) | 1.33 [1.13, 1.58] |
| 26 Patent ductus arteriosus Show forest plot | 4 | 2290 | Risk Ratio (M‐H, Random, 95% CI) | 0.90 [0.37, 2.21] |
| 27 Sensitivity analysis for perinatal death (assuming total dependence) Show forest plot | 6 | 1517 | Risk Ratio (M‐H, Random, 95% CI) | 1.35 [0.57, 3.20] |
| 28 Sensitivity analysis for perinatal death (assuming 1% dependence) Show forest plot | 6 | 3021 | Risk Ratio (M‐H, Random, 95% CI) | 1.45 [0.60, 3.49] |
| Outcome or subgroup title | No. of studies | No. of participants | Statistical method | Effect size |
| 1 Preterm birth less than 34 weeks Show forest plot | 6 | 1727 | Risk Ratio (M‐H, Random, 95% CI) | 0.83 [0.63, 1.09] |
| 2 Preterm birth less than 34 weeks subgroup by dose Show forest plot | 6 | 1727 | Risk Ratio (M‐H, Random, 95% CI) | 0.83 [0.64, 1.07] |
| 2.1 Low dose (200 mg or less daily) | 4 | 1267 | Risk Ratio (M‐H, Random, 95% CI) | 0.93 [0.63, 1.37] |
| 2.2 High dose (more than 200 mg daily) | 3 | 460 | Risk Ratio (M‐H, Random, 95% CI) | 0.68 [0.52, 0.90] |
| 3 Preterm birth less than 34 weeks subgroup by timing Show forest plot | 6 | 1727 | Risk Ratio (M‐H, Random, 95% CI) | 0.83 [0.63, 1.09] |
| 3.1 Starting before 20 weeks' gestation | 1 | 91 | Risk Ratio (M‐H, Random, 95% CI) | 0.69 [0.30, 1.58] |
| 3.2 Starting after 20 weeks' gestation | 4 | 1256 | Risk Ratio (M‐H, Random, 95% CI) | 0.74 [0.60, 0.91] |
| 3.3 Mixed timing of start | 1 | 380 | Risk Ratio (M‐H, Random, 95% CI) | 1.35 [0.90, 2.02] |
| 4 Perinatal death Show forest plot | 3 | 2287 | Risk Ratio (M‐H, Fixed, 95% CI) | 1.23 [0.74, 2.06] |
| 5 Perinatal death subgroup by dose Show forest plot | 3 | 2287 | Risk Ratio (M‐H, Fixed, 95% CI) | 1.23 [0.74, 2.06] |
| 5.1 Low dose (200 mg or less daily) | 3 | 2287 | Risk Ratio (M‐H, Fixed, 95% CI) | 1.23 [0.74, 2.06] |
| 6 Perinatal death subgroup by timing Show forest plot | 3 | 2287 | Risk Ratio (M‐H, Fixed, 95% CI) | 1.23 [0.74, 2.06] |
| 6.1 Starting before 20 weeks' gestation | 1 | 171 | Risk Ratio (M‐H, Fixed, 95% CI) | 1.98 [0.18, 21.39] |
| 6.2 Starting after 20 weeks' gestation | 1 | 1346 | Risk Ratio (M‐H, Fixed, 95% CI) | 1.11 [0.51, 2.42] |
| 6.3 Mixed timing of start | 1 | 770 | Risk Ratio (M‐H, Fixed, 95% CI) | 1.29 [0.63, 2.61] |
| 7 Prelabour rupture of the membranes Show forest plot | 2 | 514 | Risk Ratio (M‐H, Fixed, 95% CI) | 0.61 [0.23, 1.60] |
| 8 Preterm birth less than 37 weeks Show forest plot | 6 | 1597 | Risk Ratio (M‐H, Fixed, 95% CI) | 0.97 [0.89, 1.06] |
| 9 Preterm birth less than 28 weeks Show forest plot | 4 | 1569 | Risk Ratio (M‐H, Fixed, 95% CI) | 1.22 [0.68, 2.21] |
| 10 Adverse drug reaction Show forest plot | 2 | 562 | Risk Ratio (M‐H, Fixed, 95% CI) | 0.99 [0.90, 1.09] |
| 11 Caesarean section Show forest plot | 6 | 2143 | Risk Ratio (M‐H, Fixed, 95% CI) | 0.93 [0.88, 0.98] |
| 12 Satisfaction with therapy Show forest plot | 1 | 494 | Mean Difference (IV, Fixed, 95% CI) | 0.0 [‐0.35, 0.35] |
| 13 Antenatal tocolysis Show forest plot | 4 | 1420 | Risk Ratio (M‐H, Fixed, 95% CI) | 0.80 [0.62, 1.02] |
| 14 Antenatal corticosteroids Show forest plot | 4 | 1422 | Risk Ratio (M‐H, Fixed, 95% CI) | 0.87 [0.71, 1.06] |
| 15 Infant birthweight less than 2500 g Show forest plot | 4 | 3079 | Risk Ratio (M‐H, Random, 95% CI) | 0.95 [0.88, 1.03] |
| 16 Apgar score < 7 at 5 minutes Show forest plot | 3 | 2410 | Risk Ratio (M‐H, Fixed, 95% CI) | 0.65 [0.35, 1.19] |
| 17 Respiratory distress syndrome Show forest plot | 4 | 2560 | Risk Ratio (M‐H, Random, 95% CI) | 0.84 [0.64, 1.10] |
| 18 Use of mechanical ventilation Show forest plot | 5 | 3134 | Risk Ratio (M‐H, Fixed, 95% CI) | 0.61 [0.48, 0.77] |
| 19 Intraventricular haemorrhage ‐ all grades Show forest plot | 1 | 1333 | Risk Ratio (M‐H, Fixed, 95% CI) | 1.70 [0.62, 4.66] |
| 20 Retinopathy of prematurity Show forest plot | 2 | 1945 | Risk Ratio (M‐H, Fixed, 95% CI) | 1.07 [0.45, 2.54] |
| 21 Necrotising enterocolitis Show forest plot | 3 | 2117 | Risk Ratio (M‐H, Fixed, 95% CI) | 0.52 [0.13, 2.06] |
| 22 Neonatal sepsis Show forest plot | 2 | 1944 | Risk Ratio (M‐H, Fixed, 95% CI) | 1.41 [0.86, 2.33] |
| 23 Fetal death Show forest plot | 3 | 2328 | Risk Ratio (M‐H, Fixed, 95% CI) | 1.38 [0.65, 2.90] |
| 24 Neonatal death Show forest plot | 3 | 2905 | Risk Ratio (M‐H, Fixed, 95% CI) | 1.53 [0.75, 3.15] |
| 25 Admission to NICU Show forest plot | 5 | 4052 | Risk Ratio (M‐H, Fixed, 95% CI) | 0.93 [0.87, 1.00] |
| 26 Patent ductus arteriosus Show forest plot | 2 | 1946 | Risk Ratio (M‐H, Fixed, 95% CI) | 0.76 [0.47, 1.22] |
| 27 Sensitivity analysis for perinatal death (assuming total non‐independence) Show forest plot | 3 | 1144 | Risk Ratio (M‐H, Fixed, 95% CI) | 1.22 [0.61, 2.44] |
| 28 Sensitivity analysis for perinatal death (assuming 1% non‐independence) Show forest plot | 3 | 2263 | Risk Ratio (M‐H, Fixed, 95% CI) | 1.23 [0.74, 2.06] |
| Outcome or subgroup title | No. of studies | No. of participants | Statistical method | Effect size |
| 1 Preterm birth less than 34 weeks Show forest plot | 1 | 161 | Risk Ratio (M‐H, Fixed, 95% CI) | 1.67 [1.04, 2.68] |
| 2 Perinatal death Show forest plot | 1 | 330 | Risk Ratio (M‐H, Fixed, 95% CI) | 9.11 [1.17, 71.10] |
| 3 Prelabour rupture of the membranes Show forest plot | 1 | 161 | Risk Ratio (M‐H, Fixed, 95% CI) | 1.14 [0.63, 2.06] |
| 4 Preterm birth less than 37 weeks Show forest plot | 1 | 161 | Risk Ratio (M‐H, Fixed, 95% CI) | 1.06 [0.90, 1.25] |
| 5 Caesarean section Show forest plot | 1 | 161 | Risk Ratio (M‐H, Fixed, 95% CI) | 1.14 [0.88, 1.49] |
| 6 Antenatal tocolysis Show forest plot | 1 | 158 | Risk Ratio (M‐H, Fixed, 95% CI) | 1.37 [0.76, 2.45] |
| 7 Antenatal corticosteroids Show forest plot | 1 | 159 | Risk Ratio (M‐H, Fixed, 95% CI) | 0.93 [0.64, 1.36] |
| 8 Neonatal sepsis Show forest plot | 1 | 303 | Risk Ratio (M‐H, Fixed, 95% CI) | 5.03 [0.60, 42.57] |
| 9 Respiratory distress syndrome Show forest plot | 1 | 309 | Risk Ratio (M‐H, Fixed, 95% CI) | 1.46 [1.00, 2.12] |
| 10 Retinopathy of prematurity Show forest plot | 1 | 302 | Risk Ratio (M‐H, Fixed, 95% CI) | 0.20 [0.01, 4.19] |
| 11 Neonatal death Show forest plot | 1 | 307 | Risk Ratio (M‐H, Fixed, 95% CI) | 4.03 [0.46, 35.61] |
| 12 Admission to NICU Show forest plot | 1 | 313 | Risk Ratio (M‐H, Fixed, 95% CI) | 1.34 [1.04, 1.74] |
| 13 Sensitivity analysis for perinatal death (assuming total dependence) Show forest plot | 1 | 163 | Risk Ratio (M‐H, Fixed, 95% CI) | 5.06 [0.60, 42.38] |
| 14 Sensitivity analysis for perinatal death (assuming 1% dependence) Show forest plot | 1 | 322 | Risk Ratio (M‐H, Fixed, 95% CI) | 9.11 [1.17, 71.10] |
| Outcome or subgroup title | No. of studies | No. of participants | Statistical method | Effect size |
| 1 Preterm birth less than 34 weeks Show forest plot | 1 | 224 | Risk Ratio (M‐H, Fixed, 95% CI) | 0.67 [0.49, 0.91] |
| 2 Prelabour rupture of the membranes Show forest plot | 1 | 224 | Risk Ratio (M‐H, Fixed, 95% CI) | 0.47 [0.12, 1.82] |
| 3 Preterm birth less than 28 weeks Show forest plot | 1 | 224 | Risk Ratio (M‐H, Fixed, 95% CI) | 0.37 [0.07, 1.88] |
| 4 Caesarean section Show forest plot | 1 | 224 | Risk Ratio (M‐H, Fixed, 95% CI) | 0.99 [0.89, 1.11] |
| 5 Infant birthweight less than 2500 g Show forest plot | 1 | 439 | Risk Ratio (M‐H, Fixed, 95% CI) | 0.94 [0.85, 1.04] |
| 6 Respiratory distress syndrome Show forest plot | 1 | 439 | Risk Ratio (M‐H, Fixed, 95% CI) | 0.68 [0.55, 0.84] |
| 7 Use of mechanical ventilation Show forest plot | 1 | 439 | Risk Ratio (M‐H, Fixed, 95% CI) | 0.47 [0.32, 0.69] |
| 8 Admission to NICU Show forest plot | 1 | 439 | Risk Ratio (M‐H, Fixed, 95% CI) | 0.91 [0.82, 1.01] |
| Outcome or subgroup title | No. of studies | No. of participants | Statistical method | Effect size |
| 1 Preterm birth less than 34 weeks Show forest plot | 2 | 158 | Risk Ratio (M‐H, Fixed, 95% CI) | 0.57 [0.29, 1.10] |
| 2 Preterm birth less than 37 weeks Show forest plot | 2 | 168 | Risk Ratio (M‐H, Fixed, 95% CI) | 0.92 [0.72, 1.18] |