برنامههای سرسوزن سرنگ و درمان جایگزینی اوپیوئید برای پیشگیری از انتقال هپاتیت C در افرادی که مواد مخدر تزریق میکنند
Appendices
Appendix 1. Search strategies to identify studies that measure the impact of NSP/OST on HCV incidence
Cochrane Drug and Alcohol Group Specialised Register (CRS)
-
(HCV) AND (INREGISTER)
-
("hepatitis C") AND (INREGISTER)
-
("hep C") AND (INREGISTER)
-
#1 OR #2 OR #3
CENTRAL, DARE, NHSEED and HTA (Cochrane Library)
-
MeSH descriptor: [Needle‐Exchange Programs] explode all trees
-
MeSH descriptor: [Community Pharmacy Services] explode all trees
-
((needle* or syringe* or inject*) near/3 exchange):ti,ab,kw (Word variations have been searched)
-
MeSH descriptor: [Harm Reduction] explode all trees
-
(harm near/2 reduc*):ti,ab,kw (Word variations have been searched)
-
(needle* or syringe* or inject*) near/3 (suppl* or access* or provision or provid* or distribut* or dispens* or pack*):ti,ab,kw (Word variations have been searched)
-
(needle* or syringe* or inject*) near/3 (program* or service* or center* or centre* or scheme* or facility or facilities or area* or pharmacy or pharmacies or unit or units or room*):ti,ab,kw (Word variations have been searched)
-
(needle* or syringe* or inject* or slot or dispensing or vending) near/3 (machine* or (peer next distrib*)):ti,ab,kw (Word variations have been searched)
-
#1 or #2 or #3 or #4 or #5 or #5 or #6 or #7 or #8
-
MeSH descriptor: [Substance Abuse, Intravenous] explode all trees
-
((substance* or drug* or opiate* or opioid* or heroin* or morphin* or morfin* or narcot*) near/6 (use* or abus* or misuse* or addict* or depend*)):ti,ab,kw (Word variations have been searched)
-
(substance* or drug) and (inject* or intravenous):ti,ab,kw (Word variations have been searched)
-
#10 or #11 or #12
-
MeSH descriptor: [Opiate Substitution Treatment] explode all trees
-
MeSH descriptor: [Methadone] explode all trees
-
MeSH descriptor: [Buprenorphine] explode all trees
-
(substitut* or maint*) near/2 (treatment or therapy):ti,ab,kw (Word variations have been searched)
-
(methadone or buprenorphine or subutex or suboxone):ti,ab,kw (Word variations have been searched)
-
#13 or #14 or #15 or #16 or #17 or #18
-
#9 or #19
-
MeSH descriptor: [Hepatitis C] explode all trees
-
(hepatitis next C) or (hep next C):ti,ab,kw (Word variations have been searched)
-
HCV:ti,ab
-
#21 or #22 or #23
-
#13 and #20 and #24
MEDLINE, PsycINFO and Global Health (Ovid)
-
Needle‐Exchange Programs/
-
Community pharmacy services/
-
((needle* or syringe* or inject*) adj3 exchange).ab,ti.
-
Harm Reduction/
-
(harm adj reduc*).ab,ti.
-
((needle* or syringe* or inject*) adj3 (suppl* or access* or provision or provid* or distribut* or dispens* or pack*)).ab,ti.
-
((needle* or syringe* or inject*) adj3 (program* or service* or center* or centre* or scheme* or facility or facilities or area* or pharmacy or pharmacies or unit or units or room*)).ab,ti.
-
((needle* or syringe* or inject* or slot or dispensing or vending) adj3 (machine* or (peer adj distrib*))).ab,ti.
-
or/1‐8
-
Substance Abuse, Intravenous/
-
(substance$ or drug$).ab,ti.
-
(abuse$ or depend$ or use$ or misus$ or addict$).ab,ti.
-
(inject$ or intravenous).ab,ti.
-
10 or (11 and 12) or (11 and 13)
-
opiate substitution treatment/
-
methadone/
-
buprenorphine/
-
(((substitut* or maint*) adj2 (treatment or therapy)) or methadone or buprenorphine or subutex or suboxone).ab,ti.
-
or/15‐18
-
exp Hepatitis C/
-
(hepatitis‐c or or hep c or hcv).ab,ti.
-
20 or 21
-
(9 or 19) and 14 and 22
EMBASE (embase.com)
'substance abuse'/exp OR 'substance abuse' OR ((substance* OR drug* OR opiate* OR opioid* OR heroin* OR morphin* OR morfin* OR narcot*) NEAR/6 (use* OR abus* OR misuse* OR addict* OR depend*)):ab,ti OR ((substance* OR drug*) NEAR/6 (inject* OR intravenous)):ab,ti AND ('hepatitis c'/exp OR 'hepatitis‐c':ab,ti OR 'hep c':ab,ti OR hcv:ab,ti) AND ('preventive health service'/exp OR ((needle* OR syringe* OR inject*) NEAR/3 exchange):ab,ti OR 'harm reduction'/exp OR (harm NEAR/2 reduc*):ab,ti OR ((needle* OR syringe* OR inject*) NEAR/3 (suppl* OR access* OR provision OR provid* OR distribut* OR dispens* OR pack*)):ab,ti OR ((needle* OR syringe* OR inject*) NEAR/3 (program* OR service* OR center* OR centre* OR scheme* OR facility OR facilities OR area* OR pharmacy OR pharmacies OR unit OR units OR room*)):ab,ti OR ((needle* OR syringe* OR inject* OR slot OR dispensing OR vending) NEAR/3 (machine* OR peer)):ab,ti OR 'opiate substitution treatment'/exp OR 'methadone'/exp OR methadone:ab,ti OR 'buprenorphine'/exp OR 'buprenorphine':ab,ti OR ((substitut* OR maint*) NEAR/2 (treatment OR therapy)):ab,ti OR subutex:ab,ti OR suboxone:ab,ti)
CINAHL (EBSCO)
-
(MH "Needle Exchange Programs")
-
TI((needle* OR syringe*OR inject*) N3 exchange) OR AB(needle* OR syringe* OR inject*) N3 exchange)
-
(MH "Harm Reduction")
-
TI (harm N2 reduc*) OR AB (harm N2 reduc*)
-
TI ((needle* OR syringe* OR inject*) N3 (suppl* OR access* OR provision OR provid* OR distribut* OR dispens* OR pack*) ) OR AB ( TI(needle* OR syringe* OR inject*) N3 (suppl* OR access* OR provision OR provid* OR distribut* OR dispens* OR pack*))
-
TI ((needle* OR syringe* OR inject*) N3 (program* OR service* OR center* OR centre* OR scheme* OR facility OR facilities OR area* OR pharmacy OR pharmacies OR unit OR units OR room*)) OR AB ( (needle* OR syringe* OR inject*) N3 (program* OR service* OR center* OR centre* OR scheme* OR facility or facilities OR area* OR pharmacy OR pharmacies OR unit OR units OR room*))
-
TI (((needle* OR syringe* OR inject* OR slot OR dispensing OR vending) N3 (machine*OR (peer N2 distrib*)))) OR AB ( ((needle* OR syringe* OR inject* OR slot OR dispensing OR vending) N3 (machine* OR (peer N2 distrib*))))
-
S1 OR S2 OR S3 OR S4 OR S5 OR S6 OR S7
-
(MH "Substance Abuse, Intravenous")
-
TI ((substance* OR drug* OR opiate* OR opioid* OR heroin* OR morphin* OR morfin* OR narcot*) N6 (use* OR abus* OR misuse* OR addict* OR depend*))
-
AB ((substance* OR drug* OR opiate* OR opioid* OR heroin* OR morphin* OR morfin* OR narcot*) N6 (use* OR abus* OR misuse* OR addict* ORdepend*))
-
TI (substance* OR drug*) AND TI (inject* OR intravenous)
-
AB(substance* OR drug* ) AND AB( inject* OR intravenous)
-
S9 OR S10 OR S11 OR S12 OR S13
-
(MH "Methadone") OR (MH "Buprenorphine")
-
TI (methadone or buprenorphine or subutex or suboxone) OR AB (methadone or buprenorphine or subutex or suboxone)
-
TX (substitut* or maint*) N2 (treatment or therapy)
-
S15 OR S16 OR S17
-
(MH "Hepatitis C+")
-
TI ( "hepatitis‐c" or "hep c" or hcv ) OR AB ( "hepatitis‐c" or "hep c" or hcv )
-
S19 OR S20
-
S8 OR S18
-
S14 AND S21 AND S22
Web of Science (THOMSON REUTERS)
-
TOPIC: (((needle* OR syringe* OR inject*) NEAR/3 exchange))
-
TOPIC: (harm NEAR/2 reduc*)
-
TOPIC: (((needle* OR syringe* OR inject*) NEAR/3 (suppl* OR access* OR provision OR provid* OR distribut* OR dispens* OR pack*)))
-
TOPIC: ((needle* or syringe* or inject*) near/3 (program* or service* or center* or centre* or scheme* or facility or facilities or area* or pharmacy or pharmacies or unit or units or room*))
-
TOPIC: ((needle* or syringe* or inject* or slot or dispensing or vending) NEAR/3 (machine* orpeer))
-
#5 OR #4 OR #3 OR #2 OR #1
-
TOPIC: (((substance* OR drug* OR opiate* OR opioid* OR heroin* OR morphin* OR morfin* OR narcot*) NEAR/6 (use* OR abus* OR misuse* OR addict* OR depend*)))
-
TOPIC: ((substance* or drug) and (inject* or intravenous))
-
#8 OR #7
-
TOPIC: ((substitut* or maint*) near/2 (treatment or therapy))
-
TOPIC: ((methadone or buprenorphine or subutex or suboxone))
-
#11 OR #10
-
TOPIC: ("Hepatitis C")
-
TOPIC: ("Hep C")
-
TOPIC: (HCV)
-
#15 OR #14 OR #13
-
#12 OR #6
-
#17 AND #16 AND #9
Indexes=SCI‐EXPANDED, SSCI, A&HCI Timespan=All years
Appendix 2. Search strategies to identify longitudinal studies
MEDLINE, PsycINFO & Global Health (Ovid)
-
Substance Abuse, Intravenous/
-
(substance$ or drug$).ab,ti.
-
(abuse$ or depend$ or use$ or misus$ or addict$).ab,ti.
-
(inject$ or intravenous).ab,ti.
-
1 or (2 and 3) or (2 and 4)
-
exp Hepatitis C/
-
(hepatitis‐c or hcv).ab,ti.
-
(HCV adj2 seroconvers$).ti,ab.
-
(HCV adj2 transmission).ti,ab.
-
or/6‐9
-
exp Cohort Studies/
-
exp Longitudinal Studies/
-
(prospective or longitudinal or cohort).ti,ab.
-
or/11‐13
-
5 and 10 and 14
-
Animals/
-
15 not 16
Embase (embase.com)
'substance abuse'/exp OR ((substance* OR drug* OR opiate* OR opioid* OR heroin* OR morphin* OR morfin* OR narcot*) NEAR/6 (use* OR abus* OR misuse* OR addict* OR depend*)):ab,ti OR ((substance* OR drug*) NEAR/6 (inject* OR intravenous)):ab,ti AND ('hepatitis c'/exp OR 'hepatitis‐c':ab,ti OR 'hep c':ab,ti ORhcv:ab,ti) AND ('cohort analysis'/exp OR 'longitudinal study'/exp OR prospective:ab,ti OR longitudinal:ab,ti OR cohort:ab,ti)
CINAHL (EBSCO)
-
(MH "Substance Abuse, Intravenous")
-
TI ((substance* OR drug* OR opiate* OR opioid* OR heroin* OR morphin* OR morfin* OR narcot*) N6 (use* OR abus* OR misuse* OR addict* OR depend*))
-
AB ((substance* OR drug* OR opiate* OR opioid* OR heroin* OR morphin* OR morfin* OR narcot*) N6 (use* OR abus* OR misuse* OR addict* OR depend*))
-
TI ( substance* OR drug* ) AND TI ( inject* OR intravenous )
-
AB( substance* OR drug* ) AND AB( inject* OR intravenous )
-
S1 OR S2 OR S3 OR S4 OR S5
-
(MH "Hepatitis C+")
-
TI ( "hepatitis‐c" or "hep c" or hcv ) OR AB ( "hepatitis‐c" or "hep c" or hcv )
-
S7 OR S8
-
(MH "Prospective Studies+")
-
TI ( prospective or longitudinal or cohort ) OR AB ( prospective or longitudinal or cohort )
-
S10 OR S11
-
S6 AND S9 AND S12
Web of Science (THOMSON REUTERS)
-
TOPIC: (((substance* OR drug* OR opiate* OR opioid* OR heroin* OR morphin* OR morfin* OR narcot*) NEAR/6 (use* OR abus* OR misuse* OR addict* OR depend*)))
-
TOPIC: ((substance* or drug) and (inject* or intravenous))
-
#1 OR #2
-
TOPIC: ("Hepatitis C")
-
TOPIC: ("Hep C")
-
TOPIC: (HCV)
-
#4 OR #5 OR #6
-
TOPIC: (prospective or longitudinal or cohort)
-
#3 AND #7 AND #8
Indexes=SCI‐EXPANDED, SSCI, A&HCI Timespan=All years
Appendix 3. Criteria for risk of bias assessment for RCTs
| Item | Judgment | Description |
| 1. Random sequence generation (selection bias) | Low risk | The investigators describe a random component in the sequence generation process such as: random number table; computer random number generator; coin tossing; shuffling cards or envelopes; throwing dice; drawing of lots; minimisation. |
| High risk | The investigators describe a non‐random component in the sequence generation process such as: odd or even date of birth; date (or day) of admission; hospital or clinic record number; alternation; judgment of the clinician; results of a laboratory test or a series of tests; availability of the intervention. | |
| Unclear risk | Insufficient information about the sequence generation process to permit judgment of low or high risk | |
| 2. Allocation concealment (selection bias) | Low risk | Investigators enrolling participants could not foresee assignment because one of the following, or an equivalent method, was used to conceal allocation: central allocation (including telephone, web‐based, and pharmacy‐controlled, randomisation); sequentially‐numbered drug containers of identical appearance; sequentially‐numbered, opaque, sealed envelopes. |
| High risk | Investigators enrolling participants could possibly foresee assignments because one of the following method was used: open random allocation schedule (e.g. a list of random numbers); assignment envelopes without appropriate safeguards (e.g. if envelopes were unsealed or nonopaque or not sequentially numbered); alternation or rotation; date of birth; case record number; any other explicitly unconcealed procedure. | |
| Unclear risk | Insufficient information to permit judgment of low or high risk. This is usually the case if the method of concealment is not described or not described in sufficient detail to allow a definite judgment. | |
| 3. Blinding of participants and providers (performance bias) Objective outcomes | Low risk | No blinding or incomplete blinding, but the review authors judge that the outcome is not likely to be influenced by lack of blinding Blinding of participants and key study personnel ensured, and unlikely that the blinding could have been broken |
| High risk | No blinding or incomplete blinding, and the outcome is likely to be influenced by lack of blinding Blinding of key study participants and personnel attempted, but likely that the blinding could have been broken, and the outcome is likely to be influenced by lack of blinding | |
| Unclear risk | Insufficient information to permit judgment of low or high risk | |
| 4. Blinding of participants and providers (performance bias) Subjective outcomes | Low risk | Blinding of participants and providers ensured and unlikely that the blinding could have been broken |
| High risk | No blinding or incomplete blinding, and the outcome is likely to be influenced by lack of blinding Blinding of key study participants and personnel attempted, but likely that the blinding could have been broken, and the outcome is likely to be influenced by lack of blinding | |
| Unclear risk | Insufficient information to permit judgment of low or high risk | |
| 5. Blinding of outcome assessor (detection bias) Objective outcomes | Low risk | No blinding of outcome assessment, but the review authors judge that the outcome measurement is not likely to be influenced by lack of blinding Blinding of outcome assessment ensured, and unlikely that the blinding could have been broken |
| High risk | No blinding of outcome assessment, and the outcome measurement is likely to be influenced by lack of blinding Blinding of outcome assessment, but likely that the blinding could have been broken, and the outcome measurement is likely to be influenced by lack of blinding | |
| Unclear risk | Insufficient information to permit judgment of low or high risk | |
| 6.Blinding of outcome assessor (detection bias) Subjective outcomes | Low risk | Blinding of outcome assessment ensured, and unlikely that the blinding could have been broken |
| High risk | No blinding of outcome assessment, and the outcome measurement is likely to be influenced by lack of blinding Blinding of outcome assessment, but likely that the blinding could have been broken, and the outcome measurement is likely to be influenced by lack of blinding | |
| Unclear risk | Insufficient information to permit judgment of low or high risk | |
| 7. Incomplete outcome data (attrition bias) For all outcomes except retention in treatment or drop out | Low risk | No missing outcome data Reasons for missing outcome data unlikely to be related to true outcome (for survival data, censoring unlikely to be introducing bias) Missing outcome data balanced in numbers across intervention groups, with similar reasons for missing data across groups For dichotomous outcome data, the proportion of missing outcomes compared with observed event risk not enough to have a clinically‐relevant impact on the intervention effect estimate For continuous outcome data, plausible effect size (difference in means or standardised difference in means) among missing outcomes not enough to have a clinically‐relevant impact on observed effect size Missing data have been imputed using appropriate methods All randomised patients are reported/analysed in the group they were allocated to by randomisation irrespective of non‐compliance and co‐interventions (intention to treat) |
| High risk | Reason for missing outcome data likely to be related to true outcome, with either imbalance in numbers or reasons for missing data across intervention groups For dichotomous outcome data, the proportion of missing outcomes compared with observed event risk enough to induce clinically relevant bias in intervention effect estimate For continuous outcome data, plausible effect size (difference in means or standardised difference in means) among missing outcomes enough to induce clinically relevant bias in observed effect size 'As‐treated' analysis done with substantial departure of the intervention received from that assigned at randomisation | |
| Unclear risk | Insufficient information to permit judgment of low or high risk (e.g. number randomised not stated, no reasons for missing data provided; number of dropout not reported for each group) | |
| 8 Selective reporting (reporting bias) | Low risk | The study protocol is available and all of the study's pre‐specified (primary and secondary) outcomes that are of interest in the review have been reported in the pre‐specified way The study protocol is not available but it is clear that the published reports include all expected outcomes, including those that were pre‐specified (convincing text of this nature may be uncommon) |
| High risk | Not all of the study's pre‐specified primary outcomes have been reported One or more primary outcomes is reported using measurements, analysis methods or subsets of the data (e.g. subscales) that were not pre‐specified One or more reported primary outcomes were not pre‐specified (unless clear justification for their reporting is provided, such as an unexpected adverse effect); One or more outcomes of interest in the review are reported incompletely so that they cannot be entered in a meta‐analysis The study report fails to include results for a key outcome that would be expected to have been reported for such a study | |
| Unclear risk | Insufficient information to permit judgment of low or high risk |
Appendix 4. Criteria for risk of bias assessment for observational studies
| Domain | Judgment | Description |
| Bias due to confounding | Low risk (the study is comparable to a well‐performed randomised trial with regard to this domain) | No confounding expected |
| Moderate risk (the study is sound for a non‐randomised study with regard to this domain but cannot be considered comparable to a well performed randomised trial) | Confounding expected, all known critically important confounding domains appropriately measured and adjusted for; and Reliability and validity of measurement of a critically important domains were sufficient that we do not expect serious residual confounding. | |
| Serious risk (the study has some important problems) | At least one known critically important domain not appropriately measured, or not adjusted for; or Reliability or validity of measurement of a critically important domain was low enough that we expect serious residual confounding. | |
| Critical risk (the study is too problematic to provide any useful evidence on the effects of intervention) | Confounding inherently not controllable, or use of negative controls strongly suggests unmeasured confounding | |
| No information on which to base a judgment about risk of bias for this domain | No information on whether confounding might be present | |
| Bias in selection of participants into the study | Low risk | All participants who would have been eligible for the target trial were included in the study and start of follow‐up and start of intervention coincide for all participants |
| Moderate risk | Selection into the study may have been related to intervention and outcome, but the authors used appropriate methods to adjust for the selection bias; or Start of follow‐up and start of intervention do not coincide for all participants, but the proportion of participants for which this was the case was too low to induce important bias; the authors used appropriate methods to adjust for the selection bias; or the review authors are confident that the rate (hazard) ratio for the effect of intervention remains constant over time. | |
| Serious risk | Selection into the study was related to intervention and outcome; or Start of follow‐up and start of intervention do not coincide, and a potentially important amount of follow‐up time is missing from analyses, and the rate ratio is not constant over time. | |
| Critical risk | Selection into the study was strongly related to intervention and outcome; or A substantial amount of follow‐up time is likely to be missing from analyses, and the rate ratio is not constant over time. | |
| No information | No information is reported about selection of participants into the study or whether start of follow‐up and start of intervention coincide | |
| Bias in measurement of interventions | Low risk | Intervention status is well defined and based solely on information collected at the time of intervention |
| Moderate risk | Intervention status is well defined but some aspects of the assignments of intervention status were determined retrospectively | |
| Serious risk | Intervention status is not well defined, or major aspects of the assignments of intervention status were determined in a way that could have been affected by knowledge of the outcome | |
| Critical risk | (Unusual) An extremely high amount of misclassification of intervention status, e.g. because of unusually strong recall biases | |
| No information | No definition of intervention or no explanation of the source of information about intervention status | |
| Bias due to departures from intended interventions | Low risk | No bias due to departure from the intended intervention is expected, for example if both the intervention and comparator are implemented over a short time period, and subsequent interventions are part of routine medical care, or if the specified comparison relates to initiation of intervention regardless of whether it is continued |
| Moderate risk | Bias due to departure from the intended intervention is expected, and switches, co‐interventions, and some problems with intervention fidelity are appropriately measured and adjusted for in the analyses. Alternatively, most (but not all) departures from intended intervention reflect the natural course of events after initiation of intervention. | |
| Serious risk | Switches in treatment, co‐interventions, or problems with implementation fidelity are apparent and are not adjusted for in the analyses. | |
| Critical risk | Substantial departures from the intended intervention are present and are not adjusted for in the analysis. | |
| No information | No information is reported on whether there is departure from the intended intervention. | |
| Bias due to missing data | Low risk | Data were reasonably complete; or Proportions and reasons of missing participants were similar across intervention groups; or Analyses that addressed missing data are likely to have removed any risk of bias. |
| Moderate risk | Proportions of missing participants differ across interventions or reasons for missingness differ minimally across interventions; and Missing data were not addressed in the analysis. | |
| Serious risk | Proportions of missing participants differ substantially across interventions or reasons for missingness differ substantially across interventions; and Missing data were addressed inappropriately in the analysis; or The nature of the missing data means that the risk of bias cannot be removed through appropriate analysis. | |
| Critical risk | (Unusual) There were critical differences between interventions in participants with missing data that were not, or could not, be addressed through appropriate analysis. | |
| No information | No information is reported about missing data or the potential for data to be missing | |
| Bias in measurement of outcomes | Low risk | The methods of outcome assessment were comparable across intervention groups; and The outcome measure was unlikely to be influenced by knowledge of the intervention received by study participants (i.e. is objective) or the outcome assessors were unaware of the intervention received by study participants; and Any error in measuring the outcome is unrelated to intervention status. |
| Moderate risk | The methods of outcome assessment were comparable across intervention groups; and The outcome measure is only minimally influenced by knowledge of the intervention received by study participants; and Any error in measuring the outcome is only minimally related to intervention status. | |
| Serious risk | The methods of outcome assessment were not comparable across intervention groups; or The outcome measure was subjective (i.e. likely to be influenced by knowledge of the intervention received by study participants) and was assessed by outcome assessors aware of the intervention received by study participants; or Error in measuring the outcome was related to intervention status. | |
| Critical risk | The methods of outcome assessment were so different that they cannot reasonably be compared across intervention groups. | |
| No information | No information is reported about the methods of outcome assessment. | |
| Bias in selection of the reported result | Low risk | There is clear evidence (usually through examination of a pre‐registered protocol or statistical analysis plan) that all reported results correspond to all intended outcomes, analyses and sub‐cohorts. |
| Moderate risk | The outcome measurements and analyses are consistent with an a priori plan; or are clearly defined, and internally and externally consistent; and There is no indication of selection of the reported analysis from among multiple analyses; and There is no indication of selection of the cohort or subgroups for analysis and reporting on the basis of the results. | |
| Serious risk | Outcome measurements or analyses are internally or externally inconsistent; or There is a high risk of selective reporting from among multiple analyses; or The cohort or subgroup is selected from a larger study for analysis and appears to be reported on the basis of the results. | |
| Critical risk | There is evidence or strong suspicion of selective reporting of results, and the unreported results are likely to be substantially different from the reported results. | |
| No information | There is too little information to make a judgment, for example if only an abstract is available for the study. | |
| Overall judgment about risk of bias | Low risk | The study is judged to be at low risk of bias for all domains. |
| Moderate risk | The study is judged to be at low or moderate risk of bias for all domains. | |
| Serious risk | The study is judged to be at serious risk of bias in at least one domain, but not at critical risk of bias in any domain. | |
| Critical risk | The study is judged to be at critical risk of bias in at least one domain. | |
| No information | There is no clear indication that the study is at serious or critical risk of bias and there is a lack of information in one or more key domains of bias (a judgment is required for this). |

Study flow diagram.
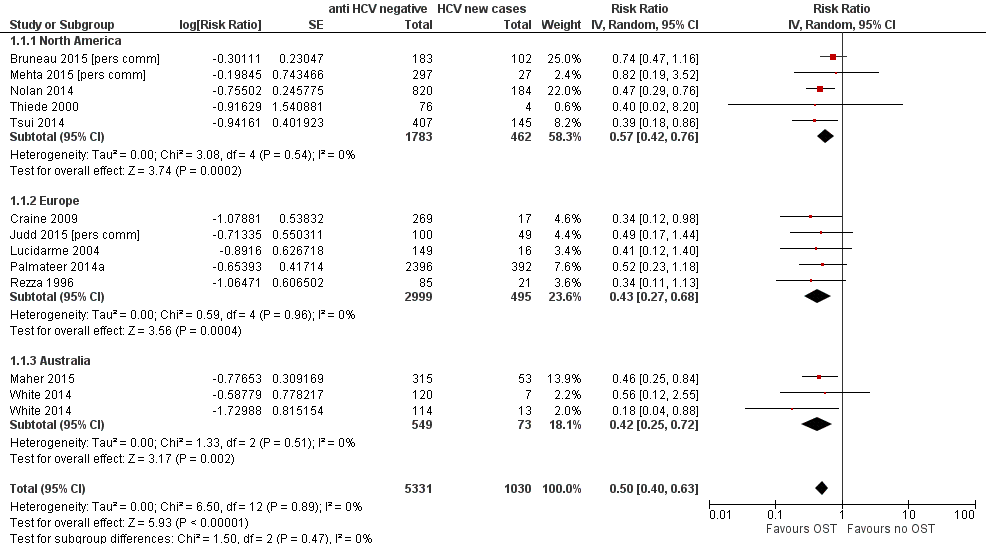
Forest plot of comparison: 1 Current OST versus no OST, outcome: 1.1 HCV incidence adjusted analyses by region.

Funnel plot of comparison: 1 Current OST versus no OST, outcome: 1.1 HCV incidence adjusted analyses by region.

Forest plot of comparison: 2 High NSP coverage versus no/low NSP coverage, outcome: 2.1 HCV incidence adjusted analyses by region.
Forest plot of comparison: 4 Combined OST and high/low NSP versus no OST and low/no NSP, outcome: 4.1 HCV incidence adjusted analyses.

Comparison 1 Current OST versus no OST, Outcome 1 HCV incidence adjusted analyses by region.

Comparison 1 Current OST versus no OST, Outcome 2 HCV incidence adjusted analysis by study design.
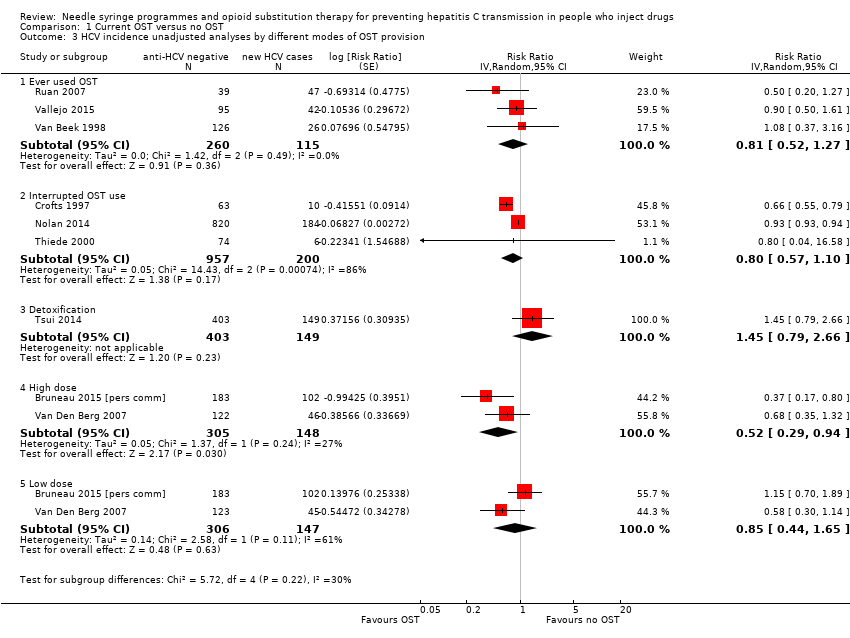
Comparison 1 Current OST versus no OST, Outcome 3 HCV incidence unadjusted analyses by different modes of OST provision.
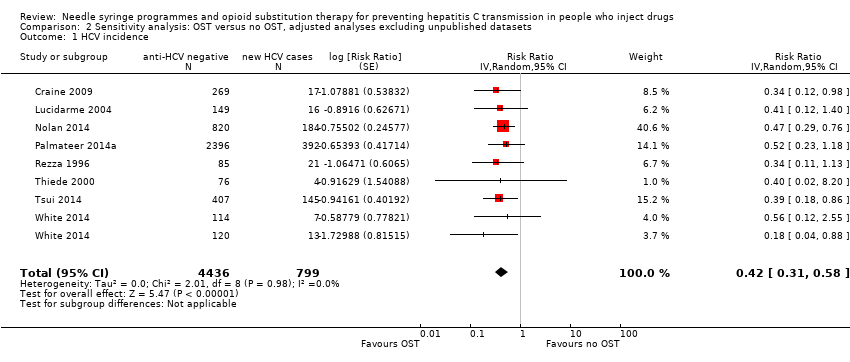
Comparison 2 Sensitivity analysis: OST versus no OST, adjusted analyses excluding unpublished datasets, Outcome 1 HCV incidence.

Comparison 3 Sensitivity analysis: OST versus no OST, adjusted analyses excluding studies at critical risk of bias, Outcome 1 HCV incidence.

Comparison 4 Sensitivity analysis: OST versus no OST, adjusted analyses excluding cross‐sectional studies, Outcome 1 HCV incidence.

Comparison 5 OST versus no OST, unadjusted analysis, Outcome 1 HCV incidence.

Comparison 6 High NSP coverage versus no/low NSP coverage, Outcome 1 HCV incidence adjusted analyses by region.

Comparison 6 High NSP coverage versus no/low NSP coverage, Outcome 2 HCV incidence adjusted analyses by study design.
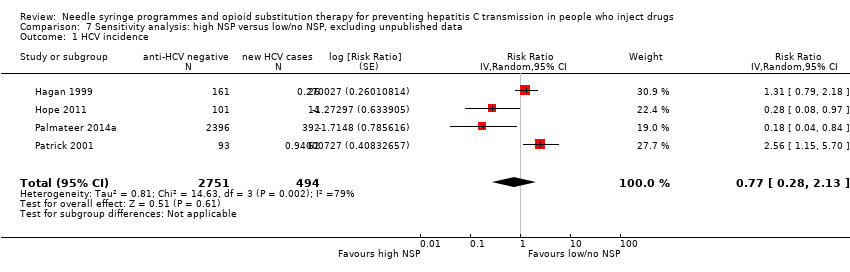
Comparison 7 Sensitivity analysis: high NSP versus low/no NSP, excluding unpublished data, Outcome 1 HCV incidence.

Comparison 8 Sensitivity analysis: high NSP versus low/no NSP, excluding cross‐sectional surveys, Outcome 1 HCV incidence.

Comparison 9 High NSP coverage versus low/no coverage, unadjusted estimates, Outcome 1 HCV incidence.

Comparison 10 Low NSP coverage versus no coverage, Outcome 1 HCV incidence, adjusted analyses.

Comparison 11 Low NSP coverage versus no NSP, unadjusted analysis, Outcome 1 HCV incidence.

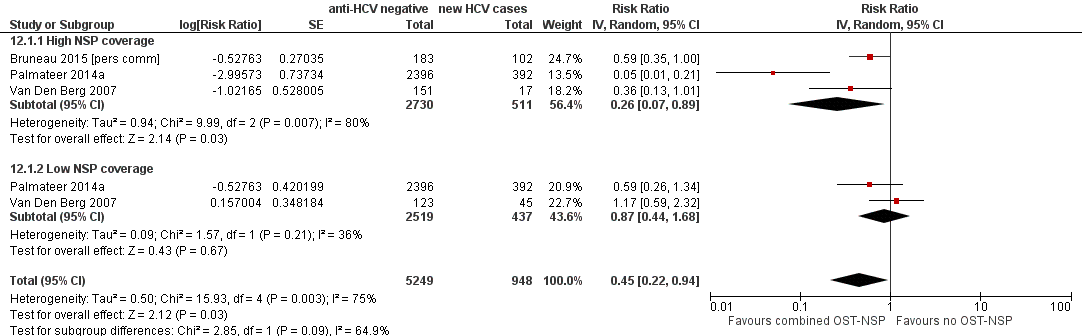
Comparison 12 Combined OST and high/low NSP versus no OST and low/no NSP, Outcome 1 HCV incidence adjusted analyses.
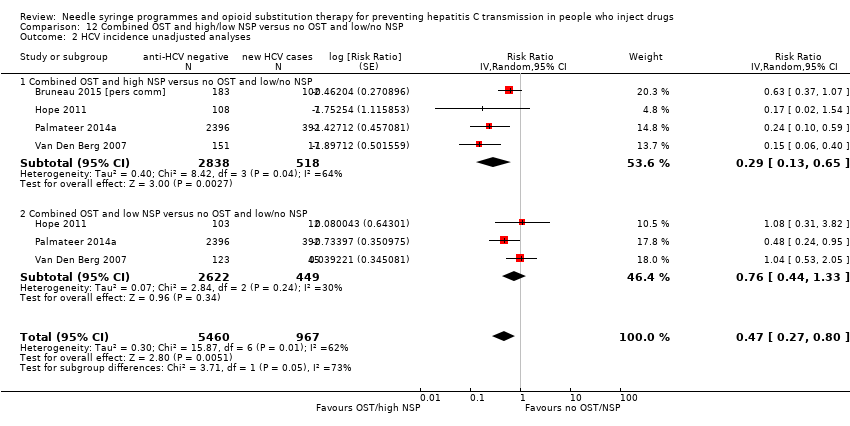
Comparison 12 Combined OST and high/low NSP versus no OST and low/no NSP, Outcome 2 HCV incidence unadjusted analyses.
| Current OST versus no OST | |||||
| Patient or population: people who inject drugs | |||||
| Outcomes | Illustrative comparative risks* (95% CI) | Relative effect | No of participants | Quality of the evidence | |
| Assumed risk | Corresponding risk | ||||
| No OST | Current OST | ||||
| HCV incidence adjusted analyses | — | — | RR 0.50 (0.40 to 0.63) | 6361 | ⊕⊕⊝⊝ |
| *The basis for the assumed risk (e.g. the median control group risk across studies) is provided in footnotes. The corresponding risk (and its 95% confidence interval) is based on the assumed risk in the comparison group and the relative effect of the intervention (and its 95% CI). | |||||
| GRADE Working Group grades of evidence | |||||
| aDowngraded one level due to overall moderate risk of bias in 2 studies, overall serious risk of bias in 6 studies, 2 studies at overall critical risk of bias in 2 studies; not enough information to make judgment in 2 studies. | |||||
| High NSP coverage versus no/low NSP coverage | |||||
| Patient or population: people who inject drugs | |||||
| Outcomes | Illustrative comparative risks* (95% CI) | Relative effect | No of participants | Quality of the evidence | |
| Assumed risk | Corresponding risk | ||||
| No/low NSP coverage | High NSP coverage | ||||
| HCV incidence adjusted analyses | — | — | RR: 0.79 (0.39 to 1.61) | 3530 | ⊕⊝⊝⊝ |
| *The basis for the assumed risk (e.g. the median control group risk across studies) is provided in footnotes. The corresponding risk (and its 95% confidence interval) is based on the assumed risk in the comparison group and the relative effect of the intervention (and its 95% CI). | |||||
| GRADE Working Group grades of evidence | |||||
| aDowngraded one level due to serious overall risk of bias in all the studies. | |||||
| Combined OST and highNSP versus no OST and low/no NSP | |||||
| Patient or population: people who inject drugs | |||||
| Outcomes | Illustrative comparative risks* (95% CI) | Relative effect | No of participants | Quality of the evidence | |
| Assumed risk | Corresponding risk | ||||
| No OST and low/no NSP | Combined OST and high NSP | ||||
| HCV incidence adjusted analyses | — | — | RR: 0.26 (0.07 to 0.89) | 3241 | ⊕⊕⊕⊝ Lowa,b |
| *The basis for the assumed risk (e.g. the median control group risk across studies) is provided in footnotes. The corresponding risk (and its 95% confidence interval) is based on the assumed risk in the comparison group and the relative effect of the intervention (and its 95% CI). | |||||
| GRADE Working Group grades of evidence | |||||
| aDowngraded one level due to serious overall risk of bias in all studies. | |||||
| Study | Confounding | Selection bias | Measurement of interventions | Departures from intended interventions | Missing data | Measurement of outcomes | Selection of reported result | Overall risk of bias |
| Critical | Critical | Serious | No info | Critical | Low | No info | Critical | |
| Moderate | Serious | Moderate | No info | No info | Low | Low | Serious | |
| Serious | Serious | Serious | No info | Serious | Low | Low | Serious | |
| Critical | Serious | Low | No info | Serious | Serious | Low | Critical | |
| Serious | Serious | Serious | No info | Low | Low | Low | Serious | |
| Moderate | Serious | Low | No info | Low | Low | Low | Serious | |
| Serious | Serious | Moderate | No info | No info | Low | Low | Serious | |
| Moderate | Moderate | Serious | No info | Low | Low | Low | Serious | |
| Moderate | Moderate | Serious | No info | No info | Low | Low | Serious | |
| Moderate | Critical | Critical | No info | Critical | Low | Low | Critical | |
| Moderate | Serious | Serious | No info | Serious | Low | Low | Serious | |
| Moderate | Serious | Serious | No info | No info | Low | Low | Serious | |
| Moderate | No info | No info | No info | No info | Low | Low | No info | |
| Serious | Serious | Moderate | No info | Low | Low | Low | Serious | |
| Moderate | No info | No info | No info | No info | Low | Low | No info | |
| Serious | Serious | Moderate | No info | Serious | Low | Low | Serious | |
| Serious | Moderate | Serious | No info | Serious | Low | Low | Serious | |
| Serious | Low | Serious | No info | Critical | Low | Low | Critical | |
| Serious | Serious | Serious | No info | Critical | Low | Low | Critical | |
| Critical | Critical | Serious | No info | Serious | Low | Low | Critical | |
| Serious | Serious | Moderate | No info | Low | Low | Low | Serious | |
| Moderate | Moderate | Low | No info | Low | Low | Low | Moderate | |
| Serious | Serious | Serious | No info | Moderate | Low | Low | Serious | |
| Moderate | Moderate | Low | No info | Moderate | Low | Low | Moderate | |
| Serious | Serious | Low | No info | Serious | Low | Low | Serious | |
| Critical | Serious | Serious | No info | Critical | Low | Low | Critical | |
| Serious | Serious | Moderate | No info | Serious | Low | Low | Serious | |
| Moderate | Serious | Moderate | No info | No info | Low | Low | Serious |
| Variable | Studies | Univariable rate ratio (95% CI) | Ratio of rate ratios (95% CI) | P value | Tau2 |
| Geographic region | |||||
| Europe | 8 | 0.51 (0.37‐0.70) | 1.0 (ref) | — | — |
| Australia | 5 | 0.55 (0.28‐1.11) | 1.12 (0.52‐2.41) | — | — |
| North America | 6 | 0.69 (0.44‐1.08) | 1.42 (0.73‐2.78) | 0.53 | 0.10 |
| Site of recruitment | |||||
| Service attenders | 12 | 0.67 (0.49‐0.92) | 1.0 (ref) | — | — |
| Community | 7 | 0.49 (0.33‐0.73) | 0.73 (0.42‐1.27) | 0.256 | 0.06 |
| Study design | |||||
| Cross‐sectional | 4 | 0.51 (0.31‐0.85) | 1.0 | — | — |
| Prospective cohort | 15 | 0.58 (0.43‐0.77) | 1.12 (0.48‐2.61) | 0.784 | 0.10 |
| Females | 17 | — | 1.59 (1.13‐2.29) | 0.01 | 0.04 |
| Prison experience | 11 | — | 1.057 (0.61‐1.79) | 0.821 | 0.43 |
| Experience of homelessness | 12 | — | 1.08 (0.83‐1.40) | 0.521 | 0.23 |
| Injection of stimulants | 12 | — | 0.89 (0.65‐1.22) | 0.373 | 0.17 |
| Daily injection | 7 | — | 0.88 (0.64‐1.22) | 0.373 | 0.17 |
| CI: confidence interval; HCV: hepatitis C virus; OST: opioid substitution therapy. | |||||
| Variable | Studies | Univariable rate ratio (95%CI) | Ratio of rate ratios (95%CI) | P value | Tau2 |
| Geographic region | |||||
| Europe | 5 | 0.44 (0.24‐0.80) | 1.0 (Ref) | — | — |
| North America | 3 | 1.58 (0.57‐4.42) | 3.73 (0.95‐14.7) | 0.057 | 0.41 |
| Recruitment site | |||||
| Service attenders | 3 | 0.67 (0.28‐1.59) | 1.0 (Ref) | — | — |
| Community | 5 | 0.82 (0.29‐2.32) | 0.76(0.12‐4.88) | 0.74 | 0.89 |
| Study design | |||||
| Cross‐sectional survey | 3 | 0.34 (0.16‐0.75) | 1.0 (Ref) | — | — |
| Prospective cohort | 4 | 1.26 (0.55‐2.93) | 3.53 (0.78‐15.86) | 0.087 | 0.48 |
| Females | 7 | — | 2.97(0.38‐23.1) | 0.24 | 0.87 |
| Prison experience | 3 | — | NA | — | — |
| Experience of homelessness | 6 | — | 1.01 (0.38‐2.67) | 0.976 | 1.53 |
| Injection of stimulants | 7 | — | 1.08 (0.47‐2.51) | 0.827 | 1.15 |
| Daily injection | 5 | — | 3.66 (0.22‐61.3) | 0.239 | 1.15 |
| CI: confidence interval; HCV: hepatitis C virus; NSP: needle syringe programmes. | |||||
| Outcome or subgroup title | No. of studies | No. of participants | Statistical method | Effect size |
| 1 HCV incidence adjusted analyses by region Show forest plot | 12 | 6361 | Risk Ratio (Random, 95% CI) | 0.50 [0.40, 0.63] |
| 1.1 North America | 5 | 2245 | Risk Ratio (Random, 95% CI) | 0.57 [0.42, 0.76] |
| 1.2 Europe | 5 | 3494 | Risk Ratio (Random, 95% CI) | 0.43 [0.27, 0.68] |
| 1.3 Australia | 2 | 622 | Risk Ratio (Random, 95% CI) | 0.42 [0.25, 0.72] |
| 2 HCV incidence adjusted analysis by study design Show forest plot | 12 | 6361 | Risk Ratio (Random, 95% CI) | 0.50 [0.40, 0.63] |
| 2.1 Prospective cohort | 10 | 3467 | Risk Ratio (Random, 95% CI) | 0.51 [0.40, 0.65] |
| 2.2 Cross‐sectional surveys | 2 | 2894 | Risk Ratio (Random, 95% CI) | 0.46 [0.23, 0.89] |
| 3 HCV incidence unadjusted analyses by different modes of OST provision Show forest plot | 9 | Risk Ratio (Random, 95% CI) | Subtotals only | |
| 3.1 Ever used OST | 3 | 375 | Risk Ratio (Random, 95% CI) | 0.81 [0.52, 1.27] |
| 3.2 Interrupted OST use | 3 | 1157 | Risk Ratio (Random, 95% CI) | 0.80 [0.57, 1.10] |
| 3.3 Detoxification | 1 | 552 | Risk Ratio (Random, 95% CI) | 1.45 [0.79, 2.66] |
| 3.4 High dose | 2 | 453 | Risk Ratio (Random, 95% CI) | 0.52 [0.29, 0.94] |
| 3.5 Low dose | 2 | 453 | Risk Ratio (Random, 95% CI) | 0.85 [0.44, 1.65] |
| Outcome or subgroup title | No. of studies | No. of participants | Statistical method | Effect size |
| 1 HCV incidence Show forest plot | 8 | 5235 | Risk Ratio (Random, 95% CI) | 0.42 [0.31, 0.58] |
| Outcome or subgroup title | No. of studies | No. of participants | Statistical method | Effect size |
| 1 HCV incidence Show forest plot | 9 | 5782 | Risk Ratio (Random, 95% CI) | 0.51 [0.40, 0.64] |
| Outcome or subgroup title | No. of studies | No. of participants | Statistical method | Effect size |
| 1 HCV incidence Show forest plot | 10 | 3467 | Risk Ratio (Random, 95% CI) | 0.51 [0.40, 0.65] |
| Outcome or subgroup title | No. of studies | No. of participants | Statistical method | Effect size |
| 1 HCV incidence Show forest plot | 16 | 9499 | Risk Ratio (Random, 95% CI) | 0.57 [0.45, 0.73] |
| Outcome or subgroup title | No. of studies | No. of participants | Statistical method | Effect size |
| 1 HCV incidence adjusted analyses by region Show forest plot | 5 | 3530 | Risk Ratio (Random, 95% CI) | 0.79 [0.39, 1.61] |
| 1.1 North America | 3 | 627 | Risk Ratio (Random, 95% CI) | 1.25 [0.63, 2.46] |
| 1.2 Europe | 2 | 2903 | Risk Ratio (Random, 95% CI) | 0.24 [0.09, 0.62] |
| 2 HCV incidence adjusted analyses by study design Show forest plot | 5 | 3530 | Risk Ratio (Random, 95% CI) | 0.95 [0.50, 1.82] |
| 2.1 Prospective cohorts | 3 | 627 | Risk Ratio (Random, 95% CI) | 1.44 [1.01, 2.05] |
| 2.2 Cross‐sectional surveys | 2 | 2903 | Risk Ratio (Random, 95% CI) | 0.24 [0.09, 0.62] |
| Outcome or subgroup title | No. of studies | No. of participants | Statistical method | Effect size |
| 1 HCV incidence Show forest plot | 4 | 3245 | Risk Ratio (Random, 95% CI) | 0.77 [0.28, 2.13] |
| Outcome or subgroup title | No. of studies | No. of participants | Statistical method | Effect size |
| 1 HCV incidence Show forest plot | 3 | 627 | Risk Ratio (Random, 95% CI) | 1.25 [0.63, 2.46] |
| Outcome or subgroup title | No. of studies | No. of participants | Statistical method | Effect size |
| 1 HCV incidence Show forest plot | 7 | 6455 | Risk Ratio (Random, 95% CI) | 0.78 [0.39, 1.55] |
| Outcome or subgroup title | No. of studies | No. of participants | Statistical method | Effect size |
| 1 HCV incidence, adjusted analyses Show forest plot | 6 | 2765 | Risk Ratio (Random, 95% CI) | 1.43 [0.82, 2.49] |
| Outcome or subgroup title | No. of studies | No. of participants | Statistical method | Effect size |
| 1 HCV incidence Show forest plot | 9 | 3242 | Risk Ratio (Random, 95% CI) | 1.41 [0.95, 2.09] |
| Outcome or subgroup title | No. of studies | No. of participants | Statistical method | Effect size |
| 1 HCV incidence adjusted analyses Show forest plot | 3 | 6197 | Risk Ratio (Random, 95% CI) | 0.45 [0.22, 0.94] |
| 1.1 High NSP coverage | 3 | 3241 | Risk Ratio (Random, 95% CI) | 0.26 [0.07, 0.89] |
| 1.2 Low NSP coverage | 2 | 2956 | Risk Ratio (Random, 95% CI) | 0.87 [0.44, 1.68] |
| 2 HCV incidence unadjusted analyses Show forest plot | 4 | 6427 | Risk Ratio (Random, 95% CI) | 0.47 [0.27, 0.80] |
| 2.1 Combined OST and high NSP versus no OST and low/no NSP | 4 | 3356 | Risk Ratio (Random, 95% CI) | 0.29 [0.13, 0.65] |
| 2.2 Combined OST and low NSP versus no OST and low/no NSP | 3 | 3071 | Risk Ratio (Random, 95% CI) | 0.76 [0.44, 1.33] |