Program picagari jarum dan terapi penggantian opioid untuk mencegah transmisi hepatitis C dalam kalangan orang yang menyuntik dadah
Abstract
Background
Needle syringe programmes and opioid substitution therapy for preventing hepatitis C transmission in people who inject drugs
Needle syringe programmes (NSP) and opioid substitution therapy (OST) are the primary interventions to reduce hepatitis C (HCV) transmission in people who inject drugs. There is good evidence for the effectiveness of NSP and OST in reducing injecting risk behaviour and increasing evidence for the effectiveness of OST and NSP in reducing HIV acquisition risk, but the evidence on the effectiveness of NSP and OST for preventing HCV acquisition is weak.
Objectives
To assess the effects of needle syringe programmes and opioid substitution therapy, alone or in combination, for preventing acquisition of HCV in people who inject drugs.
Search methods
We searched the Cochrane Drug and Alcohol Register, CENTRAL, the Cochrane Database of Systematic Reviews (CDSR), the Database of Abstracts of Reviews of Effects (DARE), the Health Technology Assessment Database (HTA), the NHS Economic Evaluation Database (NHSEED), MEDLINE, Embase, PsycINFO, Global Health, CINAHL, and the Web of Science up to 16 November 2015. We updated this search in March 2017, but we have not incorporated these results into the review yet. Where observational studies did not report any outcome measure, we asked authors to provide unpublished data. We searched publications of key international agencies and conference abstracts. We reviewed reference lists of all included articles and topic‐related systematic reviews for eligible papers.
Selection criteria
We included prospective and retrospective cohort studies, cross‐sectional surveys, case‐control studies and randomised controlled trials that measured exposure to NSP and/or OST against no intervention or a reduced exposure and reported HCV incidence as an outcome in people who inject drugs. We defined interventions as current OST (within previous 6 months), lifetime use of OST and high NSP coverage (regular attendance at an NSP or all injections covered by a new needle/syringe) or low NSP coverage (irregular attendance at an NSP or less than 100% of injections covered by a new needle/syringe) compared with no intervention or reduced exposure.
Data collection and analysis
We followed the standard Cochrane methodological procedures incorporating new methods for classifying risk of bias for observational studies. We described study methods against the following 'Risk of bias' domains: confounding, selection bias, measurement of interventions, departures from intervention, missing data, measurement of outcomes, selection of reported results; and we assigned a judgment (low, moderate, serious, critical, unclear) for each criterion.
Main results
We identified 28 studies (21 published, 7 unpublished): 13 from North America, 5 from the UK, 4 from continental Europe, 5 from Australia and 1 from China, comprising 1817 incident HCV infections and 8806.95 person‐years of follow‐up. HCV incidence ranged from 0.09 cases to 42 cases per 100 person‐years across the studies. We judged only two studies to be at moderate overall risk of bias, while 17 were at serious risk and 7 were at critical risk; for two unpublished datasets there was insufficient information to assess bias. As none of the intervention effects were generated from RCT evidence, we typically categorised quality as low. We found evidence that current OST reduces the risk of HCV acquisition by 50% (risk ratio (RR) 0.50, 95% confidence interval (CI) 0.40 to 0.63, I2 = 0%, 12 studies across all regions, N = 6361), but the quality of the evidence was low. The intervention effect remained significant in sensitivity analyses that excluded unpublished datasets and papers judged to be at critical risk of bias. We found evidence of differential impact by proportion of female participants in the sample, but not geographical region of study, the main drug used, or history of homelessness or imprisonment among study samples.
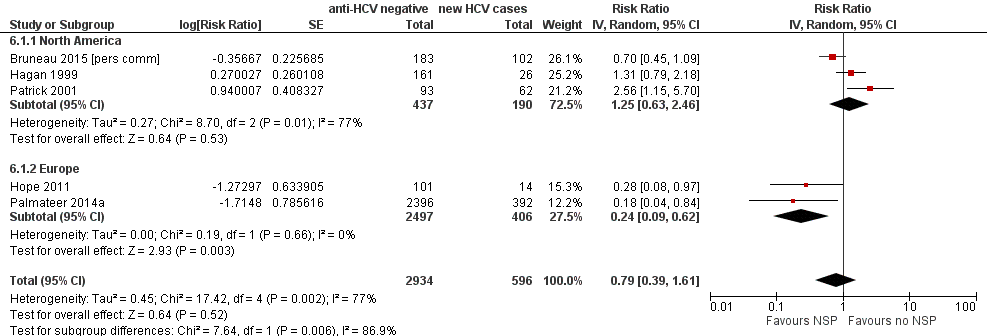
Overall, we found very low‐quality evidence that high NSP coverage did not reduce risk of HCV acquisition (RR 0.79, 95% CI 0.39 to 1.61) with high heterogeneity (I2 = 77%) based on five studies from North America and Europe involving 3530 participants. After stratification by region, high NSP coverage in Europe was associated with a 76% reduction in HCV acquisition risk (RR 0.24, 95% CI 0.09 to 0.62) with less heterogeneity (I2 =0%). We found low‐quality evidence of the impact of combined high coverage of NSP and OST, from three studies involving 3241 participants, resulting in a 74% reduction in the risk of HCV acquisition (RR 0.26 95% CI 0.07 to 0.89).
Authors' conclusions
OST is associated with a reduction in the risk of HCV acquisition, which is strengthened in studies that assess the combination of OST and NSP. There was greater heterogeneity between studies and weaker evidence for the impact of NSP on HCV acquisition. High NSP coverage was associated with a reduction in the risk of HCV acquisition in studies in Europe.
PICO
Ringkasan bahasa mudah
Intervensi untuk mengurangkan jangkitan hepatitis C dalam kalangan orang yang menyuntik dadah
Soalan ulasan
Kami mengkaji penyelidikan kesan program picagari jarum (NSP) dan rawatan penggantian opioid (OST) dalam mengurangkan risiko dijangkiti virus hepatitis C.
Latar belakang
Terdapat sekitar 114.9 juta orang yang hidup dengan hepatitis C dan 3 hingga 4 juta orang yang baru dijangkiti setiap tahun. Risiko utama dijangkiti ialah perkongsian jarum/picagari. Hampir separuh daripada orang yang menyuntik dadah menghidap hepatitis C. Pemberian peralatan suntikan steril melalui NSP mengurangkan keperluan untuk perkongsian peralatan semasa menyediakan dan menyuntik dadah. OST diambil secara oral dan mengurangkan kekerapan suntikan dan amalan suntikan yang tidak selamat. Kami memeriksa sama ada NSP dan OST, disediakan secara tunggal atau bersama, berkesan dalam mengurangkan peluang dijangkiti hepatitis C dalam kalangan orang yang menyuntik dadah.
Tarikh carian
Bukti adalah terkini sehingga November 2015.
Ciri‐ciri kajian
Kami mengenal pasti 28 kajian di seluruh Eropah, Australia, Amerika Utara dan China. Secara purata di seluruh kajian, kadar jangkitan hepatitis C baru setiap tahun adalah 19.0 untuk setiap 100 orang. Data daripada 11,070 orang yang menyuntik dadah yang tidak dijangkiti hepatitis C pada permulaan kajian telah digabungkan dalam analisis. Daripada sampel itu, 32% adalah wanita, 50% menyuntik opioid, 51% menyuntik setiap hari, dan 40% kehilangan tempat tinggal. Kajian kami dibiaya oleh Program Penyelidikan Kesihatan Awam Institut Penyelidikan Kesihatan Kebangsaan (NIHR), Unit Penyelidikan Perlindungan Kesihatan dalam Penilaian Intervensi, dan Program Maklumat Pencegahan dan Penyelidikan Dadah Suruhanjaya Eropah (DIPP), Rawatan sebagai Pencegahan di Eropah: MOdel Unjuran.
Keputusan utama
Penggunaan OST semasa (ditakrifkan sebagai penggunaan pada masa tinjauan atau dalam tempoh enam bulan sebelumnya) boleh mengurangkan risiko mendapat hepatitis C sebanyak 50%. Kami tidak pasti sama ada liputan NSP yang tinggi (ditakrifkan sebagai kehadiran biasa di NSP atau semua suntikan yang meliputi jarum baru/picagari) mengurangkan risiko dijangkiti hepatitis C dalam semua kajian di seluruh dunia, tetapi terdapat beberapa bukti daripada kajian di Eropah bahawa liputan NSP yang tinggi dapat mengurangkan risiko jangkitan hepatitis C sebanyak 76%. Penggunaan kombinasi liputan NSP dengan OST yang tinggi dapat mengurangkan risiko jangkitan hepatitis C sebanyak 74%.
Kualiti bukti
Kualiti bukti adalah dalam julat sederhana hingga sangat rendah kerana tiada kajian yang menggunakan reka bentuk standard emas kajian rawak terkawal.
Authors' conclusions
Summary of findings
| Current OST versus no OST | |||||
| Patient or population: people who inject drugs | |||||
| Outcomes | Illustrative comparative risks* (95% CI) | Relative effect | No of participants | Quality of the evidence | |
| Assumed risk | Corresponding risk | ||||
| No OST | Current OST | ||||
| HCV incidence adjusted analyses | — | — | RR 0.50 (0.40 to 0.63) | 6361 | ⊕⊕⊝⊝ |
| *The basis for the assumed risk (e.g. the median control group risk across studies) is provided in footnotes. The corresponding risk (and its 95% confidence interval) is based on the assumed risk in the comparison group and the relative effect of the intervention (and its 95% CI). | |||||
| GRADE Working Group grades of evidence | |||||
| aDowngraded one level due to overall moderate risk of bias in 2 studies, overall serious risk of bias in 6 studies, 2 studies at overall critical risk of bias in 2 studies; not enough information to make judgment in 2 studies. | |||||
| High NSP coverage versus no/low NSP coverage | |||||
| Patient or population: people who inject drugs | |||||
| Outcomes | Illustrative comparative risks* (95% CI) | Relative effect | No of participants | Quality of the evidence | |
| Assumed risk | Corresponding risk | ||||
| No/low NSP coverage | High NSP coverage | ||||
| HCV incidence adjusted analyses | — | — | RR: 0.79 (0.39 to 1.61) | 3530 | ⊕⊝⊝⊝ |
| *The basis for the assumed risk (e.g. the median control group risk across studies) is provided in footnotes. The corresponding risk (and its 95% confidence interval) is based on the assumed risk in the comparison group and the relative effect of the intervention (and its 95% CI). | |||||
| GRADE Working Group grades of evidence | |||||
| aDowngraded one level due to serious overall risk of bias in all the studies. | |||||
| Combined OST and highNSP versus no OST and low/no NSP | |||||
| Patient or population: people who inject drugs | |||||
| Outcomes | Illustrative comparative risks* (95% CI) | Relative effect | No of participants | Quality of the evidence | |
| Assumed risk | Corresponding risk | ||||
| No OST and low/no NSP | Combined OST and high NSP | ||||
| HCV incidence adjusted analyses | — | — | RR: 0.26 (0.07 to 0.89) | 3241 | ⊕⊕⊕⊝ Lowa,b |
| *The basis for the assumed risk (e.g. the median control group risk across studies) is provided in footnotes. The corresponding risk (and its 95% confidence interval) is based on the assumed risk in the comparison group and the relative effect of the intervention (and its 95% CI). | |||||
| GRADE Working Group grades of evidence | |||||
| aDowngraded one level due to serious overall risk of bias in all studies. | |||||
Background
Description of the condition
The number of people exposed to hepatitis C continues to increase globally, with an estimated 114.9 million people living with antibodies to hepatitis C (Gower 2014), 3 to 4 million people newly infected each year and 350,000 deaths occurring annually (Mohd Hanafiah 2013; Perz 2006). There were an estimated 35 million people living with human immunodeficiency virus (HIV) in 2014. Emerging evidence suggests that HIV transmission has declined since 2001 and more people are receiving treatment (UNAIDS 2014). Co‐infection with hepatitis C (HCV) among people living with HIV is a major global public health concern, with an estimated 4 million co‐infected people (Platt 2016). Among people who inject drugs (PWID), sharing needle/syringes is the main risk factor for infection with HIV and HCV. Additional risks for HCV acquisition in this population include sharing drug preparation containers, filters, rinse water and backloading (a method of sharing drugs by transferring them from the needle of one syringe into the barrel of another) (Pouget 2012; Strathdee 2010).
Description of the intervention
NSPs are often a first point of contact with health services for PWID. They provide support to minimise drug and sexual risk‐related harms, including the provision of clean needles/syringes and condoms so as to prevent bloodborne virus transmission, bacterial infections and other adverse health outcomes. By maximising the amount of clean injecting equipment in circulation, it is possible to minimise the time that contaminated equipment remains in use and the proportion of unsafe injections (Bluthenthal 2007; Kaplan 1992). NSPs operate through a range of modalities including via fixed sites, outreach, peer PWID networks, vending machines and pharmacies. Engaging in behaviours that are socially stigmatised and illegal, PWID often have high rates of unemployment, homelessness and incarceration. NSPs also provide access to longer‐term support by referring clients to medical, drug treatment or social support services.
Drug treatment for opioid addiction and dependence also encompasses a range of strategies to manage injecting drug use and reduce associated harms, including medication‐assisted treatment (MAT) such as opioid substitution therapy (OST), MAT plus psychosocial approaches, and residential rehabilitation. The most commonly prescribed forms of OST are the opioid agonist treatments methadone maintenance therapy (MMT) and the partial agonist buprenorphine maintenance treatment (BMT). Buprenorphine plus the antagonist naloxone (licensed as 'Subuxone') is also increasingly popular. OST is prescribed to dependent users to diminish the use and effects of illicitly acquired opioids. It is usually taken orally and therefore reduces the frequency of injection and unsafe injecting practices (Tilson 2007). As a treatment for opioid dependence, OST has been shown to increase health and social functioning, decrease crime and reduce the frequency of injection and unsafe injecting practices (Gowing 2011; Vorma 2013). Evidence suggests that OST is most effective when it is continuous and provided at adequate doses (Amato 2013; Faggiano 2003).
International evidence supports the use of combination interventions to prevent and treat HIV in PWID, with the provision of NSP, OST, and HIV antiretroviral treatment as the key interventions (Degenhardt 2010; WHO 2004). There is good evidence that NSP and OST reduce injecting risk behaviours and increasing evidence showing an impact on HIV incidence (Aspinall 2014; MacArthur 2012). However, evidence of their impact on HCV incidence among PWID, in combination or alone, is limited (Gibson 1999; Gibson 2001; Gowing 2011; Jones 2008; Palmateer 2010; Turner 2011; Van Den Berg 2007).
How the intervention might work
Two recent systematic reviews of 12 observational studies estimated that NSPs reduce HIV transmission among PWID by 48% (95% confidence interval (CI) 3% to 72%), with strong evidence that OST reduces HIV transmission by 54% (95% CI 33% to 68%) (Aspinall 2014; MacArthur 2012). However, none of the evidence was based on randomised controlled trials and either relied on cohort studies or cross‐sectional studies that measured OST or NSP exposure and HIV incident infections. Previous reviews synthesising evidence of the efficacy of NSPs have focused on HIV as the main outcome (Gibson 2001; Tilson 2007; Wodak 2004), thus failing to include all the available evidence on HCV (Palmateer 2010).
A recent analysis of pooled data (N = 919) in a single country examined the effect of NSP coverage on HCV incidence, defining coverage in terms of the proportion of injections covered by a sterile syringe. This analysis suggested that high coverage of NSP ('100% NSP', i.e. obtaining at least one sterile syringes per injection) or OST (defined as receiving OST or not, either currently or within the previous 6 months) can each reduce the risk of HCV acquisition by 50%; and in combination by 80% (Turner 2011). However, due to a small number of incident HCV cases (n = 40), the efficacy estimate for 100% or more NSP among those not on OST was weak (95% CI 0.22 to 1.12), and there was insufficient power to investigate the existence of a dose‐response relationship. Another systematic review examined evidence from observational studies on the impact of a range of risk reduction interventions on HCV acquisition, including behavioural interventions, NSP, and OST (Hagan 2011). This study measured the effect of NSP use, defined inconsistently due to limited available evidence, as any attendance at NSP or attendance at one point in time and showed increased risk of seroconversion among NSP attenders. Limitations of the studies included in this review were: substantial heterogeneity and lack of clarity and consistency in the measurement of NSP use across studies.
A recent review on the effect of OST use on HIV transmission identified many more studies than earlier Cochrane Reviews (MacArthur 2012). Similarly, we suspected that not all evidence on the effect of NSP on HCV transmission had been identified, so extending previous reviews would strengthen the evidence base as well as provide a more refined measure of NSP coverage that accounts for frequency of attendance and degree to which NSPs meet individuals' requirements for sterile needle/syringes.
Why it is important to do this review
Evidence of the effect of NSP with and without OST on HCV incidence is inconclusive (Palmateer 2010). Previous reviews have failed to define the frequency of use of the intervention and/or the coverage of the intervention (defined as the quantity of needles/syringes received per injection) (Hagan 2011), and a previous pooled analysis had an insufficient sample size to accurately measure the effect (Turner 2011). This review is needed in order to estimate the effect of NSPs using a consistent definition of coverage and examining impact with and without OST on HCV incidence, in order to inform harm reduction policies aimed at reducing the burden of HCV.
Objectives
To assess the effects of needle syringe programmes and opioid substitution therapy, alone or in combination, for preventing acquisition of HCV in people who inject drugs.
We were specifically concerned with the following research questions.
-
How effective is OST alone for reducing HCV incidence in PWID?
-
How effective are needle syringe programmes (NSP) with and without OST for reducing HCV incidence in PWID?
-
How does the effect of NSP and OST vary according to duration of treatment (i.e. for NSPs weekly attendance versus monthly)?
-
How does the effect of NSP vary according to the type of service (fixed site versus mobile; high coverage versus low coverage)?
-
How does the effect of OST vary according to the dosage of OST, type of substitution used and adherence to treatment?
Methods
Criteria for considering studies for this review
Types of studies
We included randomised controlled trials (RCTs), prospective and retrospective cohort studies and case‐control studies. We also followed up and included prospective studies examining HCV incidence in PWID that may have collected data regarding NSPs and OST without reporting the data in the published study, or which may have reported data as part of an adjusted analysis. For these studies, we sought unpublished data relating to the impact of NSP/OST on HCV transmission via contact with study authors. We included studies only when authors provided these data.
We included cross‐sectional surveys if they included a serological measure of recent infection (e.g. through positive ribonucleic acid (RNA) results on anti‐body negative samples). We excluded cross‐sectional studies (including serial cross‐sectional studies) reporting HCV prevalence alone. We excluded studies relying on self‐reported data for the outcome.
Types of participants
People who inject drugs (opioids and or stimulants). We excluded studies enrolling participants undergoing opportunistic HCV testing (outside of the study setting) and those relating to people who inject drugs in the prison setting, since addiction services and treatment provision in this setting differ significantly from community and healthcare settings.
Types of interventions
Experimental interventions
-
OST
-
NSP
-
NSP plus OST
Studies could be based in a drug treatment facility or in the wider community, at a fixed site or mobile unit.
Exposure to OST was defined as continuous or interrupted treatment, current, recent (previous six months or duration of HCV observation period) or any past treatment with methadone or buprenorphine.
Exposure to NSP was defined as the proportion of injections covered by a clean needle/syringe or attendance at an NSP. Where it was not possible to estimate the proportion of injection covered by a clean needle/syringe, we defined exposure accounting for frequency of injection and the degree to which the NSP meets the individual's requirement for needles/syringes.
Control intervention
-
No OST
-
Low coverage NSP or no NSP
Types of comparisons
-
OST versus no OST
-
High NSP coverage with no OST versus low coverage NSP
-
Low NSP coverage with no OST versus no NSP
-
Combined high/low NSP coverage with OST versus no OST and low/no coverage NSP
Types of outcome measures
Primary outcomes
Our review focused on one primary outcome, HCV incidence, and no other secondary outcomes. We excluded studies that did not report on HCV incidence since they would have addressed questions outside the main review question. Incidence of HCV infection in PWID was measured via repeat testing such as detection of HCV RNA positive among HCV antibody negative results or antibody avidity. We also included studies if they reported a minimum of two HCV seroconversions (HCV antibody negative to HCV antibody positive) in participants from tests conducted at different time points.
Search methods for identification of studies
Methods to be used in this systematic review in relation to the search strategies and approaches to data synthesis follow methods applied in a similar review to assess the impact of OST on HIV incidence (MacArthur 2012).
We identified papers in four ways. Firstly, we conducted two primary searches of the literature based on key search terms identified in reviews of the effect of OST and NSP on the risk of HIV and HCV among PWID (MacArthur 2012; Palmateer 2010). The purpose of the two searches were to identify studies that measured the impact of NSP/OST on HCV incidence (see Appendix 1) and to identify longitudinal studies that measured HCV incidence and reported the impact of NSP/OST as part of an adjusted analysis (see Appendix 2). The Cochrane Drugs and Alcohol Group Trials Search Co‐ordinator reviewed the search strategy and conducted the search.
Electronic searches
We searched for relevant studies in the following sources.
-
The Cochrane Drugs and Alcohol Group Specialised Register of Trials (searched 16 November 2015).
-
The Cochrane Central Register of Controlled Trials (CENTRAL; 2015, Issue 11).
-
The Cochrane Database of Systematic Reviews (CDSR) (Cochrane Library, 2015, issue 11).
-
The Database of Abstracts of Reviews of Effects (DARE)(Cochrane Library, 2015, issue 11).
-
The Health Technology Assessment Database (HTA) (Cochrane Library, 2015, issue 11).
-
The NHS Economic Evaluation Database (NHSEED) (Cochrane Library, 2015, issue 11).
-
MEDLINE (Ovid) (1966 to 16 November 2015).
-
Embase (embase.com) (1974 to 16 November 2015).
-
The Database of Abstracts of Reviews of Effects (DARE) (Cochrane Library, searched 16 November 2015).
-
Global Health (Ovid) (1974 to 16 November 2015).
-
CINAHL (EBSCOhost) (1982 to 16 November 2015).
-
Web of Science (1991 to 16 November 2015).
-
PsycINFO (Ovid) (1985 to 16 November 2015).
We searched for ongoing clinical trials and unpublished trials via searches of the following websites.
-
ClinicalTrials.gov (www.clinicaltrials.gov).
-
World Health Organization (WHO) International Clinical Trials Registry Platform (ICTRP) (apps.who.int/trialsearch/).
This review fully incorporates the results of searches conducted up to November 2015. We identified a further four reports of studies in a search update conducted in March 2017. We have added those studies to Studies awaiting classification and will incorporate them into the review at the next update.
Searching other resources
We searched the publications of key international agencies including the European Monitoring Centre on Drugs and Drug Addiction, the European Centre for Disease Control, the National Institute on Drug Abuse, the US Institute of Medicine, the United Nations Office on Drugs and Crime Prevention and the World Health Organization. We handsearched the reference lists of relevant articles to identify additional relevant studies and contacted experts in the field to identify ongoing research. We also searched conference abstracts including the International Harm Reduction Conference, International HIV/AIDS Society and the European Association for the Study of the Liver conference. Finally we contacted principal investigators and authors of prospective studies that had examined HCV incidence in PWID but had not reported on the intervention exposure to see whether these data were available from unpublished sources.
There were no language or date restrictions, and we included peer reviewed and non‐peer reviewed papers.
Data collection and analysis
Selection of studies
Two reviewers (LP, SM) independently screened all titles and abstracts, resolving disagreements following discussion. Two reviewers (LP, SM) independently screened full‐text copies of relevant articles to determine whether they met eligibility criteria for direct inclusion or for contact of study authors. We resolved disagreements by discussion or, where disagreements persisted, with adjudication by a third author (JR) to enable a consensus.
We had full‐text papers in languages other than English translated by individuals fluent in those languages. Where there were multiple publications from the same study, or the same city or region, we selected all published papers and extracted data from the study with the greatest number of outcome events (i.e. HCV seroconversions).
Data extraction and management
One author (LP) extracted data using a data extraction form, which two review authors had pre‐piloted to determine suitability for capturing study data and assessing quality. A second author (JR) checked all data to assess the accuracy of data extraction. Data extracted included:
-
lead author;
-
review title or unique identifier and date;
-
eligibility for inclusion;
-
reasons for exclusion;
-
study aim(s);
-
study design (included sampling methods, participant and attrition rate);
-
study location;
-
study setting;
-
proportion of participants who injected opioids;
-
proportion of participants who injected stimulants;
-
definition of exposure (recency of injecting);
-
intervention (NSP provision; number of needles distributed; frequency of injection; frequency of attendance; methadone maintenance therapy or buprenorphine maintenance treatment; delivery (e.g. continuous versus interrupted treatment); duration; dose);
-
additional interventions or incentives provided alongside NSP/OST;
-
participants (number in each intervention group; age, sex and ethnicity);
-
duration of follow‐up in each treatment arm;
-
outcome measure (HCV seroconversion) overall and by NSP and OST exposure;
-
unadjusted and adjusted effect size: incidence rate ratio (IRR); odds ratio (OR); risk ratio (RR)hazard ratio (HR) and precision (i.e. 95% confidence interval (CI));
-
confounding factors used to adjust effect estimates including high‐risk behaviours (injecting risk behaviours, frequency of injection, homelessness, experience of prison, duration of injection, or age, poly drug use);
-
background prevalence of HCV in the population;
-
any other comments.
Assessment of risk of bias in included studies
We would have performed the 'Risk of bias' assessment for RCTs using the criteria in the Cochrane Handbook for Systematic Reviews of Interventions (Higgins 2011). The recommended approach is a two‐part tool, addressing seven specific domains, namely sequence generation and allocation concealment (selection bias), blinding of participants and providers (performance bias), blinding of outcome assessor (detection bias), incomplete outcome data (attrition bias), selective outcome reporting (reporting bias) and other sources of bias. The first part of the tool involves describing what was reported to have happened in the study. The second part of the tool involves assigning a judgment relating to the risk of bias for that entry, in terms of low, high or unclear risk. To make these judgments we would have used the criteria indicated by Higgins 2011, adapted to the addiction field. See Appendix 3 for details. We would have assessed the risk of bias for unpublished estimates by referring to the study methods in the corresponding published paper.
We assessed the risk of bias in non‐randomised studies using a pilot version of a tool in development by the Methods Groups of the Cochrane Collaboration (Sterne 2013). This was undertaken as part of the formal piloting of the tool, in collaboration with its developers. The seven‐domain tool is an extension of the existing tool for assessing risk of bias in randomised trials (Higgins 2011).
Three domains concern the pre‐intervention phase or intervention phase.
-
Baseline confounding. In assessing bias due to confounding we considered there to be two critically important confounders: duration of injecting or age; and frequency of injecting.
-
Selection of participants into the study.
-
Measurement of the intervention.
Four domains relate to the post intervention phase.
-
Departures from intended interventions (performance bias).
-
Missing data (attrition bias).
-
Measurement of outcomes or interventions (detection bias).
-
Selection of the reported results (outcome reporting bias).
Finally, we gave an overall risk of bias judgment at the study level for each relevant outcome (see Appendix 4).
Since we were piloting a new 'Risk of bias' tool, four contributors initially applied it independently to a sample of four studies. We discussed and compared assessments to ensure consistent interpretation of domains. Two people independently assessed the remaining studies in the review and compared results. We resolved disagreements by discussion.
Measures of treatment effect
When trials reported only effect estimates, we directly extracted unadjusted and adjusted estimates reported as ORs, risk ratios (RRs), IRRs or HRs with 95% CIs. When studies provided only incidence data, we estimated rate ratios and 95% CIs based on the person‐years of observation. We extracted effect estimates reported as ORs and took them as an approximation of the RR, even though the incidence of HCV in included studies was variable (mean 18.7/100 person‐years, range 0.09 to 42). In order to account for this, we explored the impact of removing ORs on our overall intervention effect in sensitivity analyses(MacArthur 2012; Zhang 1998).
Dealing with missing data
We contacted study authors if studies provided data regarding use of NSP or the impact of drug treatment on HCV transmission but insufficient detail regarding the precise form of treatment provided. We also contacted study authors if papers reported HCV incidence data but no data regarding drug treatment or NSP. If we could not obtain missing data, we excluded the studies from the review.
Assessment of heterogeneity
We assessed heterogeneity via inspection of the forest plot and by a Chi2 test to demonstrate whether the observed differences in results were compatible with chance alone. We calculated tThe I2 statistic was calculated to examine the percentage of variability due to heterogeneity rather than to sampling error. We explored heterogeneity through sensitivity and subgroup analysis.
Assessment of reporting biases
We used funnel plots (plots of the effect estimate from each study against the sample size or effect standard error) to assess the potential for bias related to the size of the trials, which could indicate possible publication bias. We inspected funnel plot symmetry when there were at least 10 studies included in the meta‐analysis.
Data synthesis
We used a random‐effects model for all analyses, allowing for heterogeneity between studies and converting all effect estimates into RRs. We pooled adjusted and unadjusted effect estimates in separate meta‐analyses. We used Review Manager 5 (RevMan 5) for statistical analyses (RevMan 2014). We pooled data across different observational study designs and assessed the potential association between study design and effect size, stratifying by study design as well as in meta‐regression analyses.
Subgroup analysis and investigation of heterogeneity
We examined heterogeneity with the I2 and Tau2 statistic and explored reasons for heterogeneity using univariable random‐effects meta‐regression to evaluate the impact of the following covariates: geographical region of study; recruitment setting (community‐based or treatment); percentage of female participants; main drug injected; type of NSP; frequency of injecting; dose, duration and adherence to NSP/OST (i.e. continuous or interrupted treatment); and study design. There was insufficient information to assess the impact of adherence to NSP/OST (i.e. continuous or interrupted treatment).
Sensitivity analysis
We excluded studies that we assessed as being at critical risk of bias. We also used sensitivity analysis to determine to what extent the overall intervention effect changed when we excluded studies: at severe or unclear risk of bias; that did not adjust for confounders; from unpublished datasets; and that used odds ratios as effect measures and were cross‐sectional in design.
Summary of findings table
We assessed the overall quality of the evidence for the primary outcome using the GRADE system for assessing the quality of evidence (GRADE 2004; Guyatt 2008; Guyatt 2011; Schünemann 2006). GRADE takes into account issues not only related to internal validity but also to external validity, such as directness of results. The 'Summary of findings' tables present the main findings of the review in a transparent and simple tabular format. In particular, they provide key information concerning the quality of evidence, the magnitude of effect of the interventions examined and the sum of available data on the main outcomes.
The GRADE system uses the following criteria for assigning grades of evidence.
-
High: we are very confident that the true effect lies close to that of the estimate of the effect.
-
Moderate: we are moderately confident in the effect estimate: the true effect is likely to be close to the estimate of the effect, but there is a possibility that it is substantially different.
-
Low: our confidence in the effect estimate is limited: the true effect may be substantially different from the estimate of the effect.
-
Very low: we have very little confidence in the effect estimate: the true effect is likely to be substantially different from the estimate of effect.
Grading is decreased for the following reasons.
-
Serious (−1) or very serious (−2) study limitation for risk of bias.
-
Serious (−1) or very serious (−2) inconsistency between study results.
-
Some (−1) or major (−2) uncertainty about directness (the correspondence between the population, the intervention, or the outcomes measured in the studies actually found and those under consideration in our systematic review).
-
Serious (−1) or very serious (−2) imprecision of the pooled estimate(−1).
-
Publication bias strongly suspected (−1).
Grading is increased for observational studies for the following reasons.
-
Strong evidence of association ‐ significant relative risk of more than 2.0 (or less than 0.5) based on consistent evidence from two or more observational studies, with no plausible confounders (+1).
-
Very strong evidence of association ‐ significant relative risk of more than 5.0 (or less than 0.2) based on direct evidence with no major threats to validity (+2).
-
Evidence of a dose response gradient (+1).
-
All plausible confounders would have reduced the effect (+1).
Results
Description of studies
Results of the search
We identified 6720 unique records from database searching and from reference lists of included studies and relevant reviews. We excluded 6576 on the basis of title and abstract and retrieved 144 full‐text articles for more detailed evaluation. We excluded 103 of these (referring to 101 studies) after reading the full text because they did not meet the inclusion criteria; we characterised 6 studies as awaiting classification since they were written in Chinese or German, and we were not able to translate.
We finally included 28 studies (31 references): 21 published and 7 unpublished reports that satisfied all criteria required for inclusion in the review. See Figure 1.

Study flow diagram.
Twenty‐one papers directly included measures of the impact of exposure to either OST or NSP on HCV acquisition. In addition, we identified 11 eligible prospective studies that measured HCV incidence and contacted authors of these articles. Of these, we obtained unpublished data from six cohort studies in Montreal, Canada (Bruneau 2015 [pers comm]); Baltimore, USA (Mehta 2015 [pers comm]), San Francisco, USA (Page 2015 [pers comm]); London, UK (Judd 2015 [pers comm]); Melbourne, Australia (Aitken 2015 [pers comm]); and Sydney, Australia (Maher 2015); plus one cross‐sectional survey (Hope 2015 [pers comm]).
Included studies
See Characteristics of included studies.
In total we included 21 published studies (Craine 2009; Crofts 1997; Hagan 1995; Hagan 1999; Holtzman 2009; Hope 2011; Lucidarme 2004; Nolan 2014, Palmateer 2014a ; Patrick 2001; Rezza 1996; Roy 2007; Ruan 2007; Spittal 2012; Thiede 2000; Thorpe 2002; Tsui 2014; Vallejo 2015; Van Beek 1998; Van Den Berg 2007; White 2014), plus 7 unpublished studies (Aitken 2015 [pers comm]; Bruneau 2015 [pers comm]; Hope 2015 [pers comm], Judd 2015 [pers comm]; Maher 2015Mehta 2015 [pers comm]; Page 2015 [pers comm]), comprising 1817 HCV incident infections and 8806.95 person‐years of follow‐up. HCV incidence in the 28 studies ranged from 0.09 and 42 cases per 100 person‐years.
Design
We did not identify any randomised controlled trials. We included 2 case‐control studies (Hagan 1995, Rezza 1996), 3 cross‐sectional studies (Hope 2011; Hope 2015 [pers comm]; Palmateer 2014a), 20 prospective cohort studies (Aitken 2015 [pers comm]; Bruneau 2015 [pers comm]; Craine 2009; Hagan 1999; Holtzman 2009; Judd 2015 [pers comm]; Lucidarme 2004; Maher 2015; Mehta 2015 [pers comm]; Nolan 2014; Page 2015 [pers comm]; Patrick 2001; Ruan 2007; Spittal 2012; Thiede 2000; Thorpe 2002; Tsui 2014; Vallejo 2015; Van Den Berg 2007; White 2014); 2 retrospective cohort studies (Crofts 1997; Van Beek 1998); and 1 serial cross‐sectional survey (Roy 2007).
Duration of trials
For cohort studies the duration of follow‐up ranged between 1 and 22 years. Included studies were published between 1995 and 2014.
Participants and setting
Twenty‐five studies reported participants' sex, and the mean proportion of female participants was 32% (range 2.8% to 55.9%). Across 14 studies, on average 40.7% (range 9.2% to 69.2%) of participants had experience of recent or past homelessness, and 35% (range 18.2% to 90%) had experience of prison (12 studies). The mean reported use of stimulants was 32.7% (range 0% to 75%, 19 studies) and a mean of 50.5% (range 18.2% to 100%) reported heroin use (13 studies). Across 14 studies a mean of 50.6% of participants reported injecting daily (range 18.2% to 84%).
Most study participants were currently injecting at the time of recruitment, with eligibility criteria for study participation stated as: injection in the previous four weeks (Craine 2009; Hope 2011; Hope 2015 [pers comm]; Judd 2015 [pers comm]; Nolan 2014; Page 2015 [pers comm]; Patrick 2001; Spittal 2012; Thiede 2000; Tsui 2014; Vallejo 2015), in the previous 3 months to 6 months (Aitken 2015 [pers comm]; Bruneau 2015 [pers comm]; Hagan 1995; Maher 2015; Roy 2007; Ruan 2007; Thorpe 2002), or in the previous 6 months to 12 months (Hagan 1999; Holtzman 2009; Palmateer 2014a; White 2014). A few studies included PWID who had injected at any time in the past (Lucidarme 2004, Mehta 2015 [pers comm]; Van Den Berg 2007), or they reported no information on recency of injection (Crofts 1997; Rezza 1996; Van Beek 1998).
Eight studies took place in the USA; five each in the UK, Canada and Australia; and one each in the Netherlands, France, Italy, Spain and China.
Study size and method of recruitment
Sample size ranged from 46 and 2788. The method of recruitment primarily involved street outreach, in 13 studies (Craine 2009; Crofts 1997; Hagan 1995; Hagan 1999; Lucidarme 2004; Page 2015 [pers comm]; Palmateer 2014a; Rezza 1996; Roy 2007; Thiede 2000; Tsui 2014; Van Beek 1998; Van Den Berg 2007); respondent‐driven sampling, in 3 studies (Holtzman 2009; Hope 2011; Hope 2015 [pers comm]); and service attenders (both low‐threshold community services and drug treatment), in 12 studies (Aitken 2015 [pers comm]; Bruneau 2015 [pers comm]; Judd 2015 [pers comm]; Maher 2015; Mehta 2015 [pers comm]; Nolan 2014; Patrick 2001; Ruan 2007; Spittal 2012; Thorpe 2002; Vallejo 2015; White 2014). Most studies drew on a combination of recruitment methods.
Types of interventions
Twenty‐one of the included studies assessed the impact of OST (Craine 2009; Crofts 1997; Lucidarme 2004; Nolan 2014; Palmateer 2014a; Rezza 1996; Ruan 2007; Spittal 2012; Thiede 2000; Tsui 2014; Vallejo 2015; Van Beek 1998; Van Den Berg 2007; White 2014), including seven unpublished estimates (Aitken 2015 [pers comm]; Bruneau 2015 [pers comm]; Hope 2015 [pers comm]; Judd 2015 [pers comm]; Maher 2015; Mehta 2015 [pers comm]; Page 2015 [pers comm]).
Current use of OST was defined as: reporting use of prescribed methadone or buprenorphine within the previous six months (yes or no) (Bruneau 2015 [pers comm]; Maher 2015; Nolan 2014; Rezza 1996; White 2014); use for more than six months (Judd 2015 [pers comm]), use of methadone or buprenorphine at the time of survey (Craine 2009; Hope 2015 [pers comm]; Mehta 2015 [pers comm]; Palmateer 2014a; Spittal 2012), or continuous use of methadone throughout follow‐up period (Crofts 1997; Lucidarme 2004; Thiede 2000). Van Den Berg 2007 defined continuous use as daily use of methadone (any dosage) in the previous six months, while Aitken 2015 [pers comm] defined it as in the previous one month. Tsui 2014 used a three‐month time frame to measure use of OST (methadone or buprenorphine).
Seventeen studies assessed the impact of NSP (Hagan 1995; Hagan 1999; Holtzman 2009; Hope 2011; Palmateer 2014a; Patrick 2001; Roy 2007; Thorpe 2002; Vallejo 2015; Van Den Berg 2007; White 2014), including five unpublished sources (Bruneau 2015 [pers comm]; Hope 2015 [pers comm]; Maher 2015; Mehta 2015 [pers comm]; Page 2015 [pers comm]).
Bruneau 2015 [pers comm] defined high NSP coverage as obtaining 100% of needles/syringes from a safe source (receiving one clean needle for every injection), Hope 2011,Hope 2015 [pers comm]and Van Den Berg 2007 defined it as reporting ≥100% of injections using clean needles/syringes (receiving one or more clean needle for every injection), and Palmateer 2014a defined it as reporting ≥200% of injections with clean syringes (receiving more than two clean needles for every injection). Other measures of high coverage were defined as regular attendance at least once per week at an NSP in Patrick 2001 or obtaining most needles/syringes from an NSP in the last six months (Hagan 1999).
Low‐level NSP coverage was defined as ever having used an NSP (Hagan 1995), using NSPs in the previous one to six months (Holtzman 2009; Maher 2015; Mehta 2015 [pers comm]; Page 2015 [pers comm]; Roy 2007; Thorpe 2002; White 2014), or having less than 100% of injections covered by a clean needle/syringe in the last six months (Hope 2011; Van Den Berg 2007).
Four studies assessed the impact of combined NSP with OST (Hope 2011; Palmateer 2014a; Van Den Berg 2007), including one unpublished data source (Bruneau 2015 [pers comm]). Studies defined combined use of NSP plus OST in two ways: high NSP coverage plus current use of OST (Bruneau 2015 [pers comm]; Hope 2011; Palmateer 2014a; Van Den Berg 2007), and OST use plus low NSP coverage (Hope 2011; Palmateer 2014a; Van Den Berg 2007). One study looked at the impact of uptake of injecting paraphernalia (defined as spoons and filters) alone, with needles/syringes and in combination with OST (Palmateer 2014a).
Excluded studies
See Characteristics of excluded studies.
We excluded 101 studies (104 articles). Grounds for exclusion were: no outcome of interest assessed (43 studies); no intervention of interest (32 studies); no comparison of interest (all participants on OST, 9 studies); no outcome and no intervention of interest (11 studies); no outcome and no comparison of interest (4 studies); and editorial or overview (2 studies).
Risk of bias in included studies
Bias due to baseline confounding
We judged 12 studies to be at moderate risk of bias due to confounding because they adjusted for critical confounders (duration of injecting or age, and frequency of injecting) and used a suitable analysis method (e.g. adjusted for time‐varying confounding if appropriate) (Bruneau 2015 [pers comm]; Hagan 1999; Hope 2011; Hope 2015 [pers comm]; Judd 2015 [pers comm]; Lucidarme 2004; Maher 2015; Mehta 2015 [pers comm]; Page 2015 [pers comm]; Thiede 2000; Tsui 2014; White 2014). We judged 12 to be at serious risk because confounding was insufficiently addressed in the analyses (Craine 2009; Hagan 1995; Holtzman 2009; Nolan 2014; Palmateer 2014a; Patrick 2001; Rezza 1996; Roy 2007; Spittal 2012; Thorpe 2002; Vallejo 2015; Van Den Berg 2007). The four studies we assessed as being at critical risk did not make any adjustment for confounding (Aitken 2015 [pers comm]; Crofts 1997; Ruan 2007; Van Beek 1998).
Bias in the selection of participants into the study
We deemed five studies to be at moderate risk of bias because start of follow‐up and start of intervention coincided for all or most subjects (Hope 2011; Hope 2015 [pers comm]; Patrick 2001; Thiede 2000; Tsui 2014). We judged three studies to be at critical risk of bias because selection into the study was strongly related to intervention and outcome (Aitken 2015 [pers comm]; Judd 2015 [pers comm]; Ruan 2007). We considered the remaining studies to be at serious risk of selection bias, largely because participants may have already been exposed to the intervention prior to the start of the study. For two studies (Mehta 2015 [pers comm]; Page 2015 [pers comm]), we did not have enough information to make a judgment.
Bias in measurement of the intervention
We judged five studies to be at low risk of bias because intervention status was well defined and based solely on information collected at the time of intervention (Crofts 1997; Hagan 1999; Thiede 2000; Tsui 2014; Vallejo 2015). We deemed seven studies to be at moderate risk because some aspects of the assignments of intervention status were determined retrospectively (Bruneau 2015 [pers comm]; Holtzman 2009; Nolan 2014; Palmateer 2014a; Spittal 2012; Van Den Berg 2007; White 2014). We considered Judd 2015 [pers comm] to be at critical risk of bias because there was considerable risk of misclassification of intervention status. We judged the remaining studies to be at serious risk of selection bias mainly because intervention status was not well defined. For two studies (Mehta 2015 [pers comm]; Page 2015 [pers comm]), we did not have enough information to make a judgment.
Blinding
Departures from intended interventions: none of the studies provided information about co‐interventions received by participants or changes in treatment, so we coded departures from intended interventions as 'no information' for all studies.
Measurement of outcomes: we deemed all but one study to be at low risk of bias in relation to measurement of the outcome since HCV seroconversion was laboratory‐confirmed, and testing was carried out at pre‐defined time points, with no apparent differences between intervention groups. InCrofts 1997, the risk was serious because there may have been differential testing (for participants not on methadone, the need for HCV testing was determined according to the clinician's judgment).
Incomplete outcome data
Six studies were at a low risk of bias because data were reasonably complete (Hagan 1995; Hagan 1999; Hope 2011; Nolan 2014; Spittal 2012; Thiede 2000), and two studies were at moderate risk of bias because there were no substantial differences in the proportions of missing data or in reasons for missing data across intervention groups (Thorpe 2002; Tsui 2014). The eight studies at serious risk (Craine 2009; Crofts 1997; Lucidarme 2004; Palmateer 2014a; Patrick 2001; Ruan 2007; Vallejo 2015; Van Den Berg 2007), and the five at critical risk (Aitken 2015 [pers comm]; Judd 2015 [pers comm]; Rezza 1996; Roy 2007; Van Beek 1998), had substantial differences in either the proportions of missing participants or the reasons for missing data across interventions, and investigators did not adjust for these differences in the analyses. Seven studies provided insufficient information about missing data or the potential for data to be missing (Bruneau 2015 [pers comm]; Holtzman 2009; Hope 2015 [pers comm]; Maher 2015; Mehta 2015 [pers comm]; Page 2015 [pers comm]; White 2014).
Selective reporting
We judged all studies to be at low risk for selective reporting as the measure of the outcome of interest was clearly defined and internally consistent. For one study (Aitken 2015 [pers comm]), there was insufficient information for assessing reporting bias.
Overall risk of bias
We judged only 2 studies to be at moderate overall risk of bias (Thiede 2000; Tsui 2014), while 17 were at serious overall risk (Bruneau 2015 [pers comm]; Craine 2009; Hagan 1995; Hagan 1999; Holtzman 2009; Hope 2011; Lucidarme 2004; Maher 2015; Nolan 2014; Palmateer 2014a; Patrick 2001; Spittal 2012; Thorpe 2002; Vallejo 2015; White 2014), and 7 were at critical risk (Aitken 2015 [pers comm]; Crofts 1997; Judd 2015 [pers comm]; Rezza 1996; Roy 2007; Ruan 2007; Van Beek 1998). For two studies, we did not have enough information to make a judgment (Mehta 2015 [pers comm]; Page 2015 [pers comm]). This is summarised in Table 1.
| Study | Confounding | Selection bias | Measurement of interventions | Departures from intended interventions | Missing data | Measurement of outcomes | Selection of reported result | Overall risk of bias |
| Critical | Critical | Serious | No info | Critical | Low | No info | Critical | |
| Moderate | Serious | Moderate | No info | No info | Low | Low | Serious | |
| Serious | Serious | Serious | No info | Serious | Low | Low | Serious | |
| Critical | Serious | Low | No info | Serious | Serious | Low | Critical | |
| Serious | Serious | Serious | No info | Low | Low | Low | Serious | |
| Moderate | Serious | Low | No info | Low | Low | Low | Serious | |
| Serious | Serious | Moderate | No info | No info | Low | Low | Serious | |
| Moderate | Moderate | Serious | No info | Low | Low | Low | Serious | |
| Moderate | Moderate | Serious | No info | No info | Low | Low | Serious | |
| Moderate | Critical | Critical | No info | Critical | Low | Low | Critical | |
| Moderate | Serious | Serious | No info | Serious | Low | Low | Serious | |
| Moderate | Serious | Serious | No info | No info | Low | Low | Serious | |
| Moderate | No info | No info | No info | No info | Low | Low | No info | |
| Serious | Serious | Moderate | No info | Low | Low | Low | Serious | |
| Moderate | No info | No info | No info | No info | Low | Low | No info | |
| Serious | Serious | Moderate | No info | Serious | Low | Low | Serious | |
| Serious | Moderate | Serious | No info | Serious | Low | Low | Serious | |
| Serious | Low | Serious | No info | Critical | Low | Low | Critical | |
| Serious | Serious | Serious | No info | Critical | Low | Low | Critical | |
| Critical | Critical | Serious | No info | Serious | Low | Low | Critical | |
| Serious | Serious | Moderate | No info | Low | Low | Low | Serious | |
| Moderate | Moderate | Low | No info | Low | Low | Low | Moderate | |
| Serious | Serious | Serious | No info | Moderate | Low | Low | Serious | |
| Moderate | Moderate | Low | No info | Moderate | Low | Low | Moderate | |
| Serious | Serious | Low | No info | Serious | Low | Low | Serious | |
| Critical | Serious | Serious | No info | Critical | Low | Low | Critical | |
| Serious | Serious | Moderate | No info | Serious | Low | Low | Serious | |
| Moderate | Serious | Moderate | No info | No info | Low | Low | Serious |
Effects of interventions
See: Summary of findings for the main comparison Current OST versus no OST for people who inject drugs; Summary of findings 2 High NSP coverage versus no/low NSP coverage for people who inject drugs; Summary of findings 3 Combined OST and high NSP versus no OST and low/no NSP for people who inject drugs
1. Current use of OST versus no current OST
Of the 20 studies that assessed the impact of OST on HCV incidence, we pooled data from 17 studies that measured current OST (Craine 2009; Crofts 1997; Lucidarme 2004; Nolan 2014; Palmateer 2014a; Rezza 1996; Spittal 2012; Thiede 2000; Tsui 2014; Vallejo 2015; Van Den Berg 2007; White 2014), including five unpublished estimates (Aitken 2015 [pers comm]; Bruneau 2015 [pers comm]; Hope 2015 [pers comm]; Judd 2015 [pers comm]; Maher 2015).
Fourteen of the included studies were longitudinal studies, one used a case‐control study design (Rezza 1996), and two were cross‐sectional surveys (Hope 2015 [pers comm]; Palmateer 2014a). A total of 1148 HCV incident cases were included over 6553.1 person‐years of follow‐up.
The primary analyses were focused on twelve studies presenting adjusted estimates. These analyses included the following effect measures: hazard ratios in six studies (Bruneau 2015 [pers comm]; Lucidarme 2004; Maher 2015; Tsui 2014; White 2014), odds ratios in five studies (Judd 2015 [pers comm]; Nolan 2014; Palmateer 2014a; Rezza 1996; Thiede 2000), and incident rate ratio in two studies (Craine 2009; Mehta 2015 [pers comm]).
Adjusted estimates controlled for potential confounding effects of the following factors: duration and frequency of injection (Bruneau 2015 [pers comm]; Judd 2015 [pers comm]); area of residence, homelessness, sharing injecting equipment or needles (Craine 2009); sex, geographical region, use of condoms, injection of cocaine, duration of injection, sharing injecting equipment (Lucidarme 2004); duration of injection, frequency of injection and age of whole cohort (Mehta 2015 [pers comm]); unstable housing, cocaine, heroin or methamphetamine injection, cohort of recruitment, year of recruitment, follow‐up time (Nolan 2014); survey year, homelessness, stimulant injection, duration of injection (Palmateer 2014a); sex, age, duration of drug use, injection of cocaine (Rezza 1996); age, duration of injection, sex, ethnicity, homelessness or prison in the last 3 months (Tsui 2014); sex, ethnicity, age, frequency of injecting and sharing needles/syringes (White 2014); and injected at follow‐up, pooled money to buy drugs, injected with used needles and backloading (removing the plunger from a syringe and filling it with drug solution from another needle/syringe) (Thiede 2000).
Random‐effects meta‐analysis of multivariable estimates showed that opioid substitution therapy was associated with a 50% reduction in the risk of HCV infection (RR 0.50 95% CI 0.40 to 0.63) with little heterogeneity between 12 studies involving 6361 participants (I2 = 0%, P = 0.89, Tau2 = 0.00; Analysis 1.1; Figure 2).

Forest plot of comparison: 1 Current OST versus no OST, outcome: 1.1 HCV incidence adjusted analyses by region.
Sensitivity analysis
The intervention effect strengthened when we excluded estimates from four unpublished data sources (Bruneau 2015 [pers comm]; Judd 2015 [pers comm]; Maher 2015; Mehta 2015 [pers comm]): RR 0.42 (95% CI 0.31 to0.58; Analysis 2.1; I2 = 0%, Tau2 = 0.00, 8 studies, N = 5235).
This effect was maintained when the analysis was limited to excluding Judd 2015 [pers comm] and Rezza 1996, judged to be at critical risk of bias, and Mehta 2015 [pers comm], which reported insufficient information to give an overall risk of bias assessment (RR 0.51, 95% CI 0.40 to 0.64; Analysis 3.1 I2 = 0%, Tau2 = 0.00). The intervention effect was also unchanged when the analysis excluded Palmateer 2014a and Rezza 1996, two cross‐sectional studies that reported baseline measures of effect only (RR 0.51, 95% CI 0.40 to 0.65; Analysis 4.1; I2 = 0.0%, Tau2 = 0.00, 10 studies, N = 3367).
Random‐effects meta‐analysis of 16 studies that presented unadjusted estimates shows that current OST was associated with a 43% reduction in the risk of HCV acquisition (RR 0.57, 95% CI 0.45 to 0.73; Analysis 5.1; 16 studies, N = 10,647), with only moderate evidence of heterogeneity between studies (I2 = 32.4%, P = 0.09, Tau2 = 0.08).
Meta‐regression
Based on univariable meta‐regression of unadjusted estimates, we found no evidence that effectiveness varied by other covariates including geographical location (Analysis 1.1) or study design (Analysis 1.2). We did find evidence of differential impact in the proportion of female participants in the sample. With each 10% increase of female participants in sample, the effect of intervention exposure was reduced (ratio of rate ratios = 1.59, 95% CI 1.13 to 2.29; Table 2).
| Variable | Studies | Univariable rate ratio (95% CI) | Ratio of rate ratios (95% CI) | P value | Tau2 |
| Geographic region | |||||
| Europe | 8 | 0.51 (0.37‐0.70) | 1.0 (ref) | — | — |
| Australia | 5 | 0.55 (0.28‐1.11) | 1.12 (0.52‐2.41) | — | — |
| North America | 6 | 0.69 (0.44‐1.08) | 1.42 (0.73‐2.78) | 0.53 | 0.10 |
| Site of recruitment | |||||
| Service attenders | 12 | 0.67 (0.49‐0.92) | 1.0 (ref) | — | — |
| Community | 7 | 0.49 (0.33‐0.73) | 0.73 (0.42‐1.27) | 0.256 | 0.06 |
| Study design | |||||
| Cross‐sectional | 4 | 0.51 (0.31‐0.85) | 1.0 | — | — |
| Prospective cohort | 15 | 0.58 (0.43‐0.77) | 1.12 (0.48‐2.61) | 0.784 | 0.10 |
| Females | 17 | — | 1.59 (1.13‐2.29) | 0.01 | 0.04 |
| Prison experience | 11 | — | 1.057 (0.61‐1.79) | 0.821 | 0.43 |
| Experience of homelessness | 12 | — | 1.08 (0.83‐1.40) | 0.521 | 0.23 |
| Injection of stimulants | 12 | — | 0.89 (0.65‐1.22) | 0.373 | 0.17 |
| Daily injection | 7 | — | 0.88 (0.64‐1.22) | 0.373 | 0.17 |
CI: confidence interval; HCV: hepatitis C virus; OST: opioid substitution therapy.
History of OST
Three studies published unadjusted estimates of lifetime use of OST versus never using OST, comprising 115 HCV cases over 511.6 person‐years from three prospective cohorts (Ruan 2007; Vallejo 2015; Van Beek 1998). One study did not define the time frame, so we coded it as lifetime experience of OST (Vallejo 2015).
Three studies published unadjusted estimates of interrupted OST use versus no interruption of use (Crofts 1997; Nolan 2014; Thiede 2000). Two of these studies were prospective cohorts and one retrospective; they included a total of 200 HCV cases over 2273.8 person‐years. Interrupted OST use was defined either as use of MMT at baseline but not at follow‐up (Nolan 2014), or leaving MMT at least once during follow‐up (Crofts 1997; Thiede 2000).
One prospective cohort study comprising 149 HCV cases over 680 person‐years examined OST for detoxification (Tsui 2014), and two studies measured high (60 mg or more) or low dosage (less than 60 mg) methadone in the last 6 months (Bruneau 2015 [pers comm]; Van Den Berg 2007). Both these studies were prospective cohorts and included 148 HCV cases over 598.6 person‐years.
Random‐effects meta‐analysis showed a very weak protective effect for lifetime (RR 0.81, 95% CI 0.52 to 1.27, I2 = 0%, Tau2 = 0.00, 3 studies, N = 385) or interrupted use of OST (RR 0.80, 95% CI 0.57 to 1.10, I2 = 86.1%, Tau2 = 0.05, 3 studies, N = 1157). The one study measuring the impact of OST used for detoxification was not associated with reduced HCV risk acquisition (RR 1.45, 95% CI 0.79 to 2.66, Tau2 = 0.00, N = 552). In the two studies that categorised OST dosage and HCV acquisition, we found a moderate association for those exposed to high dosage OST (RR 0.52, 95% CI 0.29 to 0.94, I2 = 27.2%, Tau2 = 0.05, N = 453) and a very weak association for those exposed to low dosage OST (RR 0.85, 95% CI 0.44 to 1.65; Analysis 1.3; I2 = 61.2%, Tau2 = 0.14, N = 453).
Publication bias
A funnel plot of 13 estimates (12 studies) suggested no evidence of publication bias in studies of current OST exposure (Figure 3).

Funnel plot of comparison: 1 Current OST versus no OST, outcome: 1.1 HCV incidence adjusted analyses by region.
2. Needle syringe programmes versus lower or no NSP coverage
Of the 15 studies that reported measures of NSP exposure and HCV incidence, comparison groups consisted of NSP non‐attendance (Hagan 1995; Hagan 1999; Holtzman 2009; Maher 2015; Mehta 2015 [pers comm]; Page 2015 [pers comm]; Patrick 2001; Roy 2007; Thorpe 2002; Van Den Berg 2007), lower coverage of injections covered by a clean needle/syringe (Hope 2011; Hope 2015 [pers comm]; Palmateer 2014a; Van Den Berg 2007), and non‐attendance at NSP and not using a safe source for obtaining needles/syringes (Bruneau 2015 [pers comm]).
2.1 High coverage versus non‐attendance or lower coverage
Five studies reported adjusted measures of high NSP coverage and HCV incidence (Hagan 1999; Hope 2011; Palmateer 2014a; Patrick 2001), including one unpublished dataset (Bruneau 2015 [pers comm]). Three were prospective cohorts (Bruneau 2015 [pers comm], Hagan 1999, Patrick 2001), and two were cross‐sectional surveys (Hope 2011; Palmateer 2014a), comprising 407 HCV cases over 1644 person‐years. Effect measures used in these studies included: hazard ratios in two studies (Bruneau 2015 [pers comm], Patrick 2001), odds ratios in two studies (Hope 2011; Palmateer 2014a), and risk ratio in one study (Hagan 1999).
Random‐effects meta‐analysis showed weak evidence that high coverage NSP was not associated with reduced risk of HCV infection (RR 0.79, 95% CI 0.39 to 1.61) derived from 5 studies with 3530 participants and high heterogeneity between studies (I2 =77%, P = 0.002, Tau2=0.44; Figure 4; Analysis 6.1).
Forest plot of comparison: 2 High NSP coverage versus no/low NSP coverage, outcome: 2.1 HCV incidence adjusted analyses by region.
Sensitivity analyses
Evidence of any intervention effect became weaker after excluding the unpublished dataset of Bruneau 2015 [pers comm] (RR 0.77, 95% CI 0.28 to 2.13; Analysis 7.1; Tau2 = 0.81, 4 studies, N = 3245). We did not rate any studies as being at critical risk of bias. The intervention effect disappeared when we excluded Hope 2011 and Palmateer 2014a, two cross‐sectional studies (RR 1.25, 95% CI 0.63 to 2.46; Analysis 8.1; I2 = 77.0%, Tau2 = 0.27, 3 studies, N = 627).
Random‐effects meta‐analysis of seven studies that presented unadjusted estimates show that the weak intervention effect was unchanged (RR 0.78, 95% CI 0.39 to 1.55; Analysis 9.1; I2 = 79%, Tau2 = 0.72).
Meta‐regression
Based on univariable meta‐regression analyses, we found evidence that the effectiveness of high NSP coverage varied according to geographical region. High NSP coverage was associated with a 76% reduction in HCV acquisition risk (RR 0.24, 95% CI 0.09 to 0.62), with less heterogeneity between two European studies in 2903 participants (I2 = 0%, P = 0.66). There was no evidence of an intervention effect from studies in North America (RR 1.25, 95% CI 0.63 to 2.46; Analysis 6.1; I2 = 77%, 3 studies, N = 627; Figure 4). There was some evidence of a differential impact in the meta‐regression analysis (ratio of rate ratios 3.73, 95% CI 0.95 to 14.7, P = 0.057; Table 3). Although univariable meta‐regression analysis suggested some association between high coverage of NSP and study design (ratio of rate ratios 3.5, 95% CI 0.78 to 15.8, P = 0.087), this was reduced when adjusted by geographical region (ratio of rate ratios 1.7, 95% CI 0.18 to 16.9, P = 0.58), suggesting any association is confounded by region (Analysis 6.2; Table 3).
| Variable | Studies | Univariable rate ratio (95%CI) | Ratio of rate ratios (95%CI) | P value | Tau2 |
| Geographic region | |||||
| Europe | 5 | 0.44 (0.24‐0.80) | 1.0 (Ref) | — | — |
| North America | 3 | 1.58 (0.57‐4.42) | 3.73 (0.95‐14.7) | 0.057 | 0.41 |
| Recruitment site | |||||
| Service attenders | 3 | 0.67 (0.28‐1.59) | 1.0 (Ref) | — | — |
| Community | 5 | 0.82 (0.29‐2.32) | 0.76(0.12‐4.88) | 0.74 | 0.89 |
| Study design | |||||
| Cross‐sectional survey | 3 | 0.34 (0.16‐0.75) | 1.0 (Ref) | — | — |
| Prospective cohort | 4 | 1.26 (0.55‐2.93) | 3.53 (0.78‐15.86) | 0.087 | 0.48 |
| Females | 7 | — | 2.97(0.38‐23.1) | 0.24 | 0.87 |
| Prison experience | 3 | — | NA | — | — |
| Experience of homelessness | 6 | — | 1.01 (0.38‐2.67) | 0.976 | 1.53 |
| Injection of stimulants | 7 | — | 1.08 (0.47‐2.51) | 0.827 | 1.15 |
| Daily injection | 5 | — | 3.66 (0.22‐61.3) | 0.239 | 1.15 |
CI: confidence interval; HCV: hepatitis C virus; NSP: needle syringe programmes.
2.2 Low‐level coverage of NSP versus no NSP coverage
Six studies involving 2763 participants reported adjusted measures of low‐level NSP coverage and HCV incidence (Hagan 1995; Hagan 1999; Holtzman 2009; Maher 2015; Mehta 2015 [pers comm]; Page 2015 [pers comm]). Random‐effects meta‐analysis showed no evidence of an intervention effect of low NSP coverage on HCV risk acquisition, with moderate levels of heterogeneity (RR 1.43, 95% CI 0.82 to 2.49; Analysis 10.1; I2 = 69.1%, Tau2 = 0.272).
Sensitivity analysis
Ten studies reported unadjusted measures of low‐level NSP coverage and HCV incidence. Eight were prospective cohorts (Hagan 1999; Holtzman 2009; Maher 2015; Mehta 2015 [pers comm]; Page 2015 [pers comm]; Thorpe 2002; Van Den Berg 2007; White 2014), and one was a case‐control study (Hagan 1995). We excluded another prospective cohort study since it did not report 95% confidence intervals around the effect estimate, nor the number of new HCV cases in intervention and comparison groups required to estimate it (Roy 2007). A total of 531 cases were included in the analyses over 1617 person‐years. Random‐effects meta‐analysis showed no evidence of an intervention effect for low NSP coverage on HCV risk acquisition, with moderate levels of heterogeneity (RR 1.41 95% CI 0.95 to 2.09; Analysis 11.1; I2 = 62.3%, Tau2 = 0.19, 9 studies, N = 3242).
3. Combined needle syringe programmes plus opioid substitution therapy versus low or no NSP coverage and no OST
Four studies reported combined exposure to both NSPs and OST (Hope 2011; Palmateer 2014a; Van Den Berg 2007) including one unpublished dataset (Bruneau 2015 [pers comm]). The primary analyses focused on three studies presenting adjusted estimates (Bruneau 2015 [pers comm]; Palmateer 2014a; Van Den Berg 2007). A total of 511 HCV incident cases were included in the analysis examining high NSP coverage, and 437 cases for low NSP coverage. Only one study reported the number of person‐years (Van Den Berg 2007).
Random‐effects meta‐analysis showed that combined use of OST plus high coverage of NSP was associated with a 76% risk reduction in HCV acquisition (RR 0.26, 95% CI 0.07 to 0.89; Analysis 12.1; I2 = 80%, Tau2 = 0.94; 3 studies, N = 3241; Figure 5). The effect of exposure to OST and low coverage of NSP was weaker (RR 0.87, 95% CI 0.44 to 1.68; Analysis 12.1; I2 = 36.0%, Tau2 = 0.09; 2 studies, N = 2956 participants; Figure 5).

Forest plot of comparison: 4 Combined OST and high/low NSP versus no OST and low/no NSP, outcome: 4.1 HCV incidence adjusted analyses.
Sensitivity analysis
Four studies reported unadjusted estimates of combined exposure to both NSPs and OST (Hope 2011; Palmateer 2014a; Van Den Berg 2007) including one unpublished dataset (Bruneau 2015 [pers comm]). Two were cross‐sectional surveys (Hope 2011; Palmateer 2014a), and two were prospective cohorts (Bruneau 2015 [pers comm]; Van Den Berg 2007). The analysis examining high NSP coverage included a total of 518 HCV incident cases, and the analysis for low NSP coverage, 449 cases. Random‐effects meta‐analysis showed that combined use of OST plus high coverage of NSP was associated with a 71% risk reduction in HCV acquisition (RR 0.29, 95% CI 0.13 to 0.65, I2 = 64.4%, Tau2 = 0.07, 4 studies, N = 3356). The effect of exposure to OST and low coverage of NSP was weaker (RR 0.76, 95% CI 0.44 to 1.33; Analysis 12.2; I2 = 29.6%, Tau2 = 0.4, 3 studies, N = 2956).
Discussion
Summary of main results
Opioid substitution treatment (OST)
Primary meta‐analysis of 12 observational studies adjusting for key confounders and enrolling 6361 anti‐HCV negative participants showed that current use of opioid substitution therapy reduced the risk of HCV acquisition by 50% (95% CI 37% to 60%) compared to no current OST use. The intervention effect is strong, but the evidence is considered as low quality because it was derived from observational studies with serious risk of bias. Nonetheless, the findings were robust to sensitivity analyses excluding studies judged to be at critical risk of bias; studies drawing on unpublished data; case‐control and cross‐sectional studies only reporting baseline data; and studies reporting only unadjusted estimates. There was also no evidence of publication bias.
Meta‐regression analysis suggested evidence of a differential impact of OST by the proportion of female participants in the sample. With each 10% increase in female participants, the effect of intervention exposure was reduced by 59%. None of the included studies reported uptake of OST by sex to understand whether individual‐level analyses supported this evidence of a differential intervention effect. Other epidemiological evidence suggests that women are at increased risk of acquiring hepatitis C compared to men (Esmaeli 2016; Iversen 2015; Miller 2004; Tracy 2014). This increased risk has been linked to having a sexual partner who also injects, being initiated into injection by a sexual partner being injected by others or consistently injecting after other people with used needles/syringes (Bourgois 2004; Iversen 2015). Our findings suggest that women may have poorer access to OST than men, and this is supported by recent review work that suggests services do not take into account gender‐specific needs and are often tailored towards men (Iversen 2015).
Only a few studies reported other types of exposure to OST: three studies reported past exposure to OST; three reported interrupted OST use; one study measured OST use for detoxification; and two studies measured high dosage (more than 60 mg) or low dosage (1 to 59 mg) of methadone for daily use. Among these exposures, only high dosage of OST was associated with a reduction in risk of HCV acquisition.
Needle and syringe programmes (NSP)
Meta‐analysis of five observational studies pooling adjusted estimates from 3530 anti‐HCV negative participants show low‐quality evidence that high NSP exposure does not reduce the risk of HCV acquisition. Selected sensitivity analyses increased the uncertainty around the intervention effect. However,meta‐regression showed a strong association between intervention effect and region. After removing studies from North America, heterogeneity was reduced, and high NSP coverage in Europe was associated with a 76% (95% CI 38% to 91%) reduction in HCV acquisition risk (RR 0.24, 95% CI 0.09 to 0.62).
Combined NSP and OST
Primary meta‐analysis of three studies involving 3241 anti‐HCV negative participants and adjusting for confounders suggested a strong intervention effect for combined high coverage of NSP and OST, reducing the risk of HCV acquisition by 74% (95% CI 11% to 93%) compared to no OST and low/no coverage with NSP. The evidence is considered low quality because it was derived from observational studies with serious risk of bias, and the few studies identified precluded sensitivity analyses. Evidence for the combination of low coverage of NSP and OST was weaker. There were fewer studies with information on both OST and NSP coverage, and the studies represented a subset of people on OST (i.e. participants who continue to inject drugs while on OST), with those on low coverage NSP receiving an insufficient number of sterile syringes per average frequency of injecting.
Overall completeness and applicability of evidence
We found no historical RCT evidence that assessed the impact of NSP or OST on HCV transmission. There was a larger body of observational evidence that examined the effectiveness of NSPs and OST in reducing HCV acquisition among PWID – but the evidence was concentrated in few geographical areas and regions. Most evidence came from North America and Western Europe. Only one study was identified from China (Ruan 2007), and we did not find any studies from Eastern Europe or Southeast Asia, where there are the largest populations of PWID and hence the highest burden of disease associated with bloodborne infections (Gower 2014; Mathers 2008; Platt 2016).
Quality of the evidence
We assessed many studies included in the review as being at severe risk of bias – with only two being at moderate overall risk and seven at critical risk. Only a few studies reported the intervention effect of high NSP coverage adjusting for confounders (5/7), which limited the sensitivity analyses that we could conduct. The GRADE assessment criteria takes RCTs to be the gold standard study design, and observational studies are by default rated as low quality, so the assessment begins low, despite this being the only evidence available for examining this question. While certainty in the results may be undermined by the lack of experimental studies, the intervention effect estimates for current use of OST were consistent and robust across sensitivity analyses, and the size of effect is high. GRADE guidelines also state that judgments about the overall quality of evidence require information beyond the results of the review (GRADE 2004). Considering the wealth of supporting evidence showing the beneficial effects of OST in reducing injecting harms, HIV and bacterial infections, and in improving access to services, we are confident that the assessment is fair (Hagan 2011; MacArthur 2012; Palmateer 2010; Turner 2011; Vickerman 2012; Vickerman 2014).
Potential biases in the review process
A potential bias in the review was the heterogeneity across the studies in the use of multiple effect measures. Effect measures were converted into risk ratios in the meta‐analysis, but this may have introduced bias into our findings since we had to assume that risk ratios approximated odds ratios, which may be inappropriate for some sites given the high incidence of HCV seroconversion. We removed cross‐sectional study designs that identified serological markers of incidence infection as part of our sensitivity analysis. Effect estimates remained the same for current use of OST versus no intervention, but not for high coverage of NSPs. Nonetheless, most studies recruited people who inject drugs currently or recently, which may not be representative of all PWID exposed to OST and may lead to an underestimation of the effect of OST on HCV transmission. For example, in the Amsterdam cohort, people who reported being on OST and having ceased injecting had a lower risk of HCV transmssion (Van Den Berg 2007). Another potential bias is the use in three studies of HCV RNA testing for anti‐HCV negative samples to obtain an estimate of incidence (Hope 2011; Hope 2015 [pers comm]; Palmateer 2014a). Potential limitations of this method include delayed or weak antibody response due to a compromised immune system and uncertainty around the incidence window period (Hope 2010). All included studies estimating incidence from RNA samples used the same formula and comparable window periods. We didn't include any studies that used avidity testing, minimising any further misclassification of outcomes that that approach brings through the uncertainty in window periods.
Agreements and disagreements with other studies or reviews
Our review corroborates and underpins an earlier review that showed consistent and large effects of NSP and OST on injecting risk behaviours associated with bloodborne virus transmission (Gowing 2011). Two recent reviews focused on the effectiveness of OST and NSPs in reducing HCV incidence. Our findings corroborate the most recent pooled analysis, which suggested that receiving OST and high coverage of NSP can each reduce HCV infection risk alone but have a greater effect in combination (Turner 2011). The estimate for association between exposure to NSP and HCV incidence was weak in the pooled analysis and was focused on studies from the UK only. Findings from our subgroup analysis suggested a stronger effect of high NSP coverage in Europe. This finding builds directly on the Turner 2011 analysis through the addition to the meta‐analysis of the earlier Van Den Berg 2007 along with more recent studies and datasets (Hope 2015 [pers comm]), and it strengthens the efficacy estimate for Europe suggesting reduced risk of HCV acquisition (RR 0.24 95% CI 0.09 to 0.62). We found no effect of high NSP coverage when pooling estimates from North America and greater heterogeneity across the studies. This corroborates findings from another review that found increased risk of seroconversion associated with NSP attendance that relied on evidence predominantly from North America (Hagan 2011).
The lack of evidence for NSPs from studies in North America can be attributed to a mixture of confounding, differences in injecting patterns, potential selection bias and misclassification of exposure. People who attend NSPs regularly also report greater injecting risk behaviours, and any positive association between HCV transmission and NSP attendance disappears after adjustment for injecting risk. The effect of this residual confounding has been demonstrated in further analyses of a cohort of PWID in Vancouver, which demonstrated that higher HIV seroconversion rates observed among daily NSP attenders were associated with high‐risk behaviours of attenders (including regular cocaine injection, sex work involvement and homelessness) rather than use of the NSP (Wood 2007). Likewise, a study in Seattle showed that people who were homeless or who injected with used needle/syringes were more likely to become new NSP users (Hagan 2000). The higher proportion of stimulant injecting in North America also means that the additional protective effect of OST is absent, which may contribute to the impact of NSP on HCV risk in European studies. Potential selection bias may occur since samples of cohort studies are to some degree self‐selected. Particularly when participants are lost to follow‐up over time, they may be inherently different in terms of demographic characteristics and risk behaviours that can influence the outcome. Misclassification of exposure may also occur since it is difficult to make a clear distinction between exposed and unexposed groups, and unexposed populations may have access to clean needles/syringes through other sources than NSPs. The European studies consistently used measures of NSP exposure through coverage of injections by clean needles/syringes, whereas the North American studies drew on varied definitions of NSP use that focused on frequency of attendance at NSPs. Comparability in measurement of intervention exposure is reflected in the higher heterogeneity observed among studies measuring exposure to NSP (I2 = 77%, P = 0.002) compared to OST exposure (I2 = 0%, P = 0.89). This is particularly relevant in relation to measures of intervention exposure that focus on frequency of attendance at an NSP rather than a measure of injections covered by clean needle/syringes, and further explains the lack of effect between high NSP coverage and HCV incidence observed in North America. It is also possible that the lack of effect of NSPs on HCV transmission observed in North America is due to less frequent use of NSPs. Previous evidence has shown that lack of federal funding for NSPs in the USA has resulted in lower coverage among PWID, and this has been associated with higher HIV incidence than in other countries with higher NSP coverage (Wiessing 2009).
Findings also corroborate two recent systematic reviews that measured the impact of NSPs and OST on HIV transmission. These previous analyses of 12 observational studies estimated a moderate effect of NSPs on reducing HIV transmission by 48% (95% CI 3% to 72%) and strong evidence for OST reducing HIV transmission by 54% (95% CI 33% to 68%) (Aspinall 2014; MacArthur 2012).
A previous review of reviews from 2010 concluded that there was insufficient evidence to assess the effectiveness of NSPs in reducing HCV incidence. This 'meta' review synthesised findings from four primary reviews, three of which focused primarily on HIV as an outcome, missing much of the relevant data, and the fourth predominantly relied on weaker study designs (Palmateer 2010).

Study flow diagram.
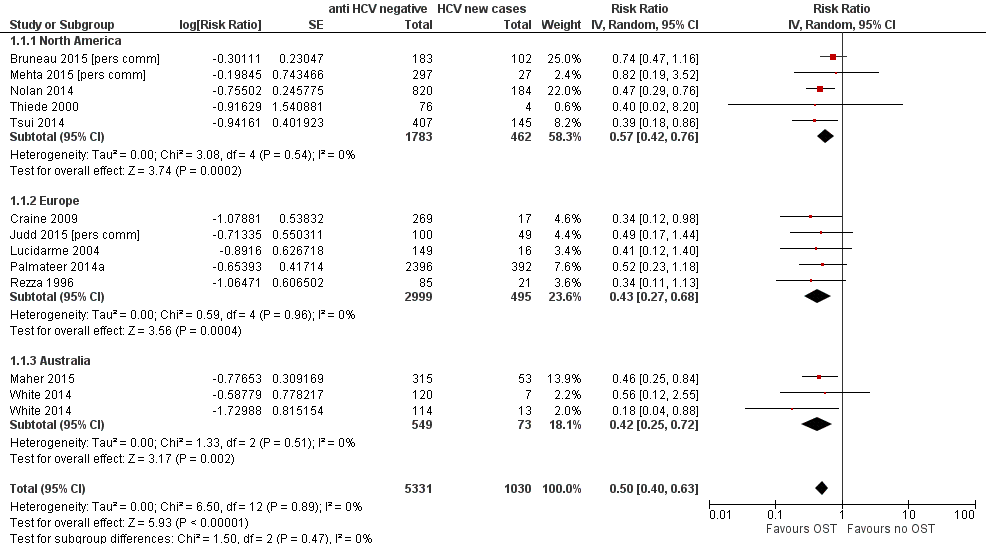
Forest plot of comparison: 1 Current OST versus no OST, outcome: 1.1 HCV incidence adjusted analyses by region.

Funnel plot of comparison: 1 Current OST versus no OST, outcome: 1.1 HCV incidence adjusted analyses by region.

Forest plot of comparison: 2 High NSP coverage versus no/low NSP coverage, outcome: 2.1 HCV incidence adjusted analyses by region.
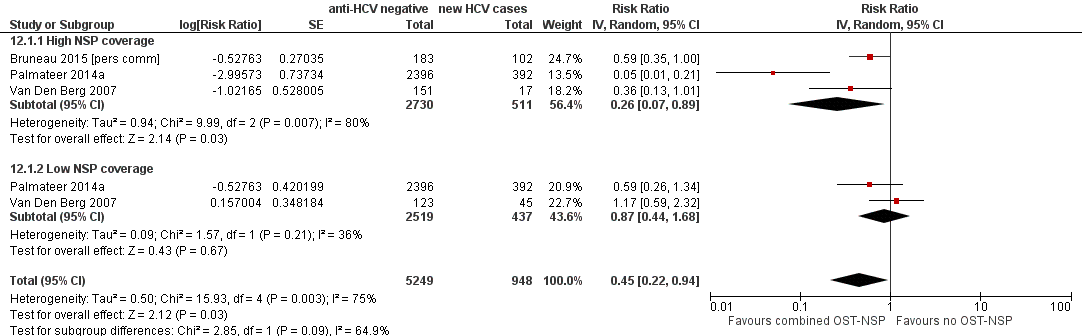
Forest plot of comparison: 4 Combined OST and high/low NSP versus no OST and low/no NSP, outcome: 4.1 HCV incidence adjusted analyses.

Comparison 1 Current OST versus no OST, Outcome 1 HCV incidence adjusted analyses by region.

Comparison 1 Current OST versus no OST, Outcome 2 HCV incidence adjusted analysis by study design.
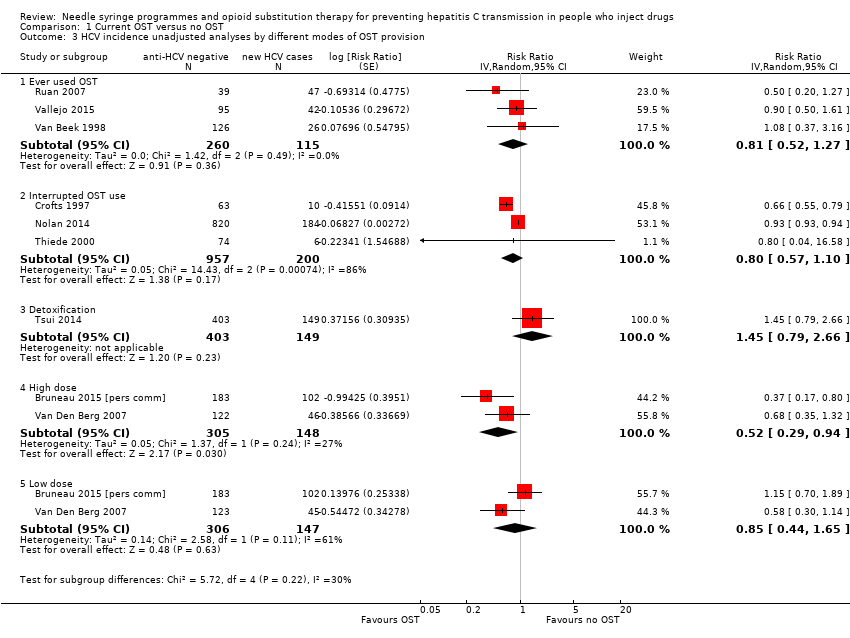
Comparison 1 Current OST versus no OST, Outcome 3 HCV incidence unadjusted analyses by different modes of OST provision.
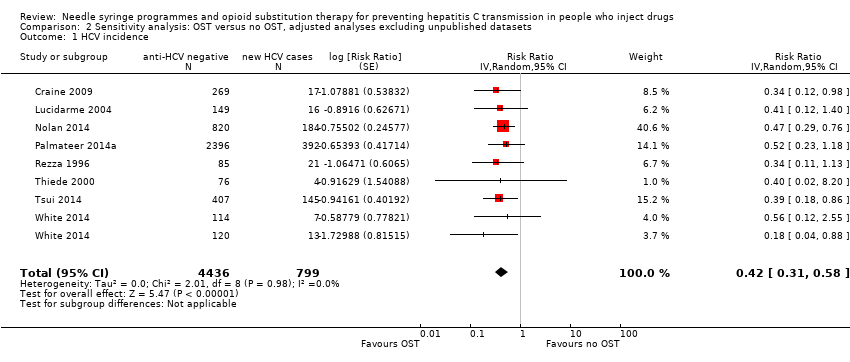
Comparison 2 Sensitivity analysis: OST versus no OST, adjusted analyses excluding unpublished datasets, Outcome 1 HCV incidence.

Comparison 3 Sensitivity analysis: OST versus no OST, adjusted analyses excluding studies at critical risk of bias, Outcome 1 HCV incidence.

Comparison 4 Sensitivity analysis: OST versus no OST, adjusted analyses excluding cross‐sectional studies, Outcome 1 HCV incidence.

Comparison 5 OST versus no OST, unadjusted analysis, Outcome 1 HCV incidence.

Comparison 6 High NSP coverage versus no/low NSP coverage, Outcome 1 HCV incidence adjusted analyses by region.

Comparison 6 High NSP coverage versus no/low NSP coverage, Outcome 2 HCV incidence adjusted analyses by study design.
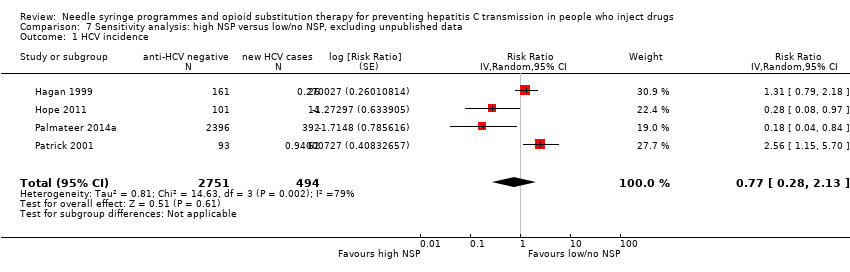
Comparison 7 Sensitivity analysis: high NSP versus low/no NSP, excluding unpublished data, Outcome 1 HCV incidence.

Comparison 8 Sensitivity analysis: high NSP versus low/no NSP, excluding cross‐sectional surveys, Outcome 1 HCV incidence.

Comparison 9 High NSP coverage versus low/no coverage, unadjusted estimates, Outcome 1 HCV incidence.

Comparison 10 Low NSP coverage versus no coverage, Outcome 1 HCV incidence, adjusted analyses.

Comparison 11 Low NSP coverage versus no NSP, unadjusted analysis, Outcome 1 HCV incidence.

Comparison 12 Combined OST and high/low NSP versus no OST and low/no NSP, Outcome 1 HCV incidence adjusted analyses.
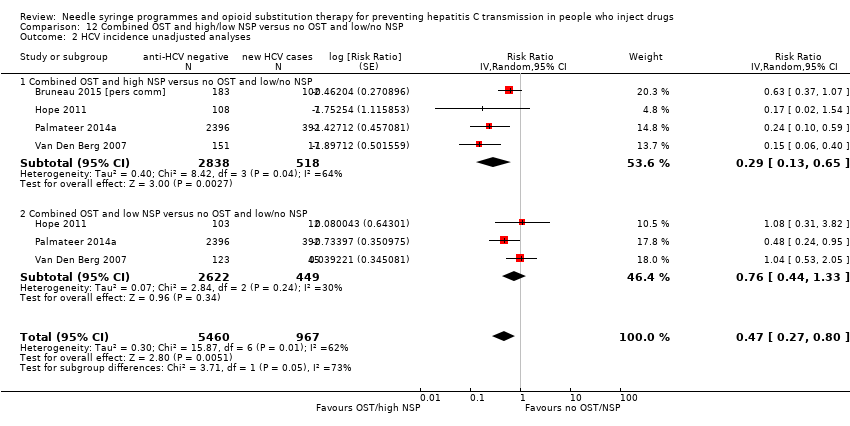
Comparison 12 Combined OST and high/low NSP versus no OST and low/no NSP, Outcome 2 HCV incidence unadjusted analyses.
| Current OST versus no OST | |||||
| Patient or population: people who inject drugs | |||||
| Outcomes | Illustrative comparative risks* (95% CI) | Relative effect | No of participants | Quality of the evidence | |
| Assumed risk | Corresponding risk | ||||
| No OST | Current OST | ||||
| HCV incidence adjusted analyses | — | — | RR 0.50 (0.40 to 0.63) | 6361 | ⊕⊕⊝⊝ |
| *The basis for the assumed risk (e.g. the median control group risk across studies) is provided in footnotes. The corresponding risk (and its 95% confidence interval) is based on the assumed risk in the comparison group and the relative effect of the intervention (and its 95% CI). | |||||
| GRADE Working Group grades of evidence | |||||
| aDowngraded one level due to overall moderate risk of bias in 2 studies, overall serious risk of bias in 6 studies, 2 studies at overall critical risk of bias in 2 studies; not enough information to make judgment in 2 studies. | |||||
| High NSP coverage versus no/low NSP coverage | |||||
| Patient or population: people who inject drugs | |||||
| Outcomes | Illustrative comparative risks* (95% CI) | Relative effect | No of participants | Quality of the evidence | |
| Assumed risk | Corresponding risk | ||||
| No/low NSP coverage | High NSP coverage | ||||
| HCV incidence adjusted analyses | — | — | RR: 0.79 (0.39 to 1.61) | 3530 | ⊕⊝⊝⊝ |
| *The basis for the assumed risk (e.g. the median control group risk across studies) is provided in footnotes. The corresponding risk (and its 95% confidence interval) is based on the assumed risk in the comparison group and the relative effect of the intervention (and its 95% CI). | |||||
| GRADE Working Group grades of evidence | |||||
| aDowngraded one level due to serious overall risk of bias in all the studies. | |||||
| Combined OST and highNSP versus no OST and low/no NSP | |||||
| Patient or population: people who inject drugs | |||||
| Outcomes | Illustrative comparative risks* (95% CI) | Relative effect | No of participants | Quality of the evidence | |
| Assumed risk | Corresponding risk | ||||
| No OST and low/no NSP | Combined OST and high NSP | ||||
| HCV incidence adjusted analyses | — | — | RR: 0.26 (0.07 to 0.89) | 3241 | ⊕⊕⊕⊝ Lowa,b |
| *The basis for the assumed risk (e.g. the median control group risk across studies) is provided in footnotes. The corresponding risk (and its 95% confidence interval) is based on the assumed risk in the comparison group and the relative effect of the intervention (and its 95% CI). | |||||
| GRADE Working Group grades of evidence | |||||
| aDowngraded one level due to serious overall risk of bias in all studies. | |||||
| Study | Confounding | Selection bias | Measurement of interventions | Departures from intended interventions | Missing data | Measurement of outcomes | Selection of reported result | Overall risk of bias |
| Critical | Critical | Serious | No info | Critical | Low | No info | Critical | |
| Moderate | Serious | Moderate | No info | No info | Low | Low | Serious | |
| Serious | Serious | Serious | No info | Serious | Low | Low | Serious | |
| Critical | Serious | Low | No info | Serious | Serious | Low | Critical | |
| Serious | Serious | Serious | No info | Low | Low | Low | Serious | |
| Moderate | Serious | Low | No info | Low | Low | Low | Serious | |
| Serious | Serious | Moderate | No info | No info | Low | Low | Serious | |
| Moderate | Moderate | Serious | No info | Low | Low | Low | Serious | |
| Moderate | Moderate | Serious | No info | No info | Low | Low | Serious | |
| Moderate | Critical | Critical | No info | Critical | Low | Low | Critical | |
| Moderate | Serious | Serious | No info | Serious | Low | Low | Serious | |
| Moderate | Serious | Serious | No info | No info | Low | Low | Serious | |
| Moderate | No info | No info | No info | No info | Low | Low | No info | |
| Serious | Serious | Moderate | No info | Low | Low | Low | Serious | |
| Moderate | No info | No info | No info | No info | Low | Low | No info | |
| Serious | Serious | Moderate | No info | Serious | Low | Low | Serious | |
| Serious | Moderate | Serious | No info | Serious | Low | Low | Serious | |
| Serious | Low | Serious | No info | Critical | Low | Low | Critical | |
| Serious | Serious | Serious | No info | Critical | Low | Low | Critical | |
| Critical | Critical | Serious | No info | Serious | Low | Low | Critical | |
| Serious | Serious | Moderate | No info | Low | Low | Low | Serious | |
| Moderate | Moderate | Low | No info | Low | Low | Low | Moderate | |
| Serious | Serious | Serious | No info | Moderate | Low | Low | Serious | |
| Moderate | Moderate | Low | No info | Moderate | Low | Low | Moderate | |
| Serious | Serious | Low | No info | Serious | Low | Low | Serious | |
| Critical | Serious | Serious | No info | Critical | Low | Low | Critical | |
| Serious | Serious | Moderate | No info | Serious | Low | Low | Serious | |
| Moderate | Serious | Moderate | No info | No info | Low | Low | Serious |
| Variable | Studies | Univariable rate ratio (95% CI) | Ratio of rate ratios (95% CI) | P value | Tau2 |
| Geographic region | |||||
| Europe | 8 | 0.51 (0.37‐0.70) | 1.0 (ref) | — | — |
| Australia | 5 | 0.55 (0.28‐1.11) | 1.12 (0.52‐2.41) | — | — |
| North America | 6 | 0.69 (0.44‐1.08) | 1.42 (0.73‐2.78) | 0.53 | 0.10 |
| Site of recruitment | |||||
| Service attenders | 12 | 0.67 (0.49‐0.92) | 1.0 (ref) | — | — |
| Community | 7 | 0.49 (0.33‐0.73) | 0.73 (0.42‐1.27) | 0.256 | 0.06 |
| Study design | |||||
| Cross‐sectional | 4 | 0.51 (0.31‐0.85) | 1.0 | — | — |
| Prospective cohort | 15 | 0.58 (0.43‐0.77) | 1.12 (0.48‐2.61) | 0.784 | 0.10 |
| Females | 17 | — | 1.59 (1.13‐2.29) | 0.01 | 0.04 |
| Prison experience | 11 | — | 1.057 (0.61‐1.79) | 0.821 | 0.43 |
| Experience of homelessness | 12 | — | 1.08 (0.83‐1.40) | 0.521 | 0.23 |
| Injection of stimulants | 12 | — | 0.89 (0.65‐1.22) | 0.373 | 0.17 |
| Daily injection | 7 | — | 0.88 (0.64‐1.22) | 0.373 | 0.17 |
| CI: confidence interval; HCV: hepatitis C virus; OST: opioid substitution therapy. | |||||
| Variable | Studies | Univariable rate ratio (95%CI) | Ratio of rate ratios (95%CI) | P value | Tau2 |
| Geographic region | |||||
| Europe | 5 | 0.44 (0.24‐0.80) | 1.0 (Ref) | — | — |
| North America | 3 | 1.58 (0.57‐4.42) | 3.73 (0.95‐14.7) | 0.057 | 0.41 |
| Recruitment site | |||||
| Service attenders | 3 | 0.67 (0.28‐1.59) | 1.0 (Ref) | — | — |
| Community | 5 | 0.82 (0.29‐2.32) | 0.76(0.12‐4.88) | 0.74 | 0.89 |
| Study design | |||||
| Cross‐sectional survey | 3 | 0.34 (0.16‐0.75) | 1.0 (Ref) | — | — |
| Prospective cohort | 4 | 1.26 (0.55‐2.93) | 3.53 (0.78‐15.86) | 0.087 | 0.48 |
| Females | 7 | — | 2.97(0.38‐23.1) | 0.24 | 0.87 |
| Prison experience | 3 | — | NA | — | — |
| Experience of homelessness | 6 | — | 1.01 (0.38‐2.67) | 0.976 | 1.53 |
| Injection of stimulants | 7 | — | 1.08 (0.47‐2.51) | 0.827 | 1.15 |
| Daily injection | 5 | — | 3.66 (0.22‐61.3) | 0.239 | 1.15 |
| CI: confidence interval; HCV: hepatitis C virus; NSP: needle syringe programmes. | |||||
| Outcome or subgroup title | No. of studies | No. of participants | Statistical method | Effect size |
| 1 HCV incidence adjusted analyses by region Show forest plot | 12 | 6361 | Risk Ratio (Random, 95% CI) | 0.50 [0.40, 0.63] |
| 1.1 North America | 5 | 2245 | Risk Ratio (Random, 95% CI) | 0.57 [0.42, 0.76] |
| 1.2 Europe | 5 | 3494 | Risk Ratio (Random, 95% CI) | 0.43 [0.27, 0.68] |
| 1.3 Australia | 2 | 622 | Risk Ratio (Random, 95% CI) | 0.42 [0.25, 0.72] |
| 2 HCV incidence adjusted analysis by study design Show forest plot | 12 | 6361 | Risk Ratio (Random, 95% CI) | 0.50 [0.40, 0.63] |
| 2.1 Prospective cohort | 10 | 3467 | Risk Ratio (Random, 95% CI) | 0.51 [0.40, 0.65] |
| 2.2 Cross‐sectional surveys | 2 | 2894 | Risk Ratio (Random, 95% CI) | 0.46 [0.23, 0.89] |
| 3 HCV incidence unadjusted analyses by different modes of OST provision Show forest plot | 9 | Risk Ratio (Random, 95% CI) | Subtotals only | |
| 3.1 Ever used OST | 3 | 375 | Risk Ratio (Random, 95% CI) | 0.81 [0.52, 1.27] |
| 3.2 Interrupted OST use | 3 | 1157 | Risk Ratio (Random, 95% CI) | 0.80 [0.57, 1.10] |
| 3.3 Detoxification | 1 | 552 | Risk Ratio (Random, 95% CI) | 1.45 [0.79, 2.66] |
| 3.4 High dose | 2 | 453 | Risk Ratio (Random, 95% CI) | 0.52 [0.29, 0.94] |
| 3.5 Low dose | 2 | 453 | Risk Ratio (Random, 95% CI) | 0.85 [0.44, 1.65] |
| Outcome or subgroup title | No. of studies | No. of participants | Statistical method | Effect size |
| 1 HCV incidence Show forest plot | 8 | 5235 | Risk Ratio (Random, 95% CI) | 0.42 [0.31, 0.58] |
| Outcome or subgroup title | No. of studies | No. of participants | Statistical method | Effect size |
| 1 HCV incidence Show forest plot | 9 | 5782 | Risk Ratio (Random, 95% CI) | 0.51 [0.40, 0.64] |
| Outcome or subgroup title | No. of studies | No. of participants | Statistical method | Effect size |
| 1 HCV incidence Show forest plot | 10 | 3467 | Risk Ratio (Random, 95% CI) | 0.51 [0.40, 0.65] |
| Outcome or subgroup title | No. of studies | No. of participants | Statistical method | Effect size |
| 1 HCV incidence Show forest plot | 16 | 9499 | Risk Ratio (Random, 95% CI) | 0.57 [0.45, 0.73] |
| Outcome or subgroup title | No. of studies | No. of participants | Statistical method | Effect size |
| 1 HCV incidence adjusted analyses by region Show forest plot | 5 | 3530 | Risk Ratio (Random, 95% CI) | 0.79 [0.39, 1.61] |
| 1.1 North America | 3 | 627 | Risk Ratio (Random, 95% CI) | 1.25 [0.63, 2.46] |
| 1.2 Europe | 2 | 2903 | Risk Ratio (Random, 95% CI) | 0.24 [0.09, 0.62] |
| 2 HCV incidence adjusted analyses by study design Show forest plot | 5 | 3530 | Risk Ratio (Random, 95% CI) | 0.95 [0.50, 1.82] |
| 2.1 Prospective cohorts | 3 | 627 | Risk Ratio (Random, 95% CI) | 1.44 [1.01, 2.05] |
| 2.2 Cross‐sectional surveys | 2 | 2903 | Risk Ratio (Random, 95% CI) | 0.24 [0.09, 0.62] |
| Outcome or subgroup title | No. of studies | No. of participants | Statistical method | Effect size |
| 1 HCV incidence Show forest plot | 4 | 3245 | Risk Ratio (Random, 95% CI) | 0.77 [0.28, 2.13] |
| Outcome or subgroup title | No. of studies | No. of participants | Statistical method | Effect size |
| 1 HCV incidence Show forest plot | 3 | 627 | Risk Ratio (Random, 95% CI) | 1.25 [0.63, 2.46] |
| Outcome or subgroup title | No. of studies | No. of participants | Statistical method | Effect size |
| 1 HCV incidence Show forest plot | 7 | 6455 | Risk Ratio (Random, 95% CI) | 0.78 [0.39, 1.55] |
| Outcome or subgroup title | No. of studies | No. of participants | Statistical method | Effect size |
| 1 HCV incidence, adjusted analyses Show forest plot | 6 | 2765 | Risk Ratio (Random, 95% CI) | 1.43 [0.82, 2.49] |
| Outcome or subgroup title | No. of studies | No. of participants | Statistical method | Effect size |
| 1 HCV incidence Show forest plot | 9 | 3242 | Risk Ratio (Random, 95% CI) | 1.41 [0.95, 2.09] |
| Outcome or subgroup title | No. of studies | No. of participants | Statistical method | Effect size |
| 1 HCV incidence adjusted analyses Show forest plot | 3 | 6197 | Risk Ratio (Random, 95% CI) | 0.45 [0.22, 0.94] |
| 1.1 High NSP coverage | 3 | 3241 | Risk Ratio (Random, 95% CI) | 0.26 [0.07, 0.89] |
| 1.2 Low NSP coverage | 2 | 2956 | Risk Ratio (Random, 95% CI) | 0.87 [0.44, 1.68] |
| 2 HCV incidence unadjusted analyses Show forest plot | 4 | 6427 | Risk Ratio (Random, 95% CI) | 0.47 [0.27, 0.80] |
| 2.1 Combined OST and high NSP versus no OST and low/no NSP | 4 | 3356 | Risk Ratio (Random, 95% CI) | 0.29 [0.13, 0.65] |
| 2.2 Combined OST and low NSP versus no OST and low/no NSP | 3 | 3071 | Risk Ratio (Random, 95% CI) | 0.76 [0.44, 1.33] |