Entrenamiento preoperatorio con ejercicios para pacientes con cáncer de pulmón de células no pequeñas
Información
- DOI:
- https://doi.org/10.1002/14651858.CD012020.pub2Copiar DOI

- Base de datos:
-
- Cochrane Database of Systematic Reviews
- Versión publicada:
-
- 07 junio 2017see what's new
- Tipo:
-
- Intervention
- Etapa:
-
- Review
- Grupo Editorial Cochrane:
-
Grupo Cochrane de Cáncer de pulmón
- Copyright:
-
- Copyright © 2017 The Cochrane Collaboration. Published by John Wiley & Sons, Ltd.
Cifras del artículo
Altmetric:
Citado por:
Autores
Contributions of authors
Vinicius Cavalheri: initiation, writing of protocol, organisation of protocol into RevMan, selection of studies, extraction of data from studies, conduct of the analysis, and writing of the final review paper.
Catherine Granger: initiation, writing of protocol and protocol development, selection of studies, extraction of data from studies, and writing of the final review paper.
Sources of support
Internal sources
-
School of Physiotherapy and Exercise Science, Faculty of Health Sciences, Curtin University, Australia.
-
Department of Physiotherapy, The University of Melbourne, Australia.
-
Department of Physiotherapy, Royal Melbourne Hospital, Australia.
-
Institute for Respiratory Health, Sir Charles Gairdner Hospital, Perth, Australia.
External sources
-
Cancer Council Western Australia, Australia.
Vinicius Cavalheri is supported by a Cancer Council Western Australia Postdoctoral Fellowship
-
Victorian Cancer Agency, Australia.
Catherine Granger is supported by a Victorian Cancer Agency Clinical Research Fellowship
Declarations of interest
Vinicius Cavalheri: none known
Catherine Granger: none known
Acknowledgements
The authors would like to thank Corynne Marchal, Managing Editor of the Cochrane Lung Cancer Group, for her feedback and support; Fergus MacBeth, Frederic Fiteni, and Ramon Rami Porta, Editors of the Cochrane Lung Cancer Group, as well as Paul Van Schil, Bruno Degano and Pierre‐Emmanuel Falcoz, peer referees, and André Stoop, consumer, for their feedback and assistance; François Calais and Giorgio Maria Agazzi for their work on the search strategies; and Virginie Westeel, Sign‐off Editor.
This research was supported by a Cancer Council WA Postdoctoral Fellowship (VC) and a Victorian Cancer Agency Clinical Research Fellowship (CG).
Version history
| Published | Title | Stage | Authors | Version |
| 2022 Sep 28 | Preoperative exercise training for people with non‐small cell lung cancer | Review | Catherine Granger, Vinicius Cavalheri | |
| 2017 Jun 07 | Preoperative exercise training for patients with non‐small cell lung cancer | Review | Vinicius Cavalheri, Catherine Granger | |
| 2015 Dec 22 | Preoperative exercise training for patients with non‐small cell lung cancer | Protocol | Vinicius Cavalheri, Catherine Granger | |
Differences between protocol and review
We did not perform subgroup or sensitivity analyses due to the small number of studies included in the meta‐analyses, as well as their small sample sizes.
Keywords
MeSH
Medical Subject Headings (MeSH) Keywords
- *Physical Conditioning, Human;
- Carcinoma, Non‐Small‐Cell Lung [*surgery];
- Chest Tubes [statistics & numerical data];
- Length of Stay [statistics & numerical data];
- Lung Neoplasms [*surgery];
- Postoperative Complications [*prevention & control];
- Randomized Controlled Trials as Topic;
- Time Factors;
- Vital Capacity;
- Walk Test;
Medical Subject Headings Check Words
Aged; Humans; Middle Aged;
PICO
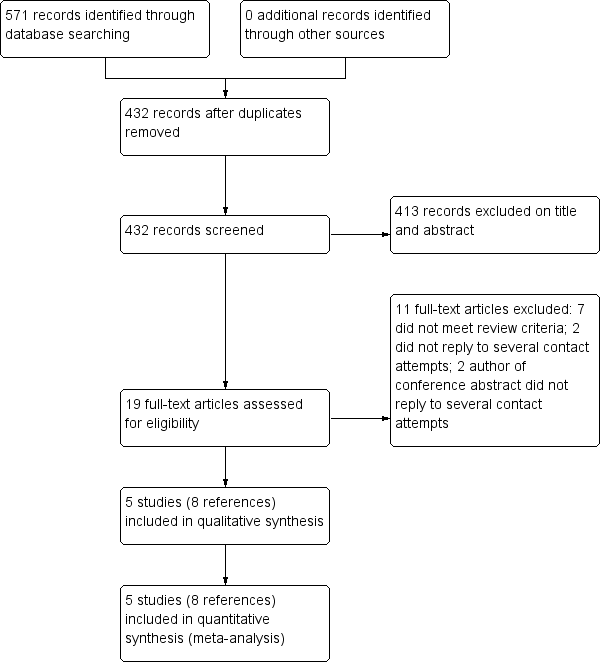
Flow diagram of references identified, excluded, and included in review
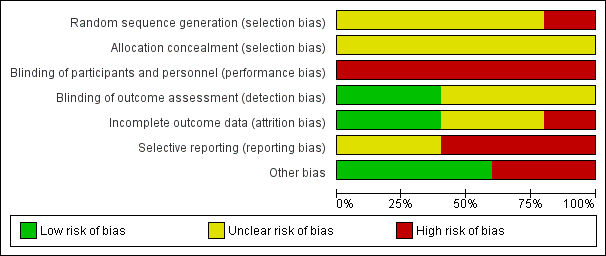
Risk of bias graph: review authors' judgements about each risk of bias item presented as percentages across all included studies.

Risk of bias summary: review authors' judgements about each risk of bias item for each included study.

Forest plot of comparison: 1 Intervention group versus control group, outcome: 1.1 Risk of developing a postoperative pulmonary complication.
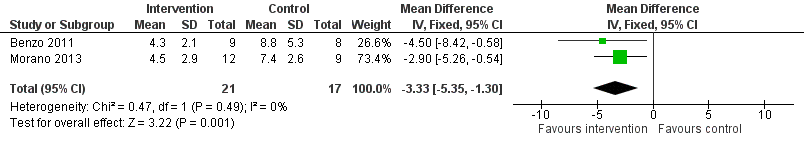
Forest plot of comparison: 1 Intervention group versus control group, outcome: 1.2 Number of days patients needed an intercostal catheter.
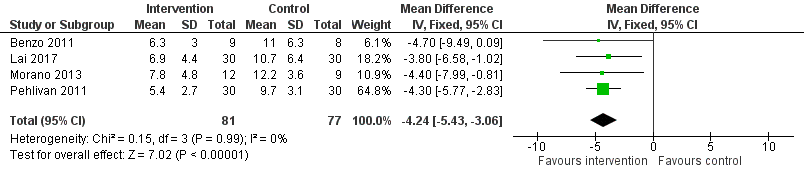
Forest plot of comparison: 1 Intervention group versus control group, outcome: 1.3 Postoperative length of hospital stay.

Comparison 1 Intervention group versus control group, Outcome 1 Risk of developing a postoperative pulmonary complication.

Comparison 1 Intervention group versus control group, Outcome 2 Number of days patients needed an intercostal catheter.

Comparison 1 Intervention group versus control group, Outcome 3 Postoperative length of hospital stay.
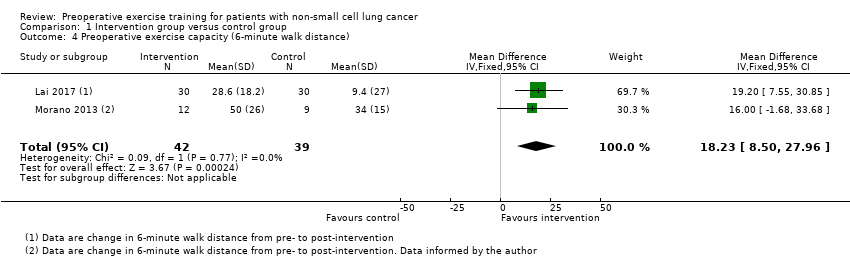
Comparison 1 Intervention group versus control group, Outcome 4 Preoperative exercise capacity (6‐minute walk distance).

Comparison 1 Intervention group versus control group, Outcome 5 Forced vital capacity (% pred).
| Preoperative exercise training compared to no exercise training for patients scheduled to undergo lung resection for non‐small cell lung cancer | ||||||
| Patient or population: patients scheduled to undergo lung resection for non‐small cell lung cancer | ||||||
| Outcomes | Anticipated absolute effects* (95% CI) | Relative effect | № of participants | Quality of the evidence | Comments | |
| Risk with no exercise training | Risk with preoperative exercise training | |||||
| Number of patients who developed postoperative pulmonary complications | Study population | RR 0.33 | 158 | ⊕⊕⊝⊝ | ||
| 22 per 100 | 7 per 100 | |||||
| Number of days patients needed an intercostal catheter | The mean number of days patients needed an intercostal catheter in the control groups ranged from 7.4 to 8.8 days | The number of days patients needed an intercostal catheter in the intervention groups was, on average, 3.33 fewer days | ‐ | 38 | ⊕⊕⊝⊝ | |
| Postoperative length of hospital stay | The mean postoperative length of hospital stay in the control groups ranged from 9.7 to 12.2 days | The postoperative length of hospital stay in the intervention groups was, on average, 4.34 fewer days (95% CI 5.65 to 3.03 fewer days) | ‐ | 158 | ⊕⊕⊝⊝ | |
| Post‐intervention exercise capacity assessed with: 6‐minute walk distance (6MWD) | The mean post‐intervention exercise capacity in the control groups ranged from 340 to 434 metres in 6 minutes. | The post‐intervention exercise capacity in the intervention groups was, on average, 18.23 metres more | ‐ | 81 | ⊕⊕⊝⊝ | |
| *The risk in the intervention group (and its 95% confidence interval) is based on the assumed risk in the comparison group and the relative effect of the intervention (and its 95% CI). | ||||||
| GRADE Working Group grades of evidence | ||||||
| 1 Significant risk of bias across the studies 2 Small sample sizes across the studies, some with wide confidence intervals | ||||||
| Study | Results |
| Number of patients who developed a postoperative pulmonary complication: Intervention group (IG): 3 of 9 (33%) Control Group (CG): 5 of 8 (63%) P = 0.23 (between‐group) Number of days patients needed a chest tube: IG: 4.3 ± 2.1 days CG: 8.8 ± 5.3 days P = 0.03 (between‐group) Postoperative length of hospital stay: IG: 6.3 ± 3.0 days CG: 11.0 ± 6.3 days P = 0.058 (between‐group) | |
| Number of patients who developed a postoperative pulmonary complication: IG: 4 of 30 (13%) CG: 11 of 30 (37%) P = 0.037 (between‐group) Postoperative length of hospital stay: IG: 6.9 ± 4.4 days CG: 10.7 ± 6.4 days P = 0.01 (between‐group) Exercise capacity: Six‐Minute Walk Distance (6MWD), in metres: IG: 30 participants completed; CG: 30 participants completed; Preoperative measurements: baseline and post‐intervention: Mean ± standard deviation (SD): IG: 431.7 ± 102.8 m to 460.3 ± 93.6 m; CG: 434.5 ± 86.2 m to 443.9 ± 88.4 m P = 0.029 (between‐group) | |
| Number of patients who developed a postoperative pulmonary complication: IG: 2 of 12 (17%) CG: 7 of 9 (78%) P = 0.01 (between‐group) Number of days patients needed a chest tube: IG: 4.5 ± 2.9 days CG: 7.4 ± 2.6 days P = 0.03 (between‐group) Postoperative length of hospital stay: IG: 7.8 ± 4.8 days CG: 12.2 ± 3.6 days P = 0.04 (between‐group) Exercise capacity: Six‐Minute Walk Distance (6MWD), in metres: IG: 12 participants completed; CG: 12 participants completed; Preoperative measurements: baseline and post‐intervention: Mean ± standard deviation (SD): IG: 425.5 ± 85.3 m to 475 ± 86.5 m (P < 0.01); CG: 339.6 ± 107 m to 335 ± 107 m (P > 0.05) P < 0.001 (between‐group) Lung function: (i) Forced expired volume in one second (FEV1; % predicted): IG: 12 participants completed; CG: 12 participants completed; Preoperative measurements: baseline and post‐intervention: IG: 48.1 ± 13.9% to 54.8 ± 22.4% (P = 0.08); CG: 51.7 ± 9.8% to 58.8 ± 13.0% (P = 0.23) Between‐group difference was not calculated (ii) Forced vital capacity (FVC; % predicted): IG: 12 participants completed; CG: 12 participants completed; Preoperative measurements: baseline and post‐intervention: Median (interquartile range): IG: 62.5% (49 to 71) to 76% (65 to 79.7); P = 0.02; CG: 62.5% (56 to 92) to 71% (63.2 to 89); P = 0.37 Between‐group difference was not calculated | |
| Number of patients who developed a postoperative pulmonary complication: IG: 1 of 30 (3%) CG: 5 of 30 (17%) P = 0.04 (between‐group) Postoperative length of hospital stay: IG: 5.4 ± 2.7 days CG: 9.7 ± 3.1 days P < 0.001 (between‐group) Lung function: (i) FEV1; % predicted: IG: 30 participants completed; CG: 30 participants completed; Preoperative measurements: change from baseline to post‐intervention: IG: 15.84 ± 2.10%; CG: 9.92 ± 3.5% P = 0.3 (between‐group) (ii) FVC; % predicted: IG: 30 participants completed; CG: 30 participants completed; Preoperative measurements: baseline and post‐intervention: IG: 19.26 ± 2.33%; CG: 16.3 ± 2.4% P = 0.6 (between‐group) | |
| Exercise capacity: Peak rate of oxygen uptake (VO2peak), in ml/kg/min: IG: 20 participants completed; CG: 20 participants completed; Preoperative measurements: baseline and post‐intervention: IG: 14.9 ± 2.3 ml/kg/min to 17.8 ± 2.1 ml/kg/min; CG: 14.8 ± 1.4 ml/kg/min to 14.5 ± 1.2 ml/kg/min P < 0.001 (between‐group) Lung function: FEV1; % predicted: IG: 20 participants completed; CG: 20 participants completed; Preoperative measurements: baseline and post‐intervention: IG: 57.4 ± 19.1% to 59.8 ± 19.2%; CG: 57.6 ± 16.9% to 57.5 ± 17.0% P > 0.05 (between‐group) | |
| Intervention group (IG), Control Group (CG) | |
| Outcome or subgroup title | No. of studies | No. of participants | Statistical method | Effect size |
| 1 Risk of developing a postoperative pulmonary complication Show forest plot | 4 | 158 | Risk Ratio (M‐H, Fixed, 95% CI) | 0.33 [0.17, 0.61] |
| 2 Number of days patients needed an intercostal catheter Show forest plot | 2 | 38 | Mean Difference (IV, Fixed, 95% CI) | ‐3.33 [‐5.35, ‐1.30] |
| 3 Postoperative length of hospital stay Show forest plot | 4 | 158 | Mean Difference (IV, Fixed, 95% CI) | ‐4.24 [‐5.43, ‐3.06] |
| 4 Preoperative exercise capacity (6‐minute walk distance) Show forest plot | 2 | 81 | Mean Difference (IV, Fixed, 95% CI) | 18.23 [8.50, 27.96] |
| 5 Forced vital capacity (% pred) Show forest plot | 2 | 84 | Mean Difference (IV, Fixed, 95% CI) | 2.97 [1.78, 4.16] |