| Intervention(s) and comparator(s) | Sample sizea | Screened/eligible
[N] | Randomised
[N] | ITT
[N] | Analysed
[N] | Finishing trial
[N] | Randomised finishing trial
[%] | Follow‐up
(extended follow‐up)a |
| (20) Resnicow 2015 | I1: parent‐only PCP motivational interviewing | The study was powered to detect a 3‐point difference in BMI percentile between any pair of study groups at 2‐year follow‐up, with an assumed SD for BMI percentile between 4 and 6: power of 0.80 and 2‐tailed a of 0.05. Sample size was inflated to account for practice‐level clustering, assuming an intraclass correlation between 0.01 and 0.05. On this basis and a projected 25‐30% attrition at 2‐year follow‐up, 10‐12 practices per arm (30‐36 total) and a mean of 15‐20 children per practice at baseline were required | ‐ | 16 practices 212 participants | 145 | 145 | 145 | 68 | 2 years (2 years) |
| I2: parent‐only PCP + dietician motivational interviewing | 15 practices 235 participants | 154 | 154 | 154 | 66 |
| C: usual care | 11 practices 198 participants | 158 | 158 | 158 | 80 |
| total: | 645 | 457 | 457 | 457 | 71 | |
| (19) Mazzeo 2014 | I: parent NOURISH | ‐ | 235 | 48 | ‐ | 46 | 10 | 21 | 12 weeks post 12‐week intervention (24 weeks) |
| C: parent control | 45 | ‐ | 45 | 16 | 36 |
| total: | 93 | | 91 | 26 | 28 |
| (18) Van Grieken 2013 | I: parent‐only | Sample size was calculated taking into account the intracluster correlation coefficient (ρ = 0.1), the number of clusters (44), the expected prevalence of overweight children in the study population, the SD, expected effect (a difference in mean), and the power of the study (80%). With a participation of 50%, an expected prevalence of overweight children of 9% and a loss‐to‐follow‐up of 30%, at least 11,301 children (and their parents) should be invited by the YHC teams to participate in the study to have a final sample of about 356 overweight children (178 in both the intervention and control group). Assuming a SD of BMI to be 1.0 kg/m2, a difference in mean BMI of 0.35 kg/m2 between the children in the intervention group and the children in the control group can be established under the assumptions mentioned above | 22 clusters 7004 participants | 349 | ‐ | 21 clusters 277 participants | 277 | 79 | 2 years post up to 12‐month intervention |
| C: usual care | 22 clusters 7004 participants | 288 | ‐ | 21 clusters 230 participants | 230 | 80 |
| total | 637 | ‐ | 42 (507) | 507 | 80 |
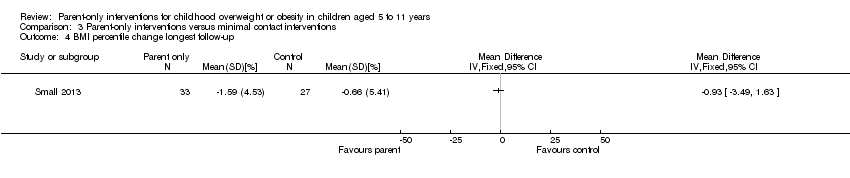
| (17) Small 2013 | I: parent‐only | ‐ | ‐ | 34 | 33 | 33 | 33 | 97 | 24 weeks post 16‐week intervention (41 weeks) |
| C: parent control | 33 | 27 | 27 | 27 | 82 |
| total: | 67 | 60 | 60 | 60 | 90 |
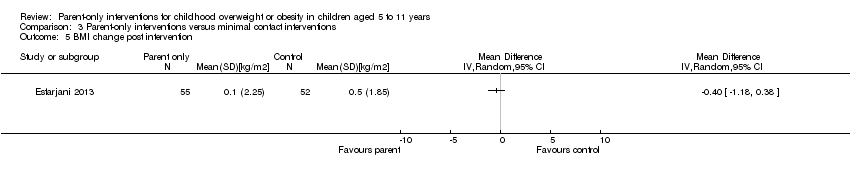
| (16) Esfarjani 2013 | I: parent‐only | ‐ | 550/156 | 70 | ‐ | 55 | 58 | 83 | Intervention 6 months (not reported) |
| C: parent control | 86 | ‐ | 52 | 59 | 69 |
| total: | 156 | ‐ | 107 | 117 | 75 |
| (15) Moens 2012 | I: parent‐only | ‐ | 80/75 | 31 | ‐ | ‐ | 31 | 100 | Immediately following 6‐month intervention |
| C: waiting list control | 19 | ‐ | ‐ | 15 | 79 |
| total: | 50 | ‐ | ‐ | 46 | 92 |
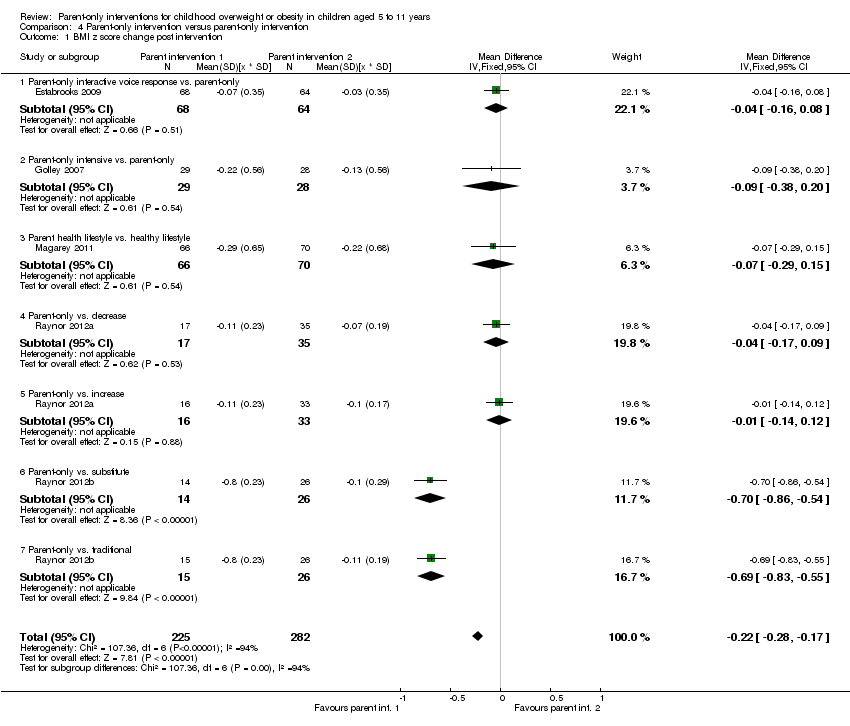
| (14) Raynor 2012a | I1: parent‐only | Sample size calculations presumed 2‐sided hypothesis testing at 6‐month assessment, with type 1 error rate = 0.05. To reject with 80% power the null hypothesis of no pre‐ to post‐treatment difference between intervention conditions vs. the alternative that the pre‐ to post‐treatment difference was 0.6 or greater (effect size), 24 participants per group were needed | 549 | 33 | 33 | 33 | 29 | 88 | 24 weeks post 24‐week intervention (reported as '12 months') |
| I2: parent ‐ diet decrease | 33 | 33 | 33 | 29 | 88 |
| I3: parent ‐ diet increase | 35 | 35 | 35 | 32 | 91 |
| total: | 101 | 101 | 101 | 90 | 89 |
| (13) Raynor 2012b | I1: parent‐only | Sample size calculations presumed 2‐sided hypothesis testing at 6‐month assessment, with type 1 error rate = 0.05. To reject with 80% power the null hypothesis of no pre‐ to post‐treatment difference between intervention conditions vs. the alternative that the pre‐ to post‐treatment difference is 0.6 or greater (effect size), 24 participants per group were needed | 549 | 29 | 29 | 29 | 26 | 90 | 24 weeks post 24‐week intervention (reported as '12 months') |
| I2: parent ‐ diet and activity traditional | 26 | 26 | 26 | 24 | 92 |
| I3: parent ‐ diet and activity substitute | 26 | 26 | 26 | 24 | 92 |
| total: | 81 | 81 | 81 | 74 | 91 |
| (12) Margarey 2011 | I: parent healthy lifestyle | Sample size calculation was based on a reduction in BMI z score of 0.26 (SD 0.49) over 12 months (power 80%, alpha = 0.05, and drop‐out rate of 30%). This represents a 50% reduction in weight velocity over 12 months and no change in height velocity. We sought 42 children per group per site (168 children) | 398 | 85 | 85 | 85 | 52 | 61 | 80 weeks post 24‐week intervention (104 weeks) |
| C: healthy lifestyle | 84 | 84 | 84 | 54 | 64 |
| total: | 169 | 169 | 169 | 106 | 63 |
| (11) Jansen 2011 | I: parent CBT | ‐ | 161 | 59 | ‐ | 54 | 54 | 92 | 12 weeks post 12‐week intervention (24 weeks) |
| C: waiting list control | 39 | ‐ | 34 | 34 | 87 |
| total: | 98 | | 88 | 88 | 90 |
| (10) Collins 2011 | I: parent‐only ‐ diet | Power: 80% chance of detecting significance (2‐sided 5% level), with a 0.26 BMI z score difference from baseline to 12 months as the initial end point, with an anticipated loss to follow‐up of 20% | 505/319 | 63 | ‐ | 42 | 22 | 35 | 80 weeks post 24‐week intervention (104 weeks) |
| C1: parent‐child (physical activity) | 73 | ‐ | 63 | 35 | 48 |
| C2: parent‐child (physical activity + diet) | 70 | ‐ | 60 | 36 | 51 |
| total: | 206 | ‐ | 165 | 93 | 45 |
| (9) Boutelle 2011 | I: parent‐only | Sample size was determined by pragmatic factors, including budget and investigator time commitments. No interim analyses were done. The hypotheses tested related to non‐inferiority of the parent treatment to the parent‐child treatment on child and parent weight loss and child daily caloric intake and physical activity. The bound for non‐inferiority hypotheses related to BMI percentile was set to 1. This is the maximum value the parent‐child group could do better than parent‐only, below which non‐inferiority would be concluded. This bound could correspond to an mean‐aged child in this sample having a BMI of 26 in the parent‐child group and 28.5 in the parent‐only group at post‐treatment/follow‐up, assuming equivalence at baseline. For a non‐inferiority bound for child BMI, which was selected post hoc, we considered choosing a BMI that would correspond to the BMI percentile non‐inferiority bound (BMI = 2.5), but instead chose a more rigorous value of BMI = 1 | 157 | 40 | ‐ | 24 | 24 | 60 | 24 weeks post 20‐week intervention (week 44) |
| C: parent‐child | 40 | ‐ | 28 | 28 | 70 |
| total: | 80 | | 52 | 52 | 65 |
| (8) West 2010 | I: parent‐only | ‐ | 205 | 52 | 52 | 52 | 34 | 65 | 40 weeks post 12‐week intervention (52 weeks) |
| C: waiting list control | 49 | 49 | 49 | 46 | 94 |
| total: | 101 | 101 | 101 | 80 | 79 |
| (7) Resnick 2009 | I: educational material + personal encounters | ‐ | 84/46 | 22 | ‐ | 18 | 18 | 82 | Unclear (41 weeks between start and last mail out) |
| C: educational material | 24 | ‐ | 24 | 24 | 100 |
| total: | 46 | | 42 | 42 | 91 |
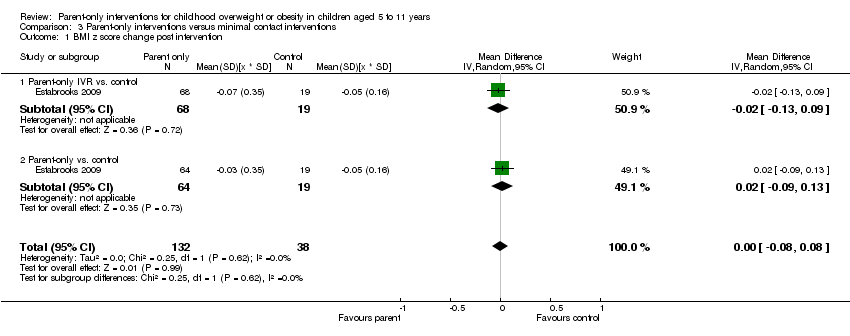
| (6) Estabrooks 2009 | I1: parent group + IVR | Sample size calculations were completed, varying the detectable effect sizes from small to medium with a power of 0.8. The result was a need for 42 participants per intervention to detect a medium effect and 64 participants to detect a small effect | 1487/656 | 85 | ‐ | 63 | 63 | 74 | 28‐40 weeks post 12‐ to 24‐week intervention (52 weeks) |
| I2: parent group | 85 | ‐ | 56 | 56 | 66 |
| C: parent workbook | 50 | ‐ | 36 | 36 | 72 |
| total: | 220 | | 155 | 155 | 70 |
| (5) Munsch 2008 | I: mother‐only CBT | Trial authors did not reach the necessary sample size of 68 families with obese children within the given time span (the target sample size of 68 was based on a repeated‐measures analysis with alpha = 0.05, 1 ‐ beta = 0.8, and a medium effect size for the linear term of the interaction between treatment and time, assuming a drop‐out rate of 20% | 181/60 | 25 | ‐ | 7 | 7 | 28 | 24 weeks post 10‐week intervention (34 weeks) |
| C: mother‐child CBT | 31 | ‐ | 20 | 20 | 65 |
| total: | 56 | | 27 | 27 | 48 |
| (4) Janicke 2008 | I: parent‐only | Post hoc power analyses were used to determine the detectable change in BMI z score from 0 to 10 months for the family based and parent‐only interventions relative to the waiting list control condition. Effect sizes (standardised BMI index) detectable with 80% power and 2‐sided level 0.05 tests were used. Standard deviations and sample sizes were set equal to their observed values. For comparing the family‐based and waiting list control conditions, trial authors reported 80% power to detect a shift from 0.022 to ‐0.145. For comparing the parent‐only and waiting list control conditions, trial authors reported 80% power to detect a shift from 0.022 to ‐0.135 | 111 | 34 | ‐ | 26 | 26 | 76 | 14 weeks post 16‐week intervention (40 weeks) |
| C1: parent‐child | 33 | ‐ | 24 | 24 | 73 |
| C2: waiting list control | 26 | ‐ | 21 | 21 | 81 |
| total: | 93 | | 71 | 71 | 76 |
| (3) Golley 2007 | I: parent intervention + lifestyle education | Sample size calculation was based on a fall in BMI z score reflecting a weight gain of only 50% of that expected over 12 months with normal growth. A sample size of 28 per group was estimated to have 80% power to detect a 12‐month fall in mean BMI z score from a baseline of 0.26 (SD 0.49), assuming no change in the control group, at a 2‐sided significance level of 0.05. To account for a drop‐out rate of up to one‐third (commonly 20‐50% in child weight‐management studies), 42 children per study group were sought (126 children) | 262/115 | 38 | ‐ | 31 | 31 | 82 | 24 weeks post 24‐week intervention (48 weeks) |
| C1: parent intervention | 37 | ‐ | 29 | 29 | 78 |
| C2: waiting list control | 36 | ‐ | 31 | 31 | 86 |
| total: | 111 | | 101 | 101 | ‐ |
| (2) Golan 2006 | I: parent‐only | The study was designed to detect differences of 10% weight loss with a power of 90% and a significance level of 0.05, given a drop‐out rate of 10% with a sample of 12 in each group | 102 | 14 | ‐ | 10 | 10 | 71 | 1 year post 26‐week intervention (18 months) |
| C: parent‐child | 18 | ‐ | 17 | 17 | 94 |
| total: | 32 | | 27 | 27 | 84 |
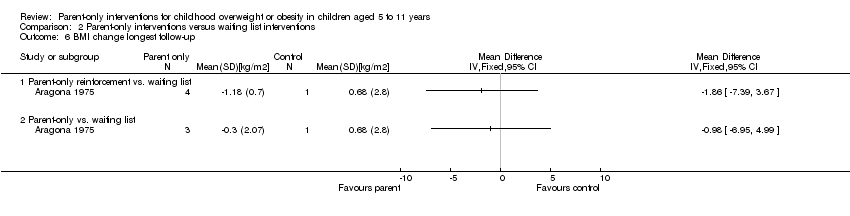
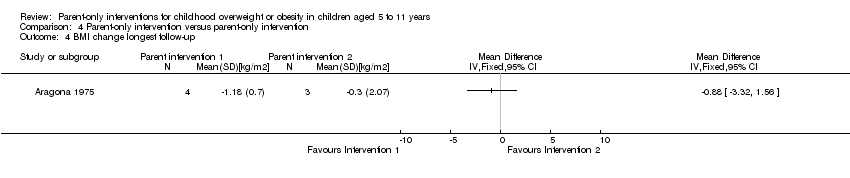
| (1) Aragona 1975 | I1: parent‐only with reinforcement | ‐ | ‐ | 5 | ‐ | 4 | 4 | 80 | 12 weeks (51 weeks' follow‐up) |
| I2: parent‐only | 5 | ‐ | 3 | 3 | 60 |
| C: waiting list control | 5 | ‐ | 5 | 2 | 40 |
| total: | 15 | | 12 | 9 | 60 |
| Grand total | All interventions | ‐ | 1773c | | 1276 | |
| All comparators | 1284c | 942 |
| All interventions and comparators | 3057c | 2218 |


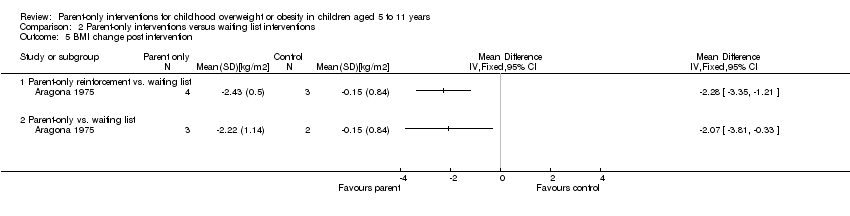


![Comparison 4 Parent‐only intervention versus parent‐only intervention, Outcome 5 BMI percentile change post intervention [%].](/es/cdsr/doi/10.1002/14651858.CD012008/media/CDSR/CD012008/image_n/nCD012008-CMP-004-05.png)