Intervenciones sólo en padres para el sobrepeso y la obesidad en niños de 5 a 11 años de edad
Resumen
Antecedentes
El sobrepeso y la obesidad en niños y adolescentes han aumentado a nivel global y se asocian con consecuencias significativas para la salud a corto y a largo plazo.
Objetivos
Evaluar la efectividad de las intervenciones en la dieta, la actividad física y conductuales administradas solamente a los padres para el tratamiento del sobrepeso y la obesidad en niños de cinco a 11 años de edad.
Métodos de búsqueda
Se hizo una búsqueda sistemática de literatura en las bases de datos the Cochrane Library, MEDLINE, EMBASE, PsycINFO, CINAHL y LILACS, así como en registros de ensayos. Se verificaron las referencias de los ensayos y revisiones sistemáticas identificados. No se aplicaron restricciones de idioma. La fecha de la última búsqueda para todas las bases de datos fue marzo 2015.
Criterios de selección
Se seleccionaron los ensayos controlados aleatorios (ECA) de dieta, actividad física e intervenciones conductuales administradas solamente a los padres para tratar el sobrepeso o la obesidad en niños de cinco a 11 años de edad.
Obtención y análisis de los datos
Dos revisores de forma independiente evaluaron el riesgo de sesgo de los ensayos y la calidad general de los estudios mediante el instrumento GRADE. Cuando fue necesario, se estableció contacto con los autores de los estudios para obtener información adicional.
Resultados principales
Se incluyeron 20 ECA con 3057 participantes. El número de participantes varió por ensayo entre 15 y 645. El seguimiento osciló entre 24 semanas y dos años. Dieciocho ensayos fueron ECA paralelos y dos fueron ECA grupales. Doce ECA tenían dos comparaciones y ocho ECA, tres comparaciones. Las intervenciones variaron ampliamente. la duración, el contenido, la administración y el seguimiento de las intervenciones fueron heterogéneos. También difirieron los comparadores. Esta revisión clasificó las comparaciones en cuatro grupos: sólo en padres versus en padres e hijos, sólo en padres versus controles en lista de espera, sólo en padres versus intervenciones de contacto mínimo y sólo en padres versus otras intervenciones sólo en padres.
La calidad de los ensayos generalmente fue baja; una gran parte de los ensayos se calificaron como con alto riesgo de sesgo por el riesgo individual de los criterios de sesgo.
En los ensayos que compararon una intervención sólo en padres con una intervención en padres e hijos, el cambio en la puntuación z del índice de masa corporal (IMC) mostró una diferencia de medias (DM) para el período de seguimiento más largo (diez a 24 meses) de ‐0,04 (intervalo de confianza [IC] del 95%: ‐0,15 a 0,08); P = 0,56; 267 participantes; tres ensayos; pruebas de baja calidad. En los ensayos que compararon una intervención sólo en padres con un control en lista de espera, el cambio en la puntuación z del IMC a favor de la intervención sólo en padres para el período de seguimiento más largo (diez a 12 meses) tuvo una DM de ‐0,10 (IC del 95%: ‐0,19 a ‐0,01); P = 0,04; 136 participantes; dos ensayos; pruebas de baja calidad. El cambio en la puntuación z del IMC de las intervenciones sólo en padres comparadas con las intervenciones control de contactos mínimo para el período de seguimiento más largo (nueve a 12 meses) mostró una DM de 0,01 (IC del 95%: ‐0,07 a 0,09); P = 0,81; 165 participantes; un ensayo; pruebas de baja calidad. Hubo pocas semejanzas entre las intervenciones y los comparadores en los ensayos incluidos en la intervención sólo en padres versus otras intervenciones sólo en padres, por lo que estos datos no se agruparon. En general, estos ensayos no mostraron diferencias significativas entre los grupos respectivos de intervenciones sólo en padres en los resultados del IMC.
Otros resultados como las medidas conductuales, las relaciones entre padres e hijos y la calidad de vida relacionada con la salud se informaron de manera inconsistente. En general los efectos adversos de las intervenciones no se informaron, y dos ensayos señalaron que no hubo efectos adversos graves. Ningún ensayo informó la mortalidad por todas las causas, la morbilidad o los efectos socioeconómicos.
Todos los resultados se deben interpretar con cuidado debido a la baja calidad, las intervenciones y los comparadores heterogéneos, y a las tasas altas de no finalización.
Conclusiones de los autores
Las intervenciones sólo en padres pueden ser una opción efectiva de tratamiento para los niños con sobrepeso u obesidad de cinco a 11 años de edad comparadas con los controles en lista de espera. Las intervenciones sólo en padres tuvieron efectos similares en comparación con las intervenciones en padres e hijos y con las intervenciones control con contacto mínimo. Sin embargo, las pruebas son limitadas en la actualidad; algunos ensayos tuvieron alto riesgo de sesgo, las pérdidas durante el seguimiento fueron un tema particular y hubo falta de pruebas en varios resultados importantes. La revisión sistemática ha identificado diez ensayos en curso que tienen un brazo de sólo en padres, que contribuirán a las actualizaciones futuras. Estos ensayos mejorarán la solidez de los análisis por tipo de comparador y pueden permitir análisis de subgrupos por el componente de intervención y el contexto. Los informes de los ensayos deben aportar suficientes detalles acerca de las intervenciones para que otros puedan repetirlos. Es necesario realizar e informar análisis de la relación entre costo y efectividad en los ensayos futuros para establecer si las intervenciones sólo en padres son más costo‐efectivas que las intervenciones en padres e hijos.
PICOs
Resumen en términos sencillos
Intervenciones sólo en padres para el sobrepeso y la obesidad en niños de 5 a 11 años de edad
Pregunta de la revisión
¿Cuán efectivas son la dieta, la actividad física y las intervenciones conductuales administradas solamente a los padres para reducir el peso en niños con sobrepeso y obesidad?
Antecedentes
A nivel mundial es cada vez mayor el número de niños con sobrepeso y obesidad. Estos niños tienen mayores probabilidades de presentar problemas de salud cuando niños y en etapas posteriores de la vida. Los padres pueden desempeñar una función importante al determinar lo que sus niños comen. Se necesita más información acerca de si ayudar a los padres a hacer cambios en la dieta y el estilo de vida de la familia tratará este problema.
Características de los estudios
Se encontraron 20 ensayos controlados aleatorios (estudios clínicos en los que los pacientes se ubican al azar en uno de dos o más grupos de tratamiento) que compararon la dieta, la actividad física y las terapias (intervenciones) conductuales (en las que se cambian o mejoran los hábitos) con diversos grupos control (que no recibieron tratamiento) administradas solamente a los padres de 3057 niños de cinco a 11 años de edad. Hubo pocas semejanzas entre los ensayos en cuanto a la naturaleza y los tipos de intervenciones utilizadas. Los ensayos se agruparon según el tipo de comparación. La presente revisión sistemática informó los efectos de las intervenciones sólo en padres en comparación con las intervenciones en padres y niños, controles en lista de espera (en los que la intervención se retardó hasta el final del ensayo), otras intervenciones con solamente información o contacto mínimo y otros tipos de intervenciones sólo en padres. Los niños de los ensayos incluidos se monitorizaron (denominado seguimiento) durante entre seis meses y dos años. Estas pruebas están actualizadas hasta marzo 2015.
Resultados clave
El resultado más informado fue el índice de masa corporal (IMC). Es una medida de la grasa corporal y se calcula al dividir el peso (en kilogramos) por el cuadrado de la talla corporal medida en metros (kg/m2). Los estudios midieron el IMC de manera que tuvieron en cuenta el género, el peso y la talla cuando los niños tuvieran más edad (como puntuación z del IMC y el percentilo de IMC).
En comparación con un control en lista de espera, hubo pruebas limitadas de que las intervenciones en los padres ayudaron a reducir el IMC. Al examinar los períodos de seguimiento más largos de los ensayos incluidos no se encontraron pruebas firmes de ventajas o desventajas de las intervenciones sólo en padres comparadas con las intervenciones en padres y niños, o comparadas con la información limitada. La presente revisión encontró información muy escasa acerca de cómo se compararon los diferentes tipos de intervenciones en los padres. Ningún ensayo informó la muerte por cualquier causa, la enfermedad o los efectos socioeconómicos (por ejemplo, si las intervenciones sólo en padres tienen costos menores en comparación con las intervenciones en padres y niños). Dos ensayos no informaron efectos secundarios graves y el resto de los ensayos no informó si ocurrieron o no efectos secundarios. Pocas veces se proporcionó información sobre las relaciones entre padres e hijos y la calidad de vida relacionada con la salud.
Calidad de la evidencia
La calidad general de las pruebas fue baja, principalmente porque solamente hubo pocos ensayos por medición o el número de niños incluidos fue pequeño. Además, muchos niños abandonaron los ensayos antes de que hubieran terminado.
Conclusiones de los autores
Summary of findings
| Parent‐only interventions vs. parent‐child interventions for childhood overweight or obesity | ||||||
| Population: children with overweight or obesity Settings: outpatients; community/university Intervention: parent‐only interventions Comparison: parent‐child interventions | ||||||
| Outcomes | Parent‐child | Parent‐only | Relative effect | No of participants | Quality of the evidence | Comments |
| BMI z score change (x * SD) Follow‐up: 40‐104 weeks | The mean BMI z score change ranged across control groups from ‐0.16 to ‐0.24 | The mean BMI z score change in the intervention groups was 0.04 lower (0.15 lower to 0.08 higher) | ‐ | 267 (3) | ⊕⊕⊝⊝ | Lower scores indicate improved weight loss |
| Adverse events | See comment | See comment | See comment | See comment | See comment | No trials reported adverse events |
| Health‐related quality of life | See comment | See comment | See comment | See comment | See comment | No trials reported health‐related quality of life |
| All‐cause mortality | See comment | See comment | See comment | See comment | See comment | No trials reported all‐cause mortality |
| Morbidity | See comment | See comment | See comment | See comment | See comment | No trials reported morbidity |
| Parent‐child relationship or assessment of parenting | See comment | See comment | See comment | See comment | See comment | No trials reported outcomes assessing parent‐child relationships or an assessment of parenting |
| Socioeconomic effects | See comment | See comment | See comment | See comment | See comment | No trials reported socioeconomic effects |
| *The basis for the assumed risk (e.g. the median control group risk across trials) is provided in footnotes. The corresponding risk (and its 95% confidence interval) is based on the assumed risk in the comparison group and the relative effect of the intervention (and its 95% CI). GRADE Working Group grades of evidence | ||||||
| "A BMI z score or standard deviation score indicates how many units (of the standard deviation) a child's BMI is above or below the average BMI value for their age group and sex. For instance, a z score of 1.5 indicates that a child' is 1.5 standard deviations above the average value, and a z score of ‐1.5 indicates a child is 1.5 standard deviations below the average value" (Noo NHS 2011). aDowngraded by one level because of serious risk of attrition bias and one level for serious imprecision (see Appendix 9). | ||||||
| Parent‐only interventions vs. waiting list control for childhood overweight or obesity | ||||||
| Population: children with overweight or obesity Settings: outpatients; community Intervention: parent‐only interventions Comparison: waiting list control | ||||||
| Outcomes | Waiting list | Parent‐only | Relative effect | No of participants | Quality of the evidence | Comments |
| BMI z score change (x * SD) Follow‐up: 40‐48 weeks | The mean BMI z score change ranged across control groups from ‐0.13 to 0.02 | The mean BMI z score change in the intervention groups was 0.1 lower (0.19 lower to 0.01 lower) | ‐ | 136 (2) | ⊕⊕⊝⊝ | Lower scores indicate improved weight loss |
| Adverse events | See comment | See comment | See comment | See comment | See comment | No trials reported adverse events |
| Health‐related quality of life | See comment | See comment | See comment | See comment | See comment | No trials reported health‐related quality of life |
| All‐cause mortality | See comment | See comment | See comment | See comment | See comment | No trials reported all‐cause mortality |
| Morbidity | See comment | See comment | See comment | See comment | See comment | No trials reported morbidity |
| Parent‐child relationship or assessment of parenting (parenting scale (PS), 30 items, scored from 1 to 7; lower scores indicate more effective parental discipline practices) Follow‐up: 12 weeks | The mean PS score for the control group was 3.4 | The mean PS score in the intervention group was 0.6 points lower | ‐ | 101 (1) | ⊕⊕⊝⊝ | ‐ |
| Socioeconomic effects | See comment | See comment | See comment | See comment | See comment | No trials reported socioeconomic effects |
| *The basis for the assumed risk (e.g. the median control group risk across trials) is provided in footnotes. The corresponding risk (and its 95% confidence interval) is based on the assumed risk in the comparison group and the relative effect of the intervention (and its 95% CI). GRADE Working Group grades of evidence | ||||||
| "A BMI z score or standard deviation score indicates how many units (of the standard deviation) a child's BMI is above or below the average BMI value for their age group and sex. For instance, a z score of 1.5 indicates that a child' is 1.5 standard deviations above the average value, and a z score of ‐1.5 indicates a child is 1.5 standard deviations below the average value" (Noo NHS 2011). aDowngraded by one level because of serious risk of attrition bias and one level for serious imprecision (see Appendix 9). | ||||||
| Parent‐only interventions vs. minimal contact control for childhood overweight or obesity | ||||||
| Population: children with overweight or obesity Settings: outpatients Intervention: parent‐only interventions Comparison: minimal contact control | ||||||
| Outcomes | Minimal contact | Parent‐only | Relative effect | No of participants | Quality of the evidence | Comments |
| BMI z score change (x * SD) Follow‐up: 52 weeks | The mean BMI z score change ranged across control groups from ‐0.06 to ‐0.06 | The mean BMI z score change in the intervention group was 0.01 lower (‐0.07 lower to 0.09 higher) | ‐ | 165 (1) | ⊕⊕⊝⊝ | Lower scores indicate improved weight loss |
| Adverse events | See comment | See comment | See comment | See comment | See comment | No trials reported adverse events |
| Health‐related quality of life (Pediatric Health‐Related Quality of Life, scale from 0 to 100; higher scores indicate better HRQoL) Follow‐up: 24 weeks) | See comment | See comment | See comment | 93 (1) | See comment | No data were presented ('"no improvements in health‐related quality of life") |
| All‐cause mortality | See comment | See comment | See comment | See comment | See comment | No trials reported all‐cause mortality |
| Morbidity | See comment | See comment | See comment | See comment | See comment | No trials reported morbidity |
| Parent‐child relationship or assessment of parenting (Child Feeding Questionnaire subscale parental concern (total of 7 subscales), score range 3‐15; higher scores indicate greater parental concern) Follow‐up: 12 weeks | The mean parent concern score was 4.7 in the control group | The mean parent concern score in the intervention group was 0.1 lower. | ‐ | 93 (1) | ⊕⊕⊝⊝ | ‐ |
| Socioeconomic effects | See comment | See comment | See comment | See comment | See comment | No trials reported socioeconomic effects |
| *The basis for the assumed risk (e.g. the median control group risk across trials) is provided in footnotes. The corresponding risk (and its 95% confidence interval) is based on the assumed risk in the comparison group and the relative effect of the intervention (and its 95% CI). GRADE Working Group grades of evidence | ||||||
| "A BMI z score or standard deviation score indicates how many units (of the standard deviation) a child's BMI is above or below the average BMI value for their age group and sex. For instance, a z score of 1.5 indicates that a child' is 1.5 standard deviations above the average value, and a z score of ‐1.5 indicates a child is 1.5 standard deviations below the average value" (Noo NHS 2011). aDowngraded by one level because of serious risk of attrition bias and one level for serious imprecision (see Appendix 9). | ||||||
| Parent‐only interventions vs. parent‐only interventions for childhood overweight or obesity | ||||||
| Population: children with overweight or obesity Settings: outpatients; university + primary care Intervention: parent‐only interventions Comparison: parent‐only interventions | ||||||
| Outcomes | Parent‐only | Parent‐only | Relative effect | No of participants | Quality of the evidence | Comments |
| BMI z score change (x * SD) Follow‐up: 12‐24 months | See comment | See comment | See comment | 467 (5) | ⊕⊕⊝⊝ | No meta‐analysis because of little consistency between trial interventions and comparators; there were no substantial differences between different parent‐only interventions |
| Adverse events | See comment | See comment | See comment | See comment | See comment | Two trials reported that there were no serious adverse events (Raynor 2012a; Raynor 2012b) |
| Health‐related quality of life | See comment | See comment | See comment | See comment | See comment | No trials reported health‐related quality of life |
| All‐cause mortality | See comment | See comment | See comment | See comment | See comment | No trials reported all‐cause mortality |
| Morbidity | See comment | See comment | See comment | See comment | See comment | No trials reported morbidity |
| Parent‐child relationship or assessment of parenting (Alabama Parenting Questionnaire, 35 items; higher scores indicate improvement) Follow‐up: 24 months | See comment | See comment | See comment | 106 (1) | See comment | 1 study assessed parent‐child relationship or assessment of parenting but there were no data for comparisons between intervention groups provided |
| Socioeconomic effects | See comment | See comment | See comment | See comment | See comment | No trials reported socioeconomic effects |
| *The basis for the assumed risk (e.g. the median control group risk across trials) is provided in footnotes. The corresponding risk (and its 95% confidence interval) is based on the assumed risk in the comparison group and the relative effect of the intervention (and its 95% CI). GRADE Working Group grades of evidence | ||||||
| "A BMI z score or standard deviation score indicates how many units (of the standard deviation) a child's BMI is above or below the average BMI value for their age group and sex. For instance, a z score of 1.5 indicates that a child' is 1.5 standard deviations above the average value, and a z score of ‐1.5 indicates a child is 1.5 standard deviations below the average value" (Noo NHS 2011). aDowngraded by one level because of serious risk of attrition bias and one level for serious imprecision (see Appendix 9) | ||||||
Antecedentes
La prevalencia de niños y adolescentes con sobrepeso y obesidad ha aumentado en todo el mundo, y representa una crisis global de salud pública (Ng 2014; WHO 2015a). Aunque alguna vez se consideró un trastorno que afecta solamente a los países desarrollados, las tasas pediátricas de sobrepeso y obesidad han comenzado a elevarse de manera considerable en algunos países en desarrollo (Wang 2012). Al utilizar la definición estándar de la International Obesity Task Force (IOTF), la prevalencia estandarizada por edad del sobrepeso y la obesidad en niños y adolescentes ha aumentado en los países desarrollados y en desarrollo desde mediados de la década de 1980 (Cole 2000). En 2013 se calculó que la prevalencia de niños y adolescentes con sobrepeso y obesidad en los países desarrollados fue del 23,8% (intervalo de confianza [IC] del 95%: 22,9 a 24,7) para los niños y del 22,6% (IC del 95%: 21,7 a 23,6) para las niñas. En los países en desarrollo se ha calculado que la prevalencia era del 12,9% (IC del 95%: 12,3 a 13,5) en los niños y del 13,4% (IC del 95%: 13,0 a 13,9) en las niñas (Ng 2014). Los niños muy pequeños también están afectados. En 2010, de Onis 2010 utilizó las normas de crecimiento de la Organización Mundial de la Salud (OMS) (WHO 2015b) para calcular que más de 42 000 000 de niños menores de cinco años de edad tenían sobrepeso u obesidad, y que aproximadamente 35 000 000 de estos niños vivían en países en desarrollo.
También se han documentado desigualdades en la prevalencia del sobrepeso y la obesidad. En general, los niños desfavorecidos desde el punto de vista socioeconómico de los países desarrollados (Knai 2012; Shrewsbury 2008), y los niños con un nivel socioeconómico más alto de países en desarrollo (Lobstein 2004; Wang 2012), presentan un mayor riesgo de sobrepeso. Sin embargo, esta relación puede variar según las características demográficas de la población (p.ej. edad, sexo, grupo étnico), y el ambiente (p.ej. campo, urbanización) (Wang 2012). La prevalencia de obesidad varía según el grupo étnico, y existen grandes grupos de datos que muestran una variación étnica significativa en las poblaciones de niños ingleses (HSCIC 2015), estadounidenses (Freedman 2006; Skinner 2014) y neozelandeses (Rajput 2014).
Aunque hay algunas pruebas de que la tasa de aumento de la obesidad pediátrica puede haber disminuido en algunos países desarrollados, los niveles actuales aún son demasiado altos y se han elevado progresivamente en muchos países en desarrollo (Olds 2011; Rokholm 2010). Sin embargo, una inquietud adicional en algunos países desarrollados como los EE.UU. (Kelly 2013; Skinner 2014) e Inglaterra (CMO 2012; Ells 2015), es el incremento de la obesidad pediátrica grave. Aunque la IOTF publicó una definición internacional para la obesidad pediátrica grave (mórbida) en 2012 (Cole 2012), a menudo la prevalencia de obesidad grave se informa mediante puntos de corte específicos para el país, lo que dificulta las comparaciones internacionales. Sin embargo, datos de los EE.UU. (Skinner 2014) e Inglaterra (Ells 2015) han indicado que la prevalencia de la obesidad pediátrica grave varía según el nivel socioeconómico y el grupo étnico y puede dar lugar a un aumento del riesgo de eventos adversos cardiometabólicos y de obesidad grave en la adultez (Kelly 2013).
Descripción de la afección
El sobrepeso y la obesidad en la niñez son resultado de una acumulación de grasa excesiva en el cuerpo, y puede aumentar el riesgo de consecuencias para la salud a corto y a más largo plazo. Se pueden desarrollar numerosas comorbilidades relacionadas con la obesidad durante la niñez, que incluyen afecciones musculoesqueléticas (Paulis 2014); factores de riesgo cardiovasculares como la hipertensión, la resistencia a la insulina y la hiperlipidemia (Reilly 2003), incluso en niños muy pequeños (Bocca 2013); y afecciones como apnea del sueño (Narang 2012), asma (Egan 2013), enfermedad hepática y diabetes tipo 2 (Daniels 2009; Lobstein 2004). El trastorno también puede afectar el bienestar psicosocial; los jóvenes con obesidad pueden ser susceptibles a la reducción de la autoestima y la calidad de vida (Griffiths 2010), así como a la estigmatización (Puhl 2007; Tang‐Peronard 2008). Las pruebas también muestran que la obesidad en la niñez puede continuar hasta la edad adulta (Parsons 1999; Singh 2008; Whitaker 1997), y por lo tanto se asocia con un mayor riesgo de salud deficiente en etapas posteriores de la vida (Reilly 2011).
Descripción de la intervención
Debido a las graves implicaciones asociadas con la obesidad en la niñez y la adolescencia, es imperativo lograr un tratamiento efectivo. Aunque los principios fundamentales del control del peso en los niños y adolescentes son los mismos que en los adultos (es decir, reducción del aporte calórico y mayor gasto de energía), el objetivo primario del tratamiento (es decir, la reducción del peso o la desaceleración del aumento de peso) y el enfoque más apropiado para la intervención varían y dependen de la edad y el grado de exceso de peso del niño, entre otras consideraciones.
Las intervenciones basadas en la familia que combinan componentes dietéticos, de la actividad física y conductuales son efectivas y se consideran actualmente la mejor práctica para el tratamiento de la obesidad de la niñez en los niños menores de 12 años de edad (Oude Luttikhuis 2009). Sin embargo, las intervenciones que incluyen a toda la familia pueden ser costosas, especialmente cuando los padres y los niños están en grupos separados y no se implementan en toda su capacidad (Upton 2012). Por lo tanto, se le ha prestado más atención a la posibilidad de intervenciones centradas en los padres.
Los padres se han definido como "agentes del cambio" para la intervención con niños menores de 12 años de edad y obesidad (Golan 2004). Se han desarrollado varias intervenciones dirigidas exclusivamente a los padres para el tratamiento de la obesidad del niño, denominadas por lo tanto intervenciones "sólo en padres", en las que el niño no se incluye directamente en la intervención. Las intervenciones sólo en padres varían según el tipo (p.ej. basadas en cursos de crianza, terapia cognitivo‐conductual, cambio conductual) y según el contexto (p.ej. en la comunidad, en el consultorio).
Efectos adversos de la intervención
No se prevé que las intervenciones sólo en padres darán lugar a resultados adversos. Sin embargo, al igual que todas las intervenciones para el tratamiento de la obesidad en niños y jóvenes, se deben considerar posibles efectos adversos, incluidos los efectos sobre el crecimiento lineal, los trastornos en los hábitos alimenticios y el bienestar psicológico.
De qué manera podría funcionar la intervención
El ambiente doméstico es importante en la etiología de la obesidad de la niñez, y los padres desempeñan una gran función en la elección de los alimentos y la actividad física de los niños. En encuestas en los EE.UU., Wansink calculó que el "guardián nutricional" (que compra y cocina los alimentos) controla el 72% de los alimentos que comen los niños dentro y fuera del hogar (Wansink 2006). Una revisión sistemática realizada por Clark y cols. indicó que un alto nivel de restricción de los padres en los refrigerios se asocia con una mayor ingesta calórica y aumento de peso en los niños (Clark 2007). Por el contrario, el control "encubierto" del consumo de alimentos de los niños mediante el control del ambiente de comida domiciliario para limitar la exposición a los alimentos no saludables (es decir, al no comprar alimentos no saludables) disminuye la ingesta de refrigerios no saludables en comparación con el control "evidente" (es decir, comprar los refrigerios pero no permitir el acceso) (Ogden 2006). En cuanto a la actividad física, una revisión sistemática indicó que el apoyo de los padres se asocia firmemente con niveles físicos de actividad en los niños, aunque la influencia del patrón de los padres al ser ellos físicamente activos no fue consistente (Gustafson 2006).
Un funcionamiento familiar deficiente, como la comunicación deficiente y niveles altos de conflictos, también se asocia con un riesgo mayor de obesidad en los niños (Halliday 2014). El estilo de crianza autoritario se asocia con un riesgo menor de obesidad en los niños, comparado con otros estilos de crianza (Sleddens 2011).
Debido a la importancia de la función de los padres en el ambiente doméstico y la importancia de los estilos y aptitudes de crianza, los padres se han definido como "agentes del cambio" en la familia para la intervención con niños menores de 12 años de edad y obesidad (Golan 2004). La importancia de los padres en el proceso de cambio ha dado lugar al cuestionamiento de si los niños necesitan participar de la intervención. El objetivo de las intervenciones sólo en padres es trabajar para darles a los padres la responsabilidad del ambiente de la comida y la actividad física de su familia y aumentar la capacidad de los padres para implementar los cambios en el estilo de vida. Los ensayos han evaluado si las intervenciones sólo en padres son superiores o comparables a las intervenciones en padres e hijos, así como a las comparaciones con control en lista de espera.
Por qué es importante realizar esta revisión
La primera versión de esta revisión sistemática se publicó en 2003 e incluyó el análisis de los ensayos de tratamiento de la obesidad en la niñez publicados hasta julio de 2001 (Summerbell 2003). La segunda versión fue publicada en 2009 y proporcionó una actualización de la revisión de 2003 (Oude Luttikhuis 2009).
Para reflejar el crecimiento rápido en esta área, la tercera actualización de esta revisión se ha dividido en seis revisiones que se centran en los siguientes enfoques terapéuticos: cirugía; fármacos; intervenciones solamente para padres; dieta, actividad física e intervenciones conductuales para niños pequeños de cero a cuatro años de edad; niños escolares con cinco a 11 años de edad y adolescentes con 12 a 17 años de edad.
La presente revisión examinó la efectividad de las intervenciones dirigidas exclusivamente a los padres para el tratamiento de la obesidad de la niñez. Esta revisión se basa en dos revisiones en esta área en las que las intervenciones sólo en padres parecieron ser tan efectivas como las intervenciones que adoptaron el modelo tradicional en el que los padres y el niño participaron en la intervención (Ewald 2014; Jull 2013). Faith 2012 no mostró pruebas consistentes de que una mayor participación de los padres y el cuidador adulto se asoció con mejores resultados en los niños. Esta revisión amplió las pruebas de la efectividad al incluir ensayos que compararon intervenciones sólo en padres con intervenciones en padres e hijos, controles en lista de espera, otras intervenciones con solamente información o contacto mínimo y otros tipos de intervenciones sólo en padres. Estos ensayos se agruparon para examinar la efectividad de las intervenciones sólo en padres para el tratamiento de la obesidad de la niñez. La revisión también pretendía explorar la repercusión del tipo (p.ej. centrado en la crianza, terapia cognitivo‐conductual, cambio conductual) y el contexto (p.ej. en la comunidad, en el consultorio, mediante internet) de la intervención sólo en padres, para determinar si algún enfoque específico fue más efectivo para el tratamiento de la obesidad de la niñez.
Los resultados de la presente revisión y otras revisiones sistemáticas de esta serie aportarán información que pueda respaldar las guías clínicas y las políticas sanitarias sobre el tratamiento del sobrepeso o la obesidad infantil.
Objetivos
Evaluar la efectividad de las intervenciones en la dieta, la actividad física y conductuales administradas solamente a los padres para el tratamiento del sobrepeso y la obesidad en niños de cinco a 11 años de edad.
Métodos
Criterios de inclusión de estudios para esta revisión
Tipos de estudios
Se incluyeron ensayos controlados aleatorios (ECA).
Tipos de participantes
Los grupos de estudio consistieron en niños con una media de edad en el estudio de cinco a 11 años al comienzo de la intervención.
Criterios diagnósticos
Se incluyeron niños con sobrepeso u obesidad según cualquier clasificación.
Tipos de intervenciones
Se planificó investigar las siguientes comparaciones de intervención versus control / comparador.
Intervención
Cualquier forma de intervención sobre el estilo de vida con el objetivo primario de tratar el sobrepeso o la obesidad en los niños (cualquier forma de tratamiento dietético, de actividad física, conductual, o una combinación de éstos administrados como intervenciones únicas o multicomponente) dirigidos a los padres como agentes del cambio (es decir, las intervenciones no incluyeron a sus niños).
Comparador
Atención habitual, una intervención en padres e hijos, intervención sólo en niños o un tratamiento alternativo concomitante siempre que se administrara en el brazo de intervención.
Las intervenciones concomitantes tenían que ser las mismas en los grupos intervención y comparador para establecer comparaciones justas.
Mínima duración de la intervención/seguimiento
La duración de la intervención/seguimiento tenía que ser por lo menos de seis meses.
Criterios de exclusión
Se excluyeron los niños gravemente enfermos o los niños con una causa sindrómica de la obesidad (p.ej. Prader‐Willi).
Tipos de medida de resultado
Resultados primarios
-
Cambios en el índice de masa corporal (IMC) y el peso corporal.
-
Eventos adversos.
Resultados secundarios
-
Calidad de vida relacionada con la salud y autoestima.
-
Mortalidad por todas las causas.
-
Morbilidad.
-
Medidas de la distribución de la grasa corporal:
-
Cambio conductual.
-
Puntos de vista de los participantes acerca de la intervención.
-
Relación entre padres e hijos o evaluación de la crianza.
-
Efectos socioeconómicos con medidas validadas.
Método y momento adecuado de la medición de resultados
-
Cambios en el IMC (kg/m2) y el peso corporal (kg) medidos al inicio, y al menos a los seis, 12 y 24 meses.
-
Eventos adversos: definidos como un resultado adverso que ocurre durante o después de la intervención pero que no necesariamente es causado por la misma, y medidos al inicio y al menos a los seis, 12 y 24 meses.
-
Calidad de vida relacionada con la salud: evaluada con instrumentos validados como el Paediatric Quality of Life Inventory y medida al inicio y al menos a los seis, 12 y 24 meses.
-
Mortalidad por todas las causas: definida como cualquier muerte que ocurriera durante o después de la intervención y medida al inicio y al menos a los seis, 12 y 24 meses
-
Morbilidad: definida como enfermedad o efecto perjudicial asociado con la intervención y medida al inicio, y al menos a los seis, 12 y 24 meses.
-
Medidas de la distribución de la grasa corporal: definidas mediante herramientas validadas como la absorciometría de rayos X de energía dual (DXA), la circunferencia de la cintura, el espesor del pliegue cutáneo, el cociente cintura‐cadera o el análisis de impedancia bioeléctrica y medidas al inicio y al menos a los seis, 12 y 24 meses.
-
Cambio conductual: definido como medidas validadas de la dieta y la actividad física y medido al inicio, y al menos a los seis, 12 y 24 meses.
-
Puntos de vista de los participantes acerca de la intervención: definidos como registros documentados de la información brindada por el participante y medidos al inicio y al menos a los seis, 12 y 24 meses.
-
Relación entre padres e hijos o evaluación de la crianza: evaluada con un instrumento validado y medida al inicio, y al menos a los seis, 12 y 24 meses.
-
Efectos socioeconómicos, definidos como una medida validada del nivel socioeconómico, como los ingresos o el nivel educativo de los padres y medidos al inicio y al menos a los seis, 12 y 24 meses.
Resumen de los hallazgos
Se presenta una tabla "Resumen de los hallazgos" que informa los siguientes resultados, enumerados según la prioridad.
-
Cambios en el IMC y el peso corporal.
-
Eventos adversos.
-
Calidad de vida relacionada con la salud
-
Mortalidad por todas las causas.
-
Morbilidad.
-
Relación entre padres e hijos o la evaluación de la crianza.
-
Efectos socioeconómicos.
Results
Description of studies
For a detailed description of trials, see the Characteristics of included studies, Characteristics of excluded studies and Characteristics of ongoing studies tables.
Results of the search
The searches generated 13,759 hits after duplicates were removed. Screening of titles and abstracts identified 137 papers to go forward for formal inclusion and exclusion. Twenty completed RCTs fulfilled the inclusion criteria and were included in the review. For a detailed description of the included trials, see the Characteristics of included studies table. The search identified 10 ongoing trials, which are reported in the Characteristics of ongoing studies table. The flow of trials through the review is presented in Figure 1.

Study flow diagram.
Included studies
A detailed description of the characteristics of included trials is presented elsewhere (see Characteristics of included studies table and Appendix 2; Appendix 3; Appendix 4; Appendix 5; Appendix 6; Appendix 7; Appendix 8; Appendix 9). The following is a succinct overview.
Source of data
The majority of data presented in the review was obtained from published literature, including supplementary published data where available. For five trials, trial authors provided data (Appendix 10).
Study details
We included 20 RCTs in 19 main publications (Aragona 1975; Boutelle 2011; Collins 2011; Esfarjani 2013; Estabrooks 2009; Golan 2006; Golley 2007; Janicke 2008; Jansen 2011; Magarey 2011; Mazzeo 2014; Munsch 2008; Raynor 2012a; Raynor 2012b; Resnick 2009; Resnicow 2015; Small 2013; van Grieken 2013; West 2010). Eighteen RCTs were parallel comparisons with individual randomisation. In most trials, the unit of randomisation was the family (parent and child); however, study authors analysed the children and parents for respective outcomes separately. Two RCTs were cluster RCTs, where the Primary Care Provider (PCP) (Resnicow 2015) or Youth Health Care (YHC) (van Grieken 2013) team were the unit of randomisation. Eighteen RCTs were superiority trials, one had a non‐inferiority study design (Boutelle 2011), and one an equivalence study design (Munsch 2008). Eight RCTs had three comparisons (Aragona 1975; Collins 2011; Estabrooks 2009; Golley 2007; Janicke 2008; Raynor 2012a; Raynor 2012b; Resnicow 2015); the remaining trials had two comparison groups.
Ten trials were undertaken in the USA (Aragona 1975; Boutelle 2011; Estabrooks 2009; Janicke 2008; Mazzeo 2014; Raynor 2012a; Raynor 2012b; Resnick 2009; Resnicow 2015; Small 2013); four in Australia (Collins 2011; Golley 2007; Magarey 2011; West 2010), and two in the Netherlands (Jansen 2011; van Grieken 2013). There was one trial each from Israel (Golan 2006), Switzerland (Munsch 2008), Iran (Esfarjani 2013), and Belgium (Moens 2012). Five trials were single‐centre trials (Aragona 1975; Boutelle 2011; Esfarjani 2013; Golan 2006; Moens 2012); the remaining trials were either multi‐centre trials (with two centres: Golley 2007; Munsch 2008; Resnick 2009; three centres: Jansen 2011; Magarey 2011; and six centres: West 2010), or the numbers of centres were not reported (Collins 2011; Estabrooks 2009; Janicke 2008; Mazzeo 2014; Raynor 2012a; Raynor 2012b; Small 2013). The cluster RCT by van Grieken 2013 was undertaken in nine study centres, across 44 healthcare teams. The cluster RCT by Resnicow 2015 was undertaken in 42 primary care practices.
Overview of study populations
All trials included parents of overweight or obese children. The diagnostic criteria differed between trials, in 10 trials this was based on the BMI 85th percentile (Boutelle 2011; Estabrooks 2009; Golan 2006; Janicke 2008; Mazzeo 2014; Munsch 2008; Raynor 2012a; Raynor 2012b; Resnick 2009; Resnicow 2015), and in one trial the BMI 95th percentile (Esfarjani 2013). In other trials, this was based on the parent or physician describing their child as overweight (Aragona 1975; Moens 2012; Small 2013; West 2010); the IOTF definition (Golley 2007; Magarey 2011), or stated as international cut‐off points that were not specified (van Grieken 2013); a specified BMI cut‐off (Collins 2011); or the proportion of BMI above expected BMI (at least 30% greater in Jansen 2011).
All trials included parents of children aged between 4 and 13 years, the majority of which did not include children above 11 years of age. The mean ages of participants were reported in 16 trials. In six trials, the mean ages were between 5 and 7 years (Esfarjani 2013; Raynor 2012a; Raynor 2012b; Resnicow 2015; Small 2013; van Grieken 2013); in seven trials, the mean ages were between 8 and 9 years (Aragona 1975; Collins 2011; Golan 2006; Magarey 2011; Moens 2012; West 2010); and in four trials, the mean ages of the children was between 10 and 11 years (Boutelle 2011; Estabrooks 2009; Janicke 2008; Munsch 2008). The proportion of girls in the trials typically ranged from 40% to 70% where reported (four trials did not report this: Esfarjani 2013; Janicke 2008; Mazzeo 2014; Resnick 2009), although was 100% in one study (Aragona 1975). Only eight trials reported ethnicity of the children and in all trials there was a high proportion of children categorised as white (between 60% and 100% across all trials: Estabrooks 2009; Janicke 2008; Moens 2012; Raynor 2012a; Raynor 2012b; Resnicow 2015; Small 2013; West 2010). Only eight trials reported socioeconomic indices of the parents (Boutelle 2011; Esfarjani 2013; Janicke 2008; Moens 2012; Resnicow 2015; Small 2013; van Grieken 2013; West 2010). Each used a different indicator of socioeconomic status (see Appendix 4).
The number of participants included in the 19 trials ranged between 15 and 645. Five trials had fewer than 30 participants per study arm (Aragona 1975; Moens 2012; Munsch 2008; Raynor 2012b; Resnick 2009), whereas four trials had greater than 60 participants per study arm (Collins 2011; Esfarjani 2013; Estabrooks 2009; Magarey 2011). In the cluster RCT by van Grieken 2013, there were 22 clusters in each arm (total 637 participants), in the Resnicow 2015 cluster RCT, there were 42 clusters (total 645 participants).
Seven trials reported the BMI z score, which ranged from 2.0 to 2.8 at baseline (Boutelle 2011; Collins 2011; Estabrooks 2009; Golley 2007; Janicke 2008; Magarey 2011; West 2010). Five trials reported the BMI percentile, which ranged from 92% to 98.5% at baseline (Jansen 2011; Mazzeo 2014; Resnick 2009; Resnicow 2015; Small 2013). Five trials reported BMI (Esfarjani 2013; Mazzeo 2014; Munsch 2008; Raynor 2012a; Raynor 2012b), and could be calculated from individual participant data in one other study (Aragona 1975). The BMI in these trials ranged from 22 to 33.6 at baseline. Eleven trials reported parental BMI. In eight trials, the mean parental BMI ranged between 26 and 36; with four trials including parents with BMIs between 26 and 30 (Jansen 2011; Munsch 2008; Resnick 2009; Resnicow 2015), and four trials including parents with BMIs above 30 (Boutelle 2011; Janicke 2008; Mazzeo 2014; Small 2013). One study reported the proportions of parents in three categories (healthy, overweight, obese); these were approximately 37% (healthy), 23% (overweight) and 40% (obese) (West 2010). Another study reported the proportions of 'normal' (about 56%) and 'overweight' (about 44%) (van Grieken 2013). One study reported the weight of the parents (for mothers and fathers for each group respectively) (Golan 2006).
For details of baseline characteristics of participants in the included trials, see Appendix 4 and Appendix 5. There were no substantial differences in baseline characteristics between the intervention and comparator groups in the included trials.
Interventions
Seventeen trials reported the settings for the interventions. In four trials, the intervention was in an outpatient setting (Collins 2011; Estabrooks 2009; Golley 2007; Magarey 2011), and in four trials it was a community setting (Janicke 2008; Mazzeo 2014; Resnick 2009; van Grieken 2013). Two trials were undertaken in a university setting (Boutelle 2011; Moens 2012); two in a primary care setting (Resnicow 2015; Small 2013), and five trials win a mixture of settings including outpatient, university, primary care or a combination of these settings (Jansen 2011; Munsch 2008; Raynor 2012a; Raynor 2012b; West 2010).
The interventions in the included trials predominantly focused on nutritional, physical activity and behavioural components; see Characteristics of included studies table and Appendix 2 for specific details for each included study.
Five trials compared a parent‐only intervention to a parent‐child intervention (two also had a third comparison of a waiting list control, Janicke 2008 or a second parent‐child intervention, Collins 2011) (Boutelle 2011; Collins 2011; Golan 2006; Janicke 2008; Munsch 2008). In one study, the duration of the intervention was 10 weeks (Munsch 2008); and four trials had interventions of 16 to 24 weeks' duration (Boutelle 2011; Collins 2011; Golan 2006; Janicke 2008). Session lengths ranged from one to two hours in all five trials. All trials followed participants beyond the timing of the end of the intervention. This was 14 weeks' post intervention in one study (Janicke 2008), 24 to 26 weeks' post intervention in two trials (Boutelle 2011; Munsch 2008), one year post intervention in one trial (Golan 2006), and 80 weeks' post intervention in one study (Collins 2011).
Six trials compared a parent‐only intervention to a waiting list control (Aragona 1975; Golley 2007; Janicke 2008; Jansen 2011; Moens 2012; West 2010) and two of these trials had two different parent‐only interventions (Aragona 1975; Golley 2007). The duration of the intervention ranged from 12 to 24 weeks in these trials and sessions ranged between 90 minutes and two hours (one study did not provide details, Aragona 1975). In two trials, there were additional sessions via telephone contact between interventionists and the parents, which were approximately 20 minutes long (Golley 2007; West 2010). All but one study followed participants up beyond the timing of the end of the intervention (Moens 2012). This was 12 to 14 weeks post intervention in one trial (Jansen 2011), 24 weeks post intervention in two trials (Golley 2007; Janicke 2008), 39 weeks post intervention in one trial (Aragona 1975) and 40 weeks post intervention in one trial West 2010).
Seven trials compared a parent‐only intervention with a minimal contact parenting advice control (mailed information or a workbook or minimal sessions) (Esfarjani 2013; Estabrooks 2009; Mazzeo 2014; Resnick 2009; Resnicow 2015; Small 2013; van Grieken 2013); two trials had two different parent‐only interventions (Estabrooks 2009; Resnicow 2015). The duration of the interventions ranged from 12 to 26 weeks in five trials (in the Resnick 2009 study the interventions ranged from 30 to 41 weeks but the study reports a mean of 18 weeks). In one study, the duration of the intervention differed for each participants, but was up to 12 months (van Grieken 2013). In one trial, the intervention continued to 24 months (Resnicow 2015). In three trials, the number of sessions provided to parents was lower than reported in the other parent‐only interventions, being three or four sessions (Resnick 2009; Small 2013; van Grieken 2013). In two trials, the intervention was delivered across 12 sessions (Esfarjani 2013; Mazzeo 2014); in the study by Estabrooks 2009, there were two parent‐only treatment arms, which were either 12 or 24 weeks in duration and in the study by Resnicow 2015, there were also two parent‐only treatment arms, which were either four or 10 sessions. Six trials reported the duration of follow‐up in relation to the completion of the intervention. In the study by Mazzeo 2014, this was 12 weeks post intervention completion, in Small 2013, this was 24 weeks post completion of the intervention, in Estabrooks 2009, this was between 28 and 40 weeks post completion of the intervention and in Aragona 1975, this was 39 weeks post completion of the intervention. In the van Grieken 2013 RCT, follow‐up was 24 months after baseline (the duration of the intervention was "up to 12 months") and in the Resnicow 2015 trial, follow‐up was at completion of the intervention at 24 months.
Seven trials compared different types of parent‐only interventions (Aragona 1975; Estabrooks 2009; Golley 2007; Magarey 2011; Raynor 2012a; Raynor 2012b; Resnicow 2015), two also had a parent‐only versus waiting list control comparison (Aragona 1975; Golley 2007), and two trials also had a parent‐only versus minimal contact intervention (Estabrooks 2009; Resnicow 2015). In the first, by Estabrooks 2009, there were three treatment arms. In one treatment group, the parents received a self help workbook, attended two group sessions and these were followed up with 10 interactive voice response (IVR) counselling sessions over a 10‐week period. In the second arm, the parents received the work book and attended the same two group sessions but did not have the IVR follow‐up sessions. In the third group, parents received the workbook only. In the study by Resnicow 2015, participants either received motivational interviewing over four sessions in the primary care practice, or received the four motivational interviewing sessions and six sessions with a dietician (the third arm received usual care information). In the study by Magarey 2011, parents were randomised into two arms, one received a four‐session parenting programme that was followed by eight group sessions about healthy lifestyles. The second group received the eight sessions about healthy lifestyles only. Both the trials by Estabrooks 2009 and Magarey 2011 followed participants up beyond the timing of the end of the intervention. In the study by Estabrooks 2009, this was between 28 and 40 weeks post completion of the intervention and in the study by Magarey 2011, this was 80 weeks post completion of the intervention. In the study by Resnicow 2015, follow‐up was at the point of completing the intervention (24 weeks) although in the second 12‐month period of the intervention there were fewer sessions held.
Two trials in one publication also compared different parent‐only interventions (Raynor 2012a; Raynor 2012b). There were many shared attributes of the two trials. The first trial compared a parent‐only intervention that focused on growth monitoring to a parent intervention that focused on decreasing sugary foods in the diet and a parent intervention that focused on increasing healthy food consumption (Raynor 2012a). Parents randomised to the two comparison groups also received the parent‐only intervention (growth monitoring). The second study compared the parent‐only intervention to a parent intervention that focused on decreasing sugary foods and increasing physical activity, and to a parent intervention that focused on increasing low‐fat milk intake and decreasing television watching (Raynor 2012b). Parents randomised to the two comparison groups also received the parent‐only 'growth monitoring' intervention. The duration of the interventions in these two trials was six months, and there were eight sessions of 45 minutes' duration. These trials followed participants up 24 weeks after the timing of the end of the intervention. Golley 2007 compared parenting skills training with the addition of intensive lifestyle education with the parenting skills training without the additional intensive lifestyle education. The duration of the interventions are as described above. Aragona 1975 compared a parenting response‐cost and training in reinforcement skills with the response‐cost training only. Parents were required to enter a contract with the interventionists and pay a deposit relating to a goal of weight loss in their child, which could be returned for attendance at the sessions and when the goal was achieved. The duration of the interventions is as described above.
Six trials reported compliance rates with the interventions (Estabrooks 2009; Golan 2006; Golley 2007; Mazzeo 2014; Raynor 2012a; Raynor 2012b). One study reported that attendance in both arms of their trial was above 80% (Golan 2006). In two trials, the trial authors reported that attendance at growth monitoring appointments did not differ among the groups (Raynor 2012a; Raynor 2012b). In Raynor 2012a, compliance with attendance and turning in monitoring dairies was 73%, in Raynor 2012b this was 64%. In the study by Mazzeo 2014, the numbers attending 50% or more of sessions were reported for the parent‐only intervention (22/43). Mean session attendance across groups was 53%. In the control group, 35/41 parents attended the single session. Golley 2007 reported the number of participants attending sessions in the two intervention arms. There were 11 sessions in the parenting‐skill training arm and 19 parents attended at least eight sessions; 13 attended 2 to 7 sessions and 5 attended 1 or 0 sessions. In the parenting‐skills training with intensive lifestyle education arm, there were 18 sessions and the study reported that 18 parents attended at least 13 sessions; 18 attended 2 to 12 sessions; and 2 attended 1 or sessions. Estabrooks 2009 reported the number of participants taking part in the IVR intervention where 20 participants took part in 0 to 5 calls while 38 took part in 6 to 10 calls.
Outcomes
All trials reported weight, BMI, or both, as an outcome measure. Other outcomes reported in the trials differed with few similarities across the included trials in the choice of outcomes reported (see Appendix 5). Where reported, measures of BMI were reported differently across the trials. Where a study reported more than one measure of BMI, we took the BMI z score as the preferred measure in the data synthesis.
Excluded studies
We excluded 83 of 137 full‐text articles after evaluation of the full publication.
The main reasons for exclusion were the interventions also included the children (not parent‐only) and the duration of the study was less than six months. Many trials had multiple reasons for exclusion (for further details see Characteristics of excluded studies table, which lists the 16 trials that most closely missed the inclusion criteria).
Risk of bias in included studies
For details on risk of bias of included trials, see Characteristics of included studies table. For an overview of review authors' judgements about each risk of bias item for individual trials and across all trials, see Figure 2 and Figure 3.

Risk of bias graph: review authors' judgements about each risk of bias item presented as percentages across all included studies (blank cells indicate that the particular outcome was not investigated in some studies).

Risk of bias summary: review authors' judgements about each risk of bias item for each included study (blank cells indicate that the study did not report that particular outcome).
Trial quality was generally low. Many trials did not report adequate information to assess the risk of bias and we assessed 14 trials at high risk of bias on at least one domain (Boutelle 2011; Collins 2011; Esfarjani 2013; Estabrooks 2009; Golley 2007; Janicke 2008; Jansen 2011; Magarey 2011; Mazzeo 2014; Moens 2012; Munsch 2008; Resnick 2009; Resnicow 2015; West 2010). We assessed six trials at high risk of bias on three or more domains (Collins 2011; Estabrooks 2009; Janicke 2008; Magarey 2011; Moens 2012; West 2010).
Allocation
Only 10 of 19 trials reported an adequate method of randomisation (Boutelle 2011; Collins 2011; Estabrooks 2009; Golley 2007; Magarey 2011; Mazzeo 2014; Raynor 2012a; Raynor 2012b; van Grieken 2013; West 2010). Five trials reported an adequate concealment of allocation (Golan 2006; Golley 2007; Magarey 2011; Raynor 2012a; Raynor 2012b).
Blinding
The potential for performance bias was unknown in most trials. Six trials were at high risk of performance bias for objective or subjective (or both) outcomes as appropriate to their study outcomes (Collins 2011; Estabrooks 2009; Magarey 2011; Moens 2012; Resnicow 2015; West 2010). Blinding of outcome assessors was adequate for objective outcomes in nine trials (Collins 2011; Estabrooks 2009; Golan 2006; Golley 2007; Magarey 2011; Raynor 2012a; Raynor 2012b; Resnicow 2015; van Grieken 2013). In three trials, the risk of detection bias was high for subjective outcomes (Estabrooks 2009; Moens 2012; West 2010).
Incomplete outcome data
Many trials reported high levels of drop‐out or loss to follow‐up (highest drop‐out rates ranged between 40% and 79%) and only nine trials reported adequate means to address these in the analysis (Aragona 1975; Golan 2006; Jansen 2011; Mazzeo 2014; Raynor 2012a; Raynor 2012b; Resnicow 2015; Small 2013; West 2010). Eight trials were at high risk of attrition bias on objective outcomes (Boutelle 2011; Collins 2011; Esfarjani 2013; Estabrooks 2009; Janicke 2008; Magarey 2011; Munsch 2008; Resnick 2009), and four trials on subjective outcome measures (Collins 2011; Janicke 2008; Magarey 2011; Munsch 2008).
Selective reporting
One trial was at low risk of selective reporting bias (van Grieken 2013), whereas eight trials were at high risk of selective reporting bias (Collins 2011; Estabrooks 2009; Golley 2007; Janicke 2008; Magarey 2011; Mazzeo 2014; Moens 2012; Resnicow 2015). All other trials were at unclear risk of selective reporting bias.
Other potential sources of bias
One study by Jansen 2011 was at high risk of bias because nine participant families who had originally been randomised to the waiting list control were included in the analysis for the parent‐only intervention. There were no other potential sources of bias identified by review authors and all of the remaining trials were at unclear risk of bias on this factor.
Effects of interventions
See: Summary of findings for the main comparison Parent‐only interventions versus parent‐child interventions for childhood overweight or obesity; Summary of findings 2 Parent‐only interventions versus waiting list control for childhood overweight or obesity; Summary of findings 3 Parent‐only interventions versus minimal contact control for childhood overweight or obesity; Summary of findings 4 Parent‐only interventions versus parent‐only interventions for childhood overweight or obesity
The included trials had different durations of interventions and follow‐up. To assess the effects of the interventions we considered outcomes from the longest period of follow‐up in each study. In addition, we also reported outcomes from any post intervention follow‐up period (if it differed from the longest period of follow‐up). This allowed an assessment of the initial response to the intervention and any maintenance of that response on outcomes. If a study reported outcomes at any interim time points, we extracted these data as per the review protocol.
For 10 of 19 trials, we had to calculate SD as described (Dealing with missing data) (Boutelle 2011; Collins 2011; Esfarjani 2013; Estabrooks 2009; Jansen 2011; Magarey 2011; Mazzeo 2014; Resnick 2009; Small 2013; West 2010). Furthermore, one trial author provided SD data on two trials (Raynor 2012a; Raynor 2012b), after being contacted (Appendix 10).
Parent‐only interventions versus parent‐child interventions
Five trials reported seven comparisons of a parent‐only intervention and a parent‐child intervention (Boutelle 2011; Collins 2011; Golan 2006; Janicke 2008; Munsch 2008). To allow consideration of the effects of the interventions, we considered outcomes here from the longest period of follow‐up and any post intervention follow‐up. The period for the post intervention follow‐up in these trials ranged from 10 weeks to 12 months and the period for the longest point of follow‐up ranged from 8 to 24 months. Losses to follow‐up ranged from 6% to 50% at the post intervention follow‐up and 18% to 72% at the longest period of follow‐up (see Table 1). One study reported the participants completing the study but it was unclear what numbers of participants were included in the post intervention follow‐up (Golan 2006). In the trials by Golan 2006, Collins 2011, and Munsch 2008, there was a differential rate of losses to follow‐up between groups. All of these factors need to be considered when interpreting the results of the trials.
Primary outcomes
Changes in body mass index and body weight
Five trials reported BMI variables at the end of the intervention (Boutelle 2011 at five months; Collins 2011 and Golan 2006 at six months; Janicke 2008 at four months; Munsch 2008 at 10 weeks). All trials reported the BMI z score. Three trials (four comparisons) reported data that could be analysed in a meta‐analysis; Golan 2006 and Munsch 2008 did not report SDs or information that could be used to estimate SDs.
A pooled summary estimate of the change in BMI z score is shown in Analysis 1.1, the MD was ‐0.06 ((95% CI ‐0.13 to 0.02); P = 0.14; 277 participants; 3 trials with 4 treatment groups; low quality evidence). There was moderate heterogeneity (I2 = 37%), and similar results occurred with a fixed‐effect meta‐analysis. All included trials had a high risk of attrition bias. SDs were imputed for one trial (Boutelle 2011).
Of the two trials that did not report measure of variance, the mean change in BMI z score was reduced in both groups; ‐0.4 in the parent‐only group and ‐0.1 in the parent‐child group in the study by Golan 2006, and ‐0.16 in the parent‐only group and ‐0.08 in the parent‐child group in the study by Munsch 2008. All trials had either high rates of non‐completion across groups or differential non‐completion rates between study groups and, therefore, these results need to be interpreted with caution. In the study by Collins 2011, the BMI was also reported, there were no significant differences in change from baseline between groups.
Five trials (six comparisons) reported BMI variables beyond the end of the intervention (Boutelle 2011, Janicke 2008, and Munsch 2008 after six months; Collins 2011 after 18 months; Golan 2006 after 12 months). In all five trials, this was the BMI z score. Two trials did not report SDs or information that could be used to estimate SDs and, therefore, these were not included in the pooled summary estimate (Golan 2006; Munsch 2008). Three trials (four comparisons) therefore provided data that could be analysed in a meta‐analysis (Boutelle 2011; Collins 2011; Janicke 2008) (see Analysis 1.2). There was no substantial difference on BMI z score change between those in the parent‐only interventions and those in the parent‐child interventions ((MD ‐0.04 (95% CI ‐0.15 to 0.08); P = 0.56; 267 participants; 3 trials with 4 treatment groups; low quality evidence). There was moderate heterogeneity (I2 = 37%); results were similar with a fixed‐effect meta‐analysis. There was a high risk of attrition bias in these three studies; we imputed SDs for two of these trials (Boutelle 2011; Collins 2011). In one of the two trials that did not report SDs, there was a reduction in BMI z score in both intervention groups (‐0.3 with parent‐only versus ‐0.14 with parent‐child) (Munsch 2008) . In the study by Golan 2006, there was a reduction in BMI z score in the parent‐only group (‐1.28) and a slight increase in BMI z score in the parent‐child group (0.032).
Two trials also reported the change in percentage overweight at follow‐up. In the study by Golan 2006, immediately after the intervention the overweight change in the parent‐only group was ‐10% (SD 22) and in the parent‐child group this was ‐3% (SD 18) (P < 0.05 for between‐group difference). At follow‐up 12 months later, the change in percentage overweight was ‐12% in the parent‐only group and 0.4% in the parent‐child group (P < 0.05). In Munsch 2008, the change reported was a ‐4% reduction at the end of treatment in the parent‐only group and a ‐2.% reduction at the end of treatment in the parent‐child group (P not significant). At follow‐up six months later, the reduction in per cent overweight was ‐5% in the parent‐only group and ‐2% in the parent‐child group (P not significant).
Collins 2011 reported body weight, adjusted for age, immediately after the intervention and at the longest period of follow‐up (24 months). At six months (immediately after the intervention), in the parent‐only group the change from baseline weight was 0.4 kg (SD 2); in the parent‐child physical activity group this was 1.3 kg (SD 3.2) and in the parent‐child physical activity plus diet group this was 0.1 kg (SD 2.9). At 24 months, in the parent‐only intervention this was ‐1.7 kg (SD 9.4), in the parent‐child physical activity group this was 0.4 kg (SD 11) and in the parent‐child physical activity plus diet group this was ‐0.9 kg (SD 10.7).
Three trials reported parental BMI (Boutelle 2011; Janicke 2008; Munsch 2008). The change from baseline parental BMI in the Janicke 2008 study was ‐0.9 (SD 1.6) in the parent‐based group and ‐0.7 (SD 1.0) in the control group at the end of the intervention (five months) and was ‐0.6 (SD 2.4) in the parent‐only group and 0.2 (SD 1.5) in the control group at the follow‐up at 11 months. There were no substantial differences between groups at either time point (P = 0.93 at four months, P = 0.17 at 10 months). In the study by Munsch 2008, the change in parental BMI at the end of treatment (10 weeks) was 0.1 (SD not calculable) in the parent‐only group and ‐0.04 (SD not calculable) in the parent‐child group. At the end of follow‐up (six months later), the change in parental BMI was ‐0.1 (SD not calculable) in the parent‐only group and 0.1 (SD not calculable) in the parent‐child group. The study reported that there were no significant differences between groups. Boutelle 2011 reported BMI post‐intervention (five months) and six months later. Parental BMI change was ‐0.7 (SD 8.7) in the parent‐only group and ‐0.1 (SD 7.4) in the parent‐child group post intervention, and 0.1 (SD 9.1) in the parent‐only group and 0.3 (SD 7.2) in the parent‐child group at follow‐up. Results were suggested by the authors to be likely to be non‐inferior. There were high levels of non‐completion in these trials.
Adverse events
No trials reported adverse events.
Secondary outcomes
Health‐related quality of life and self esteem
No trials reported health‐related quality of life measures.
Immediately post the four‐month intervention Janicke 2008 assessed the self esteem of the children on four subscales of the validated Self‐Perception Profile for Children (SPPC) measure. These were social self esteem, athletic self esteem, physical self esteem and global self esteem. Results were reported for boys and girls separately because of gender differences in self esteem and, therefore, normative data were presented for the separate groups. An increase in score on this measure corresponds to increased self esteem. Changes from baseline were generally positive for all measures for both the parent‐only and parent‐child groups. There were no substantial differences between the groups seen at follow‐up (analysis was for a treatment effect between the three interventions included in the study, no pairwise analysis was undertaken of the parent‐only and parent‐child groups).
All‐cause mortality
No trials reported all‐cause mortality.
Morbidity
No trials reported morbidity.
Measures of body fat distribution
One trial reported waist circumference adjusted for age and gender (waist z score) (Collins 2011). The change from baseline between groups at the immediate follow‐up was: parent‐only ‐0.3 (SD 0.3); parent‐child physical activity ‐0.1 (SD 0.5); parent‐child physical activity plus diet ‐0.2 (SD 0.5). At 24‐month follow‐up, change from baseline was: parent‐only ‐3.9 (SD 9.9); parent‐child physical activity ‐1.5 (SD 11.6); parent‐child physical activity plus diet ‐1.1 (SD 11.1). Both sets of results should be interpreted in view of the differential and high rates of study non‐completion.
Behaviour change
One trial used the Physical Activity Questionnaire for Older Children (Boutelle 2011). This was a seven‐day recall measure designed to assess physical activity levels and consists of nine items, each being rated on a 5‐point scale. At post‐intervention follow‐up and six months later, results for the parent‐only group showed non‐inferiority to the parent‐child group. Scores were 2.8 (SD 0.6) in the parent‐only group and 2.7 (SD 1) in the parent‐child group at immediate follow‐up, and 4.2 (SD 3.7) in the parent‐only group versus 2.8 (SD 0.7) in the parent‐child group at follow‐up six months later. Non‐completion rates were high in both groups in this study.
Munsch 2008 reported outcomes on the German version of the Child Behaviour CheckList (CBCL), reporting the global score and the subscales of CBCL externalising, CBCL internalising and CBCL social problems at the end of treatment (10 weeks) and six months later. There were no substantial differences between the parent‐only group and parent‐child groups on any of these scales (data provided by study author).
The study by Collins 2011 used an objective measure of physical activity from the Actigraph 7164 uniaxial accelerometer to assess counts per minute over an eight‐day period. The total physical activity recorded increased in all groups at the immediate point of assessment (six months) but there were no substantial differences between groups. At the longest point of follow‐up (12 months), the physical activity recorded increased in the two parent‐child groups and decreased in the parent‐only group, but there were no substantial differences seen. In addition, this study measured parental report of screen behaviours by a validated measure, the Children's Leisure Activities Study Survey. The total screen time use decreased in all three groups at both measurements, but there were no substantial differences between groups.
Participants' views of the intervention
The study by Janicke 2008 asked parents whether they would be prepared to join the programme again. In the parent‐only group, 88% of parents responded that they would and 12% responded that they may be prepared to join the programme again. In the parent‐child intervention, 91% of parents responded that they would and 9% responded that they may be prepared to join the programme again. Children in the parent‐child group were asked if it was true that "Overall, this was a good program", where 85% responded 'really true'; 12% responded 'sort of true' and 3% responded 'sort of not true'.
Parent‐child relationship or assessment of parenting
No trials reported outcomes assessing parent‐child relationships or an assessment of parenting.
Socioeconomic effects
No trials reported outcomes assessing socioeconomic effects.
Parent‐only interventions versus waiting list controls
Six trials reported eight comparisons of a parent‐only intervention and a waiting list control (Aragona 1975; Golley 2007; Janicke 2008; Jansen 2011; Moens 2012; West 2010). To allow consideration of the effects of the interventions, we considered outcomes from the longest period of follow‐up and any post intervention follow‐up. The period for the post intervention follow‐up in these trials ranged from three to six months and the period for the longest point of follow‐up ranged from six to 12 months. Two trials did not report a period of follow‐up beyond the post intervention follow‐up (Moens 2012; West 2010). Losses to follow‐up ranged from 6% to 40% at the post intervention follow‐up and 18% to 60% at the longest period of follow‐up (see Table 1). In the trials by Janicke 2008, Jansen 2011, West 2010, and Aragona 1975, there was a differential rate of losses to follow‐up between groups. In the trials by Golley 2007 and Aragona 1975, losses to follow‐up at both time points were high: between 14% and 24% in the study by Golley 2007 and up to 69% in the study by Aragona 1975. Aragona 1975 had a very small sample size of five participants per treatment group. These factors need to be considered when interpreting the results of the trials.
Primary outcomes
Changes in body mass index and body weight
Three trials reported BMI variables at follow‐up post intervention (Janicke 2008 at four months; West 2010 at 12 weeks; Jansen 2011 at three months). In two trials, this was the BMI z score (Janicke 2008; West 2010), and in the third trial, this was the BMI percentile (Jansen 2011). A fourth study reported individual participant data for weight and height and we calculated the mean BMI from these data (Aragona 1975). Another study reported adjusted BMI based on parental report of weight and height and as the data were, therefore, not reliable, we have not discussed them further here (Moens 2012).
The meta‐analysis for the change in the BMI z score comparing the parent‐only group and the waiting list control group showed an MD of ‐0.12 ((95% CI ‐0.21 to ‐0.04); P = 0.003; 153 participants; 2 trials; low quality evidence; Analysis 2.1). Janicke 2008 had a high risk of attrition and reporting bias, and West 2010 had a high risk of selection and performance bias. We imputed SDs for West 2010.
At the longest point of follow‐up, four trials (six comparisons) reported BMI variables (Golley 2007 12 months post baseline; Janicke 2008 and Jansen 2011 six months after; Aragona 1975 39 weeks after). In two trials, this was the BMI z score (Golley 2007; Janicke 2008), in one trial, this was the BMI percentile (Jansen 2011), and in one trial this was the BMI (Aragona 1975).
Meta‐analysis for the change in BMI z score comparing the parent‐only group with the waiting list control group showed a MD of ‐0.10 ((95% CI ‐0.19 to ‐0.01); P = 0.04; 136 participants; 2 trials with 3 treatment arms; low quality evidence; Analysis 2.2). Janicke 2008 had a high risk of attrition and reporting bias, Golley 2007 had a high risk of reporting bias.
Jansen 2011 found no significant difference between the parent‐only intervention and the waiting list control in BMI percentile change from baseline (MD ‐1.90 (95% CI ‐3.76 to ‐0.04); Analysis 2.4). Aragona 1975 found no significant difference between either the parent‐only plus reinforcement group or the parent‐only group and the waiting list control on change from baseline BMI (Analysis 2.6). These data were based on small numbers and the rate of non‐completion was high and these data have not been combined in a meta‐analysis.
In Jansen 2011, there was a treatment effect in favour of the parent‐only intervention for BMI percentile change (‐0.48 (95% CI ‐0.89, 0.07); Analysis 2.3); however, Jansen 2011 was at a high risk of bias owing to nine families originally allocated to the waiting list control group being included in the data set for the parent‐only intervention, and, therefore, these data should be considered with caution. In Aragona 1975, there was a reduction from baseline BMI in both the parent‐only plus reinforcement group and the parent‐only intervention group compared with the waiting list control group (Analysis 2.5). However, we did not perform a meta‐analysis because these data were based on small numbers and the rate of non‐completers was high.
We undertook no sensitivity analyses on BMI change for trials with high loss to follow‐up as all of the trials had high loss to follow‐up. Therefore, caution is recommended in the interpretation of these data.
Aragona 1975 found a reduction in weight (which we converted to kilograms) in all three intervention groups at the end of the intervention period (parent‐only with reinforcement ‐5.1 kg (SD 0.8); parent‐only without reinforcement ‐4.3 kg (SD 2.9); control ‐0.2 kg (SD 2.1)). At the longest point of follow‐up, there was a decrease in weight in the parent‐only with reinforcement group (‐0.3 (SD 2.4)) and increases in weight in the parent‐only without reinforcement group (3.3 (SD 2.9) and the control group (4.7 (SD 3.4)).
Two trials reported the change in parental BMI (Janicke 2008; Jansen 2011). In the study by Janicke 2008, there was a decrease in parental BMI in both the parent‐only group and the waiting list control group at the post intervention follow‐up (parent‐only ‐0.9 (SD 1.6) versus waiting list control ‐0.7 (SD 2.6); P = 0.93 based on a three‐way comparison). At the longest period of follow‐up (at 10 months), there was also a decrease in parental BMI from baseline, albeit smaller (parent‐only ‐0.6 (SD 2.4) versus waiting list control ‐0.6 (SD 3.6); P = 0.17, based on a three‐way comparison). In the study by Jansen 2011, the parental BMI decreased in the parent‐only group and increased in the waiting list control group immediately post intervention (parent‐only ‐0.3 (SD 4.5) versus waiting list control 0.1 (SD 6.3)), and at the longest period of follow‐up six months post intervention (parent‐only ‐0.2 (SD 4.5) versus waiting list control 0.1 (SD 6.3)).
Adverse events
No trials reported adverse events.
Secondary outcomes
Health‐related quality of life and self esteem
No trials reported health‐related quality of life.
The study by Jansen 2011 assessed self esteem on the SPPC. This validated measure comprises of six subscales, two of which were of interest and reported by the study authors (physical appearance, global self worth). Scores for each item range from 1 to 4 with higher scores relating to poorer outcome. At the post treatment assessment (three months), the physical appearance rating from the parent‐only intervention group's children was 15.9 (SD 5) and in the waiting list control this was 16.1 (SD 4.7). Six months later, the ratings were 16 (SD 5.3) for the parent‐only group and 15.7 (SD 4.7) for the waiting list control group. There was no substantial main effect between groups (comparing both groups over both time periods). On the global self worth scale, the parent‐only intervention rating was 18.8 (SD 4.2) and the waiting list control rating was 20.3 (SD 4.2) at the three month post intervention follow‐up. At the final follow‐up, these ratings were 19 (SD 4.9) for the parent‐only group and 20.2 (SD 4.1) for the waiting list control group. There was no substantial main effect between groups (comparing both groups over both time periods).
Janicke 2008 assessed the self esteem of the children on four subscales (social self esteem, athletic self esteem, physical self esteem and global self esteem) of the SPPC measure at the end of the four‐month intervention. Results were reported for boys and girls separately. Changes from baseline were generally positive for all measures for both the parent‐only and waiting list control groups. There were no substantial differences between the groups at follow‐up.
All‐cause mortality
No trials reported all‐cause mortality.
Morbidity
No trials reported morbidity.
Measures of body fat distribution
Golley 2007 calculated the waist circumference z score. At the final follow‐up (at 12 months), the mean change in score was ‐0.3 (SD 0.5) in the parent‐only intense group, ‐0.2 (0.5) in the parent‐only group and ‐0.02 (0.6) in the waiting list control group. These reductions in waist circumference z scores were not substantially different between groups.
Behaviour change
West 2010 reported the Lifestyle Behaviour Checklist (LBC), which is a measure of child weight‐related problem behaviour and includes items on eating behaviours and physical activity, yielding scores on two scales, the LBC problem scale (lower scores indicate better outcome) and the LBC confidence scale (higher scores indicate better outcome). At the post intervention follow‐up at 12 weeks, the LBC problem scores were 59.4 (SD 20.7) in the parent‐only group and 73.8 (SD 19.3) in the waiting list control group. The LBC confidence scores were 204.4 (SD 37.5) in the parent‐only group compared with 165.8 (SD 46.4) in the waiting list control group (P < 0.0125 on both scales in favour of the parent‐only intervention).
Participants' views of the intervention
For the participants' views of the parent‐only interventions in the study by Golley 2007 see 'Parent‐only interventions versus parent‐only interventions' below.
Parent‐child relationship or assessment of parenting
The study by West 2010 reported data from the Parenting Scale, which is a validated measure of parental discipline practices. It has 30 items and parents indicate their tendencies to use specific discipline strategies using 7‐point Likert scales, where 7 indicates a high probability of making the discipline mistake and 1 indicates a high probability of using an effective, alternative discipline strategy. At the post intervention follow‐up at 12 weeks the Parenting Scale scores were 2.7 (SD 0.7) in the parent‐only group and 3.4 (SD 0.5) in the waiting list control group (P < 0.0125 in favour of the parent‐only intervention; low quality evidence).
Socioeconomic effects
No trials reported socioeconomic effects.
Parent‐only interventions versus minimal contact interventions
Seven trials reported 10 comparisons of a parent‐only intervention and a minimal contact control (Esfarjani 2013; Estabrooks 2009; Mazzeo 2014; Resnick 2009; Small 2013; Resnicow 2015; van Grieken 2013). To allow consideration of the effects of the interventions, we considered outcomes from the longest period of follow‐up and any post intervention follow‐up. The period for the post intervention follow‐up in these trials ranged from three to six months in all but two trials (12 months for van Grieken 2013; 24 months for Resnicow 2015), and the period for the longest point of follow‐up ranged from six to 12 months (one study, Esfarjani 2013, did not state the duration of follow‐up). One study had a planned six‐month follow‐up but did not report results as the loss to follow‐up was high (Mazzeo 2014, 68% to 73% loss to follow‐up). Two trials did not report a period of follow‐up beyond the end of the intervention (Resnick 2009; Resnicow 2015). Losses to follow‐up in the included trials ranged from 0% to 34% at the post intervention follow‐up and were between 17% and 38% at the longest period of follow‐up (see Table 1). These need to be considered when interpreting the results of the trials below.
Primary outcomes
Changes in body mass index and body weight
Six trials (eight comparisons) reported BMI variables at follow‐up post intervention. In one study (two comparisons), this was the BMI z score (Estabrooks 2009), and in the remaining trials, this was the BMI percentile (Mazzeo 2014; Resnick 2009; Resnicow 2015; Small 2013) or BMI (Esfarjani 2013). The period for the outcome assessment differed between trials (Esfarjani 2013 at six months; Estabrooks 2009 at 12 to 24 weeks; Mazzeo 2014 at 12 weeks; Resnick 2009 at 18 to 30 weeks; Resnicow 2015 at 24 months; Small 2013 at 17 weeks).
Meta‐analysis for change in BMI z score between the parent‐only groups and the control group showed an MD of ‐0.00 ((95% CI ‐0.08 to 0.08); P = 0.99; 170 participants; 1 trial with 3 treatment arms; low quality evidence). There was a high risk of attrition bias and reporting bias for Estabrooks 2009 and we imputed SDs.
Four trials reported the change in BMI percentile; however, because of lack of standardisation these could not be pooled. None of the studies demonstrated treatment effects (Analysis 3.3).
For BMI change from the trial by Esfarjani 2013, there was no difference between comparison groups (Analysis 3.5).
At the longest point of follow‐up, four trials (five comparisons) reported BMI variables. In one trial (two comparisons, Estabrooks 2009), this was the BMI z score, in one trial this was the BMI percentile (Small 2013), and in the remaining two trials this was the BMI (Esfarjani 2013; van Grieken 2013). The duration of follow‐up varied, in the study by Estabrooks 2009 and Small 2013, this was six months after the end of the intervention; the study by Esfarjani 2013 did not report the duration of follow‐up after the six month intervention; in the study by van Grieken 2013, follow‐up was at 24 months following an intervention of up to 12 months.
Meta‐analysis for the change in BMI z score comparing the parent‐only group with the minimal contact control group showed a MD of 0.01 ((95% CI ‐0.07 to 0.09); P = 0.81; 165 participants; 1 trial with 3 treatment arms; low quality evidence; Analysis 3.2).
The one study reporting BMI percentile found no a substantial treatment effect on BMI percentile change (MD ‐0.93 (95% CI ‐3.49 to 1.63); Analysis 3.4).
Meta‐analysis for change from baseline BMI showed an MD of ‐0.12 ((95% CI ‐0.39 to 0.15); P = 0.39; 614 participants; 2 trials; low quality evidence; Analysis 3.6) (Esfarjani 2013; van Grieken 2013). In the cluster trial, the study authors calculated an intra‐cluster correlation coefficient of 0.06 for BMI and the numbers analysed appear to have been adjusted appropriately (van Grieken 2013). All of these trials had high loss to follow‐up, which should be considered when interpreting these results.
No trials reported the parental BMI.
In the study by Esfarjani 2013, weight in kilograms was also reported as an outcome. The change from baseline weight at the end of the six‐month intervention was 1.8 kg (SD 4.9) in the parent‐only group and 2.6 kg (SD 5) in the control group, giving a difference of 0.8 kg (95% CI ‐2.67 to 1.1). At the longest point of follow‐up (not defined), the weight change for the two groups were 5 kg (SD 5.1) for the parent‐only group and 5.7 kg (SD 5.17) for the control group (difference 0.7 kg (95% CI ‐2.6 to 1.2).
Adverse events
No trials reported adverse events.
Secondary outcomes
Health‐related quality of life and self esteem
One study reported narratively that there were no improvements in health‐related quality of life but reported no data (Mazzeo 2014).
No trials reported self esteem.
All‐cause mortality
No trials reported all‐cause mortality.
Morbidity
No trials reported morbidity.
Measures of body fat distribution
Small 2013 reported waist and waist‐to‐height ratio. At the post intervention assessment (three months), waist circumference was 28.2 inches (SD 3.8) in the parent‐only intervention compared with 28.4 inches (SD 3.7) in the control group (1 inch = 2.5 cm). At the final assessment (six months later), the waist circumference in the parent‐only group was 29.5 inches (SD 3.5) compared with 28.9 inches (3.7) in the control group. The waist‐to‐height ratio at three months was 0.58 (SD 0.08) in the parent‐only group and 0.60 (SD 0.06) in the control group. The corresponding values at six‐month follow‐up were 0.59 (SD 0.09) in the parent‐only group and 0.59 (SD 0.08) in the control group. The trial reported that these results were not statistically significant between groups. The study by Esfarjani 2013 reported waist circumference. The change from baseline waist circumference at the end of the six‐month intervention was ‐1.0 cm (SD 5.8) in the parent‐only group and 1.5 cm (SD 5.1) in the control group, with a difference of 2.5 cm (95% CI ‐4.6 to ‐0.4). At the longest point of follow‐up (not defined), the changes in waist circumference were 2 cm (SD 5.8) in the parent‐only group and 3.5 cm (SD 5.28) in the control group, with a difference of 1.5 cm (95% CI ‐3.6 to 0.6). van Grieken 2013 also reported waist circumference at 24‐month follow‐up. In the parent‐only group the change in waist circumference was 7.2 cm (SD 5.5) compared with 7.3 cm (SD 5.3) in the control group, with a difference of 0.1 cm (95% CI ‐1.1 to 0.8).
Esfarjani 2013 reported hip circumference. There was a change in hip circumference in the parent‐only group at the end of the intervention of ‐0.5 cm (SD 4.9) compared with 1.4 cm (SD 4.9) in the control group, with a difference of 1.9 cm (95% CI ‐3.8 to ‐0.1). At the longest point of follow‐up (not defined), the change in hip circumference was 2.1 cm (SD 4.8) in the parent‐only group and 3.7 cm (SD 5.1) in the control group, with a difference of 1.6 cm (95% CI ‐3.5 to 0.2).
Behaviour change
No trials reported validated measures assessing behaviour change.
Participants' views of the intervention
The study by Mazzeo 2014 sought parental views at completion of the parent‐only intervention. Parents either strongly agreed (79%) or moderately agreed (21%) with the statement "I enjoyed attending each NOURISH session." In addition, 92% strongly agreed that they would recommend the intervention to other parents, 91% strongly or moderately agreed that the sessions had helped them eat in a healthier manner and 78% said they were exercising more. The study also reported examples of qualitative responses received from parents in interviews, both positive and negative (e.g. "I really enjoyed them and hearing what other parents concerns were like mine" and "I was excited at first but once it started, it was sometimes difficult to get there, park, and stay focused for 90 min after working all day").
Resnick 2009 asked parents a questions about the materials used and both groups appeared to be satisfied with the materials. Of 20 parents in the parent‐only group, 13 (65%) reported reading all the study materials, the corresponding rate in the control group was 17/22 (77%). Some 17 (94%) parents in the parent‐only group and 18 (82%) of parents in the control group stated that they would recommend the programme to other families. The parents in the intervention group were also asked if they found the community health workers to be helpful and 16/20 (80%) stated "yes". The trial authors reported responses to other questions.
Parent‐child relationship or assessment of parenting
Mazzeo 2014 reported parental concern about the child's weight. This was one of seven subscales of the Child Feeding Questionnaire (results of other subscales were not reported). Parental concern decreased from 4.7 (SD 0.5) to 4.6 (SD 0.7) in the parent‐only group and from 4.7 (SD 0.5) to 4.7 (SD 0.5) in the control group at the follow‐up immediately following the 12‐week intervention (P = 0.041 in favour of the parent‐only intervention; 93 participants; 1 trial; low quality evidence).
Socioeconomic effects
No trials reported socioeconomic effects.
Parent‐only interventions versus parent‐only interventions
Seven trials reported nine comparisons of two different parent‐only interventions (Aragona 1975; Estabrooks 2009; Golley 2007; Magarey 2011; Raynor 2012a; Raynor 2012b; Resnicow 2015). The point of post intervention follow‐up was three months in one study (Aragona 1975); six months in five studies (Estabrooks 2009; Golley 2007; Magarey 2011; Raynor 2012a; Raynor 2012b); and 24 months in one study (Resnicow 2015). The longest points of follow‐up ranged from 12 to 24 months (all trials except Magarey 2011 had a 12‐month follow‐up, Resnicow 2015 only had one period of follow‐up at the end of the intervention). Losses to follow‐up in the included trials ranged from 3% to 40% at the post intervention follow‐up and were between 8% and 60% at the longest period of follow‐up (see Table 1). These need to be considered when interpreting the results of the trials.
Primary outcomes
Changes in body mass index and body weight
Five trials reported BMI z score and Analysis 4.1 and Analysis 4.2 show the change from baseline for each study. No meta‐analysis was possible because there was little or no consistency between trial interventions and comparators. A narrative synthesis of the results of the trials follows.
The study by Estabrooks 2009 (a three‐arm trial, see above for other comparisons) compared two parent‐only interventions. Parents either attended a group intervention that addressed behavioural health skills and knowledge or a group intervention that addressed the same issues but also included 10 automated telephone counselling sessions over a period of six months. Both groups also utilised a workbook aimed at promoting healthy habits and physical activity throughout the interventions. Change in BMI z score at the immediate follow‐up at six months showed an MD of ‐0.04 ((95% CI ‐0.16 to 0.08); P = 0.51) and at the follow‐up 12 months later an MD of ‐0.06 ((95% CI ‐0.18 to 0.06); P = 0.34). Losses to follow‐up were above 20% in both groups at both time points.
In a three‐arm study, Golley 2007 had two parent‐only interventions: parents either attended a behavioural change parenting skills training intervention or the same intervention with seven additional intensive lifestyle support group sessions. At six months, BMI z score change showed a MD of ‐0.09 ((95% CI ‐0.38 to 0.20); P = 0.54) where there was a 24% drop‐out rate in both groups at this time point. Similarly, at 12 months' follow‐up, the MD was ‐0.09 ((95% CI ‐0.32 to 0.14); P = 0.44). The non‐completion rate at this point of follow‐up was 18% in the intensive group and 22% in the standard group intervention.
Magarey 2011 compared two parent‐only interventions, a healthy lifestyle group (which included recommendations, practical skills and monitoring aspects) and a group that had the same healthy lifestyle intervention with the addition of four parenting skills sessions. BMI z score change at the completion of the intervention at six months showed an MD of ‐0.07 ((95% CI ‐0.29 to 0.15); P = 0.54) and at the 24‐month follow‐up, an MD of 0.03 ((95% CI ‐0.24 to 0.30); P = 0.82). Non‐completion rates in this study were between 17% and 22% at the post intervention follow‐up and 36% and 39% at the 24‐month follow‐up.
One publication reported two trials and each trial had three arms, a standard arm that was a growth monitoring intervention and two additional parent‐only interventions. In the first trial, the two additional interventions focused on diet, with one intervention focusing on decreasing sugar and salty snack food and drink consumption and the second intervention focusing on increasing fruit, vegetable and low‐fat dairy intake (Raynor 2012a). In the second trial, the two additional interventions focused on diet and physical activity, with one intervention focusing on decreasing sugar intake and increasing physical activity and the second intervention focusing on increasing low‐fat intake and decreasing sedentary lifestyles such as watching television (Raynor 2012b). The completion rates in these trials were better than the other trials, with between 3% and 12% of participants not completing the study. At the point of completion of the intervention (six months) in the Raynor 2012a trial, the difference in BMI z score change between the growth monitoring group and the group focusing on decreasing sugar consumption was ‐0.04 ((95% CI ‐0.17 to 0.09); P = 0.53; data provided by study authors). The difference between the growth monitoring group and the group focusing on increasing healthy food consumption was ‐0.01 ((95% CI ‐0.14 to 0.12); P = 0.88; data provided by study authors). Similar results were also seen at 12 months in the decreasing sugar group with an MD of ‐0.04 ((95% CI ‐0.19 to 0.11); P = 0.61), and in the increasing healthy food group with an MD of ‐0.02 ((95% CI ‐0.17 to 0.13); P = 0.80) (data provided by study authors). At the point of completion of the Raynor 2012b trial, BMI z score change between the group focusing on increasing activity compared with the growth monitoring group was ‐0.69 ((95% CI ‐0.83 to ‐0.55); P < 0.00001; data provided by study authors). The difference between the group focusing on reducing sedentary behaviours compared with the growth monitoring group was ‐0.70 (( 95% CI ‐0.86 to ‐0.54); P < 0.00001; data provided by study authors). At 12 months, there was a different pattern, with neither comparisons showing substantial differences between groups: increasing activity group MD 0.01 ((95% CI ‐0.17 to 0.19); P = 0.92) and decreasing sedentary behaviours group MD ‐0.03 ((95% CI ‐0.24 to 0.18); P = 0.78) (data provided by study authors).
Aragona 1975 reported the weight and height of individual participants and mean BMI was calculated from these data. Both parent‐only interventions included training in nutrition, exercise and behaviour, and parents contracted to the investigators regarding a weight loss goal for their child. One intervention also taught reinforcement techniques. Immediately after the intervention, and at the longest point of follow‐up, there were no substantial differences in change from baseline BMI seen (Analysis 4.3; Analysis 4.4).
The study by Resnicow 2015 reported the BMI percentile at the end of the 24‐month intervention. There were no differences between the two parent‐only interventions (Analysis 4.5).
Adverse events
The trials by Raynor 2012a; Raynor 2012b reported narratively that there were no serious adverse events.
Secondary outcomes
Health‐related quality of life and self esteem
No trials reported health‐related quality of life or self esteem.
All‐cause mortality
No trials reported all‐cause mortality.
Morbidity
No trials reported morbidity.
Measures of body fat distribution
Golley 2007 calculated waist circumference z score. At the post intervention follow‐up (six months), the mean change in waist z score was ‐0.27 (SD 0.7) in the parent‐only intense group and ‐0.12 (SD 0.61) in the parent‐only group. These reductions in waist circumference z scores were not significantly different between groups. At the final follow‐up (at 12 months), the mean change in score was ‐0.31 (SD 0.53) in the parent‐only intense group and ‐0.17 (0.50) in the parent‐only group. These reductions in waist circumference z scores were not statistically significantly different between groups.
Behaviour change
No trials reported behaviour changes.
Participants' views of the intervention
Golley 2007 reported a programme evaluation. Response rates varied, with 26/31 in the parenting and intensive lifestyle group responding and 10/29 in the parenting group responding. All participants in both groups rated the quality of the service provided during the interventions as good to excellent. Fifty per cent (13/26) of participants in the parenting and intensive lifestyle training group and 80% (8/10) in the parent‐only group said they either generally or definitely received the type of help they required from the respective programme. One hundred per cent of parents in the parenting group and 85% (22/26) in the parenting and intensive lifestyle group stated they were satisfied to very satisfied with the amount of help received. One hundred per cent of parents in the parenting group and 92% (24/26) in the parenting and intensive lifestyle group stated they were helped somewhat or helped a great deal by the intervention. The study authors provided other responses.
Parent‐child relationship or assessment of parenting
One study reported results from the Alabama Parenting Questionnaire (satisfaction, efficacy, involvement, positive parenting, poor monitoring, inconsistent discipline, corporal punishment), which is a validated measure (Magarey 2011). However, outcomes were reported only for the total group, and no comparisons between the two treatment groups were provided.
Socioeconomic effects
No trials reported socioeconomic effects.
Subgroup analyses
We did not perform subgroups analyses because there were not enough trials to estimate effects in various subgroups.
Sensitivity analyses
We did not perform any sensitivity analyses because there were not enough trials included in the analyses.
Assessment of reporting bias
We did not draw funnel plots due to limited number of trials with data included in any one analysis.
Ongoing trials
We found 10 ongoing RCTs (see Characteristics of ongoing studies table). Nine of these RCTs are parallel trials, one is a cluster trial. The ages of the participants in these trials incorporate the range of 2 to 6 years in six trials, 7 to 13 years in two trials and were not reported in three trials. In five trials, the target population are children classed as overweight (various definitions), in two trials the target population are children classed as obese, and in four trials the population is described as overweight or obese. Five trials are comparing a parent‐only intervention with another parent‐only intervention; three trials are comparing a parent‐only intervention with a parent‐child intervention; three trials are comparing a parent‐only intervention with a minimal contact intervention and one trial is comparing a parent‐only intervention to no treatment. The primary outcome is the BMI z score in nine of the 10 ongoing trials; in the one other trial, this is weight change. The estimated study completion dates, where reported, range from January 2014 to November 2016.
Discusión
Resumen de los resultados principales
Esta revisión sistemática resumió 20 ECA que examinaron el efecto de las intervenciones sólo en padres para tratar el sobrepeso y la obesidad en niños de cinco a 11 años de edad. Solamente se incluyeron los ensayos con al menos una evaluación de resultado a los seis meses con la intención de evaluar los efectos a más largo plazo de estos tipos de intervenciones. Las intervenciones y los comparadores variaron entre los ensayos incluidos y los ensayos se dividieron en cuatro grupos principales para facilitar la interpretación. Los resultados evaluados también variaron entre los grupos; Aunque todos los ensayos informaron una medida de peso corporal, varió entre el IMC, la puntuación z del IMC, el percentilo del IMC y el peso. Muchos ensayos fueron de calidad deficiente, las tasas de no finalización de los ensayos fueron generalmente altas y pocos ensayos tomaron estos aspectos en cuenta en sus análisis. Para permitir comparaciones entre los ensayos se analizaron los datos de resultado, cuando se informaron, de la evaluación posintervención y del período más largo de seguimiento.
En general, en los ensayos que compararon una intervención sólo en padres con una intervención en padres e hijos no hubo diferencias significativas en las medidas del IMC al seguimiento posintervención o en el período de seguimiento más largo. Otros resultados, informados de manera menos consistente en los ensayos, tampoco informaron en general diferencias significativas entre los grupos, que incluyen el IMC de los padres, los cambios conductuales y la calidad de vida relacionada con la salud. Un estudio realizó una evaluación del proceso, en el que las respuestas de los padres acerca de realizar el programa nuevamente fueron similares entre los grupos. En los ensayos que compararon una intervención sólo en padres con un control en lista de espera, hubo un efecto del tratamiento sobre el IMC que favoreció a la intervención sólo en padres al seguimiento posintervención y al período de seguimiento más largo (pruebas de baja calidad). No hubo efectos significativos de la intervención sólo en padres sobre el IMC de los padres o la autoestima del niño. Un ensayo informó mejores resultados en el grupo sólo en padres en una medida de cambio conductual y en una medida de prácticas de disciplina en la crianza (pruebas de baja calidad). No hubo efectos significativos de las intervenciones sólo en padres sobre el IMC o el peso en comparación con las intervenciones control de contacto mínimo. Un ensayo encontró una reducción en los niveles de inquietud de los padres en el grupo sólo en padres. Dos ensayos informaron evaluaciones del proceso y las intervenciones recibieron en general calificaciones más altas por parte los que respondieron en el grupo sólo en padres que en el grupo control. Algunos ensayos compararon una intervención sólo en padres con otra intervención sólo en padres. Para cumplir los criterios de inclusión para la revisión, se requería que las comparaciones sólo en padres fueran un tratamiento concomitante administrado en el brazo de intervención. Hubo pocas semejanzas entre las intervenciones y los comparadores en los ensayos incluidos. En general, estos ensayos no mostraron diferencias significativas entre sus grupos respectivos de sólo en padres en los diversos resultados informados.
Todos los resultados se deben interpretar con cuidado debido a la baja calidad de estos ensayos y a las diferencias entre las intervenciones y los comparadores.
Compleción y aplicabilidad general de las pruebas
Esta revisión solamente incluyó ensayos que informaron resultados a los seis meses o más; sin embargo, dentro de los ensayos individuales hubo considerable heterogeneidad con la duración de las intervenciones, y sus seguimientos respectivos variaron considerablemente. En pocos ensayos las características de la intervención fueron similares y, junto con la mezcla de resultados evaluados y observados, fue difícil establecer si algún tipo de intervención concreta tiene mayores probabilidades de dar lugar a un resultado exitoso. La intención fue explorar la repercusión del tipo de intervención sólo en padres (p.ej. centrado en la crianza, terapia cognitivo‐conductual, cambio conductual) y el contexto (p.ej. en la comunidad, en el consultorio, mediante internet) para determinar si algún enfoque específico fue más efectivo para el tratamiento del sobrepeso y la obesidad en la niñez. A pesar del número relativamente grande de ensayos incluidos en la revisión, la marcada heterogeneidad clínica hizo que no fuera posible dicha exploración. Pocos ensayos proporcionaron suficientes detalles de la intervención que permitieran que otros investigadores la replicaran (duración, tipo, naturaleza de las sesiones, tamaños de los grupos, contenidos, entrenamiento del profesional o base teórica para la intervención). Pocos ensayos informaron resultados durante un período relativamente largo de seguimiento (p.ej. durante dos años).
Los resultados parecieron indicar que las intervenciones sólo en padres son similares a las intervenciones en padres e hijos y las intervenciones de contacto mínimo, pero que son mejores que un control en lista de espera. Sin embargo, hay numerosos aspectos a considerar, los más importantes los tamaños de la muestra de muchos ensayos, la pérdidas durante el seguimiento y las pruebas de baja calidad.
No hubo un número suficiente de ensayos que informaran los resultados secundarios de interés para la revisión y solamente fue posible agrupar el IMC en los metanálisis.
Calidad de la evidencia
La calidad de los ensayos fue generalmente baja, y una gran parte de los ensayos se calificaron como con alto riesgo de sesgo por los criterios individuales de riesgo de sesgo, y muchos otros se calificaron como con riesgo incierto de sesgo. La evaluación con GRADE de los resultados que se agruparon en esta revisión ha dado lugar a que se disminuya la calidad de los ensayos por el riesgo de sesgo (en particular el sesgo de desgaste), así como por la imprecisión debido al número pequeño de ensayos y los tamaños de la muestra pequeños. Lo anterior dificulta la interpretación general de los datos.
Sesgos potenciales en el proceso de revisión
Se realizó una búsqueda exhaustiva a través de las bases de datos principales de las intervenciones que incluyeran intervenciones sólo en padres. Además, se examinaron las listas de referencias de revisiones sistemáticas. Dos revisores seleccionaron y evaluaron de forma exhaustiva los ensayos, extrajeron los datos y evaluaron la calidad de los ensayos para inclusión para disminuir los posibles sesgos en los procesos de revisión. No se tomaron decisiones acerca del análisis o la investigación de la heterogeneidad después de ver los datos. Cuando faltaron datos relevantes que permitieran la evaluación de la elegibilidad o en el estadio de extracción de datos, los revisores establecieron contacto con los autores de los estudios en busca de información adicional. Se incluyeron grupos múltiples en siete de los estudios incluidos y para los análisis el grupo compartido se dividió en dos o más grupos con tamaños de la muestra más pequeños. Este enfoque solamente resuelve parcialmente el error de la unidad de análisis, ya que las comparaciones resultantes aún están correlacionadas. Tres ensayos están en espera de clasificación porque actualmente no hay información disponible para la revisión.
Acuerdos y desacuerdos con otros estudios o revisiones
Las guías del National Institute for Health and Care Excellence (NICE) recalcan la importancia del apoyo de los padres en los servicios de control del peso para los niños y jóvenes con menos de 18 años de edad (NICE 2013). Sin embargo, no se mencionan específicamente las intervenciones sólo en padres, y en su lugar se recomiendan las intervenciones basadas en la familia. Los resultados son consistentes con un metanálisis anterior que comparó intervenciones sólo en padres con intervenciones en padres e hijos (centradas en la familia), que no mostró diferencias significativas en el cambio en la puntuación z del IMC entre los grupos (Jull 2013). Los resultados también coinciden con otra revisión sistemática que indica que las intervenciones sólo en padres fueron al menos tan efectivas como las intervenciones en padres e hijos, aunque mostró un mayor abandono en las intervenciones sólo en padres (Ewald 2014). Jang 2015 también consideró las intervenciones sólo en padres en una revisión sistemática que utilizó el marco RE‐AIM (Reach Effectiveness Adoption Implementation Maintenance) para analizar el alcance, la adopción, la implementación, la eficacia / efectividad y el mantenimiento. Estos autores también apoyan la efectividad de las intervenciones sólo en padres para mejorar el IMC de los niños, pero las intervenciones no parecieron alcanzar a las poblaciones de mayor riesgo. La presente revisión sistemática, hasta donde se conoce, es la primera en analizar las intervenciones sólo en padres por grupo de comparación, comparadas con intervenciones en padres e hijos, con intervenciones en lista de espera y con contacto mínimo y con diferentes intervenciones sólo en padres.
Risk of bias graph: review authors' judgements about each risk of bias item presented as percentages across all included studies (blank cells indicate that the particular outcome was not investigated in some studies).
Risk of bias summary: review authors' judgements about each risk of bias item for each included study (blank cells indicate that the study did not report that particular outcome).

Comparison 1 Parent‐only interventions versus parent‐child interventions, Outcome 1 BMI z score change post intervention.
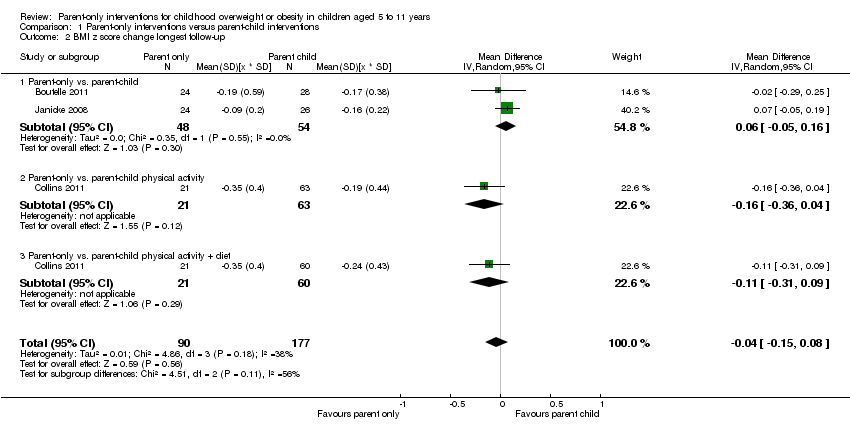
Comparison 1 Parent‐only interventions versus parent‐child interventions, Outcome 2 BMI z score change longest follow‐up.
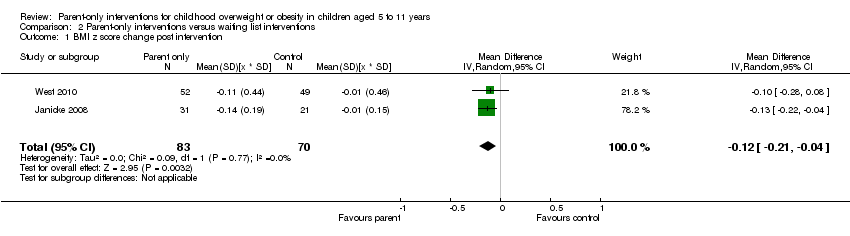
Comparison 2 Parent‐only interventions versus waiting list interventions, Outcome 1 BMI z score change post intervention.

Comparison 2 Parent‐only interventions versus waiting list interventions, Outcome 2 BMI z score change longest follow‐up.

Comparison 2 Parent‐only interventions versus waiting list interventions, Outcome 3 BMI percentile change post intervention.
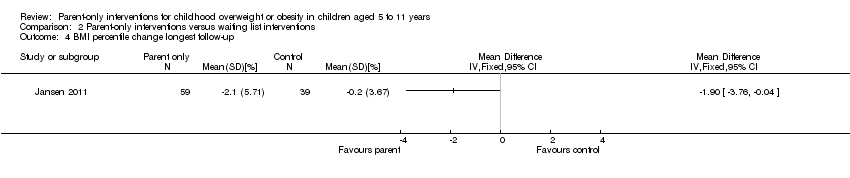
Comparison 2 Parent‐only interventions versus waiting list interventions, Outcome 4 BMI percentile change longest follow‐up.

Comparison 2 Parent‐only interventions versus waiting list interventions, Outcome 5 BMI change post intervention.
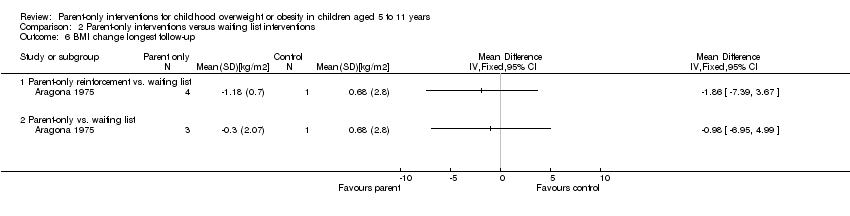
Comparison 2 Parent‐only interventions versus waiting list interventions, Outcome 6 BMI change longest follow‐up.
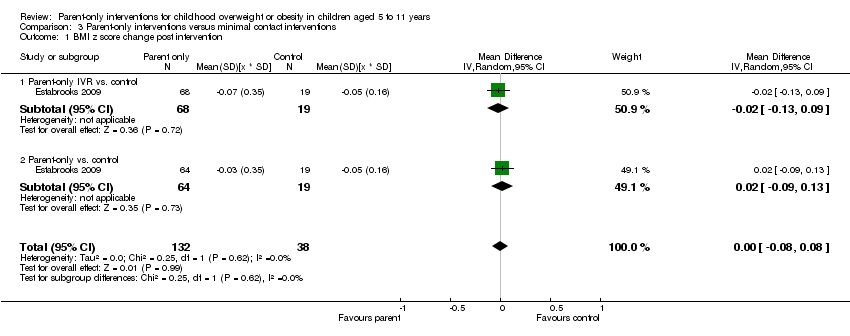
Comparison 3 Parent‐only interventions versus minimal contact interventions, Outcome 1 BMI z score change post intervention.

Comparison 3 Parent‐only interventions versus minimal contact interventions, Outcome 2 BMI z score change longest follow‐up.

Comparison 3 Parent‐only interventions versus minimal contact interventions, Outcome 3 BMI percentile change post intervention.
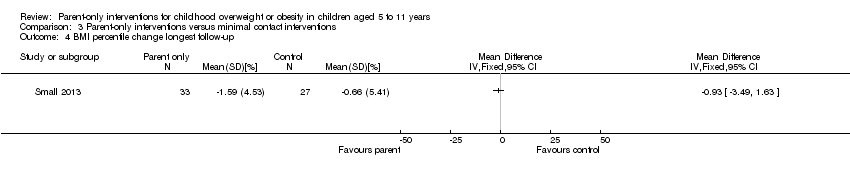
Comparison 3 Parent‐only interventions versus minimal contact interventions, Outcome 4 BMI percentile change longest follow‐up.

Comparison 3 Parent‐only interventions versus minimal contact interventions, Outcome 5 BMI change post intervention.
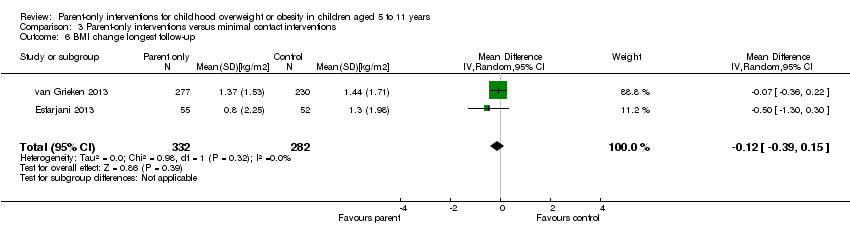
Comparison 3 Parent‐only interventions versus minimal contact interventions, Outcome 6 BMI change longest follow‐up.

Comparison 4 Parent‐only intervention versus parent‐only intervention, Outcome 1 BMI z score change post intervention.
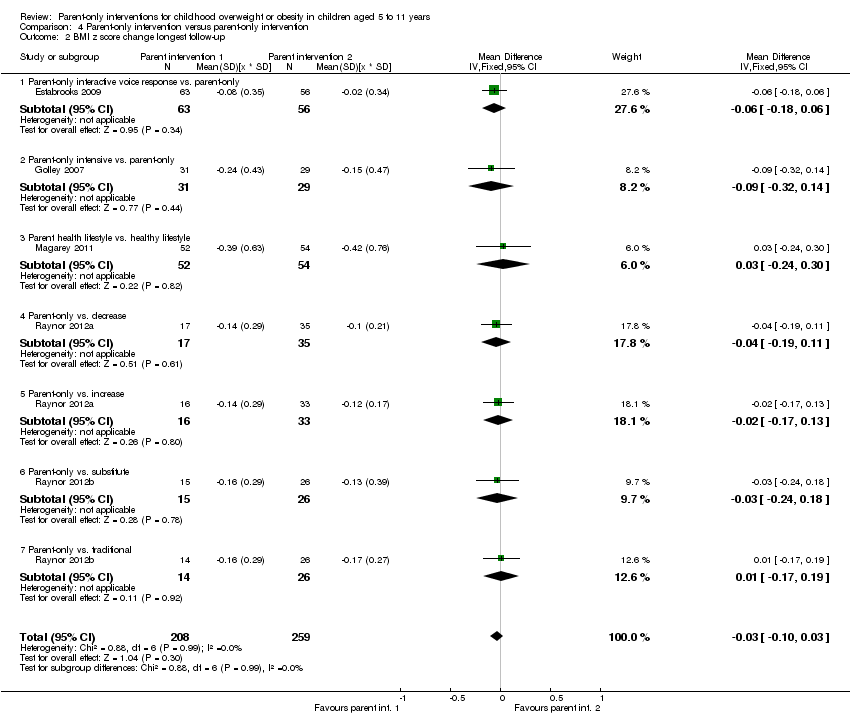
Comparison 4 Parent‐only intervention versus parent‐only intervention, Outcome 2 BMI z score change longest follow‐up.

Comparison 4 Parent‐only intervention versus parent‐only intervention, Outcome 3 BMI change post intervention.

Comparison 4 Parent‐only intervention versus parent‐only intervention, Outcome 4 BMI change longest follow‐up.
![Comparison 4 Parent‐only intervention versus parent‐only intervention, Outcome 5 BMI percentile change post intervention [%].](/cdsr/doi/10.1002/14651858.CD012008/media/CDSR/CD012008/image_n/nCD012008-CMP-004-05.png)
Comparison 4 Parent‐only intervention versus parent‐only intervention, Outcome 5 BMI percentile change post intervention [%].
| Parent‐only interventions vs. parent‐child interventions for childhood overweight or obesity | ||||||
| Population: children with overweight or obesity Settings: outpatients; community/university Intervention: parent‐only interventions Comparison: parent‐child interventions | ||||||
| Outcomes | Parent‐child | Parent‐only | Relative effect | No of participants | Quality of the evidence | Comments |
| BMI z score change (x * SD) Follow‐up: 40‐104 weeks | The mean BMI z score change ranged across control groups from ‐0.16 to ‐0.24 | The mean BMI z score change in the intervention groups was 0.04 lower (0.15 lower to 0.08 higher) | ‐ | 267 (3) | ⊕⊕⊝⊝ | Lower scores indicate improved weight loss |
| Adverse events | See comment | See comment | See comment | See comment | See comment | No trials reported adverse events |
| Health‐related quality of life | See comment | See comment | See comment | See comment | See comment | No trials reported health‐related quality of life |
| All‐cause mortality | See comment | See comment | See comment | See comment | See comment | No trials reported all‐cause mortality |
| Morbidity | See comment | See comment | See comment | See comment | See comment | No trials reported morbidity |
| Parent‐child relationship or assessment of parenting | See comment | See comment | See comment | See comment | See comment | No trials reported outcomes assessing parent‐child relationships or an assessment of parenting |
| Socioeconomic effects | See comment | See comment | See comment | See comment | See comment | No trials reported socioeconomic effects |
| *The basis for the assumed risk (e.g. the median control group risk across trials) is provided in footnotes. The corresponding risk (and its 95% confidence interval) is based on the assumed risk in the comparison group and the relative effect of the intervention (and its 95% CI). GRADE Working Group grades of evidence | ||||||
| "A BMI z score or standard deviation score indicates how many units (of the standard deviation) a child's BMI is above or below the average BMI value for their age group and sex. For instance, a z score of 1.5 indicates that a child' is 1.5 standard deviations above the average value, and a z score of ‐1.5 indicates a child is 1.5 standard deviations below the average value" (Noo NHS 2011). aDowngraded by one level because of serious risk of attrition bias and one level for serious imprecision (see Appendix 9). | ||||||
| Parent‐only interventions vs. waiting list control for childhood overweight or obesity | ||||||
| Population: children with overweight or obesity Settings: outpatients; community Intervention: parent‐only interventions Comparison: waiting list control | ||||||
| Outcomes | Waiting list | Parent‐only | Relative effect | No of participants | Quality of the evidence | Comments |
| BMI z score change (x * SD) Follow‐up: 40‐48 weeks | The mean BMI z score change ranged across control groups from ‐0.13 to 0.02 | The mean BMI z score change in the intervention groups was 0.1 lower (0.19 lower to 0.01 lower) | ‐ | 136 (2) | ⊕⊕⊝⊝ | Lower scores indicate improved weight loss |
| Adverse events | See comment | See comment | See comment | See comment | See comment | No trials reported adverse events |
| Health‐related quality of life | See comment | See comment | See comment | See comment | See comment | No trials reported health‐related quality of life |
| All‐cause mortality | See comment | See comment | See comment | See comment | See comment | No trials reported all‐cause mortality |
| Morbidity | See comment | See comment | See comment | See comment | See comment | No trials reported morbidity |
| Parent‐child relationship or assessment of parenting (parenting scale (PS), 30 items, scored from 1 to 7; lower scores indicate more effective parental discipline practices) Follow‐up: 12 weeks | The mean PS score for the control group was 3.4 | The mean PS score in the intervention group was 0.6 points lower | ‐ | 101 (1) | ⊕⊕⊝⊝ | ‐ |
| Socioeconomic effects | See comment | See comment | See comment | See comment | See comment | No trials reported socioeconomic effects |
| *The basis for the assumed risk (e.g. the median control group risk across trials) is provided in footnotes. The corresponding risk (and its 95% confidence interval) is based on the assumed risk in the comparison group and the relative effect of the intervention (and its 95% CI). GRADE Working Group grades of evidence | ||||||
| "A BMI z score or standard deviation score indicates how many units (of the standard deviation) a child's BMI is above or below the average BMI value for their age group and sex. For instance, a z score of 1.5 indicates that a child' is 1.5 standard deviations above the average value, and a z score of ‐1.5 indicates a child is 1.5 standard deviations below the average value" (Noo NHS 2011). aDowngraded by one level because of serious risk of attrition bias and one level for serious imprecision (see Appendix 9). | ||||||
| Parent‐only interventions vs. minimal contact control for childhood overweight or obesity | ||||||
| Population: children with overweight or obesity Settings: outpatients Intervention: parent‐only interventions Comparison: minimal contact control | ||||||
| Outcomes | Minimal contact | Parent‐only | Relative effect | No of participants | Quality of the evidence | Comments |
| BMI z score change (x * SD) Follow‐up: 52 weeks | The mean BMI z score change ranged across control groups from ‐0.06 to ‐0.06 | The mean BMI z score change in the intervention group was 0.01 lower (‐0.07 lower to 0.09 higher) | ‐ | 165 (1) | ⊕⊕⊝⊝ | Lower scores indicate improved weight loss |
| Adverse events | See comment | See comment | See comment | See comment | See comment | No trials reported adverse events |
| Health‐related quality of life (Pediatric Health‐Related Quality of Life, scale from 0 to 100; higher scores indicate better HRQoL) Follow‐up: 24 weeks) | See comment | See comment | See comment | 93 (1) | See comment | No data were presented ('"no improvements in health‐related quality of life") |
| All‐cause mortality | See comment | See comment | See comment | See comment | See comment | No trials reported all‐cause mortality |
| Morbidity | See comment | See comment | See comment | See comment | See comment | No trials reported morbidity |
| Parent‐child relationship or assessment of parenting (Child Feeding Questionnaire subscale parental concern (total of 7 subscales), score range 3‐15; higher scores indicate greater parental concern) Follow‐up: 12 weeks | The mean parent concern score was 4.7 in the control group | The mean parent concern score in the intervention group was 0.1 lower. | ‐ | 93 (1) | ⊕⊕⊝⊝ | ‐ |
| Socioeconomic effects | See comment | See comment | See comment | See comment | See comment | No trials reported socioeconomic effects |
| *The basis for the assumed risk (e.g. the median control group risk across trials) is provided in footnotes. The corresponding risk (and its 95% confidence interval) is based on the assumed risk in the comparison group and the relative effect of the intervention (and its 95% CI). GRADE Working Group grades of evidence | ||||||
| "A BMI z score or standard deviation score indicates how many units (of the standard deviation) a child's BMI is above or below the average BMI value for their age group and sex. For instance, a z score of 1.5 indicates that a child' is 1.5 standard deviations above the average value, and a z score of ‐1.5 indicates a child is 1.5 standard deviations below the average value" (Noo NHS 2011). aDowngraded by one level because of serious risk of attrition bias and one level for serious imprecision (see Appendix 9). | ||||||
| Parent‐only interventions vs. parent‐only interventions for childhood overweight or obesity | ||||||
| Population: children with overweight or obesity Settings: outpatients; university + primary care Intervention: parent‐only interventions Comparison: parent‐only interventions | ||||||
| Outcomes | Parent‐only | Parent‐only | Relative effect | No of participants | Quality of the evidence | Comments |
| BMI z score change (x * SD) Follow‐up: 12‐24 months | See comment | See comment | See comment | 467 (5) | ⊕⊕⊝⊝ | No meta‐analysis because of little consistency between trial interventions and comparators; there were no substantial differences between different parent‐only interventions |
| Adverse events | See comment | See comment | See comment | See comment | See comment | Two trials reported that there were no serious adverse events (Raynor 2012a; Raynor 2012b) |
| Health‐related quality of life | See comment | See comment | See comment | See comment | See comment | No trials reported health‐related quality of life |
| All‐cause mortality | See comment | See comment | See comment | See comment | See comment | No trials reported all‐cause mortality |
| Morbidity | See comment | See comment | See comment | See comment | See comment | No trials reported morbidity |
| Parent‐child relationship or assessment of parenting (Alabama Parenting Questionnaire, 35 items; higher scores indicate improvement) Follow‐up: 24 months | See comment | See comment | See comment | 106 (1) | See comment | 1 study assessed parent‐child relationship or assessment of parenting but there were no data for comparisons between intervention groups provided |
| Socioeconomic effects | See comment | See comment | See comment | See comment | See comment | No trials reported socioeconomic effects |
| *The basis for the assumed risk (e.g. the median control group risk across trials) is provided in footnotes. The corresponding risk (and its 95% confidence interval) is based on the assumed risk in the comparison group and the relative effect of the intervention (and its 95% CI). GRADE Working Group grades of evidence | ||||||
| "A BMI z score or standard deviation score indicates how many units (of the standard deviation) a child's BMI is above or below the average BMI value for their age group and sex. For instance, a z score of 1.5 indicates that a child' is 1.5 standard deviations above the average value, and a z score of ‐1.5 indicates a child is 1.5 standard deviations below the average value" (Noo NHS 2011). aDowngraded by one level because of serious risk of attrition bias and one level for serious imprecision (see Appendix 9) | ||||||
| Intervention(s) and comparator(s) | Sample sizea | Screened/eligible | Randomised | ITT | Analysed | Finishing trial | Randomised finishing trial | Follow‐up | |
| (20) Resnicow 2015 | I1: parent‐only PCP motivational interviewing | The study was powered to detect a 3‐point difference in BMI percentile between any pair of study groups at 2‐year follow‐up, with an assumed SD for BMI percentile between 4 and 6: power of 0.80 and 2‐tailed a of 0.05. Sample size was inflated to account for practice‐level clustering, assuming an intraclass correlation between 0.01 and 0.05. On this basis and a projected 25‐30% attrition at 2‐year follow‐up, 10‐12 practices per arm (30‐36 total) and a mean of 15‐20 children per practice at baseline were required | ‐ | 16 practices 212 participants | 145 | 145 | 145 | 68 | 2 years (2 years) |
| I2: parent‐only PCP + dietician motivational interviewing | 15 practices 235 participants | 154 | 154 | 154 | 66 | ||||
| C: usual care | 11 practices 198 participants | 158 | 158 | 158 | 80 | ||||
| total: | 645 | 457 | 457 | 457 | 71 | ||||
| (19) Mazzeo 2014 | I: parent NOURISH | ‐ | 235 | 48 | ‐ | 46 | 10 | 21 | 12 weeks post 12‐week intervention (24 weeks) |
| C: parent control | 45 | ‐ | 45 | 16 | 36 | ||||
| total: | 93 | 91 | 26 | 28 | |||||
| (18) Van Grieken 2013 | I: parent‐only | Sample size was calculated taking into account the intracluster correlation coefficient (ρ = 0.1), the number of clusters (44), the expected prevalence of overweight children in the study population, the SD, expected effect (a difference in mean), and the power of the study (80%). With a participation of 50%, an expected prevalence of overweight children of 9% and a loss‐to‐follow‐up of 30%, at least 11,301 children (and their parents) should be invited by the YHC teams to participate in the study to have a final sample of about 356 overweight children (178 in both the intervention and control group). Assuming a SD of BMI to be 1.0 kg/m2, a difference in mean BMI of 0.35 kg/m2 between the children in the intervention group and the children in the control group can be established under the assumptions mentioned above | 22 clusters 7004 participants | 349 | ‐ | 21 clusters 277 participants | 277 | 79 | 2 years post up to 12‐month intervention |
| C: usual care | 22 clusters 7004 participants | 288 | ‐ | 21 clusters 230 participants | 230 | 80 | |||
| total | 637 | ‐ | 42 (507) | 507 | 80 | ||||
| (17) Small 2013 | I: parent‐only | ‐ | ‐ | 34 | 33 | 33 | 33 | 97 | 24 weeks post 16‐week intervention (41 weeks) |
| C: parent control | 33 | 27 | 27 | 27 | 82 | ||||
| total: | 67 | 60 | 60 | 60 | 90 | ||||
| (16) Esfarjani 2013 | I: parent‐only | ‐ | 550/156 | 70 | ‐ | 55 | 58 | 83 | Intervention 6 months (not reported) |
| C: parent control | 86 | ‐ | 52 | 59 | 69 | ||||
| total: | 156 | ‐ | 107 | 117 | 75 | ||||
| (15) Moens 2012 | I: parent‐only | ‐ | 80/75 | 31 | ‐ | ‐ | 31 | 100 | Immediately following 6‐month intervention |
| C: waiting list control | 19 | ‐ | ‐ | 15 | 79 | ||||
| total: | 50 | ‐ | ‐ | 46 | 92 | ||||
| (14) Raynor 2012a | I1: parent‐only | Sample size calculations presumed 2‐sided hypothesis testing at 6‐month assessment, with type 1 error rate = 0.05. To reject with 80% power the null hypothesis of no pre‐ to post‐treatment difference between intervention conditions vs. the alternative that the pre‐ to post‐treatment difference was 0.6 or greater (effect size), 24 participants per group were needed | 549 | 33 | 33 | 33 | 29 | 88 | 24 weeks post 24‐week intervention (reported as '12 months') |
| I2: parent ‐ diet decrease | 33 | 33 | 33 | 29 | 88 | ||||
| I3: parent ‐ diet increase | 35 | 35 | 35 | 32 | 91 | ||||
| total: | 101 | 101 | 101 | 90 | 89 | ||||
| (13) Raynor 2012b | I1: parent‐only | Sample size calculations presumed 2‐sided hypothesis testing at 6‐month assessment, with type 1 error rate = 0.05. To reject with 80% power the null hypothesis of no pre‐ to post‐treatment difference between intervention conditions vs. the alternative that the pre‐ to post‐treatment difference is 0.6 or greater (effect size), 24 participants per group were needed | 549 | 29 | 29 | 29 | 26 | 90 | 24 weeks post 24‐week intervention (reported as '12 months') |
| I2: parent ‐ diet and activity traditional | 26 | 26 | 26 | 24 | 92 | ||||
| I3: parent ‐ diet and activity substitute | 26 | 26 | 26 | 24 | 92 | ||||
| total: | 81 | 81 | 81 | 74 | 91 | ||||
| (12) Margarey 2011 | I: parent healthy lifestyle | Sample size calculation was based on a reduction in BMI z score of 0.26 (SD 0.49) over 12 months (power 80%, alpha = 0.05, and drop‐out rate of 30%). This represents a 50% reduction in weight velocity over 12 months and no change in height velocity. We sought 42 children per group per site (168 children) | 398 | 85 | 85 | 85 | 52 | 61 | 80 weeks post 24‐week intervention (104 weeks) |
| C: healthy lifestyle | 84 | 84 | 84 | 54 | 64 | ||||
| total: | 169 | 169 | 169 | 106 | 63 | ||||
| (11) Jansen 2011 | I: parent CBT | ‐ | 161 | 59 | ‐ | 54 | 54 | 92 | 12 weeks post 12‐week intervention (24 weeks) |
| C: waiting list control | 39 | ‐ | 34 | 34 | 87 | ||||
| total: | 98 | 88 | 88 | 90 | |||||
| (10) Collins 2011 | I: parent‐only ‐ diet | Power: 80% chance of detecting significance (2‐sided 5% level), with a 0.26 BMI z score difference from baseline to 12 months as the initial end point, with an anticipated loss to follow‐up of 20% | 505/319 | 63 | ‐ | 42 | 22 | 35 | 80 weeks post 24‐week intervention (104 weeks) |
| C1: parent‐child (physical activity) | 73 | ‐ | 63 | 35 | 48 | ||||
| C2: parent‐child (physical activity + diet) | 70 | ‐ | 60 | 36 | 51 | ||||
| total: | 206 | ‐ | 165 | 93 | 45 | ||||
| (9) Boutelle 2011 | I: parent‐only | Sample size was determined by pragmatic factors, including budget and investigator time commitments. No interim analyses were done. The hypotheses tested related to non‐inferiority of the parent treatment to the parent‐child treatment on child and parent weight loss and child daily caloric intake and physical activity. The bound for non‐inferiority hypotheses related to BMI percentile was set to 1. This is the maximum value the parent‐child group could do better than parent‐only, below which non‐inferiority would be concluded. This bound could correspond to an mean‐aged child in this sample having a BMI of 26 in the parent‐child group and 28.5 in the parent‐only group at post‐treatment/follow‐up, assuming equivalence at baseline. For a non‐inferiority bound for child BMI, which was selected post hoc, we considered choosing a BMI that would correspond to the BMI percentile non‐inferiority bound (BMI = 2.5), but instead chose a more rigorous value of BMI = 1 | 157 | 40 | ‐ | 24 | 24 | 60 | 24 weeks post 20‐week intervention (week 44) |
| C: parent‐child | 40 | ‐ | 28 | 28 | 70 | ||||
| total: | 80 | 52 | 52 | 65 | |||||
| (8) West 2010 | I: parent‐only | ‐ | 205 | 52 | 52 | 52 | 34 | 65 | 40 weeks post 12‐week intervention (52 weeks) |
| C: waiting list control | 49 | 49 | 49 | 46 | 94 | ||||
| total: | 101 | 101 | 101 | 80 | 79 | ||||
| (7) Resnick 2009 | I: educational material + personal encounters | ‐ | 84/46 | 22 | ‐ | 18 | 18 | 82 | Unclear (41 weeks between start and last mail out) |
| C: educational material | 24 | ‐ | 24 | 24 | 100 | ||||
| total: | 46 | 42 | 42 | 91 | |||||
| (6) Estabrooks 2009 | I1: parent group + IVR | Sample size calculations were completed, varying the detectable effect sizes from small to medium with a power of 0.8. The result was a need for 42 participants per intervention to detect a medium effect and 64 participants to detect a small effect | 1487/656 | 85 | ‐ | 63 | 63 | 74 | 28‐40 weeks post 12‐ to 24‐week intervention (52 weeks) |
| I2: parent group | 85 | ‐ | 56 | 56 | 66 | ||||
| C: parent workbook | 50 | ‐ | 36 | 36 | 72 | ||||
| total: | 220 | 155 | 155 | 70 | |||||
| (5) Munsch 2008 | I: mother‐only CBT | Trial authors did not reach the necessary sample size of 68 families with obese children within the given time span (the target sample size of 68 was based on a repeated‐measures analysis with alpha = 0.05, 1 ‐ beta = 0.8, and a medium effect size for the linear term of the interaction between treatment and time, assuming a drop‐out rate of 20% | 181/60 | 25 | ‐ | 7 | 7 | 28 | 24 weeks post 10‐week intervention (34 weeks) |
| C: mother‐child CBT | 31 | ‐ | 20 | 20 | 65 | ||||
| total: | 56 | 27 | 27 | 48 | |||||
| (4) Janicke 2008 | I: parent‐only | Post hoc power analyses were used to determine the detectable change in BMI z score from 0 to 10 months for the family based and parent‐only interventions relative to the waiting list control condition. Effect sizes (standardised BMI index) detectable with 80% power and 2‐sided level 0.05 tests were used. Standard deviations and sample sizes were set equal to their observed values. For comparing the family‐based and waiting list control conditions, trial authors reported 80% power to detect a shift from 0.022 to ‐0.145. For comparing the parent‐only and waiting list control conditions, trial authors reported 80% power to detect a shift from 0.022 to ‐0.135 | 111 | 34 | ‐ | 26 | 26 | 76 | 14 weeks post 16‐week intervention (40 weeks) |
| C1: parent‐child | 33 | ‐ | 24 | 24 | 73 | ||||
| C2: waiting list control | 26 | ‐ | 21 | 21 | 81 | ||||
| total: | 93 | 71 | 71 | 76 | |||||
| (3) Golley 2007 | I: parent intervention + lifestyle education | Sample size calculation was based on a fall in BMI z score reflecting a weight gain of only 50% of that expected over 12 months with normal growth. A sample size of 28 per group was estimated to have 80% power to detect a 12‐month fall in mean BMI z score from a baseline of 0.26 (SD 0.49), assuming no change in the control group, at a 2‐sided significance level of 0.05. To account for a drop‐out rate of up to one‐third (commonly 20‐50% in child weight‐management studies), 42 children per study group were sought (126 children) | 262/115 | 38 | ‐ | 31 | 31 | 82 | 24 weeks post 24‐week intervention (48 weeks) |
| C1: parent intervention | 37 | ‐ | 29 | 29 | 78 | ||||
| C2: waiting list control | 36 | ‐ | 31 | 31 | 86 | ||||
| total: | 111 | 101 | 101 | ‐ | |||||
| (2) Golan 2006 | I: parent‐only | The study was designed to detect differences of 10% weight loss with a power of 90% and a significance level of 0.05, given a drop‐out rate of 10% with a sample of 12 in each group | 102 | 14 | ‐ | 10 | 10 | 71 | 1 year post 26‐week intervention (18 months) |
| C: parent‐child | 18 | ‐ | 17 | 17 | 94 | ||||
| total: | 32 | 27 | 27 | 84 | |||||
| (1) Aragona 1975 | I1: parent‐only with reinforcement | ‐ | ‐ | 5 | ‐ | 4 | 4 | 80 | 12 weeks (51 weeks' follow‐up) |
| I2: parent‐only | 5 | ‐ | 3 | 3 | 60 | ||||
| C: waiting list control | 5 | ‐ | 5 | 2 | 40 | ||||
| total: | 15 | 12 | 9 | 60 | |||||
| Grand total | All interventions | ‐ | 1773c | 1276 | |||||
| All comparators | 1284c | 942 | |||||||
| All interventions and comparators | 3057c | 2218 | |||||||
| aAccording to power calculation in trial publication or report "‐" denotes not reported BMI: body mass index; C: comparator; CBT: cognitive behavioural therapy; I: intervention; ITT: intention‐to‐treat; IVR: interactive voice response; n: number of participants; NOURISH: nourishing our understanding of role modelling to improve support and health; PCP: primary care providers; SD: standard deviation; YHC: Youth Health Care | |||||||||
| Outcome or subgroup title | No. of studies | No. of participants | Statistical method | Effect size |
| 1 BMI z score change post intervention Show forest plot | 3 | 277 | Mean Difference (IV, Random, 95% CI) | ‐0.06 [‐0.13, 0.02] |
| 1.1 Parent‐only vs. parent‐child | 2 | 112 | Mean Difference (IV, Random, 95% CI) | ‐0.05 [‐0.13, 0.04] |
| 1.2 Parent‐only vs. parent‐child physical activity | 1 | 84 | Mean Difference (IV, Random, 95% CI) | ‐0.15 [‐0.26, ‐0.04] |
| 1.3 Parent‐only vs. parent‐child physical activity + diet | 1 | 81 | Mean Difference (IV, Random, 95% CI) | 0.0 [‐0.11, 0.11] |
| 2 BMI z score change longest follow‐up Show forest plot | 3 | 267 | Mean Difference (IV, Random, 95% CI) | ‐0.04 [‐0.15, 0.08] |
| 2.1 Parent‐only vs. parent‐child | 2 | 102 | Mean Difference (IV, Random, 95% CI) | 0.06 [‐0.05, 0.16] |
| 2.2 Parent‐only vs. parent‐child physical activity | 1 | 84 | Mean Difference (IV, Random, 95% CI) | ‐0.16 [‐0.36, 0.04] |
| 2.3 Parent‐only vs. parent‐child physical activity + diet | 1 | 81 | Mean Difference (IV, Random, 95% CI) | ‐0.11 [‐0.31, 0.09] |
| Outcome or subgroup title | No. of studies | No. of participants | Statistical method | Effect size |
| 1 BMI z score change post intervention Show forest plot | 2 | 153 | Mean Difference (IV, Random, 95% CI) | ‐0.12 [‐0.21, ‐0.04] |
| 2 BMI z score change longest follow‐up Show forest plot | 2 | 136 | Mean Difference (IV, Fixed, 95% CI) | ‐0.10 [‐0.19, ‐0.01] |
| 2.1 Parent‐only vs. waiting list | 2 | 92 | Mean Difference (IV, Fixed, 95% CI) | ‐0.11 [‐0.21, ‐0.01] |
| 2.2 Parent‐only intensive education vs. waiting list | 1 | 44 | Mean Difference (IV, Fixed, 95% CI) | ‐0.02 [‐0.29, 0.25] |
| 3 BMI percentile change post intervention Show forest plot | 1 | Mean Difference (IV, Fixed, 95% CI) | Totals not selected | |
| 4 BMI percentile change longest follow‐up Show forest plot | 1 | Mean Difference (IV, Fixed, 95% CI) | Totals not selected | |
| 5 BMI change post intervention Show forest plot | 1 | Mean Difference (IV, Fixed, 95% CI) | Totals not selected | |
| 5.1 Parent‐only reinforcement vs. waiting list | 1 | Mean Difference (IV, Fixed, 95% CI) | 0.0 [0.0, 0.0] | |
| 5.2 Parent‐only vs. waiting list | 1 | Mean Difference (IV, Fixed, 95% CI) | 0.0 [0.0, 0.0] | |
| 6 BMI change longest follow‐up Show forest plot | 1 | Mean Difference (IV, Fixed, 95% CI) | Totals not selected | |
| 6.1 Parent‐only reinforcement vs. waiting list | 1 | Mean Difference (IV, Fixed, 95% CI) | 0.0 [0.0, 0.0] | |
| 6.2 Parent‐only vs. waiting list | 1 | Mean Difference (IV, Fixed, 95% CI) | 0.0 [0.0, 0.0] | |
| Outcome or subgroup title | No. of studies | No. of participants | Statistical method | Effect size |
| 1 BMI z score change post intervention Show forest plot | 1 | 170 | Mean Difference (IV, Random, 95% CI) | ‐0.00 [‐0.08, 0.08] |
| 1.1 Parent‐only IVR vs. control | 1 | 87 | Mean Difference (IV, Random, 95% CI) | ‐0.02 [‐0.13, 0.09] |
| 1.2 Parent‐only vs. control | 1 | 83 | Mean Difference (IV, Random, 95% CI) | 0.02 [‐0.09, 0.13] |
| 2 BMI z score change longest follow‐up Show forest plot | 1 | 165 | Mean Difference (IV, Fixed, 95% CI) | 0.01 [‐0.07, 0.09] |
| 2.1 Parent‐only interactive voice response vs. control | 1 | 86 | Mean Difference (IV, Fixed, 95% CI) | ‐0.02 [‐0.13, 0.09] |
| 2.2 Parent‐only vs. control | 1 | 79 | Mean Difference (IV, Fixed, 95% CI) | 0.04 [‐0.07, 0.15] |
| 3 BMI percentile change post intervention Show forest plot | 4 | Mean Difference (IV, Random, 95% CI) | Totals not selected | |
| 3.1 Parent‐only vs. minimal contact control | 3 | Mean Difference (IV, Random, 95% CI) | 0.0 [0.0, 0.0] | |
| 3.2 Parent motivational interviewing vs. minimal contact control | 1 | Mean Difference (IV, Random, 95% CI) | 0.0 [0.0, 0.0] | |
| 3.3 Parent motivational interviewing + dietician vs. minimal contact control | 1 | Mean Difference (IV, Random, 95% CI) | 0.0 [0.0, 0.0] | |
| 4 BMI percentile change longest follow‐up Show forest plot | 1 | Mean Difference (IV, Fixed, 95% CI) | Totals not selected | |
| 5 BMI change post intervention Show forest plot | 1 | Mean Difference (IV, Random, 95% CI) | Totals not selected | |
| 6 BMI change longest follow‐up Show forest plot | 2 | 614 | Mean Difference (IV, Random, 95% CI) | ‐0.12 [‐0.39, 0.15] |
| Outcome or subgroup title | No. of studies | No. of participants | Statistical method | Effect size |
| 1 BMI z score change post intervention Show forest plot | 5 | 507 | Mean Difference (IV, Fixed, 95% CI) | ‐0.22 [‐0.28, ‐0.17] |
| 1.1 Parent‐only interactive voice response vs. parent‐only | 1 | 132 | Mean Difference (IV, Fixed, 95% CI) | ‐0.04 [‐0.16, 0.08] |
| 1.2 Parent‐only intensive vs. parent‐only | 1 | 57 | Mean Difference (IV, Fixed, 95% CI) | ‐0.09 [‐0.38, 0.20] |
| 1.3 Parent health lifestyle vs. healthy lifestyle | 1 | 136 | Mean Difference (IV, Fixed, 95% CI) | ‐0.07 [‐0.29, 0.15] |
| 1.4 Parent‐only vs. decrease | 1 | 52 | Mean Difference (IV, Fixed, 95% CI) | ‐0.04 [‐0.17, 0.09] |
| 1.5 Parent‐only vs. increase | 1 | 49 | Mean Difference (IV, Fixed, 95% CI) | ‐0.01 [‐0.14, 0.12] |
| 1.6 Parent‐only vs. substitute | 1 | 40 | Mean Difference (IV, Fixed, 95% CI) | ‐0.70 [‐0.86, ‐0.54] |
| 1.7 Parent‐only vs. traditional | 1 | 41 | Mean Difference (IV, Fixed, 95% CI) | ‐0.69 [‐0.83, ‐0.55] |
| 2 BMI z score change longest follow‐up Show forest plot | 5 | 467 | Mean Difference (IV, Fixed, 95% CI) | ‐0.03 [‐0.10, 0.03] |
| 2.1 Parent‐only interactive voice response vs. parent‐only | 1 | 119 | Mean Difference (IV, Fixed, 95% CI) | ‐0.06 [‐0.18, 0.06] |
| 2.2 Parent‐only intensive vs. parent‐only | 1 | 60 | Mean Difference (IV, Fixed, 95% CI) | ‐0.09 [‐0.32, 0.14] |
| 2.3 Parent health lifestyle vs. healthy lifestyle | 1 | 106 | Mean Difference (IV, Fixed, 95% CI) | 0.03 [‐0.24, 0.30] |
| 2.4 Parent‐only vs. decrease | 1 | 52 | Mean Difference (IV, Fixed, 95% CI) | ‐0.04 [‐0.19, 0.11] |
| 2.5 Parent‐only vs. increase | 1 | 49 | Mean Difference (IV, Fixed, 95% CI) | ‐0.02 [‐0.17, 0.13] |
| 2.6 Parent‐only vs. substitute | 1 | 41 | Mean Difference (IV, Fixed, 95% CI) | ‐0.03 [‐0.24, 0.18] |
| 2.7 Parent‐only vs. traditional | 1 | 40 | Mean Difference (IV, Fixed, 95% CI) | 0.01 [‐0.17, 0.19] |
| 3 BMI change post intervention Show forest plot | 1 | Mean Difference (IV, Fixed, 95% CI) | Totals not selected | |
| 4 BMI change longest follow‐up Show forest plot | 1 | Mean Difference (IV, Fixed, 95% CI) | Totals not selected | |
| 5 BMI percentile change post intervention [%] Show forest plot | 1 | Mean Difference (IV, Random, 95% CI) | Totals not selected | |