Intervenciones sólo en padres para el sobrepeso y la obesidad en niños de 5 a 11 años de edad
Appendices
Appendix 1. Search strategies
| Cochrane Library |
| Part I: Obesity 1. [mh ^Obesity] 2. [mh ^"Obesity, Morbid"] 3. [mh ^"Obesity, Abdominal"] 4. [mh ^"Pediatric Obesity"] 5. [mh ^Overweight] 6. [mh ^"Weight Loss"] 7. (adipos* or obes*):ti,ab 8. (overweight* or ("over" next weight*)):ti,ab 9. ("weight" near/1 (reduc* or los* or control* or manage*)):ti,ab 10. {or #1‐#9} Part II: Intervention 11. [mh "Behavior Therapy"] 12. [mh "Counseling"] 13. [mh ^"Family Therapy"] 14. [mh ^"Social Support"] 15. [mh ^"Program Evaluation"] 16. [mh "Exercise"] 17. [mh "Exercise Therapy"] 18. [mh "Physical Education and Training"] 19. [mh "Exercise Movement Techniques"] 20. [mh ^"Motor Activity"] 21. [mh Diet] 22. [mh "Diet Therapy"] 23. [mh ^"Patient Education as Topic"] 24. [mh ^"Health Education"] 25. [mh "Health Behavior"] 26. [mh "Health Promotion"] 27. [mh ^"School Health Services"] 28. [mh ^"School Nursing"] 29. [mh ^"Life style"] 30. (("obesity" near/4 "intervention") or "program" or "programme" or "camp" or "camps"):ti,ab 31. ("lifestyle" or "life style"):ti,ab 32. exercis*:ti,ab 33. (physic* next (activ* or fit*)):ti,ab 34. (walk* or jog* or swim* or ("weight" next lift*) or danc* or "aerobics"):ti,ab 35. ((physic* or strength* or resist* or "circuit" or "weight" or aerob* or "cross" or "endurance" or structur*) near/4 train*):ti,ab 36. ("behavioral" or "behavioural" or (("behavior" or "behaviour") next "modification") or psychoth* or "psychosocial"):ti,ab 37. (("group" or "family" or cognit* or behav*) next therap*):ti,ab 38. (counselling or counselling):ti,ab 39. educat*:ti,ab 40. (("parent" or "parents" or "family") next ("based" or "focused" or "directed" or "centered" or "only" or "led")):ti,ab 41. (diet* or "healthy nutrition" or (nutrition* next ("knowledge" or educat* or therap* or program* or intervention*))):ti,ab 42. {or #11‐#41} Part III: Part I + Part II and additional MeSH/subheading combination 43. #10 and #42 44. [mh ^Obesity] or [mh ^"Obesity, Morbid"] or [mh ^Overweight] 45. [mh /DH,PC,RH,TH,PX][diet therapy or prevention & control or rehabilitation or therapy or psychology] 46. #44 and #45 47. #43 or #46 Part IV: Population [adapted from Leclercq 2013] 48. [mh ^Adolescent] 49. [mh Child] 50. [mh ^Infant] 51. [mh ^Pediatrics] 52. "minors":ti,ab 53. ("boy" or "boys" or "boyhood"):ti,ab 54. girl*:ti,ab 55. ("kid" or "kids"):ti,ab 56. infant*:ti,ab 57. ("baby" or "babies"):ti,ab 58. ("toddler" or "toddlers"):ti,ab 59. ("child" or "childs" or children* or childhood* or childcare* or schoolchild*):ti,ab 60. adolescen*:ti,ab 61. juvenil*:ti,ab 62. youth*:ti,ab 63. (teen* or preteen*):ti,ab 64. (underage* or ("under" next age*)):ti,ab 65. pubescen*:ti,ab 66. (paediatric* or paediatric*):ti,ab 67. {or #48‐#66} Part V: Part III AND IV and additional MeSH/subheading combination 68. #47 and #67 69. [mh ^"Pediatric Obesity"] 70. [mh /DH,PC,RH,TH,PX] 71. #69 and #70 72. #68 or #71 |
| MEDLINE (Ovid SP) |
| Part I: Obesity 1. Obesity/ 2. Obesity, Morbid/ 3. Obesity, Abdominal/ 4. Pediatric Obesity/ 5. Overweight/ 6. Weight Loss/ 7. (adipos* or obes*).tw. 8. (overweight* or over weight*).tw. 9. (weight adj1 (reduc* or los* or control* or manage*)).tw. 10. or/1‐9 Part II: Intervention 11. exp Behavior Therapy/ 12. exp Counseling/ 13. Family Therapy/ 14. Social Support/ 15. Program Evaluation/ 16. exp Exercise/ 17. exp Exercise Therapy/ 18. exp "Physical Education and Training"/ 19. exp Exercise Movement Techniques/ 20. Motor Activity/ 21. exp Diet/ 22. exp Diet Therapy/ 23. Patient Education as Topic/ 24. Health Education/ 25. exp Health Behavior/ 26. exp Health Promotion/ 27. School Health Services/ 28. School Nursing/ 29. Life style/ 30. ((obesity adj3 intervention) or program or programme or camp?).tw. 31. (lifestyle or life style).tw. 32. exercis*.tw. 33. (physic* adj (activ* or fit*)).tw. 34. (walk* or jog* or swim* or weight lift* or danc* or aerobics).tw. 35. ((physic* or strength* or resist* or circuit or weight or aerob* or cross or endurance or structur*) adj3 train*).tw. 36. (behavio?ral or behavio?r modification or psychoth* or psychosocial).tw. 37. ((group or family or cognit* or behav*) adj therap*).tw. 38. counsel?ing.tw. 39. educat*.tw. 40. ((parent? or family) adj (based or focused or directed or centered or only or led)).tw. 41. (diet* or healthy nutrition or (nutrition* adj (knowledge or educat* or therap* or program* or intervention*))).tw. 42. or/11‐41 Part III: Part I + Part II and additional MeSH/subheading combination 43. 10 and 42 44. Obesity/ or Obesity, Morbid/ or Overweight/ or Weight Loss/ 45. diet therapy.fs. or prevention & control.fs. or rehabilitation.fs. or therapy.fs. or psychology.fs. 46. 44 and 45 47. 43 or 46 Part IV: Population [adapted from Leclercq 2013] 48. Adolescent/ 49. exp Child/ 50. Infant/ 51. Pediatrics/ 52. minors.tw. 53. (boy or boys or boyhood).tw. 54. girl*.tw. 55. infant*.tw. 56. (baby or babies).tw. 57. toddler?.tw. 58. (kid or kids).tw. 59. (child or childs or children* or childhood* or childcare* or schoolchild*).tw. 60. adolescen*.tw. 61. juvenil*.tw. 62. youth*.tw. 63. (teen* or preteen*).tw. 64. (underage* or under age*).tw. 65. pubescen*.tw. 66. p?ediatric*.tw. 67. or/48‐66 Part V: Part III AND IV and additional MeSH/subheading combination 68. 47 and 67 69. Pediatric Obesity/ 70. diet therapy.fs. or prevention & control.fs. or rehabilitation.fs. or therapy.fs. or psychology.fs. 71. 69 and 70 72. 68 or 71 Part VI: Study filter [Cochrane Handbook 2008 RCT filter ‐ sensitivity and precision maximizing version] 73. randomised controlled trial.pt. 74. controlled clinical trial.pt. 75. randomi?ed.ab. 76. placebo.ab. 77. clinical trials as topic/ 78. randomly.ab. 79. trial.ti. 80. or/73‐79 81. exp animals/ not humans/ 82. 80 not 81 Part VII: Part V + Part VI 83. 72 and 82 |
| EMBASE (Ovid SP) |
| Part I: Obesity 1. obesity/ 2. morbid obesity/ 3. abdominal obesity/ 4. childhood obesity/ 5. weight reduction/ 6. weight control/ 7. (adipos* or obes*).tw. 8. (overweight* or over weight*).tw. 9. (weight adj1 (reduc* or los* or control* or manage*)).tw. 10. or/1‐9 Part II: Intervention 11. behavior therapy/ 12. cognitive therapy/ 13. exp counselling/ 14. family therapy/ 15. social support/ 16. exp program evaluation/ 17. exp exercise/ 18. exp physical education/ 19. exp physical activity/ 20. exp motor activity/ 21. training/ 22. exp diet/ 23. exp diet therapy/ 24. nutritional health/ 25. child nutrition/ 26. feeding behavior/ 27. patient education/ 28. health promotion/ 29. health literacy/ 30. nutrition education/ 31. health education/ 32. school health education/ 33. school health service/ 34. lifestyle/ 35. lifestyle modification/ 36. ((obesity adj3 intervention) or program or programme or camp?).tw. 37. (lifestyle or life style).tw. 38. exercis*.tw. 39. (physic* adj (activ* or fit*)).tw. 40. (walk* or jog* or swim* or weight lift* or danc* or aerobics).tw. 41. ((physic* or strength* or resist* or circuit or weight or aerob* or cross or endurance or structur*) adj3 train*).tw. 42. (behavio?ral or behavio?r modification or psychoth* or psychosocial).tw. 43. ((group or family or cognit* or behav*) adj therap*).tw. 44. counsel?ing.tw. 45. educat*.tw. 46. ((parent? or family) adj (based or focused or directed or centered or only or led)).tw. 47. (diet* or healthy nutrition or (nutrition* adj (knowledge or educat* or therap* or program* or intervention*))).tw. 48. or/11‐47 Part III: Part I + Part II and additional MeSH/subheading combination 49. 10 and 48 50. obesity/ or morbid obesity/ 51. pc.fs or rh.fs or th.fs. [prevention.fs. or rehabilitation.fs. or therapy.fs.] 52. 50 and 51 53. 49 or 52 Part IV: Population [adapted from Leclercq 2013] 54. juvenile/ 55. adolescent/ 56. child/ 57. infant/ 58. baby/ 59. toddler/ 60. preschool child/ 61. school child/ 62. pediatrics/ 63. minors.tw. 64. (boy or boys or boyhood).tw. 65. girl*.tw. 66. infant*.tw. 67. (baby or babies).tw. 68. toddler?.tw. 69. (kid or kids).tw. 70. (child or childs or children* or childhood* or childcare* or schoolchild*).tw. 71. adolescen*.tw. 72. juvenil*.tw. 73. youth*.tw. 74. (teen* or preteen*).tw. 75. (underage* or under age*).tw. 76. pubescen*.tw. 77. p?ediatric*.tw. 78. or/54‐77 Part V: Part III AND IV and additional MeSH/subheading combination 79. 53 and 78 80. childhood obesity/ 81. pc.fs or rh.fs or th.fs. [prevention.fs. or rehabilitation.fs. or therapy.fs.] 82. 80 and 81 83. 79 or 82 Part VI: Study filter [ Wong 2006afilter ‐ SDSSGS version] 84. random*.tw. or clinical trial*.mp. or exp treatment outcome/ Part VII: Part V + Part VI 85. 83 and 84 |
| PsycINFO (Ovid SP) |
| Part I: Obesity 1. exp Overweight 2. (adipos* or obes*).tw. 3. (overweight* or over weight*).tw. 4. or/1‐3 Part II: Intervention 5. Weight Control/ 6. Weight Loss/ 7. Aerobic Exercise/ 8. Diets/ 9. exp Exercise/ 10. Movement Therapy/ 11. Dance Therapy/ 12. exp Physical Activity/ 13. Physical Fitness/ 14. Health Behavior/ 15. Health Promotion/ 16. Health Knowledge/ 17. Health Literacy/ 18. Health Education/ 19. Client Education/ 20. Lifestyle/ 21. Physical Education/ 22. exp Program Evaluation/ 23. Educational Programs/ 24. Educational Therapy/ 25. exp Program Development/ 26. School Based Intervention/ 27. School Counseling/ 28. Counseling/ 29. Group Counseling/ 30. Family Therapy/ 31. Support Groups/ 32. Social Support/ 33. School Counselors/ 34. exp Behavior Modification/ 35. Cognitive Behavior Therapy/ 36. Cognitive Therapy/ 37. ((obesity adj3 intervention) or program or programme or camp?).tw. 38. (lifestyle or life style).tw. 39. exercis*.tw. 40. (physic* adj (activ* or fit*)).tw. 41. (walk* or jog* or swim* or weight lift* or danc* or aerobics).tw. 42. ((physic* or strength* or resist* or circuit or weight or aerob* or cross or endurance or structur*) adj3 train*).tw. 43. (behavio?ral or behavio?r modification or psychoth* or psychosocial).tw. 44. ((group or family or cognit* or behav*) adj therap*).tw. 45. counsel?ing.tw. 46. educat*.tw. 47. ((parent? or family) adj (based or focused or directed or centered or only or led)).tw. 48. (diet* or healthy nutrition or (nutrition* adj (knowledge or educat* or therap* or program* or intervention*))).tw. 49. or/5‐48 Part III: Part I + Part II 50. 4 and 49 Part IV: Population [adapted from Leclercq 2013] 51. minors.tw. 52. (boy or boys or boyhood).tw. 53. girl*.tw. 54. infant*.tw. 55. (baby or babies).tw. 56. toddler?.tw. 57. (kid or kids).tw. 58. (child or childs or children* or childhood* or childcare* or schoolchild*).tw. 59. adolescen*.tw. 60. juvenil*.tw. 61. youth*.tw. 62. (teen* or preteen*).tw. 63. (underage* or under age*).tw. 64. pubescen*.tw. 65. p?ediatric*.tw. 66. or/51‐65 Part V: Part III AND IV and additional MeSH/subheading combination 67. 50 and 66 Part VI: Study filter [ Eady 2008filter ‐ BS version] 68. control*.tw. OR random*.tw. OR exp Treatment/ Part VII: Part V + Part VI 69. 67 and 68 |
| CINAHL (EBSCOhost) |
| Part I: Obesity S1. MH "Obesity+" S2. TX (adipos* or obes*) S3. TX (overweight* or "over weight*") S4. S1 OR S2 OR S3 Part II: Intervention S5. MH "Weight Loss" S6. MH "Behavior Modification+" S7. MH "Counseling" S8. MH "Family Therapy" S9. MH "Support, Psychosocial" S10.MH "Support Groups" S11.MH "Program Evaluation" S12.MH "Program Implementation" S13.MH "Exercise+" S14.MH "Sports+" S15.MH "Therapeutic Exercise+" S16.MH "Physical Fitness" S17.MH "Physical Education and Training+" S18.MH "Health Education+" S19.MH "Diet+" S20.MH "Diet Therapy+" S21.MH "Health Behavior" S22.MH "Eating Behavior" S23.MH "Health Promotion" S24.MH "School Health Services+" S25.MH "Life style changes" S26.MH "Life style" S27.TX (weight N1 (reduc* or los* or control* or manage*)) S28.TX ((obesity N3 intervention) OR program OR programme OR camp#) S29.TX (lifestyle or "life style") S30.TX exercis* S31.TX (physic* N1 (activ* or fit*)) S32.TX (walk* or jog* or swim* or weight lift* or danc* or aerobics) S33.TX ((physic* or strength* or resist* or circuit or weight or aerob* or cross or endurance or structur*) N3 train*) S34.TX (behavio#ral or behavio#r modification or psychoth* or psychosocial) S35.TX ((group or family or cognit* or behav*) N1 therap*) S36.TX counsel#ing S37.TX educat* S38.TX ((parent# or family) N1 (based or focused or directed or centered or only or led)) S39.TX (diet* or "healthy nutrition" or (nutrition* N1 (knowledge or educat* or therap* or program* or intervention*))) S40.S5 OR S6 OR S7 OR S8 OR S9 OR S10 OR S11 OR S12 OR S13 OR S14 OR S15 OR S16 OR S17 OR S18 OR S19 OR S20 OR S21 OR S22 OR S23 OR S24 OR S25 OR S26 OR S27 OR S28 OR S29 OR S30 OR S31 OR S32 OR S33 OR S34 OR S35 OR S36 OR S37 OR S38 OR S39 Part III: Part I + Part II and additional MeSH/subheading combination S41.S4 AND S40 S42.(MH "Obesity+/DH/ED/PC/PF/RH/TH") [diet therapy or education or prevention & control or psychosocial factors or rehabilitation or therapy] S43.S41 OR S42 Part IV: Population [based on Leclercq 2013] S44.MH "Adolescence" S45.MH "Child+" S46.MH "Infant" S47.MH "Pediatrics" S48.TX minors S49.TX (boy OR boys OR boyhood) S50.TX girl* S51.TX infant* S52.TX (baby OR babies) S53.TX toddler# S54.TX (kid OR kids) S55.TX (child OR childs OR children* OR childhood* OR childcare* OR schoolchild*) S56.TX adolescen* S57.TX juvenil* S58.TX youth* S59.TX (teen* or preteen*) S60.TX (underage* or under age*) S61.TX pubescen* S62.TX (paediatric* OR paediatric*) S63.S44 OR S45 OR S46 OR S47 OR S48 OR S49 OR S50 OR S51 OR S52 OR S53 OR S54 OR S55 OR S56 OR S57 OR S58 OR S59 OR S60 OR S62 Part V: Part III AND IV and additional MeSH/subheading combination S64.S43 AND S63 S65.(MH "Pediatric Obesity/DH/ED/PC/PF/RH/TH") [diet therapy or education or prevention & control or psychosocial factors or rehabilitation or therapy] S66.S64 OR S65 Part VI: Study filter [ Wong 2006bfilter ‐ SDSSGS version] S67.MH "treatment outcomes+" OR MH "experimental studies+" or random* Part VII: Part V + Part VI S68.S66 AND S67 |
| LILACS (IAHx) |
| ((((MH:"Obesity" OR MH:"Obesity, Morbid" OR MH:"Obesity, Abdominal" OR MH:"Pediatric Obesity" OR MH:"Overweight" OR adipos$ OR obes$ OR overweight$ OR "over weight" OR sobrepes$ OR "exceso de peso" OR "excesso de peso") AND (MH:"Weight Loss" OR MH:"Exercise" OR MH:"Exercise Therapy" OR MH:"Physical Education and Training" OR MH:"Exercise Movement Techniques" OR MH:"Weight Reduction Programs" OR MH:"Motor Activity" OR MH:"Behavior Therapy" OR MH:"Counseling" OR MH:"Family Therapy" OR MH:"Social Support" OR MH:"Program Evaluation" OR MH:"Diet" OR MH:"Diet Therapy" OR MH:"Patient Education as Topic" OR MH:"Health Education" OR MH:"Health Behavior" OR MH:"Health Promotion" OR MH:"Weight Reduction Programs" OR MH:"School Health Services" OR MH:"Life style" OR exerci$ OR ejerci$ OR ((physic$ OR fisic$) AND (activ$ OR ativid$ OR fit$ OR educac$ OR entrenam$ OR treinam$)) OR ((physic$ OR fisic$ OR strength$ OR forca OR fuerza OR resist$ OR circuit$ OR weight OR aerob$ OR endurance OR structur$ OR estructur$) AND train$ OR treina$ OR entrena$) OR program$ OR "estilo de vida" OR padres OR pais OR familia OR familias OR familiar OR terapia OR orienta$ OR educa$ OR diet$ OR nutric$ OR "weight reduction" OR "weight loss" OR "weight control" OR "control de peso")) OR (MH:"Obesity/diet therapy" OR MH:"Obesity, Morbid/diet therapy" OR MH:"Overweight/diet therapy" OR MH:"Obesity/prevention & control" OR MH:"Obesity, Morbid/prevention & control " OR MH:"Overweight/prevention & control" OR MH:"Obesity/rehabilitation" OR MH:"Obesity, Morbid/rehabilitation" OR MH:"Overweight/rehabilitation" OR MH:"Obesity/therapy" OR MH:"Obesity, Morbid/therapy" OR MH:"Overweight/therapy" OR MH:"Obesity/psychology" OR MH:"Obesity, Morbid/psychology" OR MH:"Overweight/psychology")) AND (MH:"Adolescent" OR MH:"Child" OR MH:"Pediatrics" OR MH:"Infant" OR minors OR boy OR boys OR girl$ OR kid OR kids OR child OR childs OR children$ OR childhood$ OR childcare$ OR schoolchild$ OR escolar$ OR adolescen$ OR preadolescen$ OR juvenil$ OR juventud$ OR youth$ OR teen$ OR preteen$ OR underage$ OR pubescen$ OR paediatri$ OR pediatri$ OR joven$ OR jovem$ OR niños OR niñas OR crianca$ OR menin$ OR "menor de edad" OR "menores de edad" OR "menor de idade" OR "menores de idade")) OR MH:"Pediatric Obesity/diet therapy" OR MH:"Pediatric Obesity/prevention & control" OR MH:"Pediatric Obesity/rehabilitation" OR MH:"Pediatric Obesity/therapy" OR MH:"Pediatric Obesity/psychology" [activated filter "Controlled Clinical Trial"] |
| ICTRP Search Portal (Advanced search) |
| [activated "Search for clinical trials in children"]: in Title: obes* OR overweight* OR in Condition: obes* OR overweight* Recruitment Status: ALL |
| ClinicalTrials.gov (Advanced search) |
| Conditions: obese OR overweight OR obesity Study type: Interventional Studies Age Group: Child (birth‐17) |
Appendix 2. Description of interventions
| Intervention(s) | Comparator(s) | |
| Resnicow 2015 | Parent‐only PCP motivational interviewing: 4 sessions over 2 years with the primary care provider and standard advice on healthy eating and exercise | Usual care: standard advice on healthy eating and exercise |
| Parent‐only PCP + dietician motivational interviewing: 4 sessions over 2 years with the primary care provider and 6 sessions with a dietician. Standard advice on healthy eating and exercise | ||
| Mazzeo 2014 | Parent NOURISH: parents' self efficacy to make positive changes in eating and exercise behaviours | Parent control: single session on diet and exercise and mailed out information |
| van Grieken 2013 | Parent‐only: healthy lifestyle counselling at well‐child visit and up to 3 additional sessions at 3, 6 and 12 months, included motivational interviewing; focus on targeting key lifestyle‐related behaviours | Usual care control: general information about healthy lifestyle |
| Small 2013 | Parent‐only: focus on healthy habits in young children, nutritional information, information regarding increasing physical activity | Parent control: provision of educational age‐appropriate, evidence‐based health and safety information and group sessions |
| Esfarjani 2013 | Parent‐only: educational sessions on nutrition, physical activity and behavioural control | Parent control: 2 parent training sessions |
| Moens 2012 | Parent‐only: 5‐month intervention, 6 group meetings of 2 hours, focused on education of dietary requirements and training for parenting behavioural skills | Waiting list control: for 6 months |
| Raynor 2012a | Parent‐only: included behavioural strategies focused on increasing child growth monitoring and providing feedback to families | (I2) C1: parent intervention diet 'decrease': parent intervention as in parent‐only intervention and children and parents intervention focusing on decreasing sugar‐sweetened beverage and sweet and salty snack food intake |
| (I3) C2: parent intervention diet 'increase': parent intervention as in parent‐only intervention and children and parents intervention focusing on increasing fruit, vegetable and low‐fat dairy intake | ||
| Raynor 2012b | Parent‐only: included behavioural strategies focused on increasing child growth monitoring and providing feedback to families | (I2) C1: parent intervention diet and activity 'traditional': parent intervention as in parent‐only intervention and children and parents intervention focusing on decreasing sugar‐sweetened beverage intake and increasing physical activity |
| (I3) C2: parent intervention diet and activity 'substitute': parent intervention as in parent‐only intervention and children and parents intervention focusing on increasing low‐fat milk intake and decreasing TV watching | ||
| Magarey 2011 | Parent healthy lifestyle group: delivered in 4 sessions, standardised and evaluated generic parenting programme widely used in Australia and provides comprehensive facilitator training; followed by 8 healthy lifestyle sessions (as described for healthy lifestyle group) | Healthy lifestyle group: delivered in 8 sessions, included recommendations on specific core food servings; practical skills for healthy eating, reduced sedentary behaviours and increased activity; and monitoring of lifestyle behaviours and roles and responsibilities around eating, managing appetite, self esteem and teasing |
| Jansen 2011 | Parental CBT: included a focus on behavioural and nutritional components | Waiting list control: 6 month no treatment group |
| Collins 2011 | Parent‐only diet: includes behavioural techniques for food choices | C1: parent‐child (physical activity): includes physical activity goals and key skills C2: parent‐child (physical activity and diet): incorporates both the physical activity and diet‐only components of the other interventions |
| Boutelle 2011 | Parent‐only behavioural change: included self monitoring of targeted behaviours, positive reinforcement, stimulus control, pre‐planning and modelling | Parent‐child behavioural: included self monitoring of targeted behaviours, positive reinforcement, stimulus control, pre‐planning and modelling for parents and material taught in the child groups was similar but presented in an age‐appropriate manner |
| West 2010 | Parent‐only behavioural change, 'Group Lifestyle Triple P': included positive‐parenting strategies, physical activity strategies and nutrition strategies | Waiting list control: included a physical activity and nutritional advice components |
| Resnick 2009 | Educational material plus personal encounters: included choices of topics such as biological, social and environmental influences on childhood overweight; nutrition advice, physical activity guidelines | Educational material: included components on increased physical activity and nutritional components |
| Estabrooks 2009 | Parent group and IVR counselling: 2 group sessions addressing behavioural health skills and knowledge of weight, nutrition and physical activity. Based on social‐ecological theory. Utilised the workbook in the control group and followed by 10 IVR sessions including prompts for physical activity, nutrition, behavioural components | Group sessions: 2 group sessions as per group + IVR intervention; utilised the workbook |
| Control: workbook group: 61‐page workbook to promote physical activity, healthy habits, nutrition | ||
| Munsch 2008 | Mother‐only CBT: included nutrition and eating behaviour, physical activity, social competences, body concept, relapse prevention; children attended a relaxation training session | Mother‐child CBT: included the same components as the mother‐only intervention; children received sessions on nutrition and eating behaviour, basic nutritional education, reinforcement and tokens, lessons in physical activity, social competencies, developing a positive body concept, relapse prevention |
| Janicke 2008 | Parent‐only: includes behavioural, nutritional and physical activity components | C1: parent‐child: includes behavioural, nutritional and physical activity components |
| C2: waiting list control: no active treatment | ||
| Golley 2007 | Parenting‐skills training with intensive lifestyle education: behavioural change intervention including nutritional components; also 7 intensive lifestyle support group sessions | C1: parenting‐skills training: behavioural change intervention including nutritional components |
| C2: waiting list control: general healthy‐lifestyle pamphlet | ||
| Golan 2006 | Parent‐only: included behavioural, nutritional and physical activity components | Parent‐child: similar to the parent‐only but including activities for the children |
| Aragona 1975 | I1: parent‐only response‐cost plus reinforcement: nutritional information, exercise instructions, weight and calorie information, behavioural techniques including reinforcement techniques | Waiting list control |
| I2: parent‐only ‐ response‐cost: as above without the reinforcement techniques | ||
| I: intervention; C: comparator; CBT: cognitive behavioural therapy; IVR: interactive voice response; NOURISH: Nourishing Our Understanding of Role modelling to Improve Support and Health; PCP: primary care providers; PHL: parent healthy lifestyle; TV: television | ||
Appendix 3. Baseline characteristics (I)
| Intervention(s) and | Duration of intervention | Description of participants | Study period | Country | Setting | Ethnic groups | Socioeconomic status | |
| Resnicow 2015 | I1: parent‐only PCP motivational interviewing | 2 years (follow‐up: 2 years) | Parents of children aged 2‐8 years with BMI ≥ 85th and ≤ 97th percentile | ‐ | USA | Primary care | White: 53.6 Black: 11.0 Hispanic: 30.14 Asian: 1.14 Other: 3.83 | Income < USD 40,000: 38.6%; ≥ USD 40,000: 61.4% Education < college: 70.1%; ≥ college: 29.9% |
| I2: parent‐only PCP + dietician motivational interviewing | White: 59.1 Black: 6.09 Hispanic: 20.9 Asian: 8.7 Other: 5.2 | Income < USD 40,000: 29.8%; ≥ USD 40,000; 70.2% Education < college: 52.6%; ≥ college: 47.4% | ||||||
| C: usual care | White: 67.9 Black: 2.6 Hispanic: 13.3 Asian: 6.6 Other: 9.7 | Income < USD 40,000: 27.2%; ≥ USD 40,000: 72.8% Education < college: 61.8%; ≥ college: 38.2% | ||||||
| Mazzeo 2014 | I: parent NOURISH | 12 weeks (24 weeks) | Parents of overweight children aged 6‐11 years | 2008‐2009 | USA | Community | ‐ | ‐ |
| C: parent control | ||||||||
| van Grieken 2013 | I: parent‐only | up to 12 months (at 24 months) | Parents of overweight or obese children aged 5 years | September 2007‐October 2008 | The Netherlands | Community (youth health care centres) | Dutch: 75.8 | Mother's education level low/mid: 34.8; mid‐high/high: 65.2 |
| C: usual care | Dutch: 80.6 | Mother's education level low/mid: 31.5; mid‐high/high: 68.5 | ||||||
| Small 2013 | I: parent‐only | 16‐24 weeks (40‐48 weeks) | Parents of overweight or obese children aged 4‐8 years | ‐ | USA | Primary care office | White: 63 | Mothers' education: Mothers' marital status: Family structure: |
| C: control | White: 66 Hispanic: 25 Other: 7 | Mothers' education: Mothers' marital status: Family structure: | ||||||
| Esfarjani 2013 | I: parent‐only | 6 months (follow‐up unclear) | Parents of obese children aged 7 years | ‐ | Iran | ‐ | ‐ | Father's education |
| C: control | Father's education | |||||||
| Moens 2012 | I: parent‐only | 6 months (6 months) | Parents of overweight or obese children aged 6‐12 years | 2001‐2006 | Belgium | University research setting | 100% European (Caucasian) | Index of social position, low 26%, middle 52%, high 22% |
| C: waiting list control | 100% European (Caucasian) | Index of social position, low 0%, middle 75%, high 25% | ||||||
| Raynor 2012a | I: parent‐only | 24 weeks (12 months) | Parents of overweight or obese children | November 2005‐September 2007 | USA | University and primary care | White: 90.9 | ‐ |
| C1: parent ‐ diet decrease | White: 80 | |||||||
| C2: parent ‐ diet increase | White: 87 | |||||||
| Raynor 2012b | I: parent‐only | 24 weeks (12 months) | Parents of overweight or obese children | November 2005‐September 2007 | USA | University and primary care | White: 93.1 | ‐ |
| C1: parent ‐ diet and activity traditional | White: 84.6 | |||||||
| C2: parent ‐ diet and activity substitute | White: 92.3 | |||||||
| Magarey 2011 | I: parent healthy lifestyle | 24 weeks (104 weeks) | Parents of children classified as overweight aged 5‐9 years | May 2004‐estimated May 2006 | Australia | Outpatient clinic | ‐ | Reported for area of residence (Sydney or Adelaide) only, not by study arm |
| C: healthy lifestyle | ||||||||
| Jansen 2011 | I: parent CBT | 12 weeks (24 weeks) | Parents of overweight children aged 7‐13 years | ‐ | Netherlands | Community health centre, university site | ‐ | ‐ |
| C: waiting list control | ||||||||
| Collins 2011 | I: parent‐only diet | 24 weeks (104 weeks) | Parents of overweight children aged 5‐9 years | January 2005‐2008 | Australia | Outpatient clinic | ‐ | ‐ |
| C1: parent‐child (physical activity) | ||||||||
| C2: parent‐child (physical activity + diet) | ||||||||
| Boutelle 2011 | I: parent‐only | 20 weeks (44 weeks) | Parents and their overweight or obese (> 85th BMI percentile) children aged 8‐12 years | ‐ | USA | University | ‐ | Total household income: < USD 20,000: 2.6% |
| C: parent‐child | Total household income: | |||||||
| West 2010 | I: parent‐only | 12 weeks (1 year) | Children described as overweight by parents, aged 4‐11 years, and their parents | September 2003‐October 2004 | Australia | University, hospitals and schools | White: 88.5 | Mother's education: secondary only: 25.0; tertiary: 75.0 Father's education: |
| C: control | White: 85.7 | Mother's education: Mother employed: Mean (SD): mother's paid work (hour/week): 12.33; | ||||||
| Resnick 2009 | I: educational material + personal encounters | 18 weeks (unclear follow‐up, 41 week mail out) | Parents of overweight children aged 5‐11 years | October 2006‐ | USA | Community | ‐ | ‐ |
| C: educational material | ||||||||
| Estabrooks 2009 | I: parent group + IVR | 12‐24 weeks (52 weeks) | Parents of children aged 8‐12 years with a BMI > 85th percentile for their age | May 2004‐December 2007 | USA | Outpatient clinic | White: 60 Hispanic: 30 | ‐ |
| I2: parent group | White: 69 Hispanic: 19 | |||||||
| C: parent workbook | White: 59 Hispanic: 29 | |||||||
| Munsch 2008 | I: mother only | 10 weeks (34 weeks) | Mothers of children aged 8‐12 years with a BMI > 85th percentile adjusted for age and gender | ‐ | Switzerland | Efficacy of US Pediatric obesity primary care guidelines: 2 randomised trials Outpatient clinic and university | ‐ | ‐ |
| C: mother‐child | ||||||||
| Janicke 2008 | I: parent‐only | 16 weeks (40 weeks) | Parents of overweight children aged 8‐13 years | ‐ | USA | Community | Child: | Annual family income: |
| C1 parent‐child | Child: | Annual family income: | ||||||
| C2: waiting list control | Child: | Annual family income: | ||||||
| Golley 2007 | I: parent + lifestyle education | 24 weeks (48 weeks) | Parents of overweight children aged 6‐9 years | July 2002‐August 2003 | Australia | Outpatient clinic | ‐ | ‐ |
| C1 parent | ||||||||
| C2: waiting list control | ||||||||
| Golan 2006 | I: parent‐only | 26 weeks (18 months) | Parents of overweight children aged 6‐11 years | ‐ | Israel | Unclear | ‐ | ‐ |
| C: parent‐child | ||||||||
| Aragona 1975 | I1: parent‐only + reinforcement | 12 weeks (51 weeks) | Parents of overweight girls aged 5‐10 years | ‐ | USA | ‐ | ‐ | ‐ |
| I2: parent‐only | ||||||||
| C: control | ||||||||
| "‐" denotes not reported C: comparator; CBT: cognitive behavioural therapy; I: intervention; IVR: interactive voice response; NOURISH: Nourishing Our Understanding of Role modelling to Improve Support and Health; PCP: primary care providers; SD: standard deviation | ||||||||
Appendix 4. Baseline characteristics (II)
| Intervention(s) and | Sex | Age | BMI measures | Body weight | Parental weight [mean BMI (SD) or as stated] | Comedications/cointerventions/ | |
| Resnicow 2015 | I1: parent‐only PCP motivational interviewing | 57 | 5.1 (1.9) | Percentile: 92.2 (3.3) | ‐ | BMI: 30.1 (7.4) | ‐ |
| I2: parent‐only PCP + dietician motivational interviewing | 60 | 5.3 (1.8) | Percentile: 92.1 (3.4) | ‐ | BMI: 28.5 (6.4) | ||
| C: usual care | 53 | 4.9 (1.7) | Percentile: 91.5 (3.3) | ‐ | BMI: 28.4 (6.8) | ||
| Mazzeo 2014 | I: parent NOURISH | 68 | ‐ | BMI percentile: 98.47 (2.24) | ‐ | BMI: 34.2 (9.3) | ‐ |
| C: parent control | 64 | ‐ | BMI percentile: 97.86 (2.67) | ‐ | |||
| Van Grieken 2013 | I: parent‐only | 61 | 5.72 (0.42) | BMI: 18.16 (0.63) BMI SDS: 1.93 (0.38) | ‐ | Normal: 55.5% Overweight/obese: 44.5% | ‐ |
| C: usual care | 63 | 5.8 (0.45) | BMI: 18.10 (0.61) BMI SDS: 1.88 (0.35) | ‐ | Normal: 56.6% Overweight/obese: 43.4% | ||
| Small 2013 | I: parent | 52 | 5.73 (1.38) | BMI: 21.93 (3.51) BMI percentile: 96.7 (4.04) | 32.71 (10.14) | BMI: 31.56 (8.80) | ‐ |
| C: control | 70 | 5.41 (1.5) | BMI: 20.36 (2.71) BMI percentile: 95.4 (4.62) | 28.25 (8.08) | BMI: 31.89 (8.79) | ||
| Esfarjani 2013 | I: parent‐only | ‐ | 7 | 22.7 (2.2) | 36.4 (4.8) | ‐ | ‐ |
| C: control | ‐ | 7 | 22.5 (1.9) | 36.6 (4.7) | ‐ | ||
| Moens 2012 | I: parent‐only | 65 | 9.10 (1.35) | BMI %: 147.5 (17.93) | ‐ | Mother: 26.92 (5.43) Father: 27.14 (4.16) | ‐ |
| C: waiting list control | 58 | 9.26 (1.45) | BMI %: 140.45 (10.15) | ‐ | Mother: 24.75 (3.02) Father: 28.16 (3.15) | ||
| Raynor 2012a | I: parent‐only | 61 | 6.8 (1.8) | BMI: 34.6 ± 9.7 | ‐ | ‐ | ‐ |
| C1: parent ‐ diet decrease | 63 | 7.2 (1.6) | BMI: 33.4 ± 8.3 | ‐ | ‐ | ||
| C2: parent ‐ diet increase | 61 | 7.6 (1.6) | BMI: 32.2 ± 7.2 | ‐ | ‐ | ||
| Raynor 2012b | I: parent‐only | 59 | 6.7 (1.6) | BMI: 33.2 ± 9.1 | ‐ | ‐ | ‐ |
| C1: parent ‐ diet + activity traditional | 65 | 7.2 (1.5) | BMI: 30.5 ± 7.2 | ‐ | ‐ | ||
| C2: parent ‐ diet + activity substitute | 58 | 7.4 (1.3) | BMI: 33.6 ± 8.5 | ‐ | ‐ | ||
| Margarey 2011 | I: parent healthy lifestyle | 56 | All: 8.2 (1.2) | BMI (all): 24.1 (3.22) BMI z score: 2.77 (0.58) | All: 44.4 (9.82) | ‐ | ‐ |
| C: healthy lifestyle | All: 56 | All: 8.2 (1.2) | BMI (all): 24.1 (3.22) BMI z score 2.68 (0.65) | All: 44.4 (9.82) | ‐ | ||
| Jansen 2011 | I: parent CBT | ‐ | ‐ | BMI percentile: 96.8 (2.93) | ‐ | BMI: 28.30 (4.53) | ‐ |
| C: waiting list control | ‐ | ‐ | BMI percentile: 95.9 (3.38) | ‐ | BMI: 29.35 (6.33) | ||
| Collins 2011 | I: parent‐only diet | 62 | 8.2 (1.2) | BMI: 24.6 (3.0) | 46.3 (8.6) | ‐ | ‐ |
| C1: parent‐child (physical activity) | 60 | 8.3 (1.0) | BMI: 25.2 (4.1) | 48 (10.8) | ‐ | ‐ | |
| C2: parent‐child (physical activity + diet) | 55 | 8.1 (1.2) | BMI: 24.4 (3.7) | 45.5 (12.2) | ‐ | ‐ | |
| Boutelle 2011 | I: parent‐only | 50 | 10.81 (1.31) | Child BMI percentile: 98.37 (1.85) Child BMI z score: 2.29 (0.38) Child BMI: 30.48 (6.08) | ‐ | Parent BMI: 32.47 (8.25) n = 39 | ‐ |
| C: parent‐child | 70 | 10.08 (1.15) | Child BMI percentile: 98.34 (1.37) Child BMI z score: 2.25 (0.34) Child BMI: 28.26 (4.64) | ‐ | Parent BMI: 31.47 (7.46) n = 40 | ||
| West 2010 | I: parent‐only | 69 | 8.58 (1.69) | BMI z score: 2.15 (0.43) | ‐ | Parent BMI range (n, %) | ‐ |
| C: control | 65 | 8.5 (1.65) | BMI z score: 2.11 (0.46) | ‐ | Parent BMI range (n, %) | ||
| Resnick 2009 | I: educational material + personal encounters | ‐ | ‐ | BMI percentile: 94.1 (4.3) | ‐ | BMI: 25.6 | ‐ |
| C: educational material | ‐ | ‐ | BMI percentile: 94.1 (4.4) | ‐ | BMI: 26.2 | ||
| Estabrooks 2009 | I: parent group + IVR | 41 | 10.7 | BMI: 27.1 BMI z score: 2.04 | ‐ | ‐ | ‐ |
| I2: parent group | 42 | 10.6 | BMI: 27.4 BMI z score: 2.07 | ‐ | ‐ | ||
| C: parent workbook | 61 | 11 | BMI: 27.1 BMI z score: 2.00 | ‐ | ‐ | ||
| Munsch 2008 | I: mother‐only | 63 | 10.6 (1.5) | BMI: 28.0 (5.4), n = 21 BMI SDS: 2.61 | ‐ | BMI: 26.9 (3.9) | ‐ |
| C: mother‐child | 59 | 10.3 (1.4) | BMI: 26.5 (3.3) BMI SDS: 2.40 | ‐ | BMI: 29.6 (7.5) | ||
| Janicke 2008 | I: parent‐only | 46 | 11.5 (1.3) | BMI z score: 2.16 (0.35) | ‐ | BMI: 35.47 (8.2) | ‐ |
| C1 parent‐child | 63 | 11.03 (1.6) | BMI z score: 2.13 (0.43) | ‐ | BMI: 32.86 (6.8) | ||
| C2: waiting list control | 76 | 11.02 (1.81) | BMI z score: 2.02 (0.41) | ‐ | BMI: 35.66 (9.3) | ||
| Golley 2007 | I: parent + lifestyle education | 63 | ‐ | BMI z score: 2.74 (0.58) | ‐ | ‐ | ‐ |
| C1 parent | 65 | ‐ | BMI z score: 2.76 (0.58) | ‐ | ‐ | ||
| C2: waiting list control | 64 | ‐ | BMI z score: 2.75 (0.39) | ‐ | ‐ | ||
| Golan 2006 | I: parent‐only | 59 | 8.75 (1.9) | 24.2 (3.0) | 47.1 (12.4) | Weight: kg Mothers: 72.7 (11.1) Fathers: 100.9 (24.7) | ‐ |
| C: parent‐child | 50 | 8.7 (2.0) | 24.3 (3.6) | 45.5 (15.9) | Weight: kg Mothers: 79.1 (15.5) Fathers: 102.3 (19.1) | ||
| Aragona 1975 | I1: parent‐only + reinforcement | 100 | 9.4 | BMIb: 21.72 (2.03) | 47.89 (7.76) | ‐ | ‐ |
| I2: parent‐only | 100 | 10 | BMIb: 22.76 (1.58) | 47.42 (5.70) | ‐ | ||
| C: control | 100 | 8.3 | BMIb: 23.06 (3.04) | 45.04 (14.51) | ‐ | ||
| '‐' denotes not reported aSex of the overweight child BMI: body mass index; BMI SDS: standard deviation of BMI: C: comparator; CBT: cognitive behavioural therapy; I: intervention; IVR: interactive voice response; n: number of participants; NOURISH: Nourishing Our Understanding of Role modelling to Improve Support and Health; PCP: primary care providers; SD: standard deviation; TV: television | |||||||
Appendix 5. Matrix of study endpoints (publications and trial documents)
| Endpoints quoted in trial document(s) | Study results/ | Endpoints quoted in publication(s)b,c | Endpoints quoted in abstract of publication(s)b,c | |
| Resnicow 2015 | Source: NCT01335308 Primary outcome measure(s): BMI percentile | No (last verified: March 2011) History of changes: 0 documented changes | Primary outcome measure(s): BMI percentile | Primary outcome measure(s): BMI percentile |
| Secondary outcome measure(s): fruit + vegetable consumption, sweetened beverage consumption, change in physical activity | Secondary outcome measure(s): ‐ | Secondary outcome measure(s): ‐ | ||
| Other outcome measure(s): ‐ | Other outcome measure(s): ‐ | Other outcome measure(s): ‐ | ||
| Mazzeo 2014 | Source: NCT00628030 Primary outcome measure(s):
| Yes (last verified: July 2015) History of changes: 7 documented changes | Primary outcome measure(s): BMI | Primary outcome measure(s): child BMI |
| Secondary outcome measure(s):
| Secondary outcome measure(s): Three Factor Eating Questionnaire; Child Feeding Questionnaire; dietary intake (Block Food Screener); Pediatric Health‐Related Quality of Life; Pubertal status (self report) | Secondary outcome measure(s): parents satisfaction, parent behaviour change | ||
| Other outcome measure(s): ‐ | Other outcome measure(s): ‐ | Other outcome measure(s): ‐ | ||
| van Grieken 2013 | Source: ISRCTN04965410, NTR921 Primary outcome measure(s): BMI, waist circumference | No (last verified: July 2015) History of changes: no documented changes | Primary outcome measure(s): BMI, waist circumference | Primary outcome measure(s): BMI |
| Secondary outcome measure(s): levels of the 4 target overweight‐reducing and overweight‐inducing behaviours, i.e. being physically active, eating breakfast daily, drinking sweet beverages and watching TV or playing on a computer; health‐related quality of life; attitudes of parents regarding the 4 target behaviours; absence or presence of indicators of negative adverse effects, i.e. worry, stigmatisation, lowered self esteem and development of relative underweight | Secondary outcome measure(s): height, overweight prevalence, process evaluation, child‐health behaviours (breakfast, sweet beverages, playing outside and TV viewing) | Secondary outcome measure(s): minutes of outside play or TV viewing, having breakfast, number drinks of sweet beverages | ||
| Other outcome measure(s): ‐ | Other outcome measure(s): ‐ | Other outcome measure(s): ‐ | ||
| Small 2013 | Source: N/T | Primary outcome measure(s): ‐ | Primary outcome measure(s): ‐ | |
| Secondary outcome measure(s): ‐ | Secondary outcome measure(s): ‐ | |||
| Outcomes not specified as primary or secondary: BMI percentile; waist circumference; waist for height ratio | Other outcome measure(s): waist circumference, waist‐by‐height ratio, BMI and BMI percentile | |||
| Esfarjani 2013 | Source: N/T | Primary outcome measure(s): ‐ | Primary outcome measure(s): ‐ | |
| Secondary outcome measure(s): ‐ | Secondary outcome measure(s): ‐ | |||
| Outcomes not reported as primary or secondary: height, weight, BMI, waist circumference, hip circumference, fasting blood glucose (data not extracted), triglyceride (data not extracted), total cholesterol (data not extracted), HDL‐cholesterol (data not extracted, LDL cholesterol (data not extracted), food consumption (data not extracted), watching TV (data not extracted), playing on computer (data not extracted), walking time (data not extracted) | Other outcome measure(s): weight, waist and hip circumference, cholesterol, serum triglycerides, food group consumption, TV and computer time, walking time | |||
| Moens 2012 | Source: N/T | Primary outcome measure(s): see below | Primary outcome measure(s): ‐ | |
| Secondary outcome measure(s): see below | Secondary outcome measure(s): ‐ | |||
| Outcomes not reported as primary or secondary: height, weight, Dutch eating behaviour questionnaire (child and parent versions); Ghent Parental Behaviour Scale; health principles questionnaire, Hollingshead Index of Social Position | Other outcome measure(s): BMI, parental report of child's eating behaviour, familial health principles | |||
| Raynor 2012b | Source: NCT00259324 Primary outcome measure(s): BMI z score | No (last verified: July 2015) History of changes: 6 documented changes | Primary outcome measure(s): ‐ | Primary outcome measure(s): ‐ |
| Secondary outcome measure(s): eating and activity behaviours | Secondary outcome measure(s): ‐ | Secondary outcome measure(s): ‐ | ||
| Other outcome measure(s): | Outcomes not specified as primary or secondary: weight, height, BMI and BMI z score; dietary intake (food diaries); leisure time activity (Previous Day Physical Activity Recall) | Other outcome measure(s): BMI z score, energy intake | ||
| Raynor 2012a | Source: NCT00200265 Primary outcome measure(s): BMI z score | No (last verified: July 2015) History of changes: 6 documented changes | Primary outcome measure(s): ‐ | Primary outcome measure(s): ‐ |
| Secondary outcome measure(s): eating and activity behaviours | Secondary outcome measure(s): ‐ | Secondary outcome measure(s): ‐ | ||
| Other outcome measure(s): ‐ | Outcomes not specified as primary or secondary: weight, height, BMI and BMI z score; dietary intake (food diaries); leisure time activity (Previous Day Physical Activity Recall) | Other outcome measure(s): BMI z score, energy intake | ||
| Magarey 2011 | Source: ACTRN12606000120572 Primary outcome measure(s): BMI z score | No (last verified: February 2013) History of changes: no documented changes | Primary outcome measure(s): BMI z score | Primary outcome measure(s): BMI z score |
| Secondary outcome measure(s): waist circumference, fasting lipids, triglyceride, insulin, and glucose, blood pressure, health‐related quality of life, body satisfaction, parenting, parental BMI, eating and activity behaviours, health belief, programme evaluation | Secondary outcome measure(s): Program Impact (Parenting Sense of Competence Scale); Parenting (Alabama Parenting questionnaire); health‐related quality of life, waist circumference, fasting lipids, triglycerides, insulin, glucose, blood pressure, body satisfaction, eating and activity behaviours, health belief, programme satisfaction | Secondary outcome measure(s): waist z score | ||
| Other outcome measure(s): ‐ | Other outcome measure(s): ‐ | Other outcome measure(s): ‐ | ||
| Jansen 2011 | Source: N/T | Primary outcome measure(s): ‐ | Primary outcome measure(s): ‐ | |
| Secondary outcome measure(s): ‐ | Secondary outcome measure(s): ‐ | |||
| Outcomes not specified as primary or secondary: weight; height; BMI percentile, eating psychopathology (Child Eating Disorders Examination Questionnaire), eating behaviours (self report), physical activity (Baecke Questionnaire), self esteem (Self‐Perception Profile for Children), negative thoughts (Heavy Thoughts Questionnaire), knowledge test, motivation (therapist rated) | Other outcome measure(s): BMI percentile, relapse, psychopathology, self esteem and negative thoughts | |||
| Collins 2011 | Source: NCT00107692 Primary outcome measure(s): ‐ | No (last verified: September 2006) History of changes: 5 documented changes | Primary outcome measure(s): BMI z score and waist circumference | Primary outcome measure(s): BMI z score, waist measurements |
| Secondary outcome measure(s): ‐ | Secondary outcome measure(s): blood pressure, cholesterol, C‐reactive protein, triglycerides, glucose, insulin, energy intake, physical activity, movement and skill proficiency, perceived athletic competence, screen behaviours | Secondary outcome measure(s): metabolic outcomes | ||
| Outcomes not stated as primary or secondary: BMI SD score, height, weight, and waist circumference; metabolic profile measures: blood pressure; cholesterol, triglycerides; glucose and insulin; physical activity energy expenditure and sedentary activities: total kilocalories expended and time spent in sedentary activities; dietary energy intake: 4‐day weighed food record (2 week days and the weekend), parent selection of lower fat items in the household grocery shopping and behaviour changes related to a healthy lifestyle; actual and perceived competence: Test of Gross Motor Development and the Self‐Perception Profile for Children. Activity of daily living: Sit‐to‐stand transfer | Other outcome measure(s): ‐ | Other outcome measure(s): ‐ | ||
| Boutelle 2011 | Source: N/T | Primary outcome measure(s): weight, BMI (basis of non‐inferiority test) | Primary outcome measure(s): inferiority of treatment group on child weight loss | |
| Secondary outcome measure(s): dietary intake (Block Kids questionnaire), physical activity (Physical Activity Questionnaire for Older Children), BMI percentile, BMI z score | Secondary outcome measure(s): parent weight loss and child physical activity, caloric intake | |||
| Other outcome measure(s): ‐ | Other outcome measure(s): ‐ | |||
| West 2010 | Source: N/T | Primary outcome measure(s): BMI z score | Primary outcome measure(s): child BMI z score | |
| Secondary outcome measure(s): weight‐related problem behaviour and parenting self efficacy (Lifestyle Behaviour Checklist); ineffective parenting (Parenting Scale) | Secondary outcome measure(s): weight‐related problem behaviour, confidence in managing children's weight‐related behaviour | |||
| Other outcome measure(s): ‐ | Other outcome measure(s): ‐ | |||
| Resnick 2009 | Source: N/T | Primary outcome measure(s): ‐ | Primary outcome measure(s): ‐ | |
| Secondary outcome measure(s): ‐ | Secondary outcome measure(s): ‐ | |||
| Outcomes not specified as primary or secondary: sources of information, parent confidence, behavioural questions, patient satisfaction (all self report measures), BMI | Other outcome measure(s): BMI | |||
| Estabrooks 2009 | Source: NCT00433901 Primary outcome measure(s): child BMI | No (last verified: July 2010) History of changes: 2 documented changes | Primary outcome measure(s): BMI z score | Primary outcome measure(s): child BMI z scores |
| Secondary outcome measure(s): parent BMI, objective measure of physical activity using child accelerometer, Kids Eating Disorder Survey (KEDS), Peds QOL survey, SE (self efficacy), self report of physical activity, self report of sedentary activity, children's block food frequency survey, parent's home environment survey, parent self efficacy, parent demographics, parent quality of life, parent rapid assessment of physical activity, parent fat and fibre survey, parent health literacy, child/family medical history, economic survey type of medical weight management services | Secondary outcome measure(s): physical activity and sedentary behaviour (Youth Behavioural Risk Survey question); fruit, vegetable and sugared‐drink consumption (Block Kids Questionnaire); eating disorder symptoms (Kids Eating Disorders Survey); health‐related quality of life (Peds QOL survey), self efficacy | Secondary outcome measure(s): symptoms of eating disorders and body image | ||
| Other outcome measure(s): ‐ | Other outcome measure(s): ‐ | Other outcome measure(s): ‐ | ||
| Munsch 2008 | Source: N/T | Primary outcome measure(s): ‐ | Primary outcome measure(s): ‐ | |
| Secondary outcome measure(s): ‐ | Secondary outcome measure(s): ‐ | |||
| Outcomes not specified as primary or secondary: per cent overweight; depression (Depressionsinventar für Kinder und Jugendliche); anxiety (State‐Trait Anxiety Inventory for children) Social Anxiety Scale for Children‐Revised); behaviour problems (Child Behaviour CheckList), mental disorders (Diagnostisches Interview bei psychischen Störungen im Kindes‐ und Jugendalter (K‐DIPS)), binge eating (screening interview) | Other outcome measure(s): % overweight, general behaviour problems (externalising and internalising behaviour problems), global and social anxiety, and depression | |||
| Janicke 2008 | Source: N/T | Primary outcome measure(s): BMI z score (basis of power calculation) | Primary outcome measure(s): BMI z score, | |
| Secondary outcome measure(s): Youth/Adolescent Food Frequency Questionnaire | Secondary outcome measure(s): self esteem, cost | |||
| Other outcome measure(s): ‐ | Other outcome measure(s): ‐ | |||
| Golley 2007 | Source: ACTRN12606000119594 Primary outcome measure(s): BMI z score | No (last verified: February 2013) History of changes: no documented changes | Primary outcome measure(s): BMI z score | Primary outcome measure(s): BMI z score |
| Secondary outcome measure(s): waist circumference, fasting lipids, triglyceride, insulin, and glucose, blood pressure, health‐related quality of life, body satisfaction, parental weight status and waist circumference, eating and activity behaviours, parental competency, parental satisfaction | Secondary outcome measure(s): waist circumference, blood pressure; fasting glucose; total cholesterol; high‐density lipoprotein cholesterol; low‐density lipoprotein cholesterol; triacylglycerol; programme evaluation; satisfaction; health related quality of life | Secondary outcome measure(s): waist circumference z score | ||
| Other outcome measure(s): ‐ | Other outcome measure(s): ‐ | Other outcome measure(s): ‐ | ||
| Golan 2006 | Source: N/T | Primary outcome measure(s): weight loss (basis of power calculation) | Primary outcome measure(s): % overweight at end of programme (6 months) and 1‐year follow‐up | |
| Secondary outcome measure(s): weight; height, BMI z score; family eating questionnaire; parenting style (Parental Authority Questionnaire) | Secondary outcome measure(s): food stimuli in the home (from Family Eating and Activity questionnaire), parent's weight | |||
| Other outcome measure(s): ‐ | Other outcome measure(s): ‐ | |||
| Aragona 1975 | Source: N/T | Primary outcome measure(s): ‐ | Primary outcome measure(s): ‐ | |
| Secondary outcome measure(s): ‐ | Secondary outcome measure(s): ‐ | |||
| Outcomes not stated as primary or secondary: weight, height | Other outcome measure(s): weight change | |||
| ‐ denotes not reported aTrial document(s) refers to all available information from published design papers and sources other than regular publications (e.g. FDA/EMA documents, manufacturer's website's, trial registers) ACTRN: Australian New Zealand Clinical Trials Registry; BMA: body mass index; EMA: European Medicines Agency; FDA: Food and Drug Administration (US); ISRCTN: International Standard Randomised Controlled Trial Number; LDL: low‐density lipoprotein; N/A: not applicable; N/T: no trial document available; TV: television | ||||
Appendix 6. Examination of outcome reporting bias according to ORBIT classification
| Outcome | High risk of bias | High risk of bias | High risk of bias | High risk of bias | |
| Resnicow 2015 | N/A | ||||
| Mazzeo 2014 | N/A | ||||
| van Grieken 2013 | N/A | ||||
| Small 2013 | N/A | ||||
| Esfarjani 2013 | N/A | ||||
| Moens 2012 | N/A | ||||
| Raynor 2012a | N/A | ||||
| Raynor 2012b | N/A | ||||
| Magarey 2011 | N/A | ||||
| Jansen 2011 | N/A | ||||
| Collins 2011 | N/A | ||||
| Boutelle 2011 | N/A | ||||
| West 2010 | N/A | ||||
| Resnick 2009 | N/A | ||||
| Estabrooks 2009 | N/A | ||||
| Munsch 2008 | N/A | ||||
| Janicke 2008 | N/A | ||||
| Golley 2007 | N/A | ||||
| Golan 2006 | N/A | ||||
| Aragona 1975 | N/A | ||||
| aClear that outcome was measured and analysed; trial report stated that outcome was analysed but only reports that result was not significant N/A: not applicable | |||||
Appendix 7. Definition of endpoint measurement
| Behaviour change | Changes in BMI | Height | Health‐related quality of life or self esteem | All‐cause mortality/morbidity | Socioeconomic effects | Parent‐child relationship or | Participants' views | Severe/serious | |
| Resnicow 2015 | Parental questionnaire for behavioural outcomes, not validated | Primary care physicians and assistants trained in assessment of height and weight and provided with print and online resources to convert heights and weights to BMI and BMI percentile. All practices were provided with a digital scale. Parent BMI was calculated from self reported heights and weights | All practices were provided with a 36‐inch calibration rod and, if needed, a new stadiometer | ‐ | ‐ | ‐ | ‐ | ‐ | ‐ |
| Mazzeo 2014 | Parents completed the questionnaire ‐ dietary intake was assessed by using the Block Food Screener. This instrument has been validated against the Block 100‐item FFQ. | Height was measured to the nearest quarter of an inch. using a stadiometer. Weight was measured to the nearest quarter of a pound; data were used to calculate BMI in kg/m2, which were plotted on the CDC growth charts to obtain BMI percentile for age and gender | ‐ | See Appendix 11 | ‐ | ‐ | Parental concern subscale of the CFQ 3 questions, 5‐point scale (1‐5) , higher scores equate to more concern | Participants will complete an exit questionnaire that | ‐ |
| van Grieken 2013 | Parent report of child health behaviour (unvalidated, not extracted) | Weight was assessed via questionnaire that was completed by the parent. Also the YHC professionals measured at baseline. At follow‐up either the YHC professionals or a research assistant measured using the same standardized methods and equipment. Weight measured to the nearest 0.1 kilogram. BMI calculated by weight/height and children were classified into normal, overweight or obesity according to international age and gender specific cut‐off points (reference provided). Child BMI Standard Deviation Scores (SDS) were calculated using the reference population of children from the 1997 Dutch national Growth study | Height was assessed via questionnaire which was completed by the parent. Also the YHC professional measured at baseline. At follow‐up either the YHC professionals or a research assistant measured using the same standardised methods and equipment. Height measured to the nearest 0.1 cm. Waist circumference measured over naked skin at the level midway between the lower rib margin and the iliac crest at the end of gentle expiration when the child was standing | ‐ | ‐ | ‐ | Parenting practices were assessed by unvalidated measures (not data extracted) | Questionnaire assessing acceptability and feasibility of the protocol were sent after the first or second additional session. Parents were asked to indicate if the information provided was appreciated | ‐ |
| Small 2013 | ‐ | Weight was assessed in pounds (scale displayed to the BMI percentile was derived from the BMI z score using the normal distribution function in Microsoft Excel 2003 | Height assessed to the nearest eighth inch using a Seca portable stadiometer | ‐ | ‐ | ‐ | ‐ | ‐ | ‐ |
| Esfarjani 2013 | The validated food frequency questionnaire was used to assess typical food intake over the previous year (not data extracted) Unvalidated measures of TV watching, computer use (not data extracted) | Weight was measured by trained experts to the nearest 0.1 kg using a calibrated and certified portable digital scale with lightly dressed, without shoes and empty pockets. BMI was calculated (kg/m2 ) Waist circumference was measured at the smallest area between the edge of the lower chest and iliac crest bone | Height was measured by trained experts and determined in a standing position, barefoot using a portable height gauge with accuracy of 0.1 cm | ‐ | ‐ | ‐ | ‐ | ‐ | ‐ |
| Moens 2012 | Dutch Eating Behaviour Questionnaire (DEBQ, child and parent versions) ‐ validated measure with 33 items scored on a 5‐point Likert scale. Child version phrasing adapted slightly. Health principles questionnaire ‐ developed for the study, not validated (not data extracted) | Weight in light clothing by a school physician on a balance‐beam scale. Post intervention and follow‐up measured by parental report. Adjusted BMI (actual BMI/percentile 50 of BMI for age and gender x 100) calculated and overweight or obese identified in relation to European norms for 0‐21 year olds. Also BMI percentiles and z scores calculated by US CDC | Height without shoes measured by a wall‐mounted stadiometer. Post intervention and follow‐up measured by parental report | ‐ | ‐ | ‐ | Ghent Parental Behaviour Scale (GPBS), validated tool, 9 scales | ‐ | ‐ |
| Raynor 2012a | Parents were asked to complete diaries for their children 3 days each week (1 weekend day, 2 weekdays). | By trained research staff blinded to treatment assignment. Weight was assessed by a balance beam scale, and height was assessed using a stadiometer, using standard procedures (16) with participants wearing light clothing and no shoes. BMI was calculated with the following formula: BMI = weight in kg/height in m2. For children, standardised BMI (BMI‐z) scores were calculated based upon the value of the 50th BMI percentile and the standard deviation of the age‐ and sex‐ appropriate sample from the CDC growth charts | ‐ | ‐ | ‐ | ‐ | ‐ | ‐ | ‐ |
| Raynor 2012b | ‐ | By trained research staff blinded to treatment assignment. Weight was assessed by a balance beam scale, and height was assessed using a stadiometer, using standard procedures (16) with participants wearing light clothing and no shoes. BMI was calculated with the following formula: BMI = weight in kg/height in m2. For children, standardised BMI (BMI‐z) scores were calculated based upon the value of the 50th BMI percentile and the standard deviation of the age‐ and sex‐ appropriate sample from the CDC growth charts | ‐ | ‐ | ‐ | ‐ | ‐ | ‐ | ‐ |
| Magarey 2011 | ‐ | BMI measured using standard anthropometric methods, and BMI z scores were calculated using 1990 UK reference data child weight status as determined using IOTF definition | ‐ | ‐ | ‐ | ‐ | Alabama Parenting Questionnaire (Satisfaction, Efficacy, Involvement, Positive parenting, Poor monitoring, Inconsistent discipline, Corporal punishment) 35 questions, higher scores indicate improvement | ‐ | ‐ |
| Jansen 2011 | A self report questionnaire. | Weight (kg) measured and BMI percentile (Children's BMI‐for‐Age Calculator) was calculated for each child of the participating parents, thus including the target children and their siblings | ‐ | Self esteem: overweight child filled out the questionnaire (in presence of a parent and the interviewer). Perceived competence was measured with the translated version of the Self‐Perception Profile for Children. | ‐ | ‐ | ‐ | ‐ | ‐ |
| Collins 2011 | Habitual physical activity was measured using the Actigraph 7164 uniaxial accelerometer, an objective measure of activity. Participants wore the accelerometer during all waking hours over 8 consecutive days. Parents and children recorded periods The screen behaviours sub‐scale of the Children's Leisure Activities Study Survey completed by parents to assess children's time spent in TV/DVD viewing, playing electronic games, and using the computer | Weight ass measured with the children barefoot and wearing light clothing, using Tanita HD646 scales (Tanita Corporation of America Inc, Illinois, USA) to 0.1 kg | Height was measured to 0.1 cm using the stretch stature method and PE87 portable stadiometers (Mentone Educational Centre, | ‐ | ‐ | ‐ | ‐ | ‐ | ‐ |
| Boutelle 2011 | Usual dietary intake of the child was assessed with the Block Kids Questionnaire. | Weight measured in kg on a Tanita Digital Scale. BMI was standardised for age and gender (BMI z score) and expressed as a percentile (BMI percentile) using the US CCDC Growth Curves | Height was measured using a portable Schorr height board | ‐ | ‐ | ‐ | ‐ | ‐ | ‐ |
| West 2010 | The Lifestyle Behaviour Checklist lists 25 child problem behaviours related to eating (e.g. eating too quickly), physical activity (e.g. playing too many computer games) and overweight (e.g. complaining about being teased) in children aged 4‐11 years and yields scores on 2 scales ‐ the Problem scale and Confidence scale. | Height and weight were measured with a custom‐made portable stadiometer and electronic scales using standard procedures. | ‐ | ‐ | ‐ | ‐ | ‐ | Client Satisfaction Questionnaire | ‐ |
| Resnick 2009 | Parents were asked whether they received information about their children's nutrition or physical activity from any of the presented sources. | BMI collected standardised by school taken by school nurse. BMI was calculated and re‐scaled to represent the percentage of BMI measures for that age group | ‐ | ‐ | ‐ | ‐ | ‐ | Parent satisfaction: | ‐ |
| Estabrooks 2009 | ‐ | Weight was assessed using a regularly calibrated medical scale | ‐ | ‐ | ‐ | ‐ | ‐ | ‐ | ‐ |
| Munsch 2008 | Description of validated measures consistent with psychology/psychometrics. The Child Behavior Checklist for children and adolescents aged 4‐18 years recorded the assessments of parents in terms of social skills and problems of emotional well‐being and behaviour of their children the total value of internalising and externalising subscales, as well as the syndrome scale "Social problems" were recorded, representing a relevant concept in obese children | BMI measures taken and consistent with others, e.g. weight on a secca e scale. Percent overweight = [(effective BMI/BMI 50th percentile) ‐ 1] was calculated based on age and gender | Stadiometer to measure height | All children completed questionnaires to assess depressive symptoms (Children's Depression Inventory; DIKJ), anxiety (STAIK; SASC‐R and its German version), SAD, and FNE | ‐ | ‐ | ‐ | ‐ | ‐ |
| Janicke 2008 | Parents were asked to help their children complete the measure. The Youth/Adolescent Food Frequency Questionnaire was used to assess the child's dietary intake during the preceding month | Height without shoes measured to the nearest 0.1 cm using a Harpendon stadiometer. Weight to nearest 0.1 kg with 1 layer of clothing on and without shoes using a calibrated balance bean scale. Measured 3 times and averaged | Measured without shoes to nearest 0.1 cm using a Harpendon stadiometer (Holtain Ltd, Crosswell, UK). Measured 3 times and averaged | Children completed, Self‐Perception Profile for Children, which is a self report assessment of the child's perception of his or her global self worth and competence in 6 specific domains: scholastic competence, social acceptance, athletic competence, physical appearance, behavioural | ‐ | ‐ | ‐ | ‐ | ‐ |
| Golley 2007 | ‐ | Weight was measured to the nearest 0.1 kg with "SECA" electronic scales. BMI z: BMI was calculated and converted to a BMI z score by using UK reference data provided as a computer program (Child Growth Foundation, London, UK) | ‐ | ‐ | ‐ | ‐ | ‐ | Validated, anonymous 16‐item questionnaire | ‐ |
| Golan 2006 | ‐ | BMI: weight and height were measured to the nearest 0.1 kg and 1 cm, respectively, using a standard medical balance‐beam scale with a rigid vertical height rod | ‐ | ‐ | ‐ | ‐ | ‐ | ‐ | ‐ |
| Aragona 1975 | ‐ | Used bathroom scales. 3 baseline measurements obtained over a 2‐week period for both experimental groups. Control group were measured at home on the same day. To ensure reliability the experimenters independently read all height and weight measurements in the presence of the parents. If there were any inter‐rater discrepancies on weight, the child was weighed again. Weights recorded when there was inter‐rater agreement on 2 consecutive measurements | Not reported how measured | ‐ | ‐ | ‐ | ‐ | ‐ | ‐ |
| "‐" denotes not reported. 1 inch (in) = 2.5 cm; 1 pound (lb) = 450 g BMI: body mass index; CDC: Centers for Disease Control and Prevention; CFQ: Child Feeding Questionnaire; cm: centimetre; DIKJ: Depressionsinventar für Kinder und Jugendliche; FFQ: Food Frequency Questionnaire; FNE: Fear of Negative Evaluation; IOTF: International Obesity Task Force; kg: kilogram; lb: pound; PAQ‐C: Physical Activity Questionnaire for Older Children; PD‐PAR SDS: Previous Day Physical Activity Recall; SAD: Social Avoidance and Distress; SASC‐R: Social Anxiety Scale for Children‐Revise; STAIK: State und Trait Angst‐Inventar für Kinder; TV: television; YHC: Youth Health Centre | |||||||||
Appendix 8. Adverse events
| Intervention(s) and | Participants | Deaths | Participants with | Participants with | Participants discontinuing | Participants | Participants with | Participants with | |
| Resnicow 2015 | I1: parent‐only PCP motivational interviewing | 16 practices 212 participants | ‐ | ‐ | ‐ | ‐ | ‐ | ‐ | ‐ |
| I2: parent‐only PCP + dietician motivational interviewing | 15 practices 235 participants | ‐ | ‐ | ‐ | ‐ | ‐ | ‐ | ‐ | |
| C: usual care | 11 practices 198 participants | ‐ | ‐ | ‐ | ‐ | ‐ | ‐ | ‐ | |
| Mazzeo 2014 | I: parent NOURISH | 48 | ‐ | ‐ | ‐ | ‐ | ‐ | ‐ | ‐ |
| C: parent control | 45 | ‐ | ‐ | ‐ | ‐ | ‐ | ‐ | ‐ | |
| van Grieken 2013 | I: parent‐only | 349 | ‐ | ‐ | ‐ | ‐ | ‐ | ‐ | ‐ |
| C: usual care | 288 | ‐ | ‐ | ‐ | ‐ | ‐ | ‐ | ‐ | |
| Small 2013 | I: parent‐only | 34 | ‐ | ‐ | ‐ | ‐ | ‐ | ‐ | ‐ |
| C: control | 33 | ‐ | ‐ | ‐ | ‐ | ‐ | ‐ | ‐ | |
| Esfarjani 2013 | I: parent‐only | 70 | ‐ | ‐ | ‐ | ‐ | ‐ | ‐ | ‐ |
| C: control | 86 | ‐ | ‐ | ‐ | ‐ | ‐ | ‐ | ‐ | |
| Moens 2012 | I: parent‐only | 27 | ‐ | ‐ | ‐ | ‐ | ‐ | ‐ | ‐ |
| C: control | 19 | ‐ | ‐ | ‐ | ‐ | ‐ | ‐ | ‐ | |
| Raynor 2012a | I: parent‐only | 33 | ‐ | ‐ | ‐ | ‐ | ‐ | ‐ | ‐ |
| C1: parent ‐ diet decrease | 33 | ‐ | ‐ | ‐ | ‐ | ‐ | ‐ | ‐ | |
| C2: parent ‐ diet increase | 35 | ‐ | ‐ | ‐ | ‐ | ‐ | ‐ | ‐ | |
| Raynor 2012b | I: parent‐only | 29 | ‐ | ‐ | ‐ | ‐ | ‐ | ‐ | ‐ |
| C1: parent ‐ diet and activity traditional | 26 | ‐ | ‐ | ‐ | ‐ | ‐ | ‐ | ‐ | |
| C2: parent ‐ diet and activity substitute | 26 | ‐ | ‐ | ‐ | ‐ | ‐ | ‐ | ‐ | |
| Magarey 2011 | I: parent healthy lifestyle | 85 | ‐ | ‐ | ‐ | ‐ | ‐ | ‐ | ‐ |
| C: healthy lifestyle | 84 | ‐ | ‐ | ‐ | ‐ | ‐ | ‐ | ‐ | |
| Jansen 2011 | I: parent CBT | 59 | ‐ | ‐ | ‐ | ‐ | ‐ | ‐ | ‐ |
| C: waiting list control | 39 | ‐ | ‐ | ‐ | ‐ | ‐ | ‐ | ‐ | |
| Collins 2011 | I: parent‐only diet | 63 | ‐ | ‐ | ‐ | ‐ | ‐ | ‐ | ‐ |
| C1: parent‐child (physical activity) | 73 | ‐ | ‐ | ‐ | ‐ | ‐ | ‐ | ‐ | |
| C2: parent‐child (physical activity + diet) | 70 | ‐ | ‐ | ‐ | ‐ | ‐ | ‐ | ‐ | |
| Boutelle 2011 | I: parent‐only | 40 | ‐ | ‐ | ‐ | ‐ | ‐ | ‐ | ‐ |
| C: parent‐child | 40 | ‐ | ‐ | ‐ | ‐ | ‐ | ‐ | ‐ | |
| West 2010 | I: parent‐only | 52 | ‐ | ‐ | ‐ | ‐ | ‐ | ‐ | ‐ |
| C: control | 49 | ‐ | ‐ | ‐ | ‐ | ‐ | ‐ | ‐ | |
| Resnick 2009 | I: educational material + personal encounters | 22 | ‐ | ‐ | ‐ | ‐ | ‐ | ‐ | ‐ |
| C: educational material | 24 | ‐ | ‐ | ‐ | ‐ | ‐ | ‐ | ‐ | |
| Estabrooks 2009 | I: parent group + IVR | 85 | ‐ | ‐ | ‐ | ‐ | ‐ | ‐ | ‐ |
| I2: parent group | 85 | ‐ | ‐ | ‐ | ‐ | ‐ | ‐ | ‐ | |
| C: parent workbook | 50 | ‐ | ‐ | ‐ | ‐ | ‐ | ‐ | ‐ | |
| Munsch 2008 | I: mother only | 25 | ‐ | ‐ | ‐ | ‐ | ‐ | ‐ | ‐ |
| C: mother‐child | 31 | ‐ | ‐ | ‐ | ‐ | ‐ | ‐ | ‐ | |
| Janicke 2008 | I: parent‐only | 34 | ‐ | ‐ | ‐ | ‐ | ‐ | ‐ | ‐ |
| C1: parent‐child | 33 | ‐ | ‐ | ‐ | ‐ | ‐ | ‐ | ‐ | |
| C2: waiting list control | 26 | ‐ | ‐ | ‐ | ‐ | ‐ | ‐ | ‐ | |
| Golley 2007 | I: parent + lifestyle education | 38 | ‐ | ‐ | ‐ | ‐ | ‐ | ‐ | ‐ |
| C1: parent | 37 | ‐ | ‐ | ‐ | ‐ | ‐ | ‐ | ‐ | |
| C2: waiting list control | 36 | ‐ | ‐ | ‐ | ‐ | ‐ | ‐ | ‐ | |
| Golan 2006 | I: parent‐only | 14 | ‐ | ‐ | ‐ | ‐ | ‐ | ‐ | ‐ |
| C: parent‐child | 18 | ‐ | ‐ | ‐ | ‐ | ‐ | ‐ | ‐ | |
| Aragona 1975 | I1: parent‐only + reinforcement | 5 | ‐ | ‐ | ‐ | ‐ | ‐ | ‐ | ‐ |
| I2: parent‐only | 5 | ‐ | ‐ | ‐ | ‐ | ‐ | ‐ | ‐ | |
| C: control | 5 | ‐ | ‐ | ‐ | ‐ | ‐ | ‐ | ‐ | |
| "‐" denotes not reported C: comparator; CBT: cognitive behavioural therapy; I: intervention; IVR: interactive voice response; NOURISH: Nourishing Our Understanding of Role Modelling to Improve Support and Health; PCP: primary care providers | |||||||||
Appendix 9. Checklist to aid consistency and reproducibility of GRADE assessments
| Body mass index (BMI) variables | ||
| Study limitations | 1. Was random sequence generation used (i.e. no potential for selection bias)? | Yes |
| 2. Was allocation concealment used (i.e. no potential for selection bias)? | Unclear | |
| 3. Was there blinding of participants and personnel (i.e. no potential for performance bias)? | Unclear | |
| 4. Was there blinding of outcome assessment (i.e. no potential for detection bias)? | Unclear | |
| 5. Was an objective outcome used? | Yes | |
| 6. Were > 80% of participants enrolled in trials included in the analysis (i.e. no potential reporting bias)? | No (↓) | |
| 7. Were data reported consistently for the outcome of interest (i.e. no potential selective reporting)? | No (↓) | |
| 8. No other biases reported (i.e. no potential of other bias)? | Yes | |
| 9. Did the trials end up as scheduled (i.e. not stopped early)? | Yes | |
| Inconsistencyb | 1. Point estimates did not vary widely? | Yes |
| 2. To what extent did confidence intervals overlap (substantial: all confidence intervals overlap at least 1 of the included studies point estimate; some: confidence intervals overlap but not all overlap at least 1 point estimate; no: at least 1 outlier: where the confidence interval of some | Substantial | |
| 3. Was the direction of effect consistent? | No | |
| 4. What was the magnitude of statistical heterogeneity (as measured by I2) ‐ low (I2 < 40%), moderate (I2 40‐60%), high I2> 60%)? | Low | |
| 5. Was the test for heterogeneity statistically significant (P < 0.1)? | Not statistically significant | |
| Indirectnessc | 1. Were the populations in included studies applicable to the decision context? | Highly applicable |
| 2. Were the interventions in the included studies applicable to the decision context? | Highly applicable | |
| 3. Was the included outcome not a surrogate outcome? | No (however, only relevant outcome) | |
| 4. Was the outcome timeframe sufficient? | Sufficient | |
| 5. Were the conclusions based on direct comparisons? | Yes | |
| Imprecisiond | 1. Was the confidence interval for the pooled estimate consistent with benefit? | No (↓) |
| 2. What is the magnitude of the median sample size (high: > 300 participants, intermediate: 100‐300 participants, low: < 100 participants)?e | Low to intermediate (↓) | |
| 3. What was the magnitude of the number of included studies (large: > 10 studies, moderate: 5‐10 studies, small: < 5 studies)?e | Small (↓) | |
| 4. Was the outcome a common event (e.g. occurs more than 1/100)? | N/A | |
| Publication biased | 1. Was a comprehensive search conducted? | Yes |
| 2. Was grey literature searched? | Yes | |
| 3. Were no restrictions applied to study selection on the basis of language? | Yes | |
| 4. There was no industry influence on studies included in the review? | Yes | |
| 5. There was no evidence of funnel plot asymmetry? | Unclear | |
| 6. There was no discrepancy in findings between published and unpublished trials? | Unclear | |
| aQuestions on risk of bias are answered in relation to the majority of the aggregated evidence in the meta‐analysis rather than to individual trials. cWhen judging the width of the confidence interval it is recommended to use a clinical decision threshold to assess whether the imprecision is clinically meaningful. (↓): key item for possible downgrading the quality of the evidence (GRADE) as shown in the footnotes of the 'Summary of finding' table(s); GRADE: Grading of Recommendations Assessment, Development and Evaluation; N/A: not applicable. | ||
Appendix 10. Survey of study investigators providing information on included trials
| Study author contacted | Study author replied | Study author asked for additional information | Study author provided data | |
| Resnicow 2015 | 15/11/2015 | ‐ | ‐ | ‐ |
| Mazzeo 2014 | 10/08/2015 | 10/08/2015 | Allocation concealment approach and blinding of outcome assessors | ‐ |
| van Grieken 2013 | 10/08/2015 | 10/08/2015 | Allocation concealment approach and selective reporting of outcomes | Yes, 14/09/2015 |
| Small 2013 | 11/08/2015 | ‐ | N/A | N/A |
| Esfarjani 2013 | 11/08/2015 | ‐ | N/A | N/A |
| Moens 2012 | 18/08/2015 | 25/08/2015 | Details blinding of participants, personnel and outcome assessors | Yes, 03/09/15 |
| Raynor 2012a | 20/11/2014 | 25/11/2014 | Mean and standard deviation of the BMI z scores for each of the 3 arms in the trial | Yes, 25/11/2014 |
| Raynor 2012b | 20/11/2014 | 25/11/2014 | Mean and standard deviation of the BMI z scores for each of the3 arms in the trial | Yes, 25/11/2014 |
| Magarey 2011 | 11/08/2015 | 11/08/2015 | N/A | N/A |
| Jansen 2011 | 11/08/2015 | 11/08/2015 | Randomisation procedures, blinding of outcome assessors, selective reporting of outcomes | ‐ |
| Collins 2011 | 11/08/2015 | 11/08/2015 | Allocation concealment approach | ‐ |
| Boutelle 2011 | 11/08/2015 | ‐ | N/A | N/A |
| West 2010 | 11/08/2015 | 12/08/2015 | Selective reporting of outcomes | ‐ |
| Resnick 2009 | 11/08/2015 | ‐ | N/A | N/A |
| Estabrooks 2009 | 11/08/2015 | ‐ | N/A | N/A |
| Munsch 2008 | 16/04/2014 | 16/04/2014 | Additional data for Child Behaviour Checklist and English version of study publication | Yes, 16/04/2014 |
| Janicke 2008 | 11/08/2015 | 11/08/2015 | Allocation concealment approach, blinding of outcome assessors | Yes, 24/08/15 |
| Golley 2007 | 11/08/2015 | 11/08/2015 | N/A | N/A |
| Golan 2006 | 11/08/2015 | ‐ | N/A | N/A |
| Aragona 1975 | No email address | ‐ | N/A | N/A |
| N/A: not applicable | ||||
Appendix 11. Health‐related quality of life: instruments
| Name (type of | Dimensions (subscales) | Validated | Answer options | Scores | Direction of | Minimal important difference | |
| Mazzeo 2014 | Pediatric Health‐Related Quality of Life (PedsQL4.0) | 4 (physical (8 items), emotional (5 items), social (5 items), and school (5 items)) | Yes | 5‐point Likert scale from 0 (never) to 4 (almost always) | Scores are transformed on a scale from 0 to 100 | Higher scores indicate better HRQoL | Unknown |
| HRQoL: health‐related quality of life | |||||||


Risk of bias graph: review authors' judgements about each risk of bias item presented as percentages across all included studies (blank cells indicate that the particular outcome was not investigated in some studies).

Risk of bias summary: review authors' judgements about each risk of bias item for each included study (blank cells indicate that the study did not report that particular outcome).

Comparison 1 Parent‐only interventions versus parent‐child interventions, Outcome 1 BMI z score change post intervention.
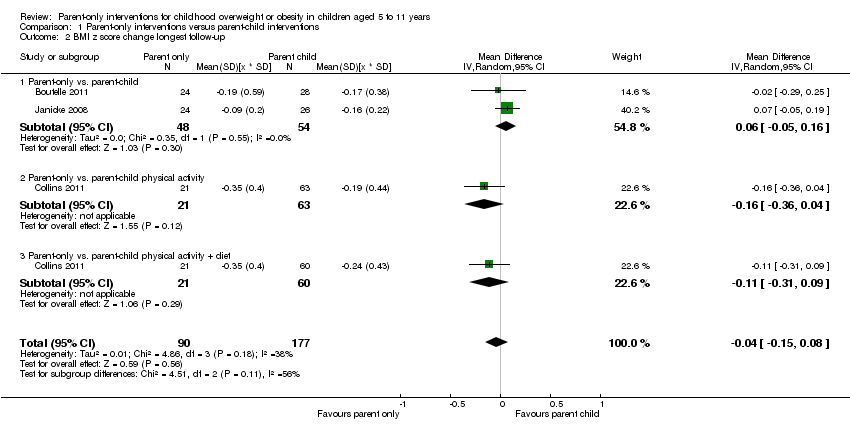
Comparison 1 Parent‐only interventions versus parent‐child interventions, Outcome 2 BMI z score change longest follow‐up.
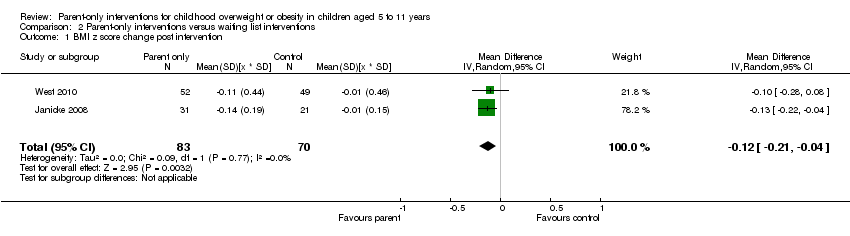
Comparison 2 Parent‐only interventions versus waiting list interventions, Outcome 1 BMI z score change post intervention.

Comparison 2 Parent‐only interventions versus waiting list interventions, Outcome 2 BMI z score change longest follow‐up.

Comparison 2 Parent‐only interventions versus waiting list interventions, Outcome 3 BMI percentile change post intervention.
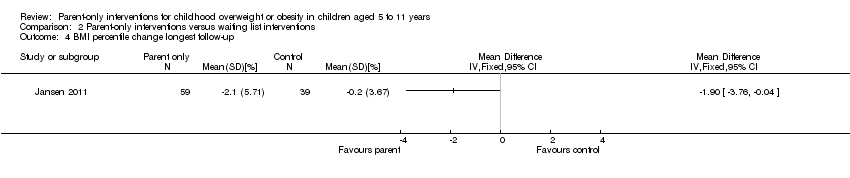
Comparison 2 Parent‐only interventions versus waiting list interventions, Outcome 4 BMI percentile change longest follow‐up.

Comparison 2 Parent‐only interventions versus waiting list interventions, Outcome 5 BMI change post intervention.
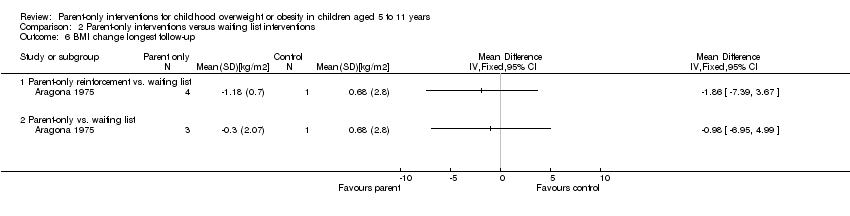
Comparison 2 Parent‐only interventions versus waiting list interventions, Outcome 6 BMI change longest follow‐up.
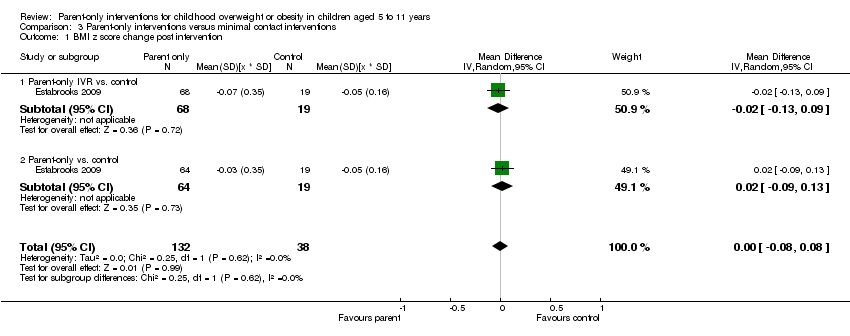
Comparison 3 Parent‐only interventions versus minimal contact interventions, Outcome 1 BMI z score change post intervention.

Comparison 3 Parent‐only interventions versus minimal contact interventions, Outcome 2 BMI z score change longest follow‐up.

Comparison 3 Parent‐only interventions versus minimal contact interventions, Outcome 3 BMI percentile change post intervention.
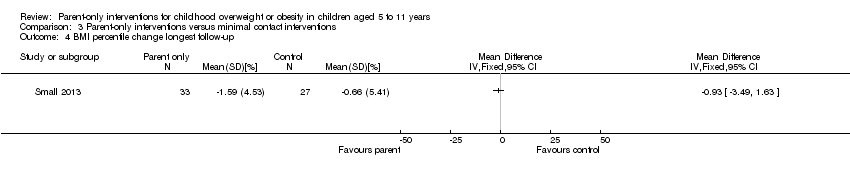
Comparison 3 Parent‐only interventions versus minimal contact interventions, Outcome 4 BMI percentile change longest follow‐up.

Comparison 3 Parent‐only interventions versus minimal contact interventions, Outcome 5 BMI change post intervention.
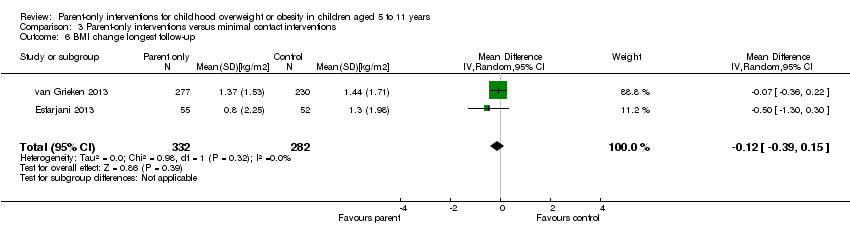
Comparison 3 Parent‐only interventions versus minimal contact interventions, Outcome 6 BMI change longest follow‐up.

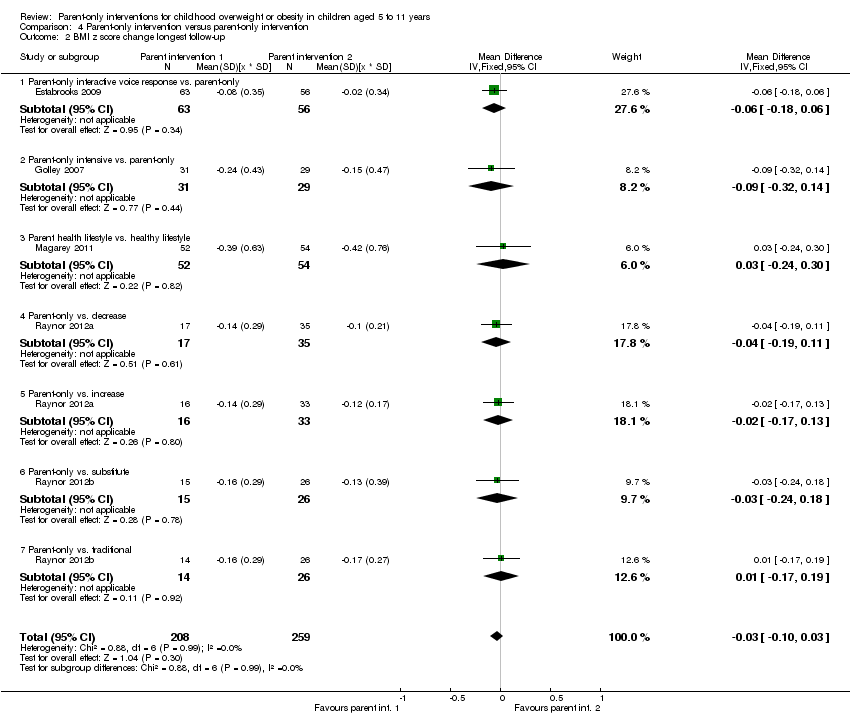
Comparison 4 Parent‐only intervention versus parent‐only intervention, Outcome 1 BMI z score change post intervention.
Comparison 4 Parent‐only intervention versus parent‐only intervention, Outcome 2 BMI z score change longest follow‐up.

Comparison 4 Parent‐only intervention versus parent‐only intervention, Outcome 3 BMI change post intervention.

Comparison 4 Parent‐only intervention versus parent‐only intervention, Outcome 4 BMI change longest follow‐up.
![Comparison 4 Parent‐only intervention versus parent‐only intervention, Outcome 5 BMI percentile change post intervention [%].](/cdsr/doi/10.1002/14651858.CD012008/media/CDSR/CD012008/image_n/nCD012008-CMP-004-05.png)
Comparison 4 Parent‐only intervention versus parent‐only intervention, Outcome 5 BMI percentile change post intervention [%].
| Parent‐only interventions vs. parent‐child interventions for childhood overweight or obesity | ||||||
| Population: children with overweight or obesity Settings: outpatients; community/university Intervention: parent‐only interventions Comparison: parent‐child interventions | ||||||
| Outcomes | Parent‐child | Parent‐only | Relative effect | No of participants | Quality of the evidence | Comments |
| BMI z score change (x * SD) Follow‐up: 40‐104 weeks | The mean BMI z score change ranged across control groups from ‐0.16 to ‐0.24 | The mean BMI z score change in the intervention groups was 0.04 lower (0.15 lower to 0.08 higher) | ‐ | 267 (3) | ⊕⊕⊝⊝ | Lower scores indicate improved weight loss |
| Adverse events | See comment | See comment | See comment | See comment | See comment | No trials reported adverse events |
| Health‐related quality of life | See comment | See comment | See comment | See comment | See comment | No trials reported health‐related quality of life |
| All‐cause mortality | See comment | See comment | See comment | See comment | See comment | No trials reported all‐cause mortality |
| Morbidity | See comment | See comment | See comment | See comment | See comment | No trials reported morbidity |
| Parent‐child relationship or assessment of parenting | See comment | See comment | See comment | See comment | See comment | No trials reported outcomes assessing parent‐child relationships or an assessment of parenting |
| Socioeconomic effects | See comment | See comment | See comment | See comment | See comment | No trials reported socioeconomic effects |
| *The basis for the assumed risk (e.g. the median control group risk across trials) is provided in footnotes. The corresponding risk (and its 95% confidence interval) is based on the assumed risk in the comparison group and the relative effect of the intervention (and its 95% CI). GRADE Working Group grades of evidence | ||||||
| "A BMI z score or standard deviation score indicates how many units (of the standard deviation) a child's BMI is above or below the average BMI value for their age group and sex. For instance, a z score of 1.5 indicates that a child' is 1.5 standard deviations above the average value, and a z score of ‐1.5 indicates a child is 1.5 standard deviations below the average value" (Noo NHS 2011). aDowngraded by one level because of serious risk of attrition bias and one level for serious imprecision (see Appendix 9). | ||||||
| Parent‐only interventions vs. waiting list control for childhood overweight or obesity | ||||||
| Population: children with overweight or obesity Settings: outpatients; community Intervention: parent‐only interventions Comparison: waiting list control | ||||||
| Outcomes | Waiting list | Parent‐only | Relative effect | No of participants | Quality of the evidence | Comments |
| BMI z score change (x * SD) Follow‐up: 40‐48 weeks | The mean BMI z score change ranged across control groups from ‐0.13 to 0.02 | The mean BMI z score change in the intervention groups was 0.1 lower (0.19 lower to 0.01 lower) | ‐ | 136 (2) | ⊕⊕⊝⊝ | Lower scores indicate improved weight loss |
| Adverse events | See comment | See comment | See comment | See comment | See comment | No trials reported adverse events |
| Health‐related quality of life | See comment | See comment | See comment | See comment | See comment | No trials reported health‐related quality of life |
| All‐cause mortality | See comment | See comment | See comment | See comment | See comment | No trials reported all‐cause mortality |
| Morbidity | See comment | See comment | See comment | See comment | See comment | No trials reported morbidity |
| Parent‐child relationship or assessment of parenting (parenting scale (PS), 30 items, scored from 1 to 7; lower scores indicate more effective parental discipline practices) Follow‐up: 12 weeks | The mean PS score for the control group was 3.4 | The mean PS score in the intervention group was 0.6 points lower | ‐ | 101 (1) | ⊕⊕⊝⊝ | ‐ |
| Socioeconomic effects | See comment | See comment | See comment | See comment | See comment | No trials reported socioeconomic effects |
| *The basis for the assumed risk (e.g. the median control group risk across trials) is provided in footnotes. The corresponding risk (and its 95% confidence interval) is based on the assumed risk in the comparison group and the relative effect of the intervention (and its 95% CI). GRADE Working Group grades of evidence | ||||||
| "A BMI z score or standard deviation score indicates how many units (of the standard deviation) a child's BMI is above or below the average BMI value for their age group and sex. For instance, a z score of 1.5 indicates that a child' is 1.5 standard deviations above the average value, and a z score of ‐1.5 indicates a child is 1.5 standard deviations below the average value" (Noo NHS 2011). aDowngraded by one level because of serious risk of attrition bias and one level for serious imprecision (see Appendix 9). | ||||||
| Parent‐only interventions vs. minimal contact control for childhood overweight or obesity | ||||||
| Population: children with overweight or obesity Settings: outpatients Intervention: parent‐only interventions Comparison: minimal contact control | ||||||
| Outcomes | Minimal contact | Parent‐only | Relative effect | No of participants | Quality of the evidence | Comments |
| BMI z score change (x * SD) Follow‐up: 52 weeks | The mean BMI z score change ranged across control groups from ‐0.06 to ‐0.06 | The mean BMI z score change in the intervention group was 0.01 lower (‐0.07 lower to 0.09 higher) | ‐ | 165 (1) | ⊕⊕⊝⊝ | Lower scores indicate improved weight loss |
| Adverse events | See comment | See comment | See comment | See comment | See comment | No trials reported adverse events |
| Health‐related quality of life (Pediatric Health‐Related Quality of Life, scale from 0 to 100; higher scores indicate better HRQoL) Follow‐up: 24 weeks) | See comment | See comment | See comment | 93 (1) | See comment | No data were presented ('"no improvements in health‐related quality of life") |
| All‐cause mortality | See comment | See comment | See comment | See comment | See comment | No trials reported all‐cause mortality |
| Morbidity | See comment | See comment | See comment | See comment | See comment | No trials reported morbidity |
| Parent‐child relationship or assessment of parenting (Child Feeding Questionnaire subscale parental concern (total of 7 subscales), score range 3‐15; higher scores indicate greater parental concern) Follow‐up: 12 weeks | The mean parent concern score was 4.7 in the control group | The mean parent concern score in the intervention group was 0.1 lower. | ‐ | 93 (1) | ⊕⊕⊝⊝ | ‐ |
| Socioeconomic effects | See comment | See comment | See comment | See comment | See comment | No trials reported socioeconomic effects |
| *The basis for the assumed risk (e.g. the median control group risk across trials) is provided in footnotes. The corresponding risk (and its 95% confidence interval) is based on the assumed risk in the comparison group and the relative effect of the intervention (and its 95% CI). GRADE Working Group grades of evidence | ||||||
| "A BMI z score or standard deviation score indicates how many units (of the standard deviation) a child's BMI is above or below the average BMI value for their age group and sex. For instance, a z score of 1.5 indicates that a child' is 1.5 standard deviations above the average value, and a z score of ‐1.5 indicates a child is 1.5 standard deviations below the average value" (Noo NHS 2011). aDowngraded by one level because of serious risk of attrition bias and one level for serious imprecision (see Appendix 9). | ||||||
| Parent‐only interventions vs. parent‐only interventions for childhood overweight or obesity | ||||||
| Population: children with overweight or obesity Settings: outpatients; university + primary care Intervention: parent‐only interventions Comparison: parent‐only interventions | ||||||
| Outcomes | Parent‐only | Parent‐only | Relative effect | No of participants | Quality of the evidence | Comments |
| BMI z score change (x * SD) Follow‐up: 12‐24 months | See comment | See comment | See comment | 467 (5) | ⊕⊕⊝⊝ | No meta‐analysis because of little consistency between trial interventions and comparators; there were no substantial differences between different parent‐only interventions |
| Adverse events | See comment | See comment | See comment | See comment | See comment | Two trials reported that there were no serious adverse events (Raynor 2012a; Raynor 2012b) |
| Health‐related quality of life | See comment | See comment | See comment | See comment | See comment | No trials reported health‐related quality of life |
| All‐cause mortality | See comment | See comment | See comment | See comment | See comment | No trials reported all‐cause mortality |
| Morbidity | See comment | See comment | See comment | See comment | See comment | No trials reported morbidity |
| Parent‐child relationship or assessment of parenting (Alabama Parenting Questionnaire, 35 items; higher scores indicate improvement) Follow‐up: 24 months | See comment | See comment | See comment | 106 (1) | See comment | 1 study assessed parent‐child relationship or assessment of parenting but there were no data for comparisons between intervention groups provided |
| Socioeconomic effects | See comment | See comment | See comment | See comment | See comment | No trials reported socioeconomic effects |
| *The basis for the assumed risk (e.g. the median control group risk across trials) is provided in footnotes. The corresponding risk (and its 95% confidence interval) is based on the assumed risk in the comparison group and the relative effect of the intervention (and its 95% CI). GRADE Working Group grades of evidence | ||||||
| "A BMI z score or standard deviation score indicates how many units (of the standard deviation) a child's BMI is above or below the average BMI value for their age group and sex. For instance, a z score of 1.5 indicates that a child' is 1.5 standard deviations above the average value, and a z score of ‐1.5 indicates a child is 1.5 standard deviations below the average value" (Noo NHS 2011). aDowngraded by one level because of serious risk of attrition bias and one level for serious imprecision (see Appendix 9) | ||||||
| Intervention(s) and comparator(s) | Sample sizea | Screened/eligible | Randomised | ITT | Analysed | Finishing trial | Randomised finishing trial | Follow‐up | |
| (20) Resnicow 2015 | I1: parent‐only PCP motivational interviewing | The study was powered to detect a 3‐point difference in BMI percentile between any pair of study groups at 2‐year follow‐up, with an assumed SD for BMI percentile between 4 and 6: power of 0.80 and 2‐tailed a of 0.05. Sample size was inflated to account for practice‐level clustering, assuming an intraclass correlation between 0.01 and 0.05. On this basis and a projected 25‐30% attrition at 2‐year follow‐up, 10‐12 practices per arm (30‐36 total) and a mean of 15‐20 children per practice at baseline were required | ‐ | 16 practices 212 participants | 145 | 145 | 145 | 68 | 2 years (2 years) |
| I2: parent‐only PCP + dietician motivational interviewing | 15 practices 235 participants | 154 | 154 | 154 | 66 | ||||
| C: usual care | 11 practices 198 participants | 158 | 158 | 158 | 80 | ||||
| total: | 645 | 457 | 457 | 457 | 71 | ||||
| (19) Mazzeo 2014 | I: parent NOURISH | ‐ | 235 | 48 | ‐ | 46 | 10 | 21 | 12 weeks post 12‐week intervention (24 weeks) |
| C: parent control | 45 | ‐ | 45 | 16 | 36 | ||||
| total: | 93 | 91 | 26 | 28 | |||||
| (18) Van Grieken 2013 | I: parent‐only | Sample size was calculated taking into account the intracluster correlation coefficient (ρ = 0.1), the number of clusters (44), the expected prevalence of overweight children in the study population, the SD, expected effect (a difference in mean), and the power of the study (80%). With a participation of 50%, an expected prevalence of overweight children of 9% and a loss‐to‐follow‐up of 30%, at least 11,301 children (and their parents) should be invited by the YHC teams to participate in the study to have a final sample of about 356 overweight children (178 in both the intervention and control group). Assuming a SD of BMI to be 1.0 kg/m2, a difference in mean BMI of 0.35 kg/m2 between the children in the intervention group and the children in the control group can be established under the assumptions mentioned above | 22 clusters 7004 participants | 349 | ‐ | 21 clusters 277 participants | 277 | 79 | 2 years post up to 12‐month intervention |
| C: usual care | 22 clusters 7004 participants | 288 | ‐ | 21 clusters 230 participants | 230 | 80 | |||
| total | 637 | ‐ | 42 (507) | 507 | 80 | ||||
| (17) Small 2013 | I: parent‐only | ‐ | ‐ | 34 | 33 | 33 | 33 | 97 | 24 weeks post 16‐week intervention (41 weeks) |
| C: parent control | 33 | 27 | 27 | 27 | 82 | ||||
| total: | 67 | 60 | 60 | 60 | 90 | ||||
| (16) Esfarjani 2013 | I: parent‐only | ‐ | 550/156 | 70 | ‐ | 55 | 58 | 83 | Intervention 6 months (not reported) |
| C: parent control | 86 | ‐ | 52 | 59 | 69 | ||||
| total: | 156 | ‐ | 107 | 117 | 75 | ||||
| (15) Moens 2012 | I: parent‐only | ‐ | 80/75 | 31 | ‐ | ‐ | 31 | 100 | Immediately following 6‐month intervention |
| C: waiting list control | 19 | ‐ | ‐ | 15 | 79 | ||||
| total: | 50 | ‐ | ‐ | 46 | 92 | ||||
| (14) Raynor 2012a | I1: parent‐only | Sample size calculations presumed 2‐sided hypothesis testing at 6‐month assessment, with type 1 error rate = 0.05. To reject with 80% power the null hypothesis of no pre‐ to post‐treatment difference between intervention conditions vs. the alternative that the pre‐ to post‐treatment difference was 0.6 or greater (effect size), 24 participants per group were needed | 549 | 33 | 33 | 33 | 29 | 88 | 24 weeks post 24‐week intervention (reported as '12 months') |
| I2: parent ‐ diet decrease | 33 | 33 | 33 | 29 | 88 | ||||
| I3: parent ‐ diet increase | 35 | 35 | 35 | 32 | 91 | ||||
| total: | 101 | 101 | 101 | 90 | 89 | ||||
| (13) Raynor 2012b | I1: parent‐only | Sample size calculations presumed 2‐sided hypothesis testing at 6‐month assessment, with type 1 error rate = 0.05. To reject with 80% power the null hypothesis of no pre‐ to post‐treatment difference between intervention conditions vs. the alternative that the pre‐ to post‐treatment difference is 0.6 or greater (effect size), 24 participants per group were needed | 549 | 29 | 29 | 29 | 26 | 90 | 24 weeks post 24‐week intervention (reported as '12 months') |
| I2: parent ‐ diet and activity traditional | 26 | 26 | 26 | 24 | 92 | ||||
| I3: parent ‐ diet and activity substitute | 26 | 26 | 26 | 24 | 92 | ||||
| total: | 81 | 81 | 81 | 74 | 91 | ||||
| (12) Margarey 2011 | I: parent healthy lifestyle | Sample size calculation was based on a reduction in BMI z score of 0.26 (SD 0.49) over 12 months (power 80%, alpha = 0.05, and drop‐out rate of 30%). This represents a 50% reduction in weight velocity over 12 months and no change in height velocity. We sought 42 children per group per site (168 children) | 398 | 85 | 85 | 85 | 52 | 61 | 80 weeks post 24‐week intervention (104 weeks) |
| C: healthy lifestyle | 84 | 84 | 84 | 54 | 64 | ||||
| total: | 169 | 169 | 169 | 106 | 63 | ||||
| (11) Jansen 2011 | I: parent CBT | ‐ | 161 | 59 | ‐ | 54 | 54 | 92 | 12 weeks post 12‐week intervention (24 weeks) |
| C: waiting list control | 39 | ‐ | 34 | 34 | 87 | ||||
| total: | 98 | 88 | 88 | 90 | |||||
| (10) Collins 2011 | I: parent‐only ‐ diet | Power: 80% chance of detecting significance (2‐sided 5% level), with a 0.26 BMI z score difference from baseline to 12 months as the initial end point, with an anticipated loss to follow‐up of 20% | 505/319 | 63 | ‐ | 42 | 22 | 35 | 80 weeks post 24‐week intervention (104 weeks) |
| C1: parent‐child (physical activity) | 73 | ‐ | 63 | 35 | 48 | ||||
| C2: parent‐child (physical activity + diet) | 70 | ‐ | 60 | 36 | 51 | ||||
| total: | 206 | ‐ | 165 | 93 | 45 | ||||
| (9) Boutelle 2011 | I: parent‐only | Sample size was determined by pragmatic factors, including budget and investigator time commitments. No interim analyses were done. The hypotheses tested related to non‐inferiority of the parent treatment to the parent‐child treatment on child and parent weight loss and child daily caloric intake and physical activity. The bound for non‐inferiority hypotheses related to BMI percentile was set to 1. This is the maximum value the parent‐child group could do better than parent‐only, below which non‐inferiority would be concluded. This bound could correspond to an mean‐aged child in this sample having a BMI of 26 in the parent‐child group and 28.5 in the parent‐only group at post‐treatment/follow‐up, assuming equivalence at baseline. For a non‐inferiority bound for child BMI, which was selected post hoc, we considered choosing a BMI that would correspond to the BMI percentile non‐inferiority bound (BMI = 2.5), but instead chose a more rigorous value of BMI = 1 | 157 | 40 | ‐ | 24 | 24 | 60 | 24 weeks post 20‐week intervention (week 44) |
| C: parent‐child | 40 | ‐ | 28 | 28 | 70 | ||||
| total: | 80 | 52 | 52 | 65 | |||||
| (8) West 2010 | I: parent‐only | ‐ | 205 | 52 | 52 | 52 | 34 | 65 | 40 weeks post 12‐week intervention (52 weeks) |
| C: waiting list control | 49 | 49 | 49 | 46 | 94 | ||||
| total: | 101 | 101 | 101 | 80 | 79 | ||||
| (7) Resnick 2009 | I: educational material + personal encounters | ‐ | 84/46 | 22 | ‐ | 18 | 18 | 82 | Unclear (41 weeks between start and last mail out) |
| C: educational material | 24 | ‐ | 24 | 24 | 100 | ||||
| total: | 46 | 42 | 42 | 91 | |||||
| (6) Estabrooks 2009 | I1: parent group + IVR | Sample size calculations were completed, varying the detectable effect sizes from small to medium with a power of 0.8. The result was a need for 42 participants per intervention to detect a medium effect and 64 participants to detect a small effect | 1487/656 | 85 | ‐ | 63 | 63 | 74 | 28‐40 weeks post 12‐ to 24‐week intervention (52 weeks) |
| I2: parent group | 85 | ‐ | 56 | 56 | 66 | ||||
| C: parent workbook | 50 | ‐ | 36 | 36 | 72 | ||||
| total: | 220 | 155 | 155 | 70 | |||||
| (5) Munsch 2008 | I: mother‐only CBT | Trial authors did not reach the necessary sample size of 68 families with obese children within the given time span (the target sample size of 68 was based on a repeated‐measures analysis with alpha = 0.05, 1 ‐ beta = 0.8, and a medium effect size for the linear term of the interaction between treatment and time, assuming a drop‐out rate of 20% | 181/60 | 25 | ‐ | 7 | 7 | 28 | 24 weeks post 10‐week intervention (34 weeks) |
| C: mother‐child CBT | 31 | ‐ | 20 | 20 | 65 | ||||
| total: | 56 | 27 | 27 | 48 | |||||
| (4) Janicke 2008 | I: parent‐only | Post hoc power analyses were used to determine the detectable change in BMI z score from 0 to 10 months for the family based and parent‐only interventions relative to the waiting list control condition. Effect sizes (standardised BMI index) detectable with 80% power and 2‐sided level 0.05 tests were used. Standard deviations and sample sizes were set equal to their observed values. For comparing the family‐based and waiting list control conditions, trial authors reported 80% power to detect a shift from 0.022 to ‐0.145. For comparing the parent‐only and waiting list control conditions, trial authors reported 80% power to detect a shift from 0.022 to ‐0.135 | 111 | 34 | ‐ | 26 | 26 | 76 | 14 weeks post 16‐week intervention (40 weeks) |
| C1: parent‐child | 33 | ‐ | 24 | 24 | 73 | ||||
| C2: waiting list control | 26 | ‐ | 21 | 21 | 81 | ||||
| total: | 93 | 71 | 71 | 76 | |||||
| (3) Golley 2007 | I: parent intervention + lifestyle education | Sample size calculation was based on a fall in BMI z score reflecting a weight gain of only 50% of that expected over 12 months with normal growth. A sample size of 28 per group was estimated to have 80% power to detect a 12‐month fall in mean BMI z score from a baseline of 0.26 (SD 0.49), assuming no change in the control group, at a 2‐sided significance level of 0.05. To account for a drop‐out rate of up to one‐third (commonly 20‐50% in child weight‐management studies), 42 children per study group were sought (126 children) | 262/115 | 38 | ‐ | 31 | 31 | 82 | 24 weeks post 24‐week intervention (48 weeks) |
| C1: parent intervention | 37 | ‐ | 29 | 29 | 78 | ||||
| C2: waiting list control | 36 | ‐ | 31 | 31 | 86 | ||||
| total: | 111 | 101 | 101 | ‐ | |||||
| (2) Golan 2006 | I: parent‐only | The study was designed to detect differences of 10% weight loss with a power of 90% and a significance level of 0.05, given a drop‐out rate of 10% with a sample of 12 in each group | 102 | 14 | ‐ | 10 | 10 | 71 | 1 year post 26‐week intervention (18 months) |
| C: parent‐child | 18 | ‐ | 17 | 17 | 94 | ||||
| total: | 32 | 27 | 27 | 84 | |||||
| (1) Aragona 1975 | I1: parent‐only with reinforcement | ‐ | ‐ | 5 | ‐ | 4 | 4 | 80 | 12 weeks (51 weeks' follow‐up) |
| I2: parent‐only | 5 | ‐ | 3 | 3 | 60 | ||||
| C: waiting list control | 5 | ‐ | 5 | 2 | 40 | ||||
| total: | 15 | 12 | 9 | 60 | |||||
| Grand total | All interventions | ‐ | 1773c | 1276 | |||||
| All comparators | 1284c | 942 | |||||||
| All interventions and comparators | 3057c | 2218 | |||||||
| aAccording to power calculation in trial publication or report "‐" denotes not reported BMI: body mass index; C: comparator; CBT: cognitive behavioural therapy; I: intervention; ITT: intention‐to‐treat; IVR: interactive voice response; n: number of participants; NOURISH: nourishing our understanding of role modelling to improve support and health; PCP: primary care providers; SD: standard deviation; YHC: Youth Health Care | |||||||||
| Outcome or subgroup title | No. of studies | No. of participants | Statistical method | Effect size |
| 1 BMI z score change post intervention Show forest plot | 3 | 277 | Mean Difference (IV, Random, 95% CI) | ‐0.06 [‐0.13, 0.02] |
| 1.1 Parent‐only vs. parent‐child | 2 | 112 | Mean Difference (IV, Random, 95% CI) | ‐0.05 [‐0.13, 0.04] |
| 1.2 Parent‐only vs. parent‐child physical activity | 1 | 84 | Mean Difference (IV, Random, 95% CI) | ‐0.15 [‐0.26, ‐0.04] |
| 1.3 Parent‐only vs. parent‐child physical activity + diet | 1 | 81 | Mean Difference (IV, Random, 95% CI) | 0.0 [‐0.11, 0.11] |
| 2 BMI z score change longest follow‐up Show forest plot | 3 | 267 | Mean Difference (IV, Random, 95% CI) | ‐0.04 [‐0.15, 0.08] |
| 2.1 Parent‐only vs. parent‐child | 2 | 102 | Mean Difference (IV, Random, 95% CI) | 0.06 [‐0.05, 0.16] |
| 2.2 Parent‐only vs. parent‐child physical activity | 1 | 84 | Mean Difference (IV, Random, 95% CI) | ‐0.16 [‐0.36, 0.04] |
| 2.3 Parent‐only vs. parent‐child physical activity + diet | 1 | 81 | Mean Difference (IV, Random, 95% CI) | ‐0.11 [‐0.31, 0.09] |
| Outcome or subgroup title | No. of studies | No. of participants | Statistical method | Effect size |
| 1 BMI z score change post intervention Show forest plot | 2 | 153 | Mean Difference (IV, Random, 95% CI) | ‐0.12 [‐0.21, ‐0.04] |
| 2 BMI z score change longest follow‐up Show forest plot | 2 | 136 | Mean Difference (IV, Fixed, 95% CI) | ‐0.10 [‐0.19, ‐0.01] |
| 2.1 Parent‐only vs. waiting list | 2 | 92 | Mean Difference (IV, Fixed, 95% CI) | ‐0.11 [‐0.21, ‐0.01] |
| 2.2 Parent‐only intensive education vs. waiting list | 1 | 44 | Mean Difference (IV, Fixed, 95% CI) | ‐0.02 [‐0.29, 0.25] |
| 3 BMI percentile change post intervention Show forest plot | 1 | Mean Difference (IV, Fixed, 95% CI) | Totals not selected | |
| 4 BMI percentile change longest follow‐up Show forest plot | 1 | Mean Difference (IV, Fixed, 95% CI) | Totals not selected | |
| 5 BMI change post intervention Show forest plot | 1 | Mean Difference (IV, Fixed, 95% CI) | Totals not selected | |
| 5.1 Parent‐only reinforcement vs. waiting list | 1 | Mean Difference (IV, Fixed, 95% CI) | 0.0 [0.0, 0.0] | |
| 5.2 Parent‐only vs. waiting list | 1 | Mean Difference (IV, Fixed, 95% CI) | 0.0 [0.0, 0.0] | |
| 6 BMI change longest follow‐up Show forest plot | 1 | Mean Difference (IV, Fixed, 95% CI) | Totals not selected | |
| 6.1 Parent‐only reinforcement vs. waiting list | 1 | Mean Difference (IV, Fixed, 95% CI) | 0.0 [0.0, 0.0] | |
| 6.2 Parent‐only vs. waiting list | 1 | Mean Difference (IV, Fixed, 95% CI) | 0.0 [0.0, 0.0] | |
| Outcome or subgroup title | No. of studies | No. of participants | Statistical method | Effect size |
| 1 BMI z score change post intervention Show forest plot | 1 | 170 | Mean Difference (IV, Random, 95% CI) | ‐0.00 [‐0.08, 0.08] |
| 1.1 Parent‐only IVR vs. control | 1 | 87 | Mean Difference (IV, Random, 95% CI) | ‐0.02 [‐0.13, 0.09] |
| 1.2 Parent‐only vs. control | 1 | 83 | Mean Difference (IV, Random, 95% CI) | 0.02 [‐0.09, 0.13] |
| 2 BMI z score change longest follow‐up Show forest plot | 1 | 165 | Mean Difference (IV, Fixed, 95% CI) | 0.01 [‐0.07, 0.09] |
| 2.1 Parent‐only interactive voice response vs. control | 1 | 86 | Mean Difference (IV, Fixed, 95% CI) | ‐0.02 [‐0.13, 0.09] |
| 2.2 Parent‐only vs. control | 1 | 79 | Mean Difference (IV, Fixed, 95% CI) | 0.04 [‐0.07, 0.15] |
| 3 BMI percentile change post intervention Show forest plot | 4 | Mean Difference (IV, Random, 95% CI) | Totals not selected | |
| 3.1 Parent‐only vs. minimal contact control | 3 | Mean Difference (IV, Random, 95% CI) | 0.0 [0.0, 0.0] | |
| 3.2 Parent motivational interviewing vs. minimal contact control | 1 | Mean Difference (IV, Random, 95% CI) | 0.0 [0.0, 0.0] | |
| 3.3 Parent motivational interviewing + dietician vs. minimal contact control | 1 | Mean Difference (IV, Random, 95% CI) | 0.0 [0.0, 0.0] | |
| 4 BMI percentile change longest follow‐up Show forest plot | 1 | Mean Difference (IV, Fixed, 95% CI) | Totals not selected | |
| 5 BMI change post intervention Show forest plot | 1 | Mean Difference (IV, Random, 95% CI) | Totals not selected | |
| 6 BMI change longest follow‐up Show forest plot | 2 | 614 | Mean Difference (IV, Random, 95% CI) | ‐0.12 [‐0.39, 0.15] |
| Outcome or subgroup title | No. of studies | No. of participants | Statistical method | Effect size |
| 1 BMI z score change post intervention Show forest plot | 5 | 507 | Mean Difference (IV, Fixed, 95% CI) | ‐0.22 [‐0.28, ‐0.17] |
| 1.1 Parent‐only interactive voice response vs. parent‐only | 1 | 132 | Mean Difference (IV, Fixed, 95% CI) | ‐0.04 [‐0.16, 0.08] |
| 1.2 Parent‐only intensive vs. parent‐only | 1 | 57 | Mean Difference (IV, Fixed, 95% CI) | ‐0.09 [‐0.38, 0.20] |
| 1.3 Parent health lifestyle vs. healthy lifestyle | 1 | 136 | Mean Difference (IV, Fixed, 95% CI) | ‐0.07 [‐0.29, 0.15] |
| 1.4 Parent‐only vs. decrease | 1 | 52 | Mean Difference (IV, Fixed, 95% CI) | ‐0.04 [‐0.17, 0.09] |
| 1.5 Parent‐only vs. increase | 1 | 49 | Mean Difference (IV, Fixed, 95% CI) | ‐0.01 [‐0.14, 0.12] |
| 1.6 Parent‐only vs. substitute | 1 | 40 | Mean Difference (IV, Fixed, 95% CI) | ‐0.70 [‐0.86, ‐0.54] |
| 1.7 Parent‐only vs. traditional | 1 | 41 | Mean Difference (IV, Fixed, 95% CI) | ‐0.69 [‐0.83, ‐0.55] |
| 2 BMI z score change longest follow‐up Show forest plot | 5 | 467 | Mean Difference (IV, Fixed, 95% CI) | ‐0.03 [‐0.10, 0.03] |
| 2.1 Parent‐only interactive voice response vs. parent‐only | 1 | 119 | Mean Difference (IV, Fixed, 95% CI) | ‐0.06 [‐0.18, 0.06] |
| 2.2 Parent‐only intensive vs. parent‐only | 1 | 60 | Mean Difference (IV, Fixed, 95% CI) | ‐0.09 [‐0.32, 0.14] |
| 2.3 Parent health lifestyle vs. healthy lifestyle | 1 | 106 | Mean Difference (IV, Fixed, 95% CI) | 0.03 [‐0.24, 0.30] |
| 2.4 Parent‐only vs. decrease | 1 | 52 | Mean Difference (IV, Fixed, 95% CI) | ‐0.04 [‐0.19, 0.11] |
| 2.5 Parent‐only vs. increase | 1 | 49 | Mean Difference (IV, Fixed, 95% CI) | ‐0.02 [‐0.17, 0.13] |
| 2.6 Parent‐only vs. substitute | 1 | 41 | Mean Difference (IV, Fixed, 95% CI) | ‐0.03 [‐0.24, 0.18] |
| 2.7 Parent‐only vs. traditional | 1 | 40 | Mean Difference (IV, Fixed, 95% CI) | 0.01 [‐0.17, 0.19] |
| 3 BMI change post intervention Show forest plot | 1 | Mean Difference (IV, Fixed, 95% CI) | Totals not selected | |
| 4 BMI change longest follow‐up Show forest plot | 1 | Mean Difference (IV, Fixed, 95% CI) | Totals not selected | |
| 5 BMI percentile change post intervention [%] Show forest plot | 1 | Mean Difference (IV, Random, 95% CI) | Totals not selected | |