Scolaris Content Display Scolaris Content Display

Study flow diagram
Figuras y tablas -
Figure 1

Study flow diagram

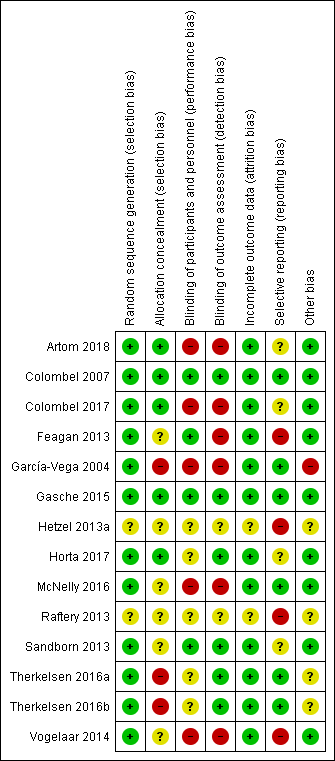
Risk of bias summary: review authors' judgements about each risk of bias item for each included study.
Figuras y tablas -
Figure 2

Risk of bias summary: review authors' judgements about each risk of bias item for each included study.

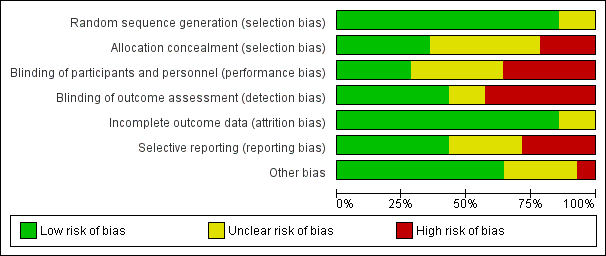
Risk of bias graph: review authors' judgements about each risk of bias item presented as percentages across all included studies.
Figuras y tablas -
Figure 3

Risk of bias graph: review authors' judgements about each risk of bias item presented as percentages across all included studies.

Comparison 1 Adalimumab maintenance versus placebo, Outcome 1 Fatigue: SF‐36 Vitality.
Figuras y tablas -
Analysis 1.1

Comparison 1 Adalimumab maintenance versus placebo, Outcome 1 Fatigue: SF‐36 Vitality.

Comparison 1 Adalimumab maintenance versus placebo, Outcome 2 Quality of life: SF‐36 PCS.
Figuras y tablas -
Analysis 1.2

Comparison 1 Adalimumab maintenance versus placebo, Outcome 2 Quality of life: SF‐36 PCS.

Comparison 1 Adalimumab maintenance versus placebo, Outcome 3 Quality of life: SF‐36 MCS.
Figuras y tablas -
Analysis 1.3

Comparison 1 Adalimumab maintenance versus placebo, Outcome 3 Quality of life: SF‐36 MCS.

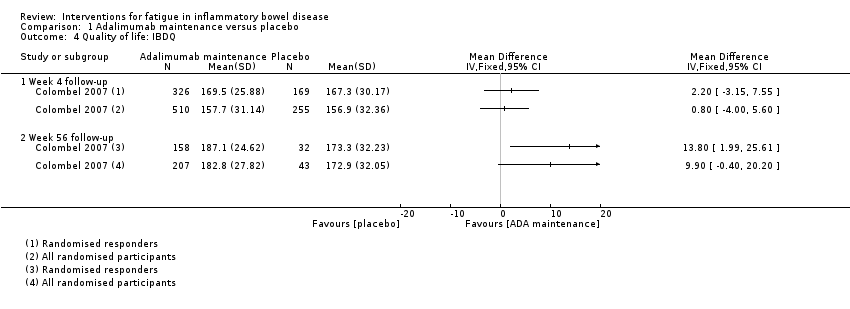
Comparison 1 Adalimumab maintenance versus placebo, Outcome 4 Quality of life: IBDQ.
Figuras y tablas -
Analysis 1.4

Comparison 1 Adalimumab maintenance versus placebo, Outcome 4 Quality of life: IBDQ.

Comparison 1 Adalimumab maintenance versus placebo, Outcome 5 Adverse events.
Figuras y tablas -
Analysis 1.5

Comparison 1 Adalimumab maintenance versus placebo, Outcome 5 Adverse events.

Comparison 1 Adalimumab maintenance versus placebo, Outcome 6 Serious AEs.
Figuras y tablas -
Analysis 1.6

Comparison 1 Adalimumab maintenance versus placebo, Outcome 6 Serious AEs.

Comparison 1 Adalimumab maintenance versus placebo, Outcome 7 Withdrawal due to AEs.
Figuras y tablas -
Analysis 1.7

Comparison 1 Adalimumab maintenance versus placebo, Outcome 7 Withdrawal due to AEs.

Comparison 2 Adalimumab 40 mg eow versus placebo, Outcome 1 Fatigue: FACIT‐ F.
Figuras y tablas -
Analysis 2.1

Comparison 2 Adalimumab 40 mg eow versus placebo, Outcome 1 Fatigue: FACIT‐ F.

Comparison 2 Adalimumab 40 mg eow versus placebo, Outcome 2 Fatigue: SF‐36 Vitality.
Figuras y tablas -
Analysis 2.2

Comparison 2 Adalimumab 40 mg eow versus placebo, Outcome 2 Fatigue: SF‐36 Vitality.

Comparison 2 Adalimumab 40 mg eow versus placebo, Outcome 3 Quality of life: SF‐36 PCS.
Figuras y tablas -
Analysis 2.3

Comparison 2 Adalimumab 40 mg eow versus placebo, Outcome 3 Quality of life: SF‐36 PCS.

Comparison 2 Adalimumab 40 mg eow versus placebo, Outcome 4 Quality of life: SF‐36 MCS.
Figuras y tablas -
Analysis 2.4

Comparison 2 Adalimumab 40 mg eow versus placebo, Outcome 4 Quality of life: SF‐36 MCS.

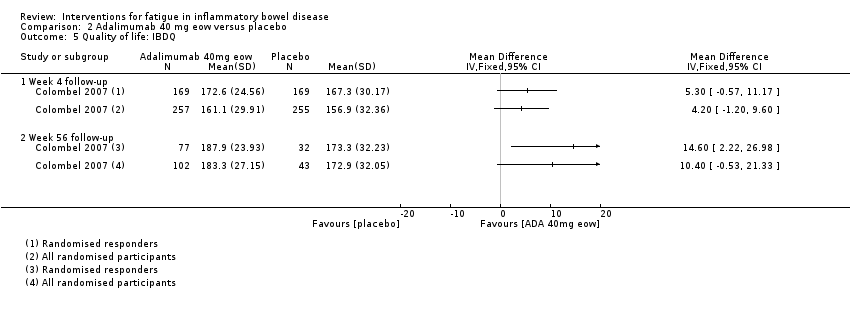
Comparison 2 Adalimumab 40 mg eow versus placebo, Outcome 5 Quality of life: IBDQ.
Figuras y tablas -
Analysis 2.5

Comparison 2 Adalimumab 40 mg eow versus placebo, Outcome 5 Quality of life: IBDQ.

Comparison 2 Adalimumab 40 mg eow versus placebo, Outcome 6 Adverse events.
Figuras y tablas -
Analysis 2.6

Comparison 2 Adalimumab 40 mg eow versus placebo, Outcome 6 Adverse events.

Comparison 2 Adalimumab 40 mg eow versus placebo, Outcome 7 Serious AEs.
Figuras y tablas -
Analysis 2.7

Comparison 2 Adalimumab 40 mg eow versus placebo, Outcome 7 Serious AEs.

Comparison 2 Adalimumab 40 mg eow versus placebo, Outcome 8 Withdrawal due to AEs.
Figuras y tablas -
Analysis 2.8

Comparison 2 Adalimumab 40 mg eow versus placebo, Outcome 8 Withdrawal due to AEs.

Comparison 3 Adalimumab 40 mg weekly versus placebo, Outcome 1 Fatigue: FACIT‐Fatigue.
Figuras y tablas -
Analysis 3.1

Comparison 3 Adalimumab 40 mg weekly versus placebo, Outcome 1 Fatigue: FACIT‐Fatigue.

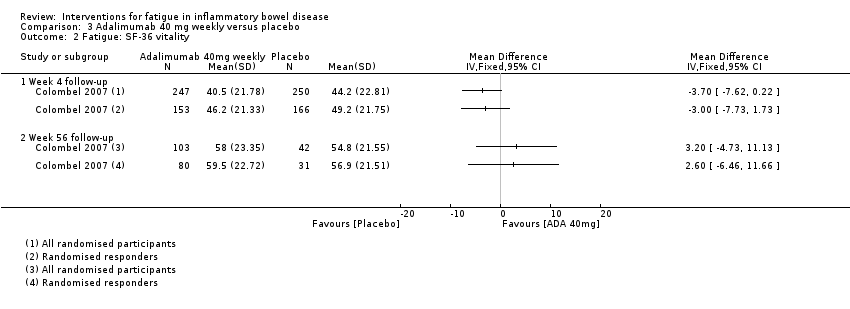
Comparison 3 Adalimumab 40 mg weekly versus placebo, Outcome 2 Fatigue: SF‐36 vitality.
Figuras y tablas -
Analysis 3.2

Comparison 3 Adalimumab 40 mg weekly versus placebo, Outcome 2 Fatigue: SF‐36 vitality.

Comparison 3 Adalimumab 40 mg weekly versus placebo, Outcome 3 Quality of life: SF‐36 PCS.
Figuras y tablas -
Analysis 3.3

Comparison 3 Adalimumab 40 mg weekly versus placebo, Outcome 3 Quality of life: SF‐36 PCS.

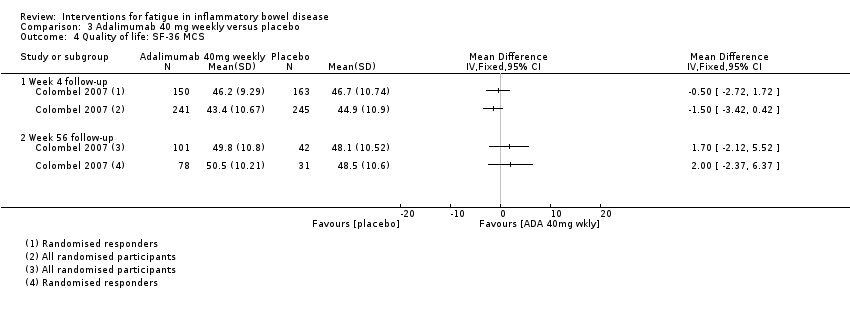
Comparison 3 Adalimumab 40 mg weekly versus placebo, Outcome 4 Quality of life: SF‐36 MCS.
Figuras y tablas -
Analysis 3.4

Comparison 3 Adalimumab 40 mg weekly versus placebo, Outcome 4 Quality of life: SF‐36 MCS.

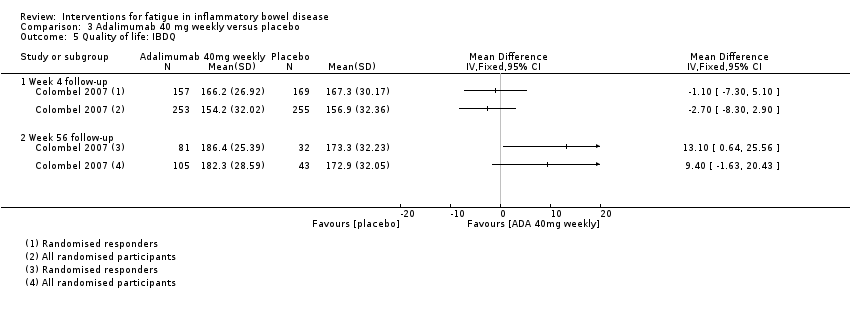
Comparison 3 Adalimumab 40 mg weekly versus placebo, Outcome 5 Quality of life: IBDQ.
Figuras y tablas -
Analysis 3.5

Comparison 3 Adalimumab 40 mg weekly versus placebo, Outcome 5 Quality of life: IBDQ.

Comparison 3 Adalimumab 40 mg weekly versus placebo, Outcome 6 Adverse events.
Figuras y tablas -
Analysis 3.6

Comparison 3 Adalimumab 40 mg weekly versus placebo, Outcome 6 Adverse events.

Comparison 3 Adalimumab 40 mg weekly versus placebo, Outcome 7 Serious AEs.
Figuras y tablas -
Analysis 3.7

Comparison 3 Adalimumab 40 mg weekly versus placebo, Outcome 7 Serious AEs.

Comparison 3 Adalimumab 40 mg weekly versus placebo, Outcome 8 Withdrawal due to AEs.
Figuras y tablas -
Analysis 3.8

Comparison 3 Adalimumab 40 mg weekly versus placebo, Outcome 8 Withdrawal due to AEs.

Comparison 4 AndoSan versus placebo, Outcome 1 Fatigue: Total Fatigue Score.
Figuras y tablas -
Analysis 4.1

Comparison 4 AndoSan versus placebo, Outcome 1 Fatigue: Total Fatigue Score.

Comparison 4 AndoSan versus placebo, Outcome 2 Fatigue: SF‐36 Vitality subscale.
Figuras y tablas -
Analysis 4.2

Comparison 4 AndoSan versus placebo, Outcome 2 Fatigue: SF‐36 Vitality subscale.

Comparison 5 Ferric maltol versus placebo, Outcome 1 Fatigue: SF‐36 Vitality subscale.
Figuras y tablas -
Analysis 5.1

Comparison 5 Ferric maltol versus placebo, Outcome 1 Fatigue: SF‐36 Vitality subscale.

Comparison 5 Ferric maltol versus placebo, Outcome 2 Quality of life: IBDQ.
Figuras y tablas -
Analysis 5.2

Comparison 5 Ferric maltol versus placebo, Outcome 2 Quality of life: IBDQ.

Comparison 5 Ferric maltol versus placebo, Outcome 3 Adverse events.
Figuras y tablas -
Analysis 5.3

Comparison 5 Ferric maltol versus placebo, Outcome 3 Adverse events.

Comparison 5 Ferric maltol versus placebo, Outcome 4 Serious AEs.
Figuras y tablas -
Analysis 5.4

Comparison 5 Ferric maltol versus placebo, Outcome 4 Serious AEs.

Comparison 5 Ferric maltol versus placebo, Outcome 5 Withdrawal due to AEs.
Figuras y tablas -
Analysis 5.5

Comparison 5 Ferric maltol versus placebo, Outcome 5 Withdrawal due to AEs.

Comparison 6 Electroacupuncture versus no treatment, Outcome 1 Fatigue: FACIT‐F.
Figuras y tablas -
Analysis 6.1

Comparison 6 Electroacupuncture versus no treatment, Outcome 1 Fatigue: FACIT‐F.

Comparison 6 Electroacupuncture versus no treatment, Outcome 2 Quality of life: IBDQ‐9.
Figuras y tablas -
Analysis 6.2

Comparison 6 Electroacupuncture versus no treatment, Outcome 2 Quality of life: IBDQ‐9.

Comparison 6 Electroacupuncture versus no treatment, Outcome 3 Adverse events.
Figuras y tablas -
Analysis 6.3

Comparison 6 Electroacupuncture versus no treatment, Outcome 3 Adverse events.

Comparison 6 Electroacupuncture versus no treatment, Outcome 4 Serious AEs.
Figuras y tablas -
Analysis 6.4

Comparison 6 Electroacupuncture versus no treatment, Outcome 4 Serious AEs.

Comparison 6 Electroacupuncture versus no treatment, Outcome 5 Withdrawal due to AEs.
Figuras y tablas -
Analysis 6.5

Comparison 6 Electroacupuncture versus no treatment, Outcome 5 Withdrawal due to AEs.

Comparison 7 Electroacupuncture versus sham electroacupuncture, Outcome 1 Fatigue: FACIT‐F.
Figuras y tablas -
Analysis 7.1

Comparison 7 Electroacupuncture versus sham electroacupuncture, Outcome 1 Fatigue: FACIT‐F.

Comparison 7 Electroacupuncture versus sham electroacupuncture, Outcome 2 Quality of life: IBDQ‐9.
Figuras y tablas -
Analysis 7.2

Comparison 7 Electroacupuncture versus sham electroacupuncture, Outcome 2 Quality of life: IBDQ‐9.

Comparison 7 Electroacupuncture versus sham electroacupuncture, Outcome 3 Adverse events.
Figuras y tablas -
Analysis 7.3

Comparison 7 Electroacupuncture versus sham electroacupuncture, Outcome 3 Adverse events.

Comparison 7 Electroacupuncture versus sham electroacupuncture, Outcome 4 Serious AEs.
Figuras y tablas -
Analysis 7.4

Comparison 7 Electroacupuncture versus sham electroacupuncture, Outcome 4 Serious AEs.

Comparison 7 Electroacupuncture versus sham electroacupuncture, Outcome 5 Withdrawal due to AEs.
Figuras y tablas -
Analysis 7.5

Comparison 7 Electroacupuncture versus sham electroacupuncture, Outcome 5 Withdrawal due to AEs.

Comparison 8 Guided stress management versus conventional medical treatment, Outcome 1 Fatigue: Average frequency symptom (tiredness).
Figuras y tablas -
Analysis 8.1

Comparison 8 Guided stress management versus conventional medical treatment, Outcome 1 Fatigue: Average frequency symptom (tiredness).

Comparison 8 Guided stress management versus conventional medical treatment, Outcome 2 Fatigue: Average severity of tiredness.
Figuras y tablas -
Analysis 8.2

Comparison 8 Guided stress management versus conventional medical treatment, Outcome 2 Fatigue: Average severity of tiredness.

Comparison 9 Self‐directed stress management versus conventional medical treatment, Outcome 1 Fatigue: Average frequency of tiredness.
Figuras y tablas -
Analysis 9.1

Comparison 9 Self‐directed stress management versus conventional medical treatment, Outcome 1 Fatigue: Average frequency of tiredness.

Comparison 9 Self‐directed stress management versus conventional medical treatment, Outcome 2 Fatigue: Average severity of tiredness.
Figuras y tablas -
Analysis 9.2

Comparison 9 Self‐directed stress management versus conventional medical treatment, Outcome 2 Fatigue: Average severity of tiredness.

Comparison 10 CBT with therapist support versus fatigue information leaflet only, Outcome 1 Fatigue: IBD‐F Section I.
Figuras y tablas -
Analysis 10.1

Comparison 10 CBT with therapist support versus fatigue information leaflet only, Outcome 1 Fatigue: IBD‐F Section I.

Comparison 10 CBT with therapist support versus fatigue information leaflet only, Outcome 2 Fatigue: IBD‐F Section II.
Figuras y tablas -
Analysis 10.2

Comparison 10 CBT with therapist support versus fatigue information leaflet only, Outcome 2 Fatigue: IBD‐F Section II.

Comparison 10 CBT with therapist support versus fatigue information leaflet only, Outcome 3 Quality of life: UK‐IBDQ.
Figuras y tablas -
Analysis 10.3

Comparison 10 CBT with therapist support versus fatigue information leaflet only, Outcome 3 Quality of life: UK‐IBDQ.

Comparison 11 Physical activity advice plus omega 3 versus no physical activity advice plus omega 3, Outcome 1 Fatigue: FACIT‐F.
Figuras y tablas -
Analysis 11.1

Comparison 11 Physical activity advice plus omega 3 versus no physical activity advice plus omega 3, Outcome 1 Fatigue: FACIT‐F.

Comparison 11 Physical activity advice plus omega 3 versus no physical activity advice plus omega 3, Outcome 2 Fatigue: MFI.
Figuras y tablas -
Analysis 11.2

Comparison 11 Physical activity advice plus omega 3 versus no physical activity advice plus omega 3, Outcome 2 Fatigue: MFI.

Comparison 11 Physical activity advice plus omega 3 versus no physical activity advice plus omega 3, Outcome 3 Fatigue: IBD‐F Section I.
Figuras y tablas -
Analysis 11.3

Comparison 11 Physical activity advice plus omega 3 versus no physical activity advice plus omega 3, Outcome 3 Fatigue: IBD‐F Section I.

Comparison 11 Physical activity advice plus omega 3 versus no physical activity advice plus omega 3, Outcome 4 Fatigue: IBD‐F Section II.
Figuras y tablas -
Analysis 11.4

Comparison 11 Physical activity advice plus omega 3 versus no physical activity advice plus omega 3, Outcome 4 Fatigue: IBD‐F Section II.

Comparison 11 Physical activity advice plus omega 3 versus no physical activity advice plus omega 3, Outcome 5 Quality of life: IBDQ.
Figuras y tablas -
Analysis 11.5

Comparison 11 Physical activity advice plus omega 3 versus no physical activity advice plus omega 3, Outcome 5 Quality of life: IBDQ.

Comparison 12 Physical activity advice plus placebo versus no physical activity advice plus placebo, Outcome 1 Fatigue: FACIT‐F.
Figuras y tablas -
Analysis 12.1

Comparison 12 Physical activity advice plus placebo versus no physical activity advice plus placebo, Outcome 1 Fatigue: FACIT‐F.

Comparison 12 Physical activity advice plus placebo versus no physical activity advice plus placebo, Outcome 2 Fatigue: MFI.
Figuras y tablas -
Analysis 12.2

Comparison 12 Physical activity advice plus placebo versus no physical activity advice plus placebo, Outcome 2 Fatigue: MFI.

Comparison 12 Physical activity advice plus placebo versus no physical activity advice plus placebo, Outcome 3 Fatigue: IBD‐F Section I.
Figuras y tablas -
Analysis 12.3

Comparison 12 Physical activity advice plus placebo versus no physical activity advice plus placebo, Outcome 3 Fatigue: IBD‐F Section I.

Comparison 12 Physical activity advice plus placebo versus no physical activity advice plus placebo, Outcome 4 Fatigue: IBD‐F Section II.
Figuras y tablas -
Analysis 12.4

Comparison 12 Physical activity advice plus placebo versus no physical activity advice plus placebo, Outcome 4 Fatigue: IBD‐F Section II.

Comparison 12 Physical activity advice plus placebo versus no physical activity advice plus placebo, Outcome 5 Quality of life: IBDQ.
Figuras y tablas -
Analysis 12.5

Comparison 12 Physical activity advice plus placebo versus no physical activity advice plus placebo, Outcome 5 Quality of life: IBDQ.

Comparison 13 Physical activity advice plus placebo versus no physical activity advice plus omega 3, Outcome 1 Fatigue: FACIT‐F.
Figuras y tablas -
Analysis 13.1

Comparison 13 Physical activity advice plus placebo versus no physical activity advice plus omega 3, Outcome 1 Fatigue: FACIT‐F.

Comparison 13 Physical activity advice plus placebo versus no physical activity advice plus omega 3, Outcome 2 Fatigue: MFI.
Figuras y tablas -
Analysis 13.2

Comparison 13 Physical activity advice plus placebo versus no physical activity advice plus omega 3, Outcome 2 Fatigue: MFI.

Comparison 13 Physical activity advice plus placebo versus no physical activity advice plus omega 3, Outcome 3 Fatigue: IBD‐F Section I.
Figuras y tablas -
Analysis 13.3

Comparison 13 Physical activity advice plus placebo versus no physical activity advice plus omega 3, Outcome 3 Fatigue: IBD‐F Section I.

Comparison 13 Physical activity advice plus placebo versus no physical activity advice plus omega 3, Outcome 4 Fatigue: IBD‐F Section II.
Figuras y tablas -
Analysis 13.4

Comparison 13 Physical activity advice plus placebo versus no physical activity advice plus omega 3, Outcome 4 Fatigue: IBD‐F Section II.

Comparison 13 Physical activity advice plus placebo versus no physical activity advice plus omega 3, Outcome 5 Quality of life: IBDQ.
Figuras y tablas -
Analysis 13.5

Comparison 13 Physical activity advice plus placebo versus no physical activity advice plus omega 3, Outcome 5 Quality of life: IBDQ.

Summary of findings for the main comparison. Electroacupuncture compared to no treatment for participants with quiescent IBD

Electroacupuncture compared to control for participants with quiescent IBD

Patient or population: participants with quiescent IBD
Setting: outpatients from a single centre in Spain
Intervention: electroacupuncture
Comparison: no treatment

Outcomes

Anticipated absolute effects* (95% CI)

Relative effect
(95% CI)

№ of participants
(studies)

Certainty of the evidence
(GRADE)

Comments

Risk with control

Risk with electroacupuncture

Fatigue
assessed with: FACIT‐Fatigue
follow‐up: 8 weeks

The mean fatigue score was 25.2

MD 8 higher
(6.45 higher to 9.55 higher)

27
(1 RCT)

⊕⊕⊝⊝
LOW 1

FACIT‐F scores ranged from 0 to 52, with higher scores indicating less fatigue. The difference in fatigue levels at the week‐16 follow‐up could not be calculated.

Quality of life
assessed with: IBDQ‐9
follow‐up: 8 weeks

The mean quality of life score was 57.0

MD 4.5 higher
(3.37 higher to 5.63 higher)

27
(1 RCT)

⊕⊕⊝⊝
LOW 1

IBDQ‐9 scores ranged from 9 to 63, with higher scores indicating better quality of life.

Adverse events
follow‐up: 16 weeks

See comment

34
(1 RCT)

⊕⊕⊝⊝
LOW 2

Safety evaluations occurred throughout the treatment period; no events were reported in either group.

Serious adverse events
follow‐up: 16 weeks

See comment

34
(1 RCT)

⊕⊕⊝⊝
LOW 2

Safety evaluations occurred throughout the treatment period; no events were reported in either group.

Withdrawal due to adverse events
follow‐up: 16 weeks

See comment

34
(1 RCT)

⊕⊕⊝⊝
LOW 2

Safety evaluations occurred throughout the treatment period; no events were reported in either group.

*The risk in the intervention group (and its 95% confidence interval) is based on the assumed risk in the comparison group and the relative effect of the intervention (and its 95% CI).

CI: Confidence interval; RR: Risk ratio; OR: Odds ratio;

GRADE Working Group grades of evidence
High certainty: We are very confident that the true effect lies close to that of the estimate of the effect
Moderate certainty: We are moderately confident in the effect estimate: The true effect is likely to be close to the estimate of the effect, but there is a possibility that it is substantially different
Low certainty: Our confidence in the effect estimate is limited: The true effect may be substantially different from the estimate of the effect
Very low certainty: We have very little confidence in the effect estimate: The true effect is likely to be substantially different from the estimate of effect

1 Downgraded two levels due to very serious imprecision as the number of participants was small and the confidence interval was wide.

2 Downgraded two levels due to very serious imprecision as the number of participants was small and an unvalidated outcome measure was used.

Figuras y tablas -
Summary of findings for the main comparison. Electroacupuncture compared to no treatment for participants with quiescent IBD
Summary of findings 2. Electroacupuncture compared to sham electroacupuncture for participants with quiescent IBD

Electroacupuncture compared to sham electroacupuncture for participants with quiescent IBD

Patient or population: participants with quiescent IBD
Setting: outpatients from a single centre in Spain
Intervention: electroacupuncture
Comparison: sham electroacupuncture

Outcomes

Anticipated absolute effects* (95% CI)

Relative effect
(95% CI)

№ of participants
(studies)

Certainty of the evidence
(GRADE)

Comments

Risk with sham electroacupuncture

Risk with electroacupuncture

Fatigue
assessed with: FACIT‐F
follow‐up: 16 weeks

The mean fatigue score was 28.8

MD 2.6 higher
(0.74 higher to 4.46 higher)

30
(1 RCT)

⊕⊕⊝⊝
LOW 1

FACIT‐F scores ranged from 0 to 52, with higher scores indicating less fatigue.

Quality of life
assessed with: IBDQ‐9
follow‐up: 16 weeks

The mean quality of life score was 58.6

MD 2.2 higher
(0.98 higher to 3.42 higher)

30
(1 RCT)

⊕⊕⊝⊝
LOW 1

IBDQ‐9 scores ranged from 9 to 63, with higher scores indicating better quality of life.

Adverse events
follow‐up: 16 weeks

See comment

OR 0.32
(0.01 to 8.27)

36
(1 RCT)

⊕⊕⊝⊝
LOW 1

One adverse event was reported in the sham acupuncture group.

Serious adverse events
follow‐up: 16 weeks

See comment

36
(1 RCT)

⊕⊕⊝⊝
LOW 1

Safety evaluations occurred throughout the treatment period; no events were reported in either group.

Withdrawal due to adverse events
follow‐up: 16 weeks

See comment

OR 0.32
(0.01 to 8.27)

36
(1 RCT)

⊕⊕⊝⊝
LOW 1

There was one withdrawal due to adverse events in the sham acupuncture group.

*The risk in the intervention group (and its 95% confidence interval) is based on the assumed risk in the comparison group and the relative effect of the intervention (and its 95% CI).

CI: Confidence interval; RR: Risk ratio; OR: Odds ratio;

GRADE Working Group grades of evidence
High certainty: We are very confident that the true effect lies close to that of the estimate of the effect
Moderate certainty: We are moderately confident in the effect estimate: The true effect is likely to be close to the estimate of the effect, but there is a possibility that it is substantially different
Low certainty: Our confidence in the effect estimate is limited: The true effect may be substantially different from the estimate of the effect
Very low certainty: We have very little confidence in the effect estimate: The true effect is likely to be substantially different from the estimate of effect

1 Downgraded two levels for very serious imprecision; small number of participants from a single study and the confidence interval was wide.

Figuras y tablas -
Summary of findings 2. Electroacupuncture compared to sham electroacupuncture for participants with quiescent IBD
Summary of findings 3. CBT with therapist support compared to fatigue information leaflet only for participants with IBD

CBT with therapist support compared to fatigue information leaflet only for participants with IBD

Patient or population: participants with IBD
Setting: outpatients from a single centre in the United Kingdom
Intervention: CBT with therapist support
Comparison: fatigue information leaflet only

Outcomes

Anticipated absolute effects* (95% CI)

Relative effect
(95% CI)

№ of participants
(studies)

Certainty of the evidence
(GRADE)

Comments

Risk with fatigue information leaflet only

Risk with CBT with therapist support

Fatigue
assessed with: IBD‐F Section I
follow‐up: 3 months

The mean fatigue score was 9.45

MD 2.16 lower
(6.13 lower to 1.81 higher)

18
(1 RCT)

⊕⊝⊝⊝
VERY LOW 1 2

IBD‐F Section I scores ranged from 0 to 20, with higher scores indicating greater levels of fatigue.

Fatigue
assessed with: IBD‐F Section II
Scale from: 0 to 120
follow‐up: 3 months

The mean fatigue score was 47.33

MD 21.62 lower
(45.02 lower to 1.78 higher)

16
(1 RCT)

⊕⊝⊝⊝
VERY LOW 1 2

IBD‐F Section II scores ranged from 0 to 120, with higher scores indicating greater impact of fatigue.

Quality of life
assessed with: UK‐IBDQ
follow‐up: 3 months

The mean quality of life score was 95.7

MD 0.19 higher
(9.32 lower to 9.7 higher)

19
(1 RCT)

⊕⊝⊝⊝
VERY LOW 1 2

UK‐IBDQ scores ranged from 32 to 224, with higher scores indicating better quality of life.

Adverse events

This outcome was not measured.

Serious adverse events

This outcome was not measured.

Withdrawal due to adverse events

This outcome was not measured.

*The risk in the intervention group (and its 95% confidence interval) is based on the assumed risk in the comparison group and the relative effect of the intervention (and its 95% CI).

CI: Confidence interval; RR: Risk ratio; OR: Odds ratio;

GRADE Working Group grades of evidence
High certainty: We are very confident that the true effect lies close to that of the estimate of the effect
Moderate certainty: We are moderately confident in the effect estimate: The true effect is likely to be close to the estimate of the effect, but there is a possibility that it is substantially different
Low certainty: Our confidence in the effect estimate is limited: The true effect may be substantially different from the estimate of the effect
Very low certainty: We have very little confidence in the effect estimate: The true effect is likely to be substantially different from the estimate of effect

1 Downgraded two levels for very serious imprecision; small number of participants from a single study and the confidence interval was wide.

2 Downgraded one level due to risk of bias in blinding of participants and personnel and blinding in outcome assessment.

Figuras y tablas -
Summary of findings 3. CBT with therapist support compared to fatigue information leaflet only for participants with IBD
Summary of findings 4. Physical activity advice plus omega 3 compared to no physical activity advice plus omega 3 for participants with quiescent IBD

Physical activity advice plus omega 3 compared to no physical activity advice plus omega 3 for participants with quiescent IBD

Patient or population: participants with quiescent IBD
Setting: outpatients from a single centre in the United Kingdom
Intervention: physical activity advice plus omega 3
Comparison: no physical activity advice plus omega 3

Outcomes

Anticipated absolute effects* (95% CI)

Relative effect
(95% CI)

№ of participants
(studies)

Certainty of the evidence
(GRADE)

Comments

Risk with no physical activity advice plus omega 3

Risk with physical activity advice plus omega 3

Fatigue
assessed with: FACIT‐F
follow‐up: 12 weeks

The mean fatigue score was 32.1

MD 6.4 higher
(1.8 lower to 14.6 higher)

25
(1 RCT)

⊕⊝⊝⊝
VERY LOW 1 2

FACIT‐F scores ranged from 0 to 52, with higher scores indicating less fatigue.

Fatigue
assessed with: MFI
follow‐up: 12 weeks

The mean fatigue score was 14.1

MD 0.5 lower
(3.88 lower to 2.88 higher)

25
(1 RCT)

⊕⊝⊝⊝
VERY LOW 1 2

MFI scores ranged from 0 to 84, with higher scores indicating greater fatigue.

Fatigue
assessed with: IBD‐F Section I
follow‐up: 12 weeks

The mean fatigue score was 9.6

MD 3.1 lower
(6.67 lower to 0.47 higher)

25
(1 RCT)

⊕⊝⊝⊝
VERY LOW 1 2

IBD‐F Section I scores ranged from 0 to 20, with higher scores indicating greater levels of fatigue.

Fatigue
assessed with: IBD‐F Section II
follow‐up: 12 weeks

The mean fatigue score was 34.8

MD 13.1 lower
(29.37 lower to 3.17 higher)

25
(1 RCT)

⊕⊝⊝⊝
VERY LOW 1 2

IBD‐F Section II scores ranged from 0 to 120, with higher scores indicating greater impact of fatigue.

Quality of life assessed with: IBDQ

follow‐up: 12 weeks

The mean QoL score was 167

MD 4.00 higher (18.46 lower to 26.46 higher)

25 (1 RCT)

⊕⊝⊝⊝
VERY LOW 1 2

IBDQ scores ranged from 32 to 224, with higher scores indicating better quality of life.

Adverse events
assessed with: Medication diary
follow‐up: 12 weeks

There were five reported adverse events in the physical activity advice plus omega 3 group and 14 adverse events in the control group, including epigastric pain, bloating, and nausea and vomiting.

25 (1 RCT)

⊕⊝⊝⊝
VERY LOW 1 2

Adverse events were recorded in the medication diary and assessed by the researcher during the 6 follow‐up contact time points.

Serious adverse events

This outcome was not reported.

Withdrawal due to adverse events

This outcome was not reported.

*The risk in the intervention group (and its 95% confidence interval) is based on the assumed risk in the comparison group and the relative effect of the intervention (and its 95% CI).

CI: Confidence interval; RR: Risk ratio; OR: Odds ratio;

GRADE Working Group grades of evidence
High certainty: We are very confident that the true effect lies close to that of the estimate of the effect
Moderate certainty: We are moderately confident in the effect estimate: The true effect is likely to be close to the estimate of the effect, but there is a possibility that it is substantially different
Low certainty: Our confidence in the effect estimate is limited: The true effect may be substantially different from the estimate of the effect
Very low certainty: We have very little confidence in the effect estimate: The true effect is likely to be substantially different from the estimate of effect

1 Downgraded two levels due to very serious imprecision as the number of participants was small, confidence interval was wide and pre‐protocol analyses used.

2 Downgraded one level as high risk of bias for blinding of participants and personnel and blinding of outcome assessment.

Figuras y tablas -
Summary of findings 4. Physical activity advice plus omega 3 compared to no physical activity advice plus omega 3 for participants with quiescent IBD
Summary of findings 5. Physical activity advice plus placebo compared to no physical activity advice plus placebo for participants with quiescent IBD

Physical activity advice plus placebo compared to no physical activity advice plus placebo for participants with quiescent IBD

Patient or population: participants with quiescent IBD
Setting: outpatients from a single centre in the United Kingdom
Intervention: physical activity advice plus placebo
Comparison: no physical activity advice plus placebo

Outcomes

Anticipated absolute effects* (95% CI)

Relative effect
(95% CI)

№ of participants
(studies)

Certainty of the evidence
(GRADE)

Comments

Risk with no physical activity advice plus placebo

Risk with physical activity advice plus placebo

Fatigue
assessed with: FACIT‐F
follow‐up: 12 weeks

The mean fatigue was 38.4

MD 2.7 higher
(2.48 lower to 7.88 higher)

27
(1 RCT)

⊕⊝⊝⊝
VERY LOW 1 2

FACIT‐F scores ranged from 0 to 52, with higher scores indicating less fatigue.

Fatigue
assessed with: MFI
follow‐up: 12 weeks

The mean fatigue was 15.3

MD 2.6 lower
(4.7 lower to 0.5 lower)

27
(1 RCT)

⊕⊝⊝⊝
VERY LOW 1 2

MFI scores ranged from 0 to 84, with higher scores indicating greater fatigue.

Fatigue
assessed with: IBD‐F Section I
follow‐up: 12 weeks

The mean fatigue was 8.5

MD 1.7 lower
(4.04 lower to 0.64 higher)

27
(1 RCT)

⊕⊝⊝⊝
VERY LOW 1 2

IBD‐F Section I scores ranged from 0 to 20, with higher scores indicating greater levels of fatigue.

Fatigue
assessed with: IBD‐F Section II
follow‐up: 12 weeks

The mean fatigue was 27.9

MD 8.5 lower
(21.57 lower to 4.57 higher)

27
(1 RCT)

⊕⊝⊝⊝
VERY LOW 1 2

IBD‐F Section II scores ranged from 0 to 120, with higher scores indicating greater impact of fatigue.

Adverse events: assessed with: Medication diary
follow‐up: 12 weeks

There were four reported adverse events in the physical activity advice plus placebo group and five reported adverse events in the no physical activity advice plus placebo group, including epigastric pain, diarrhoea, bloating, nausea and vomiting, headache, and molluscum

27
(1 RCT)

⊕⊝⊝⊝
VERY LOW 1 2

Adverse events were recorded in the medication diary and assessed by the researcher during the 6 follow‐up contact time points.

Serious adverse events ‐ not reported

This outcome was not reported.

Withdrawal due to adverse events ‐ not reported

This outcome was not reported.

*The risk in the intervention group (and its 95% confidence interval) is based on the assumed risk in the comparison group and the relative effect of the intervention (and its 95% CI).

CI: Confidence interval; RR: Risk ratio; OR: Odds ratio;

GRADE Working Group grades of evidence
High certainty: We are very confident that the true effect lies close to that of the estimate of the effect
Moderate certainty: We are moderately confident in the effect estimate: The true effect is likely to be close to the estimate of the effect, but there is a possibility that it is substantially different
Low certainty: Our confidence in the effect estimate is limited: The true effect may be substantially different from the estimate of the effect
Very low certainty: We have very little confidence in the effect estimate: The true effect is likely to be substantially different from the estimate of effect

1 Downgraded two levels due to very serious imprecision as the number of participants was small, the confidence interval was wide and per protocol analyses used.

2 Downgraded one level due to high risk of bias for blinding of participants and personnel and blinding of outcome assessments.

Figuras y tablas -
Summary of findings 5. Physical activity advice plus placebo compared to no physical activity advice plus placebo for participants with quiescent IBD
Summary of findings 6. Physical activity advice plus placebo compared to no physical activity advice plus omega 3 for participants with quiescent IBD

Physical activity advice plus placebo compared to no physical activity advice plus omega 3 for participants with quiescent IBD

Patient or population: participants with quiescent IBD
Setting: outpatients from a single centre in the United Kingdom
Intervention: physical activity advice plus placebo
Comparison: no physical activity advice plus omega 3

Outcomes

Anticipated absolute effects* (95% CI)

Relative effect
(95% CI)

№ of participants
(studies)

Certainty of the evidence
(GRADE)

Comments

Risk with no physical activity advice plus omega 3

Risk with physical activity advice plus placebo

Fatigue
assessed with: FACIT‐F
follow‐up: 12 weeks

The mean fatigue score was 32.1

MD 9 higher
(1.64 higher to 16.36 higher)

29
(1 RCT)

⊕⊝⊝⊝
VERY LOW 1 2

FACIT‐F scores ranged from 0 to 52, with higher scores indicating less fatigue.

Fatigue
assessed with: MFI
follow‐up: 12 weeks

The mean fatigue score was 14.1

MD 1.4 lower
(4.39 lower to 1.59 higher)

29
(1 RCT)

⊕⊝⊝⊝
VERY LOW 1 2

MFI scores ranged from 0 to 84, with higher scores indicating greater fatigue.

Fatigue
assessed with: IBDF Section 1
follow‐up: 12 weeks

The mean fatigue score was 9.6

MD 2.8 lower
(5.93 lower to 0.33 higher)

29
(1 RCT)

⊕⊝⊝⊝
VERY LOW 1 2

IBD‐F Section I scores ranged from 0 to 20, with higher scores indicating greater levels of fatigue.

Fatigue
assessed with: IBDF Section 2
follow‐up: 12 weeks

The mean fatigue score was 34.8

MD 15.4 lower
(30.51 lower to 0.29 lower)

29
(1 RCT)

⊕⊝⊝⊝
VERY LOW 1 2

IBD‐F Section II scores ranged from 0 to 120, with higher scores indicating greater impact of fatigue.

Adverse events: assessed with: Medication diary
follow‐up: 12 weeks

There were four reported adverse events in the physical activity advice plus placebo group and fourteen reported adverse events in the no physical activity advice plus omega 3 group, including epigastric pain, diarrhoea, bloating, nausea and vomiting, IBD flare, joint pain, and ankle injury.

29
(1 RCT)

⊕⊝⊝⊝
VERY LOW 1 2

Adverse events were recorded in the medication diary and assessed by the researcher during the 6 follow‐up contact time points.

Serious adverse events ‐ not reported

This outcome was not reported.

Withdrawal due to adverse events ‐ not reported

This outcome was not reported.

*The risk in the intervention group (and its 95% confidence interval) is based on the assumed risk in the comparison group and the relative effect of the intervention (and its 95% CI).

CI: Confidence interval; RR: Risk ratio; OR: Odds ratio;

GRADE Working Group grades of evidence
High certainty: We are very confident that the true effect lies close to that of the estimate of the effect
Moderate certainty: We are moderately confident in the effect estimate: The true effect is likely to be close to the estimate of the effect, but there is a possibility that it is substantially different
Low certainty: Our confidence in the effect estimate is limited: The true effect may be substantially different from the estimate of the effect
Very low certainty: We have very little confidence in the effect estimate: The true effect is likely to be substantially different from the estimate of effect

1 Downgraded two levels due to very serious imprecision as the number of participants was small, confidence interval was wide and per protocol analyses used.

2 Downgraded one level due to high risk of bias for blinding of participants and personnel and blinding of outcome assessments.

Figuras y tablas -
Summary of findings 6. Physical activity advice plus placebo compared to no physical activity advice plus omega 3 for participants with quiescent IBD
Table 1. Adalimumab 40 mg every other week compared to placebo for fatigue in inflammatory bowel disease

Adalimumab 40 mg every other week compared to placebo for fatigue in inflammatory bowel disease

Patient or population: participants with moderately‐to‐severely active disease
Setting: 92 centres in the United States, Europe, Canada, Australia and South Africa
Intervention: adalimumab 40 mg every other week
Comparison: placebo

Outcomes

Anticipated absolute effects* (95% CI)

Relative effect
(95% CI)

№ of participants
(studies)

Certainty of the evidence
(GRADE)

Comments

Risk with placebo

Risk with adalimumab 40 mg every other week

Fatigue
assessed with: FACIT‐Fatigue
follow‐up: 56 weeks

The mean fatigue score was 32.5

MD 4.3 higher
(1.75 higher to 6.85 higher)

337
(1 RCT)

⊕⊕⊝⊝
LOW 1

FACIT‐F scores ranged from 0 to 52, with higher scores indicating less fatigue.

Fatigue
assessed with: SF‐36 Vitality
follow‐up: 56 weeks

The mean fatigue score was 54.8

MD 2.8 higher
(5.1 lower to 10.7 higher)

143
(1 RCT)

⊕⊕⊝⊝
LOW 2

SF‐36 vitality subscale scores ranged from 0 to 100, with higher scores indicating greater vitality (less fatigue).

Quality of life
assessed with: IBDQ
follow‐up: 56 weeks

The mean quality of life score was 172.9

MD 10.4 higher
(0.53 lower to 21.33 higher)

145
(1 RCT)

⊕⊕⊝⊝
LOW 2

IBDQ scores ranged from 32 to 224, with higher scores indicating better quality of life.

Adverse events
assessed with: MedDRA
follow‐up: 56 weeks

847 per 1,000

888 per 1,000
(826 to 930)

OR 1.44
(0.86 to 2.41)

521
(1 RCT)

⊕⊕⊕⊝
MODERATE 3

Serious adverse events
assessed with: MedDRA
follow‐up: 56 weeks

153 per 1,000

92 per 1,000
(56 to 148)

OR 0.56
(0.33 to 0.96)

521
(1 RCT)

⊕⊕⊕⊝
MODERATE 3

Withdrawal due to adverse events
assessed with: MedDRA
follow‐up: 56 weeks

134 per 1,000

69 per 1,000
(39 to 119)

OR 0.48
(0.26 to 0.87)

521
(1 RCT)

⊕⊕⊕⊝
MODERATE 3

*The risk in the intervention group (and its 95% confidence interval) is based on the assumed risk in the comparison group and the relative effect of the intervention (and its 95% CI).

CI: Confidence interval; RR: Risk ratio; OR: Odds ratio;

GRADE Working Group grades of evidence
High certainty: We are very confident that the true effect lies close to that of the estimate of the effect
Moderate certainty: We are moderately confident in the effect estimate: The true effect is likely to be close to the estimate of the effect, but there is a possibility that it is substantially different
Low certainty: Our confidence in the effect estimate is limited: The true effect may be substantially different from the estimate of the effect
Very low certainty: We have very little confidence in the effect estimate: The true effect is likely to be substantially different from the estimate of effect

1 Downgraded two levels due to very serious imprecision as the confidence interval was wide and the fatigue data represented the last‐observation‐carried‐forward when a participant had missing value, dropped out or switched to open‐label therapy.

2 Downgraded two levels due to serious imprecision as the number of participants was small and confidence interval was wide.

3 Downgraded one level due to serious imprecision as the number of participants was small.

Figuras y tablas -
Table 1. Adalimumab 40 mg every other week compared to placebo for fatigue in inflammatory bowel disease
Table 2. Adalimumab 40 mg weekly compared to placebo for fatigue in inflammatory bowel disease

Adalimumab 40 mg weekly compared to placebo for fatigue in inflammatory bowel disease

Patient or population: fatigue in inflammatory bowel disease
Setting: 92 centres in the United States, Europe, Canada, Australia and South Africa
Intervention: adalimumab 40 mg weekly
Comparison: placebo

Outcomes

Anticipated absolute effects* (95% CI)

Relative effect
(95% CI)

№ of participants
(studies)

Certainty of the evidence
(GRADE)

Comments

Risk with placebo

Risk with adalimumab 40 mg weekly

Fatigue
assessed with: FACIT‐Fatigue
follow‐up: 56 weeks

The mean fatigue score was 32.5

MD 2.5 higher
(0.26 lower to 5.26 higher)

327
(1 RCT)

⊕⊕⊝⊝
LOW 1

FACIT‐F scores ranged from 0 to 52 with higher scores indicating less fatigue.

Fatigue
assessed with: SF‐36 vitality
follow‐up: 56 weeks

The mean fatigue score was 54.8

MD 3.2 higher
(4.72 lower to 11.13 higher)

145
(1 RCT)

⊕⊕⊝⊝
LOW 2

SF‐36 vitality subscale scores ranged from 0 to 100, with higher scores indicating greater vitality (less fatigue).

Quality of life
assessed with: IBDQ
follow‐up: 56 weeks

The mean quality of life score was 172.9

MD 9.4 higher
(1.63 lower to 20.43 higher)

147
(1 RCT)

⊕⊕⊝⊝
LOW2

IBDQ scores ranged from 32 to 224, with higher scores indicating better quality of life.

Adverse events
assessed with: MedDRA
follow‐up: 56 weeks

847 per 1,000

856 per 1,000
(785 to 906)

OR 1.08
(0.66 to 1.75)

518
(1 RCT)

⊕⊕⊕⊝
MODERATE 3

Serious adverse events
assessed with: MedDRA
follow‐up: 56 weeks

153 per 1,000

81 per 1,000
(48 to 135)

OR 0.49
(0.28 to 0.86)

518
(1 RCT)

⊕⊕⊕⊝
MODERATE 3

Withdrawal due to adverse events
assessed with: MedDRA
follow‐up: 56 weeks

134 per 1,000

47 per 1,000
(24 to 88)

OR 0.33
(0.15 to 0.70)

518
(1 RCT)

⊕⊕⊕⊝
MODERATE 3

*The risk in the intervention group (and its 95% confidence interval) is based on the assumed risk in the comparison group and the relative effect of the intervention (and its 95% CI).

CI: Confidence interval; RR: Risk ratio; OR: Odds ratio;

GRADE Working Group grades of evidence
High certainty: We are very confident that the true effect lies close to that of the estimate of the effect
Moderate certainty: We are moderately confident in the effect estimate: The true effect is likely to be close to the estimate of the effect, but there is a possibility that it is substantially different
Low certainty: Our confidence in the effect estimate is limited: The true effect may be substantially different from the estimate of the effect
Very low certainty: We have very little confidence in the effect estimate: The true effect is likely to be substantially different from the estimate of effect

1 Downgraded two levels due to very serious imprecision as the confidence interval was wide and the fatigue data represented the last‐observation‐carried‐forward when a participant had missing value, dropped out or switched to open‐label therapy.

2 Downgraded two levels due to serious imprecision as the number of participants was small and confidence interval was wide.

3 Downgraded one level due to serious imprecision as the number of participants was small.

Figuras y tablas -
Table 2. Adalimumab 40 mg weekly compared to placebo for fatigue in inflammatory bowel disease
Table 3. Adalimumab maintenance compared to placebo for fatigue in inflammatory bowel disease

Adalimumab maintenance compared to placebo for fatigue in inflammatory bowel disease

Patient or population: participants with moderately‐to‐severely active Crohn's disease
Setting: 92 centres in the United States, Europe, Canada, Australia and South Africa
Intervention: adalimumab maintenance
Comparison: placebo

Outcomes

Anticipated absolute effects* (95% CI)

Relative effect
(95% CI)

№ of participants
(studies)

Certainty of the evidence
(GRADE)

Comments

Risk with placebo

Risk with adalimumab maintenance

Fatigue
assessed with: SF‐36 Vitality
follow‐up: 56 weeks

The mean fatigue score was 54.8

MD 3 higher
(4.25 lower to 10.25 higher)

246
(1 RCT)

⊕⊕⊝⊝
LOW 1

SF‐36 vitality subscale scores ranged from 0 to 100, with higher scores indicating better vitality (less fatigue).

Quality of life
assessed with: SF‐36 Physical Component Summary
follow‐up: 56 weeks

The mean quality of life score was 47.7

MD 1.3 higher
(1.3 lower to 3.99 higher)

240
(1 RCT)

⊕⊕⊝⊝
LOW 1

SF‐36 physical component summary scores ranged from 0 to 100, with higher scores indicating better physical quality of life.

Quality of life
assessed with: SF‐36 Mental Component Summary
follow‐up: 56 weeks

The mean quality of life score was 48.1

MD 2.2 higher
(1.28 lower to 5.68 higher)

240
(1 RCT)

⊕⊕⊝⊝
LOW 1

The SF‐36 mental component summary scores ranged from 0 to 100, with higher scores indicating better mental quality of life.

Quality of life
assessed with: IBDQ
follow‐up: 56 weeks

The mean quality of life score was 172.9

MD 9.9 higher
(0.4 lower to 20.2 higher)

250
(1 RCT)

⊕⊕⊝⊝
LOW 1

IBDQ scores ranged from 32 to 224, with higher scores indicating better quality of life.

Adverse events
assessed with: MedDRA
follow‐up: 56 weeks

847 per 1,000

873 per 1,000
(817 to 913)

OR 1.24
(0.81 to 1.89)

521
(1 RCT)

⊕⊕⊕⊝
MODERATE 2

Serious adverse events
assessed with: MedDra
follow‐up: 56 weeks

153 per 1,000

88 per 1,000
(56 to 131)

OR 0.53
(0.33 to 0.83)

521
(1 RCT)

⊕⊕⊕⊝
MODERATE 2

Withdrawal due to adverse events
assessed with: MedDRA
follow‐up: 56 weeks

134 per 1,000

58 per 1,000
(36 to 93)

OR 0.40
(0.24 to 0.66)

521
(1 RCT)

⊕⊕⊕⊝
MODERATE 2

*The risk in the intervention group (and its 95% confidence interval) is based on the assumed risk in the comparison group and the relative effect of the intervention (and its 95% CI).

CI: Confidence interval; RR: Risk ratio; OR: Odds ratio;

GRADE Working Group grades of evidence
High certainty: We are very confident that the true effect lies close to that of the estimate of the effect
Moderate certainty: We are moderately confident in the effect estimate: The true effect is likely to be close to the estimate of the effect, but there is a possibility that it is substantially different
Low certainty: Our confidence in the effect estimate is limited: The true effect may be substantially different from the estimate of the effect
Very low certainty: We have very little confidence in the effect estimate: The true effect is likely to be substantially different from the estimate of effect

1 Downgraded two levels due to serious imprecision as the number of participants was small and confidence interval was wide.

2 Downgraded one level due to serious imprecision as the number of events was small.

Figuras y tablas -
Table 3. Adalimumab maintenance compared to placebo for fatigue in inflammatory bowel disease
Table 4. AndoSan compared to placebo for participants with mild‐to‐moderately active Crohn's disease

AndoSan compared to placebo for participants with mild‐to‐moderately active Crohn's disease

Patient or population: participants with mild‐to‐moderately active Crohn's disease
Setting: outpatients from a single centre in Oslo, Norway
Intervention: AndoSan
Comparison: placebo

Outcomes

Anticipated absolute effects* (95% CI)

Relative effect
(95% CI)

№ of participants
(studies)

Certainty of the evidence
(GRADE)

Comments

Risk with placebo

Risk with AndoSan

Fatigue
assessed with: Total Fatigue score
follow‐up: 21 days

The mean fatigue score was 16.13

MD 1.63 lower
(3.51 lower to 0.26 higher)

100
(2 RCTs)

⊕⊕⊝⊝
LOW 1 2

Total fatigue scores ranged from 0 to 33, with higher scores indicating greater fatigue.

Fatigue
assessed with: SF‐36 Vitality
follow‐up: 21 days

The mean fatigue score was 40.61

MD 3.68 higher
(1.64 lower to 9 higher)

100
(2 RCTs)

⊕⊕⊝⊝
LOW 1 2

SF‐36 vitality subscale scores ranged from 0 to 100, with higher scores indicating greater vitality (less fatigue).

Quality of life ‐ not measured

This outcome was not measured.

Adverse events ‐ not reported

This outcome was not reported.

Serious adverse events ‐ not reported

This outcome was not reported.

Withdrawal due to adverse events ‐ not reported

This outcome was not reported.

*The risk in the intervention group (and its 95% confidence interval) is based on the assumed risk in the comparison group and the relative effect of the intervention (and its 95% CI).

CI: Confidence interval; RR: Risk ratio; OR: Odds ratio;

GRADE Working Group grades of evidence
High certainty: We are very confident that the true effect lies close to that of the estimate of the effect
Moderate certainty: We are moderately confident in the effect estimate: The true effect is likely to be close to the estimate of the effect, but there is a possibility that it is substantially different
Low certainty: Our confidence in the effect estimate is limited: The true effect may be substantially different from the estimate of the effect
Very low certainty: We have very little confidence in the effect estimate: The true effect is likely to be substantially different from the estimate of effect

1 Downgraded one level due to serious imprecision as the number of participants was small and confidence interval was wide.

2 Downgraded by one level due to high risk of bias for allocation bias (open allocation).

Figuras y tablas -
Table 4. AndoSan compared to placebo for participants with mild‐to‐moderately active Crohn's disease
Table 5. Ferric maltol compared to placebo for participants in remission or mild‐to‐moderately active Crohn's disease

Ferric maltol compared to placebo for participants in remission or mild‐to‐moderately active Crohn's disease

Patient or population: participants in remission or mild‐to‐moderately active Crohn's disease
Setting: outpatients from 4 centres in Austria, Germany, Hungary and the UK
Intervention: ferric maltol
Comparison: placebo

Outcomes

Anticipated absolute effects* (95% CI)

Relative effect
(95% CI)

№ of participants
(studies)

Certainty of the evidence
(GRADE)

Comments

Risk with placebo

Risk with ferric maltol

Fatigue
assessed with: SF‐36 vitality
follow‐up: 12 weeks

The mean fatigue score was 53.23

MD 9.31 lower
(17.15 lower to 1.47 lower)

118
(1 RCT)

⊕⊕⊝⊝
LOW 1

SF‐36 vitality subscale scores ranged from 0 to 100, with higher scores indicating greater vitality (less fatigue).

Quality of life
assessed with: IBDQ
follow‐up: 12 weeks

The mean quality of life score was 176

MD 3.7 higher
(7.89 lower to 15.29 higher)

120
(1 RCT)

⊕⊕⊝⊝
LOW 1

IBDQ scores ranged from 32 to 224, with higher scores indicating better quality of life.

Adverse events
assessed with: MedDRA
follow‐up: 12 weeks

717 per 1,000

582 per 1,000
(397 to 749)

OR 0.55
(0.26 to 1.18)

120
(1 RCT)

⊕⊕⊝⊝
LOW 1

Serious adverse events
assessed with: MedDRA
follow‐up: mean 12 weeks

33 per 1,000

33 per 1,000
(5 to 202)

OR 1.00
(0.14 to 7.34)

124
(1 RCT)

⊕⊕⊝⊝
LOW 1

Withdrawal due to adverse events
assessed with: MedDRA
follow‐up: 12 weeks

83 per 1,000

133 per 1,000
(45 to 334)

OR 1.69
(0.52 to 5.51)

120
(1 RCT)

⊕⊕⊝⊝
LOW 1

*The risk in the intervention group (and its 95% confidence interval) is based on the assumed risk in the comparison group and the relative effect of the intervention (and its 95% CI).

CI: Confidence interval; RR: Risk ratio; OR: Odds ratio;

GRADE Working Group grades of evidence
High certainty: We are very confident that the true effect lies close to that of the estimate of the effect
Moderate certainty: We are moderately confident in the effect estimate: The true effect is likely to be close to the estimate of the effect, but there is a possibility that it is substantially different
Low certainty: Our confidence in the effect estimate is limited: The true effect may be substantially different from the estimate of the effect
Very low certainty: We have very little confidence in the effect estimate: The true effect is likely to be substantially different from the estimate of effect

1 Downgraded two levels due to serious imprecision as the number of participants was small and confidence interval was wide.

Figuras y tablas -
Table 5. Ferric maltol compared to placebo for participants in remission or mild‐to‐moderately active Crohn's disease
Table 6. Guided stress management compared to conventional medical treatment for participants with Crohn's disease in remission

Guided stress management compared to conventional medical treatment for participants with Crohn's disease in remission

Patient or population: participants with Crohn's disease in remission
Setting: outpatients from a single centre in Spain
Intervention: guided stress management
Comparison: conventional medical treatment

Outcomes

Anticipated absolute effects* (95% CI)

Relative effect
(95% CI)

№ of participants
(studies)

Certainty of the evidence
(GRADE)

Comments

Risk with conventional medical treatment

Risk with guided stress management

Fatigue
assessed with: Average frequency of tiredness
follow‐up: 12 months

The mean fatigue score was 51.4

MD 0
(30.77 lower to 30.77 higher)

30
(1 RCT)

⊕⊝⊝⊝
VERY LOW 1 2

The average frequency of tiredness was calculated as the number of symptomatic days divided by total reported days x 100. Higher mean scores indicated higher average frequency of tiredness.

Fatigue
assessed with: Severity of tiredness
follow‐up: 12 months

The mean fatigue score was 1

MD 0.3 higher
(0.39 lower to 0.99 higher)

30
(1 RCT)

⊕⊝⊝⊝
VERY LOW 1 2

The severity of tiredness scores ranged from 0 to 3, with higher scores indicating greater severity of tiredness.

Quality of life ‐ not measured

This outcome was not measured.

Adverse events ‐ not measured

This outcome was not measured.

Serious adverse events ‐ not measured

This outcome was not measured.

Withdrawal due to adverse events ‐ not measured

This outcome was not measured.

*The risk in the intervention group (and its 95% confidence interval) is based on the assumed risk in the comparison group and the relative effect of the intervention (and its 95% CI).

CI: Confidence interval; RR: Risk ratio; OR: Odds ratio;

GRADE Working Group grades of evidence
High certainty: We are very confident that the true effect lies close to that of the estimate of the effect
Moderate certainty: We are moderately confident in the effect estimate: The true effect is likely to be close to the estimate of the effect, but there is a possibility that it is substantially different
Low certainty: Our confidence in the effect estimate is limited: The true effect may be substantially different from the estimate of the effect
Very low certainty: We have very little confidence in the effect estimate: The true effect is likely to be substantially different from the estimate of effect

1 Downgraded by two levels due to serious imprecision as the number of participants was small and the confidence interval was wide.

2 Downgraded by two levels due to high risk of bias for most criteria.

Figuras y tablas -
Table 6. Guided stress management compared to conventional medical treatment for participants with Crohn's disease in remission
Table 7. Self‐directed stress management compared to conventional medical treatment for participants with Crohn's disease in remission

Self‐directed stress management compared to conventional medical treatment for participants with Crohn's disease in remission

Patient or population: participants with Crohn's disease in remission
Setting: outpatients from a single centre in Spain
Intervention: self‐directed stress management
Comparison: conventional medical treatment

Outcomes

Anticipated absolute effects* (95% CI)

Relative effect
(95% CI)

№ of participants
(studies)

Certainty of the evidence
(GRADE)

Comments

Risk with conventional medical treatment

Risk with self‐directed stress management

Fatigue
assessed with: Average frequency symptom (tiredness)
follow‐up: 12 months

The mean fatigue score was 51.4

MD 29.6 lower
(58.68 lower to 0.52 lower)

30
(1 RCT)

⊕⊝⊝⊝
VERY LOW 1 2

The average frequency symptom (tiredness) was calculated as the number of symptomatic days divided by the total reported days x 100. Higher scores indicated greater average frequency of tiredness.

Fatigue
assessed with: Severity of tiredness
follow‐up: 12 months

The mean fatigue score was 1

MD 0.3 lower
(0.98 lower to 0.38 higher)

30
(1 RCT)

⊕⊝⊝⊝
VERY LOW 1 2

Severity of tiredness scores ranged from 0 to 3, with higher scores indicating greater severity of tiredness.

Quality of life ‐ not measured

This outcome was not measured.

Adverse events ‐ not measured

This outcome was not measured.

Serious adverse events ‐ not measured

This outcome was not measured.

Withdrawal due to adverse events ‐ not measured

This outcome was not measured.

*The risk in the intervention group (and its 95% confidence interval) is based on the assumed risk in the comparison group and the relative effect of the intervention (and its 95% CI).

CI: Confidence interval; RR: Risk ratio; OR: Odds ratio;

GRADE Working Group grades of evidence
High certainty: We are very confident that the true effect lies close to that of the estimate of the effect
Moderate certainty: We are moderately confident in the effect estimate: The true effect is likely to be close to the estimate of the effect, but there is a possibility that it is substantially different
Low certainty: Our confidence in the effect estimate is limited: The true effect may be substantially different from the estimate of the effect
Very low certainty: We have very little confidence in the effect estimate: The true effect is likely to be substantially different from the estimate of effect

1 Downgraded two levels due to serious imprecision as the number of participants was small and confidence interval was wide.

2 Downgraded by two levels due to high risk of bias for most criteria.

Figuras y tablas -
Table 7. Self‐directed stress management compared to conventional medical treatment for participants with Crohn's disease in remission
Comparison 1. Adalimumab maintenance versus placebo

Outcome or subgroup title

No. of studies

No. of participants

Statistical method

Effect size

1 Fatigue: SF‐36 Vitality Show forest plot

1

Mean Difference (IV, Fixed, 95% CI)

Totals not selected

1.1 Week 4 follow‐up

1

Mean Difference (IV, Fixed, 95% CI)

0.0 [0.0, 0.0]

1.2 Week 56 follow‐up

1

Mean Difference (IV, Fixed, 95% CI)

0.0 [0.0, 0.0]

2 Quality of life: SF‐36 PCS Show forest plot

1

Mean Difference (IV, Fixed, 95% CI)

Totals not selected

2.1 Week 4 follow‐up

1

Mean Difference (IV, Fixed, 95% CI)

0.0 [0.0, 0.0]

2.2 Week 56 follow‐up

1

Mean Difference (IV, Fixed, 95% CI)

0.0 [0.0, 0.0]

3 Quality of life: SF‐36 MCS Show forest plot

1

Mean Difference (IV, Fixed, 95% CI)

Totals not selected

3.1 Week 4 follow‐up

1

Mean Difference (IV, Fixed, 95% CI)

0.0 [0.0, 0.0]

3.2 Week 56 follow‐up

1

Mean Difference (IV, Fixed, 95% CI)

0.0 [0.0, 0.0]

4 Quality of life: IBDQ Show forest plot

1

Mean Difference (IV, Fixed, 95% CI)

Totals not selected

4.1 Week 4 follow‐up

1

Mean Difference (IV, Fixed, 95% CI)

0.0 [0.0, 0.0]

4.2 Week 56 follow‐up

1

Mean Difference (IV, Fixed, 95% CI)

0.0 [0.0, 0.0]

5 Adverse events Show forest plot

1

Odds Ratio (M‐H, Fixed, 95% CI)

Totals not selected

6 Serious AEs Show forest plot

1

Odds Ratio (M‐H, Fixed, 95% CI)

Totals not selected

7 Withdrawal due to AEs Show forest plot

1

Odds Ratio (M‐H, Fixed, 95% CI)

Totals not selected

Figuras y tablas -
Comparison 1. Adalimumab maintenance versus placebo
Comparison 2. Adalimumab 40 mg eow versus placebo

Outcome or subgroup title

No. of studies

No. of participants

Statistical method

Effect size

1 Fatigue: FACIT‐ F Show forest plot

1

Mean Difference (IV, Fixed, 95% CI)

Totals not selected

1.1 Week 4 follow‐up

1

Mean Difference (IV, Fixed, 95% CI)

0.0 [0.0, 0.0]

1.2 Week 56 follow‐up

1

Mean Difference (IV, Fixed, 95% CI)

0.0 [0.0, 0.0]

2 Fatigue: SF‐36 Vitality Show forest plot

1

Mean Difference (IV, Fixed, 95% CI)

Totals not selected

2.1 Week 4 follow‐up

1

Mean Difference (IV, Fixed, 95% CI)

0.0 [0.0, 0.0]

2.2 Week 56 follow‐up

1

Mean Difference (IV, Fixed, 95% CI)

0.0 [0.0, 0.0]

3 Quality of life: SF‐36 PCS Show forest plot

1

Mean Difference (IV, Fixed, 95% CI)

Totals not selected

3.1 Week 4 follow‐up

1

Mean Difference (IV, Fixed, 95% CI)

0.0 [0.0, 0.0]

3.2 Week 56 follow‐up

1

Mean Difference (IV, Fixed, 95% CI)

0.0 [0.0, 0.0]

4 Quality of life: SF‐36 MCS Show forest plot

1

Mean Difference (IV, Fixed, 95% CI)

Totals not selected

4.1 Week 4 follow‐up

1

Mean Difference (IV, Fixed, 95% CI)

0.0 [0.0, 0.0]

4.2 Week 56 follow‐up

1

Mean Difference (IV, Fixed, 95% CI)

0.0 [0.0, 0.0]

5 Quality of life: IBDQ Show forest plot

1

Mean Difference (IV, Fixed, 95% CI)

Totals not selected

5.1 Week 4 follow‐up

1

Mean Difference (IV, Fixed, 95% CI)

0.0 [0.0, 0.0]

5.2 Week 56 follow‐up

1

Mean Difference (IV, Fixed, 95% CI)

0.0 [0.0, 0.0]

6 Adverse events Show forest plot

1

Odds Ratio (M‐H, Fixed, 95% CI)

Totals not selected

7 Serious AEs Show forest plot

1

Odds Ratio (M‐H, Fixed, 95% CI)

Totals not selected

8 Withdrawal due to AEs Show forest plot

1

Odds Ratio (M‐H, Fixed, 95% CI)

Totals not selected

Figuras y tablas -
Comparison 2. Adalimumab 40 mg eow versus placebo
Comparison 3. Adalimumab 40 mg weekly versus placebo

Outcome or subgroup title

No. of studies

No. of participants

Statistical method

Effect size

1 Fatigue: FACIT‐Fatigue Show forest plot

1

Mean Difference (IV, Fixed, 95% CI)

Totals not selected

1.1 Week 4 follow‐up

1

Mean Difference (IV, Fixed, 95% CI)

0.0 [0.0, 0.0]

1.2 Week 56 follow‐up

1

Mean Difference (IV, Fixed, 95% CI)

0.0 [0.0, 0.0]

2 Fatigue: SF‐36 vitality Show forest plot

1

Mean Difference (IV, Fixed, 95% CI)

Totals not selected

2.1 Week 4 follow‐up

1

Mean Difference (IV, Fixed, 95% CI)

0.0 [0.0, 0.0]

2.2 Week 56 follow‐up

1

Mean Difference (IV, Fixed, 95% CI)

0.0 [0.0, 0.0]

3 Quality of life: SF‐36 PCS Show forest plot

1

Mean Difference (IV, Fixed, 95% CI)

Totals not selected

3.1 Week 4 follow‐up

1

Mean Difference (IV, Fixed, 95% CI)

0.0 [0.0, 0.0]

3.2 Week 56 follow‐up

1

Mean Difference (IV, Fixed, 95% CI)

0.0 [0.0, 0.0]

4 Quality of life: SF‐36 MCS Show forest plot

1

Mean Difference (IV, Fixed, 95% CI)

Totals not selected

4.1 Week 4 follow‐up

1

Mean Difference (IV, Fixed, 95% CI)

0.0 [0.0, 0.0]

4.2 Week 56 follow‐up

1

Mean Difference (IV, Fixed, 95% CI)

0.0 [0.0, 0.0]

5 Quality of life: IBDQ Show forest plot

1

Mean Difference (IV, Fixed, 95% CI)

Totals not selected

5.1 Week 4 follow‐up

1

Mean Difference (IV, Fixed, 95% CI)

0.0 [0.0, 0.0]

5.2 Week 56 follow‐up

1

Mean Difference (IV, Fixed, 95% CI)

0.0 [0.0, 0.0]

6 Adverse events Show forest plot

1

Odds Ratio (M‐H, Fixed, 95% CI)

Totals not selected

7 Serious AEs Show forest plot

1

Odds Ratio (M‐H, Fixed, 95% CI)

Totals not selected

8 Withdrawal due to AEs Show forest plot

1

Odds Ratio (M‐H, Fixed, 95% CI)

Totals not selected

Figuras y tablas -
Comparison 3. Adalimumab 40 mg weekly versus placebo
Comparison 4. AndoSan versus placebo

Outcome or subgroup title

No. of studies

No. of participants

Statistical method

Effect size

1 Fatigue: Total Fatigue Score Show forest plot

2

Mean Difference (IV, Fixed, 95% CI)

Subtotals only

1.1 Day 14 follow‐up

2

100

Mean Difference (IV, Fixed, 95% CI)

‐1.63 [‐3.51, 0.26]

1.2 Day 21 follow‐up

2

100

Mean Difference (IV, Fixed, 95% CI)

‐1.59 [‐3.46, 0.28]

2 Fatigue: SF‐36 Vitality subscale Show forest plot

2

Mean Difference (IV, Fixed, 95% CI)

Subtotals only

2.1 Day 14 follow‐up

2

100

Mean Difference (IV, Fixed, 95% CI)

3.84 [‐3.78, 11.47]

2.2 Day 21 follow‐up

2

100

Mean Difference (IV, Fixed, 95% CI)

3.53 [‐3.91, 10.96]

Figuras y tablas -
Comparison 4. AndoSan versus placebo
Comparison 5. Ferric maltol versus placebo

Outcome or subgroup title

No. of studies

No. of participants

Statistical method

Effect size

1 Fatigue: SF‐36 Vitality subscale Show forest plot

1

Mean Difference (IV, Fixed, 95% CI)

Totals not selected

1.1 Week 12 follow‐up

1

Mean Difference (IV, Fixed, 95% CI)

0.0 [0.0, 0.0]

2 Quality of life: IBDQ Show forest plot

1

Mean Difference (IV, Fixed, 95% CI)

Totals not selected

2.1 Week 12 follow‐up

1

Mean Difference (IV, Fixed, 95% CI)

0.0 [0.0, 0.0]

3 Adverse events Show forest plot

1

Odds Ratio (M‐H, Fixed, 95% CI)

Totals not selected

4 Serious AEs Show forest plot

1

Odds Ratio (M‐H, Fixed, 95% CI)

Totals not selected

5 Withdrawal due to AEs Show forest plot

1

Odds Ratio (M‐H, Fixed, 95% CI)

Totals not selected

Figuras y tablas -
Comparison 5. Ferric maltol versus placebo
Comparison 6. Electroacupuncture versus no treatment

Outcome or subgroup title

No. of studies

No. of participants

Statistical method

Effect size

1 Fatigue: FACIT‐F Show forest plot

1

Mean Difference (IV, Fixed, 95% CI)

Totals not selected

1.1 Week 8 follow‐up

1

Mean Difference (IV, Fixed, 95% CI)

0.0 [0.0, 0.0]

2 Quality of life: IBDQ‐9 Show forest plot

1

Mean Difference (IV, Fixed, 95% CI)

Totals not selected

2.1 Week 8 follow‐up

1

Mean Difference (IV, Fixed, 95% CI)

0.0 [0.0, 0.0]

3 Adverse events Show forest plot

1

Odds Ratio (M‐H, Fixed, 95% CI)

Totals not selected

4 Serious AEs Show forest plot

1

Odds Ratio (M‐H, Fixed, 95% CI)

Totals not selected

5 Withdrawal due to AEs Show forest plot

1

Odds Ratio (M‐H, Fixed, 95% CI)

Totals not selected

Figuras y tablas -
Comparison 6. Electroacupuncture versus no treatment
Comparison 7. Electroacupuncture versus sham electroacupuncture

Outcome or subgroup title

No. of studies

No. of participants

Statistical method

Effect size

1 Fatigue: FACIT‐F Show forest plot

1

Mean Difference (IV, Fixed, 95% CI)

Totals not selected

1.1 Week 8 follow‐up

1

Mean Difference (IV, Fixed, 95% CI)

0.0 [0.0, 0.0]

1.2 Week 16 follow‐up

1

Mean Difference (IV, Fixed, 95% CI)

0.0 [0.0, 0.0]

2 Quality of life: IBDQ‐9 Show forest plot

1

Mean Difference (IV, Fixed, 95% CI)

Totals not selected

2.1 Week 8 follow‐up

1

Mean Difference (IV, Fixed, 95% CI)

0.0 [0.0, 0.0]

2.2 Week 16 follow‐up

1

Mean Difference (IV, Fixed, 95% CI)

0.0 [0.0, 0.0]

3 Adverse events Show forest plot

1

Odds Ratio (M‐H, Fixed, 95% CI)

Totals not selected

4 Serious AEs Show forest plot

1

Odds Ratio (M‐H, Fixed, 95% CI)

Totals not selected

5 Withdrawal due to AEs Show forest plot

1

Odds Ratio (M‐H, Fixed, 95% CI)

Totals not selected

Figuras y tablas -
Comparison 7. Electroacupuncture versus sham electroacupuncture
Comparison 8. Guided stress management versus conventional medical treatment

Outcome or subgroup title

No. of studies

No. of participants

Statistical method

Effect size

1 Fatigue: Average frequency symptom (tiredness) Show forest plot

1

Mean Difference (IV, Fixed, 95% CI)

Totals not selected

1.1 Post‐intervention

1

Mean Difference (IV, Fixed, 95% CI)

0.0 [0.0, 0.0]

1.2 12 month follow‐up

1

Mean Difference (IV, Fixed, 95% CI)

0.0 [0.0, 0.0]

2 Fatigue: Average severity of tiredness Show forest plot

1

Mean Difference (IV, Fixed, 95% CI)

Totals not selected

2.1 Post‐intervention

1

Mean Difference (IV, Fixed, 95% CI)

0.0 [0.0, 0.0]

2.2 12 month follow‐up

1

Mean Difference (IV, Fixed, 95% CI)

0.0 [0.0, 0.0]

Figuras y tablas -
Comparison 8. Guided stress management versus conventional medical treatment
Comparison 9. Self‐directed stress management versus conventional medical treatment

Outcome or subgroup title

No. of studies

No. of participants

Statistical method

Effect size

1 Fatigue: Average frequency of tiredness Show forest plot

1

Mean Difference (IV, Fixed, 95% CI)

Totals not selected

1.1 Post‐intervention

1

Mean Difference (IV, Fixed, 95% CI)

0.0 [0.0, 0.0]

1.2 12 month follow‐up

1

Mean Difference (IV, Fixed, 95% CI)

0.0 [0.0, 0.0]

2 Fatigue: Average severity of tiredness Show forest plot

1

Mean Difference (IV, Fixed, 95% CI)

Totals not selected

2.1 Post‐intervention

1

Mean Difference (IV, Fixed, 95% CI)

0.0 [0.0, 0.0]

2.2 12 month follow‐up

1

Mean Difference (IV, Fixed, 95% CI)

0.0 [0.0, 0.0]

Figuras y tablas -
Comparison 9. Self‐directed stress management versus conventional medical treatment
Comparison 10. CBT with therapist support versus fatigue information leaflet only

Outcome or subgroup title

No. of studies

No. of participants

Statistical method

Effect size

1 Fatigue: IBD‐F Section I Show forest plot

1

Mean Difference (IV, Fixed, 95% CI)

Totals not selected

1.1 Month 3 follow‐up

1

Mean Difference (IV, Fixed, 95% CI)

0.0 [0.0, 0.0]

2 Fatigue: IBD‐F Section II Show forest plot

1

Mean Difference (IV, Fixed, 95% CI)

Totals not selected

2.1 Month 3 follow‐up

1

Mean Difference (IV, Fixed, 95% CI)

0.0 [0.0, 0.0]

3 Quality of life: UK‐IBDQ Show forest plot

1

Mean Difference (IV, Fixed, 95% CI)

Totals not selected

3.1 Month 3 follow‐up

1

Mean Difference (IV, Fixed, 95% CI)

0.0 [0.0, 0.0]

Figuras y tablas -
Comparison 10. CBT with therapist support versus fatigue information leaflet only
Comparison 11. Physical activity advice plus omega 3 versus no physical activity advice plus omega 3

Outcome or subgroup title

No. of studies

No. of participants

Statistical method

Effect size

1 Fatigue: FACIT‐F Show forest plot

1

Mean Difference (IV, Fixed, 95% CI)

Totals not selected

1.1 Week 12 follow‐up

1

Mean Difference (IV, Fixed, 95% CI)

0.0 [0.0, 0.0]

2 Fatigue: MFI Show forest plot

1

Mean Difference (IV, Fixed, 95% CI)

Totals not selected

2.1 Week 12 follow‐up

1

Mean Difference (IV, Fixed, 95% CI)

0.0 [0.0, 0.0]

3 Fatigue: IBD‐F Section I Show forest plot

1

Mean Difference (IV, Fixed, 95% CI)

Totals not selected

3.1 Week 12 follow‐up

1

Mean Difference (IV, Fixed, 95% CI)

0.0 [0.0, 0.0]

4 Fatigue: IBD‐F Section II Show forest plot

1

Mean Difference (IV, Fixed, 95% CI)

Totals not selected

4.1 Week 12 follow‐up

1

Mean Difference (IV, Fixed, 95% CI)

0.0 [0.0, 0.0]

5 Quality of life: IBDQ Show forest plot

1

Mean Difference (IV, Fixed, 95% CI)

Totals not selected

5.1 Week 12 follow‐up

1

Mean Difference (IV, Fixed, 95% CI)

0.0 [0.0, 0.0]

Figuras y tablas -
Comparison 11. Physical activity advice plus omega 3 versus no physical activity advice plus omega 3
Comparison 12. Physical activity advice plus placebo versus no physical activity advice plus placebo

Outcome or subgroup title

No. of studies

No. of participants

Statistical method

Effect size

1 Fatigue: FACIT‐F Show forest plot

1

Mean Difference (IV, Fixed, 95% CI)

Totals not selected

1.1 Week 12 follow‐up

1

Mean Difference (IV, Fixed, 95% CI)

0.0 [0.0, 0.0]

2 Fatigue: MFI Show forest plot

1

Mean Difference (IV, Fixed, 95% CI)

Totals not selected

2.1 Week 12 follow‐up

1

Mean Difference (IV, Fixed, 95% CI)

0.0 [0.0, 0.0]

3 Fatigue: IBD‐F Section I Show forest plot

1

Mean Difference (IV, Fixed, 95% CI)

Totals not selected

3.1 Week 12 follow‐up

1

Mean Difference (IV, Fixed, 95% CI)

0.0 [0.0, 0.0]

4 Fatigue: IBD‐F Section II Show forest plot

1

Mean Difference (IV, Fixed, 95% CI)

Totals not selected

4.1 Week 12 follow‐up

1

Mean Difference (IV, Fixed, 95% CI)

0.0 [0.0, 0.0]

5 Quality of life: IBDQ Show forest plot

1

Mean Difference (IV, Fixed, 95% CI)

Totals not selected

5.1 Week 12 follow‐up

1

Mean Difference (IV, Fixed, 95% CI)

0.0 [0.0, 0.0]

Figuras y tablas -
Comparison 12. Physical activity advice plus placebo versus no physical activity advice plus placebo
Comparison 13. Physical activity advice plus placebo versus no physical activity advice plus omega 3

Outcome or subgroup title

No. of studies

No. of participants

Statistical method

Effect size

1 Fatigue: FACIT‐F Show forest plot

1

Mean Difference (IV, Fixed, 95% CI)

Totals not selected

1.1 Week 12 follow‐up

1

Mean Difference (IV, Fixed, 95% CI)

0.0 [0.0, 0.0]

2 Fatigue: MFI Show forest plot

1

Mean Difference (IV, Fixed, 95% CI)

Totals not selected

2.1 Week 12 follow‐up

1

Mean Difference (IV, Fixed, 95% CI)

0.0 [0.0, 0.0]

3 Fatigue: IBD‐F Section I Show forest plot

1

Mean Difference (IV, Fixed, 95% CI)

Totals not selected

3.1 Week 12 follow‐up

1

Mean Difference (IV, Fixed, 95% CI)

0.0 [0.0, 0.0]

4 Fatigue: IBD‐F Section II Show forest plot

1

Mean Difference (IV, Fixed, 95% CI)

Totals not selected

4.1 Week 12 follow‐up

1

Mean Difference (IV, Fixed, 95% CI)

0.0 [0.0, 0.0]

5 Quality of life: IBDQ Show forest plot

1

Mean Difference (IV, Fixed, 95% CI)

Totals not selected

5.1 Week 12 follow‐up

1

Mean Difference (IV, Fixed, 95% CI)

0.0 [0.0, 0.0]

Figuras y tablas -
Comparison 13. Physical activity advice plus placebo versus no physical activity advice plus omega 3