Übungen für die Bewegungskontrolle bei chronischen, unspezifischen Kreuzschmerzen
Appendices
Appendix 1. Database search strategy
MEDLINE
Last searched 2 April 2015.
-
randomized controlled trial.pt.
-
controlled clinical trial.pt.
-
clinical trial.pt.
-
exp clinical trial/
-
Random Allocation/
-
Double‐Blind Method/
-
Single‐Blind Method/
-
Comparative Study/
-
evaluation studies/
-
Follow‐Up Studies/
-
cross‐over studies/
-
Research Design/
-
Placebos/
-
(clinic$ adj25 trial$).tw.
-
((single$ or double$ or treble$ or triple$) adj (mask$ or blind$)).tw.
-
(control$ or prospective$ or volunteer$).tw.
-
(latin adj square).tw.
-
placebo$.tw.
-
random$.tw.
-
or/1‐19
-
(animals not (humans and animals)).sh.
-
20 not 21
-
dorsalgia.ti,ab.
-
exp Back Pain/
-
backache.ti,ab.
-
(lumbar adj pain).ti,ab.
-
coccyx.ti,ab.
-
coccydynia.ti,ab.
-
sciatica.ti,ab.
-
exp sciatic neuropathy/
-
spondylosis.ti,ab.
-
lumbago.ti,ab.
-
low back pain.mp.
-
or/23‐33
-
22 and 34
-
exp Exercise/
-
exercise$.mp.
-
train$.mp.
-
36 or 37 or 38
-
specific.mp.
-
stabili$.mp.
-
segment$.mp.
-
multifidus.mp.
-
transversus.mp.
-
motor control.mp.
-
or/40‐45
-
39 and 46
-
35 and 47
-
limit 48 to yr=2014‐2015
-
limit 48 to ed=20140516‐20150402
-
49 or 50
MEDLINE In‐Process & Other Non‐Indexed Citations
Searched 2 April 2015.
-
randomized controlled trial.pt.
-
controlled clinical trial.pt.
-
clinical trial.pt.
-
exp clinical trial/
-
Random Allocation/
-
Double‐Blind Method/
-
Single‐Blind Method/
-
Comparative Study/
-
evaluation studies/
-
Follow‐Up Studies/
-
cross‐over studies/
-
Research Design/
-
Placebos/
-
(clinic$ adj25 trial$).tw.
-
((single$ or double$ or treble$ or triple$) adj (mask$ or blind$)).tw.
-
(control$ or prospective$ or volunteer$).tw.
-
(latin adj square).tw.
-
placebo$.tw.
-
random$.tw.
-
or/1‐19
-
(animals not (humans and animals)).sh.
-
20 not 21
-
dorsalgia.ti,ab.
-
exp Back Pain/
-
backache.ti,ab.
-
(lumbar adj pain).ti,ab.
-
coccyx.ti,ab.
-
coccydynia.ti,ab.
-
sciatica.ti,ab.
-
exp sciatic neuropathy/
-
spondylosis.ti,ab.
-
lumbago.ti,ab.
-
low back pain.mp.
-
or/23‐33
-
22 and 34
-
exp Exercise/
-
exercise$.mp.
-
train$.mp.
-
36 or 37 or 38
-
specific.mp.
-
stabili$.mp.
-
segment$.mp.
-
multifidus.mp.
-
transversus.mp.
-
motor control.mp.
-
or/40‐45
-
39 and 46
-
35 and 47
EMBASE
Last searched 2 April 2015.
-
randomi#ed controlled trial.mp.
-
clinical trial/
-
double blind.mp.
-
single blind.mp.
-
placebo/
-
Controlled Study/
-
Randomized Controlled Trial/
-
Double Blind Procedure/
-
Single Blind Procedure/
-
crossover procedure/
-
random$.mp.
-
((singl$ or doubl$ or trebl$ or tripl$) adj25 (blind$ or mask$)).mp.
-
(versus or vs).mp.
-
(clinic$ adj2 trial$).tw.
-
or/1‐14
-
limit 15 to human
-
dorsalgia.mp.
-
back pain.mp.
-
exp BACKACHE/
-
(lumbar adj pain).mp.
-
coccyx.mp.
-
coccydynia.mp.
-
sciatica.mp.
-
exp ISCHIALGIA/
-
spondylosis.mp.
-
lumbago.mp.
-
low back pain.mp.
-
or/17‐27
-
16 and 28
-
exp exercise/
-
exercise$.mp.
-
train$.mp.
-
30 or 31 or 32
-
motor control.mp.
-
stabili$.mp.
-
segment$.mp.
-
multifidus.mp.
-
transversus.mp.
-
or/34‐38
-
33 and 39
-
29 and 40
-
limit 41 to yr=2014‐2015
-
limit 41 to em=201419‐201513
-
42 or 43
CENTRAL
Last searched 2 April 2015.
#1 MeSH descriptor: [Back Pain] explode all trees
#2 dorsalgia
#3 backache
#4 MeSH descriptor: [Low Back Pain] explode all trees
#5 lumbar next pain OR coccyx OR coccydynia OR sciatica OR spondylosis
#6 MeSH descriptor: [Sciatica] explode all trees
#7 MeSH descriptor: [Spine] explode all trees
#8 MeSH descriptor: [Spinal Diseases] explode all trees
#9 lumbago OR discitis OR disc near degeneration OR disc near prolapse OR disc near herniation
#10 spinal fusion
#11 spinal neoplasms
#12 facet near joints
#13 MeSH descriptor: [Intervertebral Disk] explode all trees
#14 postlaminectomy
#15 arachnoiditis
#16 failed near back
#17 MeSH descriptor: [Cauda Equina] explode all trees
#18 lumbar near vertebra*
#19 spinal near stenosis
#20 slipped near (disc* or disk*)
#21 degenerat* near (disc* or disk*)
#22 stenosis near (spine or root or spinal)
#23 displace* near (disc* or disk*)
#24 prolap* near (disc* or disk*)
#25 #1 or #2 or #3 or #4 or #5 or #6 or #7 or #8 or #9 or #10 or #11 or #12 or #13 or #14 or #15 or #16 or #17 or #18 or #19 or #20 or #21 or #22 or #23 or #24
#26 MeSH descriptor: [Exercise] explode all trees
#27 exercis*
#28 train*
#29 #26 or #27 or #28
#30 motor control
#31 transversus
#32 multifidus
#33 segment*
#34 stabili*
#35 #31 or #32 or #33 or #34
#36 #25 and #29 and #35 Publication Year from 2014 to 2015, in Trials
CINAHL
Last searched 2 April 2015.
S62 S61 Limiters ‐ Published Date: 20130501‐20150431
S61 S49 AND S56 AND S60
S60 S57 OR S58 OR S59
S59 "train*"
S58 "exercise*"
S57 (MH "Exercise+")
S56 S50 OR S51 OR S52 OR S53 OR S54 OR S55
S55 specific W2 stabili?ation
S54 "stabili?ation"
S53 "multifidus"
S52 (MH "Multifidus Muscles")
S51 "transversus"
S50 "motor control"
S49 S28 and S48
S48 S35 or S43 or S47
S47 S44 or S45 or S46
S46 "lumbago" 33
S45 (MH "Spondylolisthesis") OR (MH "Spondylolysis")
S44 (MH "Thoracic Vertebrae")
S43 S36 or S37 or S38 or S39 or S40 or S41 or S42
S42 lumbar N2 vertebra
S41 (MH "Lumbar Vertebrae")
S40 "coccydynia"
S39 "coccyx"
S38 "sciatica"
S37 (MH "Sciatica")
S36 (MH "Coccyx")
S35 S29 or S30 or S31 or S32 or S33 or S34
S34 lumbar N5 pain
S33 lumbar W1 pain 282
S32 "backache"
S31 (MH "Low Back Pain")
S30 (MH "Back Pain+")
S29 "dorsalgia"
S28 S26 NOT S27
S27 (MH "Animals")
S26 S7 or S12 or S19 or S25
S25 S20 or S21 or S22 or S23 or S24
S24 volunteer*
S23 prospectiv*
S22 control*
S21 followup stud*
S20 follow‐up stud*
S19 S13 or S14 or S15 or S16 or S17 or S18
S18 (MH "Prospective Studies+")
S17 (MH "Evaluation Research+")
S16 (MH "Comparative Studies")
S15 latin square
S14 (MH "Study Design+")
S13 (MH "Random Sample")
S12 S8 or S9 or S10 or S11
S11 random*
S10 placebo*
S9 (MH "Placebos")
S8 (MH "Placebo Effect")
S7 S1 or S2 or S3 or S4 or S5 or S6
S6 triple‐blind 94
S5 single‐blind 6,829
S4 double‐blind 24,437
S3 clinical W3 trial 14,324
S2 "randomi?ed controlled trial*"
S1 (MH "Clinical Trials+")
AMED
Last searched 2 April 2015.
-
randomized controlled trial.pt.
-
controlled clinical trial.pt.
-
clinical trial.pt.
-
exp clinical trials/
-
random allocation/
-
double blind method/
-
single blind method/
-
comparative study/
-
follow up studies/
-
research design/
-
placebos/
-
(clinic$ adj25 trial$).tw.
-
((single$ or double$ or treble$ or triple$) adj (mask$ or blind$)).tw.
-
(control$ or prospective$ or volunteer$).tw.
-
(latin adj square).tw.
-
placebo$.tw.
-
random$.tw.
-
or/1‐17
-
(animals not (humans and animals)).sh.
-
18 not 19
-
dorsalgia.mp.
-
exp backache/
-
sciatica/
-
(lumbar adj pain).ti,ab.
-
sciatica.mp.
-
spondylosis.mp.
-
coccyx.mp.
-
lumbago.mp.
-
low back pain.mp.
-
or/21‐29
-
20 and 30
-
exercise/
-
exercise$.mp.
-
train$.mp.
-
or/32‐34
-
specific.mp.
-
stabili$.mp. [mp=abstract, heading words, title]
-
segment$.mp.
-
multifidus.mp.
-
transversus.mp.
-
motor control.mp.
-
or/36‐41
-
35 and 42
-
31 and 43
-
limit 44 to yr=2014‐2015
SPORTDiscus
Last searched 2 April 2015.
S28 S27 Limiters ‐ Published Date: 20140501‐20150431
S27 S16 AND S20 AND S26
S26 S21 OR S22 OR S23 OR S24 OR S25
S25 specific W2 stabili?ation
S24 stabili?ation
S23 multifidus
S22 transversus
S21 motor control
S20 S17 OR S18 OR S19
S19 train*
S18 exercise*
S17 DE "EXERCISE" or DE "BACK exercises" or DE "EXERCISE therapy" or DE "PHYSICAL education & training" or DE "PHYSICAL fitness"
S16 S10 AND S15
S15 S11 OR S12 OR S13 OR S14
S14 DE "LUMBAR vertebrae" or DE "LUMBOSACRAL region"
S13 DE "SCIATICA"
S12 low back pain
S11 DE "BACKACHE"
S10 S1 OR S2 OR S3 OR S4 OR S5 OR S6 OR S7 OR S8 OR S9
S9 single blind
S8 random allocation
S7 SU randomized controlled trial
S6 SU clinical trials
S5 clinical trials
S4 placebo
S3 controlled clinical trial
S2 double blind
S1 randomi?ed controlled trial
PEDro
Last searched 2 April 2015.
Abstract & Title: Exercise
AND
Problem: pain
AND
Body Part: lumbar spine, sacro‐iliac joint or pelvis
AND
Method: clinical trial
New records added since: 15/05/2014
LILACS
Last searched 2 April 2015.
back pain AND exercise, all indexes on the homepage
Filter: Type of study: clinical Trial OR guidelines
dor lombar AND exercicio, all indexes on the homepage
Filter: Type of study: clinical trial OR guidelines
ClinicalTrials.gov
Last searched 2 April 2015.
Condition: back pain
Intervention: exercise
received on or after 05/15/2014
WHO ICTRP
Last searched 2 April 2015.
Condition: back pain
Intervention: exercise
Date of registration is between 15/05/2014‐02/04/2015
PubMed
Searched 2 April 2015.
((dorsalgia OR back pain OR backache OR lumbar pain OR coccydynia OR sciatica OR lumbago OR spondylosis) AND ((exercise* OR train*) AND (specific* OR stabili* OR segment* OR multifidus OR transverses OR motor control)) AND (pubstatusaheadofprint OR publisher[sb] or pubmednotmedline[sb]))
From 2014/05/01 to 2015/12/31
Appendix 2. Criteria for assessing risk of bias for internal validity
Random sequence generation (selection bias)
Selection bias (biased allocation to interventions) due to inadequate generation of a randomised sequence
There is a low risk of selection bias if the investigators describe a random component in the sequence generation process such as: referring to a random number table, using a computer random number generator, coin tossing, shuffling cards or envelopes, throwing dice, drawing of lots, minimisation (minimisation may be implemented without a random element, and this is considered to be equivalent to being random).
There is a high risk of selection bias if the investigators describe a non‐random component in the sequence generation process, such as: sequence generated by odd or even date of birth, date (or day) of admission, hospital or clinic record number; or allocation by judgement of the clinician, preference of the participant, results of a laboratory test or a series of tests, or availability of the intervention.
Allocation concealment (selection bias)
Selection bias (biased allocation to interventions) due to inadequate concealment of allocations prior to assignment
There is a low risk of selection bias if the participants and investigators enrolling participants could not foresee assignment because one of the following, or an equivalent method, was used to conceal allocation: central allocation (including telephone, web‐based and pharmacy‐controlled randomisation); sequentially numbered drug containers of identical appearance; or sequentially numbered, opaque, sealed envelopes.
There is a high risk of bias if participants or investigators enrolling participants could possibly foresee assignments and thus introduce selection bias, such as allocation based on: using an open random allocation schedule (e.g. a list of random numbers); assignment envelopes were used without appropriate safeguards (e.g. if envelopes were unsealed or non‐opaque or not sequentially numbered); alternation or rotation; date of birth; case record number; or other explicitly unconcealed procedures.
Blinding of participants
Performance bias due to knowledge of the allocated interventions by participants during the study
There is a low risk of performance bias if blinding of participants was ensured and it was unlikely that the blinding could have been broken; or if there was no blinding or incomplete blinding, but the review authors judge that the outcome is not likely to be influenced by lack of blinding.
Blinding of personnel/care providers (performance bias)
Performance bias due to knowledge of the allocated interventions by personnel/care providers during the study
There is a low risk of performance bias if blinding of personnel was ensured and it was unlikely that the blinding could have been broken; or if there was no blinding or incomplete blinding, but the review authors judge that the outcome is not likely to be influenced by lack of blinding.
Blinding of outcome assessor (detection bias)
Detection bias due to knowledge of the allocated interventions by outcome assessors
There is low risk of detection bias if the blinding of the outcome assessment was ensured and it was unlikely that the blinding could have been broken; or if there was no blinding or incomplete blinding, but the review authors judge that the outcome is not likely to be influenced by lack of blinding, or:
-
for patient‐reported outcomes in which the patient was the outcome assessor (e.g. pain, disability): there is a low risk of bias for outcome assessors if there is a low risk of bias for participant blinding (Boutron 2005);
-
for outcome criteria that are clinical or therapeutic events that will be determined by the interaction between patients and care providers (e.g. co‐interventions, length of hospitalisation, treatment failure), in which the care provider is the outcome assessor: there is a low risk of bias for outcome assessors if there is a low risk of bias for care providers (Boutron 2005);
-
for outcome criteria that are assessed from data from medical forms: there is a low risk of bias if the treatment or adverse effects of the treatment could not be noticed in the extracted data (Boutron 2005).
Incomplete outcome data (attrition bias)
Attrition bias due to amount, nature or handling of incomplete outcome data
There is a low risk of attrition bias if there were no missing outcome data; reasons for missing outcome data were unlikely to be related to the true outcome (for survival data, censoring unlikely to be introducing bias); missing outcome data were balanced in numbers, with similar reasons for missing data across groups; for dichotomous outcome data, the proportion of missing outcomes compared with the observed event risk was not enough to have a clinically relevant impact on the intervention effect estimate; for continuous outcome data, the plausible effect size (difference in means or standardised difference in means) among missing outcomes was not enough to have a clinically relevant impact on observed effect size, or missing data were imputed using appropriate methods (if dropouts are very large, imputation using even 'acceptable' methods may still suggest a high risk of bias) (van Tulder 2003). The percentage of withdrawals and dropouts should not exceed 20% for short‐term follow‐up and 30% for long‐term follow‐up and should not lead to substantial bias (these percentages are commonly used but arbitrary, not supported by literature) (van Tulder 2003).
Selective reporting (reporting bias)
Reporting bias due to selective outcome reporting
There is low risk of reporting bias if the study protocol is available and all of the study's pre‐specified (primary and secondary) outcomes that are of interest in the review have been reported in the pre‐specified way, or if the study protocol is not available but it is clear that the published reports include all expected outcomes, including those that were pre‐specified (convincing text of this nature may be uncommon).
There is a high risk of reporting bias if not all of the study's pre‐specified primary outcomes have been reported; one or more primary outcomes is reported using measurements, analysis methods or subsets of the data (e.g. subscales) that were not pre‐specified; one or more reported primary outcomes were not pre‐specified (unless clear justification for their reporting is provided, such as an unexpected adverse effect); one or more outcomes of interest in the review are reported incompletely so that they cannot be entered in a meta‐analysis; the study report fails to include results for a key outcome that would be expected to have been reported for such a study.
Group similarity at baseline (selection bias)
Bias due to dissimilarity at baseline for the most important prognostic indicators.
There is low risk of bias if groups are similar at baseline for demographic factors, value of main outcome measure(s) and important prognostic factors (examples in the field of back and neck pain are duration and severity of complaints, vocational status, percentage of patients with neurological symptoms) (van Tulder 2003).
Co‐interventions (performance bias)
Bias because co‐interventions were different across groups
There is low risk of bias if there were no co‐interventions or they were similar between the index and control groups (van Tulder 2003).
Compliance (performance bias)
Bias due to inappropriate compliance with interventions across groups
There is low risk of bias if compliance with the interventions was acceptable, based on the reported intensity/dosage, duration, number and frequency for both the index and control intervention(s). For single‐session interventions (e.g. surgery), this item is irrelevant (van Tulder 2003).
Intention‐to‐treat‐analysis
There is low risk of bias if all randomised patients were reported/analysed in the group to which they were allocated by randomisation.
Timing of outcome assessments (detection bias)
Bias because important outcomes were not measured at the same time across groups
There is low risk of bias if all important outcome assessments for all intervention groups were measured at the same time (van Tulder 2003).
Other bias
Bias due to problems not covered elsewhere in the table
There is a low risk of bias if the study appears to be free of other sources of bias not addressed elsewhere (e.g. study funding).
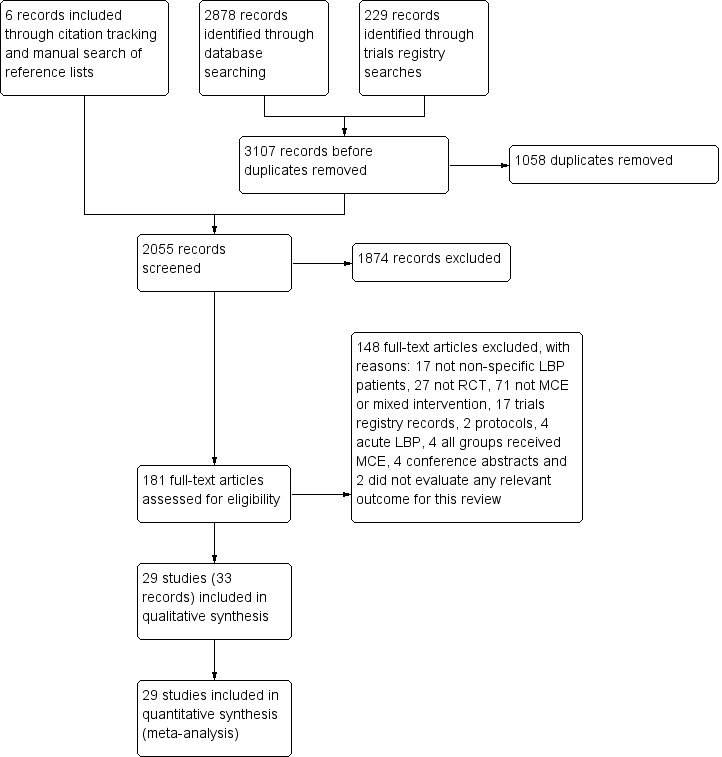
Study flow diagram.

'Risk of bias' summary: review authors' judgements about each risk of bias item for each included study.

'Risk of bias' graph: review authors' judgements about each risk of bias item presented as percentages across all included studies.

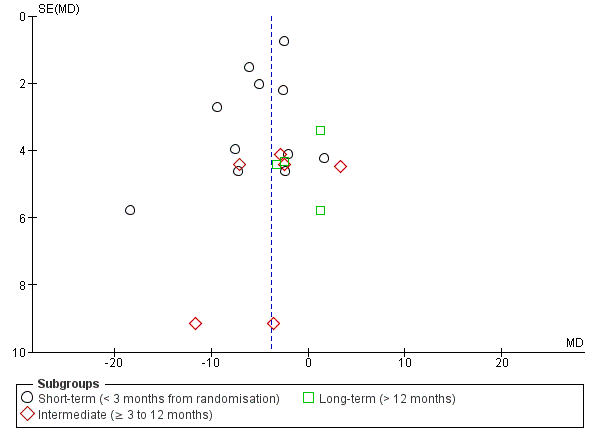
Funnel plot of comparison: motor control exercise versus other exercises, outcome: Pain.
Funnel plot of comparison: Motor control exercise versus other exercises, outcome: Disability.

Comparison 1 Motor control exercise versus other exercises, Outcome 1 Pain.

Comparison 1 Motor control exercise versus other exercises, Outcome 2 Disability.

Comparison 1 Motor control exercise versus other exercises, Outcome 3 Function.

Comparison 1 Motor control exercise versus other exercises, Outcome 4 Global impression of recovery.

Comparison 1 Motor control exercise versus other exercises, Outcome 5 Quality of life (physical component summary).

Comparison 1 Motor control exercise versus other exercises, Outcome 6 Quality of life (mental component summary).
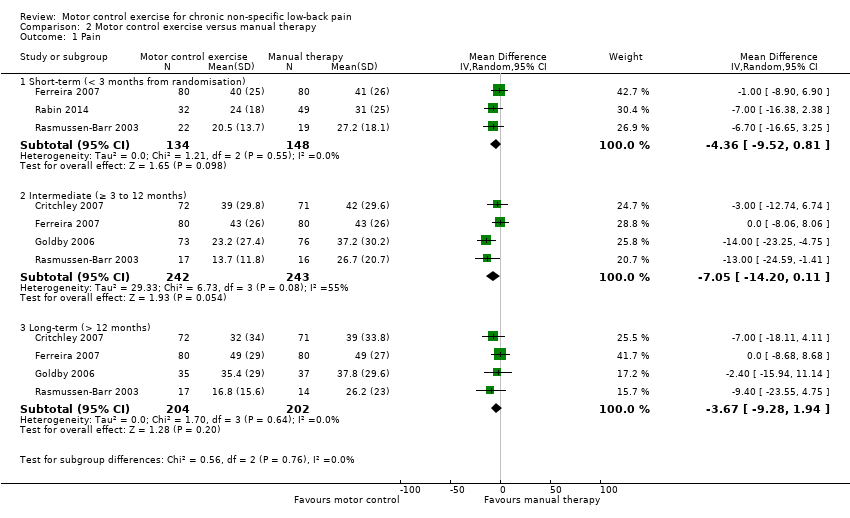
Comparison 2 Motor control exercise versus manual therapy, Outcome 1 Pain.

Comparison 2 Motor control exercise versus manual therapy, Outcome 2 Disability.

Comparison 2 Motor control exercise versus manual therapy, Outcome 3 Function.

Comparison 2 Motor control exercise versus manual therapy, Outcome 4 Global impression of recovery.
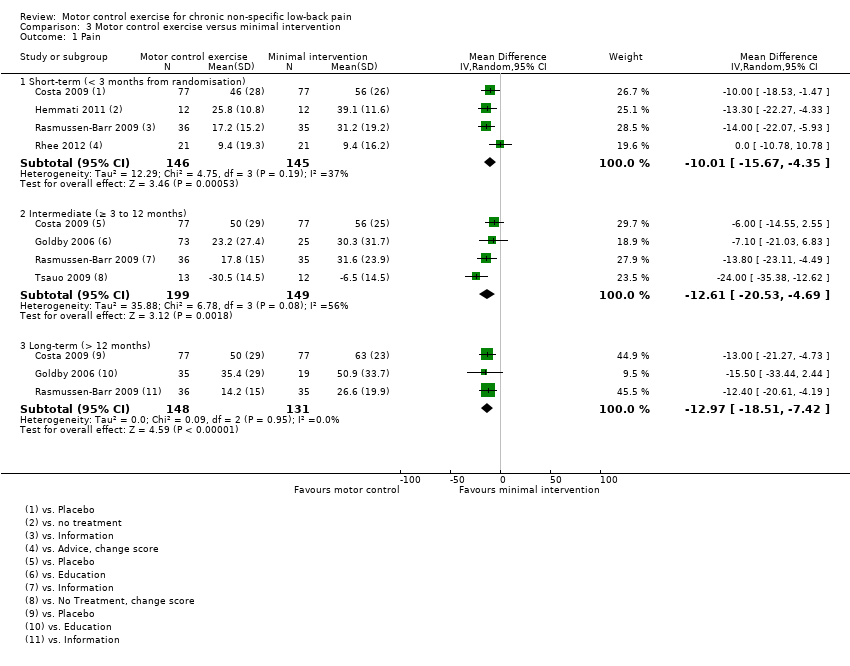
Comparison 3 Motor control exercise versus minimal intervention, Outcome 1 Pain.
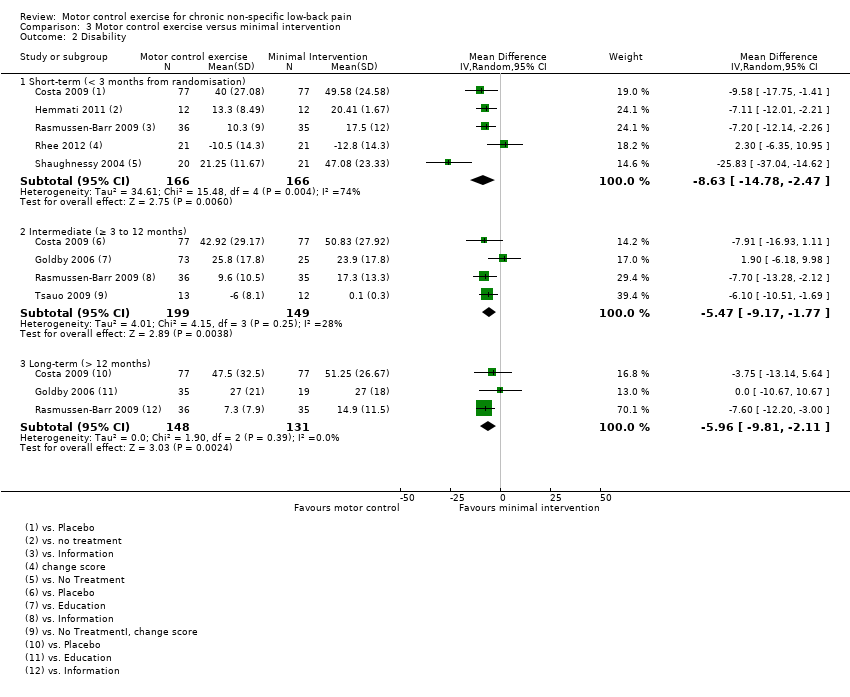
Comparison 3 Motor control exercise versus minimal intervention, Outcome 2 Disability.

Comparison 3 Motor control exercise versus minimal intervention, Outcome 3 Function.
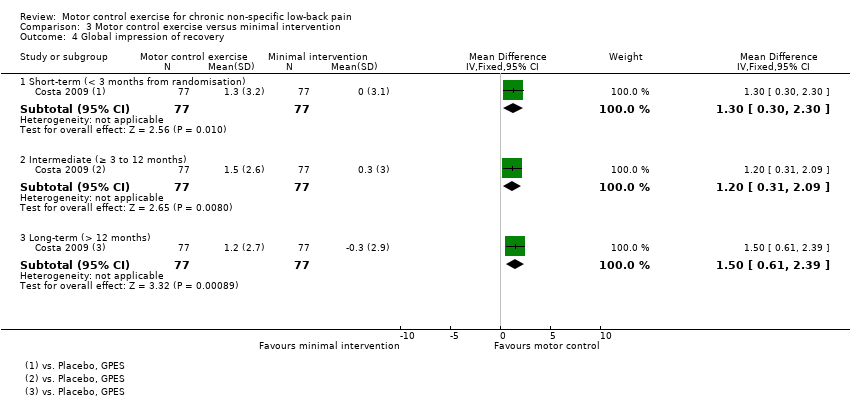
Comparison 3 Motor control exercise versus minimal intervention, Outcome 4 Global impression of recovery.

Comparison 4 Motor control exercise versus exercise and EPA, Outcome 1 Pain.
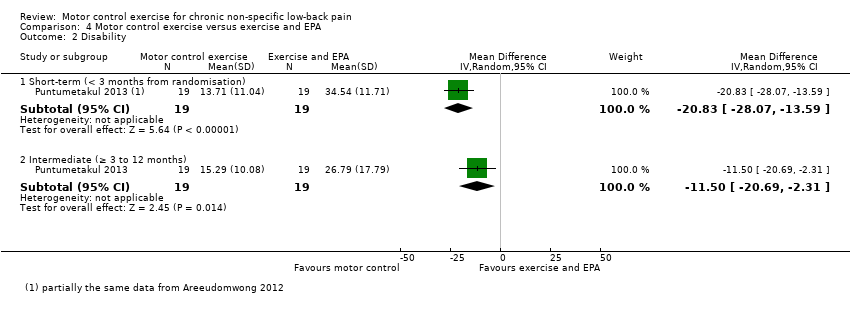
Comparison 4 Motor control exercise versus exercise and EPA, Outcome 2 Disability.
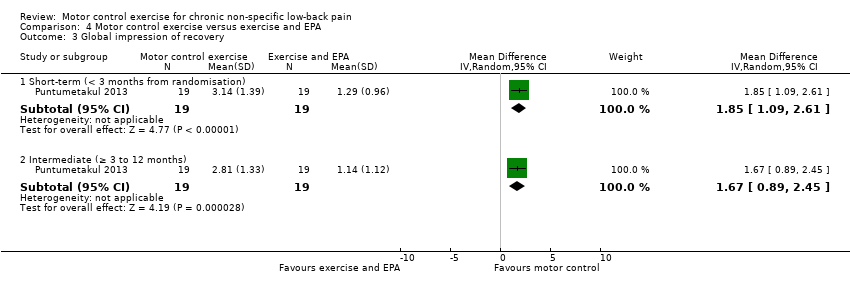
Comparison 4 Motor control exercise versus exercise and EPA, Outcome 3 Global impression of recovery.

Comparison 4 Motor control exercise versus exercise and EPA, Outcome 4 Quality of life (physical component summary).

Comparison 4 Motor control exercise versus exercise and EPA, Outcome 5 Quality of life (mental component summary).
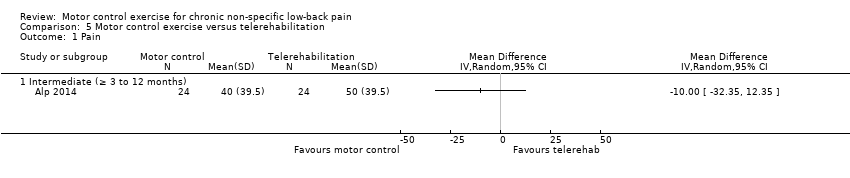
Comparison 5 Motor control exercise versus telerehabilitation, Outcome 1 Pain.

Comparison 5 Motor control exercise versus telerehabilitation, Outcome 2 Disability.

Comparison 5 Motor control exercise versus telerehabilitation, Outcome 3 Quality of life (mental component summary).

Comparison 5 Motor control exercise versus telerehabilitation, Outcome 4 Quality of life (physical component summary).
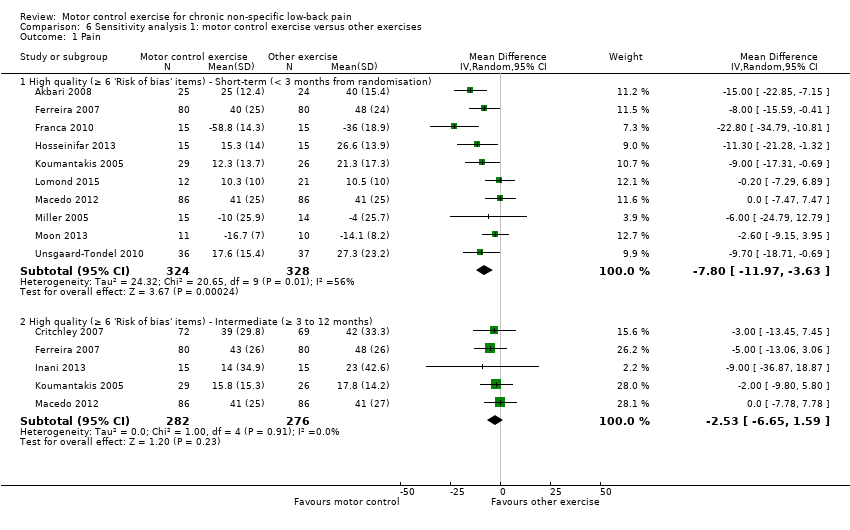
Comparison 6 Sensitivity analysis 1: motor control exercise versus other exercises, Outcome 1 Pain.

Comparison 6 Sensitivity analysis 1: motor control exercise versus other exercises, Outcome 2 Disability.

Comparison 7 Sensitivity analysis 2: motor control exercise versus minimal intervention, Outcome 1 Pain.

Comparison 7 Sensitivity analysis 2: motor control exercise versus minimal intervention, Outcome 2 Disability.

Comparison 8 Sensitivity analysis 3: motor control exercise versus manual therapy, Outcome 1 Pain.

Comparison 8 Sensitivity analysis 3: motor control exercise versus manual therapy, Outcome 2 Disability.
| Motor control exercise compared with other exercises for chronic low back pain | |||||
| Patient or population: patients with non‐specific chronic low back pain Settings: primary or tertiary care Intervention: motor control exercise Comparison: other exercises | |||||
| Outcomes | Illustrative comparative risks* (95% CI) | No of participants | Quality of the evidence | Comments | |
| Assumed risk | Corresponding risk | ||||
| Other exercises | Motor control exercise | ||||
| Pain VAS (0 to 100) Short‐term follow‐up (< 3 months from randomisation) | The mean pain ranged across control groups from 10.5 to 48 points | The mean pain in the intervention groups was (10.47 to 4.40 lower) | 872 participants (13 studies) | ⊕⊕⊝⊝ | — |
| Pain VAS (0 to 100) Intermediate follow‐up (> 3 months and < 12 months) | The mean pain ranged across control groups from 17.8 to 48 points | The mean pain in the intervention groups was (8.14 to 1.62 lower) | 588 participants (6 studies) | ⊕⊕⊕⊕ | — |
| Pain VAS (0 to 100) Long‐term follow‐up (> 12 months from randomisation) | The mean pain ranged across control groups from 26.6 to 52 points | The mean pain in the intervention groups was (6.90 lower to 1.53 higher) | 643 participants (5 studies) | ⊕⊕⊕⊕ | — |
| Disability Multiple scales (0 to 100) Short‐term follow‐up (< 3 months from randomisation) | The mean disability ranged across control groups from 11 to 40.4 points | The mean disability in the intervention groups was (7.02 to 2.65 lower) | 794 participants (11 studies) | ⊕⊝⊝⊝ | — |
| Disability Multiple scales (0 to 100) Intermediate follow‐up (> 3 months and < 12 months) | The mean disability ranged across control groups from 8 to 42.1 points | The mean disability in the intervention groups was (8.12 to 0.23 lower) | 588 participants (6 studies) | ⊕⊕⊕⊕ | — |
| Disability Multiple scales (0 to 100) Long‐term follow‐up (> 12 months from randomisation) | The mean disability ranged across control groups from 27.1 to 40 points | The mean disability in the intervention groups was (4.87 lower to 3.45 higher) | 570 participants (4 studies) | ⊕⊕⊕⊕ | — |
| Adverse events | See comment | See comment | — | See comment | 2 trials reported mild adverse events |
| *The basis for the assumed risk (e.g. the median control group risk across studies) is provided in footnotes. The corresponding risk (and its 95% confidence interval) is based on the assumed risk in the comparison group and the relative effect of the intervention (and its 95% CI). | |||||
| GRADE Working Group grades of evidence Moderate quality: We are moderately confident in the effect estimate: The true effect is likely to be close to the estimate of the effect, but there is a possibility that it is substantially different. | |||||
| 1Downgraded due to risk of bias (> 25% of the participants from trials with a high risk of bias). 2Downgraded due to publication bias. | |||||
| Motor control exercise compared with manual therapy for chronic low back pain | |||||
| Patient or population: patients with non‐specific chronic low back pain Settings: primary or tertiary care Intervention: motor control exercise Comparison: manual therapy | |||||
| Outcomes | Illustrative comparative risks* (95% CI) | No of participants | Quality of the evidence | Comments | |
| Assumed risk | Corresponding risk | ||||
| Manual therapy | Motor control exercise | ||||
| Pain VAS (0 to 100) Short‐term follow‐up (< 3 months from randomisation) | The mean pain ranged across control groups from 27.2 to 41 points | The mean pain in the intervention groups was (9.52 lower to 0.81 higher) | 282 participants | ⊕⊕⊕⊝ | — |
| Pain VAS (0 to 100) Intermediate follow‐up (> 3 months and < 12 months) | The mean pain ranged across control groups from 26.7 to 43 points | The mean pain in the intervention groups was (14.20 lower to 0.11 higher) | 485 participants | ⊕⊕⊕⊝ | — |
| Pain VAS (0 to 100) Long‐term follow‐up (> 12 months from randomisation) | The mean pain ranged across control groups from 26.2 to 49 points | The mean pain in the intervention groups was (9.28 lower to 1.94 higher) | 406 participants | ⊕⊕⊕⊕ | — |
| Disability Multiple scales (0 to 100) Short‐term follow‐up (< 3 months from randomisation) | The mean disability ranged across control groups from 14 to 32.9 points | The mean disability in the intervention groups was (6.60 lower to 1.02 higher) | 282 participants | ⊕⊕⊕⊝ | — |
| Disability Multiple scales (0 to 100) Intermediate follow‐up (> 3 months and < 12 months) | The mean disability ranged across control groups from 14 to 33.3 points | The mean disability in the intervention groups was (6.97 lower to 0.40 higher) | 485 participants | ⊕⊕⊕⊕ | — |
| Disability Multiple scales (0 to 100) Long‐term follow‐up (> 12 months from randomisation) | The mean disability ranged across control groups from 14.3 to 38.3 points | The mean disability in the intervention groups was (7.87 lower to 1.07 higher) | 406 participants | ⊕⊕⊕⊕ | — |
| Adverse events | See comment | See comment | — | See comment | None of the included trials reported any relevant adverse events |
| *The basis for the assumed risk (e.g. the median control group risk across studies) is provided in footnotes. The corresponding risk (and its 95% confidence interval) is based on the assumed risk in the comparison group and the relative effect of the intervention (and its 95% CI). | |||||
| GRADE Working Group grades of evidence High quality We are very confident that the true effect lies close to that of the estimate of the effect. Moderate quality: We are moderately confident in the effect estimate: The true effect is likely to be close to the estimate of the effect, but there is a possibility that it is substantially different. | |||||
| 1Downgraded due to imprecision. 2Downgraded due to inconsistency. | |||||
| Motor control exercise compared with minimal intervention for chronic low back pain | |||||
| Patient or population: patients with non‐specific chronic low back pain Settings: primary or tertiary care Intervention: motor control exercise Comparison: minimal intervention | |||||
| Outcomes | Illustrative comparative risks* (95% CI) | No of participants | Quality of the evidence | Comments | |
| Assumed risk | Corresponding risk | ||||
| Minimal intervention | Motor control exercise | ||||
| Pain VAS (0 to 100) Short‐term follow‐up (< 3 months from randomisation) | The mean pain ranged across control groups from 9.4 to 56 points | The mean pain in the intervention groups was (15.67 to 4.35 lower) | 291 participants | ⊕⊕⊕⊝ | — |
| Pain VAS (0 to 100) Intermediate follow‐up (> 3 months and < 12 months) | The mean pain ranged across control groups from 30.3 to 56 points | The mean pain in the intervention groups was (20.53 to 4.69 lower) | 348 participants | ⊕⊕⊝⊝ | — |
| Pain VAS (0 to 100) Long‐term follow‐up (> 12 months from randomisation) | The mean pain ranged across control groups from 26.6 to 50.9 points | The mean pain in the intervention groups was (18.51 to 7.42 lower) | 279 participants | ⊕⊕⊕⊝ | — |
| Disability Multiple scales (0 to 100) Short‐term follow‐up (< 3 months from randomisation) | The mean disability ranged across control groups from 17.5 to 49.6 points | The mean disability in the intervention groups was (14.78 to 2.47 lower) | 332 participants | ⊕⊝⊝⊝ | — |
| Disability Multiple scales (0 to 100) Intermediate follow‐up (> 3 months and < 12 months) | The mean disability ranged across control groups from 0.1 to 50.8 points | The mean disability in the intervention groups was (9.17 to 1.77 lower) | 348 participants | ⊕⊕⊕⊝ | — |
| Disability Multiple scales (0 to 100) Long‐term follow‐up (> 12 months from randomisation) | The mean disability ranged across control groups from 14.9 to 51.3 points | The mean disability in the intervention groups was (9.81 to 2.11 lower) | 279 participants | ⊕⊕⊕⊝ | — |
| Adverse events | See comment | See comment | — | See comment | One trial reported mild adverse events |
| *The basis for the assumed risk (e.g. the median control group risk across studies) is provided in footnotes. The corresponding risk (and its 95% confidence interval) is based on the assumed risk in the comparison group and the relative effect of the intervention (and its 95% CI). | |||||
| GRADE Working Group grades of evidence High quality We are very confident that the true effect lies close to that of the estimate of the effect. Moderate quality: We are moderately confident in the effect estimate: The true effect is likely to be close to the estimate of the effect, but there is a possibility that it is substantially different. | |||||
| 1Downgraded due to imprecision. 2Downgraded due to inconsistency. 3Downgraded due to risk of bias (> 25% of the participants from trials with a high risk of bias). | |||||
| Motor control exercise compared with a combination of exercise and electrophysical agents (EPA) for chronic low back pain | |||||
| Patient or population: patients with non‐specific chronic low back pain Settings: primary or tertiary care Intervention: motor control exercise Comparison: exercise and EPA | |||||
| Outcomes | Illustrative comparative risks* (95% CI) | No of Participants | Quality of the evidence | Comments | |
| Assumed risk | Corresponding risk | ||||
| Exercise and EPA | Motor control exercise | ||||
| Pain VAS (0 to 100) Short‐term follow‐up (< 3 months from randomisation) | The mean pain ranged across control groups from 43.3 to 57.1 points | The mean pain in the intervention groups was (35.32 to 25.05 lower) | 68 participants | ⊕⊕⊝⊝ | — |
| Pain VAS (0 to 100) Intermediate follow‐up (> 3 months and < 12 months) | The mean pain ranged across control groups from 28.7 to 58.1 points | The mean pain in the intervention groups was (36.83 to 1.96 lower) | 179 participants | ⊕⊝⊝⊝ | — |
| Disability Multiple scales (0 to 100) Short‐term follow‐up (< 3 months from randomisation) | The mean disability in the control group was 34.54 points | The mean disability in the intervention group was (28.07 to 13.59 lower) | 38 participants (1 study) | ⊕⊝⊝⊝ | — |
| Disability Multiple scales (0 to 100) Intermediate follow‐up (> 3 months and < 12 months) | The mean disability in the control group was 26.79 points | The mean disability in the intervention group was (20.69 to 2.31 lower) | 38 participants (1 study) | ⊕⊕⊝⊝ | — |
| Adverse events | See comment | See comment | — | See comment | None of the included trials reported any relevant adverse events |
| *The basis for the assumed risk (e.g. the median control group risk across studies) is provided in footnotes. The corresponding risk (and its 95% confidence interval) is based on the assumed risk in the comparison group and the relative effect of the intervention (and its 95% CI). | |||||
| GRADE Working Group grades of evidence High quality We are very confident that the true effect lies close to that of the estimate of the effect. Moderate quality: We are moderately confident in the effect estimate: The true effect is likely to be close to the estimate of the effect, but there is a possibility that it is substantially different. | |||||
| 1Downgraded due to imprecision. 2Downgraded due to indirectness. 3Downgraded due to inconsistency. | |||||
| Outcome or subgroup title | No. of studies | No. of participants | Statistical method | Effect size |
| 1 Pain Show forest plot | 16 | Mean Difference (IV, Random, 95% CI) | Subtotals only | |
| 1.1 Short‐term (< 3 months from randomisation) | 13 | 872 | Mean Difference (IV, Random, 95% CI) | ‐7.53 [‐10.54, ‐4.52] |
| 1.2 Intermediate (≥ 3 to 12 months) | 6 | 588 | Mean Difference (IV, Random, 95% CI) | ‐2.98 [‐6.96, 0.99] |
| 1.3 Long‐term (> 12 months) | 5 | 643 | Mean Difference (IV, Random, 95% CI) | ‐2.69 [‐6.90, 1.53] |
| 2 Disability Show forest plot | 14 | Mean Difference (IV, Random, 95% CI) | Subtotals only | |
| 2.1 Short‐term (< 3 months from randomisation) | 11 | 794 | Mean Difference (IV, Random, 95% CI) | ‐4.82 [‐6.95, ‐2.68] |
| 2.2 Intermediate (≥ 3 to 12 months) | 6 | 588 | Mean Difference (IV, Random, 95% CI) | ‐2.88 [‐6.92, 1.15] |
| 2.3 Long‐term (> 12 months) | 4 | 570 | Mean Difference (IV, Random, 95% CI) | ‐0.71 [‐4.87, 3.45] |
| 3 Function Show forest plot | 3 | Mean Difference (IV, Random, 95% CI) | Subtotals only | |
| 3.1 Short‐term (< 3 months from randomisation) | 3 | 361 | Mean Difference (IV, Random, 95% CI) | 7.29 [1.53, 13.04] |
| 3.2 Intermediate (≥ 3 to 12 months) | 2 | 332 | Mean Difference (IV, Random, 95% CI) | 0.31 [‐0.83, 1.44] |
| 3.3 Long‐term (> 12 months) | 2 | 332 | Mean Difference (IV, Random, 95% CI) | 0.52 [‐1.36, 2.41] |
| 4 Global impression of recovery Show forest plot | 2 | Mean Difference (IV, Random, 95% CI) | Subtotals only | |
| 4.1 Short‐term (< 3 months from randomisation) | 2 | 332 | Mean Difference (IV, Random, 95% CI) | 0.88 [‐0.88, 2.65] |
| 4.2 Intermediate (≥ 3 to 12 months) | 2 | 332 | Mean Difference (IV, Random, 95% CI) | 0.30 [‐0.22, 0.82] |
| 4.3 Long‐term (> 12 months) | 2 | 332 | Mean Difference (IV, Random, 95% CI) | 0.53 [‐0.03, 1.08] |
| 5 Quality of life (physical component summary) Show forest plot | 2 | Mean Difference (IV, Random, 95% CI) | Subtotals only | |
| 5.1 Short‐term (< 3 months from randomisation) | 1 | 172 | Mean Difference (IV, Random, 95% CI) | 0.0 [‐3.80, 3.80] |
| 5.2 Intermediate (≥ 3 to 12 months) | 1 | 172 | Mean Difference (IV, Random, 95% CI) | 1.40 [‐2.61, 5.41] |
| 5.3 Long‐term (> 12 months) | 2 | 269 | Mean Difference (IV, Random, 95% CI) | 0.08 [‐3.14, 3.30] |
| 6 Quality of life (mental component summary) Show forest plot | 2 | Mean Difference (IV, Random, 95% CI) | Subtotals only | |
| 6.1 Short‐term (< 3 months from randomisation) | 1 | 172 | Mean Difference (IV, Random, 95% CI) | 0.20 [‐3.39, 3.79] |
| 6.2 Intermediate (≥ 3 to 12 months) | 1 | 172 | Mean Difference (IV, Random, 95% CI) | ‐2.0 [‐5.32, 1.32] |
| 6.3 Long‐term (> 12 months) | 2 | 269 | Mean Difference (IV, Random, 95% CI) | ‐0.75 [‐3.33, 1.83] |
| Outcome or subgroup title | No. of studies | No. of participants | Statistical method | Effect size |
| 1 Pain Show forest plot | 5 | Mean Difference (IV, Random, 95% CI) | Subtotals only | |
| 1.1 Short‐term (< 3 months from randomisation) | 3 | 282 | Mean Difference (IV, Random, 95% CI) | ‐4.36 [‐9.52, 0.81] |
| 1.2 Intermediate (≥ 3 to 12 months) | 4 | 485 | Mean Difference (IV, Random, 95% CI) | ‐7.05 [‐14.20, 0.11] |
| 1.3 Long‐term (> 12 months) | 4 | 406 | Mean Difference (IV, Random, 95% CI) | ‐3.67 [‐9.28, 1.94] |
| 2 Disability Show forest plot | 5 | Mean Difference (IV, Random, 95% CI) | Subtotals only | |
| 2.1 Short‐term (< 3 months from randomisation) | 3 | 282 | Mean Difference (IV, Random, 95% CI) | ‐2.79 [‐6.60, 1.02] |
| 2.2 Intermediate (≥ 3 to 12 months) | 4 | 485 | Mean Difference (IV, Random, 95% CI) | ‐3.28 [‐6.97, 0.40] |
| 2.3 Long‐term (> 12 months) | 4 | 406 | Mean Difference (IV, Random, 95% CI) | ‐3.40 [‐7.87, 1.07] |
| 3 Function Show forest plot | 1 | Mean Difference (IV, Random, 95% CI) | Subtotals only | |
| 3.1 Short‐term (< 3 months from randomisation) | 1 | 160 | Mean Difference (IV, Random, 95% CI) | 0.20 [‐1.82, 2.22] |
| 3.2 Intermediate (≥ 3 to 12 months) | 1 | 160 | Mean Difference (IV, Random, 95% CI) | ‐0.90 [‐3.01, 1.21] |
| 3.3 Long‐term (> 12 months) | 1 | 160 | Mean Difference (IV, Random, 95% CI) | 0.5 [‐1.61, 2.61] |
| 4 Global impression of recovery Show forest plot | 1 | Mean Difference (IV, Random, 95% CI) | Subtotals only | |
| 4.1 Short‐term (< 3 months from randomisation) | 1 | 160 | Mean Difference (IV, Random, 95% CI) | 0.5 [‐0.12, 1.12] |
| 4.2 Intermediate (≥ 3 to 12 months) | 1 | 160 | Mean Difference (IV, Random, 95% CI) | 0.20 [‐0.58, 0.98] |
| 4.3 Long‐term (> 12 months) | 1 | 160 | Mean Difference (IV, Random, 95% CI) | 0.60 [‐0.24, 1.44] |
| Outcome or subgroup title | No. of studies | No. of participants | Statistical method | Effect size |
| 1 Pain Show forest plot | 6 | Mean Difference (IV, Random, 95% CI) | Subtotals only | |
| 1.1 Short‐term (< 3 months from randomisation) | 4 | 291 | Mean Difference (IV, Random, 95% CI) | ‐10.01 [‐15.67, ‐4.35] |
| 1.2 Intermediate (≥ 3 to 12 months) | 4 | 348 | Mean Difference (IV, Random, 95% CI) | ‐12.61 [‐20.53, ‐4.69] |
| 1.3 Long‐term (> 12 months) | 3 | 279 | Mean Difference (IV, Random, 95% CI) | ‐12.97 [‐18.51, ‐7.42] |
| 2 Disability Show forest plot | 7 | Mean Difference (IV, Random, 95% CI) | Subtotals only | |
| 2.1 Short‐term (< 3 months from randomisation) | 5 | 332 | Mean Difference (IV, Random, 95% CI) | ‐8.63 [‐14.78, ‐2.47] |
| 2.2 Intermediate (≥ 3 to 12 months) | 4 | 348 | Mean Difference (IV, Random, 95% CI) | ‐5.47 [‐9.17, ‐1.77] |
| 2.3 Long‐term (> 12 months) | 3 | 279 | Mean Difference (IV, Random, 95% CI) | ‐5.96 [‐9.81, ‐2.11] |
| 3 Function Show forest plot | 1 | Mean Difference (IV, Fixed, 95% CI) | Subtotals only | |
| 3.1 Short‐term (< 3 months from randomisation) | 1 | 154 | Mean Difference (IV, Fixed, 95% CI) | 1.10 [0.36, 1.84] |
| 3.2 Intermediate (≥ 3 to 12 months) | 1 | 154 | Mean Difference (IV, Fixed, 95% CI) | 1.0 [0.16, 1.84] |
| 3.3 Long‐term (> 12 months) | 1 | 154 | Mean Difference (IV, Fixed, 95% CI) | 1.50 [0.68, 2.32] |
| 4 Global impression of recovery Show forest plot | 1 | Mean Difference (IV, Fixed, 95% CI) | Subtotals only | |
| 4.1 Short‐term (< 3 months from randomisation) | 1 | 154 | Mean Difference (IV, Fixed, 95% CI) | 1.3 [0.30, 2.30] |
| 4.2 Intermediate (≥ 3 to 12 months) | 1 | 154 | Mean Difference (IV, Fixed, 95% CI) | 1.2 [0.31, 2.09] |
| 4.3 Long‐term (> 12 months) | 1 | 154 | Mean Difference (IV, Fixed, 95% CI) | 1.5 [0.61, 2.39] |
| Outcome or subgroup title | No. of studies | No. of participants | Statistical method | Effect size |
| 1 Pain Show forest plot | 3 | Mean Difference (IV, Random, 95% CI) | Subtotals only | |
| 1.1 Short‐term (< 3 months from randomisation) | 2 | 68 | Mean Difference (IV, Random, 95% CI) | ‐30.18 [‐35.32, ‐25.05] |
| 1.2 Intermediate (≥ 3 to 12 months) | 2 | 179 | Mean Difference (IV, Random, 95% CI) | ‐19.39 [‐36.83, ‐1.96] |
| 2 Disability Show forest plot | 1 | Mean Difference (IV, Random, 95% CI) | Subtotals only | |
| 2.1 Short‐term (< 3 months from randomisation) | 1 | 38 | Mean Difference (IV, Random, 95% CI) | ‐20.83 [‐28.07, ‐13.59] |
| 2.2 Intermediate (≥ 3 to 12 months) | 1 | 38 | Mean Difference (IV, Random, 95% CI) | ‐11.5 [‐20.69, ‐2.31] |
| 3 Global impression of recovery Show forest plot | 1 | Mean Difference (IV, Random, 95% CI) | Subtotals only | |
| 3.1 Short‐term (< 3 months from randomisation) | 1 | 38 | Mean Difference (IV, Random, 95% CI) | 1.85 [1.09, 2.61] |
| 3.2 Intermediate (≥ 3 to 12 months) | 1 | 38 | Mean Difference (IV, Random, 95% CI) | 1.67 [0.89, 2.45] |
| 4 Quality of life (physical component summary) Show forest plot | 1 | Mean Difference (IV, Random, 95% CI) | Subtotals only | |
| 4.1 Short‐term (< 3 months from randomisation) | 1 | 38 | Mean Difference (IV, Random, 95% CI) | 8.40 [2.68, 14.12] |
| 4.2 Intermediate (≥ 3 to 12 months) | 1 | 38 | Mean Difference (IV, Random, 95% CI) | 8.0 [2.25, 13.75] |
| 5 Quality of life (mental component summary) Show forest plot | 1 | Mean Difference (IV, Random, 95% CI) | Subtotals only | |
| 5.1 Short‐term (< 3 months from randomisation) | 1 | 38 | Mean Difference (IV, Random, 95% CI) | 2.48 [‐2.17, 7.13] |
| 5.2 Intermediate (≥ 3 to 12 months) | 1 | 38 | Mean Difference (IV, Random, 95% CI) | 1.64 [‐2.95, 6.23] |
| Outcome or subgroup title | No. of studies | No. of participants | Statistical method | Effect size |
| 1 Pain Show forest plot | 1 | Mean Difference (IV, Random, 95% CI) | Totals not selected | |
| 1.1 Intermediate (≥ 3 to 12 months) | 1 | Mean Difference (IV, Random, 95% CI) | 0.0 [0.0, 0.0] | |
| 2 Disability Show forest plot | 1 | Mean Difference (IV, Random, 95% CI) | Totals not selected | |
| 2.1 Intermediate (≥ 3 to 12 months) | 1 | Mean Difference (IV, Random, 95% CI) | 0.0 [0.0, 0.0] | |
| 3 Quality of life (mental component summary) Show forest plot | 1 | Mean Difference (IV, Random, 95% CI) | Totals not selected | |
| 3.1 Intermediate (≥ 3 to 12 months) | 1 | Mean Difference (IV, Random, 95% CI) | 0.0 [0.0, 0.0] | |
| 4 Quality of life (physical component summary) Show forest plot | 1 | Mean Difference (IV, Random, 95% CI) | Totals not selected | |
| 4.1 Intermediate (≥ 3 to 12 months) | 1 | Mean Difference (IV, Random, 95% CI) | 0.0 [0.0, 0.0] | |
| Outcome or subgroup title | No. of studies | No. of participants | Statistical method | Effect size |
| 1 Pain Show forest plot | 12 | Mean Difference (IV, Random, 95% CI) | Subtotals only | |
| 1.1 High quality (≥ 6 'Risk of bias' items) ‐ Short‐term (< 3 months from randomisation) | 10 | 652 | Mean Difference (IV, Random, 95% CI) | ‐7.80 [‐11.97, ‐3.63] |
| 1.2 High quality (≥ 6 'Risk of bias' items) ‐ Intermediate (≥ 3 to 12 months) | 5 | 558 | Mean Difference (IV, Random, 95% CI) | ‐2.53 [‐6.65, 1.59] |
| 2 Disability Show forest plot | 10 | Mean Difference (IV, Random, 95% CI) | Subtotals only | |
| 2.1 High quality (≥ 6 'Risk of bias' items) ‐ Short‐term (< 3 months from randomisation) | 8 | 574 | Mean Difference (IV, Random, 95% CI) | ‐4.27 [‐6.58, ‐1.96] |
| 2.2 High quality (≥ 6 'Risk of bias' items) ‐ Intermediate (≥ 3 to 12 months) | 5 | 558 | Mean Difference (IV, Random, 95% CI) | ‐2.64 [‐6.37, 1.09] |
| Outcome or subgroup title | No. of studies | No. of participants | Statistical method | Effect size |
| 1 Pain Show forest plot | 3 | Mean Difference (IV, Random, 95% CI) | Subtotals only | |
| 1.1 High quality (≥ 6 'Risk of bias' items) ‐ Short‐term (< 3 months from randomisation) | 2 | 225 | Mean Difference (IV, Random, 95% CI) | ‐12.11 [‐17.98, ‐6.25] |
| 1.2 High quality (≥ 6 'Risk of bias' items) ‐ Intermediate (≥ 3 to 12 months) | 3 | 323 | Mean Difference (IV, Random, 95% CI) | ‐9.15 [‐14.89, ‐3.41] |
| 2 Disability Show forest plot | 3 | Mean Difference (IV, Random, 95% CI) | Subtotals only | |
| 2.1 High quality (≥ 6 'Risk of bias' items) ‐ Short‐term (< 3 months from randomisation) | 2 | 225 | Mean Difference (IV, Random, 95% CI) | ‐7.84 [‐12.07, ‐3.61] |
| 2.2 High quality (≥ 6 'Risk of bias' items) ‐ Intermediate (≥ 3 to 12 months) | 3 | 323 | Mean Difference (IV, Random, 95% CI) | ‐4.82 [‐10.96, 1.32] |
| Outcome or subgroup title | No. of studies | No. of participants | Statistical method | Effect size |
| 1 Pain Show forest plot | 4 | Mean Difference (IV, Random, 95% CI) | Subtotals only | |
| 1.1 High quality (≥ 6 'Risk of bias' items) ‐ Short‐term (< 3 months from randomisation) | 2 | 241 | Mean Difference (IV, Random, 95% CI) | ‐3.49 [‐9.54, 2.55] |
| 1.2 High quality (≥ 6 'Risk of bias' items) ‐ Intermediate (≥ 3 to 12 months) | 3 | 452 | Mean Difference (IV, Random, 95% CI) | ‐5.51 [‐13.94, 2.92] |
| 1.3 High quality (≥ 6 'Risk of bias' items) ‐ Long‐term (> 12 months) | 3 | 375 | Mean Difference (IV, Random, 95% CI) | ‐2.60 [‐8.71, 3.50] |
| 2 Disability Show forest plot | 4 | Mean Difference (IV, Fixed, 95% CI) | Subtotals only | |
| 2.1 High quality (≥ 6 'Risk of bias' items) ‐ Short‐term (< 3 months from randomisation) | 2 | 241 | Mean Difference (IV, Fixed, 95% CI) | ‐2.54 [‐7.20, 2.13] |
| 2.2 High quality (≥ 6 'Risk of bias' items) ‐ Intermediate (≥ 3 to 12 months) | 3 | 452 | Mean Difference (IV, Fixed, 95% CI) | ‐2.51 [‐6.74, 1.72] |
| 2.3 High quality (≥ 6 'Risk of bias' items) ‐ Long‐term (> 12 months) | 3 | 375 | Mean Difference (IV, Fixed, 95% CI) | ‐2.07 [‐7.44, 3.30] |