Different types of intranasal steroids for chronic rhinosinusitis
Abstract
Background
This review is one of six looking at the primary medical management options for patients with chronic rhinosinusitis.
Chronic rhinosinusitis is common and is characterised by inflammation of the lining of the nose and paranasal sinuses leading to nasal blockage, nasal discharge, facial pressure/pain and loss of sense of smell. The condition can occur with or without nasal polyps. Topical (intranasal) corticosteroids are used with the aim of reducing inflammation in the sinonasal mucosa in order to improve patient symptoms.
Objectives
To assess the effects of different types of intranasal steroids in people with chronic rhinosinusitis.
Search methods
The Cochrane ENT Information Specialist searched the ENT Trials Register; Central Register of Controlled Trials (CENTRAL 2015, Issue 7); MEDLINE; EMBASE; ClinicalTrials.gov; ICTRP and additional sources for published and unpublished trials. The date of the search was 11 August 2015.
Selection criteria
Randomised controlled trials (RCTs) with a follow‐up period of at least three months comparing first‐generation intranasal corticosteroids (e.g. beclomethasone dipropionate, triamcinolone acetonide, flunisolide, budesonide) with second‐generation intranasal corticosteroids (e.g. ciclesonide, fluticasone furoate, fluticasone propionate, mometasone furoate, betamethasone sodium phosphate), or sprays versus drops, or low‐dose versus high‐dose intranasal corticosteroids.
Data collection and analysis
We used the standard methodological procedures expected by Cochrane. Our primary outcomes were disease‐specific health‐related quality of life (HRQL), patient‐reported disease severity and the commonest adverse event ‐ epistaxis (nosebleed). Secondary outcomes included general HRQL, endoscopic nasal polyp score, computerised tomography (CT) scan score and the adverse event of local irritation. We used GRADE to assess the quality of the evidence for each outcome; this is indicated in italics.
Main results
We included nine RCTs (911 participants), including four different comparisons. None of the studies evaluated our first primary outcome measure, disease‐specific HRQL.
Fluticasone propionate versus beclomethasone dipropionate
We identified two small studies (56 participants with polyps) that evaluated disease severity and looked at the primary adverse effect: epistaxis , but no other outcomes. We cannot report any numerical data but the study authors reported no difference between the two steroids. The evidence was of very low quality.
Fluticasone propionate versus mometasone furoate
We identified only one study (100 participants with polyps) that evaluated disease severity (nasal symptoms scores), which reported no difference (no numerical data available). The evidence was of very low quality.
High‐dose versus low‐dose steroids
We included five studies (663 participants with nasal polyps), three using mometasone furoate (400 µg versus 200 µg in adults and older children, 200 µg versus 100 µg in younger children) and two using fluticasone propionate drops (800 µg versus 400 µg). We found low quality evidence relating to disease severity and nasal polyps size, with results from the high‐dose and low‐dose groups being similar. Although all studies reported more improvement in polyp score in the high‐dose group, the significance of this is unclear due to the small size of the improvements.
The primary adverse effect, epistaxis , was more common when higher doses were used (risk ratio (RR) 2.06, 95% confidence interval (CI) 1.20 to 3.54, 637 participants, moderate quality evidence). Most of the studies that contributed data to this outcome used a broad definition of epistaxis, which ranged from frank bleeding to bloody nasal discharge to flecks of blood in the mucus.
Aqueous nasal spray versus aerosol spray
We identified only one poorly reported study (unclear number of participants for comparison of interest, 91 between three treatment arms), in which there were significant baseline differences between the participants in the two groups. We were unable to draw meaningful conclusions from the data.
Authors' conclusions
We found insufficient evidence to suggest that one type of intranasal steroid is more effective than another in patients with chronic rhinosinusitis, nor that the effectiveness of a spray differs from an aerosol. We identified no studies that compared drops with spray.
It is unclear if higher doses result in better symptom improvements (low quality evidence), but there was moderate quality evidence of an increased risk of epistaxis as an adverse effect of treatment when higher doses were used. This included all levels of severity of epistaxis and it is likely that the proportion of events that required patients to discontinue usage is low due to the low numbers of withdrawals attributed to it. If epistaxis is limited to streaks of blood in the mucus it may be tolerated by the patient and it may be safe to continue treatment. However, it may be a factor that affects compliance.
There is insufficient evidence to suggest that the different types of corticosteroid molecule or spray versus aerosol have different effects. Lower doses have similar effectiveness but fewer side effects.
Clearly more research in this area is needed, with specific attention given to trial design, disease‐specific health‐related quality of life outcomes and evaluation of longer‐term outcomes and adverse effects.
PICO
Plain language summary
Different types of intranasal steroids for chronic rhinosinusitis
Review question
We reviewed the evidence for the benefits and harms of different types of intranasal (in the nose) steroids given to people with chronic rhinosinusitis.
Background
Chronic rhinosinusitis is a common condition that is defined as inflammation of the nose and paranasal sinuses (a group of air‐filled spaces behind the nose, eyes and cheeks). Patients with chronic rhinosinusitis experience at least two or more of the following symptoms for at least 12 weeks: blocked nose, discharge from their nose or runny nose, pain or pressure in their face and/or a reduced sense of smell (hyposmia). Some people will also have nasal polyps, which are grape‐like swellings of the normal nasal lining inside the nasal passage and sinuses. Topical (intranasal) corticosteroids are used with the aim of reducing inflammation in order to improve patient symptoms.
Study characteristics
We included nine randomised controlled trials (RCTs) with a total of 910 participants in this review. The studies varied in size: some were small, with as few as 20 patients, while others included over 200 participants. Most studies recruited adult patients, but one study only included children. In the majority of the adult studies, most participants were male (72% to 79%). In all of the studies the participants had chronic rhinosinusitis with nasal polyps. The studies either compared different types of steroids (three studies), high‐dose versus low‐dose steroids (five studies), twice daily versus once daily steroids, or different delivery methods (aqueous nasal spray versus aerosol ‐ one study). All of the studies had a placebo group.
Key results and quality of the evidence
Different steroids: fluticasone propionate versus beclomethasone dipropionate
Two small studies (56 participants, unclear risk of bias) evaluated disease severity and looked at the primary adverse effect, epistaxis (nosebleed), but no other outcomes. No difference was found between the two steroids but we assessed the evidence to be of very low quality.
Different steroids: fluticasone propionate versus mometasone furoate
One study (100 participants, unclear risk of bias) found no difference in disease severity (nasal symptoms scores). We assessed this evidence to be of very low quality.
High‐dose versus low‐dose steroids
We found five studies (663 participants, low or unclear risk of bias) that compared high‐dose and low‐dose steroids, three using mometasone furoate (400 µg versus 200 µg in adults and older children, 200 µg versus 100 µg in younger children), and two using fluticasone propionate drops (800 µg versus 400 µg). Effectiveness (disease severity and nasal polyps size) was similar between the high‐dose and low‐dose groups (low quality evidence). Although all studies reported more improvement in polyp score in the high‐dose group, the significance of this is unclear because the improvements seen were small.
The primary adverse effect, epistaxis, was more common when higher doses were used (moderate quality evidence).
Different delivery methods: aqueous nasal spray versus aerosol spray
We identified only one poorly reported study with a high risk of bias. It was unclear how many participants there were: 91 were recruited into three arms. There had also been significant differences between the participants in the two groups when they started the study. We were unable to draw any meaningful conclusions from this study.
Conclusions
We found no evidence that one type of intranasal steroid is more effective than another in patients with chronic rhinosinusitis, nor that higher doses are better than lower, nor that the effectiveness of a spray differs from an aerosol. We found no studies that compared nasal drops with spray. We did find moderate quality evidence of an increased risk of epistaxis (nosebleed) as an adverse effect of treatment when higher doses were used.
More research in this area is clearly needed. In the future studies should be well designed: they should measure chronic rhinosinusitis‐specific health‐related quality of life and adverse effects as outcomes, and look at what happens to patients taking intranasal steroids in the longer term.
Authors' conclusions
Summary of findings
| Different types of intranasal corticosteroid molecules for chronic rhinosinusitis | ||||||
| Patient or population: chronic rhinosinusitis (all studies recruited patients with bilateral polyps) | ||||||
| Outcomes № of participants | Relative effect (95%) | Anticipated absolute effects* (95% CI) | Quality | What happens | ||
| Low‐dose intranasal corticosteroids | High‐dose intranasal corticosteroids | Difference | ||||
| Disease‐specific health‐related quality of life | Not measured | Impact unknown | ||||
| Disease severity ‐ overall symptoms
| — |
| ⊕⊝⊝⊝ | No differences observed but evidence was too low quality to draw a conclusion | ||
| Adverse events: epistaxis
| — |
| ⊕⊝⊝⊝ | Unclear whether the risk of epistaxis varies for different types of steroid molecules | ||
| *The risk in the intervention group (and its 95% confidence interval) is based on the assumed risk in the comparison group and the relative effect of the intervention (and its 95% CI). | ||||||
| GRADE Working Group grades of evidence | ||||||
| 1Studies were either very small (n = 20 and n = 26) and had important drop‐outs or were only reported as an abstract with inadequate information available (n = 100). We considered all studies to be at unclear to high risk of selective reporting and attrition bias. The evidence was very low quality due to very serious imprecision and very serious risk of bias concerns. | ||||||
| High‐dose versus low‐dose intranasal corticosteroids for chronic rhinosinusitis | ||||||
| Patient or population: chronic rhinosinusitis (all studies recruited patients with bilateral polyps) | ||||||
| Outcomes № of participants | Relative effect | Anticipated absolute effects* (95% CI) | Quality | What happens | ||
| Low‐dose intranasal corticosteroids | High‐dose intranasal corticosteroids | Difference | ||||
| Disease‐specific health‐related quality of life | Not measured | Impact unknown | ||||
| Disease severity ‐ overall symptoms, measured as average change from baseline at 4 months | ||||||
| All 4 EPOS domains | No information available | |||||
| 3 domains (nasal blockage, rhinorrhoea, loss of sense of smell) Range 0 to 3, lower score = less severe № of participants: 237 | — | The mean disease severity ‐ overall symptoms, measured as average change from baseline at 4 months (range 0 to 3) ‐ average symptom score (3 domains) without high‐dose was ‐0.66 points | — | MD 0.13 points lower (0.37 lower to 0.11 more) than low‐dose group | ⊕⊕⊝⊝ | The average score for 3 types of symptoms seems to be similar between the high‐dose and low‐dose groups. |
| (2 domains: nasal blockage, rhinorrhoea) № of participants: 441 | — | The mean disease severity ‐ overall symptoms, measured as average change from baseline at 4 months (range 0 to 3) ‐ average symptom score (2 domains) without high‐dose was ‐0.73 points | — | MD 0.19 points lower (0.36 lower to 0.02 lower) than low‐dose group | ⊕⊕⊝⊝ | The average score for 2 types of symptoms seems to be slightly lower for the high‐dose group. The clinical significance of this reduction is unclear. |
| Disease severity ‐ measured as average change from baseline at 4 months (range 0 to 3) | ||||||
|
№ of participants: 441 | — | The mean disease severity ‐ individual symptoms, measured as average change from baseline at 4 months (range 0 to 3) ‐ nasal blockage without high‐dose was ‐0.86 points | — | MD 0.24 points lower (0.39 lower to 0.08 lower) than low‐dose group | ⊕⊕⊝⊝ | The nasal blockage score seems to be slightly lower in the high‐dose group. The clinical significance of this reduction is unclear. |
|
№ of participants: 441 (2 RCTs) | — | The mean disease severity ‐ individual symptoms, measured as average change from baseline at 4 months (range 0 to 3) ‐ rhinorrhoea without high‐dose was ‐0.6 points | — | MD 0.15 points lower (0.33 lower to 0.03 higher) than low‐dose group | ⊕⊕⊝⊝ | The average score for rhinorrhoea seems to be similar between the high‐dose and low‐dose groups. |
|
№ of participants: 237 | — | The mean disease severity ‐ individual symptoms, measured as average change from baseline at 4 months (range 0 to 3) ‐ loss of sense of smell without high‐dose was ‐0.6 points | — | MD 0.06 points higher (0.2 lower to 0.32 higher) than low‐dose group | ⊕⊕⊝⊝ | The average score for loss of sense of smell seems to be very similar between the high‐dose and low‐dose groups. |
| Adverse effects: epistaxis № of participants: 637 | RR 2.06 | Study population | ⊕⊕⊕⊝ | The risk of epistaxis is likely to be higher in the higher‐dose groups. However, the studies included very minor nosebleeds, such as blood stains in the mucus, and most of these events are not likely to be severe. | ||
| 57 per 1000 | 118 per 1000 | 61 more per 1000 (11 more to 145 more) | ||||
| Moderate | ||||||
| 60 per 1000 | 124 per 1000 | 64 more per 1000 (12 more to 153 more) | ||||
| Adverse effects: local irritation № of participants: 542 | RR 0.97 | Study population | ⊕⊕⊝⊝ | The risk of local irritation seems to be similar between groups, but the overall risks are underestimated due to the way the data were reported. | ||
| 19 per 1000 | 18 per 1000 | 10 fewer per 1000 (13 fewer to 43 more) | ||||
| Moderate | ||||||
| 17 per 1000 | 17 per 1000 | 10 fewer per 1000 (13 fewer to 40 more) | ||||
| *The risk in the intervention group (and its 95% confidence interval) is based on the assumed risk in the comparison group and the relative effect of the intervention (and its 95% CI). | ||||||
| GRADE Working Group grades of evidence | ||||||
| 1Scale validity, particularly discriminant validity (ability to distinguish the differences between groups), was unclear. There was a high risk of reporting bias. Studies tended to report enough information for meta‐analysis only for statistically significant results. One study, which had 101 participants, reported very similar values for both intervention arms for all disease scores but had no information related to SD. 2Small sample size ‐ evidence only from one or two relatively small studies. 3Only data from patients with bilateral nasal polyposis. We considered this to be indirectness of the evidence to patients without polyps but have not further downgraded the evidence. 4One of the studies had inadequate blinding ‐ a double dummy was not used to mask the twice daily (higher) versus once daily (lower) dose; the study had 101 participants. 5Sample size relatively small for a precise estimate of adverse events. We downgraded this outcome once, after taking into consideration the inadequate blinding in one of the studies and the relatively small sample size. 6Studies did not use consistent terminology/methods to report different types of local irritation. For analysis we only selected the most frequent types of local irritation from a list (to avoid double counting). This is a possible underestimation of overall event rates. The relatively low event rates and small sample size contributed to the large confidence intervals. | ||||||
Background
Description of the condition
Chronic rhinosinusitis is defined as inflammation of the nose and paranasal sinuses characterised by two or more symptoms, one of which must be nasal blockage/obstruction/congestion or nasal discharge (anterior/posterior nasal drip). The other possible symptoms include facial pain/pressure, reduction or loss of sense of smell (in adults) or cough (in children). Symptoms must have continued for at least 12 weeks. In addition people must have either mucosal changes within the ostiomeatal complex and/or sinuses as evidenced by a computerised tomography (CT) scan and/or endoscopic signs of at least one of the following: nasal polyps, mucopurulent discharge primarily from middle meatus or oedema/mucosal obstruction primarily in the middle meatus (EPOS 2012).
Chronic rhinosinusitis represents a common source of ill health; 11% of UK adults reported chronic rhinosinusitis symptoms in a worldwide population study (Hastan 2011). Symptoms, including nasal obstruction, nasal discharge, facial pain, anosmia and sleep disturbance, have a major impact on quality of life, reportedly greater in several domains of the SF‐36 than angina or chronic respiratory disease (Gliklich 1995). Acute exacerbations, inadequate symptom control and respiratory disease exacerbation are common. Complications are rare, but may include visual impairment and intracranial infection.
Two major phenotypes of chronic rhinosinusitis have been identified based on the presence or absence of nasal polyps on examination. Nasal polyps are tumour‐like hyperplastic swellings of the nasal mucosa, most commonly originating from within the ostiomeatal complex (Larsen 2004). Chronic rhinosinusitis with nasal polyps (CRSwNP) is diagnosed when polyps are seen (on direct or endoscopic examination) bilaterally in the middle meatus. The acronym CRSsNP is used for the condition in which no polyps are present.
Although the aetiology of chronic rhinosinusitis is not fully understood, it may involve abnormalities in the host response to irritants, commensal and pathogenic organisms and allergens, obstruction of sinus drainage pathways, abnormalities of normal mucociliary function, loss of the normal mucosal barrier or infection. Two typical profiles may be observed with respect to inflammatory mediators; in eosinophilic chronic rhinosinusitis, which is typically associated with nasal polyps, high levels of eosinophils, immunoglobulin E (IgE) and interleukin (IL)‐5 may be found, while in neutrophilic chronic rhinosinusitis, more often associated with chronic rhinosinusitis without polyps, neutrophils predominate, with elevated interferon (IFN) gamma, IL‐8 and tumour necrosis factor (TNF) (EPOS 2012).
While treatment decisions should be made based on an understanding of the patient's chronic rhinosinusitis phenotype and likely aetiology, in practice treatment may be initiated without knowledge of the polyp status, particularly in primary care. This review (and most of its companion reviews) consider patients with and without polyps together in the initial evaluation of treatment effects. However, subgroup analyses explore potential differences between them.
The most commonly used interventions for chronic rhinosinusitis are used either topically (sprayed into the nose) or systemically (by mouth) and include steroids, antibiotics and saline.
Description of the intervention
Anti‐inflammatory therapy plays a significant role in the treatment of chronic rhinosinusitis. This includes corticosteroids and low‐dose macrolides. Topical corticosteroids are more widely used than oral steroids because treatment can be given for longer without significant adverse effects.
Intranasal corticosteroid therapy is often prescribed for patients with chronic rhinosinusitis, but with considerable variability in timing, frequency, dose, topical delivery method and the specific agent used (Benninger 2003; Spector 1998). The topical delivery method significantly affects the amount of steroid that comes into contact with the paranasal sinus mucosa (Grobler 2008; Harvey 2009). The simplest nasal delivery methods are drops, sprays, aerosols, nebulisers and atomisers. These contrast with methods involving direct sinus cannulation and nasal irrigation with squeeze bottles and neti pots, which are likely to provide better delivery to the sinuses, especially in the post‐sinus surgery setting (Grobler 2008; Harvey 2009; Thomas 2013).
Classes of topical corticosteroid include first‐generation intranasal steroids (beclomethasone dipropionate, triamcinolone acetonide, flunisolide and budesonide) and newer preparations (fluticasone propionate, mometasone furoate, ciclesonide and fluticasone furoate).
How the intervention might work
The use of topical (intranasal) corticosteroids has been widely advocated for the treatment of chronic rhinosinusitis given the belief that inflammation is a major component of this condition (Fokkens 2007; Hamilos 2000; McNally 1997). The mechanism of action is a combination of anti‐inflammatory effects (for example, reducing pro‐inflammatory, and increasing anti‐inflammatory, gene transcription and reducing airway inflammatory cell infiltration) and suppression of the production of pro‐inflammatory mediators, cell chemotactic factors and adhesion molecules (Mullol 2009). Different steroids, in different doses, delivered in different ways (as sprays versus drops, for example) may differ in their effectiveness. The adverse effects may also differ.
Why it is important to do this review
Intranasal corticosteroids are the mainstay and currently recommended treatment for chronic rhinosinusitis. This review incorporates an update of two previous Cochrane reviews (Kalish 2012; Snidvongs 2011). This review is important because it addresses the important clinical question of which type, dose or delivery method of intranasal corticosteroids is most effective or safe for the treatment of chronic rhinosinusitis. Unlike the companion review that seeks to establish the effectiveness of intranasal corticosteroids versus placebo (Chong 2016a), this review looks at studies that provide head to head comparisons of these factors.
This review is one of a suite of Cochrane reviews looking at common management options for patients with chronic rhinosinusitis (Chong 2016a; Chong 2016b; Head 2016a; Head 2016b; Head 2016c), and we use the same outcome measures across the reviews. We have not included studies designed to evaluate interventions in the immediate peri‐surgical period, which are focused on assessing the impact of the intervention on the surgical procedure or on modifying the post‐surgical results (preventing relapse).
Objectives
To assess the relative effects of different types, delivery methods and doses of intranasal corticosteroids.
Methods
Criteria for considering studies for this review
Types of studies
We included studies with the following design characteristics:
-
randomised controlled trials, including cluster‐randomised trials and quasi‐randomised trials (cross‐over trials were only to be included if the data from the first phase were available); and
-
patients were followed up for at least two weeks.
We excluded studies with the following design characteristics:
-
randomised patients by side of nose (within‐patient controlled) because it is difficult to ensure that the effects of any of the interventions considered can be localised; or
-
perioperative studies, where the sole purpose of the study was to investigate the effect of intranasal corticosteroids on surgical outcome.
Types of participants
Patients with chronic rhinosinusitis, whether with or without polyps.
We excluded studies that included a majority of patients with:
-
cystic fibrosis;
-
allergic fungal sinusitis/eosinophilic fungal/mucinous rhinosinusitis;
-
aspirin‐exacerbated respiratory disease;
-
antrochoanal polyps (benign polyps originating from the mucosa of the maxillary sinus);
-
malignant polyps;
-
primary ciliary dyskinesia
-
a history of surgery for nasal polyps within six weeks of entry to the study.
Types of interventions
All intranasal corticosteroids; this included nasal sprays and nasal drops.
First‐generation intranasal corticosteroids:
-
Beclomethasone dipropionate
-
Triamcinolone acetonide
-
Flunisolide
-
Budesonide
Second‐generation intranasal corticosteroids:
-
Ciclesonide
-
Fluticasone furoate
-
Fluticasone propionate
-
Mometasone furoate
-
Betamethasone sodium phospate
If other interventions were used, these should have been used in both treatment arms. Allowed co‐interventions included:
-
nasal saline irrigation;
-
antibiotics; and
-
intermittent nasal decongestants.
The main possible comparison pair was:
-
any first‐generation corticosteroid versus any second‐generation corticosteroid.
Other possible comparison pairs were:
-
intranasal corticosteroid delivered as spray versus intranasal corticosteroid delivered as drops; and
-
low‐dose intranasal corticosteroid versus high‐dose intranasal corticosteroid.
This review is part of a larger series of six reviews for the treatment of chronic rhinosinusitis.
-
Intranasal steroids versus placebo or no intervention for chronic rhinosinusitis (Chong 2016a).
-
Different types of intranasal steroids for chronic rhinosinusitis (this review). This review compares different classes, doses and delivery methods of intranasal corticosteroids for chronic rhinosinusitis.
-
Short‐course oral steroids alone for chronic rhinosinusitis (Head 2016a). This review compares short‐course oral steroids alone with placebo or no intervention, or against other pharmacological interventions such as antibiotics or nasal saline irrigation.
-
Short‐course oral steroids as an adjunct therapy for chronic rhinosinusitis (Head 2016b). This review compares oral steroids where they have been used as add‐on therapy to other treatments for chronic rhinosinusitis (such as intranasal corticosteroids, antibiotics or saline solution).
-
Saline irrigation for chronic rhinosinusitis (Chong 2016b). This review compares nasal saline irrigation for chronic rhinosinusitis with both placebo/no intervention and with intranasal corticosteroids or antibiotics.
-
Systemic and topical antibiotics for chronic rhinosinusitis (Head 2016c). This review compares both topical and systemic antibiotics with placebo/no treatment, two different antibiotics with each other and antibiotics with intranasal corticosteroids.
Types of outcome measures
We analysed the following outcomes in the review, but we did not use them as a basis for including or excluding studies.
Primary outcomes
-
Health‐related quality of life, using disease‐specific health‐related quality of life scores, such as the Sino‐Nasal Outcome Test‐22 (SNOT‐22), Rhinosinusitis Outcome Measures‐31 (RSOM‐31) and SNOT‐20.
-
Disease severity, as measured by patient‐reported symptom score (such as the Chronic Sinusitis Survey (CSS) questionnaire and visual analogue scales). In the absence of validated symptom score data, we reported patient‐reported individual symptom scores for the following symptoms: nasal obstruction/blockage/congestion, nasal discharge (rhinorrhoea), facial pressure/pain, loss of sense of smell (adults) and cough (children).
-
Significant adverse effect: epistaxis.
Secondary outcomes
-
Health‐related quality of life, using generic quality of life scores, such as the SF‐36, EQ‐5D and other well‐validated instruments.
-
Other adverse effects: local irritation (including oral thrush, sore throat and other local nasal irritation such as dryness, itchiness etc.).
-
Other adverse effects:
-
in children ‐ stunted growth (minimum time point: six months of treatment and follow‐up);
-
in adults – osteoporosis.
-
-
Endoscopic score (depending on population, either nasal polyps size score or endoscopy score, e.g. Lund‐Mackay/Lund‐Kennedy).
-
Computerised tomography (CT) scan score (e.g. Lund‐Mackay).
Outcomes were measured at three to six months, six to 12 months and more than 12 months. For adverse events, we analysed data from the longest time periods.
Search methods for identification of studies
The Cochrane ENT Information Specialist conducted systematic searches for randomised controlled trials and controlled clinical trials. There were no language, publication year or publication status restrictions. The date of the search was 11 August 2015.
Electronic searches
The Information Specialist searched:
-
the Cochrane Register of Studies ENT Trials Register (searched 11 August 2015);
-
the Cochrane Central Register of Controlled Trials (CENTRAL 2015, Issue 7);
-
Ovid MEDLINE (1946 to July week 5 2015);
-
Ovid MEDLINE (In‐Process & Other Non‐Indexed Citations) (searched 11 August 2015);
-
PubMed (as a top up to searches in Ovid MEDLINE) (searched 11 August 2015);
-
-
Ovid EMBASE (1974 to 2015 week 32);
-
ClinicalTrials.gov, www.clinicaltrials.gov (search via the Cochrane Register of Studies) (searched 11 August 2015);
-
World Health Organization (WHO) International Clinical Trials Registry Platform (ICTRP) (searched 11 August 2015);
-
Google Scholar (searched 11 August 2015).
The Information Specialist modelled subject strategies for databases on the search strategy designed for CENTRAL. Where appropriate, they were combined with subject strategy adaptations of the highly sensitive search strategy designed by Cochrane for identifying randomised controlled trials and controlled clinical trials (as described in the Cochrane Handbook for Systematic Reviews of Interventions Version 5.1.0, Box 6.4.b. (Handbook 2011). Search strategies for major databases including CENTRAL are provided in Appendix 1.
Searching other resources
We scanned the reference lists of identified publications for additional trials and contacted trial authors where necessary. In addition, the Information Specialist searched PubMed, The Cochrane Library and Google to retrieve existing systematic reviews relevant to this systematic review, so that we could scan their reference lists for additional trials.
Data collection and analysis
Selection of studies
At least two review authors independently screened all titles and abstracts of the studies obtained from the database searches to identify potentially relevant studies. At least two review authors evaluated the full text of each potentially relevant study to determine if it met the inclusion and exclusion criteria for this review.
We resolved any differences by discussion and consensus, with the involvement of a third author for clinical and/methodological input where necessary.
Data extraction and management
Two review authors independently extracted data from each study using a standardised data collection form (see Appendix 2). Whenever a study had more than one publication, we retrieved all publications to ensure complete extraction of data. Where there were discrepancies in the data extracted by different review authors, we checked these against the original reports and resolved differences by discussion and consensus, with the involvement of a third author or a methodologist where appropriate. We contacted the original study authors for clarification or for missing data whenever possible. If differences were found between publications of a study, we contacted the original authors for clarification. We used data from the main paper(s) if no further information was found.
We included key characteristics of the studies, such as study design, setting, sample size, population and how outcomes were defined or collected in the studies. In addition, we also collected baseline information on prognostic factors or effect modifiers. For this review, this included:
-
presence or absence of nasal polyps;
-
polyp score (where applicable);
-
whether the patient has had previous sinus surgery.
For the outcomes of interest to the review, we extracted the findings of the studies on an available case analysis basis; i.e. we included data from all patients available at the time points based on the treatment randomised whenever possible, irrespective of compliance or whether patients had received the treatment as planned.
In addition to extracting pre‐specified information about study characteristics and aspects of methodology relevant to risk of bias, we extracted the following summary statistics for each trial and each outcome:
-
For continuous data: the mean values, standard deviations and number of patients for each treatment group. Where endpoint data were not available, we extracted the values for change from baseline. We analysed data from measurement scales such as SNOT‐22 and EQ‐5D as continuous data.
-
For binary data: the numbers of participants experiencing an event and the number of patients assessed at the time point.
-
For ordinal scale data: if the data appeared to be approximately normally distributed or if the analysis that the investigators performed suggested parametric tests were appropriate, then we treated the outcome measures as continuous data. Alternatively, if data were available, we planned to convert into binary data.
We prespecified the time points of interest for the outcomes in this review. While studies may have reported data at multiple time points, we only extracted the longest available data within the time points of interest. For example, for 'short' follow‐up periods, our time point was defined as 'three to six months' post‐randomisation. If a study had reported data at three, four and six months, we only extracted and analysed the data for the six‐month follow‐up.
Assessment of risk of bias in included studies
Two review authors independently assessed the risk of bias of each included study. We followed the guidance in the Cochrane Handbook for Systematic Reviews of Interventions (Handbook 2011), and we used the Cochrane 'Risk of bias' tool. With this tool we assessed the risk of bias as 'low', 'high' or 'unclear' for each of the following six domains:
-
sequence generation;
-
allocation concealment;
-
blinding of participants, personnel and outcome assessment;
-
incomplete outcome data;
-
selective reporting;
-
other sources of bias.
Measures of treatment effect
We summarised the effects of dichotomous outcomes (e.g. proportion of patients with symptom resolution) as risk ratios (RR) with CIs. For the key outcomes that we presented in the 'Summary of findings' table, we also expressed the results as absolute numbers based on the pooled results and compared to the assumed risk. We also planned to calculate the number needed to treat to benefit (NNTB) using the pooled results. The assumed baseline risk is typically either (a) the median of the risks of the control groups in the included studies, this being used to represent a 'medium risk population' or, alternatively, (b) the average risk of the control groups in the included studies is used as the 'study population' (Handbook 2011). If a large number of studies were available, and where appropriate, we also planned to present additional data based on the assumed baseline risk in (c) a low‐risk population and (d) a high‐risk population.
For continuous outcomes, we expressed treatment effects as a mean difference (MD) with standard deviation (SD) or as standardised mean difference (SMD) if different scales had been used to measure the same outcome. We provided a clinical interpretation of the SMD values.
Unit of analysis issues
This review did not use data from phase II of cross‐over studies or from studies where the patient was not the unit of randomisation, i.e. studies where the side (right versus left) was randomised.
If we had found cluster‐randomised trials, we would have analysed these according to the methods in section 16.3.3 of the Cochrane Handbook for Systematic Reviews of Interventions (Handbook 2011).
Dealing with missing data
We tried to contact study authors via email whenever the outcome of interest was not reported, if the methods of the study suggested that the outcome had been measured. We did the same if not all data required for meta‐analysis had been reported, unless the missing data were standard deviations. If standard deviation data were not available, we approximated these using the standard estimation methods from P values, standard errors or 95% CIs if these were reported as detailed in the Cochrane Handbook for Systematic Reviews of Interventions (Handbook 2011). If it was impossible to estimate these, we contacted the study authors.
Apart from imputations for missing standard deviations, we conducted no other imputations. We extracted and analysed all data using the available case analysis method.
Imputing total symptom scores
Where a paper did not present information for the total disease severity in terms of patient‐reported symptom scores but did present data for the results of individual symptoms, we used the symptoms covering the important domains of the EPOS chronic rhinosinusitis diagnosis criteria (EPOS 2012) to calculate a total symptom score. The EPOS 2012 criteria for chronic rhinosinusitis require at least two symptoms. One of the symptoms must be either nasal blockage or nasal discharge; other symptoms can include facial pressure/pain, loss of sense of smell (for adults) or cough (for children). Where mean final values or changes from baseline were presented in the paper for the individual symptoms we summed these to calculate a 'total symptom score'. We calculated standard deviations for the total symptom score as if the symptoms were independent, random variables that were normally distributed. We acknowledge that there is likely to be a degree of correlation between the individual symptoms, however we used this process because the magnitude of correlation between the individual symptoms is not currently well understood (no evidence found). If the correlation is high, the summation of variables as discrete variables is likely to give a conservative estimate of the total variance of the summed final score. If the correlation is low, this method of calculation will underestimate the standard deviation of the total score. However, the average patient‐reported symptom scores have a correlation coefficient of about 0.5; if this is also applicable to chronic rhinosinusitis symptoms, the method used should have minimal impact (Balk 2012). As this method of calculation does not take into account weighting of different symptoms (no evidence found), we downgraded all the disease severity outcomes for lack of use of validated scales whenever this occurred.
Assessment of heterogeneity
We assessed clinical heterogeneity (which may be present even in the absence of statistical heterogeneity) by examining the included trials for potential differences between studies in the types of participants recruited, interventions or controls used and the outcomes measured.
We assessed statistical heterogeneity by visually inspecting the forest plots and by considering the Chi² test (with a significance level set at P value < 0.10) and the I² statistic, which calculates the percentage of variability that is due to heterogeneity rather than chance, with I² values over 50% suggesting substantial heterogeneity (Handbook 2011).
Assessment of reporting biases
We assessed reporting bias as between‐study publication bias and within‐study outcome reporting bias.
Outcome reporting bias (within‐study reporting bias)
We assessed within‐study reporting bias by comparing the outcomes reported in the published report against the study protocol, whenever this could be obtained. If the protocol was not available, we compared the outcomes reported to those listed in the methods section. If results are mentioned but not reported adequately in a way that allows analysis (e.g. the report only mentions whether the results were statistically significant or not), bias in a meta‐analysis is likely to occur. We sought further information from the study authors. If no further information could be found, we noted this as being a 'high' risk of bias. Quite often there was insufficient information to judge the risk of bias; we noted this as an 'unclear' risk of bias (Handbook 2011).
Publication bias (between‐study reporting bias)
We planned to assess funnel plots if sufficient trials (more than 10) were available for an outcome. If we had observed asymmetry of the funnel plot, we would have conducted more formal investigation using the methods proposed by Egger 1997.
Data synthesis
We conducted all meta‐analyses using Review Manager 5.3 (RevMan 2014). For dichotomous data, we planned to analyse treatment differences as a risk ratio (RR) calculated using the Mantel‐Haenszel methods. We will analyse time‐to‐event data using the generic inverse variance method.
For continuous outcomes, if all the data were from the same scale, we planned to pool mean values obtained at follow‐up with change outcomes and report this as a MD. However, if the SMD had to be used as an effect measure, we did not plan to pool change and endpoint data.
When statistical heterogeneity is low, random‐effects versus fixed‐effect methods yield trivial differences in treatment effects. However, when statistical heterogeneity is high, the random‐effects method provides a more conservative estimate of the difference.
Subgroup analysis and investigation of heterogeneity
We planned to conduct some subgroup analyses regardless of whether statistical heterogeneity was observed, as these are widely suspected to be potential effect modifiers. For this review, this included:
-
phenotype of patients: whether patients have chronic rhinosinusitis without nasal polyps, chronic rhinosinusitis with nasal polyps, a mixed group or the status of polyps is not known or not reported. We planned this subgroup analysis as although there appears to be a considerable overlap between the two forms of chronic rhinosinusitis with regards to inflammatory profile, clinical presentation and effect of treatment (Cho 2012; DeMarcantonio 2011; Ebbens 2010; Fokkens 2007; Ragab 2004; Ragab 2010; van Drunen 2009), there is some evidence pointing to differences in the respective inflammatory profiles (Kern 2008; Keswani 2012; Tan 2011; Tomassen 2011; Zhang 2008; Zhang 2009), and potentially even differences in treatment outcome (Ebbens 2011).
We presented the main analyses of this review according to the subgroups of phenotypes of chronic rhinosinusitis. We presented all other subgroup analysis results in tables.
When studies had a mixed group of patients, we analysed the study as one of the subgroups (rather than as a mixed group) if more than 80% of patients belonged to one category. For example, if 81% of patients had chronic rhinosinusitis without nasal polyps, we analysed the study as that subgroup.
In addition to the subgroups above, we planned to conduct the following subgroup analyses in the presence of statistical heterogeneity for the relevant comparisons:
-
patient age (children versus adults);
-
dose;
-
duration of treatment;
-
method of delivery.
Sensitivity analysis
We planned to carry out sensitivity analyses to determine whether the findings were robust to the decisions made in the course of identifying, screening and analysing the trials. We planned to conduct sensitivity analysis for the following factors, whenever possible:
-
impact of model chosen: fixed‐effect versus random‐effects model;
-
risk of bias of included studies: excluding studies with high risk of bias (we defined these as studies that have a high risk of allocation concealment bias and a high risk of attrition bias (overall loss to follow‐up of 20%, differential follow‐up observed);
-
how outcomes were measured: we planned to investigate the impact of including data where the validity of the measurement is unclear.
If any of these investigations found a difference in the size of the effect or heterogeneity, we mentioned this in the Effects of interventions section.
GRADE and 'Summary of findings' table
We used the GRADE approach to rate the overall quality of evidence for each outcome using the GDT tool (http://www.guidelinedevelopment.org/) for the main comparison pairs listed in the Types of interventions section. The quality of evidence reflects the extent to which we are confident that an estimate of effect is correct and we applied this in the interpretation of results. There are four possible ratings: 'high', 'moderate', 'low' and 'very low'. A rating of 'high' quality evidence implies that we are confident in our estimate of effect and that further research is very unlikely to change our confidence in the estimate of effect. A rating of 'very low' quality implies that any estimate of effect obtained is very uncertain.
The GRADE approach rates evidence from RCTs that do not have serious limitations as high quality. However, several factors can lead to the downgrading of the evidence to moderate, low or very low. The degree of downgrading is determined by the seriousness of these factors:
-
study limitations (risk of bias);
-
inconsistency;
-
indirectness of evidence;
-
imprecision;
-
publication bias.
The 'Summary of findings' table presents only the seven top priority outcomes (disease‐specific health‐related quality of life, disease severity score, adverse effects and generic quality of life score). We did not include the outcomes of endoscopic score and CT scan score in the 'Summary of findings' table.
Results
Description of studies
Results of the search
The searches retrieved a total of 2470 references after removal of duplicates. We screened titles and abstracts and subsequently removed 2429 references. We assessed 41 full texts for eligibility. We excluded 18 studies (21 references), with reasons. We included nine studies (13 references). We identified three ongoing studies. There are four studies awaiting assessment because we cannot locate the full‐text papers.
A flow chart of study retrieval and selection is provided in Figure 1.
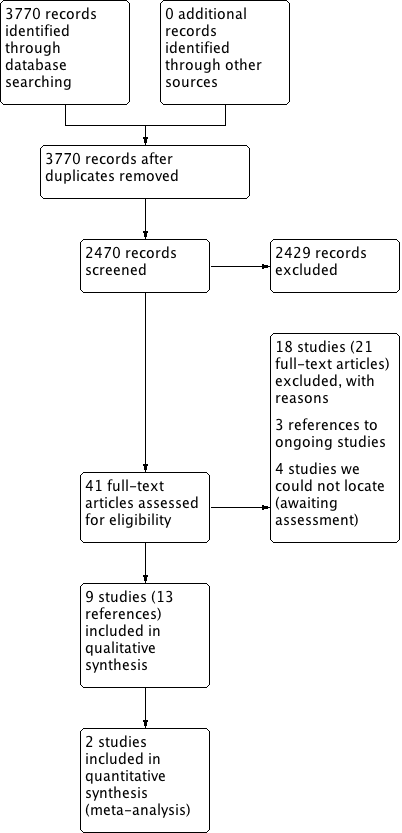
Process for sifting search results and selecting studies for inclusion.
Included studies
Design
All studies included were randomised trials and most were double‐blinded (in two studies blinding was not stated).
Sample sizes
The studies included ranged in size from small studies with as few as 20 patients in the treatment arms of interest (Lund 1998), to much larger studies, which included over 200 participants (Small 2005; Stjarne 2006).
Setting
All studies were conducted in a secondary or tertiary care setting and in various international locations, including three Scandinavian studies. It was notable that there were no studies from the Asian continent.
Participants
The participants in all but one study were adults ranging from 18 to 86 years old; the one paediatric study had an age range of 6 to 17. The adult participants in all but one study were predominantly male (range 72% to 79%), with one study including only 38% male participants. In all studies the participants had chronic rhinosinusitis with nasal polyps with visible polyps on nasal examination. There were no studies including patients with chronic rhinosinusitis without nasal polyps.
Interventions
The details of the interventions are shown in Table 1 under the following headings: comparison of different steroid molecules (three studies), high‐dose versus low‐dose (five studies), twice daily versus once daily and different delivery methods (one study). All studies had a placebo arm, except one (Demirel 2008).
Intranasal steroid formulations included were fluticasone propionate, beclomethasone dipropionate, mometasone furoate and budesonide (see below).
Summary of studies comparing different steroid molecules
| Study ID | Polyps status | Intervention | Comparison | Delivery method | Daily dose | Dosing regime | Treatment time |
| Bilateral polyposis in asthma patients | Fluticasone propionate | Mometasone furoate | Nasal spray | 200 µg | Once daily | 3 months | |
| Bilateral polyps (polyp score 1 or 2) | Fluticasone propionate | Beclomethasone dipropionate | Nasal spray | 400 µg | Twice daily | 26 weeks | |
| Bilateral nasal polyposis requiring surgical intervention | Fluticasone propionate | Beclomethasone dipropionate | Nasal spray | 400 µg | Twice daily | 12 weeks |
Summary of studies comparing high‐dose versus low‐dose steroids
| Study ID | Polyps status | Drug | Delivery method | Daily dose (Intervention) | Regimen | Daily dose (Comparison) | Regime | Duration of treatment |
| Bilateral | Mometasone furoate | Nasal spray | 200 µg (6 to 11 years); 400 µg (12 to 18 years) | Twice daily | 100 µg (6 to 11 years); 200 µg (12 to 18 years) | Once daily | 4 months | |
| Bilateral, clinically significant congestion/obstruction | Mometasone furoate | Nasal spray | 400 µg | Twice daily | 200 µg | Once daily | 4 months | |
| Bilateral, clinically significant congestion/obstruction | Mometasone furoate | Nasal spray | 400 µg | Twice daily | 200 µg | Once daily | 4 months | |
| Bilateral mild or moderate nasal polyposis | Fluticasone propionate | Nasal drops | 800 µg | Twice daily | 400 µg | Once daily | 12 weeks | |
| Bilateral | Fluticasone propionate | Nasal drops | 800 µg | Twice daily | 400 µg | Once daily | 12 weeks |
Summary of studies comparing different delivery methods
| Study ID | Polyps status | Drug | Method | Daily dose | Regime | Drug | Method | Daily dose | Regime | Duration |
| Eosinophilic nasal polyposis with polyp scores of 2 or less on each side | Budesonide | Aqueous nasal spray | 400 µg | Twice daily | Budesonide | Aerosol | 400 µg | Twice daily | 3 months |
Outcomes
Only one study included a disease‐specific health‐related quality of life (HRQL) tool for outcome assessment and only three studies included an assessment of overall disease severity. Nasal obstruction and loss of sense of smell as individual symptoms were assessed in all studies but other chronic rhinosinusitis symptoms were variably and inconsistently checked. No studies included generic HRQL tools. Endoscopic grading of polyps was reported in all studies. Adverse events were reported in all but one study (Demirel 2008). Epistaxis, which is an outcome of interest of this review, was defined to include a wide range of bleeding episodes, from frank bleeding to bloody nasal discharge to flecks of blood in the mucus in two studies (Small 2005; Stjarne 2006). The other studies did not provide a definition of epistaxis, but would have been likely to include non‐severe episodes since very few of the withdrawals were related to epistaxis.
Funding and conflict of interest
All of the studies (except Demirel 2008 and Filipovic 2006, which did not provide any information on funding or conflicts of interest) were either directly funded by pharmaceutical companies that manufacture one or more of the interventions compared, financially supported by industry including the companies (Glaxo Wellcome, Schering Plough, Astra and Merck Sharpe and Dohme), or had authors who were employees or recipients of other types of funding from the companies.
Excluded studies
We excluded 17 papers after reviewing the full text. Further details for the reasons for exclusion can be found in the Characteristics of excluded studies table. Ten of the studies were clinical trials that made a comparison relevant to this review but we excluded them due to the duration of the treatment not meeting the inclusion criterion of 12 weeks. Five of these treated and followed up patients for one month or less (Lildholdt 1995; NCT01405339; Reychler 2015; Toft 1982; Wang 2012), and four treated and followed up patients for between six and eight weeks (Filiaci 2000; Jankowski 2001; Raghavan 2006; Tos 1998). The remaining study compared betamethasone with fluticasone propionate with a treatment duration of eight weeks, although the follow‐up time was 12 weeks (Fowler 2002).
We excluded five studies due to the included population. In four of these papers all patients underwent sinus surgery either immediately before the trial started or during the trial (Bross‐Soriano 2004; Dijkstra 2004; NCT02194062; Singhal 2008). We excluded the other study due to the population: it stated that the participants had allergic or non‐allergic chronic rhinosinusitis, but on closer inspection of the inclusion criteria we thought that it included only people with allergic or non‐allergic rhinitis (Giger 2003).
Of the remaining two studies, one was a clinical trial register record of a study that was going to compare two different delivery methods (aerosol versus spray) but the study authors confirmed that the trial had not been completed or published (NCT00788463). The reason for early termination was not provided. The other was a study looking at the optimal method for delivery of intranasal spray, which studied the distribution of dye at five sinonasal sites (Cannady 2005).
Ongoing studies
We identified three relevant ongoing studies, all of which are in adults with chronic rhinosinusitis with nasal polyps (NCT01622569; NCT01624662; NCT01946711). Two of these are large, multicentre trials each with a planned population of over 300 patients (NCT01622569; NCT01624662). These two trials will make the same comparisons, comparing three different doses of fluticasone proportionate (400 µg bid, 200 µg bid and 100 µg bid) with placebo. All of the arms will use a novel bi‐directional device. The studies were completed in October 2015 but no study data were available at the time of writing. The other trial compares two delivery methods for budesonide (inhalation versus nasal spray) (NCT01946711). We contacted the investigators and they reported that the trial should be completed during 2016.
Risk of bias in included studies
See Figure 2 for the 'Risk of bias' graph (our judgements about each risk of bias item presented as percentages across all included studies) and Figure 3 for the 'Risk of bias' summary (our judgements about each risk of bias item for each included study).
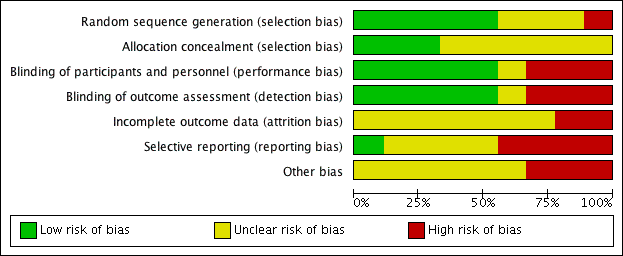
'Risk of bias' graph: review authors' judgements about each risk of bias item presented as percentages across all included studies.
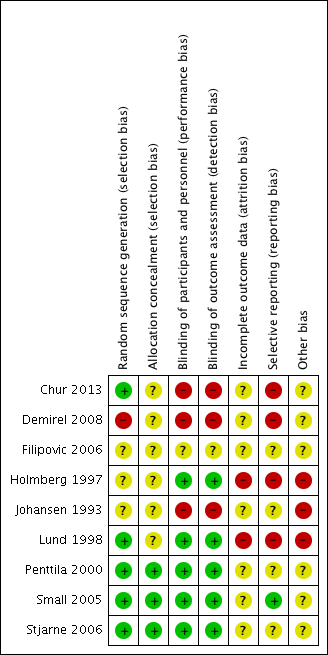
'Risk of bias' summary: review authors' judgements about each risk of bias item for each included study.
Allocation
Sequence generation
Three of the included studies provided a description that suggested that adequate sequence generation was conducted (Chur 2013; Lund 1998; Stjarne 2006). Another three stated that the trials were randomised but did not provide further information, making them at an 'unclear' risk of bias (Filipovic 2006; Holmberg 1997; Johansen 1993). Penttila 2000 and Small 2005 also did not provide details of randomisation. However, these studies were conducted fairly recently as multinational trials, and therefore should have sufficient methodology and resources to ensure that adequate sequence generation procedures were carried out. We rated these as low risk of bias.
Another study stated that patients were "randomly divided" (Demirel 2008). However, we rated this study as high risk of bias because the baseline risks, particularly the age of the participants, were not balanced between the groups. It was also a very small study, with 11 participants randomised to the once daily group and 15 to the twice daily group.
Allocation concealment
None of the studies described how allocation concealment was carried out, so we judged them all as unclear risk of bias. However, Penttila 2000, Small 2005 and Stjarne 2006 are large multinational trials, which should have adequate sequence generation, adequate blinding and no other factors suggesting that allocation concealment could be compromised. We considered these to have low risk of bias. Although Chur 2013 also had adequate sequence generation, it used blocked randomisation with unclear effectiveness of blinding and therefore it is unclear whether allocation concealment was well maintained.
Blinding
The ratings for the risk of performance bias versus detection bias were very well correlated for this review.
Most of the outcomes were assessed by patients and the overall risks of bias were low when both participants and investigators were adequately blinded. We did not find information suggesting that the clinicians could have obtained extra information from blood tests etc. to 'guess' the which treatment the patients were allocated to.
One study was an abstract and stated that it was a single‐blinded study but did not provide information on who was blinded (Filipovic 2006). However, since the study compared different drugs with the same delivery method (nasal spray) and dosing schedule (once daily), we rated this as unclear risk of bias rather than high risk.
All the other eight studies described using a "double blinded" design their report. However, we only considered the risk of both performance and detection bias to be low for five of the studies, with adequate measures to mask the type of treatment given (Holmberg 1997; Lund 1998; Penttila 2000; Small 2005; Stjarne 2006).
We rated blinding as inadequate (high risk of bias) in three studies, despite their being reported as 'double‐blinded' studies (Chur 2013; Demirel 2008; Johansen 1993). The blinding was inadequate in these studies, as there was no placebo or 'dummy' used to account for differences in the number of times treatment was administered or methods of delivery. In Chur 2013, participants "received MFNS 200 mcg once daily, MFNS 200 mcg twice daily, placebo once daily, or placebo twice daily", instead of using a double‐dummy design, where all participants received the medication twice daily (with a placebo given for those who had once daily treatment); groups either had medication once or twice daily. Therefore, there was no blinding of participants in terms of knowing whether they were on the once daily or twice daily regimen.
Similarly, Johansen 1993 stated that "The patients were treated with either budesonide aqua (Rhinocort Aqua) or budesonide aerosol (Rhinocort Aerosol), 50 mcg x 2 in each nostril, twice daily = 400 mcg/day or placebo (aqua) or aerosol)." Whilst there may be adequate blinding for treatment versus placebo, there is no blinding when comparing different dosage forms.
Although Demirel 2008 claimed to be double‐blinded, the interventions were given in a different format (nasal spray versus nasal drops) and at different frequencies (one versus two times per day), so it is difficult to see how either the personnel or participants were blind to the intervention. There was no mention of a placebo.
Incomplete outcome data
The risk of attrition bias was unclear in seven of the included studies (Chur 2013; Demirel 2008; Filipovic 2006; Johansen 1993; Penttila 2000; Small 2005; Stjarne 2006). These studies did not provide enough information to adequately judge the risk. For example, Johansen 1993 reported that 5/91 (5.5%) participants did not complete the study. There is no information on how many were randomised to each group in Johansen 1993, so it is difficult to determine whether this could have affected the results.
In two studies that were three‐arm trials including a placebo group (Small 2005; Stjarne 2006), we considered the overall risk of attrition bias to be high due to imbalances in the proportion of drop‐outs between the active and placebo groups. However, the drop‐out rates for the active intervention groups, which are of interest in this review, were similar and we still considered them acceptable. Therefore we considered these studies as being at an unclear risk of attrition bias for this review, but at a high risk for our accompanying review, which assesses intranasal steroids versus placebo (Chong 2016a).
We rated the risk of attrition bias as high for two studies. Lund 1998 only included 10 participants in each of the fluticasone and beclomethasone groups. Three patients dropped out from the fluticasone group (70%), but none dropped out from the beclomethasone group. This study carried out last observed carried forward observation (LOCF) for the missing outcomes. In Holmberg 1997, the number of participants who dropped out was twice as high in one group (4/19 in the fluticasone propionate group and 2/18 in the beclomethasone propionate group).
Selective reporting
Many of the study reports only presented effectiveness outcomes in graphs and only provided limited, selective information, for example P values or mean values when statistical significance was noted. Since many of the effectiveness outcomes did not show a significant difference between the intervention and comparison groups in this review (i.e. there were no noticeable differences between the different types of corticosteroids, methods of delivery, doses or number of administrations per day), we are uncertain whether this lack of detail in reporting is related to the lack of 'positive' results.
We considered only one study to be at low risk of bias, as all expected outcomes were reported (Small 2005).
We considered the risk of selective reporting bias to be high in four studies (Chur 2013; Demirel 2008; Holmberg 1997; Lund 1998).
Two studies reported the use of diaries for patients to record symptoms (Holmberg 1997; Lund 1998). However, neither study provided information on how the collected data would be analysed and the results were subsequently presented in a variety of ways with different cut‐off points, where it is not clear why they were selected.
The primary endpoint in Chur 2013 was "safety" (cortisol levels) and despite presenting the mean change values for effectiveness outcomes, they did not provide any information on P values or standard deviations. The study authors' rationale for collecting but not fully reporting the data was: "No statistical analysis of efficacy end points was pre‐specified in the study protocol, and only descriptive efficacy statistics were collected." We observed that these values (mean changes) were similar between groups and unlikely to be statistically significant, so poor reporting due to lack of beneficial effects cannot be ruled out. Similarly, Demirel 2008 mainly reported outcomes in graphs and did not provide information on standard deviations and P values, which are necessary for meta‐analysis.
We considered the remaining three studies to be at unclear risk. There was not enough information in the methods and/or protocol and we found it difficult to judge whether there was a risk of reporting bias (Filipovic 2006; Johansen 1993; Penttila 2000).
Other potential sources of bias
Use of validated outcome measures
The lack of use of validated outcome measures is a major concern in terms of bias. If an instrument is insensitive for measuring differences, this biases towards a finding of 'no difference' in the studies and also in this review.
None of the included studies mentioned using validated outcome measures, for either of the primary outcomes of effectiveness (disease‐specific health‐related quality of life and disease severity/symptom scores). Of the studies that attempted to use patient diaries or questionnaires to measure severity, most used a 0 to 3 scale. There is no evidence that this scale, especially when used as a single scale, has the sensitivity to distinguish between groups of patients who improved versus those who did not improve (discriminant validity). None of the studies attempted to assess all of the four symptoms used to define chronic rhinosinusitis that are mentioned in EPOS 2012 (nasal blockage, rhinorrhoea/rhinitis, loss of sense of smell and facial pain (adults)/cough (children)). Facial pain was not measured by most studies.
The scales used to measure nasal polyps were generally well described. However, again it is unclear whether a 0 to 3 scale is has the discriminant validity to detect a difference in these small trials.
Effects of interventions
See: Summary of findings for the main comparison Different types of intranasal corticosteroid molecules for chronic rhinosinusitis; Summary of findings 2 High‐dose versus low‐dose intranasal corticosteroids for chronic rhinosinusitis
Where the range of scales and values for minimal important differences were unclear, we used the standardised mean difference (SMD) to estimate the effect sizes. As suggested in the Cochrane Handbook for Systematic Reviews of Interventions (Handbook 2011), we used standard rules of thumb in the interpretation of effect sizes (SMD, or Cohen's effect size of < 0.41 = small, 0.40 to 0.70 = moderate, > 0.70 = large) (Cohen 1988).
Comparison 1: Different type of corticosteroids: fluticasone propionate versus beclomethasone dipropionate
We found two studies in participants with bilateral polyps (a combined sample size of 56) comparing fluticasone propionate aqueous nasal spray (FPANS) versus beclomethasone dipropionate aqueous nasal spray (BDANS) at a daily dose of 400 µg, delivered using nasal sprays twice a day. However, the results were poorly reported and there was insufficient information to conduct any pooling of data (Holmberg 1997; Lund 1998). The follow‐up was 26 weeks for Holmberg 1997 and 12 weeks for Lund 1998.
Primary outcomes
Health‐related quality of life, using disease‐specific health‐related quality of life scores, such as the Sino‐Nasal Outcome Test‐22 (SNOT‐22), Rhinosinusitis Outcome Measures‐31 (RSOM‐31) and SNOT‐20
Neither Holmberg 1997 nor Lund 1998 mentioned measuring quality of life.
Disease severity, as measured by patient‐reported symptom score (such as the Chronic Sinusitis Survey (CSS) questionnaire and visual analogue scales)
Neither of the studies provided patient‐reported total symptoms score results using an instrument validated in a chronic rhinosinusitis population. Both studies included information about measuring a patient‐reported symptom score in their methods section, but did not report much information at all about these. Instead, some form of physician‐rated scores were reported.
In Holmberg 1997, the methods section described patients recording the following symptoms on daily record cards: nasal blockage on waking in the morning, nasal blockage during the rest of the day, sense of smell and rhinorrhoea. The outcomes were reported on a four‐point scale (0 to 3, 0 = no symptoms, 3 = severe symptoms). These were not well reported in the results. Instead, they reported "physician's assessment of symptoms", which was not mentioned in the methods section or defined anywhere else in the paper.
The methods section of Lund 1998 reported that patients were issued with daily record cards to assess nasal blockage, sense of smell, degree of nasal discomfort (facial pain and headache) and overall rhinitis symptoms (sneezing, rhinorrhoea, nasal itching) on a five‐point rating scale (0 to 4). However, the results section only reported percentage of days with "no nasal blockage during the day" ("...trend for FPANS to be more effective") and percentage of days with "no rhinitis symptoms in the day" (a median value of 89% and 96% for FPANS‐treated and BDANS‐treated groups, respectively, at week 12).
Significant adverse effect: epistaxis
Holmberg 1997 reported that "Adverse events were reported in 14 patients (78%) receiving placebo, 13 patients (68%) receiving fluticasone propionate aqueous nasal spray, and 16 patients (89%) receiving beclomethasone dipropionate aqueous nasal spray". However, they mentioned that "The only predictable adverse event considered drug related was epistaxis". No specific figures were provided.
Lund 1998 reported that "There were more adverse events (7 [70%]) reported in the FPANS‐treated group compared with those (3 [33%]) in the group receiving placebo and in the BDANS‐treated group (3 [30%])." There was no information about whether any of these events were epistaxis.
Secondary outcomes
Health‐related quality of life, using generic quality of life scores, such as the SF‐36, EQ‐5D and other well‐validated instruments
Neither Holmberg 1997 nor Lund 1998 mentioned measuring quality of life.
Other adverse effects: local irritation (including nasal irritation, oral thrush, sore throat)
Lund 1998 reported that there was "1 predictable adverse event ‐ throat irritation ‐ in the FPANS‐treated group" (1 in 10 patients). It is unclear whether any other events reported by the 10 patients with adverse effects (seven in the fluticasone group, three in the budesonide group) were related to other forms of local irritation.
Other adverse effects, such as stunted growth in children and osteoporosis in adults (minimum time point: six months of treatment and follow‐up)
Although Holmberg 1997 followed up patients for six months, this outcome was not reported.
Endoscopic score (depending on population, either nasal polyps size score or endoscopy score, e.g. Lund‐Kennedy/Lund‐Mackay)
Lund 1998 reported that the median total polyps score (range 0 to 6) was 2 in the fluticasone group and 2.5 in the beclomethasone group, with a reported P value of 0.66. However, this included values from patients who had dropped out from the study (3/10 in the fluticasone group) and was imputed using a last observation carried forward (LOCF) method.
Computerised tomography (CT) scan score (e.g. Lund‐Mackay)
A CT scan was conducted at baseline to determine eligibility in Lund 1998 but was not reported as an outcome.
The quality of the evidence is very low (GRADE) for all outcomes in this comparison. See summary of findings Table for the main comparison.
Comparison 2: Different types of corticosteroids: fluticasone propionate versus mometasone furoate
We only found one abstract for a study that compared fluticasone propionate versus mometasone furoate, 200 µg, administered once daily as an aqueous spray (Filipovic 2006).
The abstract only mentioned that "both drugs produced statistically significant reductions" (P value < 0.01) in nasal obstruction, postnasal drip, anterior rhinorrhoea and an improvement, which is presumably compared to baseline. The study also stated that "no statistically significant differences were observed between the two drugs for most evaluated parameters".
The study reported that both drugs were "well tolerated" without providing any further information.
The quality of the evidence is very low (GRADE) for all outcomes in this comparison. See summary of findings Table for the main comparison.
Comparison 3: High‐dose versus low‐dose intranasal steroids
There were five studies, with a total of 663 participants in the intervention arms, which compared a higher dose of intranasal corticosteroids (administered twice a day) versus a lower dose (administered once a day) (Chur 2013; Demirel 2008; Penttila 2000; Small 2005; Stjarne 2006). One of these was in children aged between 6 and 18 years (Chur 2013).
| Study ID | Polyps status | Drug | Delivery method | Daily dose (Intervention) | Regime | Daily dose (Comparison) | Regime | Duration of treatment |
| Bilateral | Mometasone furoate | Nasal spray | 200 µg (6 to 11 years); 400 µg (12 to 18 years) | Twice daily | 100 µg (6 to 11 years) | Once daily | 4 months | |
| Bilateral, clinically significant congestion/obstruction | Mometasone furoate | Nasal spray | 400 µg | Twice daily | 200 µg | Once daily | 4 months | |
| Bilateral, clinically significant congestion/obstruction | Mometasone furoate | Nasal spray | 400 µg | Twice daily | 200 µg | Once daily | 4 months | |
| Bilateral mild or moderate nasal polyposis | Fluticasone propionate | Nasal drops | 800 µg | Twice daily | 400 µg | Once daily | 12 weeks | |
| Bilateral | Fluticasone propionate | Nasal drops | 800 µg | Twice daily | 400 µg | Once daily | 12 weeks |
Primary outcomes
Health‐related quality of life, using disease‐specific health‐related quality of life scores, such as the Sino‐Nasal Outcome Test‐22 (SNOT‐22), Rhinosinusitis Outcome Measures‐31 (RSOM‐31) and SNOT‐20
None of the studies mentioned measuring quality of life.
Disease severity, as measured by patient‐reported symptom score (such as the Chronic Sinusitis Survey (CSS) questionnaire and visual analogue scales)
None of the papers provided results for a patient‐reported total symptoms score using an instrument validated in a chronic rhinosinusitis population. Where available, we combined the results for the individual symptoms into a total score according to the methods set out in Dealing with missing data. In order to be included in the analysis the results had to at least meet the EPOS 2012 diagnostic criteria, which requires at least two symptoms, one of which must be nasal blockage/obstruction/congestion or nasal discharge (anterior/posterior nasal drip) with the other possible symptoms being facial pressure/pain, loss of sense of smell (adults) or cough (children).
Three studies reported results for individual symptoms but the results were presented in different ways making analysis difficult (Chur 2013; Small 2005; Stjarne 2006). The remaining two studies only recorded clinician‐rated symptoms so this information has not been presented (Demirel 2008; Penttila 2000).
Chur 2013 measured and partially reported some data for the individual symptoms of nasal congestion/obstruction, anterior rhinorrhoea/postnasal drip and loss of sense of smell. The symptoms were reported by participants (with the assistance of a parent or guardian if needed) and scored on a 0‐ to 4‐point scale. These results were presented as mean change from baseline at four months. The paper did not present standard deviations or P values for the results, the rationale for which was that the study's primary outcome was safety and they had not specified in the protocol that the effectiveness results would be analysed. However, with a mean difference of change of 0.1 points, it is unlikely that there is an important difference between the groups either clinically or statistically (see results presented below).
Small 2005 and Stjarne 2006 both asked participants to score the symptoms nasal congestion/obstruction, loss of sense of smell and anterior rhinorrhoea on a four‐point scale. The results were presented separately in graphs as the change from baseline values. P values for the between‐group differences were only given for some comparison pairs to denote the level of statistical significance, for example "P < 0.05", "P < 0.01" etc. There was sufficient information to impute standard deviations based on these values for nasal blockage and rhinorrhoea for both studies. However, there was no statistically significant difference between the groups for loss of sense of smell in Stjarne 2006 and no P values were reported.
Overall symptom scores
None of the studies provided enough information to enable the calculation of an overall symptom score for all four groups of symptoms used for the definition of chronic rhinosinusitis in EPOS 2012.
Only one study provided enough information to estimate a total score based on three of the four EPOS domains used for definition of chronic rhinosinusitis in EPOS 2012 (Small 2005). This study provided enough information to calculate the average score for nasal blockage, rhinorrhoea and loss of sense of smell. Although Stjarne 2006 also measured all of the same symptoms, it did not report the P values or standard deviations for loss of sense of smell because the results were not statistically different. Therefore, these results could only be used to measure an average symptom score based on two domains (nasal blockage and rhinorrhoea). The following are the pooled results:
-
Average combined score for three EPOS 2012 domains (nasal blockage, rhinorrhoea, loss of sense of smell): the mean difference (MD) was ‐0.13 (95% confidence interval (CI) ‐0.37 to 0.11; 237 participants; one study) on a 0 to 3 scale. It is a very small effect size and is not likely to be a clinically important difference (Analysis 1.1).
-
Average combined score for two EPOS 2012 domains (nasal blockage, rhinorrhoea): the MD was ‐0.19 (95% CI ‐0.36 to ‐0.02; 441 participants; two studies; I2 = 0%) on a 0 to 3 scale, favouring the high‐dose group. However, it is a very small effect size and this may not be a clinically important difference (Analysis 1.1).
These results have to be interpreted carefully because the studies only appeared to present their results in sufficient detail for further analysis when they showed a statistically significant improvement compared to placebo, therefore biasing the results towards a positive finding.
Individual symptom scores
Chur 2013 analysed the mean change from baseline for 51 participants in the high‐dose group and 50 participants in the low‐dose group. The mean change (recorded on a 0‐ to 4‐point scale) and percentage change compared to baseline values are shown below.
| Symptoms | Mean (%) change from baseline on a 0‐ to 4‐point scale | |
| High‐dose group | Low‐dose group | |
| Nasal congestion | ‐0.99 (‐49%) | ‐0.91 (‐38%) |
| Rhinorrhoea | ‐0.73 (‐38%) | ‐0.70 (‐43%) |
| Loss of sense of smell | ‐0.53 (‐43%) | ‐0.55 (‐49%) |
Small 2005 and Stjarne 2006 presented mean differences (MD) in the change from baseline symptom score between the high‐dose and low‐dose groups at four months, on a 0‐ to 3‐point scale. (We used these values to calculate the overall symptom scores above). Negative values show that there is a greater decrease in severity in the high‐dose (twice daily) group.
-
Nasal congestion: MD ‐0.24 (95% CI ‐0.39 to ‐0.08; 441 participants; two studies; I2 = 0%); there is a slightly larger reduction (small effect size) in nasal blockage in the high‐dose group.
-
Rhinorrhoea: MD ‐0.15 (95% CI ‐0.33 to 0.03; 441 participants; two studies; I2 = 0%); there is similar reduction in rhinorrhoea in both groups.
-
Loss of sense of smell: MD 0.06 (95% CI ‐0.20 to 0.32; 237 participants; one study); there is similar reduction in loss of sense of smell in both groups in Small 2005, but no statistically significant reduction in Stjarne 2006 (‐0.40 versus ‐0.33, MD ‐0.07) (see Analysis 1.2).
The quality of the evidence is very low (GRADE) for the measures of disease severity. See summary of findings Table 2.
Significant adverse effect: epistaxis
There was an increased risk of epistaxis in the high‐dose group (risk ratio (RR) 2.06, 95% CI 1.20 to 3.54; 637 participants; four studies; I2 = 0%) (Analysis 1.3).
Two of the four studies, which had the most weight in the pooled results, defined epistaxis to include a wide range of bleeding episodes, from frank bleeding to bloody nasal discharge to flecks of blood in the mucus (Small 2005; Stjarne 2006). Chur 2013 did not provide a definition but there is a high chance that they also used similar definitions to the other two studies, since this series of studies shared many common points in their protocols. The fourth study also did not provide a definition, but of the eight events reported, only one required a withdrawal (Penttila 2000).
The quality of the evidence is moderate (GRADE) for this comparison. See summary of findings Table 2.
Secondary outcomes
Health‐related quality of life, using generic quality of life scores, such as the SF‐36, EQ‐5D and other well‐validated instruments
None of the studies mentioned measuring quality of life.
Other adverse effects: local irritation (including nasal irritation, oral thrush, sore throat)
Similar numbers of patients experienced local irritation in both groups (RR 0.97, 95% CI 0.28 to 3.31; 542 participants; three studies; I2 = 0%) (Analysis 1.4), in the studies where these results could be analysed (Chur 2013; Small 2005; Stjarne 2006). However, the total number of events we have included in the analysis is an underestimation of the frequency of local irritation; the studies all used different descriptions (such as nasal burning, nasal dryness, nasal irritation and throat irritation) and we could only choose the most frequent type of local irritation for each study in the analysis to prevent double‐counting.
Other adverse effects, such as stunted growth in children and osteoporosis in adults (minimum time point: six months of treatment and follow‐up)
All the studies followed up participants for about four months. This was not long enough to provide a reliable measure of the longer‐term adverse effects and none of the studies reported these.
Endoscopic score (depending on population, either nasal polyps size score or endoscopy score, e.g. Lund‐Kennedy/Lund‐Mackay)
Small 2005 reported the mean change from baseline in nasal polyps score (0 to 3 range). The MD was 0.19 (95% CI ‐0.16 to 0.54; 237 participants) favouring the once daily group (Analysis 1.5). However, this difference is unlikely to be of clinical significance.
Stjarne 2006 did not find a statistically significant difference in polyps size between the low‐dose group and the placebo arms and therefore did not provide any P values to allow for the estimation of standard deviations. The polyps score (0 to 3 range) decreased by 0.96 points in the high‐dose group and 0.78 points in the low‐dose group. A mean difference of 0.18 between the two groups on a four‐point scale has no clinical significance, especially as the correlation between polyp size and symptoms is poor.
Chur 2013 reported that polyps size, measured on a four‐point scale (0 to 3) decreased by 1.1 points (‐34%) compared to baseline in the high‐dose group (n = 51) and by 0.92 points (‐26%) in the low‐dose group (n = 50). Standard deviations and P values were not provided, therefore it is not possible to estimate the statistical significance of this difference. As in Stjarne 2006, a mean difference of 0.18 between the two groups on a four‐point scale has no clinical significance, especially as the correlation between polyp size and symptoms is poor.
Demirel 2008 investigated fluticasone propionate nose drops and reported a decrease of 0.84 points (54%) compared to baseline in the twice daily (800 µg/day) group (n = 13), as opposed to a decrease of 0.9 points (40%) in the once daily (400 µg/day) group (n = 10). This is unlikely to represent a clinically significant reduction, since the baseline scores differed by about 0.7 points on a scale of 0 to 3 and the sample sizes are very small.
Penttila 2000 reported the "percentage of patients showing improvement" (it is unclear how this was defined). The risk ratio for "improvement" was 1.71 (95% CI 0.91 to 3.21; 92 participants) at 12 weeks for patients in the high‐dose group (Analysis 1.6).
Overall, all five studies reported some decrease in polyps score in the high‐dose group, but the clinical significance of this is unclear.
Computerised tomography (CT) scan score (e.g. Lund‐Mackay)
There was no mention that CT scans were conducted at follow‐up in any of the studies.
Comparison 4: Different types of delivery methods: aqueous nasal spray versus aerosol spray
One study compared two methods (aqueous nasal spray versus aerosol spray) of delivering 400 µg of budesonide per day, given as two divided doses (morning and night) for three months in patients who had eosinophilic nasal polyposis with polyp scores of 2 or less on each side (Johansen 1993). This study reported randomising 91 patients into three groups and 86 completed. However, the numbers in each group were not reported.
The study presented the results in graphs and not much further information was provided to allow for analysis. Where possible, we tried to obtain the estimates of mean change from baseline values for the outcomes (the baseline seemed to vary between groups for most outcomes) using a digital graph reader (http://arohatgi.info/WebPlotDigitizer/app/).
Primary outcomes
Health‐related quality of life, using disease‐specific health‐related quality of life scores, such as the Sino‐Nasal Outcome Test‐22 (SNOT‐22), Rhinosinusitis Outcome Measures‐31 (RSOM‐31) and SNOT‐20
The study did not mention measuring quality of life.
Disease severity, as measured by patient‐reported symptom score (such as the Chronic Sinusitis Survey (CSS) questionnaire and visual analogue scales)
The study did not provide results for a patient‐reported total symptoms score using an instrument validated in a chronic rhinosinusitis population. Patients recorded the symptoms of blocked nose (nasal obstruction) and runny nose (rhinorrhoea) for each nasal cavity on a scale of 0 to 3 in a weekly diary and they were asked whether they had experienced any change in smell using a 0 to 3 scale during clinic visits.
We estimated the point estimates for mean change from baseline for individual symptom scores using the digital graph reader:
-
Nasal congestion: the aqueous nasal spray and aerosol groups improved by 0.6 and 0.4 points, respectively.
-
Rhinorrhoea: we estimated the decrease in score from baseline for the aerosol and aqueous nasal spray groups to be about 0.5 points and 0.2 points, respectively.
-
Change in sense of smell: the study reported there was no "statistically significant difference" between the groups.
The significance of these differences is difficult to interpret, since the magnitude is not large and the baseline scores were different. Patients in the aerosol group consistently had less severe symptoms at baseline compared to the spray group (by about 0.3 points).
Significant adverse effect: epistaxis
No details of adverse events were reported. The paper only stated that "Few side effects such as dry nose, headache and epistaxis were reported and with no difference between the treatment groups".
Secondary outcomes
Health‐related quality of life, using generic quality of life scores, such as the SF‐36, EQ‐5D and other well‐validated instruments
The study did not mention measuring quality of life.
Other adverse effects: local irritation (including nasal irritation, oral thrush, sore throat)
No details about adverse events were reported. The paper only stated that "Few side effects such as dry nose, headache and epistaxis were reported and with no difference between the treatment groups".
Other adverse effects, such as stunted growth in children and osteoporosis in adults (minimum time point: six months of treatment and follow‐up)
No details about adverse events were reported. The paper only stated "Few side effects such as dry nose, headache and epistaxis were reported and with no difference between the treatment groups".
Endoscopic score (depending on population, either nasal polyps size score or endoscopy score, e.g. Lund‐Kennedy/Lund‐Mackay)
The study reported that "During the study a statistically significant decrease mean total polyps scores was seen in both groups treated with budesonide. The patients treated with placebo, however, had a mean increase in total polyps score during the treatment period." However, the "increase" in polyps size was only 0.1 points in the placebo group, whereas the decrease in polyps size score was 0.6 in the aerosol group and 1.4 in the aqueous group. As with the symptom score, the patients in the aerosol group had a lower baseline severity score (by about 0.3 points).
Computerised tomography (CT) scan score (e.g. Lund‐Mackay)
There were no indications that CT scans were used.
The quality of the evidence is very low (GRADE) for all outcomes in this comparison, due to very serious methodological concerns and imprecision.
Discussion
Summary of main results
We found nine studies reporting on four different comparisons (Chur 2013; Demirel 2008; Filipovic 2006; Holmberg 1997; Johansen 1993; Lund 1998; Penttila 2000; Small 2005; Stjarne 2006). Due to the choice of outcome measures used in these studies and the incomplete reporting of results, for most of the comparisons we were not able to find much evidence.
The following is a summary of the key findings for each comparison:
Comparison 1: Different type of corticosteroids: fluticasone propionate versus beclomethasone dipropionate
We included two small studies in the review (Holmberg 1997, n = 37; Lund 1998, n = 20). Both studies used 400 µg/day of each drug, given twice a day using nasal sprays. They reported very similar effectiveness between the groups in terms of disease severity and epistaxis. However, these studies are too small to provide any certainty of the findings (GRADE assessment: very low quality evidence). The other outcomes were either not measured or very poorly reported. See summary of findings Table for the main comparison.
Comparison 2: Different types of corticosteroids: fluticasone propionate versus mometasone furoate
We found only one study (Filipovic 2006, n = 100). This study used a 200 µg daily dose administered as an aqueous spray and found no difference in nasal symptom scores between the groups.(GRADE assessment: very low quality evidence). See summary of findings Table for the main comparison.
Comparison 3: High‐dose versus low‐dose intranasal steroids
We found five studies for this comparison. Three of these used mometasone furoate (Chur 2013; Small 2005; Stjarne 2006): a daily dose of 400 µg versus 200 µg for adults and older children, 200 µg versus 100 µg in younger children (Chur 2013). Demirel 2008 and Penttila 2000 used fluticasone propionate nasal drops (a daily dose of 800 µg versus 400 µg).
Effectiveness (disease severity and nasal polyps size) was similar between the high‐dose and low‐dose groups, except for a possibility of a small benefit in terms of nasal obstruction and rhinorrhoea when using a higher dose of mometasone. Although all studies reported more improvement in the polyps score in the high‐dose group, the significance of this is unclear due to the small size of the improvements. However, the risk ratio (RR) for adverse events was higher for epistaxis (RR 2.06, 95% confidence interval (CI) 1.20 to 3.54; 637 participants; four studies; I2 = 0%) (GRADE assessment: moderate quality evidence). It is less clear whether the risk of local irritation was similar due to the wide confidence intervals and poorer reporting (RR 0.97, 95% CI 0.28 to 3.31; 542 participants; four studies; I2 = 0%) (GRADE assessment: low quality evidence). See summary of findings Table 2.
Comparison 4: Different types of delivery methods: aqueous nasal spray versus aerosol spray
We found only one study for this comparison (Johansen 1993). This study was not well reported and there seemed to be baseline differences in polyps size. The results for disease severity seemed to be similar for symptom scores, but it is difficult to interpret the importance of the difference of 0.5 points in polyps size due to baseline differences.
In summary, despite having nine included studies there was not much information available. All reports suggested similar effectiveness between different types of intranasal corticosteroids, doses, methods of administration and formulations. However, there is a possibility of an increased risk of adverse effects, particularly epistaxis with the higher dose of mometasone furoate (400 µg versus 200 µg per day).
Overall completeness and applicability of evidence
The doses used in the studies were in keeping with manufacturers' recommendations and are applicable to the population being studied. The population of patients with chronic rhinosinusitis with nasal polyps is likely to have intranasal steroids initiated as a treatment in both primary and secondary care settings. There were no studies that included patients with chronic rhinosinusitis without nasal polyps for us to evaluate and this points to a deficiency in the currently available evidence for this subgroup.
Disease‐specific health‐related quality of life, which is both specific to the disease and important to patients, was not used in the included studies as an outcome measure. There is therefore no information at all on whether the different types of intranasal steroids have an impact on patients' quality of life.
Quality of the evidence
The quality of the evidence for all outcomes in these comparisons was either low orvery low (GRADE assessment), due to the small number of participants available for analysis (resulting in large confidence intervals) and limitations in the methods of study conduct and reporting. There is a severe concern about selective reporting bias, particularly for the effectiveness data, where studies only provided numerical data and P values (which allowed us to estimate standard deviations) when there was a statistically significant difference between groups or against placebo.
The only exception to our assessment of low/very low quality evidence is the epistaxis outcome, where we can be more certain that there is an increase in risk when higher doses of intranasal steroids are used (GRADE assessment: moderate quality evidence).
Potential biases in the review process
In most cases the studies did not report enough information for us to further analyse the results. We have had to take readings from graphs using a digital graph reader and impute standard deviations based on the P values reported. They were often only reported as 'P value < 0.05' or 'P value < 0.01' in comparisons where the studies found statistical significance. Our imputations are based on these values (using P value = 0.01 or P value = 0.05) and we are therefore conservative in our estimation of the standard deviations. However, this lack of information about non‐significant results could have prevented us from drawing more conclusive results about the lack of difference between groups.
For disease severity, we only aimed to include results measured using validated instruments. However, none of the studies in this review (and indeed most of the studies in our series of reviews (Chong 2016a; Chong 2016b; Head 2016a; Head 2016b; Head 2016c) had used these. We therefore had to make a compromise and we included results using non‐validated scales in order to obtain some information.
Agreements and disagreements with other studies or reviews
This review is part of a series of reviews on chronic rhinosinusitis (Chong 2016a; Chong 2016b; Head 2016a; Head 2016b; Head 2016c). The purpose of this review is to answer the question of whether there are any differences between the various types, dosages and regimens of intranasal corticosteroids. A companion review looks at the effectiveness of intranasal steroids compared to placebo (Chong 2016a). We are not aware of other reviews that have specifically looked at the relative effectiveness and safety of different types of intranasal corticosteroids, doses and methods or regimens of delivery. Although Chong 2016a planned subgroup analyses for different types of steroids, doses and delivery methods, this was not carried out as heterogeneity was only observed for one outcome (facial pain), where only two studies were included and they differed in the population of patients (polyps versus no polyps), types and doses of steroids used (128 µg/day budesonide versus 800 µg/day fluticasone) and method of delivery (nasal drops versus breadth actuated inhaler). That review found a higher risk of epistaxis in patients on intranasal steroids versus placebo but despite the inclusion of different doses, types of steroids and delivery methods, no heterogeneity was observed.
Recent international trials using the Optinose device (Navigate trials I and II) have now been completed (NCT01622569; NCT01624662). These studies have included differing doses within their protocols, so further information on doses and devices will be forthcoming once these results are published.
Two previous Cochrane reviews have looked at topical steroids in people with chronic rhinosinusitis with nasal polyps (Kalish 2012) and without nasal polyps (Snidvongs 2011), and also included comparison of different types and doses of steroids in their scope. Unlike these reviews, the present review only includes studies with a minimum three‐month duration of treatment and follow‐up. We excluded studies that investigated the impact of intranasal steroids on surgical outcomes, either administered perioperatively or within weeks of surgery to prevent relapses, from this review. Of these, we excluded four studies included in Kalish 2012 because the duration of treatment and follow‐up did not meet the 12‐week inclusion criterion (range from four to eight weeks) (Filiaci 2000; Jankowski 2001; Lildholdt 1995; Tos 1998), and one study that only included patients after sinus surgery (Dijkstra 2004). These reviews also did not find a difference between the doses or types of intranasal steroids.
The EPOS 2012 document splits the chronic rhinosinusitis population into those with and without nasal polyps. In patients who have chronic rhinosinusitis without nasal polyps they did not find any direct evidence for intranasal corticosteroid intra‐class comparisons (e.g. comparing delivery methods, doses or different steroids). For people with chronic rhinosinusitis with nasal polyps the evidence for intranasal corticosteroid intra‐class comparisons was not explicitly stated as a comparison of interest, although subgroup analyses were planned for topical delivery method (nasal spray versus nasal drops) and corticosteroid type (modern versus first‐generation). The comparison of high‐dose versus low‐dose was not considered although the review stated that eight studies reporting this comparison were identified (Dijkstra 2004; Filiaci 2000; Jankowski 2001; Lildholdt 1995; Penttila 2000; Small 2005; Stjarne 2006; Tos 1998). The 'intranasal corticosteroid versus placebo' results were subgrouped according to delivery method and no differences were found, although it should be acknowledged that this is indirect evidence. Similarly the comparison of 'modern' versus 'first‐generation' intranasal steroids was made by looking at an indirect subgroup analysis of intranasal steroids versus placebo trials without mention of the three trials that the authors identified specifically making this comparison (Bross‐Soriano 2004; Holmberg 1997; Lund 1998). The conclusion of this analysis was that "Modern INCS do not have greater clinical efficacy (although potentially fewer sider‐effects [sic]) compared to first‐generation INCS".

Process for sifting search results and selecting studies for inclusion.

'Risk of bias' graph: review authors' judgements about each risk of bias item presented as percentages across all included studies.

'Risk of bias' summary: review authors' judgements about each risk of bias item for each included study.

Forest plot of comparison: 1 High‐dose versus low‐dose intranasal corticosteroids, outcome: 1.1 Disease severity ‐ overall symptoms, measured as average change from baseline at 4 months (range 0 to 3).
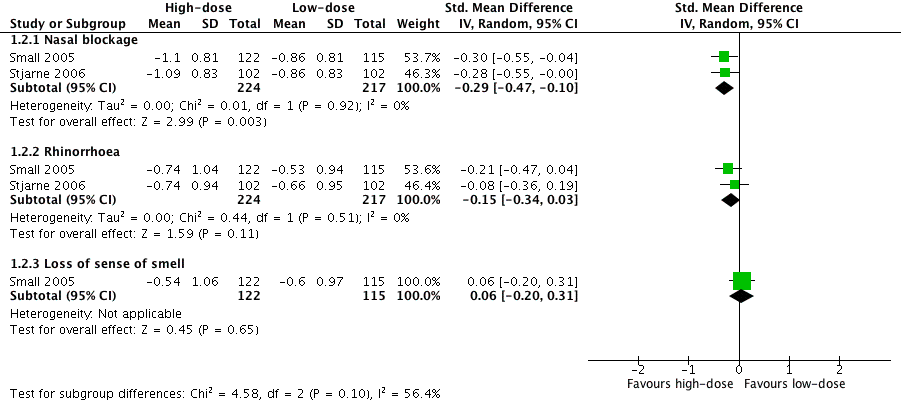
Forest plot of comparison: 1 High‐dose versus low‐dose intranasal corticosteroids, outcome: 1.2 Disease severity ‐ individual symptoms, measured as average change from baseline at 4 months (range 0 to 3).

Comparison 1 High‐dose versus low‐dose intranasal corticosteroids, Outcome 1 Disease severity ‐ overall symptoms, measured as average change from baseline at 4 months (range 0 to 3).

Comparison 1 High‐dose versus low‐dose intranasal corticosteroids, Outcome 2 Disease severity ‐ individual symptoms, measured as average change from baseline at 4 months (range 0 to 3).

Comparison 1 High‐dose versus low‐dose intranasal corticosteroids, Outcome 3 Adverse effects: epistaxis.

Comparison 1 High‐dose versus low‐dose intranasal corticosteroids, Outcome 4 Adverse effects: local irritation.

Comparison 1 High‐dose versus low‐dose intranasal corticosteroids, Outcome 5 Nasal polyps size, measured as change from baseline (0 to 3 range scale) at 4 months.

Comparison 1 High‐dose versus low‐dose intranasal corticosteroids, Outcome 6 Nasal polyps ‐ proportion with improvement at 12 weeks.
| Different types of intranasal corticosteroid molecules for chronic rhinosinusitis | ||||||
| Patient or population: chronic rhinosinusitis (all studies recruited patients with bilateral polyps) | ||||||
| Outcomes № of participants | Relative effect (95%) | Anticipated absolute effects* (95% CI) | Quality | What happens | ||
| Low‐dose intranasal corticosteroids | High‐dose intranasal corticosteroids | Difference | ||||
| Disease‐specific health‐related quality of life | Not measured | Impact unknown | ||||
| Disease severity ‐ overall symptoms
| — |
| ⊕⊝⊝⊝ | No differences observed but evidence was too low quality to draw a conclusion | ||
| Adverse events: epistaxis
| — |
| ⊕⊝⊝⊝ | Unclear whether the risk of epistaxis varies for different types of steroid molecules | ||
| *The risk in the intervention group (and its 95% confidence interval) is based on the assumed risk in the comparison group and the relative effect of the intervention (and its 95% CI). | ||||||
| GRADE Working Group grades of evidence | ||||||
| 1Studies were either very small (n = 20 and n = 26) and had important drop‐outs or were only reported as an abstract with inadequate information available (n = 100). We considered all studies to be at unclear to high risk of selective reporting and attrition bias. The evidence was very low quality due to very serious imprecision and very serious risk of bias concerns. | ||||||
| High‐dose versus low‐dose intranasal corticosteroids for chronic rhinosinusitis | ||||||
| Patient or population: chronic rhinosinusitis (all studies recruited patients with bilateral polyps) | ||||||
| Outcomes № of participants | Relative effect | Anticipated absolute effects* (95% CI) | Quality | What happens | ||
| Low‐dose intranasal corticosteroids | High‐dose intranasal corticosteroids | Difference | ||||
| Disease‐specific health‐related quality of life | Not measured | Impact unknown | ||||
| Disease severity ‐ overall symptoms, measured as average change from baseline at 4 months | ||||||
| All 4 EPOS domains | No information available | |||||
| 3 domains (nasal blockage, rhinorrhoea, loss of sense of smell) Range 0 to 3, lower score = less severe № of participants: 237 | — | The mean disease severity ‐ overall symptoms, measured as average change from baseline at 4 months (range 0 to 3) ‐ average symptom score (3 domains) without high‐dose was ‐0.66 points | — | MD 0.13 points lower (0.37 lower to 0.11 more) than low‐dose group | ⊕⊕⊝⊝ | The average score for 3 types of symptoms seems to be similar between the high‐dose and low‐dose groups. |
| (2 domains: nasal blockage, rhinorrhoea) № of participants: 441 | — | The mean disease severity ‐ overall symptoms, measured as average change from baseline at 4 months (range 0 to 3) ‐ average symptom score (2 domains) without high‐dose was ‐0.73 points | — | MD 0.19 points lower (0.36 lower to 0.02 lower) than low‐dose group | ⊕⊕⊝⊝ | The average score for 2 types of symptoms seems to be slightly lower for the high‐dose group. The clinical significance of this reduction is unclear. |
| Disease severity ‐ measured as average change from baseline at 4 months (range 0 to 3) | ||||||
|
№ of participants: 441 | — | The mean disease severity ‐ individual symptoms, measured as average change from baseline at 4 months (range 0 to 3) ‐ nasal blockage without high‐dose was ‐0.86 points | — | MD 0.24 points lower (0.39 lower to 0.08 lower) than low‐dose group | ⊕⊕⊝⊝ | The nasal blockage score seems to be slightly lower in the high‐dose group. The clinical significance of this reduction is unclear. |
|
№ of participants: 441 (2 RCTs) | — | The mean disease severity ‐ individual symptoms, measured as average change from baseline at 4 months (range 0 to 3) ‐ rhinorrhoea without high‐dose was ‐0.6 points | — | MD 0.15 points lower (0.33 lower to 0.03 higher) than low‐dose group | ⊕⊕⊝⊝ | The average score for rhinorrhoea seems to be similar between the high‐dose and low‐dose groups. |
|
№ of participants: 237 | — | The mean disease severity ‐ individual symptoms, measured as average change from baseline at 4 months (range 0 to 3) ‐ loss of sense of smell without high‐dose was ‐0.6 points | — | MD 0.06 points higher (0.2 lower to 0.32 higher) than low‐dose group | ⊕⊕⊝⊝ | The average score for loss of sense of smell seems to be very similar between the high‐dose and low‐dose groups. |
| Adverse effects: epistaxis № of participants: 637 | RR 2.06 | Study population | ⊕⊕⊕⊝ | The risk of epistaxis is likely to be higher in the higher‐dose groups. However, the studies included very minor nosebleeds, such as blood stains in the mucus, and most of these events are not likely to be severe. | ||
| 57 per 1000 | 118 per 1000 | 61 more per 1000 (11 more to 145 more) | ||||
| Moderate | ||||||
| 60 per 1000 | 124 per 1000 | 64 more per 1000 (12 more to 153 more) | ||||
| Adverse effects: local irritation № of participants: 542 | RR 0.97 | Study population | ⊕⊕⊝⊝ | The risk of local irritation seems to be similar between groups, but the overall risks are underestimated due to the way the data were reported. | ||
| 19 per 1000 | 18 per 1000 | 10 fewer per 1000 (13 fewer to 43 more) | ||||
| Moderate | ||||||
| 17 per 1000 | 17 per 1000 | 10 fewer per 1000 (13 fewer to 40 more) | ||||
| *The risk in the intervention group (and its 95% confidence interval) is based on the assumed risk in the comparison group and the relative effect of the intervention (and its 95% CI). | ||||||
| GRADE Working Group grades of evidence | ||||||
| 1Scale validity, particularly discriminant validity (ability to distinguish the differences between groups), was unclear. There was a high risk of reporting bias. Studies tended to report enough information for meta‐analysis only for statistically significant results. One study, which had 101 participants, reported very similar values for both intervention arms for all disease scores but had no information related to SD. 2Small sample size ‐ evidence only from one or two relatively small studies. 3Only data from patients with bilateral nasal polyposis. We considered this to be indirectness of the evidence to patients without polyps but have not further downgraded the evidence. 4One of the studies had inadequate blinding ‐ a double dummy was not used to mask the twice daily (higher) versus once daily (lower) dose; the study had 101 participants. 5Sample size relatively small for a precise estimate of adverse events. We downgraded this outcome once, after taking into consideration the inadequate blinding in one of the studies and the relatively small sample size. 6Studies did not use consistent terminology/methods to report different types of local irritation. For analysis we only selected the most frequent types of local irritation from a list (to avoid double counting). This is a possible underestimation of overall event rates. The relatively low event rates and small sample size contributed to the large confidence intervals. | ||||||
| Outcome or subgroup title | No. of studies | No. of participants | Statistical method | Effect size |
| 1 Disease severity ‐ overall symptoms, measured as average change from baseline at 4 months (range 0 to 3) Show forest plot | 2 | Std. Mean Difference (IV, Random, 95% CI) | Subtotals only | |
| 1.1 Average symptom score (3 domains) | 1 | 237 | Std. Mean Difference (IV, Random, 95% CI) | ‐0.14 [‐0.39, 0.12] |
| 1.2 Average symptom score (2 domains) | 2 | 441 | Std. Mean Difference (IV, Random, 95% CI) | ‐0.21 [‐0.40, ‐0.03] |
| 2 Disease severity ‐ individual symptoms, measured as average change from baseline at 4 months (range 0 to 3) Show forest plot | 2 | Std. Mean Difference (IV, Random, 95% CI) | Subtotals only | |
| 2.1 Nasal blockage | 2 | 441 | Std. Mean Difference (IV, Random, 95% CI) | ‐0.29 [‐0.47, ‐0.10] |
| 2.2 Rhinorrhoea | 2 | 441 | Std. Mean Difference (IV, Random, 95% CI) | ‐0.15 [‐0.34, 0.03] |
| 2.3 Loss of sense of smell | 1 | 237 | Std. Mean Difference (IV, Random, 95% CI) | 0.06 [‐0.20, 0.31] |
| 3 Adverse effects: epistaxis Show forest plot | 4 | 637 | Risk Ratio (M‐H, Fixed, 95% CI) | 2.06 [1.20, 3.54] |
| 4 Adverse effects: local irritation Show forest plot | 3 | 542 | Risk Ratio (M‐H, Fixed, 95% CI) | 0.97 [0.28, 3.31] |
| 5 Nasal polyps size, measured as change from baseline (0 to 3 range scale) at 4 months Show forest plot | 1 | 237 | Mean Difference (IV, Fixed, 95% CI) | 0.19 [‐0.16, 0.54] |
| 6 Nasal polyps ‐ proportion with improvement at 12 weeks Show forest plot | 1 | 92 | Risk Ratio (M‐H, Fixed, 95% CI) | 1.71 [0.91, 3.21] |