مصرف کوتاه‐مدت استروئیدهای خوراکی به تنهایی برای درمان رینوسینوزیت مزمن
چکیده
پیشینه
این مرور یکی از مرورهای شش‐گانه کاکرین درباره گزینههای اولیه مدیریت طبی برای درمان بیماران مبتلا به رینوسینوزیت (rhinosinusitis) مزمن است.
رینوسینوزیت مزمن بیماری شایعی است که مشخصه آن، التهاب مخاط بینی و سینوسهای پارانازال است. که به گرفتگی بینی، ترشحات بینی، درد یا فشار در ناحیه صورت و از دست دادن حس بویایی منجر میشود. این وضعیت ممکن است همراه با پولیپ بینی یا بدون آن رخ دهد. از استروئیدهای خوراکی برای کنترل واکنشهای التهابی و بهبود نشانههای بیماری استفاده میشود.
اهداف
بررسی تاثیرات کورتیکواستروئیدهای خوراکی در مقایسه با دارونما (placebo)/عدم مداخله یا دیگر مداخلات دارویی (کورتیکواستروئیدهای داخل بینی، آنتیبیوتیکها، ضد‐قارچها) برای درمان رینوسینوزیت مزمن.
روشهای جستوجو
متخصص اطلاعات پایگاه ثبت تخصصی گروه گوش و حلق و بینی در کاکرین (ENT) به جستوجو در پایگاه ثبت کارآزماییهای ENT؛ پایگاه ثبت مرکزی کارآزماییهای کنترل شده (CENTRAL؛ 2015، شماره 7)؛ MEDLINE؛ EMBASE؛ ClinicalTrials.gov؛ ICTRP و سایر منابع برای یافتن کارآزماییهای منتشر شده و منتشر نشده پرداخت. تاریخ جستوجو: 11 آگوست 2015 بود.
معیارهای انتخاب
کارآزماییهای تصادفیسازی و کنترل شده (randomised controlled trials; RCTs) که در آنها یک دوره درمان با کورتیکواستروئیدهای خوراکی به صورت کوتاه‐مدت (تا 21 روز) با دارونما یا عدم درمان یا با سایر مداخلات دارویی مقایسه شده بود.
گردآوری و تجزیهوتحلیل دادهها
روشهای استاندارد روششناسی مورد نظر کاکرین را به کار بردیم. پیامدهای اولیه ما عبارت بودند از: کیفیت زندگی مرتبط با سلامت (HRQL) مختص یک بیماری، شدت بیماری طبق گزارش بیمار و حوادث جانبی مانند اختلالات در خلقوخو و اختلالات رفتاری. پیامدهای ثانویه عبارت بودند از: HRQL عمومی، درجه و نمره آندوسکوپیک پولیپ بینی، درجه و نمره اسکن توموگرافی کامپیوتری (computerised tomography; CT) و حوادث جانبی مانند بیخوابی، اختلالات گوارشی و استئوپوروز. برای ارزیابی کیفیت شواهد برای هر پیامد از روش درجهبندی توصیه، ارزیابی، توسعه و ارزشیابی (GRADE) استفاده کردیم؛ این موارد به صورت ایتالیک نشان داده شده است.
نتایج اصلی
ما هشت RCT (با 474 شرکتکننده) را وارد مرور کردیم که در همه آنها کورتیکواستروئیدهای خوراکی با دارونما یا عدم مداخله مقایسه شده بود. تمام کارآزماییها صرفا شامل بزرگسالان مبتلا به رینوسینوزیت مزمن با پولیپ بینی بودند. در همه کارآزماییها پیامدهای حاصل طی دو تا سه هفته، در پایان دوره کوتاه‐مدت درمان با استروئید خوراکی گزارش شده بود. در سه کارآزمایی دیگر علاوه بر این، پیامدهای حاصل طی سه تا شش ماه نیز گزارش شده بود. در دو مورد از این مطالعات به بیماران حاضر در هر دو گروه کارآزمایی در پایان دوره درمان با استروئید خوراکی، استفاده از استروئید داخل بینی تجویز شد.
استروئیدهای خوراکی در برابر دارونما یا عدم مداخله
کیفیت زندگی مرتبط با سلامت مختص بیماری توسط یک مطالعه گزارش شد. در این مطالعه، بهبود کیفیت زندگی پس از درمان (دو تا سه هفته) در گروه دریافت کننده استروئید خوراکی در مقایسه با گروه دریافت کننده دارونما گزارش شد (تفاوت میانگین استاندارد شده (SMD): 1.24‐؛ 95% فاصله اطمینان (CI): 1.92‐ تا 0.56‐؛ 40 شرکتکننده؛ RSOM‐31 اصلاح شده)، این امر با اندازه تاثیرگذاری زیاد متناظر است. ما شواهد را دارای کیفیت پائین ارزیابی کردیم (درباره تخمین اثرگذاری نامطمئن هستیم؛ ممکن است تاثیر حقیقی اساسا متفاوت از تخمین ما از تاثیر باشد).
شدت بیماری در دو مطالعه، شدت بیماری اندازهگیری شده با نمرات نشانههای بیماری طبق گزارش بیمار بیان شده بود، به همین سبب، چهار نشانه کلیدی (گرفتگی بینی، ترشحات بینی، فشار صورت، از بین رفتن حس بویایی) که برای تعریف رینوسینوزیت مزمن به کار میرفتند، در یک نمره ادغام شدند. نتایج به دست آمده در پایان دوره درمان (دو تا سه هفته) از بهبود بیمارانی حکایت داشت که در مقایسه با گروه دارونما، از استروئیدهای خوراکی استفاده کرده بودند، هم به عنوان میانگین مقدار نهایی (SMD: ‐2.84؛ 95% CI؛ 4.09‐ تا 1.59‐؛ 22 شرکتکننده) و هم به مثابه یک تغییر از خط پایه (SMD: ‐2.28؛ 95% CI؛ 2.76‐ تا 1.80‐؛ 114 شرکتکننده). این امر با اندازه تاثیرگذاری زیاد متناظر است، با این حال، ما شواهد را دارای کیفیت پائین ارزیابی کردیم.
در یک مطالعه (114 شرکتکننده) وضعیت بیماران به مدت 10 هفته پس از دوره دو هفتهای درمان پیگیری شد. همه بیماران در هر دو گروه، در پایان دوره درمان با استروئید خوراکی، استروئید داخل بینی نیز دریافت کردند. این نتایج نشان داد که نتایج اولیه پس از درمان پایدار نماند (SMD: ‐0.22؛ 95% CI؛ 0.59‐ تا 0.15؛ 114 شرکتکننده، درصد بهبود از خط پایه). این امر با اندازه تاثیرگذاری کم متناظر است، شواهد را دارای کیفیت پائین ارزیابی کردیم.
بروز حوادث جانبی در افرادی که استروئید خوراکی دریافت کرده بودند، در مقایسه با افرادی که دارونما دریافت کرده بودند، در موارد زیر بالاتر بود: اختلالات گوارشی (خطر نسبی (RR): 3.45؛ 95% CI؛ 1.11 تا 10.78؛ 187 شرکتکننده؛ سه مطالعه) و بیخوابی (HR: 3.63؛ 95% CI؛ 1.10 تا 11.95؛ 187 شرکتکننده؛ سه مطالعه). استروئیدهای خوراکی هیچ تاثیر قابل توجهی بر اختلالات خلقوخو در دوز مورد استفاده در مطالعه وارد شده نداشتند (خطر نسبی (RR): 2.50؛ 95% CI؛ 0.55 تا 11.41؛ 40 شرکتکننده؛ یک مطالعه). شواهد را دارای کیفیت پائین ارزیابی کردیم، زیرا حوادث جانبی تعریف نشده بودند و تعداد رویدادها و حجم نمونه یا هر دو اندک بود.
سایر مقایسهها
هیچ مطالعهای یافت نشد که در آن استروئیدهای خوراکی در دوره کوتاه‐مدت با دیگر روشهای درمانی برای درمان رینوسینوزیت طبق معیارهای ورود مقایسه شده باشد.
نتیجهگیریهای نویسندگان
در پایان دوره درمان (دو تا سه هفته) در کیفیت زندگی مرتبط با سلامت و شدت نشانههای بیماری در بیماران مبتلا به رینوسینوزیت مزمن با پولیپ بینی که کورتیکواستروئیدهای خوراکی مصرف کرده بودند، در مقایسه با بیماران تحت دارونما یا عدم درمان قرار گرفته بودند، بهبودی مشاهده شد. شواهد حمایت کننده این ادعا کیفیت پائین بودند. در سه تا شش ماه پس از پایان دوره درمان با استروئید خوراکی، در کیفیت زندگی مرتبط با سلامت یا شدت نشانههای بیماری در بیمارانی که دوره اولیه درمان با استروئیدهای خوراکی را در مقایسه با دارونما یا عدم درمان گذرانده بودند، میزان بهبود ناچیز بود یا اینکه اصلا هیچ گونه بهبودی مشاهده نشد.
دادههای مربوط به عوارض جانبی همراه با دورههای کوتاه‐مدت استفاده از کورتیکواستروئیدهای خوراکی از افزایش احتمالی میزان بیخوابی و اختلالات گوارشی حکایت دارند، اما در عین حال مشخص نیست که این امر افزایش اختلالات خلقوخو را نیز به همراه دارد یا خیر. تمام نتایج مربوط به حوادث جانبی بر اساس شواهد با کیفیت پائین به دست آمدهاند.
در این زمینه، به پژوهش بیشتری نیاز است، به ویژه ارزیابی بیماران مبتلا به رینوسینوزیت مزمن بدون پولیپ بینی، پیامدهای طولانی‐مدت و عوارض جانبی آن.
هیچ شواهدی برای استروئیدهای خوراکی در مقایسه با سایر درمانها وجود ندارد.
PICO
خلاصه به زبان ساده
مصرف کوتاه‐مدت کورتیکواستروئیدهای خوراکی در مقایسه با عدم درمان یا روشهای دیگر برای درمان رینوسینوزیت مزمن
سوال مطالعه مروری
ما شواهد مربوط به مزایا و آسیبهای یک دوره کوتاه (به طور معمول تا 21 روز) کورتیکواستروئید را که از طریق دهان به افراد مبتلا به رینوسینوزیت (rhinosinusitis) مزمن داده میشود، در مقایسه با دادن دارونما (placebo) یا عدم درمان یا نوع دیگری از درمان مرور کردیم.
پیشینه
رینوسینوزیت مزمن بیماری شایعی است که مشخصه آن التهاب بینی و سینوسهای پارانازال (گروهی از فضاهای پر از هوا در پشت بینی، چشمها و گونهها) است. بیماران مبتلا به رینوسینوزیت مزمن دستکم دو یا بیش از دو نشانه زیر را به مدت حداقل 12 هفته از خود بروز میدهند: گرفتگی بینی، ترشح از بینی یا آبریزش بینی، درد یا فشار در ناحیه صورت و/یا کاهش حس بویایی (hyposmia). برخی از افراد نیز پولیپ بینی دارند که مشخصه آن بروز تورمهای انگور مانند در دیواره بینی نرمال در داخل مسیر بینی و سینوسها است.
از دورههای کوتاه‐مدت مصرف کورتیکواستروییدهای خوراکی به طور گسترده برای درمان رینوسینوزیت مزمن استفاده میشود. کارآیی این دورههای درمانی کنترل واکنش التهابی است و زمانی که پولیپ وجود داشته باشد، این روشهای درمانی به سرعت موجب کاهش اندازه پولیپ و در نتیجه بهبود نشانههای بیماری میشوند. عوارض جانبی کورتیکواستروئیدها ممکن است این موارد را در بر بگیرند: بیخوابی، تغییرات خلقوخو و ناخوشیهای دستگاه گوارش (مانند درد معده، سوزش سر دل، اسهال، یبوست، تهوع و استفراغ). هنگامی که از کورتیکواستروئیدها در طولانی‐مدت یا به صورت دورههای کوتاه‐مدت متناوب استفاده شود، بروز استئوپروز امکانپذیر است.
ویژگیهای مطالعه
این مرور، شواهد به دست آمده تا تاریخ 11 آگوست 2015 را در بر میگیرد. ما تعداد هشت کارآزمایی تصادفیسازی و کنترل شده را در کل با حضور 474 شرکتکننده وارد کردیم. همه بیماران، بزرگسالان مبتلا به رینوسینوزیت مزمن با پولیپ بینی بودند. در تمام مطالعات، تا پایان دوره درمان (دو تا سه هفته) و در سه مطالعه (210 شرکتکننده) برای سه تا شش ماه پس از اتمام درمان اولیه، وضعیت افراد پیگیری شده بود. در پنج مورد از هشت گزارش به چگونگی تامین مالی کارآزماییها اشاره شد. هیچ کدام از منابع مالی، شرکت داروسازی نبود.
نتایج کلیدی
در پایان دوره درمان دو یا سه هفتهای، افرادی که استروئیدهای خوراکی دریافت کرده بودند، در مقایسه با افرادی که دارونما مصرف کرده یا تحت هیچ درمان دیگری قرار نگرفته بودند، کیفیت بهتر زندگی، نشانههای بیماری با شدت کمتر و پولیپ بینی با اندازه کوچکتر داشتند. پس از سه تا شش ماه، در کیفیت زندگی، شدت نشانههای بیماری یا پولیپ بینی میان افرادی که استروئید خوراکی دریافت کرده و افرادی که تحت دارونما یا عدم مداخله قرار گرفته بودند، تفاوتی اندک یا عدم تفاوت مشاهده شد.
افرادی که استروئیدهای خوراکی دریافت کرده بودند، احتمالا نسبت به افرادی که تحت دارونما یا عدم مداخله قرار داشتند، از اختلالات گوارشی و بیخوابی بیشتری رنج بردند. معلوم نیست افرادی که استروئید خوراکی دریافت کرده بودند، در مقایسه با افراد دریافت کننده دارونما یا عدم مداخله، به اختلالات خلقی بیشتری دچار شدند یا خیر.
کیفیت شواهد
ما کیفیت شواهد مربوط به استروئیدهای خوراکی و استروئیدهای داخل بینی را برای بزرگسالان مبتلا به پولیپ بینی پائین ارزیابی کردیم (به احتمال بسیار، پژوهشهای بیشتر در این زمینه بر میزان اعتماد ما به تخمین اثرگذاری این روشهای درمانی تاثیر مهم خواهد گذاشت و احتمالا این تخمین را تغییر خواهند داد)، زیرا برخی از نتایج موجود از یک یا دو مطالعه به دست آمده که شمار شرکتکنندگان در آنها چندان درخور توجه نیست. خطر سوگیری (bias) در بیشتر کارآزماییها بالا نیست، اما تنها افراد دچار پولیپ بینی در این مرور حضور داشتند.
Authors' conclusions
Summary of findings
| Short‐course oral corticosteroids compared with placebo/no treatment for chronic rhinosinusitis | ||||||
| Patient or population: chronic rhinosinusitis with nasal polyps | ||||||
| Outcomes № of participants | Relative effect | Anticipated absolute effects* (95% CI) | Quality | What happens | ||
| Without oral steroids | With oral steroids | Difference | ||||
| Disease‐specific health‐related quality of life measured by Follow‐up: 2 weeks № of participants: 40 | — | Not estimable | — | The mean disease‐specific health‐related quality of life in the intervention group was 1.24 standard deviations lower (1.92 lower to 0.56 lower) | ⊕⊕⊝⊝ | A lower score indicates reduced impairment. Treatment effect in favour of short‐course oral steroids.
|
| Disease severity, as measured by patient‐reported symptom score,
| — | — | — |
| ⊕⊕⊝⊝ ⊕⊕⊝⊝ ⊕⊕⊝⊝ | A lower score indicates milder symptoms in favour of short‐course oral steroids.
|
| Adverse events: significant mood disturbance № of participants: 40 | RR 2.50 | Study population | ⊕⊕⊝⊝ | It is uncertain whether there were more mood disturbance adverse events in the oral corticosteroids group. | ||
| 100 per 1000 | 250 per 1000 | 150 more per 1000 (45 fewer to 1041 more) | ||||
| Health‐related quality of life, using generic quality of life scores | This outcome was not reported in any of the studies | |||||
| Adverse events: gastrointestinal disturbance Follow‐up: 3 months № of participants:187 | RR 3.45 | Study population | ⊕⊕⊝⊝ | There were more gastrointestinal disturbance adverse events in the oral corticosteroids group. | ||
| 47 per 1000 | 160 per 1000 | 114 more per 1000 (5 more to 455 more) | ||||
| Adverse events: insomnia Follow‐up: 3 months № of participants:187 | RR 3.63 | Study population | ⊕⊕⊝⊝ | There were more insomnia adverse events in the oral corticosteroids group. | ||
| 23 per 1000 | 84 per 1000 | 61 more per 1000 (2 more to 255 more) | ||||
| *The risk in the intervention group (and its 95% confidence interval) is based on the assumed risk in the comparison group and the relative effect of the intervention (and its 95% CI). | ||||||
| GRADE Working Group grades of evidence | ||||||
| 1Downgraded to low quality due to limitations in study methodology and imprecision. Only the disease severity scale of the RSOM‐31 was used (unknown validity of this subscale and the range of scores is unclear). One small study (n = 40), which lacked information about the method of randomisation and allocation concealment. There is a also concern that the magnitude of improvement is not sustained; one study that used a non‐validated instrument reported smaller benefit at three to six months than at two to three weeks for health‐related quality of life. 2The individual symptoms measured were: nasal obstruction, nasal discharge, sense of smell and pressure over the sinuses. Scores for the individual symptoms (0 to 10 visual analogue scale (VAS)) were summed to find the total score.The effect size could be underestimated with this method. 3Downgraded to low quality due to imprecision. Results are from one very small study (n = 22) and the results were only measured at the end of treatment (17 days). There is a concern that the magnitude of improvement is not sustained. The outcome was not measured using a validated tool. 4Downgraded to low quality due to limitations in study methodology and imprecision. One small study (n = 40), which lacked information about the method of randomisation and allocation concealment. The definition of 'mood disturbance' is not provided in the paper. The results have large confidence intervals. 5Downgraded to low quality due to inconsistency and imprecision. The terminology between the papers for this outcome differed from "diarrhoea/GI disturbance" to "gastrointestinal disturbance" to "reflux and/or gastric pain". A low number of events were reported resulting in large confidence intervals. 6Downgraded to low quality due to inconsistency and imprecision. The definition of 'insomnia' is not provided in the papers. A low number of events were reported resulting in large confidence intervals. 7The individual symptoms measured were: blocked nose, rhinorrhoea, hyposmia and sinonasal pain. The results were measured as individual symptoms on a seven‐point Likert scale (0 = no symptoms) and presented as percentage change from baseline for each symptom, which was averaged across the four symptoms to create an average change from baseline. The effect size could be underestimated with this method. 8All patients in both groups received intranasal steroids at the end of the treatment period until the end of follow‐up (12 weeks). 9Downgraded to low quality due to limitations in study methodology and imprecision. Results are from one small study (n = 117) with unclear randomisation and allocation concealment. The results were measured at the end of treatment (two weeks). There is a concern that the results are not sustained. The outcome was not measured using a validated tool. 10Downgraded to low quality due to limitations in study methodology and imprecision. Results are from one small study (n = 117) with unclear randomisation and allocation concealment. There is a small effect size with large confidence intervals. The outcome was not measured using a validated tool. | ||||||
Background
Description of the condition
Chronic rhinosinusitis is defined as inflammation of the nose and paranasal sinuses characterised by two or more symptoms, one of which must be nasal blockage/obstruction/congestion or nasal discharge (anterior/posterior nasal drip). The other possible symptoms include facial pain/pressure, reduction or loss of sense of smell (in adults) or cough (in children). Symptoms must have continued for at least 12 weeks. In addition, people must have either mucosal changes within the ostiomeatal complex and/or sinuses as evidenced by a computerised tomography (CT) scan and/or endoscopic signs of at least one of the following: nasal polyps, mucopurulent discharge primarily from middle meatus or oedema/mucosal obstruction primarily in the middle meatus (EPOS 2012).
Chronic rhinosinusitis represents a common source of ill health; 11% of UK adults reported chronic rhinosinusitis symptoms in a worldwide population study (Hastan 2011). Symptoms, including nasal obstruction, nasal discharge, facial pain, anosmia and sleep disturbance, have a major impact on quality of life, reportedly greater in several domains of the SF‐36 than angina or chronic respiratory disease (Gliklich 1995). Acute exacerbations, inadequate symptom control and respiratory disease exacerbation are common. Complications are rare, but may include visual impairment and intracranial infection.
Two major phenotypes of chronic rhinosinusitis have been identified based on the presence or absence of nasal polyps on examination. Nasal polyps are tumour‐like hyperplastic swellings of the nasal mucosa, most commonly originating from within the ostiomeatal complex (Larsen 2004). Chronic rhinosinusitis with nasal polyps (CRSwNP) is diagnosed when polyps are seen (on direct or endoscopic examination) bilaterally in the middle meatus. The acronym CRSsNP is used for the condition in which no polyps are present.
Although the aetiology of chronic rhinosinusitis is not fully understood, it may involve abnormalities in the host response to irritants, commensal and pathogenic organisms and allergens, obstruction of sinus drainage pathways, abnormalities of normal mucociliary function, loss of the normal mucosal barrier or infection. Two typical profiles may be observed with respect to inflammatory mediators; in eosinophilic chronic rhinosinusitis, which is typically associated with nasal polyps, high levels of eosinophils, immunoglobulin E (IgE) and interleukin (IL)‐5 may be found, while in neutrophilic chronic rhinosinusitis, more often associated with chronic rhinosinusitis without polyps, neutrophils predominate, with elevated interferon (IFN) gamma, IL‐8 and tumour necrosis factor (TNF) (EPOS 2012).
While treatment decisions should be made based on an understanding of the patient's chronic rhinosinusitis phenotype and likely aetiology, in practice treatment may be initiated without knowledge of the polyp status, particularly in primary care. This review (and most of its companion reviews) consider patients with and without polyps together in the initial evaluation of treatment effects. However, subgroup analyses explore potential differences between them (see below).
The most commonly used interventions for chronic rhinosinusitis are used either topically (sprayed into the nose) or systemically (by mouth) and include steroids, antibiotics and saline.
Description of the intervention
Short courses of oral steroids are widely used in medicine for a variety of inflammatory conditions. In patients with chronic rhinosinusitis they are often used with a view to gaining a rapid improvement in symptoms and to allow improved access for topically applied agents. They are typically given over a seven‐ to 21‐day period and may be at a fixed dose or incorporate a reducing dose over the course. This strategy is thought to reduce the risk of adverse effects (Mygind 1996). A wide spectrum of adverse events are reported with systemic steroid usage (see Table 1); however, data on the incidence in association with chronic rhinosinusitis are lacking. While it is possible to extrapolate findings from trials in other diseases, there is a risk that the incidence is disease‐specific; for example, a high incidence of avascular necrosis is seen with high‐dose steroid use in systemic lupus erythematosus, which is in part attributed to the underlying disease process and severity as well as the higher dosages prescribed in severe disease (Da Silva 2006).
| System | Adverse events | Notes |
| Musculoskeletal | Osteoporosis | Largely limited to long‐term use Significantly increased risk of fractures with prolonged use |
| Osteonecrosis | Rare, appears to be dose‐dependent | |
| Endocrine | Hyperglycaemia | Common; dose‐dependent, usually reversible |
| Cardiovascular | Hypertension | Common; dose‐dependent, usually reversible |
| Dermatological | Striae, bruising | Dose‐dependent; occurs after > 1 month usage |
| Ophthalmological | Cataracts | Irreversible; largely related to long‐term usage |
| Glaucoma | High risk with pre‐existing disease | |
| Gastrointestinal tract | Peptic ulceration | Increased risk largely due to concomitant NSAIDs |
| Psychological | Psychosis | Common; increased risk with dosages > 40 mg/day |
References: Da Silva 2006; Naber 1996; Stanbury 1998
NSAIDs: non‐steroidal anti‐inflammatory drugs
Adverse effects associated with short‐term oral steroid use are said to include gastrointestinal disturbances, insomnia and altered mental states. However, there are few or no published data on the frequency of these effects when short‐term courses are prescribed. Adverse effects associated with long‐term use of oral steroids are also listed in Table 1.
How the intervention might work
Short courses of oral steroids are most often used in patients with chronic rhinosinusitis with nasal polyps. The intention is to reduce the inflammation in order to produce a rapid reduction in the size of the polyps, to improve symptoms and allow better penetration of topical treatments into the nasal cavity. They may be used in a similar way for patients with chronic rhinosinusitis without polyps, who have severe nasal obstruction or complete anosmia (loss of sense of smell). The initial effect of treatment is expected to be immediate. Any observed improvement may continue, especially if one effect of the intervention is to improve the bio‐availability of an adjunct treatment.
There is, however, a lack of evidence regarding the optimal treatment regimen of oral steroids with respect to indication, dose and duration. The optimum usage of steroids is clinically important as it may reduce the need for surgery by providing good symptomatic control.
Why it is important to do this review
Short courses of oral steroids are widely used either alone or as a form of add‐on therapy in patients with chronic rhinosinusitis. This review and a closely related new review of 'Short‐course oral steroids as an adjunct therapy for chronic rhinosinusitis', Head 2016a, update and expand a previous Cochrane review that looked at this treatment in patients with polyps (Martinez‐Devesa 2011). This review seeks to establish the effectiveness of oral steroids (compared to no treatment or placebo) and their relative effectiveness compared to other commonly used agents for chronic rhinosinusitis (such as intranasal corticosteroids). In contrast, the companion review tries to establish the additional benefits (and harms) of steroids when added on to existing therapies for chronic rhinosinusitis.
This review is one of a suite of Cochrane reviews looking at common management options for patients with chronic rhinosinusitis (Chong 2016a; Chong 2016b; Chong 2016c; Head 2016b; Head 2016a), and we use the same outcome measures across the reviews. We have not included studies designed to evaluate interventions in the immediate peri‐surgical period, which are focused on assessing the impact of the intervention on the surgical procedure or on modifying the post‐surgical results (preventing relapse).
Objectives
To assess the effects of oral corticosteroids compared with placebo/no intervention or other pharmacological interventions (intranasal corticosteroids, antibiotics, antifungals) for chronic rhinosinusitis.
Methods
Criteria for considering studies for this review
Types of studies
We included studies with the following design characteristics:
-
randomised controlled trials, including cluster‐randomised trials and quasi‐randomised trials (cross‐over trials were only to be included if the data from the first phase were available); and
-
patients were followed up for at least two weeks.
We excluded studies with the following design characteristics:
-
randomised patients by side of nose (within‐patient controlled) because it is difficult to ensure that the effects of any of the interventions considered can be localised; or
-
perioperative studies, where the sole purpose of the study was to investigate the effect of the intervention on surgical outcome.
Types of participants
Patients with chronic rhinosinusitis, whether with polyps or without polyps.
We excluded studies that included a majority of patients with:
-
cystic fibrosis;
-
allergic fungal sinusitis/eosinophilic fungal/mucinous rhinosinusitis;
-
aspirin‐exacerbated respiratory disease;
-
antrochoanal polyps (benign polyps originating from the mucosa of the maxillary sinus);
-
malignant polyps;
-
primary ciliary dyskinesia;
-
gross immunodeficiency (congenital or acquired);
-
a history of surgery for nasal polyps within six weeks of entry to the study.
Types of interventions
We included all short (see below) courses of oral steroids, regardless of dose. This included:
-
prednisone;
-
prednisolone;
-
methylprednisolone;
-
hydrocortisone;
-
cortisone acetate.
Short courses of oral steroids are defined as lasting up to, but not exceeding, 21 days.
The main comparators were: placebo or no intervention.
The main comparison pairs were:
-
oral steroids versus placebo or no treatment;
-
oral steroids followed by intranasal corticosteroids versus placebo or no treatment followed by intranasal corticosteroids.
Other possible comparison pairs included:
-
oral steroids versus intranasal corticosteroids;
-
oral steroids versus antibiotics;
-
oral steroids versus antifungals.
This review is part of a larger series of six reviews of the treatment of chronic rhinosinusitis.
-
Intranasal steroids versus placebo or no intervention for chronic rhinosinusitis (Chong 2016b).
-
Different types of intranasal steroids for chronic rhinosinusitis (Chong 2016a). This review compares different classes, doses and delivery methods of intranasal corticosteroids for chronic rhinosinusitis.
-
Short‐course oral steroids alone for chronic rhinosinusitis (this review). This review compares short‐course oral steroids alone with placebo or no intervention, or against other pharmacological interventions such as antibiotics or nasal saline irrigation.
-
Short‐course oral steroids as an adjunct therapy for chronic rhinosinusitis (Head 2016a). This review compares oral steroids where they have been used as add‐on therapy to other treatments for chronic rhinosinusitis (such as intranasal corticosteroids, antibiotics or saline solution).
-
Saline irrigation for chronic rhinosinusitis (Chong 2016c). This review compares nasal saline irrigation for chronic rhinosinusitis with both placebo/no intervention and with intranasal corticosteroids or antibiotics.
-
Systemic and topical antibiotics for chronic rhinosinusitis (Head 2016b). This review compares both topical and systemic antibiotics with placebo/no treatment, two different antibiotics with each other and antibiotics with intranasal corticosteroids.
Types of outcome measures
We analysed the following outcomes in the review, but we did not use them as a basis for including or excluding studies.
Both short‐term (at the end of treatment) and long‐term effects are important therefore we evaluated outcomes at the end of treatment or within three weeks thereof in addition to three to six months, six to 12 months and more than 12 months. For adverse events, we analysed data from the longest time periods.
Primary outcomes
-
Health‐related quality of life, using disease‐specific health‐related quality of life scores, such as the Sino‐Nasal Outcome Test‐22 (SNOT‐22), Rhinosinusitis Outcome Measures‐31 (RSOM‐31) and SNOT‐20.
-
Disease severity, as measured by patient‐reported symptom score (such as the Chronic Sinusitis Survey (CSS) questionnaire and visual analogue scales). In the absence of validated symptom score data, patient‐reported individual symptom scores were reported for the following symptoms: nasal obstruction/blockage/congestion, nasal discharge (rhinorrhoea), facial pressure/pain, loss of sense of smell (adults), cough (children).
-
Significant adverse effect: mood or behavioural disturbances.
Secondary outcomes
-
Health‐related quality of life, using generic quality of life scores, such as the SF‐36, EQ‐5D and other well‐validated instruments.
-
Other adverse effects: gastrointestinal disturbances.
-
Other adverse effects: insomnia.
-
Other adverse effects: osteoporosis.
-
Endoscopic score (depending on population, either nasal polyps size score or endoscopy score, e.g. Lund‐Mackay/Lund‐Kennedy).
-
Computerised tomography (CT) scan score (e.g. Lund‐Mackay).
The adverse events that we collected from studies including one of the various comparators listed above were the same as those collected in the companion reviews assessing the effects of these interventions as primary treatments.
Search methods for identification of studies
The Cochrane ENT Information Specialist conducted systematic searches for randomised controlled trials and controlled clinical trials. There were no language, publication year or publication status restrictions. The date of the search was 11 August 2015.
Electronic searches
The Information Specialist searched:
-
the Cochrane Register of Studies ENT Trials Register (searched 11 August 2015);
-
the Cochrane Central Register of Controlled Trials (CENTRAL 2015, Issue 7);
-
Ovid MEDLINE (1946 to July week 5 2015);
-
Ovid MEDLINE (In‐Process & Other Non‐Indexed Citations) (searched 11 August 2015);
-
PubMed (as a top up to searches in Ovid MEDLINE) (searched 11 August 2015);
-
-
Ovid EMBASE (1974 to 2015 week 32);
-
ClinicalTrials.gov, www.clinicaltrials.gov (search via the Cochrane Register of Studies) (searched 11 August 2015);
-
World Health Organization (WHO) International Clinical Trials Registry Platform (ICTRP) (searched 11 August 2015);
-
Google Scholar (searched 11 August 2015).
The Information Specialist modelled subject strategies for databases on the search strategy designed for CENTRAL. Where appropriate, they were combined with subject strategy adaptations of the highly sensitive search strategy designed by Cochrane for identifying randomised controlled trials and controlled clinical trials (as described in the Cochrane Handbook for Systematic Reviews of Interventions Version 5.1.0, Box 6.4.b. (Handbook 2011). Search strategies for major databases including CENTRAL are provided in Appendix 1.
Searching other resources
We scanned the reference lists of identified publications for additional trials and contacted trial authors where necessary. In addition, the Information Specialist searched PubMed, The Cochrane Library and Google to retrieve existing systematic reviews relevant to this systematic review, so that we could scan their reference lists for additional trials.
Data collection and analysis
Selection of studies
Two review authors independently screened all titles and abstracts of the studies obtained from the database searches to identify potentially relevant studies. Two review authors evaluated the full text of each potentially relevant study to determine whether it met the inclusion and exclusion criteria for this review.
We resolved any differences by discussion and consensus, with the involvement of a third author for clinical and methodological input where necessary.
Data extraction and management
Two review authors independently extracted data from each study using a standardised data collection form (see Appendix 2). Whenever a study had more than one publication, we retrieved all publications to ensure complete extraction of data. Where there were discrepancies in the data extracted by different review authors, we checked these against the original reports and resolved differences by discussion and consensus, with the involvement of a third author or a methodologist where appropriate. We contacted the original study authors for clarification or for missing data whenever possible. If differences were found between publications of a study, we contacted the original authors for clarification. We used data from the main paper(s) if no further information was found.
We included key characteristics of the studies, such as study design, setting, sample size, population and how outcomes were defined or collected in the studies. In addition, we also collected baseline information on prognostic factors or effect modifiers. For this review, this included:
-
presence or absence of nasal polyps;
-
baseline nasal polyp score (where appropriate);
-
whether the patient has had previous sinus surgery;
-
number of previous courses of oral steroids.
For the outcomes of interest to the review, we extracted the findings of the studies on an available case analysis basis; i.e. we included data from all patients available at the time points based on the treatment randomised whenever possible, irrespective of compliance or whether patients had received the treatment as planned.
In addition to extracting pre‐specified information about study characteristics and aspects of methodology relevant to risk of bias, we extracted the following summary statistics for each trial and each outcome:
-
For continuous data: the mean values, standard deviations and number of patients for each treatment group. Where endpoint data were not available, we extracted the values for change from baseline. We analysed data from measurement scales such as SNOT‐22 and EQ‐5D as continuous data.
-
For binary data: the numbers of participants experiencing an event and the number of patients assessed at the time point.
-
For ordinal scale data: if the data appeared to be approximately normally distributed or if the analysis that the investigators performed suggested parametric tests were appropriate, then we treated the outcome measures as continuous data. Alternatively, if data were available, we converted into binary data.
We prespecified the time points of interest for the outcomes in this review. While studies may report data at multiple time points, we only extracted the longest available data within the time points of interest. For example, for 'medium‐term' follow‐up periods, our time point was defined as 'three to six months' post‐randomisation. If a study had reported data at three, four and six months, we only extracted and analysed the data for the six‐month follow‐up.
Extracting data from figures
Where values for primary or secondary outcomes were shown as figures within the paper we contacted the study authors to try to obtain the raw values. When the raw values were not provided we extracted information from the graphs using an online data extraction tool (http://arohatgi.info/WebPlotDigitizer/app/), using the best quality version of the relevant figures available.
Assessment of risk of bias in included studies
Two review authors independently assessed the risk of bias of each included study. We followed the guidance in the Cochrane Handbook for Systematic Reviews of Interventions (Handbook 2011), and we used the Cochrane 'Risk of bias' tool. With this tool we assessed the risk of bias as 'low', 'high' or 'unclear' for each of the following six domains:
-
sequence generation;
-
allocation concealment;
-
blinding of participants, personnel and outcome assessment;
-
incomplete outcome data;
-
selective reporting;
-
other sources of bias.
Measures of treatment effect
We summarised the effects of dichotomous outcomes (e.g. proportion of patients with symptom resolution) as risk ratios (RR) with CIs. For the key outcomes that we presented in the 'Summary of findings' table, we also expressed the results as absolute numbers based on the pooled results and compared to the assumed risk. We had also planned to calculate the number needed to treat to benefit (NNTB) using the pooled results where dichotomous efficacy outcomes were available. The assumed baseline risk is typically either (a) the median of the risks of the control groups in the included studies, this being used to represent a 'medium risk population' or, alternatively, (b) the average risk of the control groups in the included studies is used as the 'study population' (Handbook 2011). If a large number of studies were available, and where appropriate, we had planned also to present additional data based on the assumed baseline risk in (c) a low‐risk population and (d) a high‐risk population.
For continuous outcomes, we expressed treatment effects as a mean difference (MD) with standard deviation (SD) or as standardised mean difference (SMD) if different scales were used to measure the same outcome. We provided a clinical interpretation of the SMD values.
Unit of analysis issues
This review did not use data from phase II of cross‐over studies or from studies where the patient was not the unit of randomisation, i.e. studies where the side (right versus left) was randomised.
If we had found cluster‐randomised trials, we would have analysed these according to the methods in section 16.3.3 of the Cochrane Handbook for Systematic Reviews of Interventions (Handbook 2011).
Dealing with missing data
We tried to contact study authors via email whenever the outcome of interest was not reported, if the methods of the study suggested that the outcome had been measured. We did the same if not all data required for meta‐analysis were reported, unless the missing data were standard deviations. If standard deviation data were not available, we approximated these using the standard estimation methods from P values, standard errors or 95% CIs if these were reported, as detailed in the Cochrane Handbook for Systematic Reviews of Interventions (Handbook 2011). Where it was impossible to estimate these, we contacted the study authors.
Apart from imputations for missing standard deviations, we conducted no other imputations. However, we completed calculations relating to disease severity (measured by patient‐reported symptom scores) as most of the data measured individual symptoms rather than using validated instruments (see 'Imputing total symptom scores' below). We extracted and analysed data for all outcomes using the available case analysis method.
Imputing total symptom scores
Where a paper did not present information for the total disease severity in terms of patient‐reported symptom scores but did present data for the results of individual symptoms, we used the symptoms covering the important domains of the EPOS chronic rhinosinusitis diagnosis criteria, EPOS 2012, to calculate a total symptom score. The EPOS 2012 criteria for chronic rhinosinusitis require at least two symptoms. One of the symptoms must be either nasal blockage or nasal discharge; other symptoms can include facial pressure/pain, loss of sense of smell (for adults) or cough (for children). Where mean final values or changes from baseline were presented in the paper for the individual symptoms we summed these to calculate a 'total symptom score'. We calculated standard deviations for the total symptom score as if the symptoms were independent, random variables that were normally distributed. We acknowledge that there is likely to be a degree of correlation between the individual symptoms, however we used this process because the magnitude of correlation between the individual symptoms is not currently well understood (no evidence found). If the correlation is high, the summation of variables as discrete variables is likely to give a conservative estimate of the total variance of the summed final score. If the correlation is low, this method of calculation will underestimate the standard deviation of the total score. However, the average patient‐reported symptom scores have a correlation coefficient of about 0.5; if this is also applicable to chronic rhinosinusitis symptoms, the method used should have minimal impact (Balk 2012). As this method of calculation does not take into account weighting of different symptoms (no evidence found), we downgraded all the disease severity outcomes for lack of use of validated scales whenever this occurred.
Assessment of heterogeneity
We assessed clinical heterogeneity (which may be present even in the absence of statistical heterogeneity) by examining the included trials for potential differences between studies in the types of participants recruited, interventions or controls used and the outcomes measured.
We assessed statistical heterogeneity by visually inspecting the forest plots and by considering the Chi² test (with a significance level set at P value < 0.10) and the I² statistic, which calculates the percentage of variability that is due to heterogeneity rather than chance, with I² values over 50% suggesting substantial heterogeneity (Handbook 2011).
Assessment of reporting biases
We assessed reporting bias as between‐study publication bias and within‐study outcome reporting bias.
Outcome reporting bias (within‐study reporting bias)
We assessed within‐study reporting bias by comparing the outcomes reported in the published report against the study protocol, whenever this could be obtained. If the protocol was not available, we compared the outcomes reported to those listed in the methods section. If results were mentioned but not reported adequately in a way that allowed analysis (e.g. the report only mentions whether the results were statistically significant or not), bias in a meta‐analysis is likely to occur. We therefore sought further information from the study authors. If no further information could be found, we noted this as being a 'high' risk of bias. Quite often there was insufficient information to judge the risk of bias; we noted this as an 'unclear' risk of bias (Handbook 2011).
Publication bias (between‐study reporting bias)
We planned to assess funnel plots if sufficient trials (more than 10) were available for an outcome. If we observed asymmetry of the funnel plot, we would have conducted more formal investigation using the methods proposed by Egger 1997.
Data synthesis
We conducted all meta‐analyses using Review Manager 5.3 (RevMan 2014). For dichotomous data, we planned to analyse treatment differences as a risk ratio (RR) calculated using the Mantel‐Haenszel methods. We analysed time‐to‐event data using the generic inverse variance method.
For continuous outcomes, if all the data were from the same scale, we planned to pool mean values obtained at follow‐up with change outcomes and report this as a MD. However, if the SMD had to be used as an effect measure, we did not pool change and endpoint data.
We used a fixed‐effect model for data analysis, unless statistical heterogeneity was substantial (> 50%). When statistical heterogeneity is low, random‐effects versus fixed‐effect methods yield trivial differences in treatment effects. However, when statistical heterogeneity is high, the random‐effects method provides a more conservative estimate of the difference. If statistical heterogeneity was high, we conducted analysis using a random‐effects model, if the source of heterogeneity was unexplained.
Subgroup analysis and investigation of heterogeneity
We conducted some subgroup analyses regardless of whether statistical heterogeneity was observed, as these are widely suspected to be potential effect modifiers. For this review, this included:
-
phenotype of patients: whether patients had chronic rhinosinusitis without nasal polyps, chronic rhinosinusitis with nasal polyps, were a mixed group or the status of polyps is not known or not reported. We undertook the subgroup analysis because although there appears to be a considerable overlap between the two forms of chronic rhinosinusitis with regards to inflammatory profile, clinical presentation and effect of treatment (Cho 2012; DeMarcantonio 2011; Ebbens 2010; Fokkens 2007; Ragab 2004; Ragab 2010; van Drunen 2009), there is some evidence pointing to differences in the respective inflammatory profiles (Kern 2008; Keswani 2012; Tan 2011; Tomassen 2011; Zhang 2008; Zhang 2009), and potentially even differences in treatment outcome (Ebbens 2011).
We presented the main analyses of this review according to the subgroups of phenotypes of chronic rhinosinusitis. We presented all other subgroup analysis results in tables.
When studies had a mixed group of patients, we analysed the study as one of the subgroups (rather than as a mixed group) if more than 80% of patients belonged to one category. For example, if 81% of patients had chronic rhinosinusitis without nasal polyps, we analysed the study as that subgroup.
In addition to the subgroups above, we conducted the following subgroup analyses in the presence of statistical heterogeneity:
-
patient age (children versus adults);
-
dose;
-
duration of treatment.
Sensitivity analysis
We carried out sensitivity analyses to determine whether the findings are robust to the decisions made in the course of identifying, screening and analysing the trials. We planned to conduct sensitivity analysis for the following factors, whenever possible:
-
impact of model chosen: fixed‐effect versus random‐effects model;
-
risk of bias of included studies: excluding studies with high risk of bias (we defined these as studies that have a high risk of allocation concealment bias and a high risk of attrition bias (overall loss to follow‐up of 20%, differential follow‐up observed);
-
how outcomes were measured: we investigated the impact of including data where the validity of the measurement was unclear.
If any of these investigations found a difference in the size of the effect or heterogeneity, we mentioned this in the Effects of interventions section.
GRADE and 'Summary of findings' table
We used the GRADE approach to rate the overall quality of evidence for each outcome using the GDT tool (http://www.guidelinedevelopment.org/) for the main comparison pairs listed in the Types of interventions section. The quality of evidence reflects the extent to which we are confident that an estimate of effect is correct and we applied this in the interpretation of results. There are four possible ratings: 'high', 'moderate', 'low' and 'very low'. A rating of 'high' quality evidence implies that we are confident in our estimate of effect and that further research is very unlikely to change our confidence in the estimate of effect. A rating of 'very low' quality implies that any estimate of effect obtained is very uncertain.
The GRADE approach rates evidence from RCTs that do not have serious limitations as high quality. However, several factors can lead to the downgrading of the evidence to moderate, low or very low. The degree of downgrading is determined by the seriousness of these factors:
-
study limitations (risk of bias);
-
inconsistency;
-
indirectness of evidence;
-
imprecision;
-
publication bias.
The 'Summary of findings' table presents only the six top priority outcomes (disease‐specific health‐related quality of life, disease severity score, generic quality of life and three adverse effects: mood disturbances, gastrointestinal disturbance and insomnia). We did not include the outcomes of endoscopic score or CT scan score, or the adverse effect of osteoporosis in the 'Summary of findings' table. Similarly, we did not present the results for the individual symptoms in the 'Summary of findings' table.
Results
Description of studies
Results of the search
The searches retrieved a total of 2470 references after removal of duplicates. We screened titles and abstracts and subsequently removed 2424 studies. We assessed 46 full texts for eligibility. We excluded 30 studies, with reasons. Thirteen papers are included (eight studies). We identified three ongoing studies. There are no studies awaiting assessment.
A flow chart of study retrieval and selection is provided in Figure 1.

Process for sifting search results and selecting studies for inclusion.
Included studies
We included eight published studies (13 papers) in the review (Alobid 2014; Benitez 2006; Ecevit 2015; Hissaria 2006; Kapucu 2012; Kirtsreesakul 2012; Vaidyanathan 2011; Van Zele 2010). See Characteristics of included studies.
There were five papers from one group in Spain (Alobid 2014; Benitez 2006). After contacting the lead author of these papers we clarified that there were two separate trials reported within the different papers. We included the results from only two of these papers: Alobid 2014 for the more recent trial and Benitez 2006 for the earlier trial. The additional papers either present identical groups of patients, or results for subsets of patients.
The aim of the Ecevit 2015 study was to look at the impact of short‐course oral steroids on surgical outcomes. However, disease severity was reported after oral steroid treatment had completed but prior to surgery taking place and so we included the study in this review.
Two of the trials had more than two study arms (Kapucu 2012; Van Zele 2010). Kapucu 2012 was a four‐arm study that compared a short‐course oral steroid, an intra‐polyp steroid injection, intranasal steroid treatment (triamcinolone acetonide spray 55 μg, two times daily with two puffs in both nostril cavities) and a control group who were not given any medication. The oral steroid and the control group are included in this review. Van Zele 2010 was a three‐arm study comparing oral corticosteroids (methylprednisolone), placebo and antibiotics (doxycycline). Only the arm comparing oral steroids with placebo is included in this review although the results for the comparisons that include antibiotics are reported in Head 2016b.
Design
All eight included studies are parallel‐group, randomised controlled trials (Alobid 2014; Benitez 2006; Ecevit 2015; Hissaria 2006; Kapucu 2012; Kirtsreesakul 2012; Vaidyanathan 2011; Van Zele 2010). Three studies were unblinded and no steroid treatment was provided in the control arm (Alobid 2014; Benitez 2006; Kapucu 2012). Five studies stated that participants and healthcare professionals were blind to the treatment group (Ecevit 2015; Hissaria 2006; Kirtsreesakul 2012; Vaidyanathan 2011; Van Zele 2010). A further discussion of blinding is made in the section Blinding (performance bias and detection bias).
Setting
Four studies were conducted in ENT departments within hospitals (Alobid 2014; Benitez 2006; Ecevit 2015, Van Zele 2010), two in allergy outpatient clinics (Hissaria 2006; Kirtsreesakul 2012), and one in a speciality clinic (Vaidyanathan 2011). The setting of one study was unclear (Kapucu 2012).
Van Zele 2010 was a multicentre trial conducted on five sites in four countries (Belgium, Germany, Holland and Australia). Five studies were single‐centre: two in the same unit in Spain (Alobid 2014; Benitez 2006), one in Turkey (Ecevit 2015), one in Thailand (Kirtsreesakul 2012), and one in Scotland (Vaidyanathan 2011). The number of sites involved in the other studies are not known although one was from Australia (Hissaria 2006), and the other was Turkey (Kapucu 2012).
Participants and sample size
All of the published trials only included adults diagnosed with chronic rhinosinusitis with nasal polyps. There were 474 participants included in the comparison of oral steroids with placebo or no intervention.
The diagnostic criteria for inclusion into the trials varied by study. Three studies did not refer to a minimum grade of nasal polyps for inclusion (Hissaria 2006; Kapucu 2012; Kirtsreesakul 2012), although Hissaria 2006 recruited only "symptomatic polyp patients". Two studies included patients with moderate‐to‐severe bilateral polyps (Alobid 2014; Vaidyanathan 2011). Alobid 2014 based their inclusion on the EPOS 2012 criteria (Appendix 3) and Vaidyanathan 2011 was based on the European Position Paper on Rhinosinusitis and Nasal Polyps 2007.
Three papers included a more severely affected or recalcitrant population (Benitez 2006; Ecevit 2015; Van Zele 2010). Benitez 2006 only included people with "severe" nasal polyps (mean score: 2.7 out of a possible 3 using the Lildholdt score), whereas it was required in the participants in Van Zele 2010 that either the nasal polyps had recurred after surgical resection or were bilateral and grades 3 or 4 in both nares using their five‐point nasal polyp scoring scale (Appendix 4). In Ecevit 2015, the inclusion criteria were patients with moderate or severe nasal polyps who had not responded to a six‐week course of fluticasone nasal drops (200 µg/day). Out of 124 people treated with fluticasone, 23 met the inclusion criteria and were randomised to oral steroids or placebo.
Across all the included studies 67% of participants were male, in keeping with the male preponderance seen in a recent epidemiological study (Hopkins 2016; Philpott 2015). However, the mean age of participants was 46 years, which is a decade lower than the above referenced study; in fact it is notable that the mean age in the control arm of Ecevit 2015 was 26.6 years (although this may have been a reporting error) and the mean age for both arms in Kapucu 2012 was 32.2 years. These participant groups may therefore not be fully representative of the overall chronic rhinosinusitis population.
Interventions and comparisons
All of the eight included studies provided results for a short course of treatment (14 to 21 days) with oral steroids compared with placebo or no treatment (Alobid 2014; Benitez 2006; Ecevit 2015; Hissaria 2006; Kapucu 2012; Kirtsreesakul 2012; Vaidyanathan 2011; Van Zele 2010).
Four trials had washout periods prior to starting the trial (Alobid 2014; Benitez 2006; Kirtsreesakul 2012; Vaidyanathan 2011), in which the patients received no steroids in the two weeks (Vaidyanathan 2011), or four weeks prior to starting oral steroids (Alobid 2014; Benitez 2006; Kirtsreesakul 2012).
Three different oral steroids were given within the trials: prednisone (Alobid 2014; Benitez 2006), prednisolone (Ecevit 2015; Hissaria 2006; Kirtsreesakul 2012; Vaidyanathan 2011), and methylprednisolone (Kapucu 2012; Van Zele 2010). Both studies using prednisone started at 30 mg and reduced the dose over the 14‐day treatment course (reduced by 5 mg every two days) (Alobid 2014; Benitez 2006). For prednisolone, Ecevit 2015 gave a starting dose of 60 mg/day and then reduced this over the 17‐day treatment course. The other three studies gave a 14‐day course but with no reduction: Hissaria 2006 and Kirtsreesakul 2012 gave 50 mg/day whilst Vaidyanathan 2011 gave a lower dose of 25 mg/day. Both studies using methylprednisolone reduced the dose over the trial period. Kapucu 2012 gave oral methylprednisolone at a varying dose depending on the weight of the patient (1 mg/kg/day for three days then reduced by 8 mg/three days). The study did not give details of the average duration of treatment. Van Zele 2010 gave 32 mg/day on days one to five, 16 mg/day on days 6 to 10 and 8 mg/day on days 11 to 20.
The comparator in three studies was no steroid treatment (no placebo) (Alobid 2014; Benitez 2006; Kapucu 2012), placebo tablets in four studies (Ecevit 2015; Hissaria 2006; Kirtsreesakul 2012; Vaidyanathan 2011), and placebo capsules in one study (Van Zele 2010).
No information on any concurrent treatment was given in four studies (Alobid 2014; Benitez 2006; Ecevit 2015; Kapucu 2012). Other medications were not permitted during the oral steroid treatment stage in a further three (Kirtsreesakul 2012; Vaidyanathan 2011; Van Zele 2010). Only Hissaria 2006 identified that participants were allowed to continue the use of regular antihistamines (33% (13/40)), topical corticosteroids (55% (22/40)), or both (it is unclear how many patients used both treatments).
Three studies followed up patients beyond the end of the oral steroid treatment phase (Kirtsreesakul 2012; Vaidyanathan 2011; Van Zele 2010). Intranasal steroids were routinely prescribed to patients in both treatment arms at the end of the oral steroid treatment in two studies (Kirtsreesakul 2012; Vaidyanathan 2011). In Vaidyanathan 2011, all participants received fluticasone propionate nasal drops for eight weeks and then fluticasone propionate nasal spray for a further 18 weeks, making a total treatment time of 28 weeks (two weeks oral steroids or placebo followed by 26 weeks of intranasal steroids). In Kirtsreesakul 2012, all patients received mometasone furoate nasal spray for a further 10 weeks after initial treatment. Although patients were followed up at 12 weeks in Van Zele 2010, intranasal steroids were not routinely prescribed and were only permitted as rescue medication two months after dosing with the study medication.
Overall, the choice of oral corticosteroids used and the variety of differing regimens reflect the variety seen in mainstream clinical practice. Use of topical corticosteroids after the oral dose was included as a definitive part of the patient pathway in two studies, which reflects current practice.
Outcomes
One study did not report any of the primary or secondary outcomes as defined in the methods section of this review (Kapucu 2012).
Disease‐specific health‐related quality of life (HRQL)
This was measured in two studies using different measurement instruments (Hissaria 2006; Vaidyanathan 2011). Hissaria 2006 used the RSOM‐31 questionnaire to measure HRQL after treatment (14 days), but modified the scoring system, using only the severity parameter but not the importance parameter. Vaidyanathan 2011 used the Jupiter mini‐Rhinoconjunctivitis Quality of Life questionnaire (RQLQ) both immediately after treatment (14 days) and at 26 weeks after treatment. This scale is validated for patients with seasonal or perennial rhinoconjunctivitis but the validity of this instrument is not known in chronic rhinosinusitis patients and the scale is not clear within the paper.
Disease severity, as reported using patient‐reported outcomes
Five studies provided information on patient‐reported disease severity at the end of treatment in terms of a combined score or individual symptom scores, which could be combined into a single score (Ecevit 2015; Hissaria 2006; Kirtsreesakul 2012; Vaidyanathan 2011; Van Zele 2010). The symptoms measured, the scales of measurement used and the way in which data were reported varied greatly between studies. See Effects of interventions. Three of the studies provided medium‐term data on patient‐reported symptoms after a follow‐up period of 10 to 12 weeks (Kirtsreesakul 2012; Van Zele 2010), and 26 weeks (Vaidyanathan 2011).
Endoscopic score
Nasal polyp size was reported at the end of treatment in seven studies (Alobid 2014; Benitez 2006; Ecevit 2015; Hissaria 2006; Kirtsreesakul 2012; Vaidyanathan 2011; Van Zele 2010), and after a three‐ to six‐month follow‐up in three studies (Kirtsreesakul 2012; Vaidyanathan 2011; Van Zele 2010). Hissaria 2006 reported the estimated percentage reduction in polyp size using pairs of photographs taken pre‐ and post‐treatment. Five studies measured nasal polyps on a 0‐ to 3‐point scale although the definitions vary between categories (Alobid 2014; Benitez 2006; Ecevit 2015; Kirtsreesakul 2012; Vaidyanathan 2011), and Van Zele 2010 used a 0‐ to 4‐point scale. The scales used are summarised in Appendix 4. There was a lack of information in the papers about the methods used (e.g. was the value recorded the worst affected nostril or an average of the two nostrils?), about the validation of the scales used and about any precautions taken or calculation made to ensure consistency between investigators.
Adverse events
Two studies made no mention of whether adverse events were sought or identified in their papers (Alobid 2014; Benitez 2006). Two studies reported that no adverse effects were observed: Ecevit 2015 stated that "Adverse effects were not observed in either group", whilst Kapucu 2012 stated that "No systemic or local side effects of steroid treatment were seen in any patients". Vaidyanathan 2011 presented information about adverse events well, but did not report any of the specific adverse effects of oral steroids outcomes as pre‐defined by this review, although adverse events for intranasal steroid use after oral steroid treatment had finished were reported. The remaining three studies provided clear information about at least one of the adverse effects of interest (Hissaria 2006; Kirtsreesakul 2012; Van Zele 2010).
Excluded studies
We excluded 30 studies after reviewing the full paper. Further details of the reasons for exclusion are summarised in Characteristics of excluded studies. We identified 19 of these from the excluded papers list in previous version of the Cochrane review (Martinez‐Devesa 2011), and we found the reasons for exclusion from the previous review to still be valid under the updated inclusion criteria developed for this review (Alobid 2005; Blomqvist 2001; Blomqvist 2009; Bonfils 1998; Bonfils 2003; Bonfils 2006; Chi Chan 1996; Damm 1999; Hessler 2007; Jankowski 2003a; Jankowski 2003b; Kroflic 2006; Lildholdt 1988; Lildholdt 1989; Nores 2003; Ragab 2006; Rasp 2000; Sieskiewicz 2006; Stevens 2001).
Two papers reported RCTs comparing oral steroid treatment with placebo or no treatment, but all study participants also received concurrent treatment with antibiotics (Ozturk 2011), or intranasal steroids (Bülbül 2013). These studies are included in the Cochrane review of short‐course oral steroids as an adjunct for chronic rhinosinusitis (Head 2016a). In addition, we identified one protocol for an ongoing RCT, which will aim to compare a short course of oral steroids then intranasal steroids with intranasal steroids alone. All patients in both arms will also receive antibiotics (NCT01676415). Further details for this study can be found in the Cochrane review 'Short‐course oral steroids as an adjunct therapy for chronic rhinosinusitis' (Head 2016a).
Of the remaining seven papers, Rupa 2010 included a population of people with allergic fungal rhinosinusitis, which was out of scope for this review. One study compared intranasal steroids with oral steroids but intranasal steroid treatment was only given for 16 days (Reychler 2015). Six were either non‐randomised studies or commentaries on existing, included RCTs (Grammer 2013; Rasp 1997; Remer 2005; Sousa 2009; Tuncer 2003; van Camp 1994).
Ongoing studies
We identified three ongoing studies (Chi 2011; NCT00841802; NCT02367118). All studies are investigating oral steroids compared with either placebo or no treatment.Chi 2011 aims to compare oral prednisone with placebo treatment for 20 days in patients with nasal polyps. The trial was registered in 2011 but no further information was available despite attempts to contact the author. NCT00841802 compares oral prednisone for 21 days with placebo treatment in patients without nasal polyps. We contacted the study authors and confirmed that the study was currently recruiting participants but no results were currently available. The other ongoing study, NCT02367118, aims to compare a five‐day course oral prednisone with no intervention, prior to surgery. The study includes a mixture of patients with chronic rhinosinusitis with and without nasal polyps and the authors confirmed that they should be completing the study shortly, however no results were available in time for this review. See Characteristics of ongoing studies.
Risk of bias in included studies
The included studies were all randomised and controlled. Details of the risk of bias for each study can be found in Figure 2. A 'Risk of bias' graph shows our judgements about each risk of bias item presented as percentages across all included studies (Figure 3). In general the reporting of the trials was not of a high quality.

'Risk of bias' summary: review authors' judgements about each risk of bias item for each included study.

'Risk of bias' graph: review authors' judgements about each risk of bias item presented as percentages across all included studies.
Allocation
Sequence generation
Six of the included studies reported that the participants had been randomised to treatment groups but provided no further information on the methods of sequence generation (Alobid 2014; Benitez 2006; Hissaria 2006; Kapucu 2012; Kirtsreesakul 2012; Van Zele 2010). The ratios for randomising into the separate groups were provided for three of the studies: Alobid 2014 and Benitez 2006 randomised participants at a ratio of 3:1 into the intervention and control arms respectively, whereas Kirtsreesakul 2012 randomised at a ratio of 3:2 into the treatment and control arms respectively.
We assessed both of the remaining two studies to be at low risk of bias with respect to randomisation. Ecevit 2015 randomised participants in blocks of eight, whereas Vaidyanathan 2011 used a computer‐generated random allocation sequence to randomise the trial, using block randomisation with a block size of four.
Allocation concealment
Six studies did not provide any information about allocation concealment (Alobid 2014; Benitez 2006; Hissaria 2006; Kapucu 2012; Kirtsreesakul 2012; Van Zele 2010). For three trials the risk of bias is increased as there was no blinding (Alobid 2014; Benitez 2006; Kapucu 2012).
We assessed two studies to be at low risk of allocation concealment bias (Ecevit 2015; Vaidyanathan 2011).
Baseline characteristics
In three studies the baseline characteristics are poorly reported (Alobid 2014; Benitez 2006; Kapucu 2012). The majority of the information in Alobid 2014 relates to the overall cohort and baseline characteristics for each group are not provided for age or gender. Similarly, in Benitez 2006 some characteristics are only presented for the cohort as a whole (e.g. gender, aspirin sensitivity and comorbidity of asthma). In Kapucu 2012, there is a lack of information about the included population prior to treatment.
In addition, some of the studies do not report key information for key potential effect modifiers that would be expected to be reported. Four studies do not provide information about the severity of the nasal polyps in the different groups at the start of the trial (Alobid 2014; Benitez 2006; Kapucu 2012; Kirtsreesakul 2012). Similarly, information about any previous surgery is not presented in three papers (Benitez 2006; Ecevit 2015; Kirtsreesakul 2012).
In Van Zele 2010 there was an imbalance in the number of aspirin‐intolerant patients in the baseline characteristics (oral steroids: 14.3%; placebo: 26.3%; antibiotics: 7.1%).
Blinding
The participants and healthcare professionals in three studies were not blinded to the treatment group (Alobid 2014; Benitez 2006; Kapucu 2012). Since the main outcomes of interest in the review are patient‐reported, we considered the risk of bias for outcome assessments to be high.
Van Zele 2010 states that the study was "double blinded" but provides no information about the dosing schedule of the three arms within the trial (oral steroids, placebo and antibiotics) and what precautions were taken to prevent the participants and healthcare professionals from identifying the treatment arm to which they had been allocated. There was no information about blinding of outcome assessment in the paper.
The remaining four studies were all reported to be blinded and provide good explanations of the methods used to prevent bias from knowing the treatment arm to which participants had been allocated (Ecevit 2015; Hissaria 2006; Kirtsreesakul 2012; Vaidyanathan 2011). However, none of the studies make any comment on the taste of the placebo tablet. Oral steroids are known to have a distinctive bitter taste, which may be recognisable to patients who have previously received steroids, thus compromising the blinding. It is unclear whether the taste of the interventions was matched in these four studies and so we downgraded the risk of bias to 'unclear'.
Incomplete outcome data
We assessed five studies to be at a low risk of attrition bias (Alobid 2014; Ecevit 2015; Hissaria 2006; Kapucu 2012; Kirtsreesakul 2012). One of these studies reported that all the patients completed the trial and were included in the outcomes (Kapucu 2012). Four other studies reported drop‐out rates of less than 5% (Alobid 2014; Hissaria 2006; Ecevit 2015; Kirtsreesakul 2012).
In Benitez 2006, there was no mention of anyone who dropped out of the trial or had to discontinue for any reason. However, it was not stated within the paper how many patients were analysed for each outcome and so we assessed the risk of bias for incomplete outcome data to be unclear. We also assessed Vaidyanathan 2011 to have an unclear risk of attrition bias; the study had a relatively large drop‐out rate (9/60 (15%)), although the reasons for these drop‐outs are well described. The results table gives different numbers of participants included in each analysis, which are closer to the number of patients available rather than patients randomised and it is unclear why there is a discrepancy.
We assessed the risk of attrition bias in Van Zele 2010 as high. Seven of the initial 47 patients dropped out of the study (14.9%) and an intention‐to‐treat analysis was conducted with the last value carried forward. However, all of the patients who dropped out were from the placebo group: 7/19 (36.8%). The report implies that they all dropped out after the treatment stage during follow‐up. This may have had an effect on the overall results and no sensitivity analysis appears to have been completed to identify the impact.
Selective reporting
We assessed Ecevit 2015 and Kirtsreesakul 2012 to be at a low risk of selective reporting bias.
We assessed five studies to have an unclear risk of selective reporting bias (Alobid 2014; Benitez 2006; Kapucu 2012; Vaidyanathan 2011; Van Zele 2010). Despite meeting the inclusion criteria Kapucu 2012 did not report any of the primary or secondary outcomes specified in this review. Two studies reported primary or secondary outcomes (or both) but did not report any information about whether adverse effects were experienced by any participant within the study (Alobid 2014; Benitez 2006). Vaidyanathan 2011 did not report the methods for collecting data for adverse events (other than biological assays). In Van Zele 2010, all outcomes in the methods section have been reported in the full paper, although many of them have been presented graphically, without providing values at key time periods. The data were not reported in a way that is sufficient to be included in the meta‐analysis of this review. We contacted the study authors but further information was not provided.
We assessed Hissaria 2006 to be at high risk of reporting bias; the nasoendoscopy findings were reported inconsistently within the paper using differing criteria that had not been pre‐specified in the methods section. We were concerned that the cut‐off points for reporting could have been chosen after the results were available to make the results look more favourable.
Protocols could be identified for two of the included studies (Vaidyanathan 2011; Van Zele 2010). For Vaidyanathan 2011, no differences were identified between the outcomes at the protocol stage and those reported in the paper. For Van Zele 2010, it was difficult to judge whether there were differences between the protocol and the full paper as the protocol was not very detailed. We noted that the number of participants that the study aimed to recruit was different from the number actually recruited (120 and 48 respectively).
Other potential sources of bias
Use of validated outcome measures
The validation of outcomes was one area that we identified at the start of the review as an aspect that could lead to potential bias. If an instrument is insensitive to measuring differences, this biases the results to no difference. Six of the eight studies did not provide information about the validation of any of the outcomes relevant to this review (Alobid 2014; Benitez 2006; Ecevit 2015; Kapucu 2012; Kirtsreesakul 2012; Van Zele 2010). Furthermore, Van Zele 2010 also failed to provide information about the scale used for measuring symptoms.
Vaidyanathan 2011 reported validation of the health‐related quality of life measure (mini‐RQLQ), although on further investigation it appears that the validation was not completed in a chronic rhinosinusitis population. The validation of other outcomes was not mentioned. Hissaria 2006 provided references to the validation of the health‐related quality of life outcomes (RSOM‐31), although they use a modified version and no information on how this modification impacts the validation was made. For nasoendoscopy outcomes, the procedure to ensure reliability of measurements was well presented.
Funding and conflicts of interest in trials
Three studies did not report information about funding of the trials, or reported that no funding was provided (Ecevit 2015; Hissaria 2006; Kapucu 2012). The remaining five studies reported funding sources (Alobid 2014; Benitez 2006; Kirtsreesakul 2012; Vaidyanathan 2011; Van Zele 2010). None of the studies were explicitly funded by pharmaceutical companies with most of the funding appearing to be from governmental or university grants.
Two studies did not provide information on any of the authors' potential conflicts of interest (Alobid 2014; Benitez 2006), and four studies reported that the authors did not have any conflicts of interest (Ecevit 2015; Kapucu 2012; Kirtsreesakul 2012; Vaidyanathan 2011).
Two studies noted that one or more authors had a potential conflict of interest (Hissaria 2006; Van Zele 2010). Hissaria 2006 reported one of the authors as receiving royalties from a medical device company. Van Zele 2010 reported that one author had received royalties from a medical device company and was a consultant for another company (NeilMed). This author along with two other authors received research grants from external bodies (Garnett Passe and Rodney Williams Foundation, GlaxoSmithKline, Stallergenes, European Union).
Effects of interventions
See also summary of findings Table for the main comparison.
We analysed the pre‐specified primary and secondary outcomes. We included eight trials comprising 474 participants comparing oral steroids with placebo in this review (Alobid 2014; Benitez 2006; Ecevit 2015; Hissaria 2006; Kapucu 2012; Kirtsreesakul 2012; Vaidyanathan 2011; Van Zele 2010), although one of these studies did not include any of the pre‐specified primary or secondary outcomes and so is not included in the results (Kapucu 2012). All of the studies followed up patients until the end of treatment (14 to 21 days).
Three studies (224 participants) also followed up patients in both arms for a further 10 to 26 weeks after treatment (Kirtsreesakul 2012; Vaidyanathan 2011; Van Zele 2010). Kirtsreesakul 2012 and Vaidyanathan 2011 (177 participants) gave patients from both arms of the study intranasal corticosteroids after the end of oral steroid treatment and followed up patients for a further 10 to 26 weeks. Van Zele 2010 (47 participants) did not routinely allow intranasal corticosteroids after treatment with oral steroids but followed up patients for 10 weeks after oral steroid treatment had finished. The treatment of both arms with intranasal steroids, as represented in Kirtsreesakul 2012 and Vaidyanathan 2011, more accurately reflects current clinical practice than not providing any treatment. However, the results for all three of the longer‐term trials are also analysed together and are presented below as three‐ to six‐month results.
Where the range of scales and values for minimal important differences were unclear, we used the standardised mean difference (SMD) as a guide to estimate the effect sizes. As suggested in the Cochrane Handbook for Systematic Reviews of Interventions (Handbook 2011), we used standard rules of thumb in the interpretation of effect sizes (SMD, or Cohen's effect size of < 0.41 = small, 0.40 to 0.70 = moderate, > 0.70 = large) (Cohen 1988).
Primary efficacy outcomes
1. Health‐related quality of life, using disease‐specific health‐related quality of life scores
After treatment (two to three weeks)
Two studies (98 participants) measured 'health‐related quality of life' using a disease‐specific instrument (Hissaria 2006; Vaidyanathan 2011). However, these are not fully validated instruments for patients with chronic rhinosinusitis:
-
Hissaria 2006 used the RSOM‐31 questionnaire (a validated instrument) but modified the scoring system, using only the severity parameter but not the importance parameter. The study does not report the possible range of values that could be obtained.
-
Vaidyanathan 2011 used the mini‐Rhinoconjunctivitis Quality of Life Questionnaire (mRQLQ). This questionnaire was developed to measure the quality of life for people with seasonal or perennial rhinoconjunctivitis, and the validity for chronic rhinosinusitis patients is unknown. It has at least three to four items (out of 14) that are related to allergy but not applicable to patients with chronic rhinosinusitis. In addition, it does not include any items on sinonasal or facial pain and sense of smell, which are symptoms included in the EPOS 2012 diagnostic criteria.
Therefore, we have not pooled the results of these studies but they are plotted in Figure 4. The standardised mean difference (SMD) observed in Hissaria 2006 was ‐1.24 (95% confidence interval (CI) ‐1.92 to ‐0.56; 40 participants), whereas the SMD in Vaidyanathan 2011 was ‐0.79 (95% CI ‐1.32 to ‐0.25; 58 participants) (Analysis 1.1). We considered both of these results to be large effect sizes.

Forest plot of comparison: 1 Oral steroids versus no treatment/placebo, outcome: 1.1 Disease‐specific health‐related quality of life ‐ no pooling (2 to 3 weeks).
Medium‐term (three to six months)
Vaidyanathan 2011 also presented results for the mini‐RQLQ data at 26 weeks. The scale is not clear within the paper. The SMD was ‐0.59 (95% CI ‐1.16 to ‐0.02; 50 participants; one study) (Analysis 1.2). We considered this result to be a moderate effect size.
2. Disease severity, as measured by patient‐reported symptom score
None of the papers provided results for a patient‐reported total symptom score validated in a chronic rhinosinusitis population. Where available we combined the results for the individual symptoms into a total score according to the methods section (see Dealing with missing data). In order to be included in the analysis the results needed to provide enough data to meet the EPOS 2012 diagnostic criteria (Appendix 3), which requires at least two symptoms to be present, one of which must be nasal blockage/obstruction/congestion or nasal discharge (anterior/posterior nasal drip), with the other possible symptoms being facial pressure/pain, loss of sense of smell (adults) or cough (children).
Four studies (232 participants) reported this outcome (Ecevit 2015; Hissaria 2006; Kirtsreesakul 2012; Vaidyanathan 2011), but all used different measurements and presented results in different ways.
-
Ecevit 2015 (22 participants) asked patients to report individual symptoms on a visual analogue scale (VAS) (0 to 10; 0 = no symptoms). Scores were given for the four symptoms included in the EPOS 2012 definition (nasal obstruction, nasal discharge, sense of smell and pressure over the sinuses), which were combined to give a total mean final score with a possible range of 0 to 40.
-
Hissaria 2006 (40 participants) measured symptoms using the nasal subscale of the RSOM‐31, which measures six symptoms: congestion, rhinorrhoea, sneezing, hyposmia, postnasal discharge and thick nasal debris, all scored on a one‐ to five‐point VAS (1 = least severe, 5 = most severe). To obtain a total value, the authors averaged the scores across all domains and presented them graphically in the paper. The combined results should, therefore, have been on a scale of one to five but the results clearly show that one of the data points on the graph is less than 1. We contacted the study authors to provide further information but they did not respond. The nasal subscale of the RSOM‐31 represents three of the symptoms of the EPOS 2012 criteria. Facial pain/pressure was not reported.
-
Kirtsreesakul 2012 (114 participants) asked patients to report individual symptoms on a seven‐point Likert scale (0 to 6; 0 = no symptoms, 6 = most severe). The results for each symptom were presented graphically in the paper as percentage change from baseline. The results for the four symptoms representing the EPOS 2012 criteria (blocked nose, rhinorrhoea, hyposmia and sinonasal pain) were averaged to create an average change from baseline score.
-
Vaidyanathan 2011 (57 participants) used the "total nasal symptoms score", which is calculated from the sum of scores for nasal discharge, nasal blockage, nasal itch and sneezing, each measured on a 0‐ to 3‐point scale (total range 0 to 12; 0 = least affected, 12 = most affected). The results include two of the symptoms listed in the EPOS 2012 criteria (nasal blockage and nasal discharge). Data for facial pain/pressure or loss of sense of smell were not recorded. The validation status of the scale is unknown and it is likely to be more specific for rhinitis symptoms.
The results were presented in two different ways within the papers, either as 'mean final value' (Ecevit 2015; Hissaria 2006; Vaidyanathan 2011), or as 'change from baseline' (Kirtsreesakul 2012). Results were only presented after treatment (at two to three weeks) in both studies (Ecevit 2015; Hissaria 2006), and also as medium‐term results (three to six months after treatment) in two studies (Kirtsreesakul 2012; Vaidyanathan 2011).
We considered whether the results using different scales could be pooled, but due to the differences in the individual symptoms included in the scale, we did not consider pooling to be appropriate. We plotted all results separately using SMD on the same forest plot but did not present any totals (see Figure 5; Analysis 1.3).

Forest plot of comparison: 1 Oral steroids versus no treatment/placebo, outcome: 1.3 Disease severity (patient‐reported total symptom score).
After treatment (two to three weeks)
Mean final values
Three studies, with a total of 119 participants, presented results as mean final values immediately after treatment (14 to 17 days) (Ecevit 2015; Hissaria 2006; Vaidyanathan 2011). All of the results showed an improvement in the combined symptoms severity score for oral steroids compared with placebo at the end of treatment, with the largest effect being observed in Ecevit 2015 (SMD ‐2.84, 95% CI ‐4.08 to ‐1.59, 22 participants), followed by Hissaria 2006 (SMD ‐1.59, 95% CI ‐2.31 to ‐0.87, 40 participants) and Vaidyanathan 2011 (SMD ‐0.79, 95% CI ‐1.33 to ‐0.25, 57 participants) (Analysis 1.3). All of these SMD values corresponded to large effect sizes.
We observed a variation in the results for symptom severity between the trials. This may have been due to:
-
differences in the outcome measurement being used in each scale ‐ different individual symptoms were measured in each case and the validity and sensitivity of the scales to measure this outcome are unknown;
-
differences in the included populations within the studies ‐ participants in Ecevit 2015 were more severely affected at baseline according to the diagnostic criteria;
-
differences in the interventions provided ‐ Ecevit 2015 provided oral steroids at a higher dose than Hissaria 2006 or Vaidyanathan 2011.
Change from baseline
Kirtsreesakul 2012 (114 participants) showed a larger average percentage improvement in total symptom score for the oral steroids group compared with placebo at the end of treatment (14 days) (SMD ‐2.28, 95% CI ‐2.76 to ‐1.80) (Analysis 1.3). This corresponds to a large effect size.
Medium‐term (three to six months)
Mean final value
Vaidyanathan 2011 (51 participants) provided results at 26 weeks after the end of oral steroid treatment, where both arms of the trial had been given intranasal steroids after 21 days (when the short course of oral steroids ended). The result for total nasal symptom score was SMD ‐0.43 (95% CI ‐0.99 to 0.12) (Analysis 1.3). This corresponds to a moderate effect size.
Change from baseline
Kirtsreesakul 2012 (114 participants) provided data that allowed the calculation of three‐ to six‐month results for percentage change in total symptoms score from baseline, 10 weeks after completing the oral steroid treatment, where both arms of the trial had been given intranasal steroid therapy from two weeks (i.e. at the end of the oral steroid treatment period). The result for percentage change from baseline was SMD ‐0.22 (95% CI ‐0.59 to 0.15) (Analysis 1.3). This corresponds to a small effect size.
Individual symptom scores
Data for patient‐reported individual symptoms were presented in three papers (Ecevit 2015; Kirtsreesakul 2012; Vaidyanathan 2011). These papers used different measurement scales for the rating of symptoms.
-
Ecevit 2015 (22 participants) asked participants to rank symptoms on a visual analogue scale of 0 to 10 (0 = no complaint, 10 = most annoying). The paper presented the final mean values.
-
Kirtsreesakul 2012 (114 participants) asked participants to rate symptoms using a seven‐point Likert scale (0 to 6, 0 = no symptoms, 6 = severe symptoms). The paper presented results graphically in figures for percentage improvement from baseline for each symptom. We extracted the data from graphs. Data were presented for after treatment (two weeks) and also at 12 weeks after both groups had received intranasal steroids.
-
In Vaidyanathan 2011 the only individual symptom for which data were extractable was hyposmia, which was measured by patients on a 0 to 100 mm hyposmia visual analogue scale. It is not clearly described within the paper but it is inferred from the discussion that a higher score relates to greater severity of smell loss.
Although Alobid 2014 measured loss of sense of smell using the Barcelona Smell Test‐24 score, the results were presented for all patients, control group, patients with asthma and patients without asthma and so it was not possible to include these results.
Nasal obstruction/congestion/blockage
Final value
One study (22 participants) presented data for the mean final value of the nasal obstruction symptom score (measured on a 0 to 10 VAS, 0 = no nasal blockage) for oral steroids compared with placebo at the end of the 17‐day treatment course (mean difference (MD) ‐4.50, 95% CI ‐6.42 to ‐2.58) (Ecevit 2015) (Analysis 1.4).
Change from baseline
One study (114 participants) presented data for percentage change in nasal blockage (measured on a seven‐point Likert scale, 0 = no symptoms) for oral steroid treatment compared with placebo after a 14‐day treatment course (MD ‐38.02, 95% CI ‐48.16 to ‐27.88; 114 participants) and at three months after oral steroid treatment had finished when all patients in both study arms had received intranasal steroids for 10 weeks (MD 0.90, 95% CI ‐8.97 to 10.77) (Kirtsreesakul 2012) (Analysis 1.5).
Nasal discharge
Final value
One study (22 participants) presented data for the mean final value of nasal discharge symptom score (measured on a 0 to 10 VAS, 0 = no nasal discharge) for oral steroids compared with placebo at the end of a 17‐day treatment course (MD ‐4.70, 95% CI ‐6.79 to ‐2.61) (Ecevit 2015) (Analysis 1.6).
Change from baseline
One study (114 participants) presented data for percentage change in rhinorrhoea (measured on a seven‐point Likert scale, 0 = no symptoms) for oral steroid treatment compared with placebo after a 14‐day treatment course (MD ‐55.57, 95% CI ‐69.23 to ‐41.91) and at three months after oral steroid treatment had finished when all patients in both study arms had received intranasal steroids for 10 weeks (MD ‐1.83, 95% CI ‐13.46 to 9.81; 114 participants) (Kirtsreesakul 2012) (Analysis 1.7). Rhinorrhoea was used in preference to the individual symptom of postnasal drip, which was also reported in the paper.
Facial pain/pressure
Final value
One study (22 participants) presented data for the mean final value of facial pressure symptom score (measured on a 0 to 10 VAS, 0 = no facial pressure) for oral steroids compared with placebo at the end of a 17‐day treatment course (MD ‐3.70, 95% CI ‐6.02 to ‐1.38) (Ecevit 2015) (Analysis 1.8). The symptom of facial pressure was used in preference to the individual symptom of headache.
Change from baseline
One study (114 participants) presented data for percentage change in sinonasal pain (measured on a seven‐point Likert scale, 0 = no symptoms) for oral steroid treatment compared with placebo after a 14‐day treatment course (MD ‐30.66, 95% CI ‐46.28 to ‐15.04) and at three months after oral steroid treatment had finished when all patients in both study arms had received intranasal steroids for 10 weeks (MD 0.60, 95% CI ‐12.56 to 13.76) (Kirtsreesakul 2012) (Analysis 1.9). Rhinorrhoea was used in preference to the individual symptom of postnasal drip, which was also reported in the paper.
Loss of sense of smell
Final value
Two studies (80 participants) presented data for the mean final value of loss of sense of smell (Ecevit 2015; Vaidyanathan 2011). Ecevit 2015 measured smell on a 0 to 10 scale (0 = no loss of sense of smell) and Vaidyanathan 2011 measured this on a 0 to 100 mm hyposmia VAS (0 = no loss of sense of smell), which we subsequently scaled to represent a 0 to 10 scale. The result for oral steroids compared with placebo at the end of treatment (14 to 17 days) was MD ‐2.79 (95% CI ‐4.11 to ‐1.47). Vaidyanathan 2011 also presented results 26 weeks after the end of treatment when patients in both arms had received intranasal steroids (MD ‐1.20, 95% CI ‐2.68 to 0.28) (Analysis 1.10).
Change from baseline
One study (114 participants) presented data for percentage change in hyposmia (measured on a seven‐point Likert scale, 0 = no symptoms) for oral steroid treatment compared with placebo after a 14‐day treatment course (MD ‐44.35, 95% CI ‐57.31 to ‐31.39) and at three months after oral steroid treatment had finished when all patients in both study arms had received intranasal steroids for 10 weeks (MD ‐15.05, 95% CI ‐29.69 to ‐0.41) (Kirtsreesakul 2012) (Analysis 1.11).
None of the results for individual symptoms are presented in the GRADE 'Summary of findings' table as we considered it to be re‐presenting information that was already included in the disease severity score and, as such, not considered to be a priority outcome.
3. Significant adverse effect: mood or behavioural disturbances
One study (40 participants) reported mood disturbances as an adverse event (Hissaria 2006). This study found that there were no differences between the oral steroid and the placebo group after the two‐week treatment course (5/20 oral steroids, 0/20 placebo) (risk ratio (RR) 2.50, 95% CI 0.55 to 11.41) (Analysis 1.12).
Secondary efficacy outcomes
1. Health‐related quality of life, using generic quality of life scores, such as the SF‐36, EQ‐5D and other well‐validated instruments
None of the studies reported this as an outcome.
2. Other adverse effects: gastrointestinal disturbances
We analysed together the short‐term 'after treatment' results (two to three weeks) and the medium‐term 'three to six months' results for gastrointestinal disturbances. Three studies (187 participants) reported gastrointestinal disturbances as an adverse event (Hissaria 2006; Kirtsreesakul 2012; Van Zele 2010). Hissaria 2006 reported adverse events after the treatment course had ended (two weeks), whereas Kirtsreesakul 2012 and Van Zele 2010 reported adverse events at 12 weeks. We meta‐analysed the results and there was an increase in gastrointestinal disturbance in the oral steroid group compared with placebo (15/101, 4/86) (RR 3.45, 95% CI 1.11 to 10.78) (Analysis 1.13).
3. Other adverse effects: insomnia
Three studies (187 participants) reported insomnia as an adverse event (Hissaria 2006; Kirtsreesakul 2012; Van Zele 2010). Hissaria 2006 reported adverse events after the treatment course had ended (two weeks), whereas Kirtsreesakul 2012 and Van Zele 2010 reported adverse events at 12 weeks. We meta‐analysed the results and there was an increase in insomnia in the oral steroid group compared with placebo (10/101, 2/86) (RR 3.63, 95% CI 1.10 to 11.95) (Analysis 1.14).
4. Adverse effects: osteoporosis
None of the studies reported this as an outcome.
5. Endoscopic score (polyps size for chronic rhinosinusitis with polyps population, or overall endoscopy score for chronic rhinosinusitis without polyps population)
Five studies measured nasal polyps on a zero‐ to three‐point scale, although the wording used to describe each of the categories is not consistent between the studies (Appendix 4) (Alobid 2014; Benitez 2006; Ecevit 2015; Kirtsreesakul 2012; Vaidyanathan 2011). After reviewing the scales we agreed to analyse the results of the studies together as we thought the definitions between the categories to be roughly equivalent.
After treatment (two to three weeks)
Final value
Four studies (253 patients) reported the total nasal polyp score at the end of treatment (Alobid 2014;Benitez 2006; Ecevit 2015; Vaidyanathan 2011). All of the studies used the four‐point (0 to 3) scale for the measurement of polyps severity. Vaidyanathan 2011 summed the scores for each nostril together to give a total scale of 0 to 6. We have divided these results by two to provide the average polyp score for both nostrils on a scale of 0 to 3, to be consistent with the other studies. It is unclear in the other three papers whether the result refers to the polyp grade in the worst affected nostril or an average of the polyp grade by nostril (Alobid 2014; Benitez 2006; Ecevit 2015). The results showed that there was a reduction in nasal polyp score for oral steroids compared with placebo/no treatment at two weeks (MD ‐0.76, 95% CI ‐0.92 to ‐0.61, 253 participants) (Analysis 1.15). This observed mean difference corresponds to large effect size (SMD of ‐1.21).
There is moderate heterogeneity within the mean final nasal polyp size results as presented above (heterogeneity: Chi² = 7.20, df = 3 (P value = 0.07); I² = 58%). When Vaidyanathan 2011 is removed from the analysis, the heterogeneity is reduced. This may have been due to differences in the methods of assessing the nasal polyps.
Change from baseline
Van Zele 2010 measured the nasal polyps score on a five‐point scale (0 to 4), which was used for each nostril and then summed to get an overall nasal polyp score. The paper presented the results graphically as change from baseline polyps score, however data on the variance of the point estimates were not available for this study and it was not possible to impute them from other studies due to differences in the scale, so it was not included in the meta‐analysis.
Two studies (146 patients) reported the percentage improvement from baseline values at the end of treatment (Hissaria 2006; Kirtsreesakul 2012). Kirtsreesakul 2012 measured the polyps grade using a 0 to 3 scale, whereas Hissaria 2006 reported the estimated percentage reduction in polyp size using pairs of photographs taken pre‐ and post‐treatment. As these ways of measuring polyps were different, we analysed the data using standardised mean difference to report the results. The results showed that there was a larger change from baseline in the size of nasal polyps in the oral steroids group compared with the control group after treatment (two to three weeks) (SMD ‐1.77, 95% CI ‐2.16 to ‐1.38). This corresponds to a large effect size (Analysis 1.16).
Medium‐term (three to six months)
Final value
One study (50 patients) provided results for final mean value of nasal polyps score for oral steroids compared with placebo, 26 weeks after the initial treatment period with both study arms receiving treatment with intranasal steroids (Vaidyanathan 2011). The mean difference in nasal polyps at 26 weeks was ‐0.25 (95% CI ‐0.62 to 0.12, 50 participants) on a 0‐ to 3‐point scale (Analysis 1.15). The observed mean difference corresponds to a small effect size (SMD of 0.36).
Change from baseline
One study measured results at three months from the start of the trial when all patients in both study arms had received intranasal steroids for 10 weeks (Kirtsreesakul 2012). The results for the oral steroid arm compared to the placebo arm were SMD ‐0.52 (95% CI ‐0.90 to ‐0.14) (Analysis 1.16). This corresponds to a moderate effect size.
The results for endoscopic score are not presented in the 'Summary of findings' table as we did not consider it to be a priority outcome.
6. Computerised tomography (CT) scan score
None of the studies reported this as an outcome.
Discussion
Summary of main results
This review includes eight trials comparing the effectiveness of short‐course oral steroids with placebo or no treatment in adults with chronic rhinosinusitis with nasal polyps (summary of findings Table for the main comparison).
There was low quality evidence of an improvement in disease‐specific health‐related quality of life after treatment (two to three weeks) with oral corticosteroids compared with placebo or no treatment. There is a concern that the magnitude of the improvement is not sustained.
There was low quality evidence of an improvement in disease severity (lower symptom score) in the oral steroids group compared with the control group at the end of the steroid treatment (two to three weeks). At three months, when all patients had received intranasal steroids after the treatment period had ended, there was low quality evidence that there was no difference in the change from baseline in symptom severity between the oral steroids and control groups.
There was low quality evidence of an increase in insomnia and gastrointestinal disturbances in the oral steroids group compared with the control group. It is unclear whether there is a difference between the intervention and control groups for mood disturbances (low quality evidence). None of the studies provided data for osteoporosis.
Immediately after treatment (two to three weeks), there was evidence (high risk of bias) of an improvement in nasal polyp score for the oral steroids group compared with the control group. Results at three to six months after the end of oral steroid treatment indicate that the magnitude of the difference between the groups may not be sustained (high risk of bias).
No studies reported generic health‐related quality of life or CT scan score as outcomes.
Overall completeness and applicability of evidence
All of the included studies only included adults with nasal polyps (Alobid 2014; Benitez 2006; Ecevit 2015; Hissaria 2006; Kapucu 2012; Kirtsreesakul 2012; Vaidyanathan 2011; Van Zele 2010). This limits the applicability of the evidence to both adults without nasal polyps and the paediatric population with chronic rhinosinusitis. Two of the three ongoing studies that we identified include patients with chronic rhinosinusitis who do not have nasal polyps (NCT00841802; NCT02367118). NCT00841802 only includes patients with chronic rhinosinusitis without nasal polyps, whereas the other study, NCT02367118, includes patients with and without nasal polyps,. Evidence for oral steroids in patients with chronic rhinosinusitis without polyps may therefore be available for the next update of this review.
The doses of oral steroids used in the trials differed. Using a steroid equivalence converter (http://www.medcalc.com/steroid.html) for the three oral steroid drugs in the included trials (prednisone, prednisolone and methylprednisolone) to convert all doses into a reference drug of prednisolone, the dose of drug ranged from 25 mg/day (Vaidyanathan 2011) to 60 mg/day (Ecevit 2015). In the analysis, we analysed all of the doses together. This excludes the Kapucu 2012 study, for which no outcomes are available, which calculated the dosage based on the weight of participants at 1 mg/kg/day methylprednisolone; for a weight of 84 kg (average weight of a UK man) this would be equivalent to 105 mg/day of prednisolone.
The primary outcomes were often either not reported or very poorly reported within the papers. There was considerable inconsistency between the papers with regards to the instruments used and how the results were reported (mean final value or change from baseline), making the analysis of results difficult.
There was a lack of consistent information on disease‐related symptom severity. There were no studies that used a validated tool to report this as an outcome. Of the four studies that attempted to reported this outcome (Ecevit 2015; Hissaria 2006; Kirtsreesakul 2012; Vaidyanathan 2011), only two, Ecevit 2015 and Kirtsreesakul 2012, presented data for all four of the symptoms required to diagnose chronic rhinosinusitis using the EPOS 2012 criteria (Appendix 3). The lack of reporting of symptoms, particularly of facial pressure/pain and hyposmia, may have been due to all of the study populations being composed entirely of people with nasal polyps. The studies usually looked for changes in symptoms associated with nasal polyps (such as nasal discharge and obstruction) rather than more general chronic rhinosinusitis symptoms. The facial pain/pressure symptom was not often studied.
The two studies that reported a 'symptom severity score' without providing information on the individual elements included used scales that included items that may have been more relevant to rhinitis outcomes (Hissaria 2006; Vaidyanathan 2011), which limits the applicability of these results to the chronic rhinosinusitis population. Vaidyanathan 2011 used 'total nasal symptoms' to report symptom severity, which covers five domains: two are relevant to chronic rhinosinusitis symptoms (nasal congestion and runny nose), two domains are more specific to rhinitis symptoms (nasal itching and sneezing) and one domain relates to the impact of the symptoms on sleeping. Similarly, Hissaria 2006 used the nasal subscale of the RSOM‐31 to look at 'symptom severity'. This subscale measures congestion, rhinorrhoea, sneezing, hyposmia, postnasal discharge and thick nasal debris, of which some elements are more specific to rhinitis symptoms. These studies may change the magnitude of the effect.
The methods used for assessing polyps were poorly reported in the papers and the assessment of polyp bulk endoscopically was the subject of several scoring systems (Appendix 4). Unless examinations are videoed and assessed centrally, these are somewhat subjective, even if previously validated, and should be seen as a guide to responsiveness rather than an absolute measure, as these studies did not report intra‐ and inter‐reporter reliability. There could be potential for bias in the way the scores have been reported, particularly in studies without blinding.
The information about adverse events was incomplete. Only three of eight studies included clear information about adverse events (Hissaria 2006; Vaidyanathan 2011; Van Zele 2010). This is a trend repeated in other conditions and reliable data for adverse events associated with short‐term steroid use have not been well recorded in the literature (Burton 2008). Additionally, there was a lack of long‐term data from the trials, which could identify longer‐term effects of oral steroids such as osteoporosis.
There was also a lack of information on other longer‐term outcomes. Five of the eight studies only reported the results for both arms of the trials at the end of treatment (Alobid 2014; Benitez 2006; Ecevit 2015; Hissaria 2006; Kapucu 2012). Of the three studies that provided longer‐term results, two reported outcomes at three months (Kirtsreesakul 2012; Van Zele 2010), and one provided six‐month results (Vaidyanathan 2011).
Quality of the evidence
The quality of the evidence for all of the outcomes assessed was low, including for the adverse events outcomes that were reported.
The quality of the evidence was affected by a number of issues: methodological limitations, length of follow‐up, validation of outcome instruments and the size of the studies.
The studies were generally poorly reported and information about randomisation, allocation concealment and blinding was unclear in the majority. Five of the trials only followed up patients until the end of oral steroid treatment (two to three weeks), which limits the applicability of the evidence for the longer‐term outcomes. Where longer‐term outcomes were presented (three to six months) it was often found that the initial results were not sustained.
Another issue is the lack of use of validated instruments. Many studies did not use validated patient‐reported outcome measures and some used instruments that were validated for other populations (e.g. rhinitis patients). A 'validated instrument' is no longer valid when used outside the population it was intended for, as the items being used may no longer be relevant and important areas for chronic rhinosinusitis patients may not be covered. We also downgraded the disease severity outcome whenever an overall validated disease severity score was not reported and imputations had to be made to calculate total symptom scores (see Dealing with missing data).
The size of the studies included in this review was generally small with an average sample size of 60 participants (30 in each arm). This limits how much confidence can be placed in the results.
Potential biases in the review process
What defined a 'short course' of oral steroids was an issue that we discussed at great length during the development of the protocol for this review (Chong 2015). We finally agreed that up to a 21‐day course should be considered to be a short course, but there were some opinions that the maximum duration should be 14 days. Limiting the evidence to 14 days would have excluded two studies (Ecevit 2015; Van Zele 2010), and possibly a further study where the duration is unclear and based on weight rather than time (Kapucu 2012). As there were only a small number of papers for each outcome it is not possible to evaluate the impact of this decision.
The validation of outcome measures was a potential bias that we identified at the protocol stage as something that could affect the validity of the results. Many of the studies did not use patient‐reported symptom scoring scales that have been appropriately validated. The lack of validated scores means that we often have to make judgements based on the face validity of the scale, rather than having reliable validity data. For example, in Vaidyanathan 2011, health‐related quality of life was measured using a measure that was validated in people with seasonal or perennial allergic rhinitis but not in people with chronic rhinosinusitis, the mini‐Rhinoconjunctivitis Quality of Life Questionnaire (RQLQ). This instrument has 14 questions covering five domains: activity limitation, practical problems, nose symptoms, eye symptoms and non‐nose/eye symptoms, with a focus of eye and nose symptoms related to allergy. Similarly, many of other studies also used instruments that were not validated in people with chronic rhinosinusitis to measure symptom severity.
The lack of use of validated instruments to measure patient‐important outcomes, such as the impact on quality of life and disease severity, is the probably the single most important issue that hampers the ability to meta‐analyse results or to compare results between studies. Validated disease‐specific questionnaires exist and future trials would benefit from including these as primary outcome measures. Recent preliminary work in the UK has underlined this and identified the need to establish a core outcome set for rhinosinusitis (Hopkins 2016).
As there was a lack of outcomes reported using validated measures, in order to enable some comparison between studies and reviews (Chong 2016a; Chong 2016b; Chong 2016c; Head 2016a; Head 2016b), we took the decision to combine the scores for individual symptoms to create a total symptoms score. The methods and limitations are described in the Methods section (Dealing with missing data). The symptoms included were based on the EPOS 2012 diagnostic criteria. However, this score was not a validated measure and as there is no evidence on the correlation coefficient between symptoms, the calculation could not account for it. This may have had an effect on the magnitude of the effect size when interpreted as a standardised mean difference due to the potentially higher or lower standard deviations but not in mean differences (MD) observed. To account for the lack of validated scales used and the lack of validated methods to sum the scores, we downgraded all the disease severity outcomes for lack of use of validated scales whenever this occurred.
Another potential bias in the review process was that many of the data for the included studies were presented in the papers in graphs or charts. Where this was the case, we contacted the study authors to try to obtain more precise data, however none of the authors provided additional data. We therefore extracted the data from the paper using an online programme (http://arohatgi.info/WebPlotDigitizer/app/). There will inevitably be a degree of error in using these data, both from inaccuracies during the printing process and the process used to collect the data. We carefully considered the amount of any additional transformation of the data where they had been interpreted from graphs (such as combining individual symptoms into total scores) to try to minimise additional errors.
Agreements and disagreements with other studies or reviews
The current review updates a previous Cochrane review (Martinez‐Devesa 2011), and it increases the scope of the review to include patients both with and without nasal polyps.
The previous Cochrane review included three studies (Alobid 2006 ‐ reported in this review as Benitez 2006; Hissaria 2006; Van Zele 2010), and referenced one ongoing study. We included all four of these studies in this updated review (including the ongoing study, which has now been published in full ‐ Vaidyanathan 2011). After communication with the study author we determined that Alobid 2006 partially reported on participants in Benitez 2006 and the author recommended that Benitez 2006 was the best paper to use. The previous review concluded that "the limited number of trials of moderate to poor methodological quality showed a short‐term improvement with a short (two to four‐week) and variable dose course of oral steroids in the treatment of nasal polyps." Furthermore, they highlighted the lack of long‐term data preventing any conclusions about a sustained effect of this treatment in the management of nasal polyps. The current review presents additional evidence for the short‐term effects, although the conclusion that there is a short‐term improvement after a short course of oral steroids is still valid. In addition, this review adds three studies that reported results at three to six months (Kirtsreesakul 2012; Vaidyanathan 2011; Van Zele 2010). The results at three to six months show that the magnitude of improvement is not sustained after the oral steroid treatment period.
We changed the inclusion criteria with regards to previous surgery from the previous review to include studies where patients had surgery within six weeks of the start of the trial, compared with three months for the previous review. This did not increase the number of included studies. Some of the studies specifically investigated the use of oral steroids pre‐operatively to improve surgical field conditions during surgery (Ecevit 2015; Sieskiewicz 2006). We included these studies if the treatment duration was equivalent to the other studies included and any of the pre‐specified outcomes were measured prior to surgery (Ecevit 2015). For one study the treatment course was only five days and the outcomes were specifically related to surgical field conditions, and so we excluded this study (Sieskiewicz 2006).
The EPOS 2012 document splits the chronic rhinosinusitis population into those with and without nasal polyps. For the population without nasal polyps we identified only one case series with information about adverse events extrapolated from the chronic rhinosinusitis with nasal polyps population. The recommendation, based on very weak evidence, within the EPOS document for chronic rhinosinusitis without nasal polyps (CRSsNP) was that "systemic corticosteroids benefit CRSsNP". For the chronic rhinosinusitis with nasal polyps (CRSwNP) population, the EPOS document uses the three studies included in the previous Cochrane review (Alobid 2006 ‐ reported in this study as Benitez 2006; Hissaria 2006; Van Zele 2010) and adds an additional three studies/four papers (Benitez 2006; Vaidyanathan 2011; Martinez‐Anton 2008 ‐ reported in this review as Benitez 2006; Rupa 2010). Vaidyanathan 2011 was also included in this review. After communication with the study author we confirmed that Benitez 2006, Alobid 2006 and Martinez‐Anton 2008 all contained subsets of participants from the same trial and therefore some patients were presented in the analysis of all three trials. The author also suggested that Benitez 2006 was the best paper to use as the most complete information for the trial and this is what is included in this Cochrane review. We excluded Rupa 2010 from this review as it reported on a population that was out of scope for the review (allergic fungal rhinosinusitis). The EPOS 2012 document concludes, based on strong evidence, that "Systemic corticosteroids benefit CRSwNP but the effects are time limited post therapy".
As part of this suite of Cochrane reviews on the interventions for chronic rhinosinusitis, a review on the use of short‐course oral steroids as an adjunct has been published (Head 2016a). Two studies identified in that review used oral steroids as an adjunct treatment to either intranasal steroids (Bülbül 2013), or antibiotics (Ozturk 2011). The trials were small, low quality and did not report many of the pre‐specified outcomes. There was not enough evidence to support or oppose the use of oral steroids as an adjunct to other treatments for chronic rhinosinusitis.
As the included studies did not report the incidence of adverse events and the risk of side effects may vary according to the condition that they are used to treat, it is important to consider data from similar conditions where possible. A recent review of systemic steroids in acute rhinosinusitis identified five trials including 1193 participants, receiving either oral steroids (prednisolone at dosages ranging from 24 mg to 80 mg for three to seven days) or placebo, where adverse events were reported (Venekamp 2014; Venekamp 2015). There was no difference between the active or control arms in terms of the risk of adverse events, with respect to mild or severe events, or the risk of discontinuation of treatment.
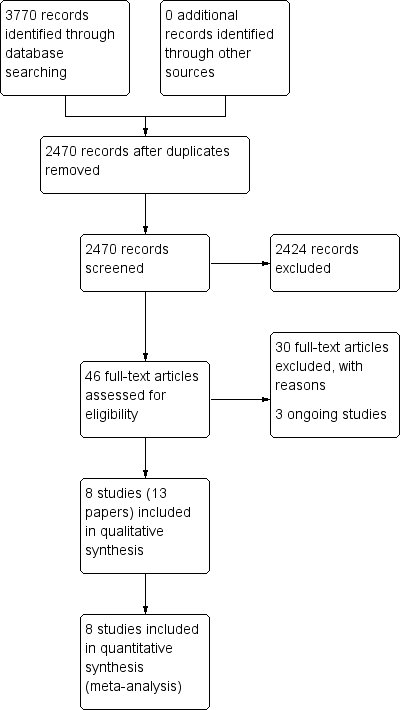
Process for sifting search results and selecting studies for inclusion.

'Risk of bias' summary: review authors' judgements about each risk of bias item for each included study.

'Risk of bias' graph: review authors' judgements about each risk of bias item presented as percentages across all included studies.

Forest plot of comparison: 1 Oral steroids versus no treatment/placebo, outcome: 1.1 Disease‐specific health‐related quality of life ‐ no pooling (2 to 3 weeks).

Forest plot of comparison: 1 Oral steroids versus no treatment/placebo, outcome: 1.3 Disease severity (patient‐reported total symptom score).

Comparison 1 Oral steroids versus no treatment/placebo, Outcome 1 Disease‐specific health‐related quality of life ‐ no pooling (2 to 3 weeks).

Comparison 1 Oral steroids versus no treatment/placebo, Outcome 2 Disease‐specific health‐related quality of life ‐ RQLQ (3 to 6 months).

Comparison 1 Oral steroids versus no treatment/placebo, Outcome 3 Disease severity (patient‐reported total symptom score).
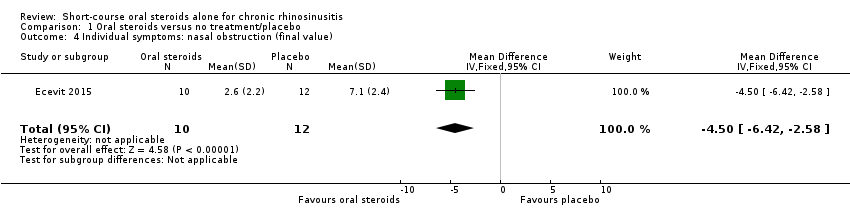
Comparison 1 Oral steroids versus no treatment/placebo, Outcome 4 Individual symptoms: nasal obstruction (final value).

Comparison 1 Oral steroids versus no treatment/placebo, Outcome 5 Individual symptoms: nasal obstruction (change from baseline).

Comparison 1 Oral steroids versus no treatment/placebo, Outcome 6 Individual symptoms: nasal discharge (final value).
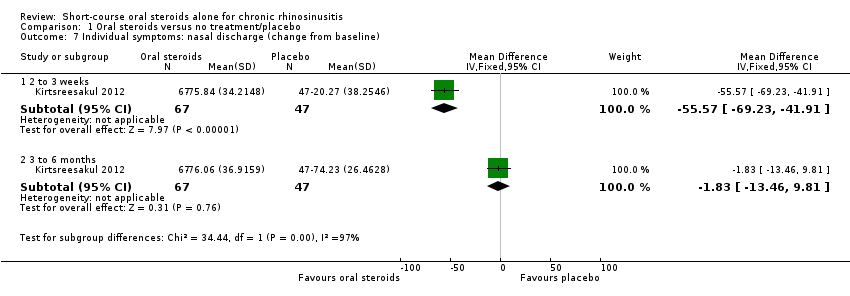
Comparison 1 Oral steroids versus no treatment/placebo, Outcome 7 Individual symptoms: nasal discharge (change from baseline).

Comparison 1 Oral steroids versus no treatment/placebo, Outcome 8 Individual symptoms: facial pressure (final value).

Comparison 1 Oral steroids versus no treatment/placebo, Outcome 9 Individual symptoms: facial pressure (change from baseline).
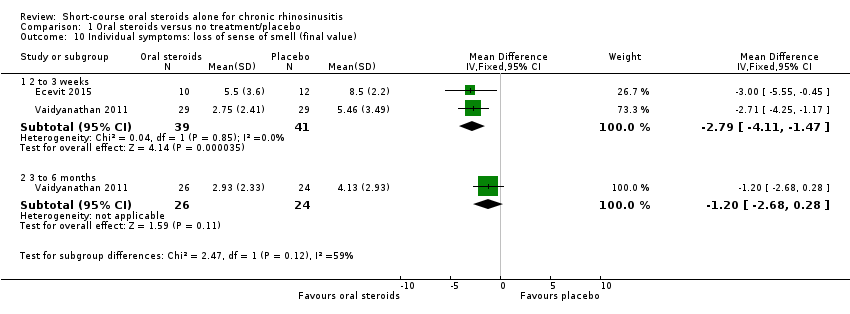
Comparison 1 Oral steroids versus no treatment/placebo, Outcome 10 Individual symptoms: loss of sense of smell (final value).
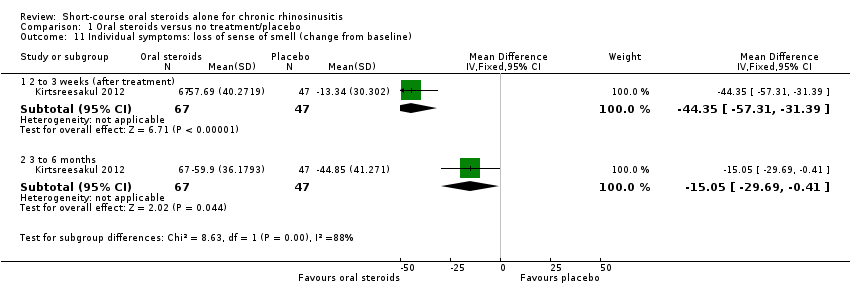
Comparison 1 Oral steroids versus no treatment/placebo, Outcome 11 Individual symptoms: loss of sense of smell (change from baseline).
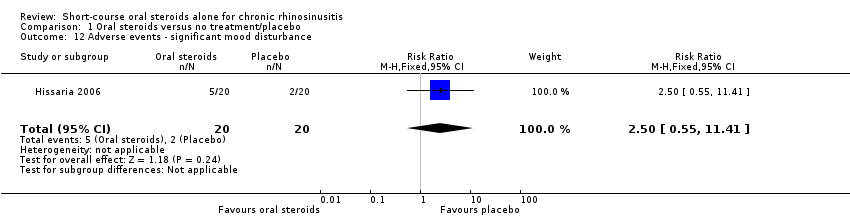
Comparison 1 Oral steroids versus no treatment/placebo, Outcome 12 Adverse events ‐ significant mood disturbance.
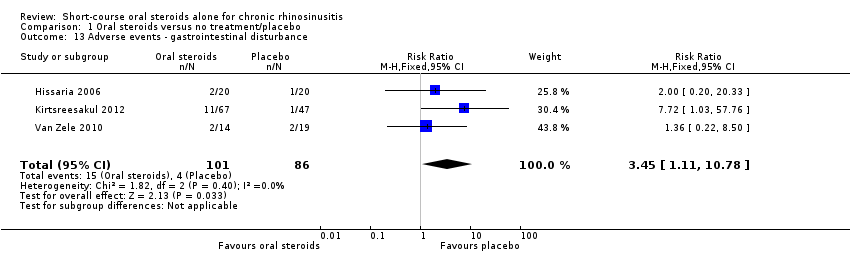
Comparison 1 Oral steroids versus no treatment/placebo, Outcome 13 Adverse events ‐ gastrointestinal disturbance.

Comparison 1 Oral steroids versus no treatment/placebo, Outcome 14 Adverse events ‐ insomnia.
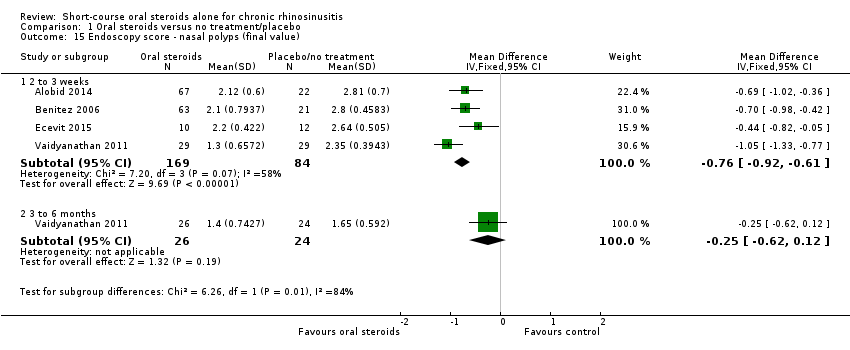
Comparison 1 Oral steroids versus no treatment/placebo, Outcome 15 Endoscopy score ‐ nasal polyps (final value).
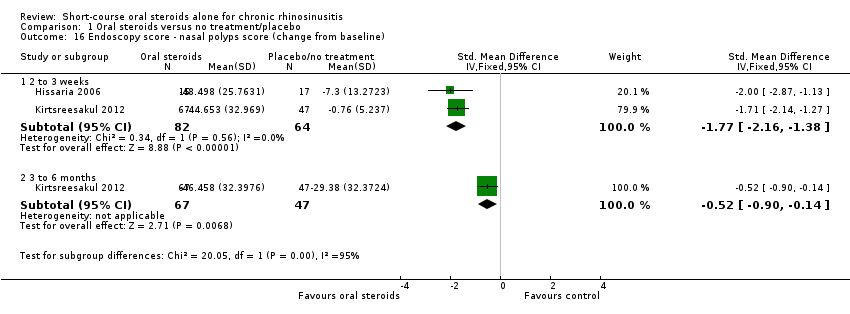
Comparison 1 Oral steroids versus no treatment/placebo, Outcome 16 Endoscopy score ‐ nasal polyps score (change from baseline).
| Short‐course oral corticosteroids compared with placebo/no treatment for chronic rhinosinusitis | ||||||
| Patient or population: chronic rhinosinusitis with nasal polyps | ||||||
| Outcomes № of participants | Relative effect | Anticipated absolute effects* (95% CI) | Quality | What happens | ||
| Without oral steroids | With oral steroids | Difference | ||||
| Disease‐specific health‐related quality of life measured by Follow‐up: 2 weeks № of participants: 40 | — | Not estimable | — | The mean disease‐specific health‐related quality of life in the intervention group was 1.24 standard deviations lower (1.92 lower to 0.56 lower) | ⊕⊕⊝⊝ | A lower score indicates reduced impairment. Treatment effect in favour of short‐course oral steroids.
|
| Disease severity, as measured by patient‐reported symptom score,
| — | — | — |
| ⊕⊕⊝⊝ ⊕⊕⊝⊝ ⊕⊕⊝⊝ | A lower score indicates milder symptoms in favour of short‐course oral steroids.
|
| Adverse events: significant mood disturbance № of participants: 40 | RR 2.50 | Study population | ⊕⊕⊝⊝ | It is uncertain whether there were more mood disturbance adverse events in the oral corticosteroids group. | ||
| 100 per 1000 | 250 per 1000 | 150 more per 1000 (45 fewer to 1041 more) | ||||
| Health‐related quality of life, using generic quality of life scores | This outcome was not reported in any of the studies | |||||
| Adverse events: gastrointestinal disturbance Follow‐up: 3 months № of participants:187 | RR 3.45 | Study population | ⊕⊕⊝⊝ | There were more gastrointestinal disturbance adverse events in the oral corticosteroids group. | ||
| 47 per 1000 | 160 per 1000 | 114 more per 1000 (5 more to 455 more) | ||||
| Adverse events: insomnia Follow‐up: 3 months № of participants:187 | RR 3.63 | Study population | ⊕⊕⊝⊝ | There were more insomnia adverse events in the oral corticosteroids group. | ||
| 23 per 1000 | 84 per 1000 | 61 more per 1000 (2 more to 255 more) | ||||
| *The risk in the intervention group (and its 95% confidence interval) is based on the assumed risk in the comparison group and the relative effect of the intervention (and its 95% CI). | ||||||
| GRADE Working Group grades of evidence | ||||||
| 1Downgraded to low quality due to limitations in study methodology and imprecision. Only the disease severity scale of the RSOM‐31 was used (unknown validity of this subscale and the range of scores is unclear). One small study (n = 40), which lacked information about the method of randomisation and allocation concealment. There is a also concern that the magnitude of improvement is not sustained; one study that used a non‐validated instrument reported smaller benefit at three to six months than at two to three weeks for health‐related quality of life. 2The individual symptoms measured were: nasal obstruction, nasal discharge, sense of smell and pressure over the sinuses. Scores for the individual symptoms (0 to 10 visual analogue scale (VAS)) were summed to find the total score.The effect size could be underestimated with this method. 3Downgraded to low quality due to imprecision. Results are from one very small study (n = 22) and the results were only measured at the end of treatment (17 days). There is a concern that the magnitude of improvement is not sustained. The outcome was not measured using a validated tool. 4Downgraded to low quality due to limitations in study methodology and imprecision. One small study (n = 40), which lacked information about the method of randomisation and allocation concealment. The definition of 'mood disturbance' is not provided in the paper. The results have large confidence intervals. 5Downgraded to low quality due to inconsistency and imprecision. The terminology between the papers for this outcome differed from "diarrhoea/GI disturbance" to "gastrointestinal disturbance" to "reflux and/or gastric pain". A low number of events were reported resulting in large confidence intervals. 6Downgraded to low quality due to inconsistency and imprecision. The definition of 'insomnia' is not provided in the papers. A low number of events were reported resulting in large confidence intervals. 7The individual symptoms measured were: blocked nose, rhinorrhoea, hyposmia and sinonasal pain. The results were measured as individual symptoms on a seven‐point Likert scale (0 = no symptoms) and presented as percentage change from baseline for each symptom, which was averaged across the four symptoms to create an average change from baseline. The effect size could be underestimated with this method. 8All patients in both groups received intranasal steroids at the end of the treatment period until the end of follow‐up (12 weeks). 9Downgraded to low quality due to limitations in study methodology and imprecision. Results are from one small study (n = 117) with unclear randomisation and allocation concealment. The results were measured at the end of treatment (two weeks). There is a concern that the results are not sustained. The outcome was not measured using a validated tool. 10Downgraded to low quality due to limitations in study methodology and imprecision. Results are from one small study (n = 117) with unclear randomisation and allocation concealment. There is a small effect size with large confidence intervals. The outcome was not measured using a validated tool. | ||||||
| System | Adverse events | Notes |
| Musculoskeletal | Osteoporosis | Largely limited to long‐term use Significantly increased risk of fractures with prolonged use |
| Osteonecrosis | Rare, appears to be dose‐dependent | |
| Endocrine | Hyperglycaemia | Common; dose‐dependent, usually reversible |
| Cardiovascular | Hypertension | Common; dose‐dependent, usually reversible |
| Dermatological | Striae, bruising | Dose‐dependent; occurs after > 1 month usage |
| Ophthalmological | Cataracts | Irreversible; largely related to long‐term usage |
| Glaucoma | High risk with pre‐existing disease | |
| Gastrointestinal tract | Peptic ulceration | Increased risk largely due to concomitant NSAIDs |
| Psychological | Psychosis | Common; increased risk with dosages > 40 mg/day |
| References: Da Silva 2006; Naber 1996; Stanbury 1998 NSAIDs: non‐steroidal anti‐inflammatory drugs | ||
| Outcome or subgroup title | No. of studies | No. of participants | Statistical method | Effect size |
| 1 Disease‐specific health‐related quality of life ‐ no pooling (2 to 3 weeks) Show forest plot | 2 | Std. Mean Difference (IV, Fixed, 95% CI) | Subtotals only | |
| 1.1 Severity score of RSOM | 1 | 40 | Std. Mean Difference (IV, Fixed, 95% CI) | ‐1.24 [‐1.92, ‐0.56] |
| 1.2 Mini‐RQLQ | 1 | 58 | Std. Mean Difference (IV, Fixed, 95% CI) | ‐0.79 [‐1.32, ‐0.25] |
| 2 Disease‐specific health‐related quality of life ‐ RQLQ (3 to 6 months) Show forest plot | 1 | 50 | Std. Mean Difference (IV, Fixed, 95% CI) | ‐0.59 [‐1.16, ‐0.02] |
| 3 Disease severity (patient‐reported total symptom score) Show forest plot | 4 | Std. Mean Difference (IV, Fixed, 95% CI) | Totals not selected | |
| 3.1 Final value (2 to 3 weeks) | 3 | Std. Mean Difference (IV, Fixed, 95% CI) | 0.0 [0.0, 0.0] | |
| 3.2 Change from baseline (2 to 3 weeks) | 1 | Std. Mean Difference (IV, Fixed, 95% CI) | 0.0 [0.0, 0.0] | |
| 3.3 Final value (3 to 6 months) | 1 | Std. Mean Difference (IV, Fixed, 95% CI) | 0.0 [0.0, 0.0] | |
| 3.4 Change from baseline (3 to 6 months) | 1 | Std. Mean Difference (IV, Fixed, 95% CI) | 0.0 [0.0, 0.0] | |
| 4 Individual symptoms: nasal obstruction (final value) Show forest plot | 1 | 22 | Mean Difference (IV, Fixed, 95% CI) | ‐4.5 [‐6.42, ‐2.58] |
| 5 Individual symptoms: nasal obstruction (change from baseline) Show forest plot | 1 | Mean Difference (IV, Fixed, 95% CI) | Subtotals only | |
| 5.1 Change from baseline (2 to 3 weeks) | 1 | 114 | Mean Difference (IV, Fixed, 95% CI) | ‐38.02 [‐48.16, ‐27.88] |
| 5.2 Change from baseline (3 to 6 months) | 1 | 114 | Mean Difference (IV, Fixed, 95% CI) | 0.90 [‐8.97, 10.77] |
| 6 Individual symptoms: nasal discharge (final value) Show forest plot | 1 | 22 | Mean Difference (IV, Fixed, 95% CI) | ‐4.7 [‐6.79, ‐2.61] |
| 7 Individual symptoms: nasal discharge (change from baseline) Show forest plot | 1 | Mean Difference (IV, Fixed, 95% CI) | Subtotals only | |
| 7.1 2 to 3 weeks | 1 | 114 | Mean Difference (IV, Fixed, 95% CI) | ‐55.57 [‐69.23, ‐41.91] |
| 7.2 3 to 6 months | 1 | 114 | Mean Difference (IV, Fixed, 95% CI) | ‐1.83 [‐13.46, 9.81] |
| 8 Individual symptoms: facial pressure (final value) Show forest plot | 1 | 22 | Mean Difference (IV, Fixed, 95% CI) | ‐3.7 [‐6.02, ‐1.38] |
| 9 Individual symptoms: facial pressure (change from baseline) Show forest plot | 1 | Mean Difference (IV, Fixed, 95% CI) | Subtotals only | |
| 9.1 2 to 3 weeks | 1 | 114 | Mean Difference (IV, Fixed, 95% CI) | ‐30.66 [‐46.28, ‐15.04] |
| 9.2 3 to 6 months | 1 | 114 | Mean Difference (IV, Fixed, 95% CI) | 0.60 [‐12.56, 13.76] |
| 10 Individual symptoms: loss of sense of smell (final value) Show forest plot | 2 | Mean Difference (IV, Fixed, 95% CI) | Subtotals only | |
| 10.1 2 to 3 weeks | 2 | 80 | Mean Difference (IV, Fixed, 95% CI) | ‐2.79 [‐4.11, ‐1.47] |
| 10.2 3 to 6 months | 1 | 50 | Mean Difference (IV, Fixed, 95% CI) | ‐1.20 [‐2.68, 0.28] |
| 11 Individual symptoms: loss of sense of smell (change from baseline) Show forest plot | 1 | Mean Difference (IV, Fixed, 95% CI) | Subtotals only | |
| 11.1 2 to 3 weeks (after treatment) | 1 | 114 | Mean Difference (IV, Fixed, 95% CI) | ‐44.35 [‐57.31, ‐31.39] |
| 11.2 3 to 6 months | 1 | 114 | Mean Difference (IV, Fixed, 95% CI) | ‐15.05 [‐29.69, ‐0.41] |
| 12 Adverse events ‐ significant mood disturbance Show forest plot | 1 | 40 | Risk Ratio (M‐H, Fixed, 95% CI) | 2.5 [0.55, 11.41] |
| 13 Adverse events ‐ gastrointestinal disturbance Show forest plot | 3 | 187 | Risk Ratio (M‐H, Fixed, 95% CI) | 3.45 [1.11, 10.78] |
| 14 Adverse events ‐ insomnia Show forest plot | 3 | 187 | Risk Ratio (M‐H, Fixed, 95% CI) | 3.63 [1.10, 11.95] |
| 15 Endoscopy score ‐ nasal polyps (final value) Show forest plot | 4 | Mean Difference (IV, Fixed, 95% CI) | Subtotals only | |
| 15.1 2 to 3 weeks | 4 | 253 | Mean Difference (IV, Fixed, 95% CI) | ‐0.76 [‐0.92, ‐0.61] |
| 15.2 3 to 6 months | 1 | 50 | Mean Difference (IV, Fixed, 95% CI) | ‐0.25 [‐0.62, 0.12] |
| 16 Endoscopy score ‐ nasal polyps score (change from baseline) Show forest plot | 2 | Std. Mean Difference (IV, Fixed, 95% CI) | Subtotals only | |
| 16.1 2 to 3 weeks | 2 | 146 | Std. Mean Difference (IV, Fixed, 95% CI) | ‐1.77 [‐2.16, ‐1.38] |
| 16.2 3 to 6 months | 1 | 114 | Std. Mean Difference (IV, Fixed, 95% CI) | ‐0.52 [‐0.90, ‐0.14] |