Sobreimpresión del lecho tumoral para las pacientes que han sido sometidas a una cirugía conservadora de mama
Información
- DOI:
- https://doi.org/10.1002/14651858.CD011987.pub2Copiar DOI

- Base de datos:
-
- Cochrane Database of Systematic Reviews
- Versión publicada:
-
- 06 noviembre 2017see what's new
- Tipo:
-
- Intervention
- Etapa:
-
- Review
- Grupo Editorial Cochrane:
-
Grupo Cochrane de Cáncer de mama
- Copyright:
-
- Copyright © 2017 The Cochrane Collaboration. Published by John Wiley & Sons, Ltd.
Cifras del artículo
Altmetric:
Citado por:
Autores
Contributions of authors
Isabelle Kindts (IK): drafted the protocol, selected which trials to include, extracted data from trials, entered data into Review Manager 5, carried out the analysis, interpreted the analysis, drafted the final review.
Annouschka Laenen (AL): drafted the protocol, carried out the analysis, interpreted the analysis and drafted the final review.
Tom Depuydt (TD): was to be consulted by IK and CW in case of disagreement on selected or extracted data.
Caroline Weltens (CW): drafted the protocol, selected which trials to include, extracted data from trials, entered data into Review Manager 5, interpreted the analysis, drafted the final review.
Declarations of interest
IK: None known.
AL: None known.
TD: None known.
CW: None known.
Acknowledgements
The review authors acknowledge the editorial base of the Cochrane Breast Cancer Group and those editors who made helpful comments on the protocol. We also thank Trudy Bekkering from the Academic Center for General Practice, Leuven for her feedback on the protocol.
Version history
| Published | Title | Stage | Authors | Version |
| 2017 Nov 06 | Tumour bed boost radiotherapy for women after breast‐conserving surgery | Review | Isabelle Kindts, Annouschka Laenen, Tom Depuydt, Caroline Weltens | |
| 2015 Dec 11 | Tumour bed boost radiotherapy for women after breast conserving surgery | Protocol | Isabelle Kindts, Annouschka Laenen, Tom Depuydt, Caroline Weltens | |
Differences between protocol and review
The protocol stated that only women with invasive breast cancer would be included in the analysis. However, we reconsidered this based on the SGW study in which women with carcinoma in situ were also included (59 out of 688 participants). We excluded SGW in the sensitivity analysis for local control. However, we included SGW in the meta‐analysis for toxicity and cosmesis.
Keywords
MeSH
Medical Subject Headings (MeSH) Keywords
Medical Subject Headings Check Words
Adult; Female; Humans; Middle Aged;
PICO

Illustration of the breast retraction assessment (BRA) measurements as reported by EORTC. BRA = √((a1 ‐ b1)² + (a2 ‐ b2)²); reference length = √(b1² + b2²); percentage breast retraction assessment = (BRA/reference length) x 100.
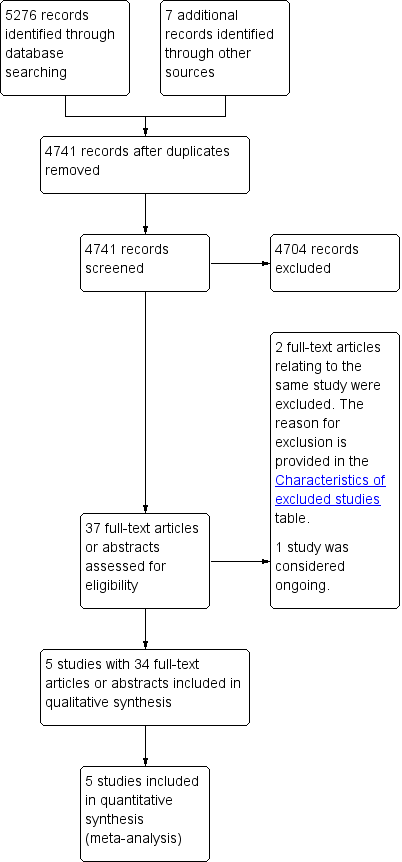
Study flow diagram.
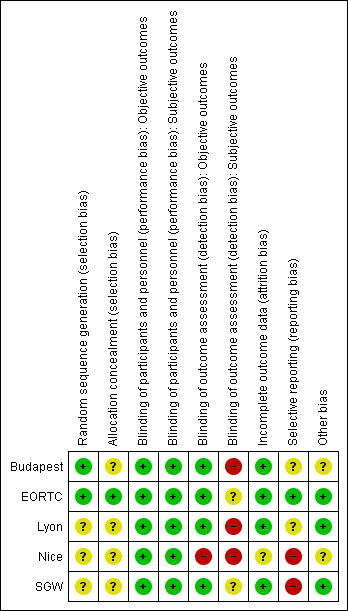
'Risk of bias' summary: review authors' judgements about each risk of bias item for each included study.

Forest plot of comparison: 1 Tumour bed boost radiotherapy versus no boost, outcome: 1.1 Local control.
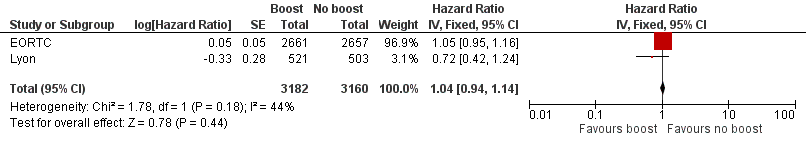
Forest plot of comparison: 1 Tumour bed boost radiotherapy versus no boost, outcome: 1.5 Overall survival.
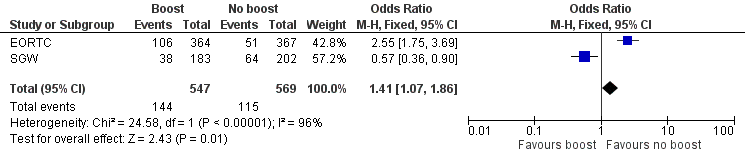
Forest plot of comparison: 1 Tumour bed boost radiotherapy versus no boost, outcome: 1.8 Cosmesis, Panel.
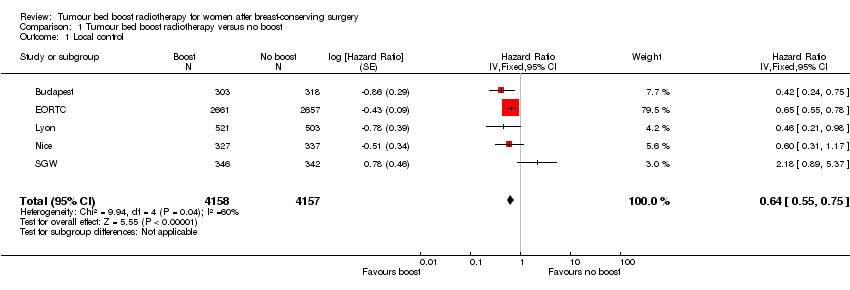
Comparison 1 Tumour bed boost radiotherapy versus no boost, Outcome 1 Local control.
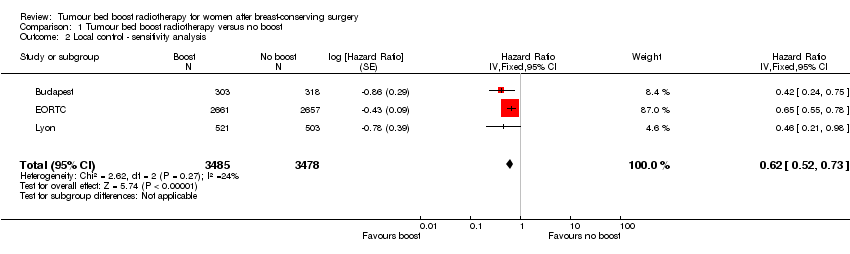
Comparison 1 Tumour bed boost radiotherapy versus no boost, Outcome 2 Local control ‐ sensitivity analysis.

Comparison 1 Tumour bed boost radiotherapy versus no boost, Outcome 3 Local control ‐ subgroup +40 years.

Comparison 1 Tumour bed boost radiotherapy versus no boost, Outcome 4 Local control ‐ subgroup low boost dose.
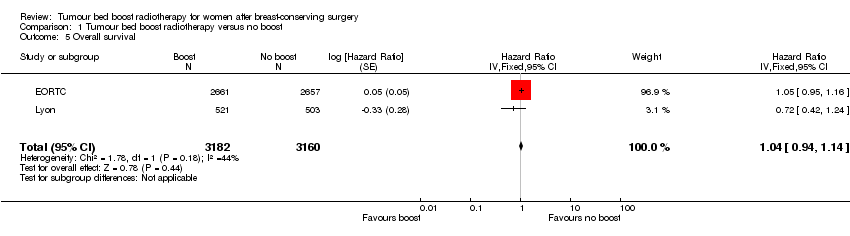
Comparison 1 Tumour bed boost radiotherapy versus no boost, Outcome 5 Overall survival.
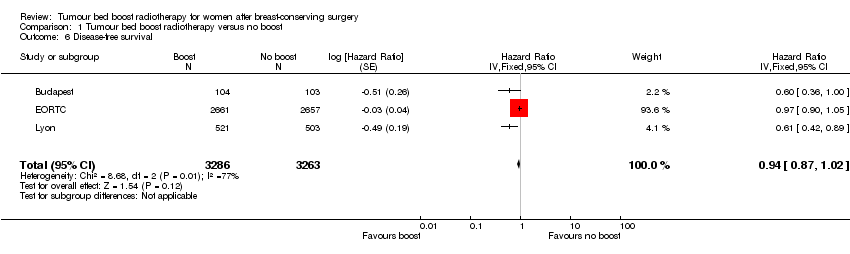
Comparison 1 Tumour bed boost radiotherapy versus no boost, Outcome 6 Disease‐free survival.

Comparison 1 Tumour bed boost radiotherapy versus no boost, Outcome 7 Late toxicity, pBRA.

Comparison 1 Tumour bed boost radiotherapy versus no boost, Outcome 8 Cosmesis, Panel.

Comparison 1 Tumour bed boost radiotherapy versus no boost, Outcome 9 Cosmesis, Physician.
| Boost compared to no boost in breast cancer radiotherapy | ||||||
| Patient or population: breast‐conserving radiotherapy for breast cancer | ||||||
| Outcomes | Anticipated absolute effects* (95% CI) | Relative effect | № of participants | Quality of the evidence | Comments | |
| Risk without boost | Risk with boost | |||||
| Local control: recurrence at 5 years | Study population | HR 0.64 | 8315 | ⊕⊕⊝⊝ | Nice did not report 5‐year local control. | |
| 70 per 1000 | 45 per 1000 | |||||
| Overall survival: mortality at 5 years | Study population | HR 1.04 | 6342 | ⊕⊕⊕⊝ | ||
| 91 per 1000 | 94 per 1000 | |||||
| Disease‐free survival: disease progression/mortality at 5 years | Study population | HR 0.94 | 6549 | ⊕⊕⊝⊝ | EORTC did not report 5‐year disease‐free survival. | |
| 221 per 1000 | 209 per 1000 | |||||
| Late toxicity, pBRA | Mean pBRA 8.17, range 7.55 to 10 | Mean pBRA 8.55, | MD 0.38 higher (0.18 lower to 0.93 higher) | 1526 | ⊕⊝⊝⊝ | |
| Cosmesis, panel scored: fair or poor | Study population | OR 1.41 | 1116 | ⊕⊕⊝⊝ | ||
| 202 per 1000 | 263 per 1000 | |||||
| Cosmesis, physician‐scored: fair or poor | Study population | OR 1.58 | 592 | ⊕⊝⊝⊝ | ||
| 85 per 1000 | 128 per 1000 | |||||
| Sensitivity analysis: local control ‐ recurrence at 5 years | Study population | HR 0.62 | 6963 | ⊕⊕⊕⊕ | ||
| 74 per 1000 | 47 per 1000 | |||||
| Subgroup analysis: local control ‐ > 40 years old, recurrence at 5 years | Study population | HR 0.65 | 5058 | ⊕⊕⊕⊕ | ||
| 59 per 1000 | 39 per 1000 | |||||
| *The risk in the intervention group (and its 95% confidence interval) is based on the assumed risk in the comparison group and the relative effect of the intervention (and its 95% CI). | ||||||
| GRADE Working Group grades of evidence | ||||||
| 1High risk of selective reporting in one study. | ||||||
| Organ tissue | 0 | Grade 1 | Grade 2 | Grade 3 | Grade 4 |
| Skin | None | Slight atrophy; pigmentation change; some hair loss | Patchy atrophy; moderate telangiectasia; total hair loss | Marked atrophy; gross telangiectasia | Ulceration |
| Subcutaneous tissue | None | Slight induration (fibrosis) and loss of subcutaneous fat | Moderate fibrosis but asymptomatic; slight field contracture; < 10% linear reduction | Severe induration and loss of subcutaneous tissue; field contracture > 10% linear measurement | Necrosis |
| RTOG/EORTC: Radiation Therapy Oncology Group/European Organisation for Research and Treatment of Cancer | |||||
| Cosmetic score |
| Excellent |
| Good |
| Fair |
| Poor |
| Outcome or subgroup title | No. of studies | No. of participants | Statistical method | Effect size |
| 1 Local control Show forest plot | 5 | 8315 | Hazard Ratio (Fixed, 95% CI) | 0.64 [0.55, 0.75] |
| 2 Local control ‐ sensitivity analysis Show forest plot | 3 | 6963 | Hazard Ratio (Fixed, 95% CI) | 0.62 [0.52, 0.73] |
| 3 Local control ‐ subgroup +40 years Show forest plot | 2 | 5058 | Hazard Ratio (Fixed, 95% CI) | 0.65 [0.53, 0.81] |
| 4 Local control ‐ subgroup low boost dose Show forest plot | 2 | 1352 | Hazard Ratio (Fixed, 95% CI) | 0.95 [0.55, 1.62] |
| 5 Overall survival Show forest plot | 2 | 6342 | Hazard Ratio (Fixed, 95% CI) | 1.04 [0.94, 1.14] |
| 6 Disease‐free survival Show forest plot | 3 | 6549 | Hazard Ratio (Fixed, 95% CI) | 0.94 [0.87, 1.02] |
| 7 Late toxicity, pBRA Show forest plot | 2 | 1526 | Mean Difference (IV, Fixed, 95% CI) | 0.38 [‐0.18, 0.93] |
| 8 Cosmesis, Panel Show forest plot | 2 | 1116 | Odds Ratio (M‐H, Fixed, 95% CI) | 1.41 [1.07, 1.86] |
| 9 Cosmesis, Physician Show forest plot | 2 | 592 | Odds Ratio (M‐H, Fixed, 95% CI) | 1.58 [0.93, 2.69] |