Rawatan ubat anti‐diabetes oral untuk rawatan wanita dengan diabetes gestasi
Referencias
References to studies included in this review
References to studies excluded from this review
References to studies awaiting assessment
References to ongoing studies
Additional references
References to other published versions of this review
Characteristics of studies
Characteristics of included studies [ordered by study ID]
| Methods | Randomised, parallel, open‐label study | |
| Participants | 70 women Inclusion criteria: women diagnosed with GDM whose glycaemic targets were not adequately controlled by diet and exercise alone. GDM diagnosed using WHO criteria 75 g OGTT fasting ≥ 6.1 mmol/L (110 mg/dL); 2‐h value ≥ 7.8 mmol/L (140 mg/dL). Gestational age 11‐33 weeks, singleton pregnancy Exclusion criteria: presence of a pathology requiring faster glucose control (e.g. antenatal corticosteroids), other pathologies affecting therapy or perinatal results (no details) Setting: maternity hospital Joinville SC, Brazil Timing: October 2003‐July 2004 | |
| Interventions | Glyburide (n = 24) ‐ initial dose 5 mg in the morning, increasing every 7 d until glycaemic control achieved up to a maximum of 20 mg Acarbose (n = 19) ‐ initial dose 50 mg before main meals with 50 mg increments every 7 d until glycaemic control achieved to a maximum of 300 mg Insulin (n = 27) ‐ not applicable for this systematic review Where maximum dose was met without adequate glycaemic control insulin therapy was commenced | |
| Outcomes | No primary outcomes were listed for the mother. Secondary outcomes included fasting and postprandial glucose levels, gestational age at birth, severe hypoglycaemia requiring hospitalisation, BMI, gestational weight gain, type of delivery, other occurrences For the infant, primary outcomes: fetal weight, fetal hypoglycaemia; secondary outcomes: birthweight, macrosomia, LGA, capillary blood glucose, neonatal hypoglycaemia, bilirubin level, calcium level, duration of hospitalisation, admission to NICU, death, discharge status | |
| Notes | Sample size calculation ‐ no details ITT analysis ‐ no Funding ‐ no details | |
| Risk of bias | ||
| Bias | Authors' judgement | Support for judgement |
| Random sequence generation (selection bias) | Unclear risk | State that randomised but no details |
| Allocation concealment (selection bias) | Low risk | "Randomization was done by using brown envelopes containing outside the randomization number and in the inside a sheet defining which therapy the patient was allocated to" |
| Blinding of participants and personnel (performance bias) | High risk | Open label study. "SInce this study compares 3 therapies with different administration procedures, this was not a blind study" |
| Blinding of outcome assessment (detection bias) | Unclear risk | Open label study. No details as to whether outcome assessors were blinded |
| Incomplete outcome data (attrition bias) | Low risk | 71 women in total were randomised and 1 was later excluded due to severe asthma that required corticotherapy. This woman was excluded from further analysis |
| Selective reporting (reporting bias) | Low risk | No evidence of selective reporting although an original protocol was not viewed |
| Other bias | Low risk | No differences in baseline |
| Methods | Randomised, parallel study | |
| Participants | 395 women Inclusion criteria: at least 2 abnormal values on a 3‐h 100 g OGTT using NDDG criteria and fasting values > 5.8 mmol/L (105 mg/dL); 24‐30 weeks' gestation; singleton pregnancy Exclusion criteria: established pre‐gestational diabetes; abnormal gestational diabetes screening (≥ 140 mg/dL) prior to 24 weeks' gestation, multiple pregnancy; known major fetal anomaly or fetal demise; any renal disease with serum creatinine > 1.0 mg/dL; known liver disease such as hepatitis; maternal or fetal conditions likely to require imminent or very preterm delivery such as pre‐eclampsia, preterm premature rupture of membranes, preterm labour, and IUGR; known hypersensitivity or allergic reaction to glyburide Setting: medical centre, Dallas, Texas, USA Timing: September 2008‐October 2012 | |
| Interventions | All women underwent monitored diet with weekly diary logs and 4 times daily glucose monitoring. Treatment targets were fasting < 5.3 mmol/L (95 mg/dL) and < 6.7 mmol/L (120 mg/dL) for 2‐h post‐prandial glucose readings Glibenclamide (n = 189) starting dose 2.5 mg and titrated up to a maximum of 20 mg/d based on weekly maternal capillary glucose readings Placebo (n = 186) identical capsule to glibenclamide | |
| Outcomes | Primary ‐ birthweight decrease of 200 g Secondary outcomes ‐ mean capillary blood glucose, need for insulin, chorioamnionitis, pregnancy‐induced hypertension, need for operative birth, shoulder dystocia, perineal trauma, maternal weight gain, birthweight, SGA, LGA, admission to neonatal intensive care, fracture clavicle, Erbs palsy, hyperbilirubinaemia, active treatment of hypoglycaemia, cord blood pH </= 7 | |
| Notes | Trial registration NCT00744965 Sample size calculation ‐ yes based on birthweight Funding ‐ Department of Obstetrics and Gynaecology ITT analysis ‐ no | |
| Risk of bias | ||
| Bias | Authors' judgement | Support for judgement |
| Random sequence generation (selection bias) | Low risk | "computer generated randomization schedule" |
| Allocation concealment (selection bias) | Low risk | Masking, allocation and assignment done by the investigational drug pharmacy |
| Blinding of participants and personnel (performance bias) | Low risk | Participants blinded with identical placebo capsule |
| Blinding of outcome assessment (detection bias) | Low risk | Outcome assessors were blinded according to trial registration |
| Incomplete outcome data (attrition bias) | Low risk | 20 women lost to follow‐up: glibenclamide n = 9 did not give birth in study hospital or lost to follow‐up; placebo n = 11 did not give birth in study hospital or lost to follow‐up |
| Selective reporting (reporting bias) | High risk | No published protocol found but the trial registration listed primary and secondary outcomes. However, many more maternal and neonatal outcomes were reported in the published paper than were prespecified in the trial registration document |
| Other bias | High risk | This trial appears to have been registered twice as NCT00942552 and as NCT 00744965 with the same outcomes, interventions and sample size. The population was 93% Hispanic and therefore the results may not be generalisable to other ethnicities |
| Methods | Randomised, parallel study | |
| Participants | 59 women Women diagnosed with gestational diabetes (no details for diagnosis provided) between 12 and 34 weeks Conference abstract with no details of inclusion or exclusion criteria Setting: Callifornia, USA Timing: not specified | |
| Interventions | Acarbose 50 mg 3 times/d and increased by 50 mg if 50% of glycaemic targets readings were not achieved in a week (fasting < 5.3 mmol/L, < 95 mg/dL; 1‐hour postprandial < 7.5 mmol/L, < 135 mg/dL) (n = 29) Placebo (n = 30) no details | |
| Outcomes | Treatment failure, weight gain, side effects, gestational age at delivery, Apgar scores, birthweight, mode of delivery | |
| Notes | Conference abstract only. Unable to find contact details for study authors, no evidence of a full paper publication and no definition of GDM provided ITT analysis ‐ states it has used ITT analysis Power calculation ‐ yes based on failure rates Funding ‐ no details | |
| Risk of bias | ||
| Bias | Authors' judgement | Support for judgement |
| Random sequence generation (selection bias) | Unclear risk | States randomised but no details |
| Allocation concealment (selection bias) | Unclear risk | No details |
| Blinding of participants and personnel (performance bias) | Unclear risk | States double blind but no details |
| Blinding of outcome assessment (detection bias) | Unclear risk | States double blind but no details |
| Incomplete outcome data (attrition bias) | Unclear risk | No details provided, although state that ITT analysis conducted |
| Selective reporting (reporting bias) | High risk | Conference abstract only published in 2006, no full publication identified. Not all data reported |
| Other bias | High risk | Unable to judge as conference proceeding only |
| Methods | Randomised, parallel study | |
| Participants | 81 women Inclusion criteria: "eligible women between 18‐45 years diagnosed with gestational diabetes, according to the WHO criteria, ratified the public network for prenatal care at the Clinic for Diabetes and Pregnancy. Women with singleton pregnancy and gestational age not exceeding 30 weeks at the time of enrolment, calculated from ultrasound (U.S.) Obstetric performed before the 20th week of pregnancy will be enrolled" (taken from clinical trial registry NCT02091336) Exclusion criteria: "women who present enrolment in the diagnosis of chronic hypertension, heart disease or chronic lung disease intrauterine restricted or preterm labour, growth, or even chronic diarrhoea will be excluded" (taken from clinical trial registry NCT02091336) Setting: Hosptial de Clinicas, Porto Allegre, Brazil | |
| Interventions | Glibenclamide (n = 45). Initial dose of 2.5 mg/d, increased by 2.5 mg the following week, and following increments of 5 mg/week until glycaemic control achieved or maximum dose of 20 mg/d Metformin (n = 36). Initial dose of 500 mg, increasing in 500 mg increments every 3 d until glycaemic target achieved or maximum dose of 2.5 g/d | |
| Outcomes | Caesarean section, perinatal death, LGA, need for additional pharmacological therapy, maternal hypoglycaemia, weight gain in pregnancy, macrosomia, SGA, birth trauma (any), gestational age at birth, preterm birth (< 37 weeks), birthweight, neonatal hypoglycaemia, RDS | |
| Notes | Additional information was obtained from the clinical trial registration NCT02091336 | |
| Risk of bias | ||
| Bias | Authors' judgement | Support for judgement |
| Random sequence generation (selection bias) | Unclear risk | "Randomized" no further details |
| Allocation concealment (selection bias) | Unclear risk | No details |
| Blinding of participants and personnel (performance bias) | High risk | Open label study |
| Blinding of outcome assessment (detection bias) | Unclear risk | No details |
| Incomplete outcome data (attrition bias) | High risk | 8/36 women dropped out of metformin arm (hypoglycaemia n = 1; lack of glycaemic control n = 1; gastric intolerance n = 6) and 24/45 dropped out of glibenclamide arm (hypoglycaemia n = 17; lack of glycaemic control n = 6; gastric intolerance n = 1) |
| Selective reporting (reporting bias) | High risk | In this abstract the only data reported were for dropouts and not for those who remained in the study |
| Other bias | High risk | Data reported as conference abstract only. No baseline data were presented |
| Methods | Randomised, parallel study, single centre | |
| Participants | 48 women Inclusion criteria: diagnosed with GDM using Carpenter and Coustan criteria, failed to meet treatment targets with diet alone after 2 weeks Exclusion criteria: not stated Setting: Kerala, India Timing: not stated | |
| Interventions | Glibenclamide (n = 24) initial dose 2.5 mg twice daily increasing to a maximum of 10 mg daily. If treatment targets not met then insulin added Metformin (n = 24) initial dose 500 mg twice daily, increasing to a maximum dose of 1700 mg daily. If treatment targets not met then insulin added | |
| Outcomes | Maternal glycaemic control (HbA1c in third trimester), birthweight, cord C peptide. Mode of delivery, shoulder dystocia, neonatal blood sugars at 3 and 6 h, hyperbilirubinaemia, incidence of urinary tract infection, incidence of candidiasis, pre‐eclampsia, weight gain (10 kg or more) | |
| Notes | Sample size calculation ‐ no details ITT analysis ‐ no Funding ‐ no details provided Conflicts of interest ‐ authors state that there were no financial or other conflicts of interest associated with this study | |
| Risk of bias | ||
| Bias | Authors' judgement | Support for judgement |
| Random sequence generation (selection bias) | Low risk | Block randomisation using computer‐generated random numbers |
| Allocation concealment (selection bias) | Unclear risk | No details |
| Blinding of participants and personnel (performance bias) | Low risk | Physician and patient were blinded to the allocation. Tablets dispensed in sealed envelopes from the pharmacy |
| Blinding of outcome assessment (detection bias) | Unclear risk | No details |
| Incomplete outcome data (attrition bias) | Low risk | 1 woman in each arm was lost to follow‐up. Analysed 46 women |
| Selective reporting (reporting bias) | High risk | Some additional outcomes were reported that were not specified in the methods section |
| Other bias | Unclear risk | Unable to ascertain if demographics similar at baseline as no data provided |
| Methods | Randomised, parallel‐controlled study, single centre | |
| Participants | 159 women Mean age of glibenclamide group was 33.6 ± 4.6 years and for the metformin group was 33.4 ± 4.4 years. Mean BMI glibenclamide group 28.8 ± 4.0 kg/m2 and for the metformin group was 28.7 ± 4.4 kg/m2 All women screened by risk factors followed by 100 g OGTT between 24‐28 weeks' gestation. Criteria for diagnosis was NDDG (1979) using 2 abnormal values from fasting glucose ≥ 5.3 mmol/L, 1‐h ≥ 10 mmol/L, 2‐h ≥ 8.6 mmol/L, 3‐h ≥ 7.8 mmol/L. Gestational age at recruitment was 29.7 ± 3.7 weeks in the glibenclamide group and 29.3 ± 3.3 weeks in the metformin group Inclusion criteria: failed to meet treatment targets using medical nutritional therapy (fasting glucose ≥ 5.5 mmol/L and ≤ 7.8 mmol/L, 2‐h postprandial ≥ 6.7 mmol/L and ≤ 13.9 mmol/L), 20‐33 weeks' gestation Exclusion criteria: pre‐existing type 1 or type 2 diabetes, currently taking metformin for some other indication, multiple pregnancy, recognised fetal anomaly, known abnormal renal or hepatic function, hypoxic cardio‐respiratory disease, malabsorption or some other significant gastrointestinal disease, sepsis, ruptured membranes, gestational hypertension or pre‐eclampsia Setting: India Timing: 2007‐2010 | |
| Interventions | Glibenclamide (n = 80) initial dose 2.5 mg. Doses increased weekly if required to a maximum of 15 mg/d Metformin (n = 79) initial dose 500 mg/d, increased weekly if required to a maximum of 2500 mg/d Blood sugars self‐monitored 4 times/week Treatment target during therapy fasting glucose ≤ 5.3 mmol/L and 2‐h postprandial ≤ 6.7 mmol/L. If targets were not met in 2‐3 weeks insulin was added or women were switched over to insulin alone All women were induced not later than 39 weeks' gestation | |
| Outcomes | Primary outcomes: composite including macrosomia (> 3.7 kg), hypoglycaemia (≤ 2.2 mmol/L), need for phototherapy, RDS, stillbirth, neonatal death, birth trauma Secondary outcomes: birthweight, maternal glycaemic control, hypertension, preterm birth < 34 weeks, induction of labour, mode of birth, complications of birth | |
| Notes | Power calculation: yes based on composite outcome ITT analysis: yes Funding: none specified Conflicts of interest: not detailed in manuscript | |
| Risk of bias | ||
| Bias | Authors' judgement | Support for judgement |
| Random sequence generation (selection bias) | Low risk | "computer generated random list" |
| Allocation concealment (selection bias) | Low risk | "sequentially labelled opaque envelopes" "arranged...in a central research office by research officers not involved in patient care" |
| Blinding of participants and personnel (performance bias) | High risk | Women were not blinded |
| Blinding of outcome assessment (detection bias) | Low risk | Research officers collecting data were masked to allocation. After birth all babies were monitored by neonatologists who were masked to study participation |
| Incomplete outcome data (attrition bias) | Low risk | In the glibenclamide group 6 women did not receive the allocated intervention (obstetrician withdrew 1 woman, 4 women withdrew, 1 woman gave birth elsewhere) In the metformin group 4 women did not receive the allocated intervention (1 withdrew from study and 3 gave birth elsewhere) |
| Selective reporting (reporting bias) | Low risk | The outcome of preterm birth < 34 weeks' gestation was not listed as an outcome in the Trial Registration on the Clinical Trials Registry India (CTRI/2014/02/004418 ‐ registered retrospectively) but was listed and reported in the published manuscript |
| Other bias | Unclear risk | An interim analysis requested by the local data monitoring committee showed significant differences in outcomes and the study was stopped before the total sample size of 86 women per group was achieved Groups were balanced at baseline although the metformin group had higher fasting triglyceride levels |
| Methods | Randomised, parallel study | |
| Participants | 149 women diagnosed with GDM following a 1‐h 50 g OGCT (≥ 7.2 mmol/L; 130 mg/dL) followed by a 3‐h 100 g OGTT using Carpenter and Coustan criteria with 2 or more abnormal results. All women initially treated with diet and exercise counselling. Treatment targets were fasting 5.8 mmol/L (105 mg/dL); or 2‐h postprandial blood glucose level 6.7 mmol/L (120 mg/dL). Mean age of women in the glyburide group was 29.6 ± 7.8 years and in the metformin group was 31 ± 7.1 years. Mean BMI in glyburide group was 32.7 ± 7.0 kg/m2 and in the metformin group was 32.8 ± 5.8 kg/m2. Both groups comprised 88% Hispanic women Inclusion criteria: between 11 and 33 weeks' gestation Exclusion criteria: history of significant renal or hepatic disease, chronic hypertension requiring medication, or substance misuse Setting: University of New Mexico, Albuquerque, USA Timing: July 2003‐May 2008. | |
| Interventions | Metformin (n = 75) initial dose of 500 mg per day taken in divided doses and increased as required to a maximum of 2000 g/d Glibenclamide (n = 74) initial dose of 2.5 mg twice daily increased as required to a maximum of 20 mg daily | |
| Outcomes | Primary outcome: glycaemic control Secondary outcomes: medication failure rate, macrosomia (> 4000 g), admission to NICU, 5‐minute Apgar less than 7, birth trauma, pre‐eclampsia, maternal and neonatal hypoglycaemia, route of delivery | |
| Notes | Elective delivery was planned at 38 weeks by induction of labour or repeat caesarean section as required ITT ‐ all randomised women were included in the analysis Power calculation ‐ yes, based on a difference in glycaemic control between groups Funding ‐ no details Conflicts of interest ‐ authors state in the manuscript that there were no financial or other conflicts | |
| Risk of bias | ||
| Bias | Authors' judgement | Support for judgement |
| Random sequence generation (selection bias) | Low risk | "computer generated random list" |
| Allocation concealment (selection bias) | Low risk | "Sequentially labelled, opaque, sealed envelopes" |
| Blinding of participants and personnel (performance bias) | High risk | Study participants and care providers were not blinded to the treatment allocation |
| Blinding of outcome assessment (detection bias) | Unclear risk | No details provided |
| Incomplete outcome data (attrition bias) | Low risk | All women randomised were analysed. In the glyburide group 3 women never took the drug and 3 relocated before birth. In the metformin group, 5 women had only 2 prenatal visits, 2 relocated and 1 could not tolerate the gastrointestinal side effects and only took 2 doses of metformin |
| Selective reporting (reporting bias) | Low risk | All outcomes prespecified in the methods were reported in the results section |
| Other bias | Low risk | There were no group differences at baseline |
| Methods | Parallel, randomised controlled trial (pilot study) | |
| Participants | 40 women (target for study was 60) Inclusion criteria: women with mild GDM (fasting blood glucose 5.1‐5.4 mmol/L, 2‐h < 8.5 mmol/L) Exclusion criteria: multiple pregnancy, previous stillbirth, previous shoulder dystocia requiring obstetric manoeuvres, < 16 years old, unable to consent, known allergy or contra‐indication to study medication, liver abnormalities, renal dysfunction, acute or chronic disease which might cause tissue hypoxia, lactation Setting: Manchester, UK Timing: unclear | |
| Interventions | Metformin up to 2000 mg/daily with initial dose of 500 mg/day from 26‐28 weeks' gestation to birth +/‐ insulin if treatment targets not met (no home monitoring) (n = 18) Standard care with dietary advice +/‐ metformin or insulin if treatment targets not met. Self‐monitoring of blood glucose pre‐meal and 1‐h postprandial (n = 19) | |
| Outcomes | Anxiety, blood glucose, serum insulin, HOMA‐IR, acceptability, need for insulin (taken from trial registration document) | |
| Notes | EudraCT number: 2013‐004065‐13/ ISRCTN86503951 | |
| Risk of bias | ||
| Bias | Authors' judgement | Support for judgement |
| Random sequence generation (selection bias) | Unclear risk | No details provided |
| Allocation concealment (selection bias) | Low risk | Trial registration document states "..prefilled sealed envelopes created by independent research midwives within the department" |
| Blinding of participants and personnel (performance bias) | High risk | "open label" |
| Blinding of outcome assessment (detection bias) | Unclear risk | No details |
| Incomplete outcome data (attrition bias) | Unclear risk | 3 women did not complete the trial and were not analysed, unclear as to which group they were allocated |
| Selective reporting (reporting bias) | High risk | No prespecified outcomes were provided in the conference abstract. Data were reported on n = 40 when according to the trial registration documentation the sample size was n = 60 |
| Other bias | High risk | No reported differences at baseline although differences were reported between participants and non‐participants. Evidence in conference abstract format only at present |
| Methods | Randomised, parallel controlled study | |
| Participants | 106 women Inclusion criteria: women diagnosed with GDM using Carpenter and Coustan criteria, 14‐33 weeks' gestation, aged 18‐45 years, 1 week of dietary treatment, sonographic dating of the pregnancy earlier than 24 weeks Exclusion criteria: suspected IUGR earlier than 24 weeks' gestation, major fetal malformation, pregestational diabetes mellitus Setting: Israel Timing: 2012‐2014 | |
| Interventions | Glibenclamide (n = 55) maximum dose 20 mg per day Metformin (n = 51) maximum dose 2550 mg per day If treatment targets not met then the other drug was added. If both failed then insulin was added Self‐monitoring of blood sugar 7 times/d | |
| Outcomes | Primary outcome ‐ glycaemic control | |
| Notes | Sample size calculation ‐ yes based on glycaemic control ITT analysis ‐ not clear in conference abstract Funding ‐ no details in conference abstract Conflicts of interest ‐ no details of whether there was a conflict was stated in the conference abstract | |
| Risk of bias | ||
| Bias | Authors' judgement | Support for judgement |
| Random sequence generation (selection bias) | Unclear risk | States randomised but no details |
| Allocation concealment (selection bias) | Unclear risk | No details |
| Blinding of participants and personnel (performance bias) | High risk | Open label, participants were not blinded |
| Blinding of outcome assessment (detection bias) | Unclear risk | No details |
| Incomplete outcome data (attrition bias) | High risk | Unclear as the data were only reported in a conference abstract |
| Selective reporting (reporting bias) | High risk | Unclear as outcomes appear to be reported that were not listed in methods section or in the study registration document |
| Other bias | High risk | Data were presented as a conference abstract only |
| Methods | Randomised parallel trial | |
| Participants | 207 women from South Africa Inclusion criteria: women who had been screened using a 2‐h 100 g OGTT with blood glucose values ≥ 7.8 mmol/L (140 mg/dL), remaining duration of pregnancy allowing for 6 weeks of intervention. Included women with known diabetes, glycosuria, family and obstetric histories suggestive of diabetes Exclusion criteria: established diabetics already on a specific treatment were not randomised Setting: Durban, South Africa Timing: not stated | |
| Interventions | Chlorpropramide (n = 58) maximum dose 250 mg/day Tolbutamide (n = 46) maximum dose 1.5 g/day Insulin (n = 47) Dietary restriction alone (n = 56) Those participants who failed to respond to a treatment were usually then given insulin | |
| Outcomes | None prespecified | |
| Notes | Power calculation ‐ not stated ITT analysis ‐ yes Funding ‐ financial support received from Pfizer laboratories Conflicts of interest ‐ not reported | |
| Risk of bias | ||
| Bias | Authors' judgement | Support for judgement |
| Random sequence generation (selection bias) | Unclear risk | "random sample basis", no other details |
| Allocation concealment (selection bias) | Unclear risk | No details |
| Blinding of participants and personnel (performance bias) | Unclear risk | No details |
| Blinding of outcome assessment (detection bias) | Unclear risk | No details |
| Incomplete outcome data (attrition bias) | Low risk | All women randomised appear to have data |
| Selective reporting (reporting bias) | High risk | There were no pre‐specified outcomes for the mother or the infant |
| Other bias | High risk | Paper states that there were no differences between interventions at baseline. The data for GDM and other diabetes could not be separated. The proportion of women with GDM could not be determined and the data have therefore not been included in any meta‐analysis |
| Methods | Randomised, parallel study | |
| Participants | 200 women. Mean age in metformin group 32.6 ± 5.6 years and for glyburide group 31.3 ± 5.4 years Women with GDM requiring additional pharmacotherapy. Diagnosis was by WHO criteria Inclusion criteria: > 18 years of age, gestational age 11‐33 weeks, single gestation, fetal abdominal circumference > 10% and < 75%, absence of other pathologies that might interfere with perinatal results or hypoglycaemic therapy. Capilliary glucose testing fasting 5.0 mmol/L (90 mg/dL), 1‐h postprandial after breakfast lunch and supper < 6.7 mmol/L (120 mg/dL); 2 abnormal values required Exclusion criteria: intolerance to drugs, unwillingness to participate, fetal risk (abdominal circumference < 10% or > 97%), lack of follow‐up or fetal malformation diagnosed at birth Setting: hospital medical centre, Santa Catarina, Brazil Timing: July 2008‐September 2010 | |
| Interventions | Glyburide (n = 96) starting dose 2.5 mg before breakfast and dinner and increased by 2.5 to 5 mg/week until glycaemic control achieved or to a maximum of 20 mg/d Metformin (n = 104) starting dose 500 mg at breakfast and dinner and increased by 500‐1000 mg weekly until glycaemic control achieved or a maximum of 2500 mg/d Insulin was started at 0.7 IU/kg/day regular insulin preprandial and NHP insulin at bedtime when glycaemic targets were not met | |
| Outcomes | Primary outcomes ‐ maternal glucose control, weight, neonatal glucose levels. Maternal ‐ weight gain during pregnancy, need for change in therapy, HbA1c, ketonuria, gestational age at birth, severe hypoglycaemia requiring hospitalisation, mode of birth, complications with hypertensive disorders Neonatal ‐ birthweight, LGA, macrosomia, fetal hypoglycaemia, CGT after birth, duration of hospitalisation, death, hospital discharge conditions | |
| Notes | Sample size calculations: no details Funding: no details ITT analysis: where possible | |
| Risk of bias | ||
| Bias | Authors' judgement | Support for judgement |
| Random sequence generation (selection bias) | Low risk | "randomized", "computer generated randomization" |
| Allocation concealment (selection bias) | Low risk | Sequential numbering in brown envelopes with the name of the group glyburide or metformin |
| Blinding of participants and personnel (performance bias) | High risk | "Open clinical study" |
| Blinding of outcome assessment (detection bias) | Unclear risk | No details |
| Incomplete outcome data (attrition bias) | Low risk | 2 women were excluded due to intrauterine death, 1 from each group |
| Selective reporting (reporting bias) | High risk | Maternal and infant outcomes reported. However macrosomia was prespecified but not reported |
| Other bias | Low risk | No differences in baseline |
BMI: body mass index
GDM: gestational diabetes mellitus
ITT: intention to treat
IUGR: intrauterine growth restriction
LGA: large‐for‐gestational age
NICU: neonatal intensive care unit
OGTT: oral glucose tolerance test
RDS: respiratory distress syndrome
SGA: small‐for‐gestational age
Characteristics of excluded studies [ordered by study ID]
| Study | Reason for exclusion |
| Wrong comparator; metformin versus insulin | |
| Postpartum intervention | |
| This study comparing metformin and placebo was registered with ClinicalTrials.gov in 2010. Subsequent updates indicate that the study never started to recruit due to insufficient funding for enrolment of participants | |
| This is a pharmacokinetic study and not an intervention study | |
| Postpartum intervention |
Characteristics of studies awaiting assessment [ordered by study ID]
| Methods | Unclear if this is a randomised trial |
| Participants | 32 women who had undergone amniocentesis for fetal lung maturity |
| Interventions | Control ‐ non diabetic Metformin only Glibenclamide only Metformin and insulin |
| Outcomes | Amniotic levels of insulin, glucose and adiponectin |
| Notes | We are attempting to identify and contact the authors of this study as it is not clear if the women were randomised to treatment or not prior to the amniocentesis. This appears to be unlikely given that there is a control group of women without diabetes. It is also unclear if these are women with GDM or pregestational diabetes |
| Methods | Parallel, randomised controlled trial |
| Participants | 200 pregnant women Inclusion: women diagnosed with GDM or type 2 diabetes, singleton pregnancy Exclusion: diabetic nephropathy or proliferative retinopathy, unable to swallow tablets Setting: Israel |
| Interventions | Metformin (no other details) Comparison (not specified) |
| Outcomes | None prespecified |
| Notes | This study was first registered in 2006 (NCT00414245) but does not appear to have started recruitment. We contacted investigators in December 2015 to ascertain study status and to find out what the comparison was in the study |
GDM: gestational diabetes mellitus
Characteristics of ongoing studies [ordered by study ID]
| Trial name or title | Glibenclamide (glyburide) versus Glucovance in the treatment of GDM (GGIG) |
| Methods | Parallel randomised controlled trial |
| Participants | Inclusion criteria: GDM, > 12 weeks' gestation, able to consent Exclusion criteria: unable to consent, pre‐existing diabetes, glucose‐6‐phosphate dehydrogenase deficiency, serum creatinine > 1, liver disease, allergy to sulfa, allergy to glyburide, allergy to metformin, fetal anomaly |
| Interventions | Glibenclamide 2.5 mg at bedtime increased to a maximum of 20 mg if needed, versus Glucovance (combination of glibenclamide and metformin) (2.5/500) once daily at bedtime increased if required to 20/2000 |
| Outcomes | Glycaemic control, maternal hypoglycaemia, birthweight, Apgar scores, admission to NICU, neonatal hypoglycaemia |
| Starting date | June 2016 |
| Contact information | Lisa Moore: [email protected] |
| Notes |
GDM: gestational diabetes mellitus
NICU: neonatal intensive care unit
Data and analyses
| Outcome or subgroup title | No. of studies | No. of participants | Statistical method | Effect size |
| 1 Hypertensive disorders of pregnancy Show forest plot | 1 | Risk Ratio (M‐H, Fixed, 95% CI) | Subtotals only | |
| Analysis 1.1  Comparison 1 Oral anti‐diabetic agents versus placebo, Outcome 1 Hypertensive disorders of pregnancy. | ||||
| 1.1 Hypertensive disorders of pregnancy (any type) | 1 | 375 | Risk Ratio (M‐H, Fixed, 95% CI) | 1.24 [0.81, 1.90] |
| 1.2 Pregnancy‐induced hypertension | 1 | 375 | Risk Ratio (M‐H, Fixed, 95% CI) | 1.24 [0.71, 2.19] |
| 1.3 Pre‐eclampsia | 1 | 375 | Risk Ratio (M‐H, Fixed, 95% CI) | 1.23 [0.59, 2.56] |
| 2 Caesarean section Show forest plot | 1 | 375 | Risk Ratio (M‐H, Fixed, 95% CI) | 1.03 [0.79, 1.34] |
| Analysis 1.2  Comparison 1 Oral anti‐diabetic agents versus placebo, Outcome 2 Caesarean section. | ||||
| 3 Large‐for‐gestational age Show forest plot | 1 | 375 | Risk Ratio (M‐H, Fixed, 95% CI) | 0.89 [0.51, 1.58] |
| Analysis 1.3  Comparison 1 Oral anti‐diabetic agents versus placebo, Outcome 3 Large‐for‐gestational age. | ||||
| 4 Use of additional pharmacotherapy Show forest plot | 2 | 434 | Risk Ratio (M‐H, Fixed, 95% CI) | 0.68 [0.42, 1.11] |
| Analysis 1.4  Comparison 1 Oral anti‐diabetic agents versus placebo, Outcome 4 Use of additional pharmacotherapy. | ||||
| 4.1 Placebo | 2 | 434 | Risk Ratio (M‐H, Fixed, 95% CI) | 0.68 [0.42, 1.11] |
| 5 Glycaemic control (end of treatment) (mg/dL) Show forest plot | 1 | 375 | Mean Difference (IV, Fixed, 95% CI) | ‐3.0 [‐5.13, ‐0.87] |
| Analysis 1.5  Comparison 1 Oral anti‐diabetic agents versus placebo, Outcome 5 Glycaemic control (end of treatment) (mg/dL). | ||||
| 6 Weight gain in pregnancy (Kg) Show forest plot | 1 | 375 | Mean Difference (IV, Fixed, 95% CI) | 0.0 [‐0.96, 0.96] |
| Analysis 1.6  Comparison 1 Oral anti‐diabetic agents versus placebo, Outcome 6 Weight gain in pregnancy (Kg). | ||||
| 7 Induction of labour Show forest plot | 1 | 375 | Risk Ratio (M‐H, Fixed, 95% CI) | 1.18 [0.79, 1.76] |
| Analysis 1.7  Comparison 1 Oral anti‐diabetic agents versus placebo, Outcome 7 Induction of labour. | ||||
| 8 Perineal trauma Show forest plot | 1 | 375 | Risk Ratio (M‐H, Fixed, 95% CI) | 0.98 [0.06, 15.62] |
| Analysis 1.8  Comparison 1 Oral anti‐diabetic agents versus placebo, Outcome 8 Perineal trauma. | ||||
| 9 Stillbirth Show forest plot | 1 | 375 | Risk Ratio (M‐H, Fixed, 95% CI) | 0.49 [0.05, 5.38] |
| Analysis 1.9  Comparison 1 Oral anti‐diabetic agents versus placebo, Outcome 9 Stillbirth. | ||||
| 10 Neonatal death Show forest plot | 1 | 375 | Risk Ratio (M‐H, Fixed, 95% CI) | 0.0 [0.0, 0.0] |
| Analysis 1.10  Comparison 1 Oral anti‐diabetic agents versus placebo, Outcome 10 Neonatal death. | ||||
| 11 Small‐for‐gestational age Show forest plot | 1 | 375 | Risk Ratio (M‐H, Fixed, 95% CI) | 1.11 [0.58, 2.10] |
| Analysis 1.11  Comparison 1 Oral anti‐diabetic agents versus placebo, Outcome 11 Small‐for‐gestational age. | ||||
| 12 Macrosomia Show forest plot | 1 | 375 | Risk Ratio (M‐H, Fixed, 95% CI) | 0.71 [0.36, 1.41] |
| Analysis 1.12  Comparison 1 Oral anti‐diabetic agents versus placebo, Outcome 12 Macrosomia. | ||||
| 13 Birthweight (g) Show forest plot | 1 | 375 | Mean Difference (IV, Fixed, 95% CI) | ‐33.0 [‐134.53, 68.53] |
| Analysis 1.13  Comparison 1 Oral anti‐diabetic agents versus placebo, Outcome 13 Birthweight (g). | ||||
| 14 Shoulder dystocia Show forest plot | 1 | 375 | Risk Ratio (M‐H, Fixed, 95% CI) | 0.33 [0.01, 8.00] |
| Analysis 1.14  Comparison 1 Oral anti‐diabetic agents versus placebo, Outcome 14 Shoulder dystocia. | ||||
| 15 Bone fracture Show forest plot | 1 | 375 | Risk Ratio (M‐H, Fixed, 95% CI) | 0.74 [0.17, 3.25] |
| Analysis 1.15 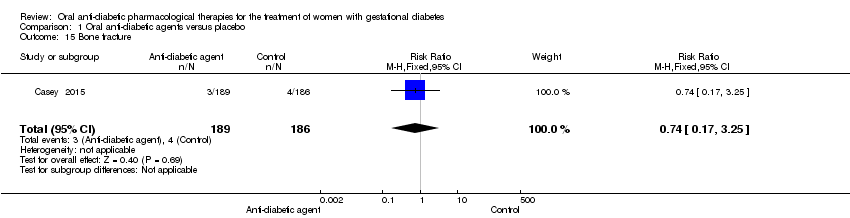 Comparison 1 Oral anti‐diabetic agents versus placebo, Outcome 15 Bone fracture. | ||||
| 16 Nerve palsy Show forest plot | 1 | 375 | Risk Ratio (M‐H, Fixed, 95% CI) | 0.33 [0.01, 8.00] |
| Analysis 1.16  Comparison 1 Oral anti‐diabetic agents versus placebo, Outcome 16 Nerve palsy. | ||||
| 17 Gestational age at birth (weeks) Show forest plot | 1 | 375 | Mean Difference (IV, Fixed, 95% CI) | 0.0 [‐0.32, 0.32] |
| Analysis 1.17 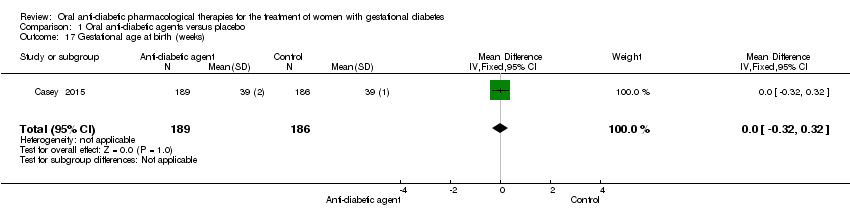 Comparison 1 Oral anti‐diabetic agents versus placebo, Outcome 17 Gestational age at birth (weeks). | ||||
| 18 Neonatal hypoglycaemia Show forest plot | 1 | 375 | Risk Ratio (M‐H, Fixed, 95% CI) | 1.97 [0.36, 10.62] |
| Analysis 1.18  Comparison 1 Oral anti‐diabetic agents versus placebo, Outcome 18 Neonatal hypoglycaemia. | ||||
| 19 Hyperbilirubinaemia Show forest plot | 1 | 375 | Risk Ratio (M‐H, Fixed, 95% CI) | 1.97 [0.50, 7.75] |
| Analysis 1.19  Comparison 1 Oral anti‐diabetic agents versus placebo, Outcome 19 Hyperbilirubinaemia. | ||||
| 20 Admission to NICU Show forest plot | 1 | 375 | Risk Ratio (M‐H, Fixed, 95% CI) | 1.16 [0.53, 2.53] |
| Analysis 1.20  Comparison 1 Oral anti‐diabetic agents versus placebo, Outcome 20 Admission to NICU. | ||||
| Outcome or subgroup title | No. of studies | No. of participants | Statistical method | Effect size |
| 1 Hypertensive disorders of pregnancy Show forest plot | 3 | 508 | Risk Ratio (M‐H, Fixed, 95% CI) | 0.70 [0.38, 1.30] |
| Analysis 2.1  Comparison 2 Metformin versus glibenclamide, Outcome 1 Hypertensive disorders of pregnancy. | ||||
| 1.1 Pre‐eclampsia | 1 | 149 | Risk Ratio (M‐H, Fixed, 95% CI) | 0.66 [0.11, 3.82] |
| 1.2 Pregnancy‐induced hypertension | 2 | 359 | Risk Ratio (M‐H, Fixed, 95% CI) | 0.71 [0.37, 1.37] |
| 2 Caesarean section Show forest plot | 4 | 554 | Risk Ratio (M‐H, Random, 95% CI) | 1.20 [0.83, 1.72] |
| Analysis 2.2  Comparison 2 Metformin versus glibenclamide, Outcome 2 Caesarean section. | ||||
| 2.1 Carpenter and Coustan criteria | 2 | 195 | Risk Ratio (M‐H, Random, 95% CI) | 2.36 [0.53, 10.52] |
| 2.2 National Diabetes Data Group criteria | 1 | 159 | Risk Ratio (M‐H, Random, 95% CI) | 1.12 [0.75, 1.68] |
| 2.3 World Health Organization (1999) | 1 | 200 | Risk Ratio (M‐H, Random, 95% CI) | 0.95 [0.78, 1.15] |
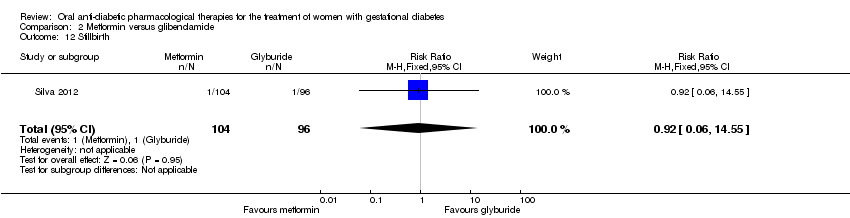
| 3 Perinatal mortality Show forest plot | 2 | 359 | Risk Ratio (M‐H, Fixed, 95% CI) | 0.92 [0.06, 14.55] |
| Analysis 2.3  Comparison 2 Metformin versus glibenclamide, Outcome 3 Perinatal mortality. | ||||
| 4 Large‐for‐gestational age Show forest plot | 2 | 246 | Risk Ratio (M‐H, Random, 95% CI) | 0.67 [0.24, 1.83] |
| Analysis 2.4  Comparison 2 Metformin versus glibenclamide, Outcome 4 Large‐for‐gestational age. | ||||
| 4.1 Carpenter and Coustan criteria | 1 | 46 | Risk Ratio (M‐H, Random, 95% CI) | 1.25 [0.38, 4.07] |
| 4.2 World Health Organization (1999) | 1 | 200 | Risk Ratio (M‐H, Random, 95% CI) | 0.44 [0.21, 0.92] |
| 5 Death or serious morbidity composite Show forest plot | 1 | 159 | Risk Ratio (M‐H, Fixed, 95% CI) | 0.54 [0.31, 0.94] |
| Analysis 2.5  Comparison 2 Metformin versus glibenclamide, Outcome 5 Death or serious morbidity composite. | ||||
| 6 Use of additional pharmacotherapy Show forest plot | 5 | 660 | Risk Ratio (M‐H, Random, 95% CI) | 0.66 [0.28, 1.57] |
| Analysis 2.6  Comparison 2 Metformin versus glibenclamide, Outcome 6 Use of additional pharmacotherapy. | ||||
| 7 Maternal hypoglycaemia Show forest plot | 3 | 354 | Risk Ratio (M‐H, Fixed, 95% CI) | 0.89 [0.36, 2.19] |
| Analysis 2.7  Comparison 2 Metformin versus glibenclamide, Outcome 7 Maternal hypoglycaemia. | ||||
| 8 Glycaemic control (mg/L; mmol/L) Show forest plot | 3 | Std. Mean Difference (IV, Fixed, 95% CI) | Subtotals only | |
| Analysis 2.8  Comparison 2 Metformin versus glibenclamide, Outcome 8 Glycaemic control (mg/L; mmol/L). | ||||
| 8.1 Fasting blood glucose | 3 | 508 | Std. Mean Difference (IV, Fixed, 95% CI) | 0.19 [0.02, 0.37] |
| 8.2 Postprandial blood glucose | 3 | 508 | Std. Mean Difference (IV, Fixed, 95% CI) | 0.16 [‐0.01, 0.34] |
| 8.3 HbA1c | 1 | 200 | Std. Mean Difference (IV, Fixed, 95% CI) | ‐0.12 [‐0.39, 0.16] |
| 9 Weight gain in pregnancy (Kg) Show forest plot | 1 | 200 | Mean Difference (IV, Fixed, 95% CI) | ‐2.06 [‐3.98, ‐0.14] |
| Analysis 2.9  Comparison 2 Metformin versus glibenclamide, Outcome 9 Weight gain in pregnancy (Kg). | ||||
| 10 Induction of labour Show forest plot | 1 | 159 | Risk Ratio (M‐H, Fixed, 95% CI) | 0.81 [0.61, 1.07] |
| Analysis 2.10  Comparison 2 Metformin versus glibenclamide, Outcome 10 Induction of labour. | ||||
| 11 Perineal trauma Show forest plot | 2 | 308 | Risk Ratio (M‐H, Fixed, 95% CI) | 1.67 [0.22, 12.52] |
| Analysis 2.11  Comparison 2 Metformin versus glibenclamide, Outcome 11 Perineal trauma. | ||||
| 12 Stillbirth Show forest plot | 1 | 200 | Risk Ratio (M‐H, Fixed, 95% CI) | 0.92 [0.06, 14.55] |
| Analysis 2.12  Comparison 2 Metformin versus glibenclamide, Outcome 12 Stillbirth. | ||||
| 13 Macrosomia Show forest plot | 2 | 308 | Risk Ratio (M‐H, Fixed, 95% CI) | 0.72 [0.23, 2.21] |
| Analysis 2.13  Comparison 2 Metformin versus glibenclamide, Outcome 13 Macrosomia. | ||||
| 14 Birth trauma Show forest plot | 1 | 159 | Risk Ratio (M‐H, Fixed, 95% CI) | 0.0 [0.0, 0.0] |
| Analysis 2.14 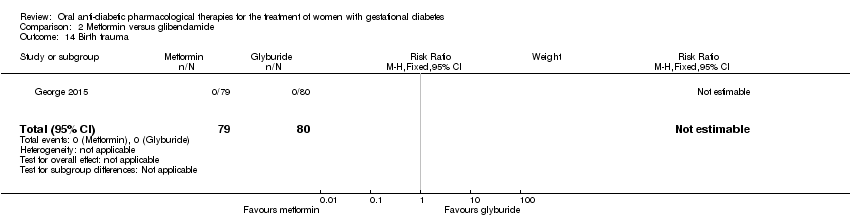 Comparison 2 Metformin versus glibenclamide, Outcome 14 Birth trauma. | ||||
| 15 Shoulder dystocia Show forest plot | 2 | 195 | Risk Ratio (M‐H, Fixed, 95% CI) | 0.99 [0.14, 6.89] |
| Analysis 2.15  Comparison 2 Metformin versus glibenclamide, Outcome 15 Shoulder dystocia. | ||||
| 16 Gestational age at birth (weeks) Show forest plot | 3 | 508 | Mean Difference (IV, Fixed, 95% CI) | 0.03 [‐0.22, 0.28] |
| Analysis 2.16  Comparison 2 Metformin versus glibenclamide, Outcome 16 Gestational age at birth (weeks). | ||||
| 17 Preterm birth Show forest plot | 3 | 508 | Risk Ratio (M‐H, Fixed, 95% CI) | 1.59 [0.59, 4.29] |
| Analysis 2.17  Comparison 2 Metformin versus glibenclamide, Outcome 17 Preterm birth. | ||||
| 18 5‐minute Apgar < 7 Show forest plot | 1 | 149 | Risk Ratio (M‐H, Fixed, 95% CI) | 0.0 [0.0, 0.0] |
| Analysis 2.18  Comparison 2 Metformin versus glibenclamide, Outcome 18 5‐minute Apgar < 7. | ||||
| 19 Birthweight (g) Show forest plot | 2 | 349 | Mean Difference (IV, Fixed, 95% CI) | ‐209.13 [‐314.53, ‐103.73] |
| Analysis 2.19 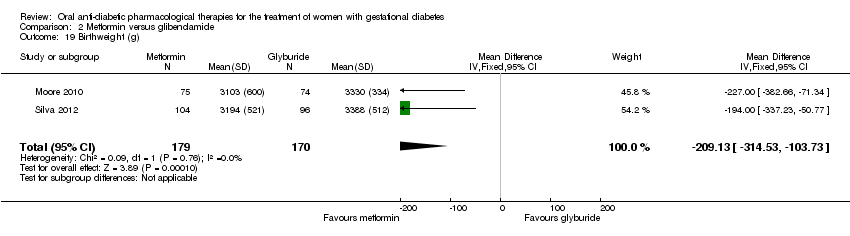 Comparison 2 Metformin versus glibenclamide, Outcome 19 Birthweight (g). | ||||
| 20 Ponderal index Show forest plot | 1 | 200 | Mean Difference (IV, Fixed, 95% CI) | ‐0.09 [‐0.17, ‐0.01] |
| Analysis 2.20 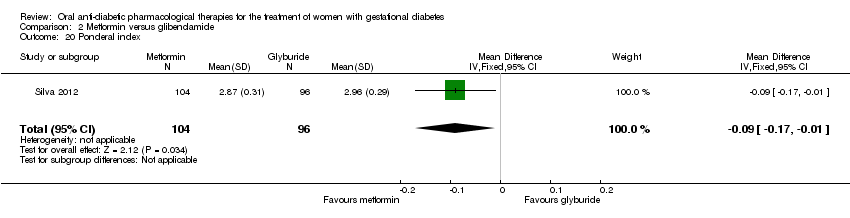 Comparison 2 Metformin versus glibenclamide, Outcome 20 Ponderal index. | ||||
| 21 Neonatal hypoglycaemia Show forest plot | 4 | 554 | Risk Ratio (M‐H, Fixed, 95% CI) | 0.86 [0.42, 1.77] |
| Analysis 2.21  Comparison 2 Metformin versus glibenclamide, Outcome 21 Neonatal hypoglycaemia. | ||||
| 22 Respiratory distress syndrome Show forest plot | 1 | 159 | Risk Ratio (M‐H, Fixed, 95% CI) | 0.51 [0.10, 2.69] |
| Analysis 2.22  Comparison 2 Metformin versus glibenclamide, Outcome 22 Respiratory distress syndrome. | ||||
| 23 Hyperbilirubinaemia Show forest plot | 2 | 205 | Risk Ratio (M‐H, Fixed, 95% CI) | 0.68 [0.37, 1.25] |
| Analysis 2.23  Comparison 2 Metformin versus glibenclamide, Outcome 23 Hyperbilirubinaemia. | ||||
| 24 Admission to NICU Show forest plot | 2 | 349 | Risk Ratio (M‐H, Fixed, 95% CI) | 1.52 [0.65, 3.56] |
| Analysis 2.24  Comparison 2 Metformin versus glibenclamide, Outcome 24 Admission to NICU. | ||||
| Outcome or subgroup title | No. of studies | No. of participants | Statistical method | Effect size |
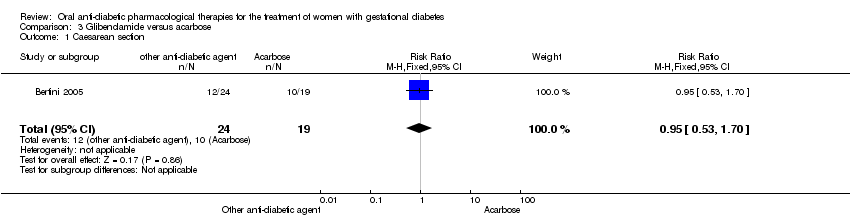
| 1 Caesarean section Show forest plot | 1 | 43 | Risk Ratio (M‐H, Fixed, 95% CI) | 0.95 [0.53, 1.70] |
| Analysis 3.1  Comparison 3 Glibenclamide versus acarbose, Outcome 1 Caesarean section. | ||||
| 2 Perinatal mortality Show forest plot | 1 | 43 | Risk Ratio (M‐H, Fixed, 95% CI) | 0.0 [0.0, 0.0] |
| Analysis 3.2  Comparison 3 Glibenclamide versus acarbose, Outcome 2 Perinatal mortality. | ||||
| 3 Large‐for‐gestational age Show forest plot | 1 | 43 | Risk Ratio (M‐H, Fixed, 95% CI) | 2.38 [0.54, 10.46] |
| Analysis 3.3  Comparison 3 Glibenclamide versus acarbose, Outcome 3 Large‐for‐gestational age. | ||||
| 4 Need for additional pharmacotherapy Show forest plot | 1 | 43 | Risk Ratio (M‐H, Fixed, 95% CI) | 0.49 [0.19, 1.27] |
| Analysis 3.4  Comparison 3 Glibenclamide versus acarbose, Outcome 4 Need for additional pharmacotherapy. | ||||
| 5 Maternal hypoglycaemia Show forest plot | 1 | 43 | Risk Ratio (M‐H, Fixed, 95% CI) | 0.0 [0.0, 0.0] |
| Analysis 3.5  Comparison 3 Glibenclamide versus acarbose, Outcome 5 Maternal hypoglycaemia. | ||||
| 6 Weight gain in pregnancy (Kg) Show forest plot | 1 | 43 | Mean Difference (IV, Fixed, 95% CI) | ‐0.60 [‐3.13, 1.93] |
| Analysis 3.6  Comparison 3 Glibenclamide versus acarbose, Outcome 6 Weight gain in pregnancy (Kg). | ||||
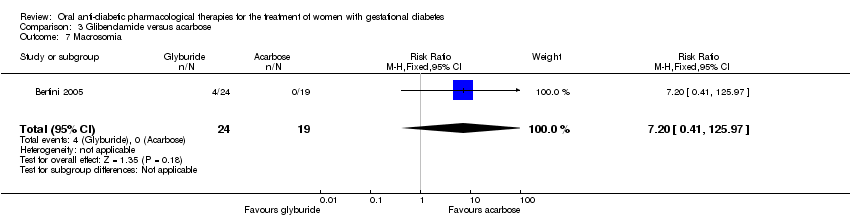
| 7 Macrosomia Show forest plot | 1 | 43 | Risk Ratio (M‐H, Fixed, 95% CI) | 7.20 [0.41, 125.97] |
| Analysis 3.7  Comparison 3 Glibenclamide versus acarbose, Outcome 7 Macrosomia. | ||||
| 8 Small‐for‐gestational age Show forest plot | 1 | 43 | Risk Ratio (M‐H, Fixed, 95% CI) | 0.0 [0.0, 0.0] |
| Analysis 3.8  Comparison 3 Glibenclamide versus acarbose, Outcome 8 Small‐for‐gestational age. | ||||
| 9 Birth trauma (not specified) Show forest plot | 1 | 43 | Risk Ratio (M‐H, Fixed, 95% CI) | 0.0 [0.0, 0.0] |
| Analysis 3.9  Comparison 3 Glibenclamide versus acarbose, Outcome 9 Birth trauma (not specified). | ||||
| 10 Gestational age at birth (weeks) Show forest plot | 1 | 43 | Mean Difference (IV, Fixed, 95% CI) | ‐0.10 [‐0.82, 0.62] |
| Analysis 3.10  Comparison 3 Glibenclamide versus acarbose, Outcome 10 Gestational age at birth (weeks). | ||||
| 11 Preterm birth Show forest plot | 1 | 43 | Risk Ratio (M‐H, Fixed, 95% CI) | 0.0 [0.0, 0.0] |
| Analysis 3.11  Comparison 3 Glibenclamide versus acarbose, Outcome 11 Preterm birth. | ||||
| 12 Birthweight (Kg) Show forest plot | 1 | 43 | Mean Difference (IV, Fixed, 95% CI) | 153.0 [‐123.52, 429.52] |
| Analysis 3.12 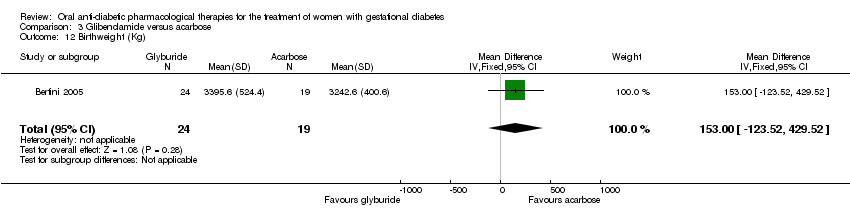 Comparison 3 Glibenclamide versus acarbose, Outcome 12 Birthweight (Kg). | ||||
| 13 Neonatal hypoglycaemia Show forest plot | 1 | 43 | Risk Ratio (M‐H, Fixed, 95% CI) | 6.33 [0.87, 46.32] |
| Analysis 3.13  Comparison 3 Glibenclamide versus acarbose, Outcome 13 Neonatal hypoglycaemia. | ||||
| 14 Respiratory distress syndrome Show forest plot | 1 | 43 | Risk Ratio (M‐H, Fixed, 95% CI) | 0.0 [0.0, 0.0] |
| Analysis 3.14  Comparison 3 Glibenclamide versus acarbose, Outcome 14 Respiratory distress syndrome. | ||||

Study flow diagram

Risk of bias graph: review authors' judgements about each risk of bias item presented as percentages across all included studies

Risk of bias summary: review authors' judgements about each risk of bias item for each included study

Comparison 1 Oral anti‐diabetic agents versus placebo, Outcome 1 Hypertensive disorders of pregnancy.

Comparison 1 Oral anti‐diabetic agents versus placebo, Outcome 2 Caesarean section.

Comparison 1 Oral anti‐diabetic agents versus placebo, Outcome 3 Large‐for‐gestational age.

Comparison 1 Oral anti‐diabetic agents versus placebo, Outcome 4 Use of additional pharmacotherapy.

Comparison 1 Oral anti‐diabetic agents versus placebo, Outcome 5 Glycaemic control (end of treatment) (mg/dL).

Comparison 1 Oral anti‐diabetic agents versus placebo, Outcome 6 Weight gain in pregnancy (Kg).

Comparison 1 Oral anti‐diabetic agents versus placebo, Outcome 7 Induction of labour.

Comparison 1 Oral anti‐diabetic agents versus placebo, Outcome 8 Perineal trauma.

Comparison 1 Oral anti‐diabetic agents versus placebo, Outcome 9 Stillbirth.

Comparison 1 Oral anti‐diabetic agents versus placebo, Outcome 10 Neonatal death.

Comparison 1 Oral anti‐diabetic agents versus placebo, Outcome 11 Small‐for‐gestational age.

Comparison 1 Oral anti‐diabetic agents versus placebo, Outcome 12 Macrosomia.

Comparison 1 Oral anti‐diabetic agents versus placebo, Outcome 13 Birthweight (g).

Comparison 1 Oral anti‐diabetic agents versus placebo, Outcome 14 Shoulder dystocia.

Comparison 1 Oral anti‐diabetic agents versus placebo, Outcome 15 Bone fracture.

Comparison 1 Oral anti‐diabetic agents versus placebo, Outcome 16 Nerve palsy.

Comparison 1 Oral anti‐diabetic agents versus placebo, Outcome 17 Gestational age at birth (weeks).

Comparison 1 Oral anti‐diabetic agents versus placebo, Outcome 18 Neonatal hypoglycaemia.
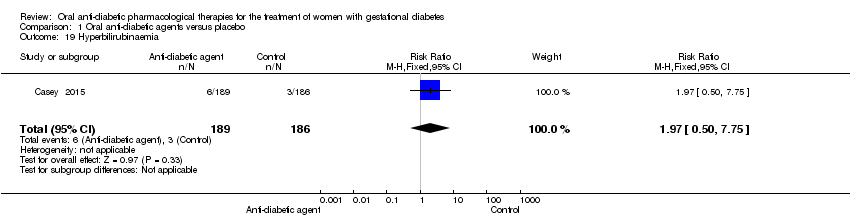
Comparison 1 Oral anti‐diabetic agents versus placebo, Outcome 19 Hyperbilirubinaemia.

Comparison 1 Oral anti‐diabetic agents versus placebo, Outcome 20 Admission to NICU.

Comparison 2 Metformin versus glibenclamide, Outcome 1 Hypertensive disorders of pregnancy.

Comparison 2 Metformin versus glibenclamide, Outcome 2 Caesarean section.

Comparison 2 Metformin versus glibenclamide, Outcome 3 Perinatal mortality.

Comparison 2 Metformin versus glibenclamide, Outcome 4 Large‐for‐gestational age.

Comparison 2 Metformin versus glibenclamide, Outcome 5 Death or serious morbidity composite.

Comparison 2 Metformin versus glibenclamide, Outcome 6 Use of additional pharmacotherapy.

Comparison 2 Metformin versus glibenclamide, Outcome 7 Maternal hypoglycaemia.

Comparison 2 Metformin versus glibenclamide, Outcome 8 Glycaemic control (mg/L; mmol/L).

Comparison 2 Metformin versus glibenclamide, Outcome 9 Weight gain in pregnancy (Kg).

Comparison 2 Metformin versus glibenclamide, Outcome 10 Induction of labour.

Comparison 2 Metformin versus glibenclamide, Outcome 11 Perineal trauma.
Comparison 2 Metformin versus glibenclamide, Outcome 12 Stillbirth.

Comparison 2 Metformin versus glibenclamide, Outcome 13 Macrosomia.

Comparison 2 Metformin versus glibenclamide, Outcome 14 Birth trauma.

Comparison 2 Metformin versus glibenclamide, Outcome 15 Shoulder dystocia.

Comparison 2 Metformin versus glibenclamide, Outcome 16 Gestational age at birth (weeks).

Comparison 2 Metformin versus glibenclamide, Outcome 17 Preterm birth.

Comparison 2 Metformin versus glibenclamide, Outcome 18 5‐minute Apgar < 7.

Comparison 2 Metformin versus glibenclamide, Outcome 19 Birthweight (g).

Comparison 2 Metformin versus glibenclamide, Outcome 20 Ponderal index.

Comparison 2 Metformin versus glibenclamide, Outcome 21 Neonatal hypoglycaemia.

Comparison 2 Metformin versus glibenclamide, Outcome 22 Respiratory distress syndrome.

Comparison 2 Metformin versus glibenclamide, Outcome 23 Hyperbilirubinaemia.

Comparison 2 Metformin versus glibenclamide, Outcome 24 Admission to NICU.
Comparison 3 Glibenclamide versus acarbose, Outcome 1 Caesarean section.

Comparison 3 Glibenclamide versus acarbose, Outcome 2 Perinatal mortality.

Comparison 3 Glibenclamide versus acarbose, Outcome 3 Large‐for‐gestational age.

Comparison 3 Glibenclamide versus acarbose, Outcome 4 Need for additional pharmacotherapy.

Comparison 3 Glibenclamide versus acarbose, Outcome 5 Maternal hypoglycaemia.

Comparison 3 Glibenclamide versus acarbose, Outcome 6 Weight gain in pregnancy (Kg).
Comparison 3 Glibenclamide versus acarbose, Outcome 7 Macrosomia.

Comparison 3 Glibenclamide versus acarbose, Outcome 8 Small‐for‐gestational age.

Comparison 3 Glibenclamide versus acarbose, Outcome 9 Birth trauma (not specified).

Comparison 3 Glibenclamide versus acarbose, Outcome 10 Gestational age at birth (weeks).

Comparison 3 Glibenclamide versus acarbose, Outcome 11 Preterm birth.

Comparison 3 Glibenclamide versus acarbose, Outcome 12 Birthweight (Kg).

Comparison 3 Glibenclamide versus acarbose, Outcome 13 Neonatal hypoglycaemia.

Comparison 3 Glibenclamide versus acarbose, Outcome 14 Respiratory distress syndrome.
| Oral anti‐diabetic pharmacological therapies versus placebo ‐ maternal outcomes | ||||||
| Patient or population: women diagnosed with gestational diabetes; 24‐30 weeks' gestation; singleton pregnancy. Setting: Medical Centre, USA. | ||||||
| Outcomes | Anticipated absolute effects* (95% CI) | Relative effect | № of participants | Quality of the evidence | Comments | |
| Risk with placebo | Risk with oral anti‐diabetic pharmacological therapies | |||||
| Hypertensive disorders of pregnancy ‐ (any type) | 167 per 1000 | 207 per 1000 | RR 1.24 | 375 | ⊕⊝⊝⊝ | |
| Caearean section | 360 per 1000 | 371 per 1000 | RR 1.03 | 375 | ⊕⊝⊝⊝ | |
| Development of type 2 diabetes ‐ not measured | see comment | see comment | not estimable | ‐ | ‐ | This was not a pre‐specified outcome for the included studies reporting on this comparison |
| Perineal trauma | 5 per 1000 | 5 per 1000 | RR 0.98 | 375 | ⊕⊝⊝⊝ | Event rates were low 1/189 for anti‐diabetic pharmacological therapy and 1/186 in the control (placebo) group |
| Return to pre‐pregnancy weight ‐ not measured | see comment | see comment | not estimable | ‐ | ‐ | This was not a pre‐specified outcome for the included studies reporting on this comparison |
| Postnatal depression ‐ not measured | see comment | see comment | not estimable | ‐ | ‐ | This was not a pre‐specified outcome for the included studies reporting on this comparison |
| Induction of labour | 188 per 1000 | 222 per 1000 | RR 1.18 | 375 | ⊕⊝⊝⊝ | |
| *The risk in the intervention group (and its 95% confidence interval) is based on the assumed risk in the comparison group and the relative effect of the intervention (and its 95% CI). | ||||||
| GRADE Working Group grades of evidence | ||||||
| aRisk of bias ‐ we did not find a published protocol and there were more outcomes reported in the published paper than were listed in the trial registration document ‐ downgraded 1 level. | ||||||
| Oral anti‐diabetic pharmacological therapies versus placebo ‐ neonatal outcomes | ||||||
| Patient or population: infants of women diagnosed with gestational diabetes Setting: Medical Centre, USA Comparison: placebo | ||||||
| Outcomes | Anticipated absolute effects* (95% CI) | Relative effect | № of participants | Quality of the evidence | Comments | |
| Risk with placebo | Risk with oral anti‐diabetic pharmacological therapies | |||||
| Large‐for‐gestational age | 118 per 1000 | 105 per 1000 | RR 0.89 | 375 | ⊕⊝⊝⊝ | |
| Perinatal mortality | see comment | see comment | not estimable | ‐ | ‐ | None of the included studies pre‐specified this outcome |
| Death or serious morbidity composite ‐ not reported | see comment | see comment | not estimable | ‐ | ‐ | None of the included studies pre‐specified this outcome |
| Neonatal hypoglycaemia | 11 per 1000 | 21 per 1000 | RR 1.97 | 375 | ⊕⊝⊝⊝ | Event rates were low with 4/189 for oral anti‐diabetic pharmacological therapy and 2/186 for placebo group |
| Adiposity (neonate, child, adult) ‐ not measured | see comment | see comment | not estimable | ‐ | ‐ | None of the included studies pre‐specified this outcome |
| Diabetes (child, adult) ‐ not measured | see comment | see comment | not estimable | ‐ | ‐ | None of the included studies pre‐specified this outcome |
| Neurosensory disability in later childhood ‐ not measured | see comment | see comment | not estimable | ‐ | ‐ | None of the included studies pre‐specified this outcome |
| *The risk in the intervention group (and its 95% confidence interval) is based on the assumed risk in the comparison group and the relative effect of the intervention (and its 95% CI). | ||||||
| GRADE Working Group grades of evidence | ||||||
| aRisk of bias ‐ we did not find a published protocol and there were more outcomes reported in the published paper than were listed in the trial registration document ‐ downgraded 1 level. | ||||||
| Metformin versus glibenclamide ‐ maternal outcomes | ||||||
| Patient or population: women diagnosed with gestational diabetes Setting: trials conducted in Brazil, India and the USA | ||||||
| Outcomes | Anticipated absolute effects* (95% CI) | Relative effect | № of participants | Quality of the evidence | Comments | |
| Risk with glibenclamide | Risk with metformin | |||||
| Hypertensive disorders of pregnancy | 88 per 1000 | 62 per 1000 | RR 0.70 | 508 | ⊕⊕⊕⊝ | |
| Caesarean section | 392 per 1000 | 470 per 1000 | RR 1.20 | 554 | ⊕⊕⊝⊝ | |
| Development of type 2 diabetes ‐ not measured | see comment | see comment | not estimable | ‐ | ‐ | None of the included studies for this comparison had pre‐specified development of type 2 diabetes as an outcome |
| Perineal trauma | 6 per 1000 | 11 per 1000 | RR 1.67 | 308 | ⊕⊕⊝⊝ | Note low event rates (2/154 for metformin and 1/154 for glibenclamide |
| Return to pre‐pregnancy weight ‐ not measured | see comment | see comment | not estimable | ‐ | ‐ | None of the included studies for this comparison had return to pre‐pregnancy weight as a pre‐specified outcome |
| Postnatal depression ‐ not measured | see comment | see comment | not estimable | ‐ | ‐ | None of the included studies for this comparison had postnatal depression as a pre‐specified outcome |
| Induction of labour | 613 per 1000 | 496 per 1000 | RR 0.81 | 159 | ⊕⊕⊝⊝ | |
| *The risk in the intervention group (and its 95% confidence interval) is based on the assumed risk in the comparison group and the relative effect of the intervention (and its 95% CI). | ||||||
| GRADE Working Group grades of evidence | ||||||
| aRisk of bias ‐ all studies were open label ‐ downgraded 1 level. | ||||||
| Metformin versus glibenclamide ‐ neonatal outcomes | ||||||
| Patient or population: Infants of women diagnosed with gestational diabetes Setting: trials conducted in Brazil, India and the USA | ||||||
| Outcomes | Anticipated absolute effects* (95% CI) | Relative effect | № of participants | Quality of the evidence | Comments | |
| Risk with glibenclamide | Risk with metformin | |||||
| Large‐for‐gestational age | 193 per 1000 | 129 per 1000 | RR 0.67 | 246 | ⊕⊕⊝⊝ | |
| Perinatal mortality | 6 per 1000 | 5 per 1000 | RR 0.92 | 359 | ⊕⊝⊝⊝ | Note that event rates were very low. 1 study had no event of perinatal death in either the metformin nor the glibenclamide group. The second study had 1 death in each group |
| Death or serious morbidity composite | 350 per 1000 | 189 per 1000 | RR 0.54 | 159 | ⊕⊕⊝⊝ | |
| Neonatal hypoglycaemia | 48 per 1000 | 41 per 1000 | RR 0.86 | 554 | ⊕⊕⊝⊝ | |
| Adiposity ‐ not measured | see comment | see comment | not estimable | ‐ | ‐ | None of the included trials for this comparison had pre‐specified adiposity as a trial outcome |
| Diabetes ‐ not measured | see comment | see comment | not estimable | ‐ | ‐ | None of the included trials for this comparison had pre‐specified diabetes as a trial outcome |
| Neurosensory disability in later childhood ‐ not measured | see comment | see comment | not estimable | ‐ | ‐ | None of the included trials for this comparison had pre‐specified neurosensory disability as a trial outcome |
| *The risk in the intervention group (and its 95% confidence interval) is based on the assumed risk in the comparison group and the relative effect of the intervention (and its 95% CI). | ||||||
| GRADE Working Group grades of evidence | ||||||
| aRisk of bias ‐ allocation concealment was unclear in 1 study. 1 study was open label ‐ downgraded 1 level. | ||||||
| Glibenclamide versus acarbose ‐ maternal outcomes | ||||||
| Patient or population: women diagnosed with gestational diabetes; 11 to 33 weeks' gestation; singleton pregnancy Setting: Maternity hospital, Brazil | ||||||
| Outcomes | Anticipated absolute effects* (95% CI) | Relative effect | № of participants | Quality of the evidence | Comments | |
| Risk with acarbose | Risk with other oral anti‐diabetic agent | |||||
| Hypertensive disorders of pregnancy ‐ not reported | see comment | see comment | not estimable | ‐ | ‐ | No data were reported for this outcome |
| Caesarean section | 526 per 1000 | 500 per 1000 | RR 0.95 | 43 | ⊕⊕⊝⊝ | |
| Development of type 2 diabetes ‐ not reported | see comment | see comment | not estimable | ‐ | ‐ | No data were reported for this outcome |
| Perineal trauma ‐ not reported | see comment | see comment | not estimable | ‐ | ‐ | No data were reported for this outcome |
| Return to pre‐pregnancy weight ‐ not reported | see comment | see comment | not estimable | ‐ | ‐ | No data were reported for this outcome |
| Postnatal depression ‐ not reported | see comment | see comment | not estimable | ‐ | ‐ | No data were reported for this outcome |
| Induction of labour ‐ not reported | see comment | see comment | not estimable | ‐ | ‐ | No data were reported for this outcome |
| *The risk in the intervention group (and its 95% confidence interval) is based on the assumed risk in the comparison group and the relative effect of the intervention (and its 95% CI). | ||||||
| GRADE Working Group grades of evidence | ||||||
| aMethod of randomisation was unclear and the study was open‐label ‐ downgraded ‐1 level. | ||||||
| Glibenclamide versus acarbose ‐ neonatal outcomes | ||||||
| Patient or population: women with gestational diabetes Setting: maternity hospital, Brazil | ||||||
| Outcomes | Anticipated absolute effects* (95% CI) | Relative effect | № of participants | Quality of the evidence | Comments | |
| Risk with acarbose | Risk with glibenclamide | |||||
| Large‐for‐gestational age | 105 per 1000 | 251 per 1000 | RR 2.38 | 43 | ⊕⊕⊝⊝ | |
| Perinatal mortality | see comment | see comment | not estimable | 43 (1 RCT) | ⊕⊕⊝⊝ | No events were reported in either group |
| Death or serious morbidity composite ‐ not reported | see comment | see comment | not estimable | ‐ | ‐ | No data were reported for this outcome |
| Neonatal hypoglycaemia | 53/1000 | 333/1000 (46 to 1000) | RR 6.33 (0.87 to 46.32) | 43 | ⊕⊕⊝⊝ | Low event rates and sample size (8/24 in glibenclamide group and 1/19 in acarbose group) |
| Adiposity ‐ not reported | see comment | see comment | not estimable | ‐ | ‐ | No data were reported for this outcome |
| Diabetes ‐ not reported | see comment | see comment | not estimable | ‐ | ‐ | No data were reported for this outcome |
| Neurosensory disability in later childhood ‐ not reported | see comment | see comment | not estimable | ‐ | ‐ | No data were reported for this outcome |
| *The risk in the intervention group (and its 95% confidence interval) is based on the assumed risk in the comparison group and the relative effect of the intervention (and its 95% CI). | ||||||
| GRADE Working Group grades of evidence | ||||||
| aRisk of bias ‐ evidence of selective reporting ‐ downgraded 1 level. | ||||||
| Organisation/professional body | Screening and diagnostic criteria | |||||
| 1‐hour oral glucose challenge test | Oral glucose tolerance test | Fasting | 1 hour | 2 hour | 3 hour | |
| ADA 2013a, IADPSG 2010a, ADIPS 2013 (Nankervis 2014)a, WHO 2014a | ‐ | 75 g | ≥ 5.1 mmol/L (≥ 92 mg/dL) | ≥ 10 mmol/L (≥ 180 mg/dL) | ≥ 8.5 mmol/L (≥ 153 mg/dL) | ‐ |
| Carpenter and Coustanb National Diabetes Data Groupb | 50 g (> 7.2 mmol/L; > 130 mg/dL) | 100 g | ≥ 5.3 mmol/L (≥ 95 mg/dL) | ≥ 10 mmol/L (≥180 mg/dL) | ≥ 8.6 mmol/L (≥ 155 mg/dL) | ≥ 7.8 mmol/L (≥ 140 mg/dL) |
| 50 g (> 7.8 mmol/L; > 140 mg/dL) | 100 g | ≥ 5.8 mmol/L (≥ 105 mg/dL) | ≥ 10.6 mmol/L (≥ 190 mg/dL) | ≥ 9.2 mmol/L (≥ 165 mg/dL) | ≥ 8.0 mmol/L (≥ 145 mg/dL) | |
| Canadian Diabetes Association 2013 eithera orb | 50 g ‐ | 75 g 75 g | ≥ 5.3 mmol/L (≥ 95 mg/dL) ≥ 5.1 mmol/L (≥ 92 mg/dL) | ≥ 10.6 mmol/L (≥ 190 mg/dL) ≥ 10 mmol/L (≥ 180 mg/dL) | ≥ 9.0 mmol/L ≥ 8.5 mmol/L (≥ 153 mg/dL) | |
| ‐ | 75 g | ≥ 5.6 mmol/L (≥ 101 mg/dL) | ‐ | ≥ 7.8 mmol/L (≥ 140 mg/dL) | ‐ | |
| NICE 2008; WHO 1999; Hoffman 1998 (ADIPS)b | ‐ | 75 g | ≥ 7.0 mmol/L (≥ 126 mg/dL) | ‐ | ≥ 11.1 mmol/L (≥ 200 mg/dL) | ‐ |
| New Zealand Ministry of Health 2014a | 50 g if HbA1c < 41 mmol/mol (≥ 7.8 mmol/L; ≥ 140 mg/dL) | 75 g | ≥ 5.5 mmol/L (≥ 99 mg/dL) | ‐ | ≥ 9.0 mmol/L (≥ 162 mg/dL) | ‐ |
| ADA: American Diabetes Association | ||||||
| Study ID | Intervention | Comparison |
| 31.2 ± 4.5 (n = 24), glibenclamide | 31.5 ± 5.8 (n = 19), acarbose | |
| 31.3 ± 6, glibenclamide | 31.2 ± 6, placebo | |
| Not stated, acarbose | Not stated, placebo | |
| Not stated, glibenclamide | Not stated, metformin | |
| Not stated, glibenclamide | Not stated, metformin | |
| 33.4 ± 4.4 (n = 79), metformin | 33.6 ± 4.6 (n = 80), glibenclamide | |
| 31 ± 7.1 (n = 75) ‐ metformin | 29.6 ± 7.8 (n = 74), glibenclamide | |
| Not stated, metformin | Not stated, standard care | |
| Not stated, metformin | Not stated, glibenclamide | |
| Chlopropramide 30.9 (n = 58) Tolbutamide 29.7 (n = 46) | Diet 32.7 (n = 56) | |
| 32.6 ± 5.6 (n = 104), metformin | 31.3 ± 5.4 (n = 96), glibenclamide |
| Study ID | Intervention | Comparison | Timepoint BMI measured at |
| 27.5 ± 5.8 (n = 24), glibenclamide | 25.7 ± 4.2 (n = 19), acarbose | Not stated | |
| 29.0 ± 4.8 | 28.9 ± 5.3 | Pre‐pregnancy | |
| Not stated | Not stated | Not stated | |
| Not stated | Not stated | Not stated | |
| Not stated | Not stated | Not stated | |
| 28.7 ± 4.4 (n = 79), metformin | 28.8 ± 4.0 (n = 80), glibenclamide | Baseline | |
| 32.8 ± 5.8 (n = 75), metformin | 32.7 ± 7.0 (n = 74), glibenclamide | Not stated | |
| Not stated | Not stated | Not stated | |
| Not stated | Not stated | Not stated | |
| 28.7 ± 5.4 (n = 104), metformin | 28.6 ± 5.9 (n = 96), glibenclamide | Not stated |
| Study ID | Intervention | Comparison |
| Not stated | Not stated | |
| 26.0 ± 2.0, glibenclamide | 26.0 ± 1.0, placebo | |
| Not stated | Not stated | |
| Not stated | Not stated | |
| Not stated | Not stated | |
| 29.3 ± 3.3 weeks' (n = 79), metformin | 29.7 ± 3.7 weeks' (n = 80) | |
| 27.3 ± 6.8 weeks' (n = 75), metformin | 29.1 ± 5.0 weeks' (n = 74), glibenclamide | |
| Not stated | Not stated | |
| Not stated | Not stated | |
| Not stated | Not stated | |
| 27.0 ± 6.4 weeks' (n = 104), metformin | 25.4 ± 7.1 weeks' (n = 96), glibenclamide |
| Study ID | Timing | Screening | Diagnosis | Criteria |
| 24‐28 weeks' | 1 hour, 50 g OGCT(≥ 7.8 mmol/L; 140 mg/dL) | 2 abnormal values 3 hour, 100 g OGTT Fasting < 5.8 mmol/L (105 mg/dL) 1‐hour ≥ 10.6 mmol/L (190 mg/dL) 2‐hour ≥ 9.2 mmol/L (165 mg/dL) 3‐hour ≥ 8.1 mmol/L (145 mg/dL) | National Diabetes Data Group | |
| 11‐33 weeks' | Not stated | 75 g OGTT Fasting ≥ 6.1 mmol/L (110 mg/dL); 2‐hour value ≥ 7.8 mmol/L (140 mg/dL). | WHO criteria (old) | |
| 12‐34 weeks' | Not stated | Not stated | Not stated | |
| Not stated | Not stated | Not stated | WHO criteria but not stated if 1999 or 2015 | |
| ‐ | 1 hour 50 g OGCT (≥ 7.8 mmol/L; 140 mg/dL) | 2 abnormal values 100 g OGTT: fasting glucose ≥ 5.3 mmol/L, 1‐hour ≥ 10 mmol/L, 2‐hour ≥ 8.6 mmol/L, 3‐hour ≥ 7.8 mmol/L | Carpenter and Coustan | |
| 24‐28 weeks' | Not stated | 2 abnormal values 100 g OGTT: fasting glucose ≥ 5.3 mmol/L, 1‐hour ≥ 10 mmol/L, 2‐hour ≥ 8.6 mmol/L, 3‐hour ≥ 7.8 mmol/L | National Diabetes Data Group (1979) | |
| 11‐33 weeks' | 1 hour 50 g OGCT (≥ 7.2 mmol/L; 130 mg/dL) | 3 hour 100 g OGTT using criteria with 2 or more abnormal results. | Carpenter and Coustan | |
| Not stated | Not stated | Fasting blood glucose 5.1 to 5.4 mmol/L, 2 hour < 8.5 mmol/L | Not stated | |
| 11‐33 weeks' | 1 hour 50 g OGCT (≥ 7.2 mmol/L; 130 mg/dL) | 3 hour 100 g OGTT using criteria with 2 or more abnormal results. | Carpenter and Coustan | |
| Not stated | Not stated | Not stated | Not stated | |
| Not stated | Not stated | Not stated | WHO criteria (1999) | |
| OGCT oral glucose tolerance test; OGTT oral glucose tolerance test | ||||
| Study ID | Fasting | 1‐hour post‐prandial | 2‐hour post‐prandial |
| < 5.3 mmol/L (95mg/dL) | ‐ | < 6.7mmol/L (120 mg/dL) | |
| < 5.0 mmol/L (90 mg/dL) | ‐ | < 5.5 mmol/L (100 mg/dL) | |
| < 5.3 mmol/L (95 mg/dL) | < 7.5 mmol/L (135 mg/dL) | ‐ | |
| Not stated | Not stated | Not stated | |
| < 5.3 mmol/L (95 mg/dL) | < 7.8 mmol/L (140 mg/dL) | ‐ | |
| ≤ 5.3 mmol/L (95 mg/dL) | ‐ | ≤ 6.7 mmol/L (120 mg/dL) | |
| < 5.8 mmol/L (105 mg/dL) | ‐ | < 6.7 mmol/L (120 mg/dL) | |
| Not stated | Not stated | Not stated | |
| ≤ 5.3 mmol/L (95 mg/dL) | 90 minutes < 7.2 mmol/L (130 mg/dL) | ‐ | |
| ‐ | 8.3 mmol/L* (150 mg/dL) | ‐ | |
| 5.0 mmol/L (90 mg/dL) | < 6.7 mmol/L (120 mg/dL) | ‐ | |
| Post‐prandial timing not specified | |||
| Outcome or subgroup title | No. of studies | No. of participants | Statistical method | Effect size |
| 1 Hypertensive disorders of pregnancy Show forest plot | 1 | Risk Ratio (M‐H, Fixed, 95% CI) | Subtotals only | |
| 1.1 Hypertensive disorders of pregnancy (any type) | 1 | 375 | Risk Ratio (M‐H, Fixed, 95% CI) | 1.24 [0.81, 1.90] |
| 1.2 Pregnancy‐induced hypertension | 1 | 375 | Risk Ratio (M‐H, Fixed, 95% CI) | 1.24 [0.71, 2.19] |
| 1.3 Pre‐eclampsia | 1 | 375 | Risk Ratio (M‐H, Fixed, 95% CI) | 1.23 [0.59, 2.56] |
| 2 Caesarean section Show forest plot | 1 | 375 | Risk Ratio (M‐H, Fixed, 95% CI) | 1.03 [0.79, 1.34] |
| 3 Large‐for‐gestational age Show forest plot | 1 | 375 | Risk Ratio (M‐H, Fixed, 95% CI) | 0.89 [0.51, 1.58] |
| 4 Use of additional pharmacotherapy Show forest plot | 2 | 434 | Risk Ratio (M‐H, Fixed, 95% CI) | 0.68 [0.42, 1.11] |
| 4.1 Placebo | 2 | 434 | Risk Ratio (M‐H, Fixed, 95% CI) | 0.68 [0.42, 1.11] |
| 5 Glycaemic control (end of treatment) (mg/dL) Show forest plot | 1 | 375 | Mean Difference (IV, Fixed, 95% CI) | ‐3.0 [‐5.13, ‐0.87] |
| 6 Weight gain in pregnancy (Kg) Show forest plot | 1 | 375 | Mean Difference (IV, Fixed, 95% CI) | 0.0 [‐0.96, 0.96] |
| 7 Induction of labour Show forest plot | 1 | 375 | Risk Ratio (M‐H, Fixed, 95% CI) | 1.18 [0.79, 1.76] |
| 8 Perineal trauma Show forest plot | 1 | 375 | Risk Ratio (M‐H, Fixed, 95% CI) | 0.98 [0.06, 15.62] |
| 9 Stillbirth Show forest plot | 1 | 375 | Risk Ratio (M‐H, Fixed, 95% CI) | 0.49 [0.05, 5.38] |
| 10 Neonatal death Show forest plot | 1 | 375 | Risk Ratio (M‐H, Fixed, 95% CI) | 0.0 [0.0, 0.0] |
| 11 Small‐for‐gestational age Show forest plot | 1 | 375 | Risk Ratio (M‐H, Fixed, 95% CI) | 1.11 [0.58, 2.10] |
| 12 Macrosomia Show forest plot | 1 | 375 | Risk Ratio (M‐H, Fixed, 95% CI) | 0.71 [0.36, 1.41] |
| 13 Birthweight (g) Show forest plot | 1 | 375 | Mean Difference (IV, Fixed, 95% CI) | ‐33.0 [‐134.53, 68.53] |
| 14 Shoulder dystocia Show forest plot | 1 | 375 | Risk Ratio (M‐H, Fixed, 95% CI) | 0.33 [0.01, 8.00] |
| 15 Bone fracture Show forest plot | 1 | 375 | Risk Ratio (M‐H, Fixed, 95% CI) | 0.74 [0.17, 3.25] |
| 16 Nerve palsy Show forest plot | 1 | 375 | Risk Ratio (M‐H, Fixed, 95% CI) | 0.33 [0.01, 8.00] |
| 17 Gestational age at birth (weeks) Show forest plot | 1 | 375 | Mean Difference (IV, Fixed, 95% CI) | 0.0 [‐0.32, 0.32] |
| 18 Neonatal hypoglycaemia Show forest plot | 1 | 375 | Risk Ratio (M‐H, Fixed, 95% CI) | 1.97 [0.36, 10.62] |
| 19 Hyperbilirubinaemia Show forest plot | 1 | 375 | Risk Ratio (M‐H, Fixed, 95% CI) | 1.97 [0.50, 7.75] |
| 20 Admission to NICU Show forest plot | 1 | 375 | Risk Ratio (M‐H, Fixed, 95% CI) | 1.16 [0.53, 2.53] |
| Outcome or subgroup title | No. of studies | No. of participants | Statistical method | Effect size |
| 1 Hypertensive disorders of pregnancy Show forest plot | 3 | 508 | Risk Ratio (M‐H, Fixed, 95% CI) | 0.70 [0.38, 1.30] |
| 1.1 Pre‐eclampsia | 1 | 149 | Risk Ratio (M‐H, Fixed, 95% CI) | 0.66 [0.11, 3.82] |
| 1.2 Pregnancy‐induced hypertension | 2 | 359 | Risk Ratio (M‐H, Fixed, 95% CI) | 0.71 [0.37, 1.37] |
| 2 Caesarean section Show forest plot | 4 | 554 | Risk Ratio (M‐H, Random, 95% CI) | 1.20 [0.83, 1.72] |
| 2.1 Carpenter and Coustan criteria | 2 | 195 | Risk Ratio (M‐H, Random, 95% CI) | 2.36 [0.53, 10.52] |
| 2.2 National Diabetes Data Group criteria | 1 | 159 | Risk Ratio (M‐H, Random, 95% CI) | 1.12 [0.75, 1.68] |
| 2.3 World Health Organization (1999) | 1 | 200 | Risk Ratio (M‐H, Random, 95% CI) | 0.95 [0.78, 1.15] |
| 3 Perinatal mortality Show forest plot | 2 | 359 | Risk Ratio (M‐H, Fixed, 95% CI) | 0.92 [0.06, 14.55] |
| 4 Large‐for‐gestational age Show forest plot | 2 | 246 | Risk Ratio (M‐H, Random, 95% CI) | 0.67 [0.24, 1.83] |
| 4.1 Carpenter and Coustan criteria | 1 | 46 | Risk Ratio (M‐H, Random, 95% CI) | 1.25 [0.38, 4.07] |
| 4.2 World Health Organization (1999) | 1 | 200 | Risk Ratio (M‐H, Random, 95% CI) | 0.44 [0.21, 0.92] |
| 5 Death or serious morbidity composite Show forest plot | 1 | 159 | Risk Ratio (M‐H, Fixed, 95% CI) | 0.54 [0.31, 0.94] |
| 6 Use of additional pharmacotherapy Show forest plot | 5 | 660 | Risk Ratio (M‐H, Random, 95% CI) | 0.66 [0.28, 1.57] |
| 7 Maternal hypoglycaemia Show forest plot | 3 | 354 | Risk Ratio (M‐H, Fixed, 95% CI) | 0.89 [0.36, 2.19] |
| 8 Glycaemic control (mg/L; mmol/L) Show forest plot | 3 | Std. Mean Difference (IV, Fixed, 95% CI) | Subtotals only | |
| 8.1 Fasting blood glucose | 3 | 508 | Std. Mean Difference (IV, Fixed, 95% CI) | 0.19 [0.02, 0.37] |
| 8.2 Postprandial blood glucose | 3 | 508 | Std. Mean Difference (IV, Fixed, 95% CI) | 0.16 [‐0.01, 0.34] |
| 8.3 HbA1c | 1 | 200 | Std. Mean Difference (IV, Fixed, 95% CI) | ‐0.12 [‐0.39, 0.16] |
| 9 Weight gain in pregnancy (Kg) Show forest plot | 1 | 200 | Mean Difference (IV, Fixed, 95% CI) | ‐2.06 [‐3.98, ‐0.14] |
| 10 Induction of labour Show forest plot | 1 | 159 | Risk Ratio (M‐H, Fixed, 95% CI) | 0.81 [0.61, 1.07] |
| 11 Perineal trauma Show forest plot | 2 | 308 | Risk Ratio (M‐H, Fixed, 95% CI) | 1.67 [0.22, 12.52] |
| 12 Stillbirth Show forest plot | 1 | 200 | Risk Ratio (M‐H, Fixed, 95% CI) | 0.92 [0.06, 14.55] |
| 13 Macrosomia Show forest plot | 2 | 308 | Risk Ratio (M‐H, Fixed, 95% CI) | 0.72 [0.23, 2.21] |
| 14 Birth trauma Show forest plot | 1 | 159 | Risk Ratio (M‐H, Fixed, 95% CI) | 0.0 [0.0, 0.0] |
| 15 Shoulder dystocia Show forest plot | 2 | 195 | Risk Ratio (M‐H, Fixed, 95% CI) | 0.99 [0.14, 6.89] |
| 16 Gestational age at birth (weeks) Show forest plot | 3 | 508 | Mean Difference (IV, Fixed, 95% CI) | 0.03 [‐0.22, 0.28] |
| 17 Preterm birth Show forest plot | 3 | 508 | Risk Ratio (M‐H, Fixed, 95% CI) | 1.59 [0.59, 4.29] |
| 18 5‐minute Apgar < 7 Show forest plot | 1 | 149 | Risk Ratio (M‐H, Fixed, 95% CI) | 0.0 [0.0, 0.0] |
| 19 Birthweight (g) Show forest plot | 2 | 349 | Mean Difference (IV, Fixed, 95% CI) | ‐209.13 [‐314.53, ‐103.73] |
| 20 Ponderal index Show forest plot | 1 | 200 | Mean Difference (IV, Fixed, 95% CI) | ‐0.09 [‐0.17, ‐0.01] |
| 21 Neonatal hypoglycaemia Show forest plot | 4 | 554 | Risk Ratio (M‐H, Fixed, 95% CI) | 0.86 [0.42, 1.77] |
| 22 Respiratory distress syndrome Show forest plot | 1 | 159 | Risk Ratio (M‐H, Fixed, 95% CI) | 0.51 [0.10, 2.69] |
| 23 Hyperbilirubinaemia Show forest plot | 2 | 205 | Risk Ratio (M‐H, Fixed, 95% CI) | 0.68 [0.37, 1.25] |
| 24 Admission to NICU Show forest plot | 2 | 349 | Risk Ratio (M‐H, Fixed, 95% CI) | 1.52 [0.65, 3.56] |
| Outcome or subgroup title | No. of studies | No. of participants | Statistical method | Effect size |
| 1 Caesarean section Show forest plot | 1 | 43 | Risk Ratio (M‐H, Fixed, 95% CI) | 0.95 [0.53, 1.70] |
| 2 Perinatal mortality Show forest plot | 1 | 43 | Risk Ratio (M‐H, Fixed, 95% CI) | 0.0 [0.0, 0.0] |
| 3 Large‐for‐gestational age Show forest plot | 1 | 43 | Risk Ratio (M‐H, Fixed, 95% CI) | 2.38 [0.54, 10.46] |
| 4 Need for additional pharmacotherapy Show forest plot | 1 | 43 | Risk Ratio (M‐H, Fixed, 95% CI) | 0.49 [0.19, 1.27] |
| 5 Maternal hypoglycaemia Show forest plot | 1 | 43 | Risk Ratio (M‐H, Fixed, 95% CI) | 0.0 [0.0, 0.0] |
| 6 Weight gain in pregnancy (Kg) Show forest plot | 1 | 43 | Mean Difference (IV, Fixed, 95% CI) | ‐0.60 [‐3.13, 1.93] |
| 7 Macrosomia Show forest plot | 1 | 43 | Risk Ratio (M‐H, Fixed, 95% CI) | 7.20 [0.41, 125.97] |
| 8 Small‐for‐gestational age Show forest plot | 1 | 43 | Risk Ratio (M‐H, Fixed, 95% CI) | 0.0 [0.0, 0.0] |
| 9 Birth trauma (not specified) Show forest plot | 1 | 43 | Risk Ratio (M‐H, Fixed, 95% CI) | 0.0 [0.0, 0.0] |
| 10 Gestational age at birth (weeks) Show forest plot | 1 | 43 | Mean Difference (IV, Fixed, 95% CI) | ‐0.10 [‐0.82, 0.62] |
| 11 Preterm birth Show forest plot | 1 | 43 | Risk Ratio (M‐H, Fixed, 95% CI) | 0.0 [0.0, 0.0] |
| 12 Birthweight (Kg) Show forest plot | 1 | 43 | Mean Difference (IV, Fixed, 95% CI) | 153.0 [‐123.52, 429.52] |
| 13 Neonatal hypoglycaemia Show forest plot | 1 | 43 | Risk Ratio (M‐H, Fixed, 95% CI) | 6.33 [0.87, 46.32] |
| 14 Respiratory distress syndrome Show forest plot | 1 | 43 | Risk Ratio (M‐H, Fixed, 95% CI) | 0.0 [0.0, 0.0] |