Askorbatna kiselina za liječenje Charcot‐Marie‐Tooth bolesti
Referencias
References to studies included in this review
References to studies excluded from this review
Additional references
References to other published versions of this review
Characteristics of studies
Characteristics of included studies [ordered by study ID]
Ir a:
| Methods | Randomised, placebo‐controlled, double‐blind clinical trial | |
| Participants | 80 children with genetically proven CMT1A; aged 2 to 16 years; both sexes | |
| Interventions | Oral ascorbic acid dose (approximately 30 mg/kg body weight/day) (N = 41):
versus matching placebo (N = 39) for 12 months | |
| Outcomes | Primary: change in median nerve conduction velocity (m/s) after 12 months Secondary: change in foot and hand strength, motor function, walking ability and quality of life after 12 months | |
| Funding sources | "The University of Sydney Research and Development Scheme (#K2701 U3332), National Health and Medical Research Council of Australia (NHMRC #336705), James N Kirby Foundation, New South Wales Podiatrists Registration Board, Australian Podiatry Education and Research Foundation, and Charcot–Marie–Tooth Association of Australia" | |
| Conflicts of interest | No conflicts of interest reported | |
| Notes | Date study was performed: June 2007 to December 2008 | |
| Risk of bias | ||
| Bias | Authors' judgement | Support for judgement |
| Random sequence generation (selection bias) | Low risk | "Patients were randomly assigned in a 1:1 ratio by a computer‐generated algorithm" |
| Allocation concealment (selection bias) | Unclear risk | "Randomisation data were retained by central pharmacy" |
| Blinding of participants and personnel (performance bias) | Low risk | "The principal investigator (JB) and the other investigators, study coordinators, assessors, children, and their parents were unaware of the treatment assignment" |
| Blinding of outcome assessment (detection bias) | Low risk | "The principal investigator (JB) and the other investigators, study coordinators, assessors [...] were unaware of the treatment assignment" |
| Incomplete outcome data (attrition bias) | Low risk | "Analysis of treatment effect between groups was by intention to treat" |
| Selective reporting (reporting bias) | Low risk | Study protocol available on www.ANZCTR.org.au; outcome reporting according to protocol |
| Other bias | Low risk | None identified |
| Methods | Randomised, placebo‐controlled, double‐blind clinical trial | |
| Participants | 110 participants between 14 and 69 years old with CMT1A proven genetically, both sexes | |
| Interventions | 4 g ascorbic acid per day (N = 87), versus matching placebo (N = 23) for 24 months | |
| Outcomes | Primary: CMTNS after 24 months Secondary: Neuropathy Impairment Score, nerve conduction studies, SF‐36, serum ascorbic acid levels, PMP22 mRNA in skin biopsy (RT‐PCR) after 24 months | |
| Funding sources | "Muscular Dystrophy Association and the Charcot‐Marie‐Tooth Association. Wayne State University, the University of Rochester, and Johns Hopkins University were members of the Inherited Neuropathy Consortium of the Rare Disease Clinical Research Network supported by the National Institute of Neurological Disorders and Stroke and Office of Rare Diseases." | |
| Conflicts of interest | "Dr. Lewis has consulted for Baxter, CSL Behring, AxelaCare, Novartis, and Bristol‐Myers Squibb. | |
| Notes | Study start date: April 2007; completion date: December 2012 (as stated on ClinicalTrials.gov) | |
| Risk of bias | ||
| Bias | Authors' judgement | Support for judgement |
| Random sequence generation (selection bias) | Low risk | "The randomization plan was computer generated" |
| Allocation concealment (selection bias) | Unclear risk | "Subjects were randomly assigned with 4:1 allocation to AA (80%) or placebo (20%)" |
| Blinding of participants and personnel (performance bias) | Low risk | "Only a programmer in the Muscle Study Group Biostatistics Center and the |
| Blinding of outcome assessment (detection bias) | Low risk | "Only a programmer in the Muscle Study Group Biostatistics Center and the |
| Incomplete outcome data (attrition bias) | Low risk | "This approach appropriately accounts for missing data when estimating the model parameters under the “missing at random” assumption." |
| Selective reporting (reporting bias) | Unclear risk | Study protocol available on www.ClinicalTrials.gov; all pre‐specified outcomes reported; some additional, not pre‐specified outcomes reported |
| Other bias | Low risk | None identified |
| Methods | Randomised, placebo‐controlled, double‐blind clinical trial | |
| Participants | People with CMT1A genetically carrying the duplication on chromosome 17q11.2; between 18 and 70 years; both sexes | |
| Interventions | Ascorbic acid 1500 mg/day (N = 26) versus matching placebo (N = 25) for 24 months | |
| Outcomes | Primary: change in CMTNS after 24 months Secondary: change in MVIC, 10‐m walking, nine‐hole peg test, ONLS, VAS for pain and fatigue, SF36 after 24 months | |
| Funding sources | "The clinical trial was funded by grant of The Czech Internal Grant Agency of Ministry of Health of Czech Republic (No NR/9517)" | |
| Conflicts of interest | No conflict of interest for any investigator | |
| Notes | Study not published yet, data obtained by communication with principal investigator Date study was performed: 1 January 2007 to 31 December 2009 | |
| Risk of bias | ||
| Bias | Authors' judgement | Support for judgement |
| Random sequence generation (selection bias) | Low risk | The randomization was performed by the pharmaceutical company FAVEA s.r.o, which prepared the study medication for this trial |
| Allocation concealment (selection bias) | Unclear risk | The investigator at each centre obtained the study medication and allocation concealment code from the pharmaceutical company |
| Blinding of participants and personnel (performance bias) | Low risk | The case report form included only initials and study number, not the names or further data about participants |
| Blinding of outcome assessment (detection bias) | Low risk | The two investigators in each centre (one examining and one treating neurologist) were not in contact about the participants; only the case report form documents were transmitted from examining to treating neurologist |
| Incomplete outcome data (attrition bias) | High risk | The study evaluation did not include the data of participants who dropped out |
| Selective reporting (reporting bias) | Unclear risk | Study protocol not available |
| Other bias | Low risk | None identified |
| Methods | Randomised, placebo‐controlled, double‐blind clinical trial | |
| Participants | 179 participants with CMT1A aged 34 to 58 years, genetically confirmed, both sexes | |
| Interventions | 1 g/day ascorbic acid (N = 56), 3 g/day ascorbic acid (N = 61), versus matching placebo (N = 62) for 12 months | |
| Outcomes | Primary: change in CMTNS after 12 months Secondary: change in CMTES, quantitative motor testing, SF‐36, ODSS, time to walk 10‐m, VAS, Clinical Global Impression Severity scale, ascorbic acid blood concentration, nerve conduction studies after 12 months | |
| Funding sources | "French Ministry of Health (National PHRC 2004) and Association Française Contre les Myopathies." (p. 1) | |
| Conflicts of interest | "Ascorbic acid for the treatment of CMT1A is under patent and its application has been registered by INSERM, AFM, and Marseille II University. MF is one of the inventors of the patent, which has been licensed to Murigenetics. MF and OB participate in the activities of Murigenetics as scientific advisers and are each 15% shareholders in the company. The other authors have no conflict of interest." (p. 8) | |
| Notes | Date study was performed: recruitment from September 2005 to September 2007 | |
| Risk of bias | ||
| Bias | Authors' judgement | Support for judgement |
| Random sequence generation (selection bias) | Low risk | "The randomisation sequence was generated using randomization.com" |
| Allocation concealment (selection bias) | Unclear risk | "Active treatment and placebo were prepared by CLIPA Clinical Packaging." |
| Blinding of participants and personnel (performance bias) | Low risk | "Both patients and investigators were unaware of the treatment allocation." |
| Blinding of outcome assessment (detection bias) | Low risk | "Both patients and investigators were unaware of the treatment allocation." |
| Incomplete outcome data (attrition bias) | Low risk | "Analyses were done on the intention to treat population." |
| Selective reporting (reporting bias) | Unclear risk | Study protocol not available |
| Other bias | Low risk | None identified |
| Methods | Randomised, placebo‐controlled, double‐blind clinical trial | |
| Participants | People with CMT1A genetically carrying the duplication on chromosome 17q11.2; between 18 and 70 years old; both sexes | |
| Interventions | 1500 mg/day ascorbic acid (N = 138) versus matching placebo (N = 133) for 24 months | |
| Outcomes | Primary: change in CMTNS after 24 months Secondary: change in MVIC, 10‐m walking, nine‐hole peg test, ONLS, VAS for pain and fatigue, SF‐36, skin biopsy (expression of PMP22) after 24 months | |
| Funding sources | "Telethon‐UILDM (grant numbers GUP04002 and GUP05007) and AIFA (Italian Medicines Agency; grant number FARM53APAH) in Italy, and Muscular Dystrophy Campaign in the UK (grant number RA3/736/1). MMR also receives funding from CMTUK and the UK Medical Research Council. In the UK, this work was undertaken at University College London Hospitals and University College London, which received a proportion of funding from the UK Department of Health's National Institute for Health Research Biomedical Research Centres funding scheme." | |
| Conflicts of interest | "RACH was a consultant for Octapharma, Baxter, Laboratoires Français de Fractionnement et des Biotechnologies (LFB), and Novartis. AS was a board member for Novartis, and has received speaker honoraria from Sanofi‐Aventis. All other authors declare that they have no conflicts of interest." | |
| Notes | Date study was performed: inclusion from March 2006 to September 2007 | |
| Risk of bias | ||
| Bias | Authors' judgement | Support for judgement |
| Random sequence generation (selection bias) | Low risk | "The randomisation sequence was computer generated (by a pseudo‐random number generator)" |
| Allocation concealment (selection bias) | Low risk | "Treatment was allocated centrally by telephone, and was stratified by centre and disease severity (CMTNS ≤ 10 vs > 10, or CMTES ≤ 8 vs > 8 if electrophysiological assessment was not done in the previous 3 months), with a block size of four (unknown to investigators) within each centre. The sequence was available in opaque sealed envelopes at every centre for emergency unmasking." |
| Blinding of participants and personnel (performance bias) | Low risk | "Patients, treating physicians, [...] were masked to treatment allocation." |
| Blinding of outcome assessment (detection bias) | Low risk | "[...] physicians assessing outcomes with clinical scales at baseline and during follow‐up were masked to treatment allocation." |
| Incomplete outcome data (attrition bias) | Low risk | "The main analysis of the primary outcome included all randomised patients who took at least one dose of study treatment. [...] For patients who were unavailable, missing data were imputed according to Rubin's multiple imputation approach."; six participants dropped out after allocation due to withdrawal of consent. |
| Selective reporting (reporting bias) | Low risk | Study protocol available on www.ClinicalTrialsRegister.eu and separate publication; outcome reporting according to protocol |
| Other bias | Low risk | None identified |
| Methods | Randomised, placebo‐controlled, double‐blind clinical trial | |
| Participants | People with CMT1A, genetically carrying the duplication on chromosome 17q11.2, between 12 and 25 years, both sexes | |
| Interventions | Ascorbic acid 2 g/day (N = 5) versus matching placebo (N = 6) for 12 months | |
| Outcomes | Primary: change in motor nerve conduction velocity of the median nerve after 12 months | |
| Funding sources | "internally funded at the Department of Neurology and Clinical Neurophysiology, Academic Medical Centre, University of Amsterdam." | |
| Conflicts of interest | No competing interests declared | |
| Notes | Date study was performed: inclusion December 2005 and June 2006 | |
| Risk of bias | ||
| Bias | Authors' judgement | Support for judgement |
| Random sequence generation (selection bias) | Low risk | "The pharmacist, who did not have any further role in the study, generated a computerized randomization sequence." |
| Allocation concealment (selection bias) | Unclear risk | "Eligible patients were randomly allocated to oral ascorbic acid or placebo." |
| Blinding of participants and personnel (performance bias) | Low risk | "Participants and investigators were unaware of the treatment assignment." |
| Blinding of outcome assessment (detection bias) | Low risk | "Participants and investigators were unaware of the treatment assignment." |
| Incomplete outcome data (attrition bias) | Low risk | "Randomised patients with at least one follow‐up measure of the primary outcome were analyzed according to the intention‐to‐treat principle. In case of incomplete data, we used the last observation carried forward approach." |
| Selective reporting (reporting bias) | Low risk | Study protocol available on www.ClinicalTrials.gov; outcome reporting according to protocol |
| Other bias | Low risk | None identified |
N: number of participants
CMT1A: Charcot‐Marie‐Tooth disease type 1A
CMTES: Charcot‐Marie‐Tooth disease examination score
CMTNS: Charcot‐Marie‐Tooth disease neuropathy score
MVIC: maximal voluntary isometric contraction
ODSS: Overall Disability Sum Score
ONLS: Overall Neuropathy Limitations Scale
SF‐36: Short‐Form 36 Health Survey Questionnaire
PMP22: peripheral myelin protein 22 kDa
mRNA: messenger ribonucleic acid
RT‐PCR: reverse transcription polymerase chain reaction
VAS: visual analogue scale
Characteristics of excluded studies [ordered by study ID]
Ir a:
| Study | Reason for exclusion |
| Controlled by untreated cohort group, not randomised |
Data and analyses
| Outcome or subgroup title | No. of studies | No. of participants | Statistical method | Effect size |
| 1 Impairment ‐ CMTNS (scale 0 to 36 points) Show forest plot | 5 | 533 | Mean Difference (IV, Fixed, 95% CI) | ‐0.37 [‐0.83, 0.09] |
| Analysis 1.1  Comparison 1 Ascorbic acid versus placebo 12 months (adults), Outcome 1 Impairment ‐ CMTNS (scale 0 to 36 points). | ||||
| 2 Impairment ‐ CMTES (scale 0 to 28 points) Show forest plot | 3 | 460 | Mean Difference (IV, Fixed, 95% CI) | ‐0.15 [‐0.57, 0.27] |
| Analysis 1.2  Comparison 1 Ascorbic acid versus placebo 12 months (adults), Outcome 2 Impairment ‐ CMTES (scale 0 to 28 points). | ||||
| 3 Impairment ‐ NIS (scale ‐26 to 26 points) Show forest plot | 1 | 110 | Mean Difference (IV, Fixed, 95% CI) | 1.91 [‐2.24, 6.06] |
| Analysis 1.3 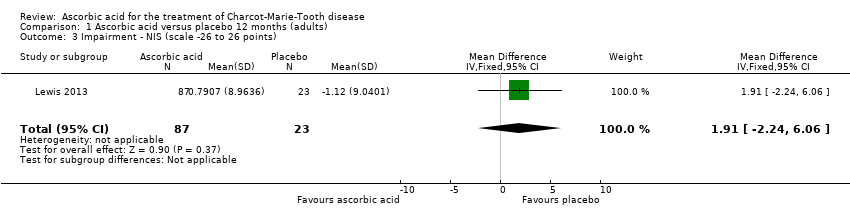 Comparison 1 Ascorbic acid versus placebo 12 months (adults), Outcome 3 Impairment ‐ NIS (scale ‐26 to 26 points). | ||||
| 4 Disability ‐ ODSS (scale 0 to 12 points) Show forest plot | 2 | 134 | Mean Difference (IV, Fixed, 95% CI) | ‐0.09 [‐0.36, 0.18] |
| Analysis 1.4  Comparison 1 Ascorbic acid versus placebo 12 months (adults), Outcome 4 Disability ‐ ODSS (scale 0 to 12 points). | ||||
| 5 Disability ‐ ONLS (scale 0 to 12 points) Show forest plot | 2 | 289 | Mean Difference (IV, Fixed, 95% CI) | 0.07 [‐0.02, 0.17] |
| Analysis 1.5 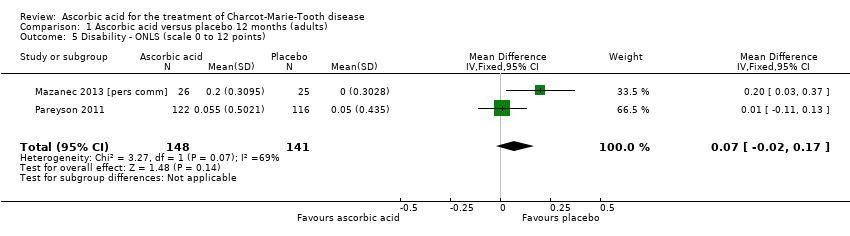 Comparison 1 Ascorbic acid versus placebo 12 months (adults), Outcome 5 Disability ‐ ONLS (scale 0 to 12 points). | ||||
| 6 Disability ‐ ALDS (scale 0 to 100 points) Show forest plot | 1 | 11 | Mean Difference (IV, Fixed, 95% CI) | ‐1.3 [‐4.28, 1.68] |
| Analysis 1.6 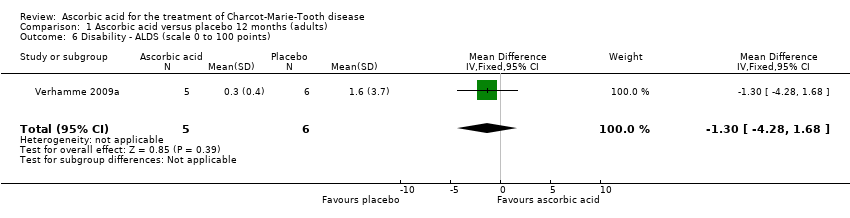 Comparison 1 Ascorbic acid versus placebo 12 months (adults), Outcome 6 Disability ‐ ALDS (scale 0 to 100 points). | ||||
| 7 CMAP, ulnar nerve (abductor digiti minimi) Show forest plot | 2 | 161 | Mean Difference (IV, Fixed, 95% CI) | 0.13 [‐0.34, 0.59] |
| Analysis 1.7 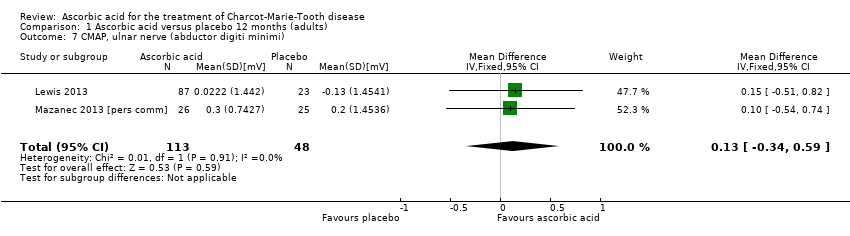 Comparison 1 Ascorbic acid versus placebo 12 months (adults), Outcome 7 CMAP, ulnar nerve (abductor digiti minimi). | ||||
| 8 CMAP, median nerve (abductor pollicis brevis) Show forest plot | 1 | 11 | Mean Difference (IV, Fixed, 95% CI) | ‐0.18 [‐1.19, 0.83] |
| Analysis 1.8  Comparison 1 Ascorbic acid versus placebo 12 months (adults), Outcome 8 CMAP, median nerve (abductor pollicis brevis). | ||||
| 9 CMAP summatory from ulnar, median and peroneal nerves Show forest plot | 1 | 217 | Mean Difference (IV, Fixed, 95% CI) | 0.23 [‐0.48, 0.94] |
| Analysis 1.9 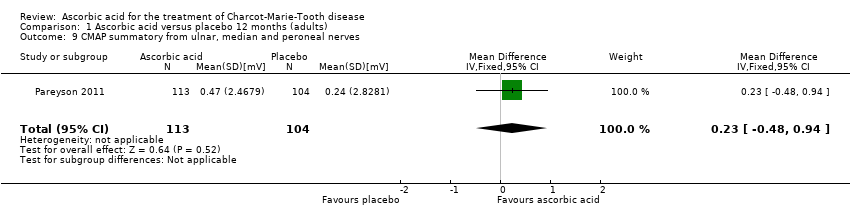 Comparison 1 Ascorbic acid versus placebo 12 months (adults), Outcome 9 CMAP summatory from ulnar, median and peroneal nerves. | ||||
| 10 Sensation ‐ INCAT Sensory Sum score (scale 0 to 20 points) Show forest plot | 1 | 10 | Mean Difference (IV, Fixed, 95% CI) | ‐2.0 [‐5.53, 1.53] |
| Analysis 1.10  Comparison 1 Ascorbic acid versus placebo 12 months (adults), Outcome 10 Sensation ‐ INCAT Sensory Sum score (scale 0 to 20 points). | ||||
| 11 SNAP amplitude Show forest plot | 1 | 123 | Mean Difference (IV, Fixed, 95% CI) | 0.0 [‐0.42, 0.42] |
| Analysis 1.11  Comparison 1 Ascorbic acid versus placebo 12 months (adults), Outcome 11 SNAP amplitude. | ||||
| 12 Hand grip Show forest plot | 3 | 412 | Mean Difference (IV, Fixed, 95% CI) | 1.39 [‐4.17, 6.95] |
| Analysis 1.12  Comparison 1 Ascorbic acid versus placebo 12 months (adults), Outcome 12 Hand grip. | ||||
| 13 Three‐point pinch Show forest plot | 3 | 300 | Mean Difference (IV, Fixed, 95% CI) | 0.60 [‐1.53, 2.73] |
| Analysis 1.13 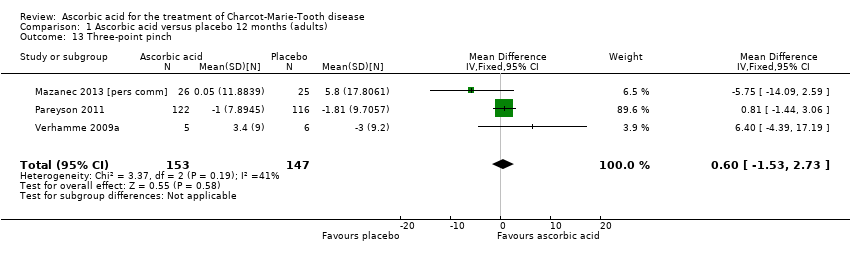 Comparison 1 Ascorbic acid versus placebo 12 months (adults), Outcome 13 Three‐point pinch. | ||||
| 14 Foot dorsiflexion Show forest plot | 4 | 423 | Mean Difference (IV, Fixed, 95% CI) | 1.10 [‐3.47, 5.67] |
| Analysis 1.14 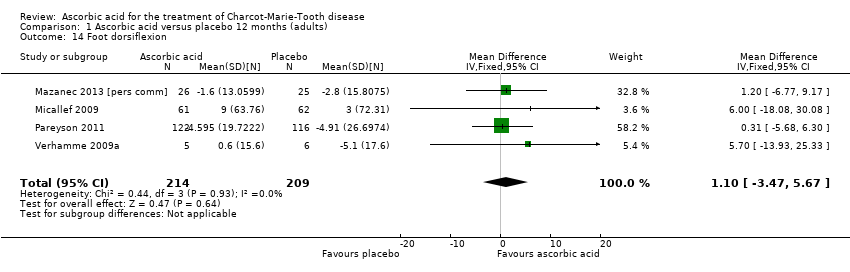 Comparison 1 Ascorbic acid versus placebo 12 months (adults), Outcome 14 Foot dorsiflexion. | ||||
| 15 Quality of life ‐ SF36 ‐ physical functioning Show forest plot | 4 | 522 | Mean Difference (IV, Fixed, 95% CI) | ‐0.05 [‐1.32, 1.22] |
| Analysis 1.15  Comparison 1 Ascorbic acid versus placebo 12 months (adults), Outcome 15 Quality of life ‐ SF36 ‐ physical functioning. | ||||
| 16 Quality of life ‐ SF36 ‐ bodily pain Show forest plot | 3 | 401 | Mean Difference (IV, Fixed, 95% CI) | ‐0.53 [‐2.69, 1.62] |
| Analysis 1.16  Comparison 1 Ascorbic acid versus placebo 12 months (adults), Outcome 16 Quality of life ‐ SF36 ‐ bodily pain. | ||||
| 17 Quality of life ‐ SF36 ‐ energy Show forest plot | 2 | 291 | Mean Difference (IV, Fixed, 95% CI) | 0.45 [‐2.84, 3.74] |
| Analysis 1.17  Comparison 1 Ascorbic acid versus placebo 12 months (adults), Outcome 17 Quality of life ‐ SF36 ‐ energy. | ||||
| 18 Quality of life ‐ SF36 ‐ psychological Show forest plot | 1 | 123 | Mean Difference (IV, Fixed, 95% CI) | 0.90 [‐2.65, 4.45] |
| Analysis 1.18  Comparison 1 Ascorbic acid versus placebo 12 months (adults), Outcome 18 Quality of life ‐ SF36 ‐ psychological. | ||||
| 19 Quality of life ‐ SF36 ‐ MCS Show forest plot | 1 | 110 | Mean Difference (IV, Fixed, 95% CI) | 0.46 [‐3.80, 4.72] |
| Analysis 1.19  Comparison 1 Ascorbic acid versus placebo 12 months (adults), Outcome 19 Quality of life ‐ SF36 ‐ MCS. | ||||
| 20 Quality of life ‐ SF36 ‐ PCS Show forest plot | 1 | 110 | Mean Difference (IV, Fixed, 95% CI) | 0.39 [‐2.98, 3.76] |
| Analysis 1.20  Comparison 1 Ascorbic acid versus placebo 12 months (adults), Outcome 20 Quality of life ‐ SF36 ‐ PCS. | ||||
| 21 9‐hole peg test Show forest plot | 3 | 286 | Mean Difference (IV, Fixed, 95% CI) | ‐0.39 [‐0.76, ‐0.02] |
| Analysis 1.21  Comparison 1 Ascorbic acid versus placebo 12 months (adults), Outcome 21 9‐hole peg test. | ||||
| 22 Timed 10 m walk Show forest plot | 3 | 401 | Mean Difference (IV, Fixed, 95% CI) | ‐0.02 [‐0.32, 0.29] |
| Analysis 1.22 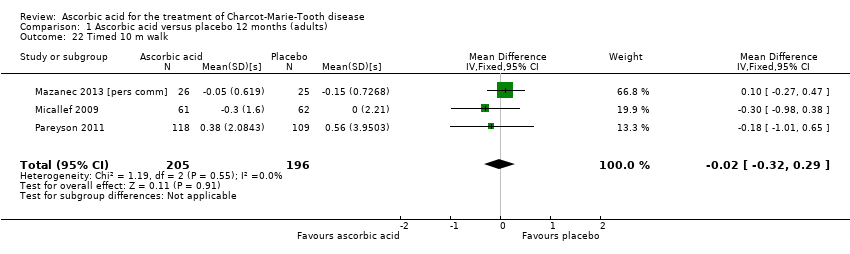 Comparison 1 Ascorbic acid versus placebo 12 months (adults), Outcome 22 Timed 10 m walk. | ||||
| 23 50 m walk Show forest plot | 1 | 11 | Mean Difference (IV, Fixed, 95% CI) | ‐0.30 [‐2.49, 1.89] |
| Analysis 1.23  Comparison 1 Ascorbic acid versus placebo 12 months (adults), Outcome 23 50 m walk. | ||||
| Outcome or subgroup title | No. of studies | No. of participants | Statistical method | Effect size |
| 1 Impairment ‐ CMTNS (scale 0 to 36 points) Show forest plot | 3 | 388 | Mean Difference (IV, Fixed, 95% CI) | ‐0.21 [‐0.81, 0.39] |
| Analysis 2.1  Comparison 2 Ascorbic acid versus placebo 24 months (adults), Outcome 1 Impairment ‐ CMTNS (scale 0 to 36 points). | ||||
| 2 Impairment ‐ CMTES (scale 0 to 28 points) Show forest plot | 2 | 337 | Mean Difference (IV, Fixed, 95% CI) | ‐0.12 [‐0.67, 0.42] |
| Analysis 2.2  Comparison 2 Ascorbic acid versus placebo 24 months (adults), Outcome 2 Impairment ‐ CMTES (scale 0 to 28 points). | ||||
| 3 Disability ‐ ONLS (scale 0 to 12 points) Show forest plot | 2 | 276 | Mean Difference (IV, Fixed, 95% CI) | 0.14 [‐0.05, 0.34] |
| Analysis 2.3 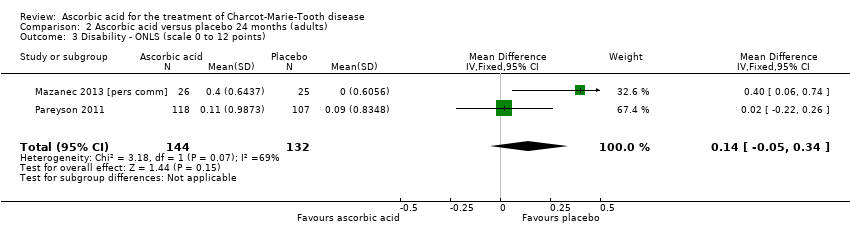 Comparison 2 Ascorbic acid versus placebo 24 months (adults), Outcome 3 Disability ‐ ONLS (scale 0 to 12 points). | ||||
| 4 CMAP, ulnar nerve (abductor digiti minimi) Show forest plot | 2 | 161 | Mean Difference (IV, Fixed, 95% CI) | 0.06 [‐0.10, 0.23] |
| Analysis 2.4 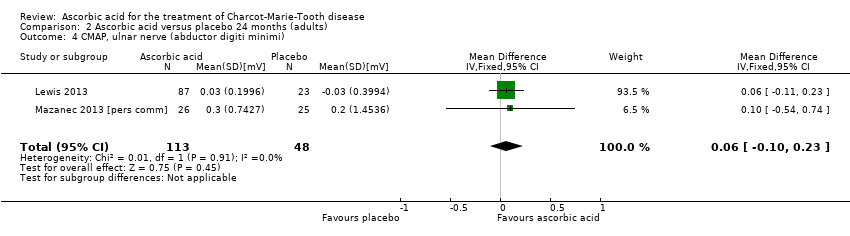 Comparison 2 Ascorbic acid versus placebo 24 months (adults), Outcome 4 CMAP, ulnar nerve (abductor digiti minimi). | ||||
| 5 Hand grip Show forest plot | 2 | 186 | Mean Difference (IV, Fixed, 95% CI) | 1.25 [‐3.86, 6.37] |
| Analysis 2.5  Comparison 2 Ascorbic acid versus placebo 24 months (adults), Outcome 5 Hand grip. | ||||
| 6 Three‐point pinch Show forest plot | 2 | 276 | Mean Difference (IV, Fixed, 95% CI) | 0.73 [‐3.62, 5.08] |
| Analysis 2.6  Comparison 2 Ascorbic acid versus placebo 24 months (adults), Outcome 6 Three‐point pinch. | ||||
| 7 Foot dorsiflexion Show forest plot | 2 | 278 | Mean Difference (IV, Fixed, 95% CI) | 0.77 [‐7.21, 8.76] |
| Analysis 2.7 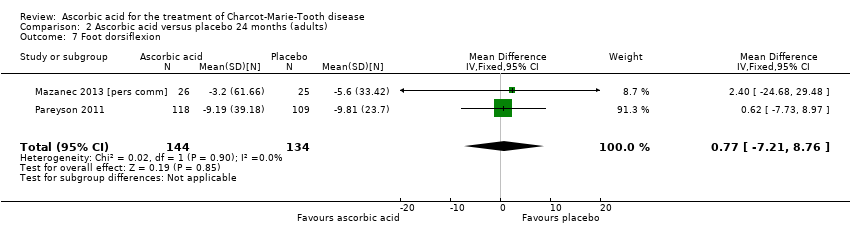 Comparison 2 Ascorbic acid versus placebo 24 months (adults), Outcome 7 Foot dorsiflexion. | ||||
| 8 Quality of life ‐ SF36 ‐ physical functioning Show forest plot | 3 | 382 | Mean Difference (IV, Fixed, 95% CI) | ‐0.07 [‐2.41, 2.26] |
| Analysis 2.8  Comparison 2 Ascorbic acid versus placebo 24 months (adults), Outcome 8 Quality of life ‐ SF36 ‐ physical functioning. | ||||
| 9 Quality of life ‐ SF36 ‐ bodily pain Show forest plot | 3 | 385 | Mean Difference (IV, Fixed, 95% CI) | ‐1.57 [‐4.93, 1.80] |
| Analysis 2.9  Comparison 2 Ascorbic acid versus placebo 24 months (adults), Outcome 9 Quality of life ‐ SF36 ‐ bodily pain. | ||||
| 10 Quality of life ‐ SF36 ‐ energy Show forest plot | 2 | 267 | Mean Difference (IV, Fixed, 95% CI) | 0.71 [‐3.35, 4.77] |
| Analysis 2.10 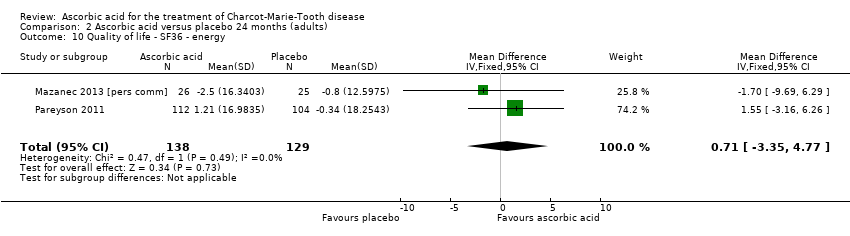 Comparison 2 Ascorbic acid versus placebo 24 months (adults), Outcome 10 Quality of life ‐ SF36 ‐ energy. | ||||
| 11 9‐hole peg test Show forest plot | 2 | 275 | Mean Difference (IV, Fixed, 95% CI) | ‐1.16 [‐1.96, ‐0.37] |
| Analysis 2.11 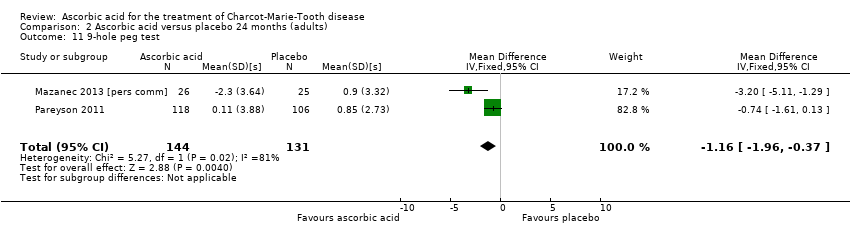 Comparison 2 Ascorbic acid versus placebo 24 months (adults), Outcome 11 9‐hole peg test. | ||||
| 12 Timed 10 m walk Show forest plot | 2 | 278 | Mean Difference (IV, Fixed, 95% CI) | 0.09 [‐0.64, 0.82] |
| Analysis 2.12  Comparison 2 Ascorbic acid versus placebo 24 months (adults), Outcome 12 Timed 10 m walk. | ||||
| 13 PMP22 mRNA (skin biopsy) Show forest plot | 2 | 114 | Mean Difference (IV, Fixed, 95% CI) | ‐0.05 [‐0.13, 0.03] |
| Analysis 2.13  Comparison 2 Ascorbic acid versus placebo 24 months (adults), Outcome 13 PMP22 mRNA (skin biopsy). | ||||
| Outcome or subgroup title | No. of studies | No. of participants | Statistical method | Effect size |
| 1 CMAP amplitude (M. abductor pollicis brevis) Show forest plot | 1 | 80 | Mean Difference (IV, Fixed, 95% CI) | 0.30 [‐0.75, 1.35] |
| Analysis 3.1  Comparison 3 Ascorbic acid vs placebo (children), Outcome 1 CMAP amplitude (M. abductor pollicis brevis). | ||||
| 2 Hand grip Show forest plot | 1 | 80 | Mean Difference (IV, Fixed, 95% CI) | 9.80 [‐18.10, 37.70] |
| Analysis 3.2  Comparison 3 Ascorbic acid vs placebo (children), Outcome 2 Hand grip. | ||||
| 3 Finger pinch Show forest plot | 1 | 80 | Mean Difference (IV, Fixed, 95% CI) | 1.60 [‐1.84, 5.04] |
| Analysis 3.3  Comparison 3 Ascorbic acid vs placebo (children), Outcome 3 Finger pinch. | ||||
| 4 Foot dorsiflexion Show forest plot | 1 | 80 | Mean Difference (IV, Fixed, 95% CI) | ‐1.0 [‐11.90, 9.90] |
| Analysis 3.4  Comparison 3 Ascorbic acid vs placebo (children), Outcome 4 Foot dorsiflexion. | ||||
| 5 Foot plantar flexion Show forest plot | 1 | 80 | Mean Difference (IV, Fixed, 95% CI) | ‐10.20 [‐36.29, 15.89] |
| Analysis 3.5  Comparison 3 Ascorbic acid vs placebo (children), Outcome 5 Foot plantar flexion. | ||||
| 6 Median nerve motor conduction velocity Show forest plot | 1 | 80 | Mean Difference (IV, Fixed, 95% CI) | 2.0 [‐0.89, 4.89] |
| Analysis 3.6 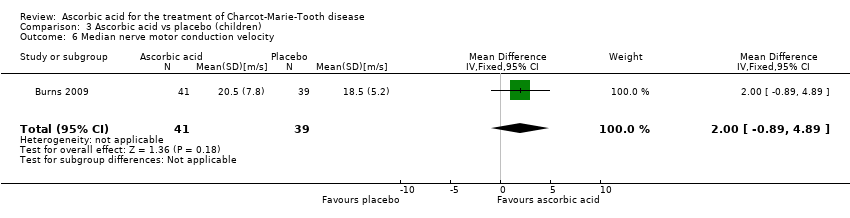 Comparison 3 Ascorbic acid vs placebo (children), Outcome 6 Median nerve motor conduction velocity. | ||||
| 7 9‐hole peg test Show forest plot | 1 | 78 | Mean Difference (IV, Fixed, 95% CI) | ‐0.80 [‐2.85, 1.25] |
| Analysis 3.7  Comparison 3 Ascorbic acid vs placebo (children), Outcome 7 9‐hole peg test. | ||||
| 8 6 min walk Show forest plot | 1 | 65 | Mean Difference (IV, Fixed, 95% CI) | ‐3.0 [‐32.34, 26.34] |
| Analysis 3.8 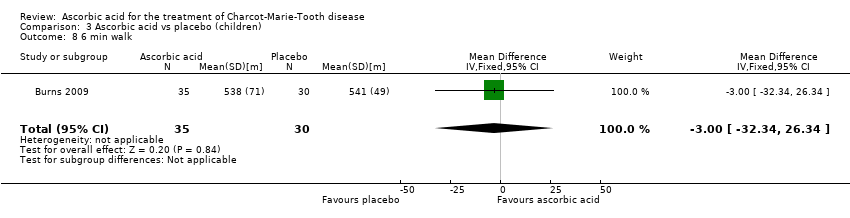 Comparison 3 Ascorbic acid vs placebo (children), Outcome 8 6 min walk. | ||||
| 9 Balance Show forest plot | 1 | 74 | Mean Difference (IV, Fixed, 95% CI) | ‐1.30 [‐4.62, 2.02] |
| Analysis 3.9 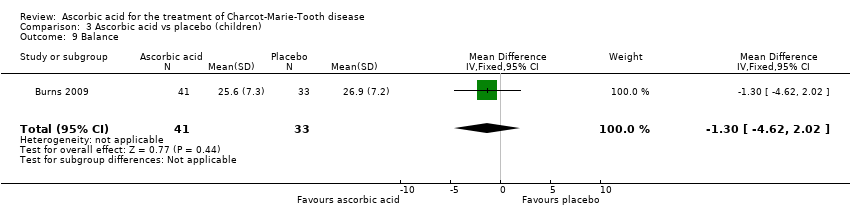 Comparison 3 Ascorbic acid vs placebo (children), Outcome 9 Balance. | ||||
| 10 Agility Show forest plot | 1 | 72 | Mean Difference (IV, Fixed, 95% CI) | ‐1.70 [‐5.43, 2.03] |
| Analysis 3.10  Comparison 3 Ascorbic acid vs placebo (children), Outcome 10 Agility. | ||||
| 11 Long jump Show forest plot | 1 | 72 | Mean Difference (IV, Fixed, 95% CI) | 2.20 [‐11.10, 15.50] |
| Analysis 3.11  Comparison 3 Ascorbic acid vs placebo (children), Outcome 11 Long jump. | ||||
| 12 Speed Show forest plot | 1 | 53 | Mean Difference (IV, Fixed, 95% CI) | ‐0.20 [‐9.33, 8.93] |
| Analysis 3.12 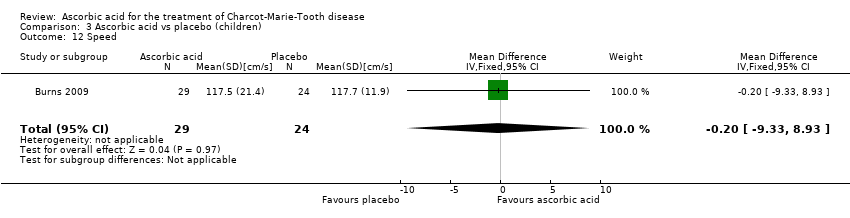 Comparison 3 Ascorbic acid vs placebo (children), Outcome 12 Speed. | ||||
| 13 Cadence Show forest plot | 1 | 53 | Mean Difference (IV, Fixed, 95% CI) | 0.80 [‐6.54, 8.14] |
| Analysis 3.13  Comparison 3 Ascorbic acid vs placebo (children), Outcome 13 Cadence. | ||||
| 14 Step time Show forest plot | 1 | 53 | Mean Difference (IV, Fixed, 95% CI) | 0.0 [‐0.05, 0.05] |
| Analysis 3.14  Comparison 3 Ascorbic acid vs placebo (children), Outcome 14 Step time. | ||||
| 15 Step length Show forest plot | 1 | 53 | Mean Difference (IV, Fixed, 95% CI) | ‐0.90 [‐4.97, 3.17] |
| Analysis 3.15  Comparison 3 Ascorbic acid vs placebo (children), Outcome 15 Step length. | ||||
| 16 Stride length Show forest plot | 1 | 53 | Mean Difference (IV, Fixed, 95% CI) | ‐1.80 [‐9.58, 5.98] |
| Analysis 3.16  Comparison 3 Ascorbic acid vs placebo (children), Outcome 16 Stride length. | ||||
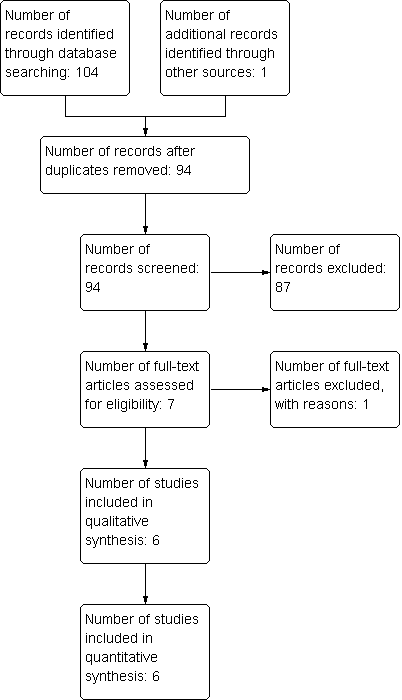
Study flow diagram.

Risk of bias summary: review authors' judgements about each risk of bias item for each included study. Green (+) = low risk of bias; yellow (?) = unclear risk of bias; red (‐) = high risk of bias.

Forest plot of comparison: 1 Ascorbic acid versus placebo 12 months, outcome: 1.1 CMTNS.
![Forest plot of comparison: 1 Ascorbic acid versus placebo 12 months (adults), outcome: 1.21 9‐hole peg test [s].](/es/cdsr/doi/10.1002/14651858.CD011952/media/CDSR/CD011952/image_n/nCD011952-AFig-FIG04.png)
Forest plot of comparison: 1 Ascorbic acid versus placebo 12 months (adults), outcome: 1.21 9‐hole peg test [s].
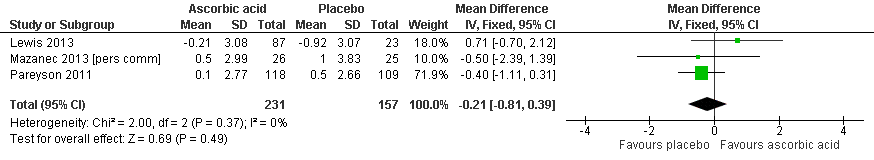
Forest plot of comparison: 2 Ascorbic acid versus placebo 24 months (adults), outcome: 2.1 Impairment ‐ CMTNS.
![Forest plot of comparison: 2 Ascorbic acid versus placebo 24 months (adults), outcome: 2.11 Impairment ‐ 9‐hole peg test [s].](/es/cdsr/doi/10.1002/14651858.CD011952/media/CDSR/CD011952/image_n/nCD011952-AFig-FIG06.png)
Forest plot of comparison: 2 Ascorbic acid versus placebo 24 months (adults), outcome: 2.11 Impairment ‐ 9‐hole peg test [s].
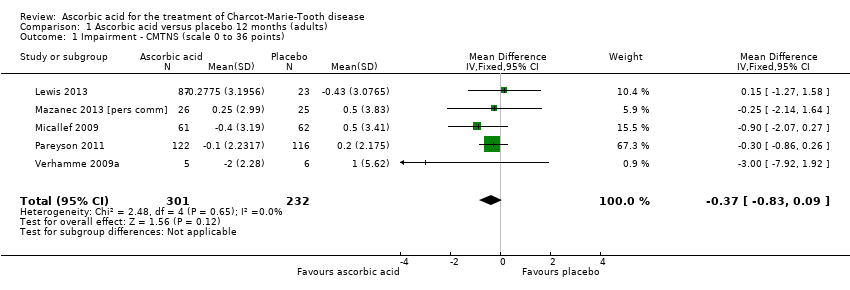
Comparison 1 Ascorbic acid versus placebo 12 months (adults), Outcome 1 Impairment ‐ CMTNS (scale 0 to 36 points).
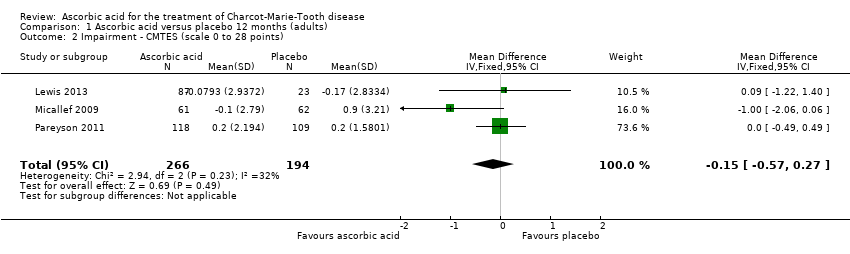
Comparison 1 Ascorbic acid versus placebo 12 months (adults), Outcome 2 Impairment ‐ CMTES (scale 0 to 28 points).

Comparison 1 Ascorbic acid versus placebo 12 months (adults), Outcome 3 Impairment ‐ NIS (scale ‐26 to 26 points).
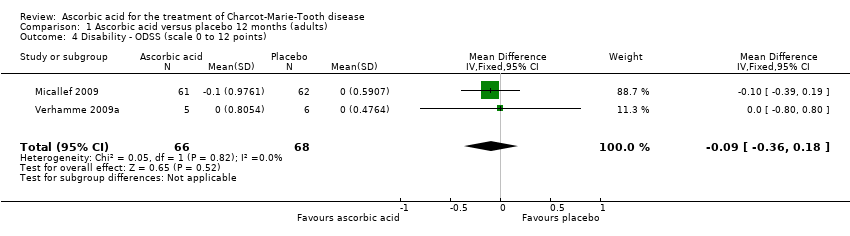
Comparison 1 Ascorbic acid versus placebo 12 months (adults), Outcome 4 Disability ‐ ODSS (scale 0 to 12 points).

Comparison 1 Ascorbic acid versus placebo 12 months (adults), Outcome 5 Disability ‐ ONLS (scale 0 to 12 points).

Comparison 1 Ascorbic acid versus placebo 12 months (adults), Outcome 6 Disability ‐ ALDS (scale 0 to 100 points).

Comparison 1 Ascorbic acid versus placebo 12 months (adults), Outcome 7 CMAP, ulnar nerve (abductor digiti minimi).

Comparison 1 Ascorbic acid versus placebo 12 months (adults), Outcome 8 CMAP, median nerve (abductor pollicis brevis).

Comparison 1 Ascorbic acid versus placebo 12 months (adults), Outcome 9 CMAP summatory from ulnar, median and peroneal nerves.

Comparison 1 Ascorbic acid versus placebo 12 months (adults), Outcome 10 Sensation ‐ INCAT Sensory Sum score (scale 0 to 20 points).
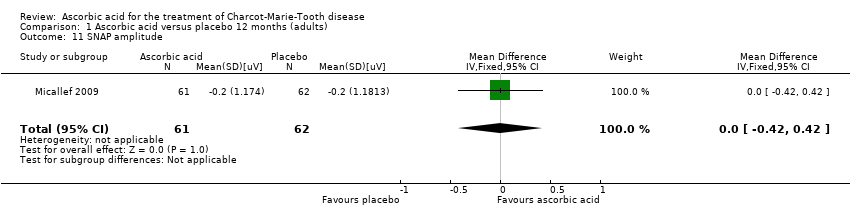
Comparison 1 Ascorbic acid versus placebo 12 months (adults), Outcome 11 SNAP amplitude.
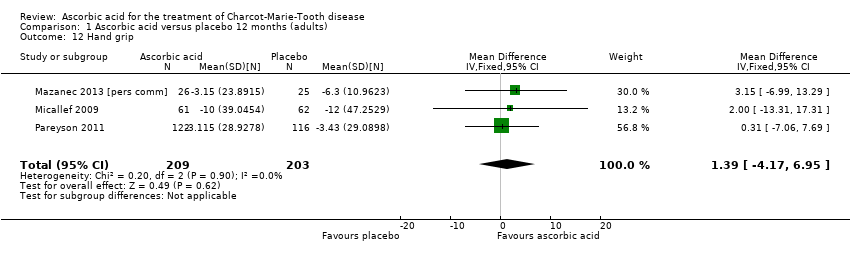
Comparison 1 Ascorbic acid versus placebo 12 months (adults), Outcome 12 Hand grip.

Comparison 1 Ascorbic acid versus placebo 12 months (adults), Outcome 13 Three‐point pinch.

Comparison 1 Ascorbic acid versus placebo 12 months (adults), Outcome 14 Foot dorsiflexion.

Comparison 1 Ascorbic acid versus placebo 12 months (adults), Outcome 15 Quality of life ‐ SF36 ‐ physical functioning.

Comparison 1 Ascorbic acid versus placebo 12 months (adults), Outcome 16 Quality of life ‐ SF36 ‐ bodily pain.

Comparison 1 Ascorbic acid versus placebo 12 months (adults), Outcome 17 Quality of life ‐ SF36 ‐ energy.

Comparison 1 Ascorbic acid versus placebo 12 months (adults), Outcome 18 Quality of life ‐ SF36 ‐ psychological.
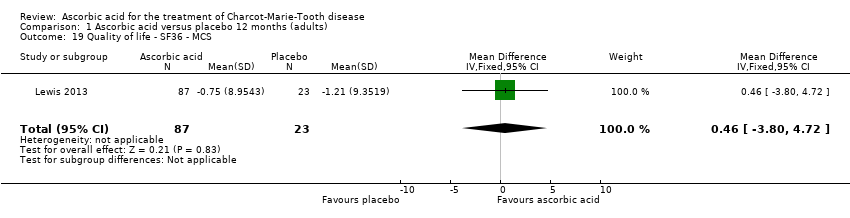
Comparison 1 Ascorbic acid versus placebo 12 months (adults), Outcome 19 Quality of life ‐ SF36 ‐ MCS.
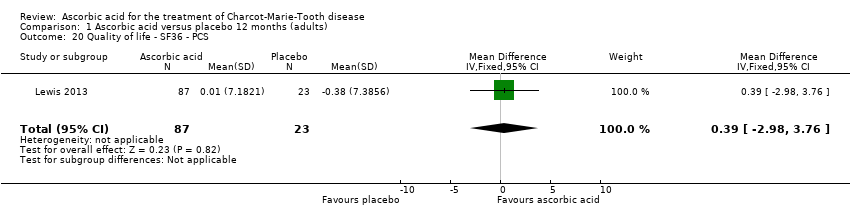
Comparison 1 Ascorbic acid versus placebo 12 months (adults), Outcome 20 Quality of life ‐ SF36 ‐ PCS.

Comparison 1 Ascorbic acid versus placebo 12 months (adults), Outcome 21 9‐hole peg test.

Comparison 1 Ascorbic acid versus placebo 12 months (adults), Outcome 22 Timed 10 m walk.
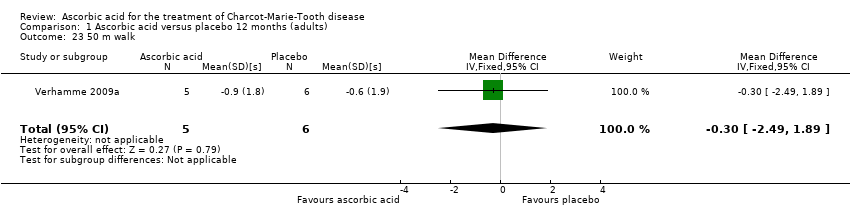
Comparison 1 Ascorbic acid versus placebo 12 months (adults), Outcome 23 50 m walk.

Comparison 2 Ascorbic acid versus placebo 24 months (adults), Outcome 1 Impairment ‐ CMTNS (scale 0 to 36 points).

Comparison 2 Ascorbic acid versus placebo 24 months (adults), Outcome 2 Impairment ‐ CMTES (scale 0 to 28 points).

Comparison 2 Ascorbic acid versus placebo 24 months (adults), Outcome 3 Disability ‐ ONLS (scale 0 to 12 points).

Comparison 2 Ascorbic acid versus placebo 24 months (adults), Outcome 4 CMAP, ulnar nerve (abductor digiti minimi).

Comparison 2 Ascorbic acid versus placebo 24 months (adults), Outcome 5 Hand grip.

Comparison 2 Ascorbic acid versus placebo 24 months (adults), Outcome 6 Three‐point pinch.

Comparison 2 Ascorbic acid versus placebo 24 months (adults), Outcome 7 Foot dorsiflexion.

Comparison 2 Ascorbic acid versus placebo 24 months (adults), Outcome 8 Quality of life ‐ SF36 ‐ physical functioning.
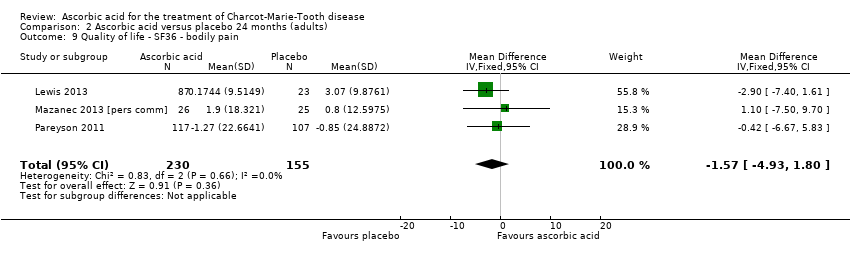
Comparison 2 Ascorbic acid versus placebo 24 months (adults), Outcome 9 Quality of life ‐ SF36 ‐ bodily pain.

Comparison 2 Ascorbic acid versus placebo 24 months (adults), Outcome 10 Quality of life ‐ SF36 ‐ energy.

Comparison 2 Ascorbic acid versus placebo 24 months (adults), Outcome 11 9‐hole peg test.
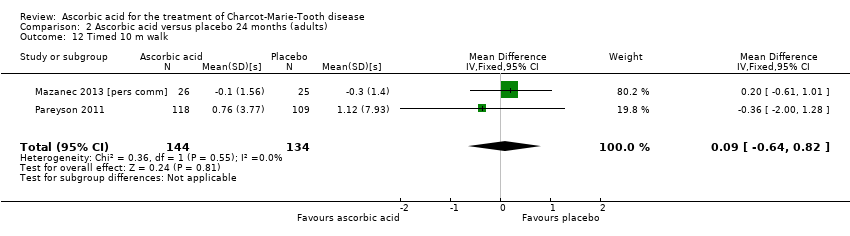
Comparison 2 Ascorbic acid versus placebo 24 months (adults), Outcome 12 Timed 10 m walk.
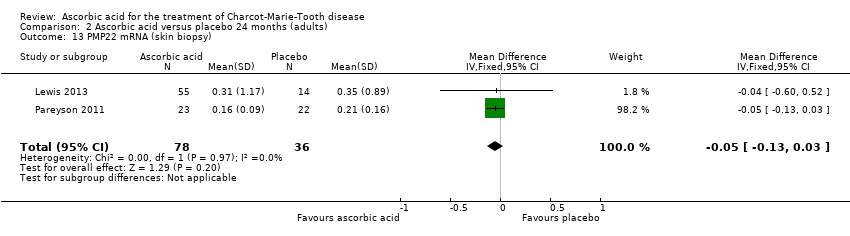
Comparison 2 Ascorbic acid versus placebo 24 months (adults), Outcome 13 PMP22 mRNA (skin biopsy).
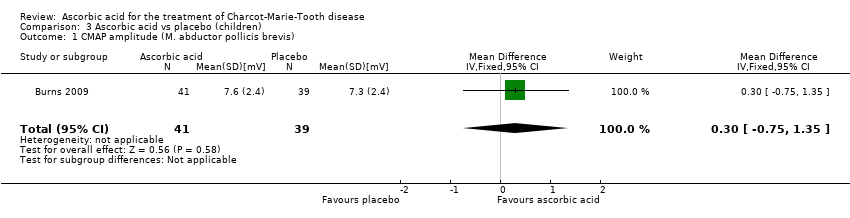
Comparison 3 Ascorbic acid vs placebo (children), Outcome 1 CMAP amplitude (M. abductor pollicis brevis).
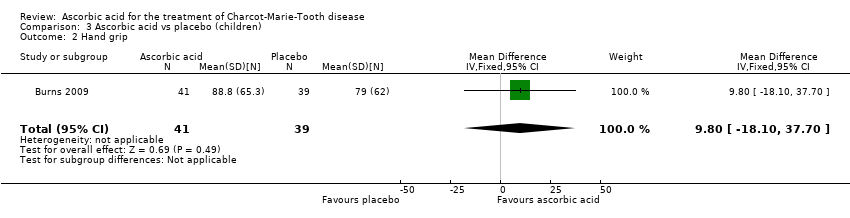
Comparison 3 Ascorbic acid vs placebo (children), Outcome 2 Hand grip.
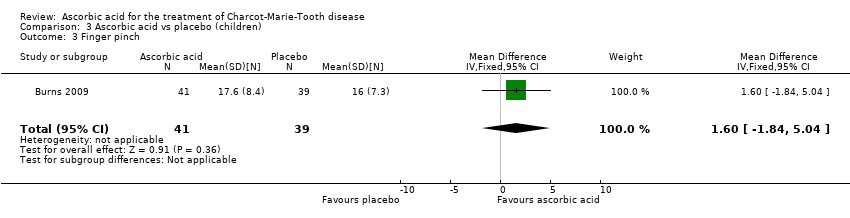
Comparison 3 Ascorbic acid vs placebo (children), Outcome 3 Finger pinch.
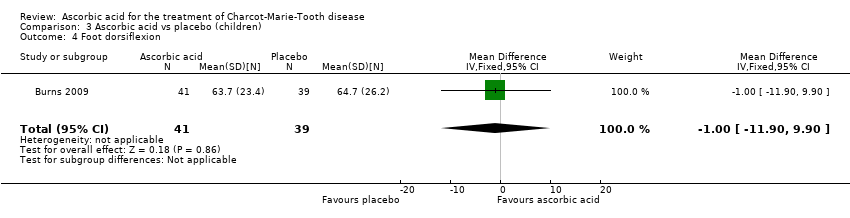
Comparison 3 Ascorbic acid vs placebo (children), Outcome 4 Foot dorsiflexion.
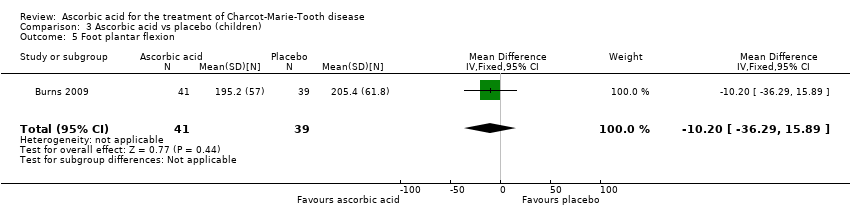
Comparison 3 Ascorbic acid vs placebo (children), Outcome 5 Foot plantar flexion.

Comparison 3 Ascorbic acid vs placebo (children), Outcome 6 Median nerve motor conduction velocity.
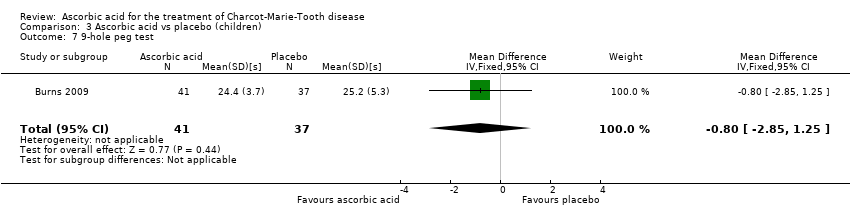
Comparison 3 Ascorbic acid vs placebo (children), Outcome 7 9‐hole peg test.

Comparison 3 Ascorbic acid vs placebo (children), Outcome 8 6 min walk.

Comparison 3 Ascorbic acid vs placebo (children), Outcome 9 Balance.

Comparison 3 Ascorbic acid vs placebo (children), Outcome 10 Agility.
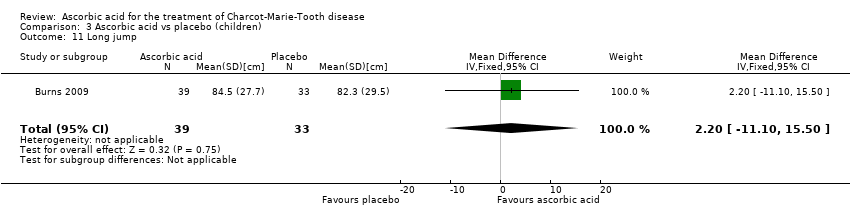
Comparison 3 Ascorbic acid vs placebo (children), Outcome 11 Long jump.

Comparison 3 Ascorbic acid vs placebo (children), Outcome 12 Speed.

Comparison 3 Ascorbic acid vs placebo (children), Outcome 13 Cadence.
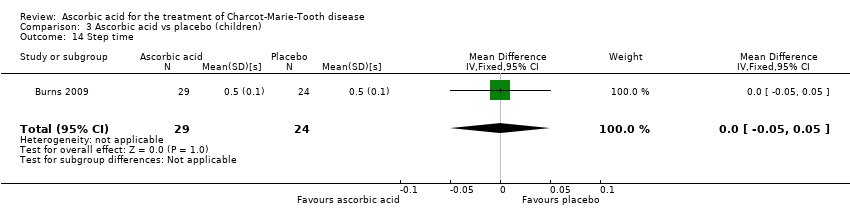
Comparison 3 Ascorbic acid vs placebo (children), Outcome 14 Step time.
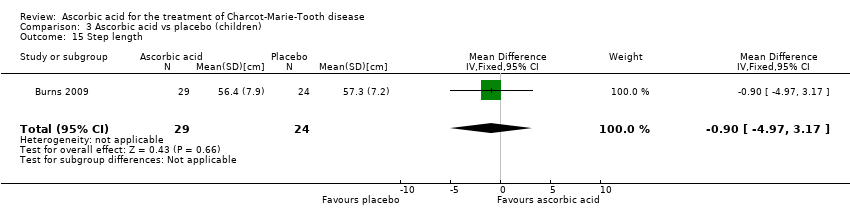
Comparison 3 Ascorbic acid vs placebo (children), Outcome 15 Step length.

Comparison 3 Ascorbic acid vs placebo (children), Outcome 16 Stride length.
| Ascorbic acid treatment compared with placebo for CMT1A in adults | ||||||
| Participants or population: adults with CMT1A Intervention: oral ascorbic acid (1 g to 4 g/day) Comparison: placebo | ||||||
| Outcomes | Illustrative comparative risks* (95% CI) | Relative effect | No of participants | Quality of the evidence | Comments | |
| Assumed risk | Corresponding risk | |||||
| Placebo | Ascorbic acid | |||||
| Impairment ‐ change in CMTNS at 24 months (0 to 36 points) | The mean change in CMTNS ranged across control groups from ‐0.92 to 1 point | The mean change in CMTNS in the intervention groups was 0.21 lower (0.81 lower to 0.39 higher) | ‐0.21 (‐0.81 to 0.39) | 388 (3) | ⊕⊕⊕⊕ | |
| Impairment ‐ change in CMTES at 24 months (0 to 28 points) | The mean change in CMTES ranged across control groups from ‐0.64 to 0.5 point | The mean change in CMTES in the intervention groups was 0.12 lower (0.67 lower to 0.42 higher) | ‐0.12 (‐0.67 to 0.42) | 337 (2) | ⊕⊕⊕⊝ | |
| Change in timed 10‐m walk at 12 months (seconds (s)) | The mean change in timed 10‐m walk ranged across control groups from ‐0.15 to 0.56 s | The mean change in timed 10‐m walk in the intervention groups was 0.02 lower (0.32 lower to 0.29 lower) | ‐0.02 (‐0.32 to 0.29) | 401 (3) | ⊕⊕⊕⊕ | |
| Change in foot dorsiflexion at 12 months (N) | The mean change in foot dorsiflexion force ranged across control groups from | The mean change in foot dorsiflexion force in the intervention groups was 1.1 higher (3.47 lower to 5.67 higher) | 1.1 (‐3.47 to 5.67) | 423 (4) | ⊕⊕⊕⊕ | |
| Change in 9‐hole peg test (HPT) at 12 months (seconds) | The mean change in 9‐HPT ranged across control groups from | The mean change in 9‐HPT in the intervention groups was 0.39 lower (0.76 lower to 0.02 lower) | ‐0.39 (‐0.76 to ‐0.02) | 286 | ⊕⊕⊕⊝ | |
| Serious adverse events (SAE; %) | The relative abundance of SAE was 12% in the placebo group ((number of SAE/number of participants)*100) | The relative abundance of SAE was 11.7% in the intervention groups ((number of SAE/number of participants)*100) | Not estimable | 702 (6, including 1 study in children) | ⊕⊕⊕⊕ | |
| *The assumed risk is based on the mean change or the range of mean change) across control groups in included studies.. The corresponding risk (and its 95% confidence interval) is based on the assumed risk in the comparison group and the relative effect of the intervention (and its 95% CI). | ||||||
| GRADE Working Group grades of evidence | ||||||
| 1 Evidence downgraded because of number of studies and participants, which was lower than for other outcomes. Further research may thus have an impact on our confidence in the estimate of effect and may change the estimate. | ||||||
| Outcome or subgroup title | No. of studies | No. of participants | Statistical method | Effect size |
| 1 Impairment ‐ CMTNS (scale 0 to 36 points) Show forest plot | 5 | 533 | Mean Difference (IV, Fixed, 95% CI) | ‐0.37 [‐0.83, 0.09] |
| 2 Impairment ‐ CMTES (scale 0 to 28 points) Show forest plot | 3 | 460 | Mean Difference (IV, Fixed, 95% CI) | ‐0.15 [‐0.57, 0.27] |
| 3 Impairment ‐ NIS (scale ‐26 to 26 points) Show forest plot | 1 | 110 | Mean Difference (IV, Fixed, 95% CI) | 1.91 [‐2.24, 6.06] |
| 4 Disability ‐ ODSS (scale 0 to 12 points) Show forest plot | 2 | 134 | Mean Difference (IV, Fixed, 95% CI) | ‐0.09 [‐0.36, 0.18] |
| 5 Disability ‐ ONLS (scale 0 to 12 points) Show forest plot | 2 | 289 | Mean Difference (IV, Fixed, 95% CI) | 0.07 [‐0.02, 0.17] |
| 6 Disability ‐ ALDS (scale 0 to 100 points) Show forest plot | 1 | 11 | Mean Difference (IV, Fixed, 95% CI) | ‐1.3 [‐4.28, 1.68] |
| 7 CMAP, ulnar nerve (abductor digiti minimi) Show forest plot | 2 | 161 | Mean Difference (IV, Fixed, 95% CI) | 0.13 [‐0.34, 0.59] |
| 8 CMAP, median nerve (abductor pollicis brevis) Show forest plot | 1 | 11 | Mean Difference (IV, Fixed, 95% CI) | ‐0.18 [‐1.19, 0.83] |
| 9 CMAP summatory from ulnar, median and peroneal nerves Show forest plot | 1 | 217 | Mean Difference (IV, Fixed, 95% CI) | 0.23 [‐0.48, 0.94] |
| 10 Sensation ‐ INCAT Sensory Sum score (scale 0 to 20 points) Show forest plot | 1 | 10 | Mean Difference (IV, Fixed, 95% CI) | ‐2.0 [‐5.53, 1.53] |
| 11 SNAP amplitude Show forest plot | 1 | 123 | Mean Difference (IV, Fixed, 95% CI) | 0.0 [‐0.42, 0.42] |
| 12 Hand grip Show forest plot | 3 | 412 | Mean Difference (IV, Fixed, 95% CI) | 1.39 [‐4.17, 6.95] |
| 13 Three‐point pinch Show forest plot | 3 | 300 | Mean Difference (IV, Fixed, 95% CI) | 0.60 [‐1.53, 2.73] |
| 14 Foot dorsiflexion Show forest plot | 4 | 423 | Mean Difference (IV, Fixed, 95% CI) | 1.10 [‐3.47, 5.67] |
| 15 Quality of life ‐ SF36 ‐ physical functioning Show forest plot | 4 | 522 | Mean Difference (IV, Fixed, 95% CI) | ‐0.05 [‐1.32, 1.22] |
| 16 Quality of life ‐ SF36 ‐ bodily pain Show forest plot | 3 | 401 | Mean Difference (IV, Fixed, 95% CI) | ‐0.53 [‐2.69, 1.62] |
| 17 Quality of life ‐ SF36 ‐ energy Show forest plot | 2 | 291 | Mean Difference (IV, Fixed, 95% CI) | 0.45 [‐2.84, 3.74] |
| 18 Quality of life ‐ SF36 ‐ psychological Show forest plot | 1 | 123 | Mean Difference (IV, Fixed, 95% CI) | 0.90 [‐2.65, 4.45] |
| 19 Quality of life ‐ SF36 ‐ MCS Show forest plot | 1 | 110 | Mean Difference (IV, Fixed, 95% CI) | 0.46 [‐3.80, 4.72] |
| 20 Quality of life ‐ SF36 ‐ PCS Show forest plot | 1 | 110 | Mean Difference (IV, Fixed, 95% CI) | 0.39 [‐2.98, 3.76] |
| 21 9‐hole peg test Show forest plot | 3 | 286 | Mean Difference (IV, Fixed, 95% CI) | ‐0.39 [‐0.76, ‐0.02] |
| 22 Timed 10 m walk Show forest plot | 3 | 401 | Mean Difference (IV, Fixed, 95% CI) | ‐0.02 [‐0.32, 0.29] |
| 23 50 m walk Show forest plot | 1 | 11 | Mean Difference (IV, Fixed, 95% CI) | ‐0.30 [‐2.49, 1.89] |
| Outcome or subgroup title | No. of studies | No. of participants | Statistical method | Effect size |
| 1 Impairment ‐ CMTNS (scale 0 to 36 points) Show forest plot | 3 | 388 | Mean Difference (IV, Fixed, 95% CI) | ‐0.21 [‐0.81, 0.39] |
| 2 Impairment ‐ CMTES (scale 0 to 28 points) Show forest plot | 2 | 337 | Mean Difference (IV, Fixed, 95% CI) | ‐0.12 [‐0.67, 0.42] |
| 3 Disability ‐ ONLS (scale 0 to 12 points) Show forest plot | 2 | 276 | Mean Difference (IV, Fixed, 95% CI) | 0.14 [‐0.05, 0.34] |
| 4 CMAP, ulnar nerve (abductor digiti minimi) Show forest plot | 2 | 161 | Mean Difference (IV, Fixed, 95% CI) | 0.06 [‐0.10, 0.23] |
| 5 Hand grip Show forest plot | 2 | 186 | Mean Difference (IV, Fixed, 95% CI) | 1.25 [‐3.86, 6.37] |
| 6 Three‐point pinch Show forest plot | 2 | 276 | Mean Difference (IV, Fixed, 95% CI) | 0.73 [‐3.62, 5.08] |
| 7 Foot dorsiflexion Show forest plot | 2 | 278 | Mean Difference (IV, Fixed, 95% CI) | 0.77 [‐7.21, 8.76] |
| 8 Quality of life ‐ SF36 ‐ physical functioning Show forest plot | 3 | 382 | Mean Difference (IV, Fixed, 95% CI) | ‐0.07 [‐2.41, 2.26] |
| 9 Quality of life ‐ SF36 ‐ bodily pain Show forest plot | 3 | 385 | Mean Difference (IV, Fixed, 95% CI) | ‐1.57 [‐4.93, 1.80] |
| 10 Quality of life ‐ SF36 ‐ energy Show forest plot | 2 | 267 | Mean Difference (IV, Fixed, 95% CI) | 0.71 [‐3.35, 4.77] |
| 11 9‐hole peg test Show forest plot | 2 | 275 | Mean Difference (IV, Fixed, 95% CI) | ‐1.16 [‐1.96, ‐0.37] |
| 12 Timed 10 m walk Show forest plot | 2 | 278 | Mean Difference (IV, Fixed, 95% CI) | 0.09 [‐0.64, 0.82] |
| 13 PMP22 mRNA (skin biopsy) Show forest plot | 2 | 114 | Mean Difference (IV, Fixed, 95% CI) | ‐0.05 [‐0.13, 0.03] |
| Outcome or subgroup title | No. of studies | No. of participants | Statistical method | Effect size |
| 1 CMAP amplitude (M. abductor pollicis brevis) Show forest plot | 1 | 80 | Mean Difference (IV, Fixed, 95% CI) | 0.30 [‐0.75, 1.35] |
| 2 Hand grip Show forest plot | 1 | 80 | Mean Difference (IV, Fixed, 95% CI) | 9.80 [‐18.10, 37.70] |
| 3 Finger pinch Show forest plot | 1 | 80 | Mean Difference (IV, Fixed, 95% CI) | 1.60 [‐1.84, 5.04] |
| 4 Foot dorsiflexion Show forest plot | 1 | 80 | Mean Difference (IV, Fixed, 95% CI) | ‐1.0 [‐11.90, 9.90] |
| 5 Foot plantar flexion Show forest plot | 1 | 80 | Mean Difference (IV, Fixed, 95% CI) | ‐10.20 [‐36.29, 15.89] |
| 6 Median nerve motor conduction velocity Show forest plot | 1 | 80 | Mean Difference (IV, Fixed, 95% CI) | 2.0 [‐0.89, 4.89] |
| 7 9‐hole peg test Show forest plot | 1 | 78 | Mean Difference (IV, Fixed, 95% CI) | ‐0.80 [‐2.85, 1.25] |
| 8 6 min walk Show forest plot | 1 | 65 | Mean Difference (IV, Fixed, 95% CI) | ‐3.0 [‐32.34, 26.34] |
| 9 Balance Show forest plot | 1 | 74 | Mean Difference (IV, Fixed, 95% CI) | ‐1.30 [‐4.62, 2.02] |
| 10 Agility Show forest plot | 1 | 72 | Mean Difference (IV, Fixed, 95% CI) | ‐1.70 [‐5.43, 2.03] |
| 11 Long jump Show forest plot | 1 | 72 | Mean Difference (IV, Fixed, 95% CI) | 2.20 [‐11.10, 15.50] |
| 12 Speed Show forest plot | 1 | 53 | Mean Difference (IV, Fixed, 95% CI) | ‐0.20 [‐9.33, 8.93] |
| 13 Cadence Show forest plot | 1 | 53 | Mean Difference (IV, Fixed, 95% CI) | 0.80 [‐6.54, 8.14] |
| 14 Step time Show forest plot | 1 | 53 | Mean Difference (IV, Fixed, 95% CI) | 0.0 [‐0.05, 0.05] |
| 15 Step length Show forest plot | 1 | 53 | Mean Difference (IV, Fixed, 95% CI) | ‐0.90 [‐4.97, 3.17] |
| 16 Stride length Show forest plot | 1 | 53 | Mean Difference (IV, Fixed, 95% CI) | ‐1.80 [‐9.58, 5.98] |