Vendajes y agentes tópicos para el tratamiento de las úlceras por presión
Información
- DOI:
- https://doi.org/10.1002/14651858.CD011947.pub2Copiar DOI

- Base de datos:
-
- Cochrane Database of Systematic Reviews
- Versión publicada:
-
- 22 junio 2017see what's new
- Tipo:
-
- Intervention
- Etapa:
-
- Review
- Grupo Editorial Cochrane:
-
Grupo Cochrane de Heridas
- Copyright:
-
- Copyright © 2017 The Cochrane Collaboration. Published by John Wiley & Sons, Ltd.
Cifras del artículo
Altmetric:
Citado por:
Autores
Contributions of authors
Maggie Westby: designed and coordinated the review; extracted data; checked the quality of data extraction; analysed and interpreted data; undertook and checked quality assessment; performed statistical analysis; checked the quality of the statistical analysis; produced the first draft of the review; contributed to writing and editing the review; made an intellectual contribution to the review; contacted an expert statistician; approved the final review prior to submission and is a guarantor of the review.
Jo Dumville: conceived, designed and coordinated the review; analysed and interpreted data; checked quality assessment; contributed to writing and editing the review; made an intellectual contribution to the review; approved the final review prior to submission; secured funding; and performed previous work that was the foundation of the current review.
Marta Soares: analysed and interpreted data; performed statistical analysis; checked the quality of the statistical analysis; contributed to writing or editing the review; made an intellectual contribution to the review; advised on the review; approved the final review prior to submission and performed previous work that was the foundation of the current review.
Nikki Stubbs: contributed to writing or editing the review; made an intellectual contribution to the review; advised on the review and approved the final review prior to submission.
Gill Norman: extracted data; checked the quality of data extraction; undertook and checked quality assessment; contributed to writing and editing the review; made an intellectual contribution to the review and approved the final review prior to submission.
Contributions of the editorial base
Nicky Cullum (Co‐ordinating Editor): edited the protocol and the review; advised on methodology, interpretation and content; approved the final protocol and review prior to submission.
Gill Rizzello (Managing Editor): co‐ordinated the editorial process, advised on content; edited the protocol and the review.
Reetu Child (Information Specialist): designed the search strategy and ran the search; edited the search methods section.
Ursula Gonthier (Editorial Assistant): edited the plain language summary and reference sections.
Sources of support
Internal sources
-
Division of Nursing, Midwifery and Social Work, School of Health Sciences, University of Manchester, UK.
External sources
-
National Institute for Health Research, UK.
This project was supported by the National Institute for Health Research, via Cochrane Infrastructure and Cochrane Programme Grant funding (NIHR Cochrane Programme Grant 13/89/08 – High Priority Cochrane Reviews in Wound Prevention and Treatment) to Cochrane Wounds. The views and opinions expressed therein are those of the authors and do not necessarily reflect those of the Systematic Reviews Programme, NIHR, NHS or the Department of Health.
-
National Institute for Health Research Collaboration for Leadership in Applied Health Research and Care (NIHR CLAHRC) Greater Manchester, UK.
Jo Dumville was partly funded by the National Institute for Health Research Collaboration for Leadership in Applied Health Research and Care (NIHR CLAHRC) Greater Manchester. The funder had no role in the design of the studies, data collection and analysis, decision to publish, or preparation of the manuscript. However, the review may be considered to be affiliated to the work of the NIHR CLAHRC Greater Manchester. The views expressed herein are those of the authors and not necessarily those of the NHS, NIHR or the Department of Health.
Declarations of interest
Maggie Westby: my employment at the University of Manchester is funded by National Institute for Health Research (NIHR) and focuses on high priority Cochrane Reviews in the prevention and treatment of wounds.
Jo Dumville: I receive research funding from the National Institute for Health Research (NIHR) for the production of systematic reviews focusing on high priority Cochrane Reviews in the prevention and treatment of wounds. This work was also partly funded by the National Institute for Health Research Collaboration for Leadership in Applied Health Research and Care (NIHR CLAHRC) Greater Manchester.
Marta Soares: none known.
Nikki Stubbs: funding from pharmaceutical companies has supported training and educational events, and payments have been received by the author for non‐product‐related educational sessions. These have been unrelated to the subject matter of the review and have never been in support or in pursuit of the promotion of products.
Gill Norman: my employment at the University of Manchester is funded by the National Institute for Health Research (NIHR) and focuses on high priority Cochrane Reviews in the prevention and treatment of wounds.
Acknowledgements
The authors would like to acknowledge the contribution of Cochrane Wounds editor, Joan Webster, the peer referees Anne‐Marie Bagnall, Gill Worthy, Emma Ladds, Zena Moore, Linda Faye Lehman and Janet Yarrow and the copy editors Jenny Bellorini and Denise Mitchell. The authors are also grateful to Adolfo Maria Tambella for providing translation services.
Version history
| Published | Title | Stage | Authors | Version |
| 2017 Jun 22 | Dressings and topical agents for treating pressure ulcers | Review | Maggie J Westby, Jo C Dumville, Marta O Soares, Nikki Stubbs, Gill Norman | |
| 2015 Nov 18 | Dressings and topical agents for treating pressure ulcers | Protocol | Maggie J Westby, Jo C Dumville, Marta O Soares, Nikki Stubbs, Gill Norman, Christopher N Foley | |
Differences between protocol and review
The protocol states that where studies have 25% or fewer Stage 1 ulcers, or 25% or fewer other complex wound types, we would include all study data initially and test the assumption in sensitivity analysis. However, we decided that it was more appropriate to exclude these studies. We also planned to carry out a sensitivity analysis in the absence of studies for which there were more than 75% but less than 100% of eligible ulcers. However, this sensitivity analysis was not done. A post‐hoc subgroup analysis was added, restricting the interventions to dressings (and hydrogel).
The major change from the protocol was to analyse the data in a frequentist rather than Bayesian framework, so STATA was used for all analyses rather than WinBUGS, as we originally proposed.
We did not contact study authors.
Keywords
MeSH
Medical Subject Headings (MeSH) Keywords
- *Bandages;
- *Wound Healing;
- Alginates [therapeutic use];
- Bandages, Hydrocolloid;
- Collagenases [therapeutic use];
- Dermatologic Agents [*therapeutic use];
- Egg White;
- Gels [therapeutic use];
- Glucuronic Acid [therapeutic use];
- Hexuronic Acids [therapeutic use];
- Network Meta‐Analysis;
- Ointments [therapeutic use];
- Pharmaceutic Aids [therapeutic use];
- Phenytoin [therapeutic use];
- Povidone [therapeutic use];
- Pressure Ulcer [*therapy];
- Randomized Controlled Trials as Topic;
- Zinc Oxide [therapeutic use];
Medical Subject Headings Check Words
Humans;
PICO
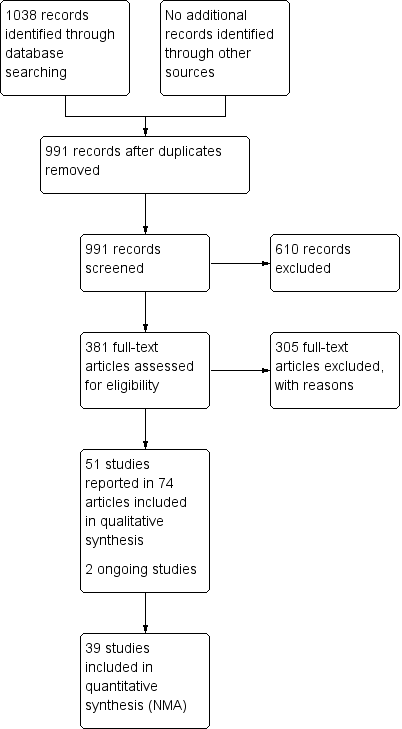
Study flow diagram

Network diagram ‐ individual interventions, by risk of bias (3 categories)
Key: green = low/unclear; yellow = high; red = very high overall risk of bias for the contrast. The number of studies for each contrast is given in Table 2.

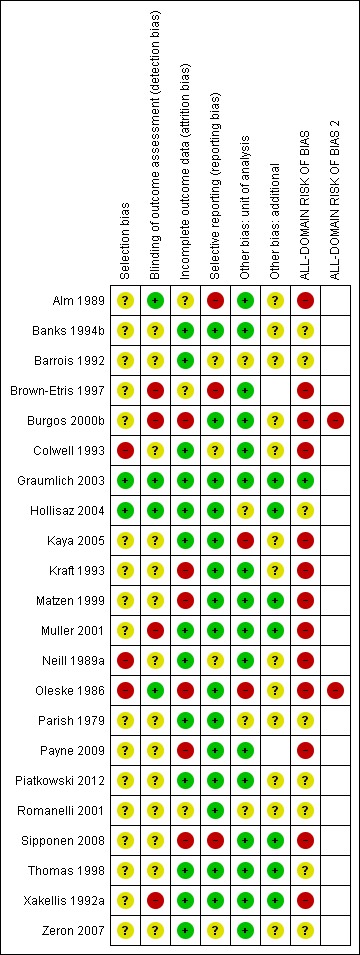
Risk of bias summary: review authors' judgements about each risk of bias item for each included study
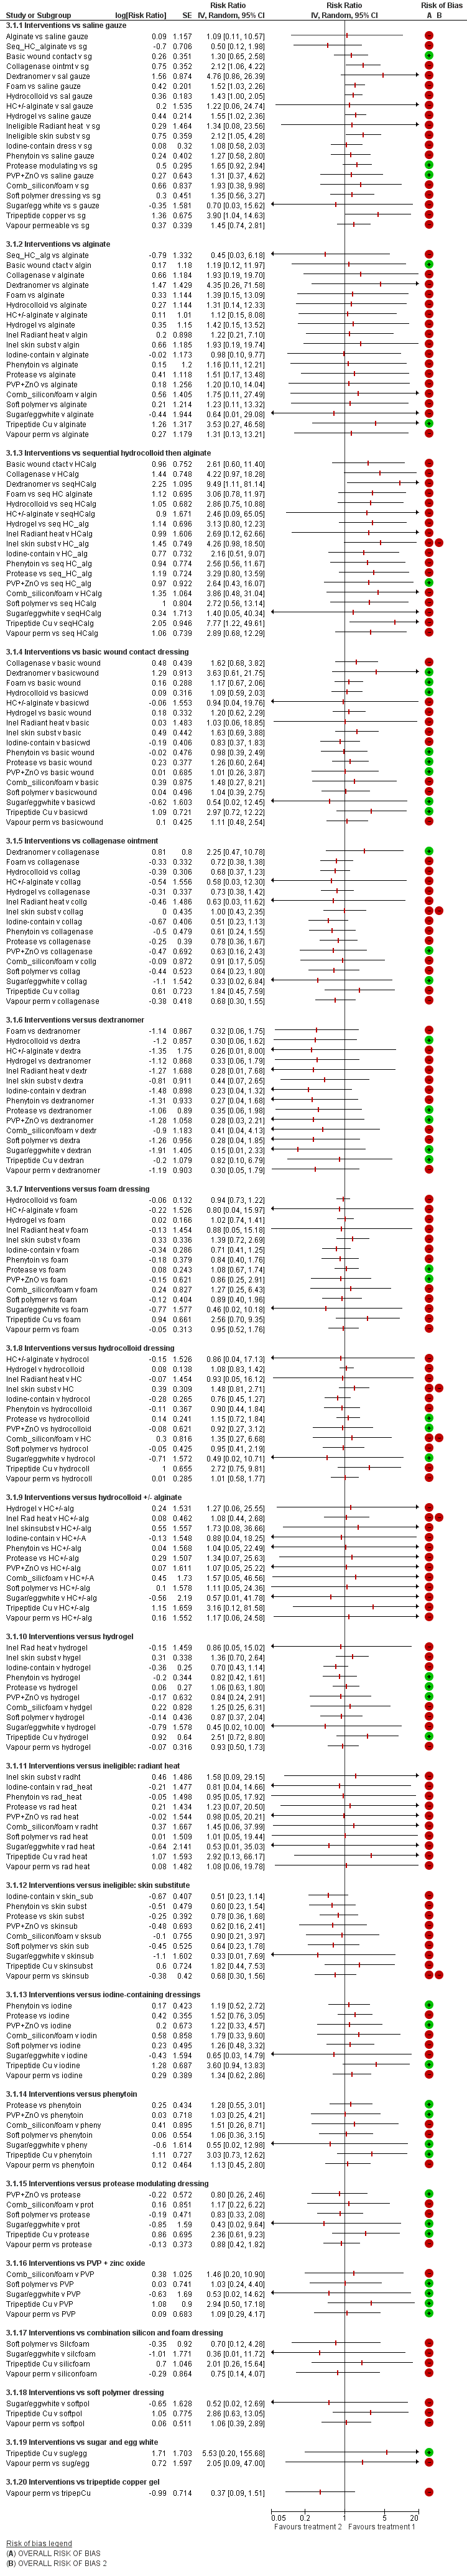
NMA results: individual intervention 1 versus individual intervention 2
Key for overall risk of bias for the contrast: green = low/unclear; one red = high; two reds = very high

Rankograms for each intervention ‐ individual network

Funnel plot ‐ individual network
Key to interventions: 1: saline gauze; 2: alginate dressing; 3: sequential hydrocolloid alginate dressings; 4: basic wound contact dressing; 5: collagenase ointment; 6: dextranomer; 7: foam dressing; 8: hydrocolloid dressing; 9: hydrocolloid +/‐ alginate (hydrocolloid dressing with/without alginate filler); 10: hydrogel dressing; 11: ineligible radiant heat; 12: ineligible skin substitute; 13: iodine‐containing dressing; 14: phenytoin; 15: protease‐modulating dressing; 16: PVP + zinc oxide 17: silicone + foam dressing; 18: soft polymer dressing; 19: sugar + egg white; 20: tripeptide copper gel; 21: vapour‐permeable dressing
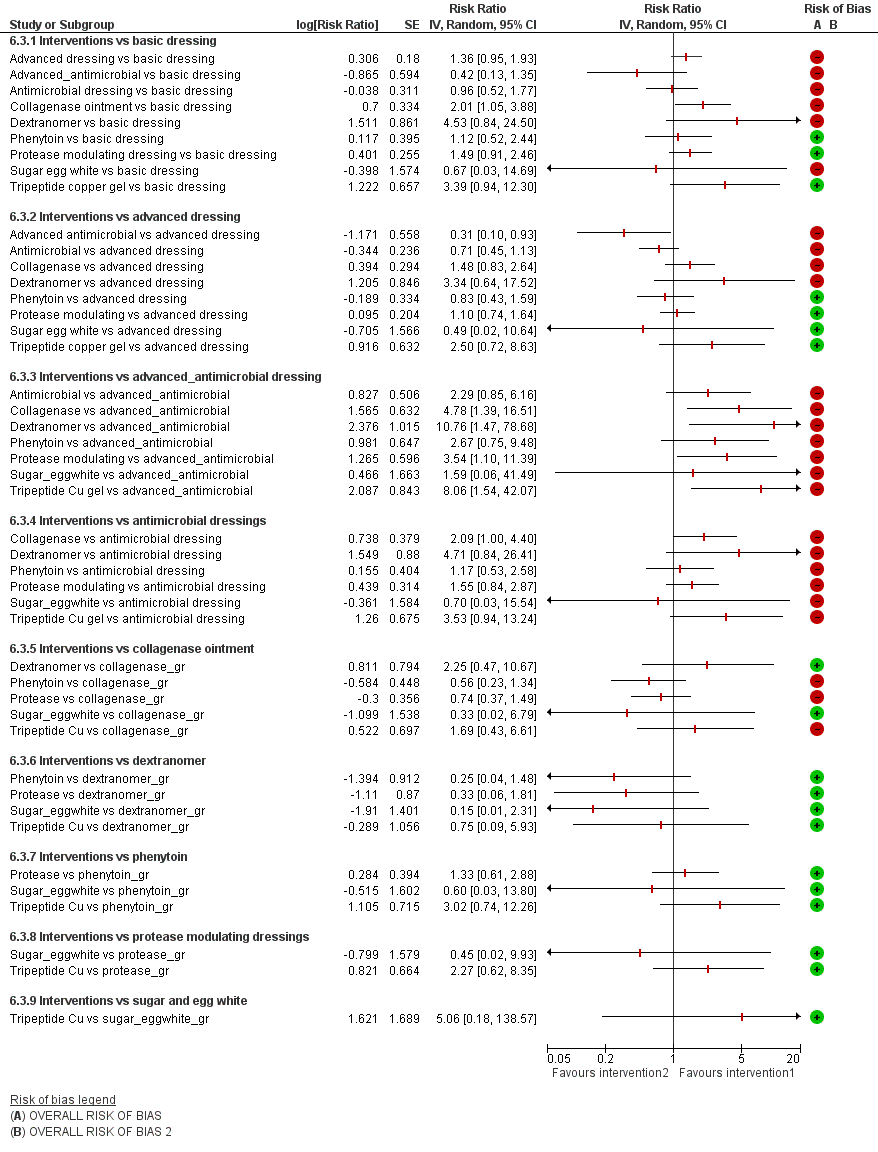
Intervention 1 versus intervention 2 ‐ group network
Key for overall risk of bias for the contrast: green = low/unclear; one red = high; two reds = very high

Rankograms combined ‐ group network

Funnel plot ‐ group network
Key to interventions: 1: basic dressing; 2: advanced dressing; 3: advanced or antimicrobial dressing; 4: antimicrobial dressing;
5: collagenase ointment; 6: dextranomer; 7: phenytoin; 8: protease‐modulating dressing; 9: sugar + egg white; 10: tripeptide copper gel
Key: green = low/unclear risk of bias; yellow = high risk of bias; red = very high overall risk of bias for the contrast. The number of studies for each contrast is given in Table 4.
Risk of bias summary ‐ group network: review authors' judgements about each risk of bias item for each included study

Group network ‐ rankograms
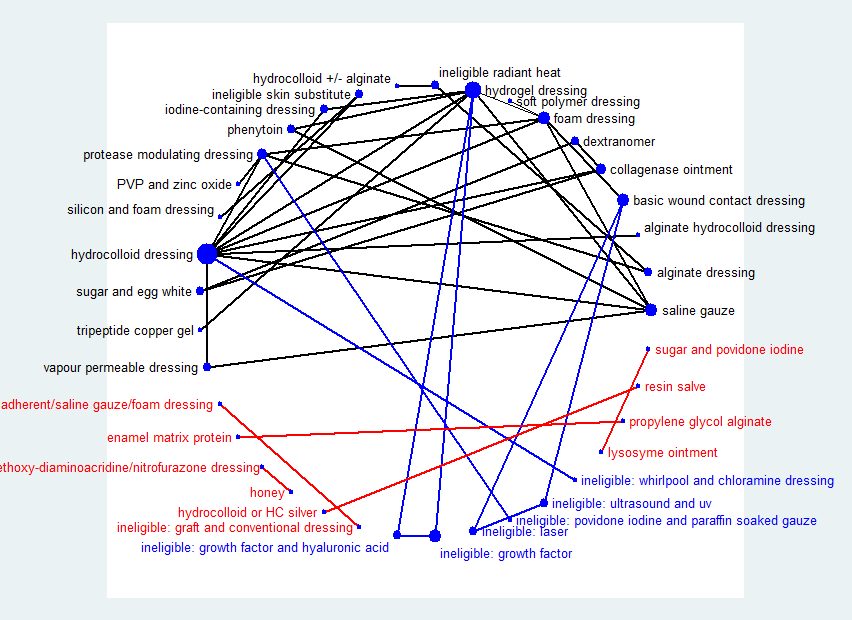
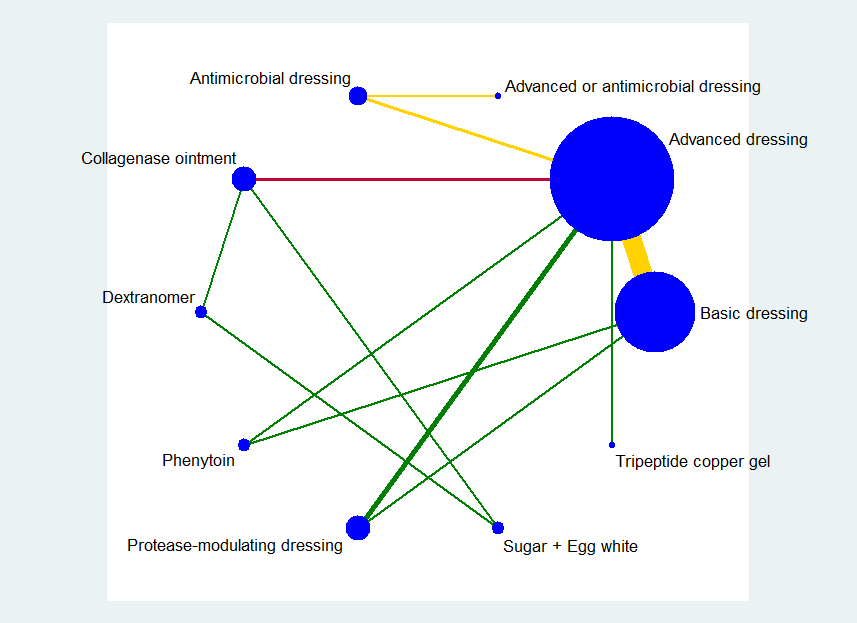
Network diagram ‐ all interventions
Key: red = isolated interventions; blue = ineligible interventions joined to only one eligible intervention. Line and node weights not to scale
Contributions matrix ‐ interventions versus saline gauze (independent network)
Key: 1 = saline gauze dressing; 2 = alginate dressing; 3 = sequential hydrocolloid alginate dressings; 4 = basic wound contact dressing; 5 = collagenase ointment; 6 = dextranomer; 7 = foam dressing; 8 = hydrocolloid dressing; 9 = hydrocolloid +/‐ alginate (hydrocolloid with/without alginate filler); 10 = hydrogel dressing; 11 = ineligible intervention: radiant heat; 12 = ineligible intervention: skin substitute; 13 = iodine‐containing dressing; 14 = phenytoin; 15 = protease‐modulating dressing; 16 = PVP + zinc oxide; 17 = silicone + foam dressing; 18 = soft polymer dressing; 19 = sugar + egg white; 20 = tripeptide copper gel; 21 = vapour‐permeable dressing.

Rankograms combined ‐ individual network
Key to interventions: 1: saline gauze; 2: alginate dressing; 3: sequential hydrocolloid alginate dressings; 4: basic wound contact dressing; 5: collagenase ointment; 6: dextranomer; 7: foam dressing; 8: hydrocolloid dressing; 9: hydrocolloid +/‐ alginate (hydrocolloid dressing with/without alginate filler); 10: hydrogel dressing; 11: ineligible radiant heat; 12: ineligible skin substitute; 13: iodine‐containing dressing; 14: phenytoin; 15: protease‐modulating dressing; 16: PVP + zinc oxide
17: silicone + foam dressing; 18: soft polymer dressing; 19: sugar + egg white; 20: tripeptide copper gel; 21: vapour‐permeable dressing

Comparison 1 Direct evidence: individual interventions, number with complete healing, Outcome 1 Interventions vs saline gauze.

Comparison 1 Direct evidence: individual interventions, number with complete healing, Outcome 2 Interventions vs hydrocolloid.

Comparison 2 Direct evidence group intervention, number with complete healing, Outcome 1 Intervention 1 vs intervention 2.

Comparison 3 Direct evidence: individual interventions, time‐to‐healing data, Outcome 1 Time‐to‐healing (survival analysis).

Comparison 4 Direct evidence: group interventions, time‐to‐healing data, Outcome 1 Time‐to‐healing (survival analysis).

Comparison 5 Direct evidence ‐ non‐network comparisons, Outcome 1 Intervention 1 vs intervention 2.
| NMA evidence for individual network: proportion with complete healing ‐ interventions versus saline gauze | ||||
| Patient or population: people with pressure ulcers Settings: hospital, community or care home, or combinations | ||||
| Contrasts: interventions versus saline gauze | Relative effect | Anticipated absolute effects* (95% CI) ‐ from median of saline gauze control groups in direct evidence | Certainty (quality) of | |
| Median CGR | With interventions | |||
| Alginate dressings | RR 1.09 | 157 per 1000 | 171 per 1000 (17 to 1000) | ⊕⊝⊝⊝ |
| 14 more people healed per 1000 (140 fewer to 1000 more) | ||||
| Sequential hydrocolloid alginate dressings | RR 0.50 | 157 per 1000 | 78 per 1000 (1.9 to 31.2) | ⊕⊝⊝⊝ |
| 79 fewer people healed per 1000 (138 fewer to 155 more) | ||||
| Basic wound contact dressings | RR 1.30 | 157 per 1000 | 204 per 1000 (102 to 407) | ⊕⊕⊝⊝ |
| 47 more people healed per 1000 (55 fewer to 250 more) | ||||
| Collagenase ointment | RR 2.12 | 157 per 1000 | 333 per 1000 (166 to 663) | ⊕⊕⊝⊝ |
| 176 more people healed per 1000 (9 more to 506 more) | ||||
| Dextranomer | RR 4.76 | 157 per 1000 | 747 per 1000 (135 to 1000) | ⊕⊝⊝⊝ |
| 590 more people healed per 1000 (22 fewer to 1000 more) | ||||
| Foam dressings | RR 1.52 | 157 per 1000 | 239 per 1,000 (162 to 353) | ⊕⊕⊝⊝ |
| 82 more people healed per 1,000 (5 more to 196 more) | ||||
| Hydrocolloid dressing | RR 1.22 | 157 per 1000 | 192 per 1,000 (9 to 1000) | ⊕⊝⊝⊝ |
| 35 more people healed per 1,000 (148 fewer to 1000 more) | ||||
| Hydrocolloid dressings | RR 1.43 | 157 per 1000 | 225 per 1000 (157 to 322) | ⊕⊝⊝⊝ |
| 68 more people healed per 1000 (from 0 fewer to 165 more) | ||||
| Hydrogel | RR 1.55 | 157 per 1000 | 243 per 1000 (160 to 371) | ⊕⊝⊝⊝ |
| 86 more people healed per 1000 (from 3 more to 214 more) | ||||
| Iodine‐containing dressings | RR 1.08 | 157 per 1000 | 170 per 1000 (91 to 316) | ⊕⊝⊝⊝ |
| 13 more people healed per 1000 (from 66 fewer to 159 more) | ||||
| Phenytoin | RR 1.27 | 157 per 1000 | 199 per 1000 (91 to 440) | ⊕⊝⊝⊝ |
| 42 more people healed per 1000 (from 66 fewer to 283 more) | ||||
| Protease‐modulating dressings | RR 1.65 | 157 per 1000 | 259 per 1,000 (144 to 462) | ⊕⊕⊕⊝ |
| 102 more people healed per 1000 (from 13 fewer to 305 more) | ||||
| Polyvinylpyrrolidone + zinc oxide | RR 1.31 | 157 per 1000 | 206 per 1,000 (58 to 732) | ⊕⊕⊝⊝ |
| 49 more people healed per 1000 (from 99 fewer to 575 more) | ||||
| Combination silicone foam dressings | RR 1.93 | 157 per 1000 | 303 per 1,000 (60 to 1,000) | ⊕⊝⊝⊝ |
| 146 more people healed per 1000 (from 97 fewer to 1,000 more) | ||||
| Soft polymer dressings | RR 1.35 | 157 per 1000 | 212 per 1,000 (86 to 517) | ⊕⊝⊝⊝ |
| 55 more people healed per 1000 (from 71 fewer to 360 more) | ||||
| Sugar + egg white | RR 0.70 | 157 per 1000 | 110 per 1000 (5 to 1,000) | ⊕⊝⊝⊝ |
| 47 fewer people healed per 1000 (from 152 fewer to 1000 more) | ||||
| Tripeptide copper gel | RR 3.90 | 157 per 1000 | 612 per 1000 (163 to 1000) | ⊕⊝⊝⊝ |
| 455 more people healed per 1000 (6 more to 1000 more) | ||||
| Vapour‐permeable dressings | RR 1.45 | 157 per 1000 | 228 per 1000 | ⊕⊝⊝⊝ |
| 71 more people healed per 1000 (from 39 fewer to 283 more) | ||||
| *The risk in the intervention group (and its 95% CI) is based on the assumed risk in the comparator group and the relative effect of the intervention (and its 95% CI). | ||||
| GRADE Working Group grades of evidence | ||||
| 1Majority of evidence at high risk of bias (downgraded once); imprecision: very wide CI (crosses 0.75 and 1.25) (downgraded twice). | ||||
| Study characteristic | Studies in the individual | Studies in both individual and group networks | Studies in the group network only | Studies included in neither network | |
| Publication (all others were full published papers) | Conference abstracts (5) | ||||
| Multiple interventions | > 2 arms (4) | Nussbaum 1994; Ramos‐Torrecillas 2015 (4 arms) | |||
| Unit of randomisation (all other studies randomised individuals) | Ulcers randomised (5) | ||||
| Cluster‐randomised (2) | |||||
| not stated (3) | |||||
| Funding | Industry funding (18) | Banks 1994c; Belmin 2002; Brod 1990; Brown‐Etris 2008; Hondé 1994; Motta 1999 | Banks 1994a; Burgos 2000b; Colwell 1993; Kraft 1993; Neill 1989a; Payne 2009; Piatkowski 2012; Thomas 1998 | ||
| Mixed industry and non industry (2) | |||||
| Non industry (10) | Brown‐Etris 1997; Hollisaz 2004; Kaya 2005; Muller 2001; Oleske 1986; Xakellis 1992 | ||||
| Not stated (21) | Aguilo Sanchez 2002; Bale 1997a; Brown‐Etris 1996; Darkovich 1990; Meaume 2003; Price 2000; Seeley 1999; Seeley 1999; Thomas 1997a; Thomas 2005 | Alm 1989; Banks 1994b; Barrois 1992; Matzen 1999; Parish 1979; Romanelli 2001; Zeron 2007 | |||
| Setting | Community only (6) | ||||
| Hospital only (20) | Bale 1997a; Banks 1994c; Belmin 2002; Hondé 1994; Sopata 2002 | Alm 1989; Burgos 2000b; Colwell 1993; Kaya 2005; Muller 2001; Oleske 1986; Piatkowski 2012; Zeron 2007 | Gorse 1987; Imamura 1989; Nisi 2005; Nussbaum 1994; Ramos‐Torrecillas 2015; Yapucu Güneş 2007 | ||
| Hospital and other setting (7) | Price 2000 (hospital and community); Darkovich 1990 (hospital and care home); Brown‐Etris 1996 (hospital and community and care home) | Banks 1994b (hospital and community); Kraft 1993; Neill 1989a (hospital and care home); Payne 2009 (hospital and community and care home) | Ashby 2012 (hospital and community) | ||
| Care home and community (5) | |||||
| Care home only (5) | |||||
| Not stated (7) | |||||
| Follow‐up time | < 6 weeks (8) | Oleske 1986; Parish 1979; Payne 2009; Piatkowski 2012; Zeron 2007 | |||
| 6 to 8 weeks (25) | Aguilo Sanchez 2002; Banks 1994c; Belmin 2002; Brod 1990; Brown‐Etris 2008; Hondé 1994; Meaume 2003; Motta 1999; Price 2000; Seeley 1999; Sopata 2002; Thomas 1997a; | Alm 1989; Banks 1994a; Barrois 1992; Brown‐Etris 1997; Graumlich 2003; Hollisaz 2004; Neill 1989a; Romanelli 2001 | Imamura 1989; Nisi 2005; Nussbaum 1994; Sebern 1986; Van De Looverbosch 2004 | ||
| > 8 to 12 weeks (10) | Banks 1994b; Burgos 2000b; Colwell 1993; Matzen 1999; Thomas 1998 | ||||
| ≥ 16 weeks (7) | |||||
| Unclear (1) | |||||
| Mean age | < 65 years (8) | ||||
| Not stated (1) | |||||
| Physical conditions | Spinal cord injuries (4) | ||||
| Other (2) | Sopata 2002 (advanced cancer) | Parish 1979 ("chronically ill or physically disabled") | |||
| Ulcer grade | Mainly Stage 2 (17) | Bale 1997a; Thomas 1997a (Stirling); Brown‐Etris 2008 (classification not stated); Darkovich 1990 (Enis and Sarmiento); Hondé 1994 (Shea); Meaume 2003 (EUPAP) | Colwell 1993 (classification not stated); Graumlich 2003; Kaya 2005; Payne 2009 (NPUAP); Hollisaz 2004; Neill 1989a; Xakellis 1992 (Shea); Kraft 1993 (Enterstomal Therapy); Oleske 1986 (Enis and Sarmiento) | Gorse 1987; Van De Looverbosch 2004 (classification not stated) | |
| Mainly Stage 3 (15) | Belmin 2002 (Yarkony); Seeley 1999 (AHCPR); Thomas 1997a (Stirling); Serena 2010 (NPUAP); Brown‐Etris 1996; Motta 1999; Price 2000; Thomas 2005 (classification not stated) | Burgos 2000b (classification not stated); Piatkowski 2012 (EPUAP) | Sipponen 2008 (EPUAP) | Ashby 2012; Ramos‐Torrecillas 2015; (EPUAP classification); Yapucu Güneş 2007 (AHCRQ); Payne 2004 (classification not stated) | |
| Mainly Stage 4 (2) | Matzen 1999; Muller 2001 (classification not stated) | ||||
| Other (12) | Banks 1994c (II/III); Sopata 2002 II/III (Torrance); Brod 1990 (II/III) (classification not stated) | Banks 1994a (II/III); Brown‐Etris 1997 (II/III/IV) (classification not stated); Banks 1994b (Torrance II/III); Romanelli 2001 (II/III); Zeron 2007(2/3) (NPUAP) | Nisi 2005 (2‐4); Rees 1999 (3/4) (NPUAP); Sebern 1986 (II/III) (Shea); Imamura 1989 (II/III/IV) (classification not stated) | ||
| Not stated (5) | |||||
| Ulcer duration (other studies had ≥ 3 months) | < 3 months (16) | Banks 1994c (median 7 days); Belmin 2002; Brown‐Etris 1996; Brown‐Etris 2008; Meaume 2003; Motta 1999; Seeley 1999; Sopata 2002 (mean 2.5 weeks); Thomas 1997a | Banks 1994a; Burgos 2000b; Colwell 1993; Graumlich 2003; Hollisaz 2004; Kraft 1993; Payne 2009 | ||
| ≥ 3 months (6) | |||||
| Not stated/unclear (29) | Aguilo Sanchez 2002; Bale 1997a; Brod 1990; Darkovich 1990; Hondé 1994; Price 2000; Thomas 2005 | Banks 1994b; Barrois 1992; Brown‐Etris 1997; Kaya 2005; Matzen 1999; Muller 2001; Neill 1989a; Oleske 1986; Parish 1979; Piatkowski 2012 (> 4 weeks); Romanelli 2001; Thomas 1998; Xakellis 1992; Zeron 2007 | Gorse 1987; Imamura 1989; Nisi 2005; Nussbaum 1994 (> 6 weeks); Sebern 1986; Van De Looverbosch 2004 (> 1 month); Yapucu Güneş 2007 | ||
| Contrast/comparison | Number | RR (95% CI) direct evidence Random‐effects (inverse variance) Heterogeneity statistics | NMA results (consistency assumption) RR (95% CI) |
| Hydrocolloid dressing versus saline gauze dressing | 4 (279) | 1.89 (0.91 to 3.93) Tau² = 0.35; P = 0.01; I² = 73% | 1.43 (1.00 to 2.05) |
| Hydrogel versus saline gauze dressing | 3 (110) | 2.44 (0.64 to 9.27) Tau² = 0.90; P = 0.03; I² = 71% | 1.55 (1.02 to 2.36) |
| Foam dressings versus saline gauze dressing | 3 (93) | 1.51 (0.78 to 2.90) P = 0.41; I² = 0% | 1.52 (1.03 to 2.26) |
| Phenytoin versus saline gauze dressing | 1 (40) | 3.02 (0.97 to 9.35) | 1.27 (0.58 to 2.80) |
| Hydrogel versus hydrocolloid dressings | 4 (322) | 1.11 (0.74 to 1.67) Tau² = 0.08; P = 0.11; I² = 51% | 1.08 (0.83 to 1.42) |
| Foam dressing versus hydrocolloid dressing | 6 (292) | 1.05 (0.81 to 1.36) Tau² = 0.00; P = 0.67; I² = 0% (Stata: 1.05 (0.73 to 1.23)) | 1.07 (0.82 to 1.38) |
| Collagenase ointment versus hydrocolloid dressing | 2 (61) | 1.51 (0.93 to 2.43) P = 0.61; I² = 0% | 1.48 (0.81 to 2.69) |
| Iodine‐containing dressing versus hydrocolloid dressing | 1 (76) | 0.90 (0.41 to 1.96) | 0.76 (0.45 to 1.27) |
| Protease‐modulating dressing versus hydrocolloid dressing | 1 (65) | 1.03 (0.64 to 1.66) | 1.15 (0.72 to 1.84) |
| Vapour‐permeable dressing versus hydrocolloid dressing | 1 (72) | 1.01 (0.69 to 1.47) | 1.01 (0.58 to 1.77) |
| Hydrocolloid dressing 4 weeks then alginate dressing 4 weeks versus hydrocolloid dressing (Belmin 2002) | 1 (110) | 0.35 (0.10 to 1.25) | 0.35 (0.09 to 1.33) |
| Ineligible intervention: skin substitute versus hydrocolloid dressing (Hondé 1994) | 1 (168) | 1.48 (0.95 to 2.32) | 1.48 (0.81 to 2.71) |
| Foam dressing versus hydrogel (Sopata 2002) | 1 (38) | 1.11 (0.80 to 1.54) | 0.98 (0.71 to 1.36) |
| Tripeptide copper versus hydrogel | 1 (12) | 2.50 (0.76 to 8.19) | 2.51 (0.72 to 8.80) |
| Iodine‐containing dressing versus hydrogel | 1 (49) | 0.64 (0.43 to 0.97) | 0.70 (0.43 to 1.14) |
| Phenytoin versus hydrogel (Hollisaz 2004) | 1 (39) | 0.71 (0.41 to 1.24) | 0.82 (0.42 to 1.61) |
| Foam dressing versus protease‐modulating dressing | 1 (10) | 0.82 (0.49 to 1.38) | 0.93 (0.57 to 1.49) |
| Alginate dressing versus protease‐modulating dressing (Brown‐Etris 1997) | 1 (36) | 0.67 (0.08 to 5.75) | 0.30 (0.07 to 1.25) |
| PVP + zinc oxide versus protease‐modulating dressing | 1 (24) | 0.80 (0.28 to 2.27) | 0.80 (0.26 to 2.46) |
| Soft polymer dressing versus foam dressing | 1 (38) | 0.89 (0.45 to 1.75) | 0.89 (0.40 to 1.96) |
| Combination silicone‐foam dressing versus ineligible intervention: skin substitute (Serena 2010) | 1 (74) | 0.91 (0.22 to 3.77) | 0.90 (0.21 to 3.97) |
| Hydrocolloid with/without alginate filler versus ineligible intervention: radiant heat (Thomas 2005) | 1 (41) | 0.92 (0.41 to 2.06) | 0.92 (0.37 to 2.27) |
| Collagenase ointment versus dextranomer | 1 (12) | 0.35 (0.05 to 2.26) (Stata 0.44 (0.10 to 2.02)) | 0.44 (0.09 to 2.13) |
| Collagenase ointment versus sugar + egg white | 1 (10) | 3.00 (0.15 to 59.89) (Stata 3.00 (0.15 to 59.79)) | 3.00 (0.15 to 61.59) |
| Dextranomer versus sugar + egg white | 1 (12) | 6.75 (0.44 to 102.80) | 6.75 (0.43 to 105.99) |
| Foam dressing versus basic wound contact dressing | 1 (50) | 1.17 (0.79 to 1.72) | 1.17 (0.67 to 2.06) |
| Alginate dressing versus ineligible intervention: radiant heat (Price 2000) | 1 (58) | 0.82 (0.15 to 4.55) | 0.82 (0.14 to 4.77) |
| NMA evidence for group network: proportion with complete healing ‐ interventions versus basic dressings | ||||
| Patient or population: people with pressure ulcers Settings: hospital, community or care home, or combinations | ||||
| Contrasts: interventions versus basic dressing | Relative effect (95% CI) | Anticipated absolute effects* (95% CI) ‐ from median of basic dressing control groups in direct evidence | Certainty (quality) of the | |
| Median CGR | With interventions | |||
| Advanced dressings versus basic dressing | RR 1.36 | 191 per 1000 | 260 per 1000 | ⊕⊝⊝⊝ |
| 69 more people healed per 1000 (from 10 fewer to 178 more) | ||||
| Advanced + antimicrobial dressing versus basic dressing | RR 0.42 | 191 per 1000 | 80 per 1000 | ⊕⊝⊝⊝ |
| 111 fewer people healed per 1000 (from 67 more to 166 fewer) | ||||
| Antimicrobial dressing versus basic dressing | RR 0.96 | 191 per 1000 | 183 per 1000 | ⊕⊝⊝⊝ |
| 8 fewer people healed per 1000 (from 92 fewer to 147 more) | ||||
| Collagenase ointment versus basic dressing | RR 2.01 | 191 per 1000 | 384 per 1000 | ⊕⊕⊝⊝ |
| 193 more people healed per 1000 (from 10 more to 550 more) | ||||
| Dextranomer versus basic dressing | RR 4.53 | 191 per 1000 | 865 per 1000 | ⊕⊝⊝⊝ |
| 674 more people healed per 1000 (from 31 fewer to 1,000 more) | ||||
| Phenytoin versus basic dressing | RR 1.12 | 191 per 1000 | 214 per 1000 | ⊕⊝⊝⊝ |
| 23 more people healed per 1000 (from 92 fewer to 275 more) | ||||
| Protease‐modulating dressing versus basic dressing | RR 1.49 | 191 per 1000 | 285 per 1000 | ⊕⊕⊕⊝ |
| 94 more people healed per 1000 (from 17 fewer to 279 more) | ||||
| Sugar + egg white versus basic dressing | RR 0.67 (0.03 to 14.69) | 191 per 1000 | 128 per 1000 | ⊕⊝⊝⊝ |
| 63 fewer people healed per 1000 (from 185 fewer to 1000 more) | ||||
| Tripeptide copper gel versus basic dressing | RR 3.39 | 191 per 1000 | 647 per 1000 | ⊕⊕⊝⊝ |
| 456 more people healed per 1000 (from 11 fewer to 1000 more) | ||||
| *The risk in the intervention group (and its 95% CI) is based on the assumed risk in the comparison group and the relative effect of the intervention (and its 95% CI). | ||||
| GRADE Working Group grades of evidence | ||||
| 1Majority of evidence at high risk of bias (downgraded once); inconsistency: heterogeneity in direct evidence (downgraded once); imprecision: wide CI (downgraded once). | ||||
| Individual intervention | Group intervention (studies in final network) |
| Basic wound contact dressing | Basic dressing (12 studies) |
| Saline gauze dressing | |
| Polyvinylpyrrolidone | |
| Hydrocolloid dressing | Advanced dressing (19 studies) |
| Foam dressing | |
| Hydrogel dressing | |
| Soft polymer dressing | |
| Alginate dressing | |
| Vapour‐permeable dressing | |
| Combination silicone foam dressing | |
| Hydrocolloid with/without alginate | |
| Standard care as described in Ashby 2012 | |
| Honey | Antimicrobial dressing (3 studies) |
| Iodine‐containing dressing | |
| Ethoxy diaminoacridine + nitrofurazone dressing | |
| Resin salve | |
| Hydrocolloid or hydrocolloid silver dressing | Advanced or antimicrobial dressing (1 study) |
| Protease‐modulating dressing | Protease‐modulating dressing (4 studies) |
| Collagenase ointment | Collagenase ointment (3 studies) |
| Dextranomer | Dextranomer (1 study) |
| Phenytoin topical | Phenytoin topical (1 study) |
| Sugar + egg white | Sugar + egg white (1 study) |
| Tripeptide copper gel | Tripeptide copper gel (1 study) |
| Contrast/comparison | Number | RR (95% CI) direct evidence Random‐effects (inverse variance) Heterogeneity statistics | NMA results (consistency assumption) RR (95% CI) |
| Advanced dressings versus basic dressings (Alm 1989; Banks 1994b; Colwell 1993; Hollisaz 2004; Kraft 1993; Matzen 1999; | 11 (532) | 1.55 (1.10 to 2.19) Tau² = 0.13; P = 0.02; I² = 52% | 1.36 (0.95 to 1.93) |
| Phenytoin versus basic dressing | 1 (40) | 3.02 (0.97 to 9.35) | 1.12 (0.52 to 2.44) |
| Protease‐modulating dressing versus basic dressing (Zeron 2007) | 1 (24) | 1.25 (0.44 to 3.55) | 1.49 (0.91 to 2.46) |
| Antimicrobial dressings versus advanced dressings (Barrois 1992; Kaya 2005) | 2 (125) | 0.69 (0.48 to 0.99) Tau² = 0.00; P = 0.46; I² = 0% | 0.71 (0.45 to 1.13) |
| Collagenase ointment versus advanced dressings | 2 (61) | 1.51 (0.93 to 2.43) Tau² = 0.00; P = 0.61 ; I² = 0% | 1.48 (0.83 to 2.64) |
| Phenytoin versus advanced dressing | 1 (39) | 0.71 (0.41 to 1.24) | 0.83 (0.43 to 1.59) |
| Protease‐modulating dressing versus advanced dressing (Brown‐Etris 1997; Graumlich 2003; Piatkowski 2012) | 3 (112) | 1.13 (0.80 to 1.60) Tau² = 0.00; P = 0.84 ; I² = 0% (Stata: 1.12 (0.79 to 1.59)) | 1.10 (0.74 to 1.64) |
| Tripeptide copper gel versus advanced dressing | 1 (12) | 2.50 (0.76 to 8.19) | 2.50 (0.72 to 8.63) |
| Antimicrobial dressing versus advanced antimicrobial dressing (Sipponen 2008) | 1 (37) | 2.29 (0.91 to 5.77) | 2.29 (0.85 to 6.16) |
| Collagenase versus dextranomer | 1 (12) | 0.35 (0.05 to 2.26) (Stata 0.44 (0.10 to 2.02)) | 0.44 (0.09 to 2.11) |
| Collagenase ointment versus sugar + egg white (part of 3‐arm trial) (Parish 1979) | 1 (10) | 3.00 (0.15 to 59.89) (Stata 3.00 (0.15 to 59.79)) | 3.00 (0.15 to 61.18) |
| Dextranomer versus sugar + egg white (part of 3‐arm trial) (Parish 1979) | 1 (12) | 6.75 (0.44 to 102.80) | 6.75 (0.43 to 105.22) |
| TOTAL | 22 (959) |
| Group intervention | Mean rank | SUCRA | Probability at | Rank at maximum |
| Basic dressing | 7.3 | 0.3 | 30.6 | 8 |
| Advanced dressing | 5.2 | 0.5 | 38.8 | 5 |
| Advanced ‐ antimicrobial dressing | 9.4 | 0.1 | 57.0 | 10 |
| Antimicrobial dressing | 7.4 | 0.3 | 31.9 | 8 |
| Collagenase ointment | 3.3 | 0.7 | 39.4 | 3 |
| Dextranomer | 2 | 0.9 | 55.3 | 1 |
| Phenytoin | 6.5 | 0.4 | 20.5 | 7 |
| Protease‐modulating dressing | 4.6 | 0.6 | 31.2 | 4 |
| Sugar + egg white | 7 | 0.3 | 36.5 | 10 |
| Tripeptide copper gel | 2.3 | 0.9 | 36.2 | 2 |
| Intervention | Number of | Number of participants | In joined | Number of studies | Number of participants |
| Alginate dressings | 2 | 38 | Y | 2 | 38 |
| Basic wound contact dressings | 2 | 33 | Y | 1 | 24 |
| Collagenase‐containing ointment | 3 | 35 | Y | 3 | 35 |
| Combination dressing: non‐adherent + saline gauze + foam | 1 | 16 | N | ||
| Combination dressing: silicone + foam | 1 | 44 | Y | 1 | 44 |
| Dextranomer | 1 | 7 | Y | 1 | 7 |
| Enamel matrix protein | 1 | 6 | N | ||
| Ethoxy‐diaminoacridine plus nitrofurazone dressing | 1 | 26 | N | ||
| Foam dressings | 13 | 266 | Y | 13 | 266 |
| Gauze saline dressings | 11 | 245 | Y | 10 | 233 |
| Honey | 1 | 25 | N | ||
| Hydrocolloid dressings | 22 | 791 | Y | 21 | 715 |
| Hydrocolloid or hydrocolloid silver dressing | 1 | 16 | N | ||
| Hydrocolloid with or without alginate filler | 1 | 20 | Y | 1 | 20 |
| Hydrocolloid‐alginate sequential dressings | 1 | 57 | Y | 1 | 57 |
| Hydrogel | 12 | 335 | Y | 10 | 279 |
| Ineligible intervention: graft + conventional dressing | 1 | 18 | N | ||
| Ineligible intervention: growth factor + hyaluronic acid | 1 | 40 | N | ||
| Ineligible intervention: growth factor | 2 | 152 | N | ||
| Ineligible intervention laser | 1 | 7 | N | ||
| Ineligible intervention: NPWT (only included in group analysis) | 1 | 6 | N | ||
| Ineligible intervention: povidone iodine + paraffin soaked gauze | 1 | 40 | N | ||
| Ineligible intervention: radiant heat | 2 | 53 | Y | 2 | 53 |
| Ineligible intervention: skin substitute | 2 | 110 | Y | 2 | 110 |
| Ineligible intervention: ultrasound + ultraviolet | 1 | 6 | N | ||
| Ineligible intervention: whirlpool + chloramine dressing | 1 | 52 | N | ||
| Iodine‐containing dressings | 2 | 62 | Y | 2 | 62 |
| Lysosyme ointment | 1 | 69 | N | ||
| Phenytoin topical | 1 | 21 | Y | 1 | 21 |
| Polyvinylpyrrolidone + zinc oxide | 1 | 12 | Y | 1 | 12 |
| Propylene glycol alginate | 1 | 5 | N | ||
| Protease‐modulating dressings | 5 | 116 | Y | 4 | 76 |
| Resin salve | 1 | 16 | N | ||
| Soft polymer dressing | 1 | 18 | Y | 1 | 18 |
| Standard care (only included in group analysis) | 1 | 6 | N | ||
| Sugar + egg white | 1 | 5 | Y | 1 | 5 |
| Sugar + povidone iodine | 1 | 72 | N | ||
| Tripeptide copper + Opsite | 1 | 6 | Y | 1 | 6 |
| Vapour‐permeable dressings | 2 | 57 | Y | 1 | 35 |
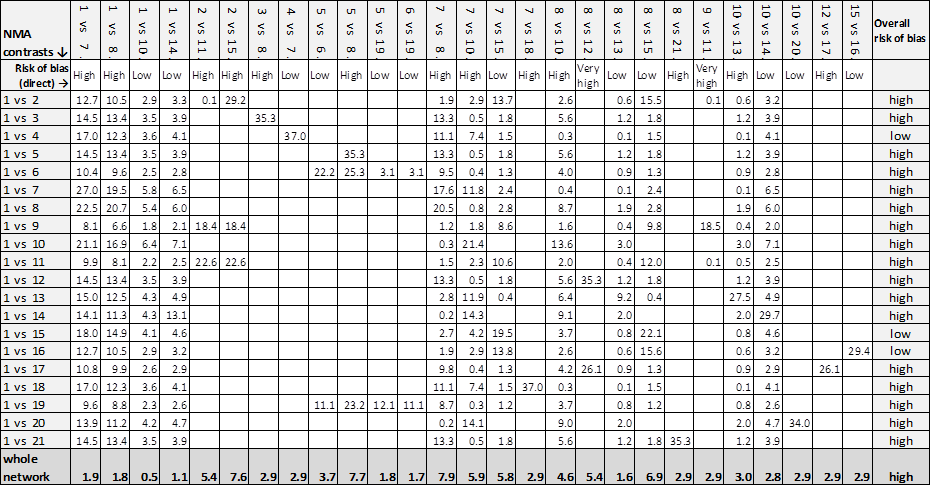
| NMA ⇩ | Contributions from each direct evidence contrast | Overall risk |
| 1 vs 2 | 74.5% 1 vs 2 + 5.5% 1 vs 7 + 7.2% 1 vs 8 + 5.5% 2 vs 7 + 7.2% 2 vs 8 | high |
| 1 vs 3 | 27.1% 1 vs 2 + 2.0% 1 vs 7 + 2.6% 1 vs 8 + 31.8% 2 vs 4 + 2.0% 2 vs 7 + 2.6% 2 vs 8 + 31.8% 3 vs 4 | high |
| 1 vs 4 | 39.8% 1 vs 2 + 2.9% 1 vs 7 + 3.9% 1 vs 8 + 46.6% 2 vs 4 + 2.9% 2 vs 7 + 3.9% 2 vs 8 | high |
| 1 vs 5 | 39.8% 1 vs 2 + 2.9% 1 vs 7 + 3.9% 1 vs 8 + 46.6% 2 vs 5 + 2.9% 2 vs 7 + 3.9% 2 vs 8 | high |
| 1 vs 6 | 26.1% 1 vs 2 + 1.9% 1 vs 7 + 2.5% 1 vs 8 + 30.6% 2 vs 5 + 1.9% 2 vs 7 + | high |
| 1 vs 7 | 37.8% 1 vs 2 + 13.4% 1 vs 7 + 3.7% 1 vs 8 + 41.4% 2 vs 7 + 3.7% 2 vs 8 | low |
| 1 vs 8 | 40.8% 1 vs 2 + 3.0% 1 vs 7 + 9.3% 1 vs 8 + 3.0% 2 vs 7 + 43.8% 2 vs 8 | low |
| 1 vs 9 | 23.6% 1 vs 2 + 1.7% 1 vs 7 + 2.3% 1 vs 8 + 27.6% 2 vs 5 + 1.7% 2 vs 7 + | high |
| 1 vs 10 | 39.8% 1 vs 2 + 2.9% 1 vs 7 + 3.9% 1 vs 8 + 2.9% 2 vs 7 + 3.9% 2 vs 8 + 46.9% 2 vs 10 | low |
| Whole network | 8.7% 1 vs 2 + 2.1% 1 vs 7 + 1.6% 1 vs 8 + 14.9% 2 vs 4 + 19.6% 2 vs 5 + | high |
| Key to interventions: 1 = basic dressing; 2 = advanced dressing; 3 = advanced +/‐ antimicrobial dressing; Risk of bias for direct contrasts: Low ‐ 1 vs 7; 1 vs 8; 2 vs 7; 2 vs 8; 2 vs 10; 5 vs 6; 5 vs 9; 6 vs 9. | ||
| Common heterogeneity estimate within each loop | Common heterogeneity estimate for network: tau² (network) = 0.0435 | ||||
| Loop | Ratio of RR (90% CI) | P value | Loop heterogeneity tau² (loop) | Ratio of RR (90% CI) | P value |
| Saline gauze ‐ hydrogel ‐ phenytoin | 3.90 (1.19 to 12.77) | 0.059 | 0.000 | 3.75 (90%CI 1.14 to 12.29) | 0.067 |
| Saline gauze ‐ foam ‐ hydrogel | 1.64 (0.27 to 9.99) | 0.651 | 0.512 | 1.21 (90%CI 0.56 to 2.63) | 0.682 |
| Hydrocolloid ‐ hydrogel ‐ iodine containing dressing | 1.26 (0.44 to 3.61) | 0.721 | 0.084 | 1.28 (90%CI 0.59 to 2.75) | 0.602 |
| Foam ‐ hydrocolloid ‐ protease‐modulating | 1.25 (0.66 to 2.35) | 0.562 | 0 | 1.24 (90%CI 0.66 to 2.35) | 0.572 |
| Foam ‐ hydrocolloid ‐ hydrogel | 1.13 (0.7 to 1.83) | 0.675 | 0.016 | 1.16 (90%CI 0.77 to 1.75) | 0.548 |
| Saline gauze ‐ foam ‐ hydrocolloid | 1.04 (0.45 to 2.41) | 0.936 | 0.084 | 1.04 (90%CI 0.55 to 1.96) | 0.919 |
| Saline gauze ‐ hydrocolloid ‐ hydrogel | 1.01 (0.33 to 3.11) | 0.993 | 0.244 | 1.09 (90%CI 0.62 to 1.89) | 0.808 |
| Contrast | Direct evidence RR (95% CI) | Indirect evidence RR (95% CI) | RR direct/RR indirect (90% CI) | P value | tau² |
| Foam versus saline gauze | 1.52 (0.73 to 3.16) | 1.54 (0.95 to 2.49) | 0.99 (90% CI 0.47 to 2.05) | 0.973 | 0.22 |
| Hydrocolloid versus saline gauze | 1.41 (0.88 to 2.26) | 1.49 (0.87 to 2.56) | 0.95 (90% CI 0.53 to 1.69) | 0.876 | 0.22 |
| Hydrogel versus saline gauze | 1.67 (0.86 to 3.22) | 1.52 (0.91 to 2.54) | 1.10 (90% CI 0.57 to 2.12) | 0.820 | 0.22 |
| Phenytoin versus saline gauze | 3.01 (0.93 to 9.71) | 0.29 (0.05 to 1.51) | 10.06 (90% CI 1.35 to 75.13) | 0.059 | 0.15 |
| Hydrocolloid versus foam | 0.95 (0.68 to 1.32) | 0.91 (0.57 to 1.44) | 1.04 (90% CI 0.65 to 1.68) | 0.881 | 0.23 |
| Hydrogel versus foam | 0.90 (0.51 to 1.58) | 1.10 (0.72 to 1.68) | 0.81 (90% CI 0.45 to 1.47) | 0.568 | 0.23 |
| Protease‐modulating dressing versus foam | 1.22 (0.61 to 2.41) | 0.94 (0.46 to 1.92) | 1.29 (90% CI 0.56 to 2.94) | 0.614 | 0.22 |
| Hydrogel versus hydrocolloid | 1.10 (0.76 to 1.59) | 1.07 (0.68 to 1.68) | 1.02 (90% CI 0.63 to 1.67) | 0.935 | 0.24 |
| Iodine‐containing dressing versus hydrocolloid | 0.90 (0.36 to 2.19) | 0.68 (0.35 to 1.33) | 1.31 (90% CI 0.51 to 3.32) | 0.638 | 0.22 |
| Protease‐modulating dressing versus hydrocolloid | 1.02 (0.53 to 1.97) | 1.32 (0.63 to 2.76) | 0.78 (90% CI 0.34 to 1.77) | 0.614 | 0.22 |
| Iodine‐containing dressing versus hydrogel | 0.64 (0.35 to 1.16) | 0.84 (0.32 to 2.15) | 0.77 (90% CI 0.30 to 1.95) | 0.639 | 0.22 |
| Phenytoin versus hydrogel | 0.71 (0.38 to 1.34) | 7.18 (0.68 to 75.47) | 0.10 (90% CI 0.01 to 0.74) | 0.059 | 0.15 |
| Contrast | Design 1 | NMA results for design 1 | Design 2 | (NMA results for design 2 | NMA results |
| Foam versus saline gauze | 7 vs 1 (3 studies) | 1.53 (0.71 to 2.22) | NA | NA | 1.52 (1.03 to 1.85) |
| Hydrocolloid versus saline gauze | 8 vs 1 (4 studies) | 1.50 (0.9 to 1.92) | NA | NA | 1.43 (1.00 to 1.70) |
| Hydrogel versus saline gauze | 10 vs 1 (2 studies; heterogeneity) | 1.16 (0.51 to 1.73) | 10 vs 1 vs 14 (one 3‐arm study) | 4.22 (1.26 to 7.65) | 1.55 (1.02 to 1.91) |
| Phenytoin versus saline gauze | NA | NA | 14 vs 1 vs 10 | 3.02 (0.86 to 5.56) | 1.28 (0.58 to 1.88) |
| Hydrocolloid versus collagenase | 8 vs 5 (2 studies) | 0.68 (0.35 to 0.95) | NA | NA | 0.68 (0.37 to 0.91) |
| Hydrocolloid versus foam | 8 vs 7 (6 studies) | 0.96 (0.67 to 1.13) | NA | NA | 0.94 (0.73 to 1.07) |
| Hydrogel versus foam | 10 vs 7 (1 study) | 0.90 (0.48 to 1.22) | NA | NA | 1.02 (0.74 to 1.2) |
| Protease‐modulating versus foam | 15 vs 7 (1 study) | 1.22 (0.58 to 1.76) | NA | NA | 1.08 (0.67 to 1.36) |
| Hydrogel versus hydrocolloid | 10 vs 8 (4 studies) | 1.11 (0.74 to 1.35) | NA | NA | 1.09 (0.83 to 1.24) |
| Iodine‐containing dressing versus hydrocolloid | 13 vs 8 (1 study) | 0.90 (0.35 to 1.43) | NA | NA | 0.76 (0.45 to 0.97) |
| Protease‐modulating versus hydrocolloid | 15 vs 8 (1 study) | 1.03 (0.5 to 1.46) | NA | NA | 1.15 (0.72 to 1.45) |
| Iodine‐containing dressing versus hydrogel | 13 vs 10 (1 study) | 0.64 (0.33 to 0.9) | NA | NA | 0.70 (0.43 to 0.88) |
| Phenytoin versus hydrogel | NA | NA | 14 vs 10 vs 1 | 0.71 (0.33 to 1.04) | 0.82 (0.42 to 1.14) |
| Loop | Ratio of RR (90% CI) | P value | Loop heterogeneity ‐ tau² |
| Basic dressing ‐ advanced dressing ‐ phenytoin | 3.04 (0.71 to 13.06) | 0.210 | 0.085 |
| Basic dressing ‐ advanced dressing ‐ protease‐modulating dressing | 1.36 (0.39 to 4.73) | 0.682 | 0.091 |
| Contrast | Direct evidence RR (95% CI) | Indirect evidence RR (95% CI) | RR direct/RR indirect (90% CI) | P value | Tau² |
| Advanced dressing versus basic dressing | 1.41 (0.96 to 2.09) | 1.10 (0.33 to 3.73) | 1.28 (90% CI 0.44 to 3.76) | 0.705 | 0.221791 |
| Phenytoin versus basic dressing | 3.02 (0.97 to 9.38) | 0.24 (0.06 to 1.02) | 12.51 (90% CI 1.87 to 83.55) | 0.029 | 0.048414 |
| Protease‐modulating dressing versus basic dressing | 1.25 (0.4 to 3.87) | 1.60 (0.87 to 2.95) | 0.78 (90% CI 0.27 to 2.3) | 0.707 | 0.221734 |
| Phenytoin versus advanced dressing | 0.71 (0.41 to 1.25) | 8.94 (0.96 to 83.43) | 0.08 (90% CI 0.01 to 0.53) | 0.029 | 0.048424 |
| Protease‐modulating dressing versus advanced dressing | 1.13 (0.71 to 1.79) | 0.88 (0.27 to 2.92) | 1.28 (90% CI 0.44 to 3.76) | 0.706 | 0.221781 |
| Contrast | Design 1 | NMA results for design 1 | Design 2 | NMA results for design 2 | NMA results |
| Advanced dressing versus basic dressing | 2 vs 1 (10 studies; heterogeneity) | 1.21 (0.88 to 1.67) | 2 vs 1 vs 7 (1 study) | 4.22 (1.41 to 12.68) | 1.36 (0.95 to 1.93) |
| Phenytoin versus basic dressing | NA | NA | 7 vs 1 vs 2 (1 study) | 3.02 (0.96 to 9.44) | 1.12 (0.52 to 2.44) |
| Protease‐modulating dressing versus basic dressing | 8 vs 1 (1 study) | 1.25 (0.44 to 3.59) | NA | NA | 1.49 (0.91 to 2.46) |
| Phenytoin versus advanced dressing | NA | NA | 7 vs 2 vs 1 (1 study) | 0.71 (0.4 to 1.27) | 0.83 (0.43 to 1.59) |
| Protease‐modulating dressing versus advanced dressing | 8 vs 2 (3 studies) | 1.12 (0.78 to 1.62) | NA | NA | 1.10 (0.74 to 1.64) |
| Intervention | Mean rank | SUCRA | Probability | Rank at maximum |
| Saline gauze | 16.3 | 0.2 | 16.2 | 17 |
| Alginate dressing | 12.4 | 0.4 | 10.8 | 19 |
| Sequential hydrocolloid alginate dressings | 18.6 | 0.1 | 34.6 | 21 |
| Basic wound contact dressing | 12.4 | 0.4 | 11.6 | 15 |
| Collagenase ointment | 6.9 | 0.7 | 13.5 | 6 |
| Dextranomer | 3.5 | 0.9 | 40.8 | 1 |
| Foam dressing | 10.3 | 0.5 | 15.0 | 10 |
| Hydrocolloid dressing | 11.6 | 0.5 | 18.6 | 11 |
| Hydrocolloid with/without alginate filler | 11.9 | 0.5 | 12.4 | 21 |
| Hydrogel | 9.9 | 0.6 | 14.9 | 10 |
| Ineligible intervention ‐ radiant heat | 11.4 | 0.5 | 12.8 | 20 |
| Ineligible intervention ‐ skin substitute | 6.6 | 0.7 | 15.0 | 4 |
| Iodine‐containing dressing | 15.3 | 0.3 | 13.4 | 17 |
| Phenytoin | 12.6 | 0.4 | 9.4 | 16 |
| Protease‐modulating dressing | 9.3 | 0.6 | 11.8 | 8 |
| PVP + zinc oxide | 11.8 | 0.5 | 8.1 | 20 |
| Silicone + foam dressing | 8.9 | 0.6 | 10.0 | 2 |
| Soft polymer dressing | 11.9 | 0.5 | 7.7 | 16 |
| Sugar + egg white | 14.4 | 0.3 | 31.8 | 21 |
| Tripeptide copper gel | 3.7 | 0.9 | 25.3 | 1 |
| Vapour‐permeable dressing | 11.4 | 0.5 | 8.9 | 13 |
| Contrast | Study | Risk ratio (95% CI) | Hazard ratio (95% CI) | Median times to healing |
| Hydrocolloid versus saline gauze | (6 weeks) | 3.43 (1.32 to 8.89) | 1.88 (0.80 to 4.45) | |
| Xakellis 1992 | 1.04 (0.82 to 1.32) | 1.67 (0.81 to 3.45) | 9 days versus 11 days | |
| Meta‐analysis of 2 studies in 95 participants (Alm 1989; Xakellis 1992) ‐ selected | Meta‐analysis: 1.72 (0.54 to 5.47) I² = 82%, P = 0.02 | Meta‐analysis: 1.75 (95% CI 1.00 to 3.05 I² = 0%, P = 0.84 | ||
| Hydrogel versus hydrocolloid | Brod 1990 (8 weeks) | 1.11 (0.74 to 1.67) | 1.30 (0.54 to 3.13) | 32 days versus 42 days (P = 0.56); Kaplan‐Meier curves crossing |
| Protease‐modulating dressing versus hydrocolloid | Graumlich 2003 (8 weeks) | 1.03 (0.64 to 1.66) | 1.34 (0.67 to 2.65) | 4 weeks and 7 weeks (estimated from Kaplan‐Meier plot); protease‐modulating dressing had more healing from 5 weeks |
| Collagenase ointment versus hydrocolloid | Muller 2001 (16 weeks ‐ probably) | 1.57 (0.95 to 2.61) | 2.58 (1.00 to 6.65) | |
| Hydrocolloid +/‐ alginate versus ineligible: radiant heat | Thomas 2005 (12 weeks) | 0.92 (0.41 to 2.06) | 0.64 (0.23 to 1.77) | > 90 days and 70 days (estimated from Kaplan‐Meier plot); radiant heat had consistently more healing at all time points |
| Foam versus saline gauze | Payne 2009 (4 weeks) | 1.33 (0.62 to 2.88) | 1.12 (0.42 to 3.01) |
| Risk ratio (95% CI) intervention versus saline gauze | Mean rank (of 21 interventions unless otherwise stated) | |||||
| Intervention | Original | Sensitivity analysis 1. Very high risk of bias | Sensitivity analysis 2. Complete case | Original saline 16.3 | Sensitivity analysis 1. Very high risk of bias | Sensitivity analysis 2. Complete case saline = 16.3 |
| Alginate dressing | 1.10 (0.11 to 10.57) | 1.14 (0.11 to 11.45) | 1.08 (0.11 to 10.69) | 12.4 | 11 | 12.6 |
| Sequential hydrocolloid | s0.50 (0.12 to 1.99) | 0.52 (0.12 to 2.20) | 0.51 (0.12 to 2.1) | 18.6 | 15.8 | 18.5 |
| Basic wound contact dressing | 1.30 (0.65 to 2.59) | 1.33 (0.61 to 2.93) | 1.44 (0.76 to 2.73) | 12.4 | 10.6 | 11.1 |
| Collagenase ointment | 2.11 (1.06 to 4.21) | 2.35 (1.02 to 5.44) | 2.01 (0.98 to 4.12) | 6.9 | 5.2 | 7.4 |
| Dextranomer | 4.75 (0.86 to 26.34) | 5.29 (0.87 to 32.26) | 4.51 (0.79 to 25.88) | 3.5 | 2.9 | 3.8 |
| Foam dressing | 1.52 (1.03 to 2.26) | 1.56 (1 to 2.43) | 1.45 (0.97 to 2.15) | 10.3 | 9 | 11.2 |
| Hydrocolloid dressing | 1.43 (1 to 2.05) | 1.50 (0.99 to 2.26) | 1.47 (1.02 to 2.12) | 11.6 | 9.7 | 11.1 |
| Hydrocolloid with/without | 1.23 (0.06 to 24.86) | not in network | 1.33 (0.06 to 27.37) | 11.9 | not in network | 11.5 |
| Hydrogel dressing | 1.55 (1.02 to 2.36) | 1.74 (1.09 to 2.77) | 1.56 (1.02 to 2.37) | 9.9 | 7.5 | 9.8 |
| Ineligible: radiant heat | 1.34 (0.08 to 23.53) | 1.39 (0.07 to 25.76) | 1.62 (0.09 to 29.28) | 11.4 | not in network | 10.2 |
| Ineligible: skin substitute | 2.12 (1.05 to 4.28) | not in network | 1.92 (0.91 to 4.02) | 6.6 | 9.8 | 7.6 |
| Iodine‐containing dressing | 1.08 (0.58 to 2.02) | 1.19 (0.6 to 2.38) | 1.13 (0.58 to 2.18) | 15.3 | 12.1 | 14.7 |
| Phenytoin | 1.28 (0.58 to 2.81) | 1.66 (0.71 to 3.89) | 1.3 (0.57 to 2.96) | 12.6 | 8.6 | 12.4 |
| Protease‐modulating dressing | 1.64 (0.92 to 2.93) | 1.71 (0.89 to 3.26) | 1.63 (0.89 to 2.97) | 9.3 | 7.9 | 9.4 |
| PVP + ZnO | 1.32 (0.37 to 4.64) | 1.37 (0.36 to 5.19) | 1.30 (0.35 to 4.78) | 11.8 | 10.2 | 11.9 |
| Combined silicone foam dressing | 1.93 (0.37 to 9.92) | not in network | 1.74 (0.33 to 9.32) | 8.9 | not in network | 9.7 |
| Soft polymer dressing | 1.35 (0.56 to 3.27) | 1.39 (0.53 to 3.63) | 1.29 (0.52 to 3.23) | 11.9 | 10.2 | 12.3 |
| Sugar + egg white | 0.70 (0.03 to 15.6) | 0.78 (0.03 to 18.33) | 0.67 (0.03 to 15.11) | 14.4 | 12 | 14.6 |
| Tripeptide copper gel | 3.88 (1.03 to 14.56) | 2.78 (0.90 to 8.58) | 3.89 (1.01 to 15) | 3.7 | 4.8 | 3.8 |
| Vapour‐permeable dressing | 1.44 (0.74 to 2.8) | 1.51 (0.70 to 3.25) | 1.48 (0.72 to 3.04) | 11.4 | 9.5 | 11 |
| Outcome or subgroup title | No. of studies | No. of participants | Statistical method | Effect size |
| 1 Interventions vs saline gauze Show forest plot | 10 | Risk Ratio (IV, Random, 95% CI) | Subtotals only | |
| 1.1 Hydrocolloid vs saline gauze | 4 | 279 | Risk Ratio (IV, Random, 95% CI) | 1.89 [0.91, 3.93] |
| 1.2 Hydrogel vs saline gauze | 3 | 110 | Risk Ratio (IV, Random, 95% CI) | 2.44 [0.64, 9.27] |
| 1.3 Foam vs saline gauze | 3 | 93 | Risk Ratio (IV, Random, 95% CI) | 1.51 [0.78, 2.90] |
| 2 Interventions vs hydrocolloid Show forest plot | 13 | Risk Ratio (IV, Random, 95% CI) | Subtotals only | |
| 2.1 Hydrogel vs hydrocolloid | 4 | 322 | Risk Ratio (IV, Random, 95% CI) | 1.11 [0.74, 1.67] |
| 2.2 Foam vs hydrocolloid | 6 | 292 | Risk Ratio (IV, Random, 95% CI) | 1.05 [0.81, 1.36] |
| 2.3 Collagenase ointment vs hydrocolloid | 2 | 61 | Risk Ratio (IV, Random, 95% CI) | 1.51 [0.93, 2.43] |
| 2.4 Protease‐modulating dressing vs hydrocolloid | 1 | 65 | Risk Ratio (IV, Random, 95% CI) | 1.03 [0.64, 1.66] |
| Outcome or subgroup title | No. of studies | No. of participants | Statistical method | Effect size |
| 1 Intervention 1 vs intervention 2 Show forest plot | 18 | Risk Ratio (IV, Random, 95% CI) | Subtotals only | |
| 1.1 Advanced dressing vs basic dressing | 11 | 532 | Risk Ratio (IV, Random, 95% CI) | 1.55 [1.10, 2.19] |
| 1.2 Antimicrobial dressing vs advanced dressing | 2 | 125 | Risk Ratio (IV, Random, 95% CI) | 0.69 [0.48, 0.99] |
| 1.3 Collagenase ointment vs advanced dressing | 2 | 61 | Risk Ratio (IV, Random, 95% CI) | 1.51 [0.93, 2.43] |
| 1.4 Protease‐modulating dressing vs advanced dressing | 3 | 112 | Risk Ratio (IV, Random, 95% CI) | 1.13 [0.80, 1.60] |
| Outcome or subgroup title | No. of studies | No. of participants | Statistical method | Effect size |
| 1 Time‐to‐healing (survival analysis) Show forest plot | 7 | Hazard Ratio (Fixed, 95% CI) | Subtotals only | |
| 1.1 Hydrocolloid versus saline gauze | 2 | 95 | Hazard Ratio (Fixed, 95% CI) | 1.75 [1.00, 3.05] |
| 1.2 Hydrogel versus hydrocolloid | 1 | 43 | Hazard Ratio (Fixed, 95% CI) | 1.30 [0.54, 3.13] |
| 1.3 Protease‐modulating versus hydrocolloid | 1 | 65 | Hazard Ratio (Fixed, 95% CI) | 1.34 [0.67, 2.65] |
| 1.4 Collagenase ointment versus hydrocolloid | 1 | 24 | Hazard Ratio (Fixed, 95% CI) | 2.59 [1.01, 6.62] |
| 1.5 Foam versus saline gauze | 1 | 36 | Hazard Ratio (Fixed, 95% CI) | 1.13 [0.42, 3.00] |
| 1.6 Hydrocolloid +/‐ alginate versus ineligible: radiant heat | 1 | 41 | Hazard Ratio (Fixed, 95% CI) | 0.64 [0.23, 1.77] |
| Outcome or subgroup title | No. of studies | No. of participants | Statistical method | Effect size |
| 1 Time‐to‐healing (survival analysis) Show forest plot | 5 | Hazard Ratio (Fixed, 95% CI) | Subtotals only | |
| 1.1 Advanced dressing versus basic dressing | 3 | Hazard Ratio (Fixed, 95% CI) | 1.57 [0.97, 2.55] | |
| 1.2 Protease‐modulating dressing versus advanced dressing | 1 | Hazard Ratio (Fixed, 95% CI) | 1.34 [0.67, 2.65] | |
| 1.3 Advanced dressings versus collagenase ointment | 1 | Hazard Ratio (Fixed, 95% CI) | 0.27 [0.11, 0.67] | |
| Outcome or subgroup title | No. of studies | No. of participants | Statistical method | Effect size |
| 1 Intervention 1 vs intervention 2 Show forest plot | 4 | Risk Ratio (IV, Random, 95% CI) | Totals not selected | |
| 1.1 Sugar + povidone iodine vs lysosyme | 1 | Risk Ratio (IV, Random, 95% CI) | 0.0 [0.0, 0.0] | |
| 1.2 Enamel matrix protein vs propylene glycol alginate | 1 | Risk Ratio (IV, Random, 95% CI) | 0.0 [0.0, 0.0] | |
| 1.3 Honey vs ethoxy‐diaminoacridine +nitrofurazone dressings | 1 | Risk Ratio (IV, Random, 95% CI) | 0.0 [0.0, 0.0] | |
| 1.4 Resin salve vs hydrocolloid or hydrocolloid silver dressing | 1 | Risk Ratio (IV, Random, 95% CI) | 0.0 [0.0, 0.0] | |