Les pansements et les agents topiques pour le traitement des escarres
Appendices
Appendix 1. Pressure ulcer grading
One of the most widely recognised systems for categorising pressure ulcers is that of the National Pressure Ulcer Advisory Panel (NPUAP). Their international classification recognises four categories or stages of pressure ulcer and two categories of unclassifiable pressure injury, in which wound depth and/or extent, or both, cannot be accurately determined; unclassifiable pressure ulcers are generally severe and would be grouped clinically with Stage 3 or Stage 4 ulcers (EPUAP‐NPUAP‐PPPIA 2014; NPUAP 2016):
-
Category/Stage 1: Non‐blanchable erythema of intact skin: Intact skin with a localized area of non‐blanchable erythema, which may appear differently in darkly pigmented skin. Presence of blanchable erythema or changes in sensation, temperature, or firmness may precede visual changes. Color changes do not include purple or maroon discoloration; these may indicate deep tissue pressure injury.
-
Category/Stage 2: Partial‐thickness skin loss with exposed dermis: Partial‐thickness loss of skin with exposed dermis. The wound bed is viable, pink or red, moist, and may also present as an intact or ruptured serum‐filled blister. Adipose (fat) is not visible and deeper tissues are not visible. Granulation tissue, slough and eschar are not present. These injuries commonly result from adverse microclimate and shear in the skin over the pelvis and shear in the heel. This stage should not be used to describe moisture associated skin damage (MASD) including incontinence associated dermatitis (IAD), intertriginous dermatitis (ITD), medical adhesive related skin injury (MARSI), or traumatic wounds (skin tears, burns, abrasions).
-
Category/Stage 3: Full‐thickness skin loss: Full‐thickness loss of skin, in which adipose (fat) is visible in the ulcer and granulation tissue and epibole (rolled wound edges) are often present. Slough and/or eschar may be visible. The depth of tissue damage varies by anatomical location; areas of significant adiposity can develop deep wounds. Undermining and tunneling may occur. Fascia, muscle, tendon, ligament, cartilage and/or bone are not exposed. If slough or eschar obscures the extent of tissue loss this is an Unstageable Pressure Injury.
-
Category/Stage 4: Full‐thickness skin and tissue loss: Full‐thickness skin and tissue loss with exposed or directly palpable fascia, muscle, tendon, ligament, cartilage or bone in the ulcer. Slough and/or eschar may be visible. Epibole (rolled edges), undermining and/or tunneling often occur. Depth varies by anatomical location. If slough or eschar obscures the extent of tissue loss this is an Unstageable Pressure Injury.
The two additional categories of unclassifiable wounds are:
-
Unstageable/unclassified ‐ Obscured full‐thickness skin and tissue loss: Full‐thickness skin and tissue loss in which the extent of tissue damage within the ulcer cannot be confirmed because it is obscured by slough or eschar. If slough or eschar is removed, a Stage 3 or Stage 4 pressure injury will be revealed. Stable eschar (i.e. dry, adherent, intact without erythema or fluctuance) on the heel or ischemic limb should not be softened or removed.
-
Deep Tissue Pressure Injury ‐ Persistent non‐blanchable deep red, maroon or purple discoloration: Intact or non‐intact skin with localized area of persistent non‐blanchable deep red, maroon, purple discoloration or epidermal separation revealing a dark wound bed or blood filled blister. Pain and temperature change often precede skin color changes. Discoloration may appear differently in darkly pigmented skin. This injury results from intense and/or prolonged pressure and shear forces at the bone‐muscle interface. The wound may evolve rapidly to reveal the actual extent of tissue injury, or may resolve without tissue loss. If necrotic tissue, subcutaneous tissue, granulation tissue, fascia, muscle or other underlying structures are visible, this indicates a full thickness pressure injury (Unstageable, Stage 3 or Stage 4). Do not use DTPI to describe vascular, traumatic, neuropathic, or dermatologic conditions.
Photographs of the different PU stages are included in the US Agency for Healthcare Research and Quality guideline (AHRQ 2013).
Appendix 2. Glossary of NMA terms
Arm‐specific outcomes/arm‐level data: raw outcome data (e.g. mean (SD) or risk) for each arm of the trial (see treatment contrast).
Assumptions for NMA: in common with all meta‐analysis, the true treatment effect across trials is assumed to be described by a fixed‐effect or random‐effects model. Additionally, transitivity is assumed and, concurrently, exchangeability and consistency.
Baseline risk: the absolute risk of the outcome in the 'control' group. This is affected by the presence of prognostic factors. Some authors have used the baseline risk as a proxy effect modifier, but in general the effect estimate (RR/OR/HR) is independent of the baseline risk; on the other hand, the absolute risk difference depends on baseline risk.
Bayesian approach: the explicit quantitative use of external evidence in the design, monitoring, analysis, interpretation of a health‐care evaluation. In the Bayesian paradigm, prior beliefs about parameters in the models are specified and factored into the estimation. Posterior distributions of model parameters are then derived from the prior information and the observed data. In NMA, it is common to use non‐informative priors for effect estimates.
Coherence/consistency: the direct effect estimate (e.g. mean difference or log odds ratio) is the same as the sum of the indirect effect estimates.
Connected network: a group of linked interventions, such that every trial in the network has at least one intervention in common with at least one other trial. Sometimes individual comparisons are not connected to the rest of the network (disconnected network) and can sometimes be joined in by extending the network to include supplementary interventions.
Contour‐enhanced funnel plot: contour‐enhanced funnel plots show areas of statistical significance, and they can help in distinguishing publication bias from other possible reasons for asymmetry. In a network of interventions, each study estimates the relative effect of different interventions, so asymmetry in the funnel plot cannot be judged. To account for this, an adaptation of the funnel plot can be used, in which the standard error is plotted against an adjusted effect size for each study: the adjusted effect size for a comparison is the study‐specific effect size minus the mean for the meta‐analysis for that comparison.
Contrast/comparison/study‐level data: outcome data for the comparison (e.g. mean difference, odds ratio).
Credible interval (CrI): the 95% credible interval is the range within which the mean value lies with posterior probability of 95%.
Decision space/decision set: the interventions in the decision set are the focal treatments of interest to systematic review authors.
Direct evidence/direct comparison/direct contrast: head‐to‐head comparison of two treatments, for example, A versus B (see indirect evidence).
Edge: line representing a direct contrast on a network diagram.
Effect modifier: effect modification occurs when the effect of A versus B (as the RR/OR/HR for binary outcomes) is significantly different in two or more subgroups, and this leads to heterogeneity, either within trials or between trials, or both. Factors that give rise to subgroup effects are called effect modifiers, and it is important to identify potential effect modifiers and allow for them in the analysis. The identification of significant effect modifiers may lead to stratification (separate analyses for each subgroup) or to a decision not to combine data from different trials in a meta‐analysis. In general, trials have different distributions of effect modifiers (e.g. proportion of people with and without diabetes), leading to inconsistency between trials in the treatment effect. This is often magnified when there is a network of different contrasts.
Exchangeability: it is assumed that treatments in a NMA are exchangeable, so, if treatment B had been given to participants in the indirect A versus C trials and if A had been given in the B versus C indirect trials, then the true AB differences in these indirect studies would be identical to the true AB difference in direct A versus B trials, or at least from the same common distribution. Furthermore, if participants in other trials within the wider linked network (e.g. D versus E trials) were given A and B, the AB differences would also be the same or from the same distribution. This assumption breaks down when there are effect modifiers.
Fixed‐effect: the true treatment effect is assumed to be constant across trials (fixed‐effect) ‐ see also random‐effects and transitivity.
Global inconsistency: inconsistency across a network is described as global inconsistency. It can be evaluated statistically by fitting models that allow and do not allow for inconsistency. See also: Inconsistency/incoherence:
Heterogeneity in a NMA: participants are not randomised to different trials. Therefore, there may be systematic differences in study characteristics or the distribution of participant characteristics across trials. If these characteristics influence the treatment effects (i.e. are effect modifiers), then there are systematic differences in treatment effects across trials, which is called between‐trial heterogeneity. There may also be within‐trial heterogeneity if there are subgroups of an effect modifier for which results are reported separately. In a NMA, the term, 'heterogeneity' applies to variation in effect modifiers within a single contrast (e.g. A versus B); the term, 'inconsistency' refers to the imbalance in effect modifiers between contrasts.
Heterogeneity variance parameter (tau²): in a random‐effects model we assume there is heterogeneity for each pairwise comparison (e.g. A versus B) with variance (tau²AB), but in a NMA we often assume that there is a common heterogeneity amongst all the contrasts in the network; this common heterogeneity has a variance (tau²), which is called the 'heterogeneity variance parameter'. It can be compared with empirical distributions of heterogeneity values typically found in meta‐analyses (Salanti 2014; Turner 2012).
Inconsistency/incoherence: this occurs when the effect estimate derived from an indirect contrast is not the same as the effect estimate derived from a direct contrast. For example, in a network of three interventions, there is inconsistency if dAB(direct) ǂ dAB(indirect), where dAB(indirect) = dAC(direct) ‐ dBC(direct); the effect estimates are given as mean differences or log(odds ratios/risk ratios/hazard ratios). Note that in order to investigate inconsistency there must be both indirect and direct evidence (loops in the network). See also global inconsistency.
Inconsistency factor: this is the absolute difference between the direct and indirect estimates on the log scale (or the logarithm of the ratio of the two odds/hazard ratios) for one of the contrasts in a loop. A statistically low powered z‐test and a 90% or 95% confidence interval (CI) of the inconsistency is computed to determine whether this difference is significant.
Indirect evidence/indirect comparison/indirect contrast: comparison of two treatments, for example, A versus B, obtained from combinations of other comparisons (e.g. trials comparing A versus C and trials comparing B with C) (see direct evidence).
Indirect comparison meta‐analysis: meta‐analysis of a set of treatments that are linked via common comparator(s), but none are compared directly; evidence is combined in a single internally consistent model.
Leverage: this is the effective number of parameters of the model, which is calculated differently for fixed‐effect and random‐effects models, with the latter having greater complexity.
Likelihood (function): the likelihood function is a tool for inferring the underlying distribution of the observed data. To do this, we propose a model to represent the data ‐ often a parametric distribution is assumed (e.g. binomial) ‐ and unknown parameters of that distribution are determined, given the data, by maximising the likelihood (the larger the likelihood, the closer the model fit).
Loop (of evidence): combination of direct and indirect evidence, such that the interventions in the network diagram can be linked to form a closed loop.
Meta‐analysis: a statistical synthesis of the results from two or more separate studies. Methods involve calculating a weighted average of effect estimates from the separate studies.
Mixed treatment comparison meta‐analysis: another name for network meta‐analysis.
Model: a statistical model is a (simplified) mathematical representation of the system we wish to learn about, and which generates our observed data. The model will usually depend on some known factors, such as other variables measured alongside the data, and some unknown parameters that we wish to determine. Then having determined the unknown parameters, the model should be able to simulate data that are an approximation of the real data, allowing us to make inferences from the data.
Multi‐arm trial: individual trial that compares more than two interventions.
Network: trials must be linked in a network of interventions, such that every trial in the network has at least one intervention in common with at least one other trial.
Network diagram: graphical representation of the interventions in the network. It consists of nodes representing the interventions and edges representing the contrasts. The amount of available information can be presented by 'weighting' the nodes and edges using different node sizes and line thicknesses according to the number of studies reporting that treatment or contrast respectively. Other types of weighting are discussed in Chaimani 2013b.
Network meta‐analysis (NMA): NMA is the simultaneous combination of data from randomised comparisons of multiple competing treatments (A versus B, A versus C, A versus D, B versus D, and so on), to deliver an internally consistent set of estimates while respecting the randomisation in the evidence. The use of indirect estimates can provide information on contrasts for which no trials exist. It can also improve the precision of the direct estimate by reducing the width of the CIs compared with the direct evidence alone.
Node: intervention represented on a network diagram, usually by a circle of weighted size.
Node splitting: a method of assessing inconsistency. A 'leave‐one comparison‐out' approach, often called 'node splitting,' is applied, with each direct contrast being excluded from the network and then estimating the difference between this direct evidence and the indirect evidence from the network.
Pairwise meta‐analysis: meta‐analysis of one or more trials of direct comparisons (e.g. A versus B) ‐ see direct evidence.
Prognostic factors: population or study characteristics that affect the risk of the outcome. In a sufficiently large randomised trial that is free from bias, prognostic factors are distributed evenly between intervention groups and do not affect the effect estimate (RR/OR/HR for binary outcomes) unless they are effect modifiers, but they do affect the baseline risk and absolute risk difference.
Random‐effects: trial‐specific treatment differences are assumed to be from a common distribution ‐ see also fixed‐effect and transitivity.
Ranking: ordering of treatments according to their relative effectiveness.
Rankogram: graph of probability versus rank order for a particular treatment. Rankograms are based on the uncertainty in the effect estimates. So if two treatments A and B are each compared with the reference intervention and the CIs for the effect overlap, then each treatment will have some probability of being the most effective. If there is no overlap and A is better than B, then the probability of A being the best will be 1.
Sparse data: data with wide CIs because of few events as a consequence of small studies or short follow‐up periods.
Study‐level data: see contrast.
SUCRA: Surface Under the Cumulative RAnking. This is a measure of the probability that the given treatment is the best. Thus, a SUCRA would be 1 (or 100%) when a treatment was certain to be the best and 0 (0%) when a treatment was certain to be the worst.
Supplementary set (of interventions): interventions added to the network to provide additional evidence on relative treatment effects of the decision set. This may be to connect an otherwise unconnected network of treatments, to increase the precision of the treatment effect estimates or to help address between‐trial heterogeneity.
Transitivity: NMA requires a transitivity assumption, such that there is no imbalance in the distribution of effect modifiers across the different types of treatment contrasts (see also exchangeability).
'Unadjusted' meta‐analysis: meta‐analysis of all the treatment arms for a particular treatment (e.g. all A arms). This breaks the randomisation and should not be done.
References include: Caldwell 2005; Caldwell 2014; Chaimani 2013a; Chaimani 2013b; Cipriani 2013; Dias 2013; Dias 2016; Grant 2013; Jansen 2013; Lu 2004; Salanti 2008; Salanti 2011; Salanti 2014; Soares 2014; Thorlund 2012; Tu 2012; White 2012.
Appendix 3. Search strategies
The Cochrane Central Register of Controlled Trials (CENTRAL)
#1MeSH descriptor: [Bandages] explode all trees
#2MeSH descriptor: [Alginates] explode all trees
#3MeSH descriptor: [Hydrogels] explode all trees
#4MeSH descriptor: [Honey] explode all trees
#5MeSH descriptor: [Silver] explode all trees
#6MeSH descriptor: [Silver Sulfadiazine] explode all trees
#7MeSH descriptor: [Charcoal] explode all trees
#8MeSH descriptor: [Silicones] explode all trees
#9(dressing* or pad or pads or gauze or tulle or film or bead or foam* or non‐adherent or "non adherent" or hydrocolloid* or "sodium hyaluronate" or alginat* or hydrogel* or silver* or honey* or matrix or iodine* or "protease modulat*" or "capillary action" or charcoal or silicon* or polymer*):ti,ab,kw
#10((odour or odor) near/3 absorb*):ti,ab,kw
#11(primapore or curasorb or seasorb or sorbsan or advadraw or vacutex or tegaderm or opsite or allevyn or biatain or medihoney or activon tulle or granuflex or "nu derm" or aquacel or iodoflex or iodozyme or xeroform or carboflex or cutimed sorbact or promogran or acticoat or "urgosorb silver" or mepitel or urgotul):ti,ab,kw
#12{or #1‐#11}
#13MeSH descriptor: [Metronidazole] explode all trees
#14metronidazole:ti,ab,kw
#15MeSH descriptor: [Anti‐Bacterial Agents] explode all trees
#16MeSH descriptor: [Administration, Topical] explode all trees
#17{and #15‐#16}
#18(topical near/2 (antibiotic* or antimicrobial* or antibacterial*)):ti,ab,kw
#19MeSH descriptor: [Iodophors] explode all trees
#20{and #16, #19}
#21((topical near/2 iodin*) or ("cadexomer iodine")):ti,ab,kw
#22MeSH descriptor: [Collagenases] explode all trees
#23{and #16, #22}
#24(topical near/2 collagen*):ti,ab,kw
#25MeSH descriptor: [Phenytoin] explode all trees
#26{and #16, #25}
#27(topical near/2 phenytoin):ti,ab,kw
#28MeSH descriptor: [Zinc Oxide] explode all trees
#29{and #16, #28}
#30(topical near/2 zinc):ti,ab,kw
#31(iodosorb or actiformcool or aquaflo or flamazine or silvadene):ti,ab,kw
#32MeSH descriptor: [Ointments] explode all trees
#33(ointment* or lotion* or cream* or powder* or gel or gels):ti,ab,kw
#34(topical next (agent* or preparation* or therap* or treatment*)):ti,ab,kw
#35{or #13‐#14, #17‐#18, #20‐#21, #23‐#24, #26‐#27, #29‐#34}
#36{or #12, #35}
#37MeSH descriptor: [Pressure Ulcer] explode all trees
#38(pressure next (ulcer* or sore* or injur*)):ti,ab,kw
#39(decubitus next (ulcer* or sore*)):ti,ab,kw
#40((bed next sore*) or bedsore*):ti,ab,kw
#41{or #37‐#40}
#42{and #36, #41} in Trials
Ovid MEDLINE
1 exp Bandages/
2 exp Alginates/
3 exp Hydrogels/
4 exp Honey/
5 exp Silver/
6 exp Silver Sulfadiazine/
7 exp Charcoal/
8 exp Silicones/
9 (dressing* or pad or pads or gauze or tulle or film or bead or foam* or non‐adherent or "non adherent" or hydrocolloid* or "sodium hyaluronate" or alginat* or hydrogel* or silver* or honey* or matrix or iodine* or "protease modulat*" or "capillary action" or charcoal or silicon* or polymer*).tw.
10 ((odour or odor) adj3 absorb*).tw.
11 (primapore or curasorb or seasorb or sorbsan or advadraw or vacutex or tegaderm or opsite or allevyn or biatain or medihoney or activon tulle or granuflex or "nu derm" or aquacel or iodoflex or iodozyme or xeroform or carboflex or cutimed sorbact or promogran or acticoat or "urgosorb silver" or mepitel or urgotul).tw.
12 or/1‐11
13 exp Metronidazole/
14 metronidazole.tw.
15 exp Administration, Topical/
16 exp Anti‐Bacterial Agents/
17 and/15‐16
18 (topical adj2 (antibiotic* or antimicrobial* or antibacterial*)).tw.
19 exp Iodophors/
20 and/15,19
21 ((topical adj2 iodin*) or "cadexomer iodine").tw.
22 exp Collagenases/
23 and/15,22
24 (topical adj2 collagen*).tw.
25 exp Phenytoin/
26 and/15,25
27 (topical adj2 phenytoin).tw.
28 exp Zinc Oxide/
29 and/15,28
30 (topical adj2 zinc).tw.
31 (iodosorb or actiformcool or aquaflo or flamazine or silvadene).tw.
32 exp Ointments/
33 (ointment* or lotion* or cream* or powder* or gel or gels).tw.
34 (topical adj (agent* or preparation* or therap* or treatment*)).tw.
35 or/13‐14,17‐18,20‐21,23‐24,26‐27,29‐34
36 or/12,35
37 exp Pressure Ulcer/
38 (pressure adj (ulcer* or sore* or injur*)).tw.
39 (decubitus adj (ulcer* or sore*)).tw.
40 (bedsore* or bed sore*).tw.
41 or/37‐40
42 and/36,41
43 randomized controlled trial.pt.
44 controlled clinical trial.pt.
45 randomi?ed.ab.
46 placebo.ab.
47 clinical trials as topic.sh.
48 randomly.ab.
49 trial.ti.
50 or/43‐49
51 exp animals/ not humans.sh.
52 50 not 51
53 and/42,52
Ovid Embase
1 exp "bandages and dressings"/
2 exp honey/
3 exp hydrogel/
4 exp Calcium Alginate/
5 (dressing* or pad or pads or gauze or tulle or film or bead or foam* or non‐adherent or "non adherent" or hydrocolloid* or "sodium hyaluronate" or alginat* or hydrogel* or silver* or honey* or matrix or iodine* or "protease modulat*" or "capillary action" or charcoal or silicon* or polymer*).ti,ab.
6 ((odour or odor) adj3 absorb*).ti,ab.
7 (primapore or curasorb or seasorb or sorbsan or advadraw or vacutex or tegaderm or opsite or allevyn or biatain or medihoney or activon tulle or granuflex or "nu derm" or aquacel or iodoflex or iodozyme or xeroform or carboflex or cutimed sorbact or promogran or acticoat or "urgosorb silver" or mepitel or urgotul).ti,ab.
8 or/1‐7
9 exp metronidazole/
10 metronidazole.ti,ab.
11 topical drug administration/
12 exp Antibiotic Agent/
13 and/11‐12
14 (topical adj2 (antibiotic* or antimicrobial* or antibacterial*)).ti,ab.
15 exp cadexomer iodine/
16 and/11,15
17 "cadexomer iodine".ti,ab.
18 exp silver/ or exp sulfadiazine silver/
19 and/11,18
20 exp collagenase/
21 and/11,20
22 (topical adj2 collagen*).ti,ab.
23 phenytoin/
24 and/11,23
25 (topical adj2 phenytoin).ti,ab.
26 exp zinc oxide/
27 and/11,26
28 (topical adj2 zinc).ti,ab.
29 (iodosorb or actiformcool or aquaflo or flamazine or silvadene).ti,ab.
30 exp ointment/
31 (ointment* or lotion* or cream* or powder* or gel or gels).ti,ab.
32 (topical adj (agent* or preparation* or therap* or treatment*)).ti,ab.
33 or/9‐10,13‐14,16‐17,19,21‐22,24‐25,27‐32
34 or/8,33
35 exp decubitus/
36 (pressure adj (ulcer* or sore* or injur*)).tw.
37 (decubitus adj (ulcer* or sore*)).tw.
38 (bedsore* or bed sore*).tw.
39 or/35‐38
40 and/34,39
41 Randomized controlled trials/
42 Single‐Blind Method/
43 Double‐Blind Method/
44 Crossover Procedure/
45 (random* or factorial* or crossover* or cross over* or cross‐over* or placebo* or assign* or allocat* or volunteer*).ti,ab.
46 (doubl* adj blind*).ti,ab.
47 (singl* adj blind*).ti,ab.
48 or/41‐47
49 exp animals/ or exp invertebrate/ or animal experiment/ or animal model/ or animal tissue/ or animal cell/ or nonhuman/
50 human/ or human cell/
51 and/49‐50
52 49 not 51
53 48 not 52
54 and/40,53
EBSCO CINAHL Plus
S57 S43 AND S56
S56 S44 OR S45 OR S46 OR S47 OR S48 OR S49 OR S50 OR S51 OR S52 OR S53 OR S54 OR S55
S55 TI allocat* random* or AB allocat* random*
S54 MH "Quantitative Studies"
S53 TI placebo* or AB placebo*
S52 MH "Placebos"
S51 TI random* allocat* or AB random* allocat*
S50 MH "Random Assignment"
S49 TI randomi?ed control* trial* or AB randomi?ed control* trial*
S48 AB ( singl* or doubl* or trebl* or tripl* ) and AB ( blind* or mask* )
S47 TI ( singl* or doubl* or trebl* or tripl* ) and TI ( blind* or mask* )
S46 TI clinic* N1 trial* or AB clinic* N1 trial*
S45 PT Clinical trial
S44 MH "Clinical Trials+"
S43 S37 AND S42
S42 S38 OR S39 OR S40 OR S41
S41 TI decubitus or AB decubitus
S40 TI ( bed sore* or bedsore* ) or AB ( bed sore* or bedsore* )
S39 TI ( pressure ulcer* or pressure sore* ) or AB ( pressure ulcer* or pressure sore* )
S38 (MH "Pressure Ulcer+")
S37 S13 OR S36
S36 S14 OR S15 OR S18 OR S19 OR S21 OR S22 OR S24 OR S25 OR S27 OR S28 OR S30 OR S31 OR S33 OR S34 OR S35
S35 TI (topical N3 agent* or topical N3 preparation* or topical N3 therap* and topical N3 treatment*) OR AB (topical N3 agent* or topical N3 preparation* or topical N3 therap* and topical N3 treatment*)
S34 TI (ointment* or lotion* or cream* or powder* or gel or gels) OR AB (ointment* or lotion* or cream* or powder* or gel or gels)
S33 (MH "Ointments")
S32 TI (iodosorb or actiformcool or aquaflo or flamazine or silvadene) OR AB (iodosorb or actiformcool or aquaflo or flamazine or silvadene)
S31 TI (topical N2 zinc) OR AB (topical N2 zinc)
S30 S16 AND S29
S29(MH "Zinc Oxide")
S28TI (topical N2 phenytoin) OR AB (topical N2 phenytoin)
S27S16 AND S26
S26(MH "Phenytoin+")
S25 TI (topical N2 collagen*) OR AB (topical N2 collagen*)
S24 S16 AND S23
S23 (MH "Collagen")
S22 TI "cadexomer iodine" OR AB "cadexomer iodine"
S21 S16 AND S20
S20 (MH "Iodophors+")
S19 TI (topical N2 (antibiotic* or antimicrobial* or antibacterial*)) OR AB (topical N2 (antibiotic* or antimicrobial* or antibacterial*))
S18 S16 AND S17
S17 (MH "Antiinfective Agents+")
S16 (MH "Administration, Topical+")
S15 TI metronidazole OR AB metronidazole
S14 (MH "Metronidazole")
S13 S1 OR S2 OR S3 OR S4 OR S5 OR S6 OR S7 OR S8 OR S9 OR S10 OR S11 OR S12
S12 AB (primapore or curasorb or seasorb or sorbsan or advadraw or vacutex or tegaderm or opsite or allevyn or biatain or medihoney or activon tulle or granuflex or "nu derm" or aquacel or iodoflex or iodozyme or xeroform or carboflex or cutimed sorbact or promogran or acticoat or "urgosorb silver" or mepitel or urgotul)
S11 TI (primapore or curasorb or seasorb or sorbsan or advadraw or vacutex or tegaderm or opsite or allevyn or biatain or medihoney or activon tulle or granuflex or "nu derm" or aquacel or iodoflex or iodozyme or xeroform or carboflex or cutimed sorbact or promogran or acticoat or "urgosorb silver" or mepitel or urgotul)
S10 TI odor N3 absorb* or AB odor N3 absorb*
S9 TI odour N3 absorb* or AB odour N3 absorb*
S8 AB (dressing* or pad or pads or gauze or tulle or film or bead or foam* or non‐adherent or "non adherent" or hydrocolloid* or "sodium hyaluronate" or alginat* or hydrogel* or silver* or honey* or matrix or iodine* or "protease modulat*" or "capillary action" or charcoal or silicon* or polymer*)
S7 TI (dressing* or pad or pads or gauze or tulle or film or bead or foam* or non‐adherent or "non adherent" or hydrocolloid* or "sodium hyaluronate" or alginat* or hydrogel* or silver* or honey* or matrix or iodine* or "protease modulat*" or "capillary action" or charcoal or silicon* or polymer*)
S6 (MH "Silver") or (MH "Silver Sulfadiazine")
S5 (MH "Honey")
S4 (MH "Charcoal")
S3 (MH "Silicones")
S2 (MH "Alginates")
S1 (MH "Bandages and Dressings+")
Appendix 4. STATA routines
We used the following specialist NMA STATA routines in addition to the standard STATA meta‐analysis routines of metan and mvmeta.
-
network meta consistency ‐ a multivariate network meta‐analysis routine; 'consistency' means assuming the heterogeneity variance is the same for all contrasts
-
network meta inconsistency ‐ multivariate network meta‐analysis routine: 'inconsistency' means account is taken of different study designs (e.g. pairwise/3‐arm trials) ‐ heterogeneity is assumed to be different amongst contrasts
-
intervalplot ‐ output of all NMA results (follows network meta routines)
-
netleague ‐ gives a 'league table' of results (follows network meta routines)
-
network rank ‐ produces ranking of interventions (follows network meta routines)
-
netweight ‐ calculates all direct pairwise summary effect sizes with their variances, creates the design matrix, and estimates the percentage contribution of each direct comparison to the network summary estimates and in the entire network.
-
ifplot ‐ identifies all triangular and quadratic loops in a network of interventions and estimates the respective inconsistency factors and their uncertainties
We also used STATA routines to visually display the data
-
network plot ‐ produces a network diagram, can be modified to add risk of bias
-
network rank ‐ produces rankograms
-
network forest ‐ plots results grouped by study design
-
netfunnel ‐ plots a comparison‐adjusted funnel plot for assessing small‐study effects within a network of interventions
Appendix 5. Group Network
Studies included in the group network
Individual interventions were mapped onto the group categories as shown in Table 5. Based on an assumption that dressings within certain categories can be used interchangeably, we grouped the individual interventions into the following pre‐specified categories: basic wound dressings, advanced dressings and antimicrobial dressings (as described in the BNF 2016), and we kept the different types of specialist dressings (e.g. protease‐modulating matrix dressings) and the different topical agents as separate categories.
| Individual intervention | Group intervention (studies in final network) |
| Basic wound contact dressing | Basic dressing (12 studies) |
| Saline gauze dressing | |
| Polyvinylpyrrolidone | |
| Hydrocolloid dressing | Advanced dressing (19 studies) |
| Foam dressing | |
| Hydrogel dressing | |
| Soft polymer dressing | |
| Alginate dressing | |
| Vapour‐permeable dressing | |
| Combination silicone foam dressing | |
| Hydrocolloid with/without alginate | |
| Standard care as described in Ashby 2012 | |
| Honey | Antimicrobial dressing (3 studies) |
| Iodine‐containing dressing | |
| Ethoxy diaminoacridine + nitrofurazone dressing | |
| Resin salve | |
| Hydrocolloid or hydrocolloid silver dressing | Advanced or antimicrobial dressing (1 study) |
| Protease‐modulating dressing | Protease‐modulating dressing (4 studies) |
| Collagenase ointment | Collagenase ointment (3 studies) |
| Dextranomer | Dextranomer (1 study) |
| Phenytoin topical | Phenytoin topical (1 study) |
| Sugar + egg white | Sugar + egg white (1 study) |
| Tripeptide copper gel | Tripeptide copper gel (1 study) |
We excluded 15 of the 51 included studies from the group analysis because they compared interventions in the same group: 14 had advanced dressings in both arms (Aguilo Sanchez 2002; Bale 1997a; Banks 1994a; Banks 1994c; Belmin 2002; Brod 1990; Brown‐Etris 1996; Brown‐Etris 2008; Darkovich 1990; Motta 1999; Muller 2001; Seeley 1999; Sopata 2002; Thomas 1997a); and one had two antimicrobial dressings (Yapucu Güneş 2007). Three additional studies not joined into the individual network were also isolated from the group network (Imamura 1989; Payne 2004; Van De Looverbosch 2004). Two studies previously excluded from the individual network were included initially in the group network (Ashby 2012; Sipponen 2008), but only the Sipponen 2008 study was included in the network. We excluded the Ashby 2012 study and nine others from the network because they were joined to an ineligible intervention that did not link two or more interventions in the network (Gorse 1987; Hondé 1994; Nisi 2005; Nussbaum 1994; Price 2000; Ramos‐Torrecillas 2015; Rees 1999; Serena 2010; Thomas 2005). We also excluded the Sebern 1986 study from the group network, as for the individual network.
Interventions and comparisons
The group network comprised 22 studies (which is less than half of the 51 included studies) (Alm 1989; Banks 1994b; Barrois 1992; Brown‐Etris 1997; Burgos 2000b; Colwell 1993; Graumlich 2003; Hollisaz 2004; Kaya 2005; Kraft 1993; Matzen 1999; Muller 2001; Neill 1989a; Oleske 1986; Parish 1979; Payne 2009; Piatkowski 2012; Romanelli 2001; Sipponen 2008; Thomas 1998; Xakellis 1992; Zeron 2007), The median (range) study size was 38.5 (10 to 100). Only three contrasts were informed by more than one study.
The network comprised 10 interventions. Two studies were three‐arm trials (Hollisaz 2004; Parish 1979), so the total number of comparisons was 26, encompassing a total of 959 participants, experiencing 362 events (complete healing). There were eight direct contrasts and three triangular loops (one of which was exclusive to the Parish 1979 study). This is only 32.5% of the participants in the 51 included studies. The network diagram is shown in Figure 10. Only three contrasts were informed by more than one study:advanced dressing versus basic dressing (11 studies); antimicrobial dressing versus advanced dressing (2); and collagenase ointment versus advanced dressing (2).

Key: green = low/unclear risk of bias; yellow = high risk of bias; red = very high overall risk of bias for the contrast. The number of studies for each contrast is given in Table 4.
| Contrast/comparison | Number | RR (95% CI) direct evidence Random‐effects (inverse variance) Heterogeneity statistics | NMA results (consistency assumption) RR (95% CI) |
| Advanced dressings versus basic dressings (Alm 1989; Banks 1994b; Colwell 1993; Hollisaz 2004; Kraft 1993; Matzen 1999; | 11 (532) | 1.55 (1.10 to 2.19) Tau² = 0.13; P = 0.02; I² = 52% | 1.36 (0.95 to 1.93) |
| Phenytoin versus basic dressing | 1 (40) | 3.02 (0.97 to 9.35) | 1.12 (0.52 to 2.44) |
| Protease‐modulating dressing versus basic dressing (Zeron 2007) | 1 (24) | 1.25 (0.44 to 3.55) | 1.49 (0.91 to 2.46) |
| Antimicrobial dressings versus advanced dressings (Barrois 1992; Kaya 2005) | 2 (125) | 0.69 (0.48 to 0.99) Tau² = 0.00; P = 0.46; I² = 0% | 0.71 (0.45 to 1.13) |
| Collagenase ointment versus advanced dressings | 2 (61) | 1.51 (0.93 to 2.43) Tau² = 0.00; P = 0.61 ; I² = 0% | 1.48 (0.83 to 2.64) |
| Phenytoin versus advanced dressing | 1 (39) | 0.71 (0.41 to 1.24) | 0.83 (0.43 to 1.59) |
| Protease‐modulating dressing versus advanced dressing (Brown‐Etris 1997; Graumlich 2003; Piatkowski 2012) | 3 (112) | 1.13 (0.80 to 1.60) Tau² = 0.00; P = 0.84 ; I² = 0% (Stata: 1.12 (0.79 to 1.59)) | 1.10 (0.74 to 1.64) |
| Tripeptide copper gel versus advanced dressing | 1 (12) | 2.50 (0.76 to 8.19) | 2.50 (0.72 to 8.63) |
| Antimicrobial dressing versus advanced antimicrobial dressing (Sipponen 2008) | 1 (37) | 2.29 (0.91 to 5.77) | 2.29 (0.85 to 6.16) |
| Collagenase versus dextranomer | 1 (12) | 0.35 (0.05 to 2.26) (Stata 0.44 (0.10 to 2.02)) | 0.44 (0.09 to 2.11) |
| Collagenase ointment versus sugar + egg white (part of 3‐arm trial) (Parish 1979) | 1 (10) | 3.00 (0.15 to 59.89) (Stata 3.00 (0.15 to 59.79)) | 3.00 (0.15 to 61.18) |
| Dextranomer versus sugar + egg white (part of 3‐arm trial) (Parish 1979) | 1 (12) | 6.75 (0.44 to 102.80) | 6.75 (0.43 to 105.22) |
| TOTAL | 22 (959) |
The characteristics of studies and participants in the group network are described in Table 1.
Risk of bias
We have summarised the all‐domain risk of bias for each study in the group network in Figure 11. We judged one study to be at low risk of bias (Graumlich 2003) and eight at unclear risk of bias (Banks 1994b; Barrois 1992; Hollisaz 2004; Parish 1979; Piatkowski 2012; Romanelli 2001; Thomas 1998; Zeron 2007). We judged three studies to be at very high risk of bias, that is, to have high risk of bias for two or more domains (Banks 1994a; Burgos 2000b; Oleske 1986). The rest of the studies we assessed to be at high risk of bias. We grouped the low and unclear categories together in the network.

Risk of bias summary ‐ group network: review authors' judgements about each risk of bias item for each included study
For each direct comparison, the overall risk of bias is shown colour coded in Figure 10. There is a relatively large amount of evidence at high or very high risk of bias.
For each contrast in the network, we calculated the overall risk of bias as described in Appendix 8, and the risk of bias ratings are also shown beside the results in Figure 7.
Network meta‐analysis results
The group NMA generated results for 45 mixed treatment contrasts. The network was dominated by the contrast advanced dressing versus basic dressing and the rest of the data were sparse.
Figure 7 shows all NMA results, with the all‐domain risk of bias shown alongside the forest plot contrasts.
As in the individual network, the evidence for the majority of contrasts was informed by studies at high risk of bias, and CIs were wide or very wide, such that we downgraded all evidence at least once for imprecision. There was also heterogeneity or inconsistency, or both, for some contrasts. Consequently, evidence was of low or very low certainty, with the exception of one contrast, for which we assessed the evidence to be of moderate certainty. As for the individual network, this moderate‐certainty evidence should be interpreted in the light of the very low‐certainty evidence for the network as a whole.
We report the representative set of contrasts of each intervention versus basic dressings (Table 3 and Figure 7 first subgroup). Further details of the GRADE assessment can be found in Appendix 8 and Appendix 9.
It is not clear whether protease‐modulating dressings increase the probability of healing compared with basic dressings (RR 1.49; 95% CI 0.91 to 2.46, moderate quality evidence). This corresponds to an absolute risk difference of 94 more people healed per 1000 (95% CI 17 fewer to 279 more). We downgraded the evidence once for imprecision (low risk of bias).
For each of two contrasts (collagenase ointment and tripeptide copper gel) it is unclear whether the intervention increases the probability of healing compared with basic dressings (collagenase: RR 2.01, 95% CI 1.05 to 3.88 and tripeptide copper gel: RR 3.39, 95% CI 0.94 to 12.30); Figure 7). This was low certainty evidence, downgraded once for risk of bias and once for imprecision for collagenase ointment, and twice for imprecision for tripeptide copper gel (for which the direct evidence involved only six participants experiencing five events (complete healing)).
It is unclear whether the remaining six interventions affect the probability of healing compared with basic dressings (advanced dressings, advanced and antimicrobial dressings; antimicrobial dressings, dextranomer, phenytoin and sugar plus egg white) because the evidence is of very low certainty (downgraded mainly for risk of bias (once) and imprecision (twice), although two contrasts (phenytoin and advanced dressings versus basic dressings) had inconsistency.
Ranking of treatments
The rank probability data are shown in Figure 12 and Table 6. The rankograms have maximum probabilities more sharply defined in the group network compared with the individual network for the treatments advanced dressings, advanced‐antimicrobial dressings, collagenase ointment and dextranomer, but there is still overlap of the rankograms for different treatments (Figure 8). The mean rank was 2.0 for dextranomer and 2.3 for tripeptide copper gel, and two treatments had a mean rank of 10 (out of 10): advanced‐antimicrobial dressings and sugar plus egg white. However, no SUCRA value was 0 or 1, indicating uncertainty in the group network.
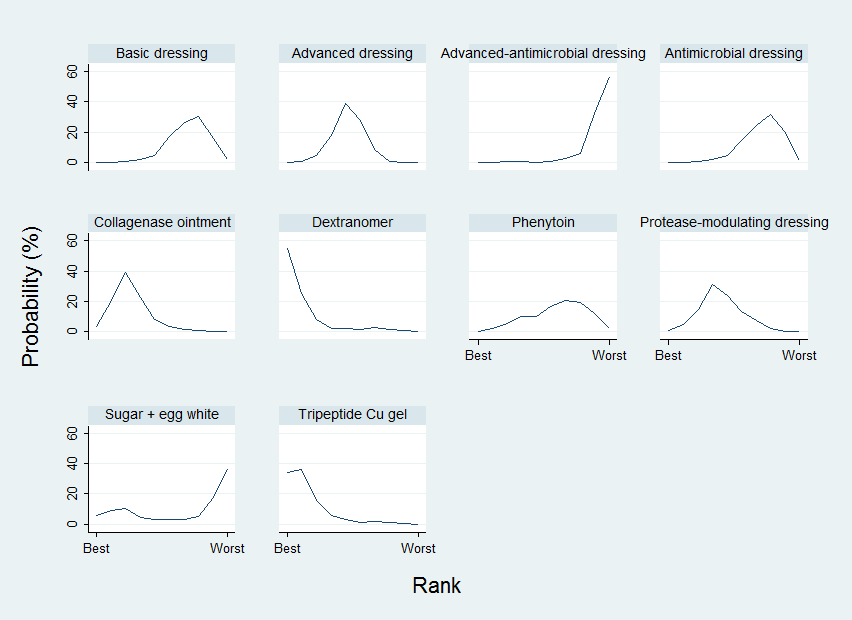
Group network ‐ rankograms
| Group intervention | Mean rank | SUCRA | Probability at | Rank at maximum |
| Basic dressing | 7.3 | 0.3 | 30.6 | 8 |
| Advanced dressing | 5.2 | 0.5 | 38.8 | 5 |
| Advanced ‐ antimicrobial dressing | 9.4 | 0.1 | 57.0 | 10 |
| Antimicrobial dressing | 7.4 | 0.3 | 31.9 | 8 |
| Collagenase ointment | 3.3 | 0.7 | 39.4 | 3 |
| Dextranomer | 2 | 0.9 | 55.3 | 1 |
| Phenytoin | 6.5 | 0.4 | 20.5 | 7 |
| Protease‐modulating dressing | 4.6 | 0.6 | 31.2 | 4 |
| Sugar + egg white | 7 | 0.3 | 36.5 | 10 |
| Tripeptide copper gel | 2.3 | 0.9 | 36.2 | 2 |
As with the individual network, the results must be interpreted in the light of the considerable uncertainty in the network and individual estimates, which can give misleading results. Numerically, dextranomer and tripeptide copper gel had the highest probabilities of being the best treatments (55% and 34%, respectively), but these high rankings are likely to be an artificial result. . Across all treatments there was very low certainty in the ranking of interventions (see quality assessment below).
Comparison of results from standard meta‐analysis versus NMA findings
We compared the NMA results with the direct comparison (pairwise) results for the proportion completely healed for the eight different comparisons informing the group network (Table 4). Three comparisons had two or more direct comparison studies (Analysis 2.1). The direct evidence shows some heterogeneity for the comparison of advanced dressing versus basic dressing (I² = 52%, P = 0.02 and some variation in the point estimates). Appendix 11 shows direct evidence results for the time‐to‐healing outcome for three comparisons in five studies.
Certainty/quality assessment of the network
Overall we downgraded the evidence certainty three times for the network as a whole, because of risk of bias (once), imprecision (once) and inconsistency and publication bias (once): the weighted average risk of bias across the network was high (Appendix 8). For inconsistency, the global Wald test was borderline significant at the 90% significance level (P value was 0.095) (see Appendix 9), however, there were relatively few contrasts with conflicting results for direct and indirect estimates. We downgraded the evidence once for imprecision: there is some overlap of the individual rankograms and no SUCRA value was zero or 1, suggesting uncertainty around treatment estimates and ranking in this network. A contour‐enhanced funnel plot (Figure 9) suggested there may be some asymmetry in the plot (which may be a consequence of publication bias).
Overall, we have little confidence in the findings in this group network, either in terms of the effect estimates or in the ranking of interventions.
Sensitivity analyses ‐ group network
We did not pre‐specify sensitivity analyses for the group network, mainly because the group network itself is based on the assumption that a variety of dressings can be grouped as advanced dressings or basic dressings (as defined by the BNF 2016). We attempted to investigate this assumption by examining the network contrasts for the individual network that compared two advanced dressings, expecting the effect estimates to be close to 1 if the assumption was valid. Results can be seen in Figure 4. Most point estimates were fairly close to 1, but CIs were usually wide or very wide around the estimates. Without exception, the risk of bias for each contrast was either high or very high, and the CI crossed at least one GRADE default MID. Thus, there is no clear evidence either to support or refute the group assumption.
A post‐hoc sensitivity analysis (Appendix 12) examined the original assumption of combining topical agents and dressings in the same NMA, by restricting the group NMA to dressings. There may have been less imprecision in the network as a whole, but results for the contrasts with basic dressings were similar to those in the full group network.
Appendix 6. Assessment of risk of bias
1. Was the allocation sequence randomly generated? (Part of 'Selection bias')
Low risk of bias
The investigators describe a random component in the sequence generation process such as: referring to a random number table; using a computer random‐number generator; coin tossing; shuffling cards or envelopes; throwing dice; drawing of lots.
High risk of bias
The investigators describe a non‐random component in the sequence generation process. Usually, the description would involve some systematic, non‐random approach, for example: sequence generated by odd or even date of birth; sequence generated by some rule based on date (or day) of admission; sequence generated by some rule based on hospital or clinic record number.
Unclear
Insufficient information about the sequence generation process provided to permit a judgement of low or high risk of bias.
2. Was the treatment allocation adequately concealed? (Part of 'Selection bias')
Low risk of bias
Participants and investigators enrolling participants could not foresee assignment because one of the following, or an equivalent method, was used to conceal allocation: central allocation (including telephone, web‐based and pharmacy‐controlled randomisation); sequentially‐numbered drug containers of identical appearance; sequentially‐numbered, opaque, sealed envelopes.
High risk of bias
Participants or investigators enrolling participants could possibly foresee assignments and thus introduce selection bias, such as allocation based on: using an open random allocation schedule (e.g. a list of random numbers); assignment envelopes were used without appropriate safeguards (e.g. if envelopes were unsealed or non opaque or not sequentially numbered); alternation or rotation; date of birth; case record number; any other explicitly unconcealed procedure.
Unclear
Insufficient information provided to permit a judgement of low or high risk of bias. This is usually the case if the method of concealment is not described or not described in sufficient detail to allow a definite judgement, for example if the use of assignment envelopes is described, but it remains unclear whether envelopes were sequentially numbered, opaque and sealed.
3. Blinding ‐ was knowledge of the allocated interventions adequately prevented during the study? (Performance bias for blinding of participants and caregivers; detection bias for outcome assessors)
Low risk of bias
Any one of the following.
-
No blinding, but the review authors judge that the outcome and the outcome measurement are not likely to be influenced by lack of blinding.
-
Blinding of participants and key study personnel ensured, and unlikely that the blinding could have been broken.
-
Either participants or some key study personnel were not blinded, but outcome assessment was blinded and the non‐blinding of others was unlikely to introduce bias.
High risk of bias
Any one of the following.
-
No blinding or incomplete blinding, and the outcome or outcome measurement is likely to be influenced by lack of blinding.
-
Blinding of key study participants and personnel attempted, but likely that the blinding could have been broken and the outcome or outcome measurement is likely to be influenced by lack of blinding.
-
Either participants or some key study personnel were not blinded, and the non‐blinding was likely to introduce bias.
Unclear
Either of the following.
-
Insufficient information provided to permit a judgement of low or high risk of bias.
-
The study did not address this outcome.
4. Were incomplete outcome data adequately addressed? (Attrition bias)
Low risk of bias
Any one of the following.
-
No missing outcome data.
-
Reasons for missing outcome data unlikely to be related to true outcome (for survival data, censoring unlikely to be introducing bias).
-
Missing outcome data balanced in numbers across intervention groups, with similar reasons for missing data across groups.
-
For dichotomous outcome data, the proportion of missing outcomes compared with observed event risk was not enough to have a clinically relevant impact on the intervention effect estimate.
-
For continuous outcome data, plausible effect size (difference in means or standardised difference in means) among missing outcomes was not enough to have a clinically relevant impact on observed effect size.
-
Missing data have been imputed using appropriate methods.
High risk of bias
Any one of the following.
-
Reason for missing outcome data likely to be related to true outcome, with either imbalance in numbers or reasons for missing data across intervention groups.
-
For dichotomous outcome data, the proportion of missing outcomes compared with observed event risk was enough to induce clinically relevant bias in intervention effect estimate.
-
For continuous outcome data, plausible effect size (difference in means or standardised difference in means) among missing outcomes was enough to induce clinically relevant bias in observed effect size.
-
'As‐treated' analysis done with substantial departure of the intervention received from that assigned at randomisation.
-
Potentially inappropriate application of simple imputation.
Unclear
Either of the following.
-
Insufficient reporting of attrition/exclusions to permit a judgement of low or high risk of bias (e.g. number randomised not stated, no reasons for missing data provided).
-
The study did not address this outcome.
5. Are reports of the study free of suggestion of selective outcome reporting? (Outcome reporting bias)
Low risk of bias
Either of the following.
-
The study protocol is available and all of the study's pre‐specified (primary and secondary) outcomes that are of interest in the review have been reported in the pre‐specified way.
-
The study protocol is not available but it is clear that the published reports include all expected outcomes, including those that were pre‐specified (convincing text of this nature may be uncommon).
High risk of bias
Any one of the following.
-
Not all of the study's pre‐specified primary outcomes have been reported.
-
One or more primary outcomes are reported using measurements, analysis methods or subsets of the data (e.g. subscales) that were not pre‐specified.
-
One or more reported primary outcomes of the study were not pre‐specified (unless clear justification for their reporting is provided, such as an unexpected adverse effect).
-
One or more outcomes of interest in the review are reported incompletely so that they cannot be entered in a meta‐analysis.
-
The study report fails to include results for a key outcome that would be expected to have been reported for such a study.
Unclear
Insufficient information provided to permit judgement of low or high risk of bias. It is likely that the majority of studies will fall into this category.
6. Other sources of potential bias
Low risk of bias
The study appears to be free of other sources of bias.
High risk of bias
There is at least one important additional risk of bias. For example, the study:
-
had a potential source of bias related to the specific study design used; or
-
has been claimed to have been fraudulent; or
-
had some other problem.
Unclear
There may be a risk of bias, but there is either:
-
insufficient information to assess whether an important risk of bias exists; or
-
insufficient rationale or evidence that an identified problem will introduce bias.
Appendix 7. Studies included in the individual network
The 51 included studies compared 39 different interventions in 59 comparisons, summarised in Table 7.
| Intervention | Number of | Number of participants | In joined | Number of studies | Number of participants |
| Alginate dressings | 2 | 38 | Y | 2 | 38 |
| Basic wound contact dressings | 2 | 33 | Y | 1 | 24 |
| Collagenase‐containing ointment | 3 | 35 | Y | 3 | 35 |
| Combination dressing: non‐adherent + saline gauze + foam | 1 | 16 | N | ||
| Combination dressing: silicone + foam | 1 | 44 | Y | 1 | 44 |
| Dextranomer | 1 | 7 | Y | 1 | 7 |
| Enamel matrix protein | 1 | 6 | N | ||
| Ethoxy‐diaminoacridine plus nitrofurazone dressing | 1 | 26 | N | ||
| Foam dressings | 13 | 266 | Y | 13 | 266 |
| Gauze saline dressings | 11 | 245 | Y | 10 | 233 |
| Honey | 1 | 25 | N | ||
| Hydrocolloid dressings | 22 | 791 | Y | 21 | 715 |
| Hydrocolloid or hydrocolloid silver dressing | 1 | 16 | N | ||
| Hydrocolloid with or without alginate filler | 1 | 20 | Y | 1 | 20 |
| Hydrocolloid‐alginate sequential dressings | 1 | 57 | Y | 1 | 57 |
| Hydrogel | 12 | 335 | Y | 10 | 279 |
| Ineligible intervention: graft + conventional dressing | 1 | 18 | N | ||
| Ineligible intervention: growth factor + hyaluronic acid | 1 | 40 | N | ||
| Ineligible intervention: growth factor | 2 | 152 | N | ||
| Ineligible intervention laser | 1 | 7 | N | ||
| Ineligible intervention: NPWT (only included in group analysis) | 1 | 6 | N | ||
| Ineligible intervention: povidone iodine + paraffin soaked gauze | 1 | 40 | N | ||
| Ineligible intervention: radiant heat | 2 | 53 | Y | 2 | 53 |
| Ineligible intervention: skin substitute | 2 | 110 | Y | 2 | 110 |
| Ineligible intervention: ultrasound + ultraviolet | 1 | 6 | N | ||
| Ineligible intervention: whirlpool + chloramine dressing | 1 | 52 | N | ||
| Iodine‐containing dressings | 2 | 62 | Y | 2 | 62 |
| Lysosyme ointment | 1 | 69 | N | ||
| Phenytoin topical | 1 | 21 | Y | 1 | 21 |
| Polyvinylpyrrolidone + zinc oxide | 1 | 12 | Y | 1 | 12 |
| Propylene glycol alginate | 1 | 5 | N | ||
| Protease‐modulating dressings | 5 | 116 | Y | 4 | 76 |
| Resin salve | 1 | 16 | N | ||
| Soft polymer dressing | 1 | 18 | Y | 1 | 18 |
| Standard care (only included in group analysis) | 1 | 6 | N | ||
| Sugar + egg white | 1 | 5 | Y | 1 | 5 |
| Sugar + povidone iodine | 1 | 72 | N | ||
| Tripeptide copper + Opsite | 1 | 6 | Y | 1 | 6 |
| Vapour‐permeable dressings | 2 | 57 | Y | 1 | 35 |
One study (Ashby 2012) had a range of advanced dressings as the comparator, so was ineligible for the individual intervention NMA (but was eligible for the group NMA). Thus there were 50 eligible studies for the individual NMA, comparing 37 different interventions in 58 comparisons with 2952 participants.There were nine interventions eligible for the individual network, which, on their own, did not meet the inclusion criteria of the review, but were compared with interventions that did meet the inclusion criteria ‐ we have called these 'ineligible interventions'.
The network diagram for all interventions in the individual NMA is shown in Figure 13. Ten interventions (including one ineligible intervention) were isolated from the network and are shown in red in Figure 13. Two further ineligible interventions (radiant heat and skin substitute) linked two of the eligible interventions and so were included in the joined network; the other six ineligible interventions (shown in blue) did not link eligible interventions and their studies were therefore omitted from thejoined network. Two of these omitted studies were three‐arm trials each with two ineligible interventions (Nussbaum 1994; Ramos‐Torrecillas 2015). Therefore, ten studies could not be included in the joined network (Gorse 1987; Imamura 1989; Nisi 2005; Nussbaum 1994; Payne 2004; Ramos‐Torrecillas 2015; Rees 1999; Sipponen 2008; Van De Looverbosch 2004; Yapucu Güneş 2007). The results for the isolated studies in which both interventions were eligible are reported in Analysis 5.1. Another study (Sebern 1986) only partially reported their results and was not considered further.

Network diagram ‐ all interventions
Key: red = isolated interventions; blue = ineligible interventions joined to only one eligible intervention. Line and node weights not to scale
Thus 39 studies were included in the individual network (Aguilo Sanchez 2002; Alm 1989; Bale 1997a; Banks 1994b; Banks 1994a; Banks 1994c; Barrois 1992; Belmin 2002; Brod 1990; Brown‐Etris 1996; Brown‐Etris 1997; Brown‐Etris 2008; Burgos 2000b; Colwell 1993; Darkovich 1990; Graumlich 2003; Hollisaz 2004; Hondé 1994; Kaya 2005; Kraft 1993; Matzen 1999; Meaume 2003; Motta 1999; Muller 2001; Neill 1989a; Oleske 1986; Parish 1979; Payne 2009; Piatkowski 2012; Price 2000; Romanelli 2001; Seeley 1999; Serena 2010; Sopata 2002; Thomas 1997a; Thomas 1998; Thomas 2005; Xakellis 1992; Zeron 2007).
Appendix 8. Contributions and risk of bias in the individual and group networks
7.1. Individual network
The percentage contributions to the mixed treatment contrasts from each direct contrast are shown in Figure 14 for the individual network contrasts versus saline gauze. We calculated the risk of bias for each contrast in the NMA and results for each mixed treatment contrast are shown in the last column of the table in Figure 14 and represented on the forest plot (see Assessment of risk of bias in included studies).

Contributions matrix ‐ interventions versus saline gauze (independent network)
Key: 1 = saline gauze dressing; 2 = alginate dressing; 3 = sequential hydrocolloid alginate dressings; 4 = basic wound contact dressing; 5 = collagenase ointment; 6 = dextranomer; 7 = foam dressing; 8 = hydrocolloid dressing; 9 = hydrocolloid +/‐ alginate (hydrocolloid with/without alginate filler); 10 = hydrogel dressing; 11 = ineligible intervention: radiant heat; 12 = ineligible intervention: skin substitute; 13 = iodine‐containing dressing; 14 = phenytoin; 15 = protease‐modulating dressing; 16 = PVP + zinc oxide; 17 = silicone + foam dressing; 18 = soft polymer dressing; 19 = sugar + egg white; 20 = tripeptide copper gel; 21 = vapour‐permeable dressing.
The contributions to the whole network from each direct contrast are given in the last row of the table in Figure 14. The overall risk of bias was high and the largest contributions to the network were from the direct contrasts: foam versus hydrocolloid; collagenase ointment versus sugar plus egg white; and protease‐modulating dressings versus alginate dressings (but all contributions were still 10% or less).
7.2. Group network
The percentage contributions to the mixed treatment contrasts from each direct contrast are shown in Table 8 for the group network contrasts versus basic dressings. We calculated the risk of bias for each contrast in the NMA and results for each mixed treatment contrast are shown in the last column of Table 8.
| NMA ⇩ | Contributions from each direct evidence contrast | Overall risk |
| 1 vs 2 | 74.5% 1 vs 2 + 5.5% 1 vs 7 + 7.2% 1 vs 8 + 5.5% 2 vs 7 + 7.2% 2 vs 8 | high |
| 1 vs 3 | 27.1% 1 vs 2 + 2.0% 1 vs 7 + 2.6% 1 vs 8 + 31.8% 2 vs 4 + 2.0% 2 vs 7 + 2.6% 2 vs 8 + 31.8% 3 vs 4 | high |
| 1 vs 4 | 39.8% 1 vs 2 + 2.9% 1 vs 7 + 3.9% 1 vs 8 + 46.6% 2 vs 4 + 2.9% 2 vs 7 + 3.9% 2 vs 8 | high |
| 1 vs 5 | 39.8% 1 vs 2 + 2.9% 1 vs 7 + 3.9% 1 vs 8 + 46.6% 2 vs 5 + 2.9% 2 vs 7 + 3.9% 2 vs 8 | high |
| 1 vs 6 | 26.1% 1 vs 2 + 1.9% 1 vs 7 + 2.5% 1 vs 8 + 30.6% 2 vs 5 + 1.9% 2 vs 7 + | high |
| 1 vs 7 | 37.8% 1 vs 2 + 13.4% 1 vs 7 + 3.7% 1 vs 8 + 41.4% 2 vs 7 + 3.7% 2 vs 8 | low |
| 1 vs 8 | 40.8% 1 vs 2 + 3.0% 1 vs 7 + 9.3% 1 vs 8 + 3.0% 2 vs 7 + 43.8% 2 vs 8 | low |
| 1 vs 9 | 23.6% 1 vs 2 + 1.7% 1 vs 7 + 2.3% 1 vs 8 + 27.6% 2 vs 5 + 1.7% 2 vs 7 + | high |
| 1 vs 10 | 39.8% 1 vs 2 + 2.9% 1 vs 7 + 3.9% 1 vs 8 + 2.9% 2 vs 7 + 3.9% 2 vs 8 + 46.9% 2 vs 10 | low |
| Whole network | 8.7% 1 vs 2 + 2.1% 1 vs 7 + 1.6% 1 vs 8 + 14.9% 2 vs 4 + 19.6% 2 vs 5 + | high |
Key to interventions: 1 = basic dressing; 2 = advanced dressing; 3 = advanced +/‐ antimicrobial dressing;
4 = antimicrobial dressing; 5 = collagenase ointment; 6 = dextranomer; 7 = phenytoin;
8 = protease‐modulating dressing; 9 = sugar + egg white; 10 = tripeptide copper gel
Risk of bias for direct contrasts: Low ‐ 1 vs 7; 1 vs 8; 2 vs 7; 2 vs 8; 2 vs 10; 5 vs 6; 5 vs 9; 6 vs 9.
High risk of bias: 1 vs 2; 2 vs 4; 2 vs 5; 3 vs 4
Contributions to the whole network are given in the last row. The overall risk of bias was high and the largest contributions to the network were for the direct contrasts: collagenase ointment versus advanced dressings (19.6%); antimicrobial dressings versus advanced dressings (14.9%) and dextranomer versus collagenase ointment (10.5%).
Appendix 9. Inconsistency
8.1 Individual network
8.1.1. Inconsistency for each contrast (local inconsistency)
Firstly, we examined inconsistency factors, comparing results from the direct evidence with those from the indirect evidence for each contrast informed by a loop. We reported results as the ratio of risk ratios (RoRR), with its 90% confidence interval (CI) for the seven loops (Table 9), assuming a common heterogeneity estimate within each loop. At the 90% significance level, there appeared to be inconsistency in the saline gauze‐hydrogel‐phenytoin loop (RoRR 3.90, 90% CI 1,19 to 12.77). The results also suggested some non‐significant potential inconsistency in all other loops (because the 90% CI crosses 2 or 0.5), except for the loop comprising foam, hydrocolloid and hydrogel. In particular, the loop comprising saline gauze‐foam‐hydrogel had potential inconsistency (RoRR 1.64, 90% CI 0.27 to 9.99); this loop also had a fairly high tau² (0.512), suggesting heterogeneity within that loop. We also examined inconsistency factors using the assumption of a common heterogeneity estimate across the network (Veroniki 2013) (Table 9): for the individual network, tau² (network) was 0.043, and the RoRR for the saline gauze‐hydrogel‐phenytoin loop was 3.75 (90% CI 1.14 to 12.29), that is, similar to the original assumption. For this analysis, the 90% CI crossed 0.5 or 2.0 for all loops except foam‐hydrocolloid‐hydrogel.
| Common heterogeneity estimate within each loop | Common heterogeneity estimate for network: tau² (network) = 0.0435 | ||||
| Loop | Ratio of RR (90% CI) | P value | Loop heterogeneity tau² (loop) | Ratio of RR (90% CI) | P value |
| Saline gauze ‐ hydrogel ‐ phenytoin | 3.90 (1.19 to 12.77) | 0.059 | 0.000 | 3.75 (90%CI 1.14 to 12.29) | 0.067 |
| Saline gauze ‐ foam ‐ hydrogel | 1.64 (0.27 to 9.99) | 0.651 | 0.512 | 1.21 (90%CI 0.56 to 2.63) | 0.682 |
| Hydrocolloid ‐ hydrogel ‐ iodine containing dressing | 1.26 (0.44 to 3.61) | 0.721 | 0.084 | 1.28 (90%CI 0.59 to 2.75) | 0.602 |
| Foam ‐ hydrocolloid ‐ protease‐modulating | 1.25 (0.66 to 2.35) | 0.562 | 0 | 1.24 (90%CI 0.66 to 2.35) | 0.572 |
| Foam ‐ hydrocolloid ‐ hydrogel | 1.13 (0.7 to 1.83) | 0.675 | 0.016 | 1.16 (90%CI 0.77 to 1.75) | 0.548 |
| Saline gauze ‐ foam ‐ hydrocolloid | 1.04 (0.45 to 2.41) | 0.936 | 0.084 | 1.04 (90%CI 0.55 to 1.96) | 0.919 |
| Saline gauze ‐ hydrocolloid ‐ hydrogel | 1.01 (0.33 to 3.11) | 0.993 | 0.244 | 1.09 (90%CI 0.62 to 1.89) | 0.808 |
̶Secondly, a node‐splitting approach was taken. The results following node‐splitting for indirect and direct NMA estimates are shown in Table 10, together with the ratio of risk ratios (RoRR) (indirect/direct) with its 90% CI (the 90% significance level was chosen for this test because of its lack of power). The 'indirect' estimate is the result when the NMA is run in the absence of the direct evidence for that contrast. This is only meaningful if the two interventions in the contrast are joined indirectly through the rest of the network; therefore, we report node splitting results for only 12 (of 27) direct contrasts. We made the following observations:
| Contrast | Direct evidence RR (95% CI) | Indirect evidence RR (95% CI) | RR direct/RR indirect (90% CI) | P value | tau² |
| Foam versus saline gauze | 1.52 (0.73 to 3.16) | 1.54 (0.95 to 2.49) | 0.99 (90% CI 0.47 to 2.05) | 0.973 | 0.22 |
| Hydrocolloid versus saline gauze | 1.41 (0.88 to 2.26) | 1.49 (0.87 to 2.56) | 0.95 (90% CI 0.53 to 1.69) | 0.876 | 0.22 |
| Hydrogel versus saline gauze | 1.67 (0.86 to 3.22) | 1.52 (0.91 to 2.54) | 1.10 (90% CI 0.57 to 2.12) | 0.820 | 0.22 |
| Phenytoin versus saline gauze | 3.01 (0.93 to 9.71) | 0.29 (0.05 to 1.51) | 10.06 (90% CI 1.35 to 75.13) | 0.059 | 0.15 |
| Hydrocolloid versus foam | 0.95 (0.68 to 1.32) | 0.91 (0.57 to 1.44) | 1.04 (90% CI 0.65 to 1.68) | 0.881 | 0.23 |
| Hydrogel versus foam | 0.90 (0.51 to 1.58) | 1.10 (0.72 to 1.68) | 0.81 (90% CI 0.45 to 1.47) | 0.568 | 0.23 |
| Protease‐modulating dressing versus foam | 1.22 (0.61 to 2.41) | 0.94 (0.46 to 1.92) | 1.29 (90% CI 0.56 to 2.94) | 0.614 | 0.22 |
| Hydrogel versus hydrocolloid | 1.10 (0.76 to 1.59) | 1.07 (0.68 to 1.68) | 1.02 (90% CI 0.63 to 1.67) | 0.935 | 0.24 |
| Iodine‐containing dressing versus hydrocolloid | 0.90 (0.36 to 2.19) | 0.68 (0.35 to 1.33) | 1.31 (90% CI 0.51 to 3.32) | 0.638 | 0.22 |
| Protease‐modulating dressing versus hydrocolloid | 1.02 (0.53 to 1.97) | 1.32 (0.63 to 2.76) | 0.78 (90% CI 0.34 to 1.77) | 0.614 | 0.22 |
| Iodine‐containing dressing versus hydrogel | 0.64 (0.35 to 1.16) | 0.84 (0.32 to 2.15) | 0.77 (90% CI 0.30 to 1.95) | 0.639 | 0.22 |
| Phenytoin versus hydrogel | 0.71 (0.38 to 1.34) | 7.18 (0.68 to 75.47) | 0.10 (90% CI 0.01 to 0.74) | 0.059 | 0.15 |
-
Results for two contrasts suggested inconsistency at the 90% confidence level: phenytoin versus saline gauze (RoRR 10.06, 90% CI 1.35 to 75.13) and phenytoin versus hydrogel (RoRR 0.10, 90% CI 0.01 to 0.74). However, the CIs were wide.
-
There was potential for inconsistency for four other contrasts (with the CI including either 0.5 or 2, but not both): hydrogel versus foam (RoRR 0.81, 90% CI 0.45 to 1.47); protease‐modulating dressing versus foam (RoRR 1.29, 90% CI 0.56 to 2.94); protease‐modulating dressing versus hydrocolloid (RoRR 0.78, 90% CI 0.34 to 1.77) and iodine‐containing dressing versus hydrogel (RoRR 0.77, 90% CI 0.30 to 1.95).
However, all the CIs were wide and there was uncertainty around whether there was inconsistency or not.
We also compared inconsistency versus consistency assumptions for each contrast, examining any differences between different designs (3‐arm and 2‐arm), and between inconsistency and consistency NMA results (Table 11). We reported results only for contrasts with two 'core' interventions; there were no differences between models for 'peripheral' contrasts. Only one contrast had more than one type of design (hydrogel versus saline gauze) and there appeared to be large non‐significant differences in the results for different designs. One contrast had non‐significant differences between the NMA results using inconsistency and consistency assumptions (phenytoin versus saline gauze).
| Contrast | Design 1 | NMA results for design 1 | Design 2 | (NMA results for design 2 | NMA results |
| Foam versus saline gauze | 7 vs 1 (3 studies) | 1.53 (0.71 to 2.22) | NA | NA | 1.52 (1.03 to 1.85) |
| Hydrocolloid versus saline gauze | 8 vs 1 (4 studies) | 1.50 (0.9 to 1.92) | NA | NA | 1.43 (1.00 to 1.70) |
| Hydrogel versus saline gauze | 10 vs 1 (2 studies; heterogeneity) | 1.16 (0.51 to 1.73) | 10 vs 1 vs 14 (one 3‐arm study) | 4.22 (1.26 to 7.65) | 1.55 (1.02 to 1.91) |
| Phenytoin versus saline gauze | NA | NA | 14 vs 1 vs 10 | 3.02 (0.86 to 5.56) | 1.28 (0.58 to 1.88) |
| Hydrocolloid versus collagenase | 8 vs 5 (2 studies) | 0.68 (0.35 to 0.95) | NA | NA | 0.68 (0.37 to 0.91) |
| Hydrocolloid versus foam | 8 vs 7 (6 studies) | 0.96 (0.67 to 1.13) | NA | NA | 0.94 (0.73 to 1.07) |
| Hydrogel versus foam | 10 vs 7 (1 study) | 0.90 (0.48 to 1.22) | NA | NA | 1.02 (0.74 to 1.2) |
| Protease‐modulating versus foam | 15 vs 7 (1 study) | 1.22 (0.58 to 1.76) | NA | NA | 1.08 (0.67 to 1.36) |
| Hydrogel versus hydrocolloid | 10 vs 8 (4 studies) | 1.11 (0.74 to 1.35) | NA | NA | 1.09 (0.83 to 1.24) |
| Iodine‐containing dressing versus hydrocolloid | 13 vs 8 (1 study) | 0.90 (0.35 to 1.43) | NA | NA | 0.76 (0.45 to 0.97) |
| Protease‐modulating versus hydrocolloid | 15 vs 8 (1 study) | 1.03 (0.5 to 1.46) | NA | NA | 1.15 (0.72 to 1.45) |
| Iodine‐containing dressing versus hydrogel | 13 vs 10 (1 study) | 0.64 (0.33 to 0.9) | NA | NA | 0.70 (0.43 to 0.88) |
| Phenytoin versus hydrogel | NA | NA | 14 vs 10 vs 1 | 0.71 (0.33 to 1.04) | 0.82 (0.42 to 1.14) |
8.1.2. Inconsistency in the network as a whole
We conducted both consistency and inconsistency analyses. The latter showed that the six inconsistency parameters (IP) for the individual network were as follows:
(1) IP = 0: design is the 3‐arm trial comparing saline gauze versus hydrogel versus phenytoin
(2) IP = 0: design is 2‐arm trials comparing foam and hydrocolloid
(3) IP = 0: design is 2‐arm trials comparing foam and hydrogel
(4) IP = 0: design is 2‐arm trials comparing hydrocolloid and hydrogel
(5) IP = 0: design is 2‐arm trials comparing hydrogel and protease‐modulating dressings
(6) IP = 0: design is 2‐arm trials comparing hydrogel and iodine‐containing dressings
The global Wald test for inconsistency gave: Chi²(6) = 3.59 and P value 0.7314.
8.2 Group network
8.2.1. Inconsistency for each contrast (local inconsistency)
Inconsistency factors are reported as the RoRR with its 90% CI in Table 12. There are two loops, basic dressing ‐ advanced dressing ‐ phenytoin; and basic dressing ‐ advanced dressing ‐ protease‐modulating dressing. At the 90% significance level, there did not appear to be inconsistency in these loops, but the results suggested some non‐significant potential inconsistency in both loops (because the 90% CI crossed 2): for the loop containing phenytoin, the RoRR was 3.04 (0.71 to 13.06) and for the loop containing protease‐modulating dressing the RoRR was 1.36 (0.39 to 4.73).
| Loop | Ratio of RR (90% CI) | P value | Loop heterogeneity ‐ tau² |
| Basic dressing ‐ advanced dressing ‐ phenytoin | 3.04 (0.71 to 13.06) | 0.210 | 0.085 |
| Basic dressing ‐ advanced dressing ‐ protease‐modulating dressing | 1.36 (0.39 to 4.73) | 0.682 | 0.091 |
The results following node‐splitting are shown in Table 13 for five (of 11) direct contrasts. The results suggested that there may be inconsistency at the 90% confidence level for two contrasts: phenytoin versus basic dressing (RoRR 12.51, 90% CI 1.87 to 83.55; P = 0.029) and phenytoin versus advanced dressing (RoRR 0.08, 90% CI 0.01 to 0.53; P = 0.029). However, the CIs were wide.
| Contrast | Direct evidence RR (95% CI) | Indirect evidence RR (95% CI) | RR direct/RR indirect (90% CI) | P value | Tau² |
| Advanced dressing versus basic dressing | 1.41 (0.96 to 2.09) | 1.10 (0.33 to 3.73) | 1.28 (90% CI 0.44 to 3.76) | 0.705 | 0.221791 |
| Phenytoin versus basic dressing | 3.02 (0.97 to 9.38) | 0.24 (0.06 to 1.02) | 12.51 (90% CI 1.87 to 83.55) | 0.029 | 0.048414 |
| Protease‐modulating dressing versus basic dressing | 1.25 (0.4 to 3.87) | 1.60 (0.87 to 2.95) | 0.78 (90% CI 0.27 to 2.3) | 0.707 | 0.221734 |
| Phenytoin versus advanced dressing | 0.71 (0.41 to 1.25) | 8.94 (0.96 to 83.43) | 0.08 (90% CI 0.01 to 0.53) | 0.029 | 0.048424 |
| Protease‐modulating dressing versus advanced dressing | 1.13 (0.71 to 1.79) | 0.88 (0.27 to 2.92) | 1.28 (90% CI 0.44 to 3.76) | 0.706 | 0.221781 |
We also compared inconsistency versus consistency assumptions for each contrast, examining any differences between different designs (3‐arm and 2‐arm), and between inconsistency and consistency NMA results (Table 14). Results were reported only for contrasts with two 'core' interventions; there were no differences between models for 'peripheral' contrasts. Only one contrast had more than one type of design (advanced dressings versus basic dressings) and there appeared to be large non‐significant differences in the results for different designs. One contrast had non‐significant differences between the NMA results using inconsistency and consistency assumptions (phenytoin versus basic dressings).
| Contrast | Design 1 | NMA results for design 1 | Design 2 | NMA results for design 2 | NMA results |
| Advanced dressing versus basic dressing | 2 vs 1 (10 studies; heterogeneity) | 1.21 (0.88 to 1.67) | 2 vs 1 vs 7 (1 study) | 4.22 (1.41 to 12.68) | 1.36 (0.95 to 1.93) |
| Phenytoin versus basic dressing | NA | NA | 7 vs 1 vs 2 (1 study) | 3.02 (0.96 to 9.44) | 1.12 (0.52 to 2.44) |
| Protease‐modulating dressing versus basic dressing | 8 vs 1 (1 study) | 1.25 (0.44 to 3.59) | NA | NA | 1.49 (0.91 to 2.46) |
| Phenytoin versus advanced dressing | NA | NA | 7 vs 2 vs 1 (1 study) | 0.71 (0.4 to 1.27) | 0.83 (0.43 to 1.59) |
| Protease‐modulating dressing versus advanced dressing | 8 vs 2 (3 studies) | 1.12 (0.78 to 1.62) | NA | NA | 1.10 (0.74 to 1.64) |
8.2.2. Inconsistency in the network as a whole
There were two inconsistency parameters (IP) for the group network:
IP = 0: design is the 3‐arm trial comparing basic dressing, advanced dressing and phenytoin
IP = 0: design is the 2‐arm trial comparing advanced dressing and protease‐modulating dressing
The global Wald test for inconsistency gave: Chi²(2) = 4.66 and P‐value 0.0975. This is borderline significant at the 90% confidence level.
Appendix 10. Ranking interventions
Data for each intervention were shown as the probability that each intervention is the best, second best, third best treatment, etc. (see Figure 5, and Table 15). There was substantial overlap of the individual rankograms, illustrated in Figure 15, which intentionally shows the confusion, together with some indication that dextranomer and tripeptide copper gel may be the best treatments and that the worst treatments may be the sequential hydrocolloid‐alginate dressings and sugar plus egg white. Across all treatments there was considerable uncertainty in the ranking of interventions and no intervention had more than 50% probability of being the best treatment. This, together with the mean rank being no higher than 3.6 and no lower than 18.6 (out of 21), and no SUCRA value being 0 or 1, reinforces our view of the considerable uncertainty around treatment estimates in this network.

Rankograms combined ‐ individual network
Key to interventions: 1: saline gauze; 2: alginate dressing; 3: sequential hydrocolloid alginate dressings; 4: basic wound contact dressing; 5: collagenase ointment; 6: dextranomer; 7: foam dressing; 8: hydrocolloid dressing; 9: hydrocolloid +/‐ alginate (hydrocolloid dressing with/without alginate filler); 10: hydrogel dressing; 11: ineligible radiant heat; 12: ineligible skin substitute; 13: iodine‐containing dressing; 14: phenytoin; 15: protease‐modulating dressing; 16: PVP + zinc oxide
17: silicone + foam dressing; 18: soft polymer dressing; 19: sugar + egg white; 20: tripeptide copper gel; 21: vapour‐permeable dressing
| Intervention | Mean rank | SUCRA | Probability | Rank at maximum |
| Saline gauze | 16.3 | 0.2 | 16.2 | 17 |
| Alginate dressing | 12.4 | 0.4 | 10.8 | 19 |
| Sequential hydrocolloid alginate dressings | 18.6 | 0.1 | 34.6 | 21 |
| Basic wound contact dressing | 12.4 | 0.4 | 11.6 | 15 |
| Collagenase ointment | 6.9 | 0.7 | 13.5 | 6 |
| Dextranomer | 3.5 | 0.9 | 40.8 | 1 |
| Foam dressing | 10.3 | 0.5 | 15.0 | 10 |
| Hydrocolloid dressing | 11.6 | 0.5 | 18.6 | 11 |
| Hydrocolloid with/without alginate filler | 11.9 | 0.5 | 12.4 | 21 |
| Hydrogel | 9.9 | 0.6 | 14.9 | 10 |
| Ineligible intervention ‐ radiant heat | 11.4 | 0.5 | 12.8 | 20 |
| Ineligible intervention ‐ skin substitute | 6.6 | 0.7 | 15.0 | 4 |
| Iodine‐containing dressing | 15.3 | 0.3 | 13.4 | 17 |
| Phenytoin | 12.6 | 0.4 | 9.4 | 16 |
| Protease‐modulating dressing | 9.3 | 0.6 | 11.8 | 8 |
| PVP + zinc oxide | 11.8 | 0.5 | 8.1 | 20 |
| Silicone + foam dressing | 8.9 | 0.6 | 10.0 | 2 |
| Soft polymer dressing | 11.9 | 0.5 | 7.7 | 16 |
| Sugar + egg white | 14.4 | 0.3 | 31.8 | 21 |
| Tripeptide copper gel | 3.7 | 0.9 | 25.3 | 1 |
| Vapour‐permeable dressing | 11.4 | 0.5 | 8.9 | 13 |
Appendix 11. Time to event data: direct evidence
The duration of follow‐up ranged from 3 to 26 weeks, but the distribution was insufficient to allow modelling of time dependence in the network.
Seven studies (Alm 1989; Brod 1990; Graumlich 2003; Muller 2001; Payne 2009; Thomas 2005; Xakellis 1992) reported time‐to‐event data. We calculated the hazard ratio using the method and spreadsheet from Tierney 2007; one study (Xakellis 1992) reported the hazard ratio directly, adjusted for exudate level. The time‐to‐healing data are shown in Analysis 3.1 and summary statistics for the time‐to‐healing and the proportion healed are compared in Table 16 for the studies that report both healing outcomes.
| Contrast | Study | Risk ratio (95% CI) | Hazard ratio (95% CI) | Median times to healing |
| Hydrocolloid versus saline gauze | (6 weeks) | 3.43 (1.32 to 8.89) | 1.88 (0.80 to 4.45) | |
| Xakellis 1992 | 1.04 (0.82 to 1.32) | 1.67 (0.81 to 3.45) | 9 days versus 11 days | |
| Meta‐analysis of 2 studies in 95 participants (Alm 1989; Xakellis 1992) ‐ selected | Meta‐analysis: 1.72 (0.54 to 5.47) I² = 82%, P = 0.02 | Meta‐analysis: 1.75 (95% CI 1.00 to 3.05 I² = 0%, P = 0.84 | ||
| Hydrogel versus hydrocolloid | Brod 1990 (8 weeks) | 1.11 (0.74 to 1.67) | 1.30 (0.54 to 3.13) | 32 days versus 42 days (P = 0.56); Kaplan‐Meier curves crossing |
| Protease‐modulating dressing versus hydrocolloid | Graumlich 2003 (8 weeks) | 1.03 (0.64 to 1.66) | 1.34 (0.67 to 2.65) | 4 weeks and 7 weeks (estimated from Kaplan‐Meier plot); protease‐modulating dressing had more healing from 5 weeks |
| Collagenase ointment versus hydrocolloid | Muller 2001 (16 weeks ‐ probably) | 1.57 (0.95 to 2.61) | 2.58 (1.00 to 6.65) | |
| Hydrocolloid +/‐ alginate versus ineligible: radiant heat | Thomas 2005 (12 weeks) | 0.92 (0.41 to 2.06) | 0.64 (0.23 to 1.77) | > 90 days and 70 days (estimated from Kaplan‐Meier plot); radiant heat had consistently more healing at all time points |
| Foam versus saline gauze | Payne 2009 (4 weeks) | 1.33 (0.62 to 2.88) | 1.12 (0.42 to 3.01) |
In the individual network, two studies in 95 participants suggested that the time to healing may have been quicker for hydrocolloid versus saline gauze (HR 1.75, 95% CI 1.00 to 3.05); there was no heterogeneity (unlike the risk ratio). One study in 24 participants suggested healing may have been quicker for collagenase ointment compared with hydrocolloid (HR 2.58, 95% CI 1.00 to 2.65). In the other studies, the CI showed much uncertainty.
There was some suggestion of a time dependent effect because there were qualitative and quantitative differences between the HR and the RR: for shorter studies (4‐6 weeks), the HR gave a smaller effect than the RR, but for the medium and longer term studies the HR gave a larger effect than the RR, suggesting that wounds that heal do so relatively quickly.
For the group network, time‐to‐healing data are shown in Analysis 4.1. Three studies in 131 participants suggested that the time to healing may have been quicker for advanced dressing versus basic dressing (HR 1.57, 95% CI 0.97 to 2.55); there was no heterogeneity. This compared with the same three studies analysed as the proportion healed: RR (random‐effects) 1.48 (95% CI 0.79 to 2.77); I² = 66%, P = 0.05.
Appendix 12. Sensitivity analyses
We conducted pre‐specified sensitivity analyses for the individual network and a post‐hoc sensitivity analysis for both networks.
11.1. Sensitivity analysis by risk of bias (individual network)
The planned sensitivity analysis for risk of bias was to restrict the network to those studies at low or unclear risk of bias. Only 12 studies with 13 interventions remained and these formed three isolated loops.
Instead we conducted a sensitivity analysis which excluded studies that had high risk of bias for two or more domains (very high risk of bias) ‐ we excluded seven studies from the joined network (Bale 1997a; Banks 1994a; Brown‐Etris 1996; Burgos 2000b; Payne 2004; Ramos‐Torrecillas 2015; Thomas 2005); one further study (Serena 2010) was no longer joined into the network. This left 31 studies with 35 comparisons, including 18 interventions and 1513 participants (i.e. 51% of the participants in the full network and 72% of the joined network participants).
The NMA results for interventions versus saline gauze are shown in Table 17 alongside the original data. There were only minor differences. The mean rank order was similar to the original data (Table 17) and the rankograms similarly indicated much imprecision.
| Risk ratio (95% CI) intervention versus saline gauze | Mean rank (of 21 interventions unless otherwise stated) | |||||
| Intervention | Original | Sensitivity analysis 1. Very high risk of bias | Sensitivity analysis 2. Complete case | Original saline 16.3 | Sensitivity analysis 1. Very high risk of bias | Sensitivity analysis 2. Complete case saline = 16.3 |
| Alginate dressing | 1.10 (0.11 to 10.57) | 1.14 (0.11 to 11.45) | 1.08 (0.11 to 10.69) | 12.4 | 11 | 12.6 |
| Sequential hydrocolloid | s0.50 (0.12 to 1.99) | 0.52 (0.12 to 2.20) | 0.51 (0.12 to 2.1) | 18.6 | 15.8 | 18.5 |
| Basic wound contact dressing | 1.30 (0.65 to 2.59) | 1.33 (0.61 to 2.93) | 1.44 (0.76 to 2.73) | 12.4 | 10.6 | 11.1 |
| Collagenase ointment | 2.11 (1.06 to 4.21) | 2.35 (1.02 to 5.44) | 2.01 (0.98 to 4.12) | 6.9 | 5.2 | 7.4 |
| Dextranomer | 4.75 (0.86 to 26.34) | 5.29 (0.87 to 32.26) | 4.51 (0.79 to 25.88) | 3.5 | 2.9 | 3.8 |
| Foam dressing | 1.52 (1.03 to 2.26) | 1.56 (1 to 2.43) | 1.45 (0.97 to 2.15) | 10.3 | 9 | 11.2 |
| Hydrocolloid dressing | 1.43 (1 to 2.05) | 1.50 (0.99 to 2.26) | 1.47 (1.02 to 2.12) | 11.6 | 9.7 | 11.1 |
| Hydrocolloid with/without | 1.23 (0.06 to 24.86) | not in network | 1.33 (0.06 to 27.37) | 11.9 | not in network | 11.5 |
| Hydrogel dressing | 1.55 (1.02 to 2.36) | 1.74 (1.09 to 2.77) | 1.56 (1.02 to 2.37) | 9.9 | 7.5 | 9.8 |
| Ineligible: radiant heat | 1.34 (0.08 to 23.53) | 1.39 (0.07 to 25.76) | 1.62 (0.09 to 29.28) | 11.4 | not in network | 10.2 |
| Ineligible: skin substitute | 2.12 (1.05 to 4.28) | not in network | 1.92 (0.91 to 4.02) | 6.6 | 9.8 | 7.6 |
| Iodine‐containing dressing | 1.08 (0.58 to 2.02) | 1.19 (0.6 to 2.38) | 1.13 (0.58 to 2.18) | 15.3 | 12.1 | 14.7 |
| Phenytoin | 1.28 (0.58 to 2.81) | 1.66 (0.71 to 3.89) | 1.3 (0.57 to 2.96) | 12.6 | 8.6 | 12.4 |
| Protease‐modulating dressing | 1.64 (0.92 to 2.93) | 1.71 (0.89 to 3.26) | 1.63 (0.89 to 2.97) | 9.3 | 7.9 | 9.4 |
| PVP + ZnO | 1.32 (0.37 to 4.64) | 1.37 (0.36 to 5.19) | 1.30 (0.35 to 4.78) | 11.8 | 10.2 | 11.9 |
| Combined silicone foam dressing | 1.93 (0.37 to 9.92) | not in network | 1.74 (0.33 to 9.32) | 8.9 | not in network | 9.7 |
| Soft polymer dressing | 1.35 (0.56 to 3.27) | 1.39 (0.53 to 3.63) | 1.29 (0.52 to 3.23) | 11.9 | 10.2 | 12.3 |
| Sugar + egg white | 0.70 (0.03 to 15.6) | 0.78 (0.03 to 18.33) | 0.67 (0.03 to 15.11) | 14.4 | 12 | 14.6 |
| Tripeptide copper gel | 3.88 (1.03 to 14.56) | 2.78 (0.90 to 8.58) | 3.89 (1.01 to 15) | 3.7 | 4.8 | 3.8 |
| Vapour‐permeable dressing | 1.44 (0.74 to 2.8) | 1.51 (0.70 to 3.25) | 1.48 (0.72 to 3.04) | 11.4 | 9.5 | 11 |
The global Wald test for inconsistency was not significant ‐ the P value was 0.761, which was very similar to the original analysis (P = 0.731). The point estimates for node splitting gave smaller ratios of RRs than the original for the contrasts previously showing inconsistencies: phenytoin versus saline gauze RoRR 1.97 (90% CI 0.33 to 11.87) and phenytoin versus hydrogel RoRR 0.96 (95% CI 0.47 to 1.94). These RoRRs were no longer significant at the 90% confidence level.
11.2. Sensitivity analysis by missing data assumption (individual network)
We conducted a sensitivity analysis using a different assumption regarding missing data: the original assumption was an intention‐to‐treat analysis with imputation that missing data had no event. This sensitivity analysis used an available case analysis assumption: data were reported for 22 of the 39 studies (Bale 1997a; Banks 1994b; Banks 1994a; Banks 1994c; Barrois 1992; Brod 1990; Brown‐Etris 1996; Darkovich 1990; Graumlich 2003; Hondé 1994; Kraft 1993; Matzen 1999; Meaume 2003; Muller 2001; Payne 2009; Price 2000; Seeley 1999; Sopata 2002; Thomas 1997a; Thomas 1998; Thomas 2005; Xakellis 1992). For this analysis, the 39 studies had data on 1838 participants (i.e. 87%).
The NMA results for the sensitivity analysis are shown in Table 17 alongside the original data. Differences were only small. The mean rank order was similar to the original data (Table 17). The Wald test for inconsistency was not significant ‐ the P value was 0.638, which was similar to the original analysis (P = 0.731).
The global Wald test for inconsistency was not significant ‐ the P value was 0.638, which was similar to the original analysis (P = 0.731). The point estimates for node splitting gave similar RoRRs.
11.3 Post‐hoc sensitivity analysis ‐ dressings only (both individual and group networks)
For the individual network, we also investigated, post‐hoc, our original assumption that topical agents could be used in place of dressings, by examining only the network of studies involving two or more dressings (or hydrogel). There were no three‐arm trials remaining and the 30 studies compared 12 interventions in a total of 1627 participants experiencing 641 events, with 16 direct contrasts and 66 mixed treatment contrasts. The NMA rankings were similarly imprecise (data not shown).
For the group network, 17 studies compared five interventions in a total of 798 participants experiencing 304 events, with five direct contrasts and 10 mixed treatment contrasts. This network was still sparse in terms of total participants, but, on average, there were more events per contrast. The post‐hoc sensitivity analysis had less overlap of rankograms (data not shown) than the full group network, and the mean rank was closer to a whole number; one SUCRA value was 0 and another was 0.9. The mean ranks were: protease‐modulating 1.4; advanced 1.9; basic 3.1; antimicrobial 3.7: advanced‐antimicrobial 4.9. For the comparisons with basic dressing, effect estimates were similar to those in Table 3 but CIs were still wide.
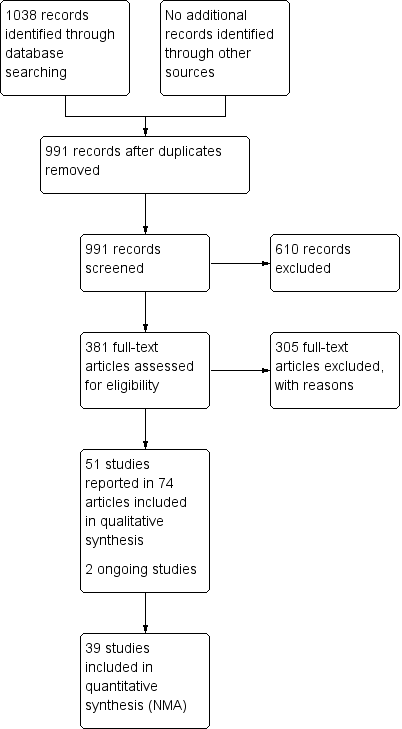
Study flow diagram

Network diagram ‐ individual interventions, by risk of bias (3 categories)
Key: green = low/unclear; yellow = high; red = very high overall risk of bias for the contrast. The number of studies for each contrast is given in Table 2.

Risk of bias summary: review authors' judgements about each risk of bias item for each included study
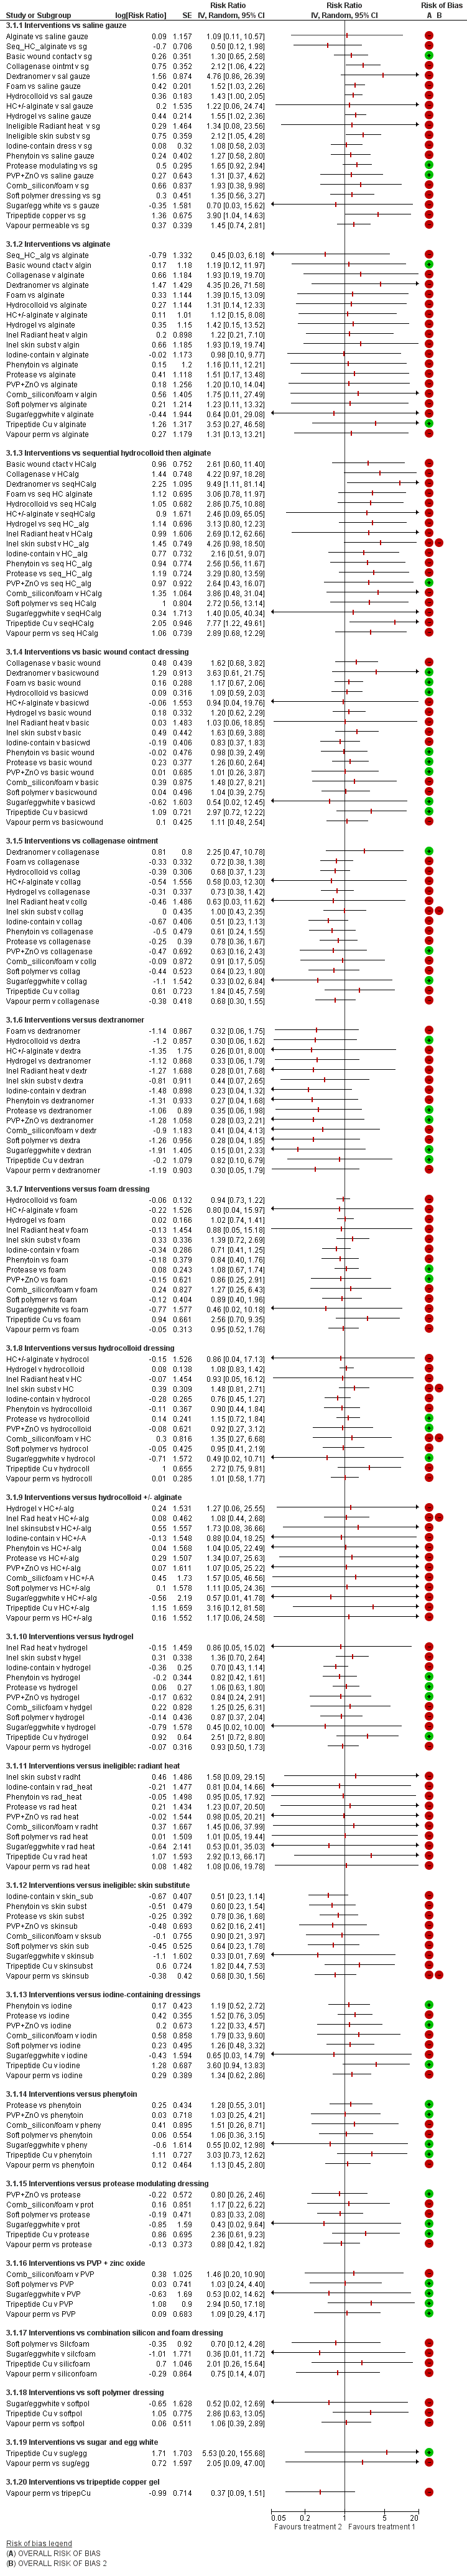
NMA results: individual intervention 1 versus individual intervention 2
Key for overall risk of bias for the contrast: green = low/unclear; one red = high; two reds = very high

Rankograms for each intervention ‐ individual network

Funnel plot ‐ individual network
Key to interventions: 1: saline gauze; 2: alginate dressing; 3: sequential hydrocolloid alginate dressings; 4: basic wound contact dressing; 5: collagenase ointment; 6: dextranomer; 7: foam dressing; 8: hydrocolloid dressing; 9: hydrocolloid +/‐ alginate (hydrocolloid dressing with/without alginate filler); 10: hydrogel dressing; 11: ineligible radiant heat; 12: ineligible skin substitute; 13: iodine‐containing dressing; 14: phenytoin; 15: protease‐modulating dressing; 16: PVP + zinc oxide 17: silicone + foam dressing; 18: soft polymer dressing; 19: sugar + egg white; 20: tripeptide copper gel; 21: vapour‐permeable dressing
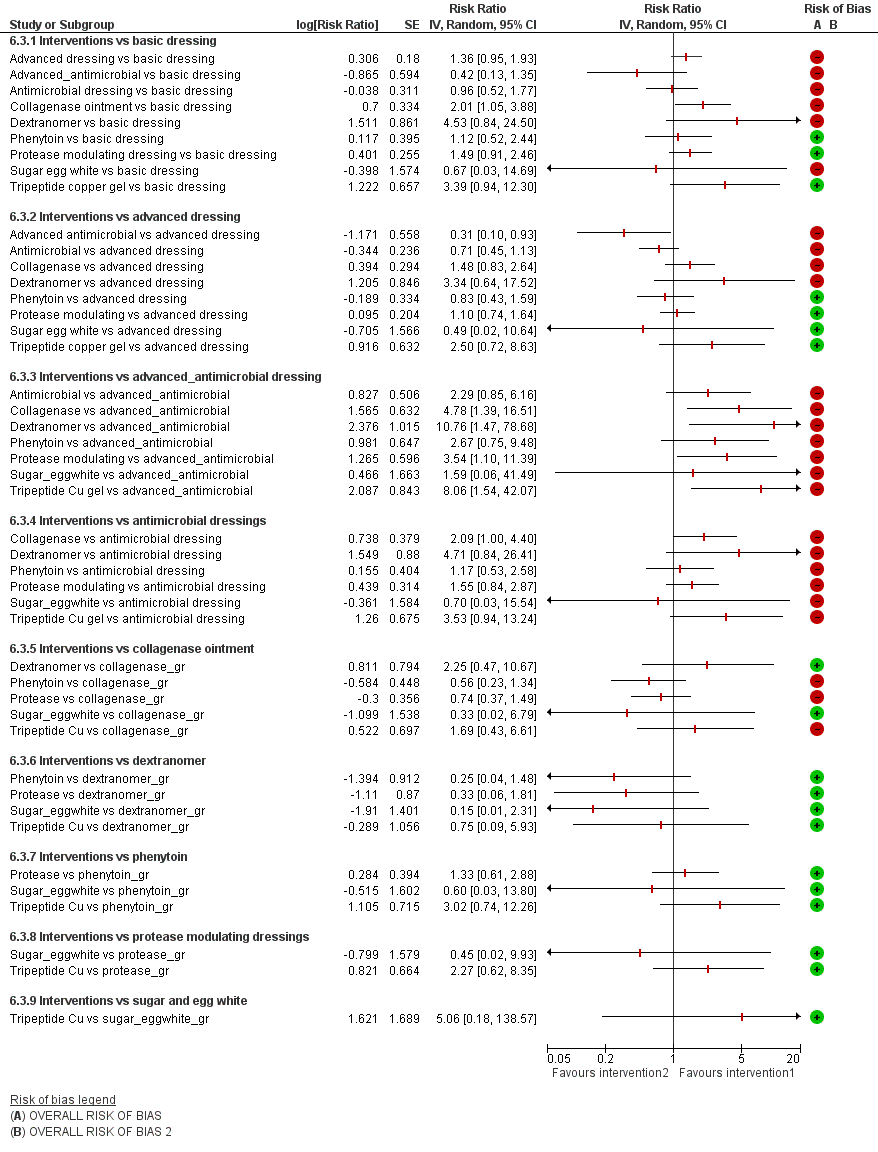
Intervention 1 versus intervention 2 ‐ group network
Key for overall risk of bias for the contrast: green = low/unclear; one red = high; two reds = very high

Rankograms combined ‐ group network

Funnel plot ‐ group network
Key to interventions: 1: basic dressing; 2: advanced dressing; 3: advanced or antimicrobial dressing; 4: antimicrobial dressing;
5: collagenase ointment; 6: dextranomer; 7: phenytoin; 8: protease‐modulating dressing; 9: sugar + egg white; 10: tripeptide copper gel
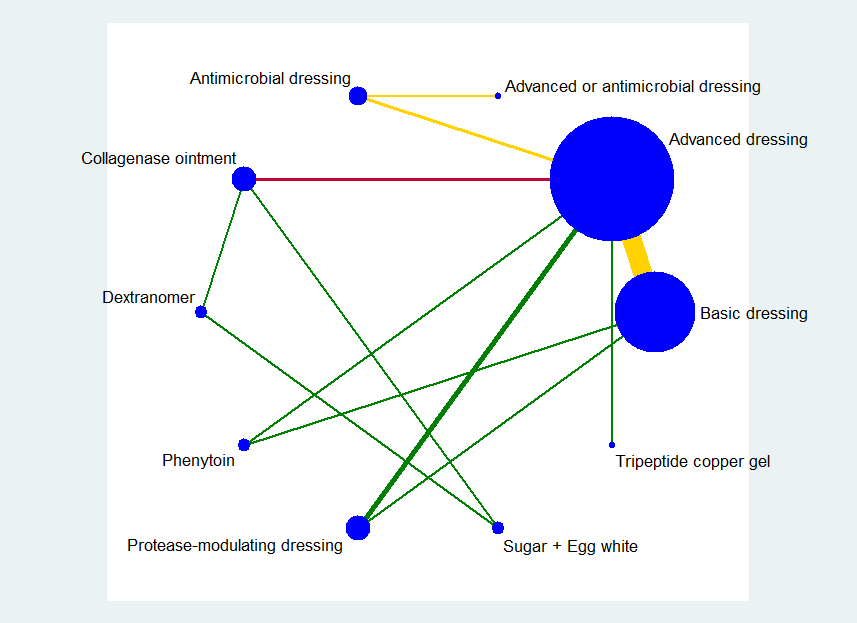
Key: green = low/unclear risk of bias; yellow = high risk of bias; red = very high overall risk of bias for the contrast. The number of studies for each contrast is given in Table 4.
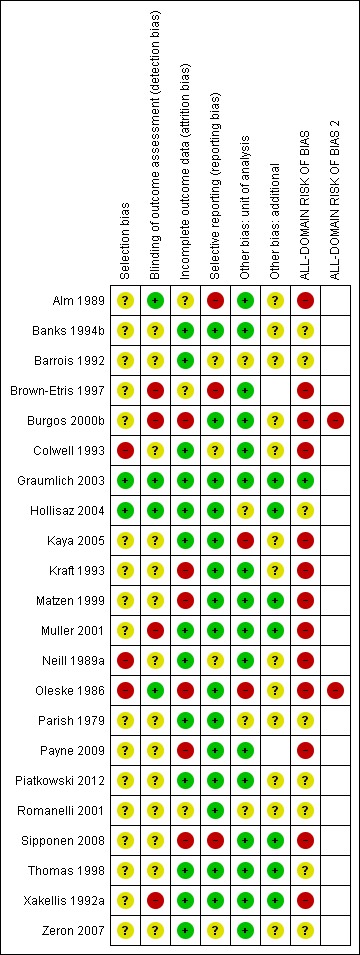
Risk of bias summary ‐ group network: review authors' judgements about each risk of bias item for each included study

Group network ‐ rankograms
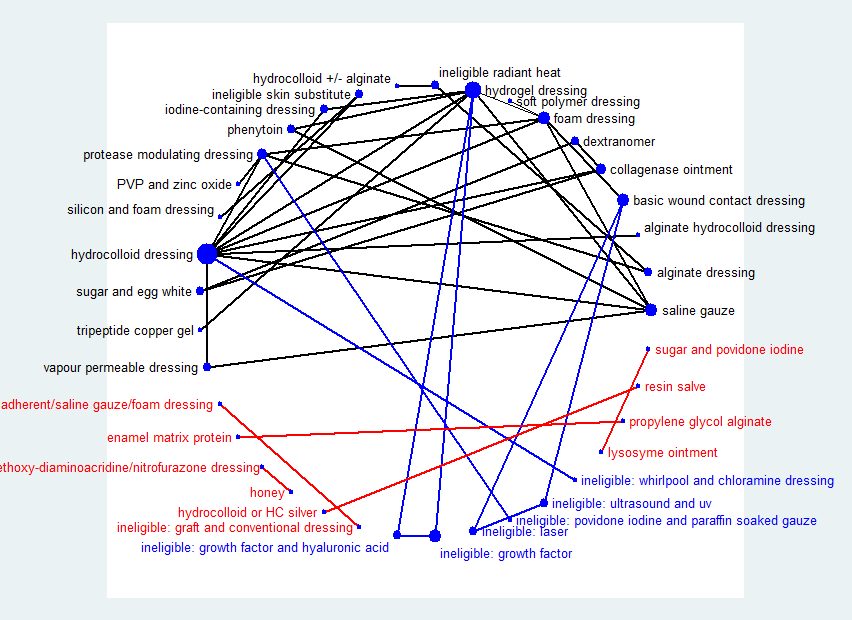
Network diagram ‐ all interventions
Key: red = isolated interventions; blue = ineligible interventions joined to only one eligible intervention. Line and node weights not to scale
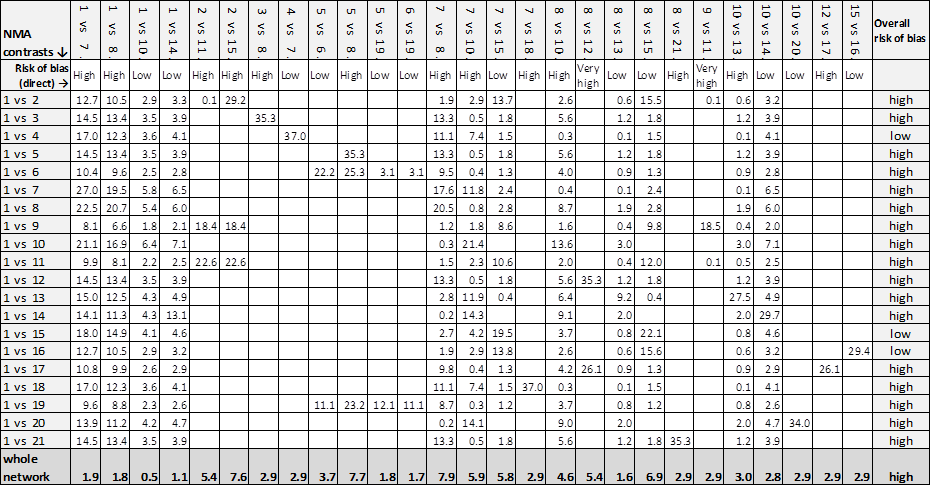
Contributions matrix ‐ interventions versus saline gauze (independent network)
Key: 1 = saline gauze dressing; 2 = alginate dressing; 3 = sequential hydrocolloid alginate dressings; 4 = basic wound contact dressing; 5 = collagenase ointment; 6 = dextranomer; 7 = foam dressing; 8 = hydrocolloid dressing; 9 = hydrocolloid +/‐ alginate (hydrocolloid with/without alginate filler); 10 = hydrogel dressing; 11 = ineligible intervention: radiant heat; 12 = ineligible intervention: skin substitute; 13 = iodine‐containing dressing; 14 = phenytoin; 15 = protease‐modulating dressing; 16 = PVP + zinc oxide; 17 = silicone + foam dressing; 18 = soft polymer dressing; 19 = sugar + egg white; 20 = tripeptide copper gel; 21 = vapour‐permeable dressing.

Rankograms combined ‐ individual network
Key to interventions: 1: saline gauze; 2: alginate dressing; 3: sequential hydrocolloid alginate dressings; 4: basic wound contact dressing; 5: collagenase ointment; 6: dextranomer; 7: foam dressing; 8: hydrocolloid dressing; 9: hydrocolloid +/‐ alginate (hydrocolloid dressing with/without alginate filler); 10: hydrogel dressing; 11: ineligible radiant heat; 12: ineligible skin substitute; 13: iodine‐containing dressing; 14: phenytoin; 15: protease‐modulating dressing; 16: PVP + zinc oxide
17: silicone + foam dressing; 18: soft polymer dressing; 19: sugar + egg white; 20: tripeptide copper gel; 21: vapour‐permeable dressing

Comparison 1 Direct evidence: individual interventions, number with complete healing, Outcome 1 Interventions vs saline gauze.

Comparison 1 Direct evidence: individual interventions, number with complete healing, Outcome 2 Interventions vs hydrocolloid.

Comparison 2 Direct evidence group intervention, number with complete healing, Outcome 1 Intervention 1 vs intervention 2.

Comparison 3 Direct evidence: individual interventions, time‐to‐healing data, Outcome 1 Time‐to‐healing (survival analysis).

Comparison 4 Direct evidence: group interventions, time‐to‐healing data, Outcome 1 Time‐to‐healing (survival analysis).

Comparison 5 Direct evidence ‐ non‐network comparisons, Outcome 1 Intervention 1 vs intervention 2.
| NMA evidence for individual network: proportion with complete healing ‐ interventions versus saline gauze | ||||
| Patient or population: people with pressure ulcers Settings: hospital, community or care home, or combinations | ||||
| Contrasts: interventions versus saline gauze | Relative effect | Anticipated absolute effects* (95% CI) ‐ from median of saline gauze control groups in direct evidence | Certainty (quality) of | |
| Median CGR | With interventions | |||
| Alginate dressings | RR 1.09 | 157 per 1000 | 171 per 1000 (17 to 1000) | ⊕⊝⊝⊝ |
| 14 more people healed per 1000 (140 fewer to 1000 more) | ||||
| Sequential hydrocolloid alginate dressings | RR 0.50 | 157 per 1000 | 78 per 1000 (1.9 to 31.2) | ⊕⊝⊝⊝ |
| 79 fewer people healed per 1000 (138 fewer to 155 more) | ||||
| Basic wound contact dressings | RR 1.30 | 157 per 1000 | 204 per 1000 (102 to 407) | ⊕⊕⊝⊝ |
| 47 more people healed per 1000 (55 fewer to 250 more) | ||||
| Collagenase ointment | RR 2.12 | 157 per 1000 | 333 per 1000 (166 to 663) | ⊕⊕⊝⊝ |
| 176 more people healed per 1000 (9 more to 506 more) | ||||
| Dextranomer | RR 4.76 | 157 per 1000 | 747 per 1000 (135 to 1000) | ⊕⊝⊝⊝ |
| 590 more people healed per 1000 (22 fewer to 1000 more) | ||||
| Foam dressings | RR 1.52 | 157 per 1000 | 239 per 1,000 (162 to 353) | ⊕⊕⊝⊝ |
| 82 more people healed per 1,000 (5 more to 196 more) | ||||
| Hydrocolloid dressing | RR 1.22 | 157 per 1000 | 192 per 1,000 (9 to 1000) | ⊕⊝⊝⊝ |
| 35 more people healed per 1,000 (148 fewer to 1000 more) | ||||
| Hydrocolloid dressings | RR 1.43 | 157 per 1000 | 225 per 1000 (157 to 322) | ⊕⊝⊝⊝ |
| 68 more people healed per 1000 (from 0 fewer to 165 more) | ||||
| Hydrogel | RR 1.55 | 157 per 1000 | 243 per 1000 (160 to 371) | ⊕⊝⊝⊝ |
| 86 more people healed per 1000 (from 3 more to 214 more) | ||||
| Iodine‐containing dressings | RR 1.08 | 157 per 1000 | 170 per 1000 (91 to 316) | ⊕⊝⊝⊝ |
| 13 more people healed per 1000 (from 66 fewer to 159 more) | ||||
| Phenytoin | RR 1.27 | 157 per 1000 | 199 per 1000 (91 to 440) | ⊕⊝⊝⊝ |
| 42 more people healed per 1000 (from 66 fewer to 283 more) | ||||
| Protease‐modulating dressings | RR 1.65 | 157 per 1000 | 259 per 1,000 (144 to 462) | ⊕⊕⊕⊝ |
| 102 more people healed per 1000 (from 13 fewer to 305 more) | ||||
| Polyvinylpyrrolidone + zinc oxide | RR 1.31 | 157 per 1000 | 206 per 1,000 (58 to 732) | ⊕⊕⊝⊝ |
| 49 more people healed per 1000 (from 99 fewer to 575 more) | ||||
| Combination silicone foam dressings | RR 1.93 | 157 per 1000 | 303 per 1,000 (60 to 1,000) | ⊕⊝⊝⊝ |
| 146 more people healed per 1000 (from 97 fewer to 1,000 more) | ||||
| Soft polymer dressings | RR 1.35 | 157 per 1000 | 212 per 1,000 (86 to 517) | ⊕⊝⊝⊝ |
| 55 more people healed per 1000 (from 71 fewer to 360 more) | ||||
| Sugar + egg white | RR 0.70 | 157 per 1000 | 110 per 1000 (5 to 1,000) | ⊕⊝⊝⊝ |
| 47 fewer people healed per 1000 (from 152 fewer to 1000 more) | ||||
| Tripeptide copper gel | RR 3.90 | 157 per 1000 | 612 per 1000 (163 to 1000) | ⊕⊝⊝⊝ |
| 455 more people healed per 1000 (6 more to 1000 more) | ||||
| Vapour‐permeable dressings | RR 1.45 | 157 per 1000 | 228 per 1000 | ⊕⊝⊝⊝ |
| 71 more people healed per 1000 (from 39 fewer to 283 more) | ||||
| *The risk in the intervention group (and its 95% CI) is based on the assumed risk in the comparator group and the relative effect of the intervention (and its 95% CI). | ||||
| GRADE Working Group grades of evidence | ||||
| 1Majority of evidence at high risk of bias (downgraded once); imprecision: very wide CI (crosses 0.75 and 1.25) (downgraded twice). | ||||
| Study characteristic | Studies in the individual | Studies in both individual and group networks | Studies in the group network only | Studies included in neither network | |
| Publication (all others were full published papers) | Conference abstracts (5) | ||||
| Multiple interventions | > 2 arms (4) | Nussbaum 1994; Ramos‐Torrecillas 2015 (4 arms) | |||
| Unit of randomisation (all other studies randomised individuals) | Ulcers randomised (5) | ||||
| Cluster‐randomised (2) | |||||
| not stated (3) | |||||
| Funding | Industry funding (18) | Banks 1994c; Belmin 2002; Brod 1990; Brown‐Etris 2008; Hondé 1994; Motta 1999 | Banks 1994a; Burgos 2000b; Colwell 1993; Kraft 1993; Neill 1989a; Payne 2009; Piatkowski 2012; Thomas 1998 | ||
| Mixed industry and non industry (2) | |||||
| Non industry (10) | Brown‐Etris 1997; Hollisaz 2004; Kaya 2005; Muller 2001; Oleske 1986; Xakellis 1992 | ||||
| Not stated (21) | Aguilo Sanchez 2002; Bale 1997a; Brown‐Etris 1996; Darkovich 1990; Meaume 2003; Price 2000; Seeley 1999; Seeley 1999; Thomas 1997a; Thomas 2005 | Alm 1989; Banks 1994b; Barrois 1992; Matzen 1999; Parish 1979; Romanelli 2001; Zeron 2007 | |||
| Setting | Community only (6) | ||||
| Hospital only (20) | Bale 1997a; Banks 1994c; Belmin 2002; Hondé 1994; Sopata 2002 | Alm 1989; Burgos 2000b; Colwell 1993; Kaya 2005; Muller 2001; Oleske 1986; Piatkowski 2012; Zeron 2007 | Gorse 1987; Imamura 1989; Nisi 2005; Nussbaum 1994; Ramos‐Torrecillas 2015; Yapucu Güneş 2007 | ||
| Hospital and other setting (7) | Price 2000 (hospital and community); Darkovich 1990 (hospital and care home); Brown‐Etris 1996 (hospital and community and care home) | Banks 1994b (hospital and community); Kraft 1993; Neill 1989a (hospital and care home); Payne 2009 (hospital and community and care home) | Ashby 2012 (hospital and community) | ||
| Care home and community (5) | |||||
| Care home only (5) | |||||
| Not stated (7) | |||||
| Follow‐up time | < 6 weeks (8) | Oleske 1986; Parish 1979; Payne 2009; Piatkowski 2012; Zeron 2007 | |||
| 6 to 8 weeks (25) | Aguilo Sanchez 2002; Banks 1994c; Belmin 2002; Brod 1990; Brown‐Etris 2008; Hondé 1994; Meaume 2003; Motta 1999; Price 2000; Seeley 1999; Sopata 2002; Thomas 1997a; | Alm 1989; Banks 1994a; Barrois 1992; Brown‐Etris 1997; Graumlich 2003; Hollisaz 2004; Neill 1989a; Romanelli 2001 | Imamura 1989; Nisi 2005; Nussbaum 1994; Sebern 1986; Van De Looverbosch 2004 | ||
| > 8 to 12 weeks (10) | Banks 1994b; Burgos 2000b; Colwell 1993; Matzen 1999; Thomas 1998 | ||||
| ≥ 16 weeks (7) | |||||
| Unclear (1) | |||||
| Mean age | < 65 years (8) | ||||
| Not stated (1) | |||||
| Physical conditions | Spinal cord injuries (4) | ||||
| Other (2) | Sopata 2002 (advanced cancer) | Parish 1979 ("chronically ill or physically disabled") | |||
| Ulcer grade | Mainly Stage 2 (17) | Bale 1997a; Thomas 1997a (Stirling); Brown‐Etris 2008 (classification not stated); Darkovich 1990 (Enis and Sarmiento); Hondé 1994 (Shea); Meaume 2003 (EUPAP) | Colwell 1993 (classification not stated); Graumlich 2003; Kaya 2005; Payne 2009 (NPUAP); Hollisaz 2004; Neill 1989a; Xakellis 1992 (Shea); Kraft 1993 (Enterstomal Therapy); Oleske 1986 (Enis and Sarmiento) | Gorse 1987; Van De Looverbosch 2004 (classification not stated) | |
| Mainly Stage 3 (15) | Belmin 2002 (Yarkony); Seeley 1999 (AHCPR); Thomas 1997a (Stirling); Serena 2010 (NPUAP); Brown‐Etris 1996; Motta 1999; Price 2000; Thomas 2005 (classification not stated) | Burgos 2000b (classification not stated); Piatkowski 2012 (EPUAP) | Sipponen 2008 (EPUAP) | Ashby 2012; Ramos‐Torrecillas 2015; (EPUAP classification); Yapucu Güneş 2007 (AHCRQ); Payne 2004 (classification not stated) | |
| Mainly Stage 4 (2) | Matzen 1999; Muller 2001 (classification not stated) | ||||
| Other (12) | Banks 1994c (II/III); Sopata 2002 II/III (Torrance); Brod 1990 (II/III) (classification not stated) | Banks 1994a (II/III); Brown‐Etris 1997 (II/III/IV) (classification not stated); Banks 1994b (Torrance II/III); Romanelli 2001 (II/III); Zeron 2007(2/3) (NPUAP) | Nisi 2005 (2‐4); Rees 1999 (3/4) (NPUAP); Sebern 1986 (II/III) (Shea); Imamura 1989 (II/III/IV) (classification not stated) | ||
| Not stated (5) | |||||
| Ulcer duration (other studies had ≥ 3 months) | < 3 months (16) | Banks 1994c (median 7 days); Belmin 2002; Brown‐Etris 1996; Brown‐Etris 2008; Meaume 2003; Motta 1999; Seeley 1999; Sopata 2002 (mean 2.5 weeks); Thomas 1997a | Banks 1994a; Burgos 2000b; Colwell 1993; Graumlich 2003; Hollisaz 2004; Kraft 1993; Payne 2009 | ||
| ≥ 3 months (6) | |||||
| Not stated/unclear (29) | Aguilo Sanchez 2002; Bale 1997a; Brod 1990; Darkovich 1990; Hondé 1994; Price 2000; Thomas 2005 | Banks 1994b; Barrois 1992; Brown‐Etris 1997; Kaya 2005; Matzen 1999; Muller 2001; Neill 1989a; Oleske 1986; Parish 1979; Piatkowski 2012 (> 4 weeks); Romanelli 2001; Thomas 1998; Xakellis 1992; Zeron 2007 | Gorse 1987; Imamura 1989; Nisi 2005; Nussbaum 1994 (> 6 weeks); Sebern 1986; Van De Looverbosch 2004 (> 1 month); Yapucu Güneş 2007 | ||
| Contrast/comparison | Number | RR (95% CI) direct evidence Random‐effects (inverse variance) Heterogeneity statistics | NMA results (consistency assumption) RR (95% CI) |
| Hydrocolloid dressing versus saline gauze dressing | 4 (279) | 1.89 (0.91 to 3.93) Tau² = 0.35; P = 0.01; I² = 73% | 1.43 (1.00 to 2.05) |
| Hydrogel versus saline gauze dressing | 3 (110) | 2.44 (0.64 to 9.27) Tau² = 0.90; P = 0.03; I² = 71% | 1.55 (1.02 to 2.36) |
| Foam dressings versus saline gauze dressing | 3 (93) | 1.51 (0.78 to 2.90) P = 0.41; I² = 0% | 1.52 (1.03 to 2.26) |
| Phenytoin versus saline gauze dressing | 1 (40) | 3.02 (0.97 to 9.35) | 1.27 (0.58 to 2.80) |
| Hydrogel versus hydrocolloid dressings | 4 (322) | 1.11 (0.74 to 1.67) Tau² = 0.08; P = 0.11; I² = 51% | 1.08 (0.83 to 1.42) |
| Foam dressing versus hydrocolloid dressing | 6 (292) | 1.05 (0.81 to 1.36) Tau² = 0.00; P = 0.67; I² = 0% (Stata: 1.05 (0.73 to 1.23)) | 1.07 (0.82 to 1.38) |
| Collagenase ointment versus hydrocolloid dressing | 2 (61) | 1.51 (0.93 to 2.43) P = 0.61; I² = 0% | 1.48 (0.81 to 2.69) |
| Iodine‐containing dressing versus hydrocolloid dressing | 1 (76) | 0.90 (0.41 to 1.96) | 0.76 (0.45 to 1.27) |
| Protease‐modulating dressing versus hydrocolloid dressing | 1 (65) | 1.03 (0.64 to 1.66) | 1.15 (0.72 to 1.84) |
| Vapour‐permeable dressing versus hydrocolloid dressing | 1 (72) | 1.01 (0.69 to 1.47) | 1.01 (0.58 to 1.77) |
| Hydrocolloid dressing 4 weeks then alginate dressing 4 weeks versus hydrocolloid dressing (Belmin 2002) | 1 (110) | 0.35 (0.10 to 1.25) | 0.35 (0.09 to 1.33) |
| Ineligible intervention: skin substitute versus hydrocolloid dressing (Hondé 1994) | 1 (168) | 1.48 (0.95 to 2.32) | 1.48 (0.81 to 2.71) |
| Foam dressing versus hydrogel (Sopata 2002) | 1 (38) | 1.11 (0.80 to 1.54) | 0.98 (0.71 to 1.36) |
| Tripeptide copper versus hydrogel | 1 (12) | 2.50 (0.76 to 8.19) | 2.51 (0.72 to 8.80) |
| Iodine‐containing dressing versus hydrogel | 1 (49) | 0.64 (0.43 to 0.97) | 0.70 (0.43 to 1.14) |
| Phenytoin versus hydrogel (Hollisaz 2004) | 1 (39) | 0.71 (0.41 to 1.24) | 0.82 (0.42 to 1.61) |
| Foam dressing versus protease‐modulating dressing | 1 (10) | 0.82 (0.49 to 1.38) | 0.93 (0.57 to 1.49) |
| Alginate dressing versus protease‐modulating dressing (Brown‐Etris 1997) | 1 (36) | 0.67 (0.08 to 5.75) | 0.30 (0.07 to 1.25) |
| PVP + zinc oxide versus protease‐modulating dressing | 1 (24) | 0.80 (0.28 to 2.27) | 0.80 (0.26 to 2.46) |
| Soft polymer dressing versus foam dressing | 1 (38) | 0.89 (0.45 to 1.75) | 0.89 (0.40 to 1.96) |
| Combination silicone‐foam dressing versus ineligible intervention: skin substitute (Serena 2010) | 1 (74) | 0.91 (0.22 to 3.77) | 0.90 (0.21 to 3.97) |
| Hydrocolloid with/without alginate filler versus ineligible intervention: radiant heat (Thomas 2005) | 1 (41) | 0.92 (0.41 to 2.06) | 0.92 (0.37 to 2.27) |
| Collagenase ointment versus dextranomer | 1 (12) | 0.35 (0.05 to 2.26) (Stata 0.44 (0.10 to 2.02)) | 0.44 (0.09 to 2.13) |
| Collagenase ointment versus sugar + egg white | 1 (10) | 3.00 (0.15 to 59.89) (Stata 3.00 (0.15 to 59.79)) | 3.00 (0.15 to 61.59) |
| Dextranomer versus sugar + egg white | 1 (12) | 6.75 (0.44 to 102.80) | 6.75 (0.43 to 105.99) |
| Foam dressing versus basic wound contact dressing | 1 (50) | 1.17 (0.79 to 1.72) | 1.17 (0.67 to 2.06) |
| Alginate dressing versus ineligible intervention: radiant heat (Price 2000) | 1 (58) | 0.82 (0.15 to 4.55) | 0.82 (0.14 to 4.77) |
| NMA evidence for group network: proportion with complete healing ‐ interventions versus basic dressings | ||||
| Patient or population: people with pressure ulcers Settings: hospital, community or care home, or combinations | ||||
| Contrasts: interventions versus basic dressing | Relative effect (95% CI) | Anticipated absolute effects* (95% CI) ‐ from median of basic dressing control groups in direct evidence | Certainty (quality) of the | |
| Median CGR | With interventions | |||
| Advanced dressings versus basic dressing | RR 1.36 | 191 per 1000 | 260 per 1000 | ⊕⊝⊝⊝ |
| 69 more people healed per 1000 (from 10 fewer to 178 more) | ||||
| Advanced + antimicrobial dressing versus basic dressing | RR 0.42 | 191 per 1000 | 80 per 1000 | ⊕⊝⊝⊝ |
| 111 fewer people healed per 1000 (from 67 more to 166 fewer) | ||||
| Antimicrobial dressing versus basic dressing | RR 0.96 | 191 per 1000 | 183 per 1000 | ⊕⊝⊝⊝ |
| 8 fewer people healed per 1000 (from 92 fewer to 147 more) | ||||
| Collagenase ointment versus basic dressing | RR 2.01 | 191 per 1000 | 384 per 1000 | ⊕⊕⊝⊝ |
| 193 more people healed per 1000 (from 10 more to 550 more) | ||||
| Dextranomer versus basic dressing | RR 4.53 | 191 per 1000 | 865 per 1000 | ⊕⊝⊝⊝ |
| 674 more people healed per 1000 (from 31 fewer to 1,000 more) | ||||
| Phenytoin versus basic dressing | RR 1.12 | 191 per 1000 | 214 per 1000 | ⊕⊝⊝⊝ |
| 23 more people healed per 1000 (from 92 fewer to 275 more) | ||||
| Protease‐modulating dressing versus basic dressing | RR 1.49 | 191 per 1000 | 285 per 1000 | ⊕⊕⊕⊝ |
| 94 more people healed per 1000 (from 17 fewer to 279 more) | ||||
| Sugar + egg white versus basic dressing | RR 0.67 (0.03 to 14.69) | 191 per 1000 | 128 per 1000 | ⊕⊝⊝⊝ |
| 63 fewer people healed per 1000 (from 185 fewer to 1000 more) | ||||
| Tripeptide copper gel versus basic dressing | RR 3.39 | 191 per 1000 | 647 per 1000 | ⊕⊕⊝⊝ |
| 456 more people healed per 1000 (from 11 fewer to 1000 more) | ||||
| *The risk in the intervention group (and its 95% CI) is based on the assumed risk in the comparison group and the relative effect of the intervention (and its 95% CI). | ||||
| GRADE Working Group grades of evidence | ||||
| 1Majority of evidence at high risk of bias (downgraded once); inconsistency: heterogeneity in direct evidence (downgraded once); imprecision: wide CI (downgraded once). | ||||
| Individual intervention | Group intervention (studies in final network) |
| Basic wound contact dressing | Basic dressing (12 studies) |
| Saline gauze dressing | |
| Polyvinylpyrrolidone | |
| Hydrocolloid dressing | Advanced dressing (19 studies) |
| Foam dressing | |
| Hydrogel dressing | |
| Soft polymer dressing | |
| Alginate dressing | |
| Vapour‐permeable dressing | |
| Combination silicone foam dressing | |
| Hydrocolloid with/without alginate | |
| Standard care as described in Ashby 2012 | |
| Honey | Antimicrobial dressing (3 studies) |
| Iodine‐containing dressing | |
| Ethoxy diaminoacridine + nitrofurazone dressing | |
| Resin salve | |
| Hydrocolloid or hydrocolloid silver dressing | Advanced or antimicrobial dressing (1 study) |
| Protease‐modulating dressing | Protease‐modulating dressing (4 studies) |
| Collagenase ointment | Collagenase ointment (3 studies) |
| Dextranomer | Dextranomer (1 study) |
| Phenytoin topical | Phenytoin topical (1 study) |
| Sugar + egg white | Sugar + egg white (1 study) |
| Tripeptide copper gel | Tripeptide copper gel (1 study) |
| Contrast/comparison | Number | RR (95% CI) direct evidence Random‐effects (inverse variance) Heterogeneity statistics | NMA results (consistency assumption) RR (95% CI) |
| Advanced dressings versus basic dressings (Alm 1989; Banks 1994b; Colwell 1993; Hollisaz 2004; Kraft 1993; Matzen 1999; | 11 (532) | 1.55 (1.10 to 2.19) Tau² = 0.13; P = 0.02; I² = 52% | 1.36 (0.95 to 1.93) |
| Phenytoin versus basic dressing | 1 (40) | 3.02 (0.97 to 9.35) | 1.12 (0.52 to 2.44) |
| Protease‐modulating dressing versus basic dressing (Zeron 2007) | 1 (24) | 1.25 (0.44 to 3.55) | 1.49 (0.91 to 2.46) |
| Antimicrobial dressings versus advanced dressings (Barrois 1992; Kaya 2005) | 2 (125) | 0.69 (0.48 to 0.99) Tau² = 0.00; P = 0.46; I² = 0% | 0.71 (0.45 to 1.13) |
| Collagenase ointment versus advanced dressings | 2 (61) | 1.51 (0.93 to 2.43) Tau² = 0.00; P = 0.61 ; I² = 0% | 1.48 (0.83 to 2.64) |
| Phenytoin versus advanced dressing | 1 (39) | 0.71 (0.41 to 1.24) | 0.83 (0.43 to 1.59) |
| Protease‐modulating dressing versus advanced dressing (Brown‐Etris 1997; Graumlich 2003; Piatkowski 2012) | 3 (112) | 1.13 (0.80 to 1.60) Tau² = 0.00; P = 0.84 ; I² = 0% (Stata: 1.12 (0.79 to 1.59)) | 1.10 (0.74 to 1.64) |
| Tripeptide copper gel versus advanced dressing | 1 (12) | 2.50 (0.76 to 8.19) | 2.50 (0.72 to 8.63) |
| Antimicrobial dressing versus advanced antimicrobial dressing (Sipponen 2008) | 1 (37) | 2.29 (0.91 to 5.77) | 2.29 (0.85 to 6.16) |
| Collagenase versus dextranomer | 1 (12) | 0.35 (0.05 to 2.26) (Stata 0.44 (0.10 to 2.02)) | 0.44 (0.09 to 2.11) |
| Collagenase ointment versus sugar + egg white (part of 3‐arm trial) (Parish 1979) | 1 (10) | 3.00 (0.15 to 59.89) (Stata 3.00 (0.15 to 59.79)) | 3.00 (0.15 to 61.18) |
| Dextranomer versus sugar + egg white (part of 3‐arm trial) (Parish 1979) | 1 (12) | 6.75 (0.44 to 102.80) | 6.75 (0.43 to 105.22) |
| TOTAL | 22 (959) |
| Group intervention | Mean rank | SUCRA | Probability at | Rank at maximum |
| Basic dressing | 7.3 | 0.3 | 30.6 | 8 |
| Advanced dressing | 5.2 | 0.5 | 38.8 | 5 |
| Advanced ‐ antimicrobial dressing | 9.4 | 0.1 | 57.0 | 10 |
| Antimicrobial dressing | 7.4 | 0.3 | 31.9 | 8 |
| Collagenase ointment | 3.3 | 0.7 | 39.4 | 3 |
| Dextranomer | 2 | 0.9 | 55.3 | 1 |
| Phenytoin | 6.5 | 0.4 | 20.5 | 7 |
| Protease‐modulating dressing | 4.6 | 0.6 | 31.2 | 4 |
| Sugar + egg white | 7 | 0.3 | 36.5 | 10 |
| Tripeptide copper gel | 2.3 | 0.9 | 36.2 | 2 |
| Intervention | Number of | Number of participants | In joined | Number of studies | Number of participants |
| Alginate dressings | 2 | 38 | Y | 2 | 38 |
| Basic wound contact dressings | 2 | 33 | Y | 1 | 24 |
| Collagenase‐containing ointment | 3 | 35 | Y | 3 | 35 |
| Combination dressing: non‐adherent + saline gauze + foam | 1 | 16 | N | ||
| Combination dressing: silicone + foam | 1 | 44 | Y | 1 | 44 |
| Dextranomer | 1 | 7 | Y | 1 | 7 |
| Enamel matrix protein | 1 | 6 | N | ||
| Ethoxy‐diaminoacridine plus nitrofurazone dressing | 1 | 26 | N | ||
| Foam dressings | 13 | 266 | Y | 13 | 266 |
| Gauze saline dressings | 11 | 245 | Y | 10 | 233 |
| Honey | 1 | 25 | N | ||
| Hydrocolloid dressings | 22 | 791 | Y | 21 | 715 |
| Hydrocolloid or hydrocolloid silver dressing | 1 | 16 | N | ||
| Hydrocolloid with or without alginate filler | 1 | 20 | Y | 1 | 20 |
| Hydrocolloid‐alginate sequential dressings | 1 | 57 | Y | 1 | 57 |
| Hydrogel | 12 | 335 | Y | 10 | 279 |
| Ineligible intervention: graft + conventional dressing | 1 | 18 | N | ||
| Ineligible intervention: growth factor + hyaluronic acid | 1 | 40 | N | ||
| Ineligible intervention: growth factor | 2 | 152 | N | ||
| Ineligible intervention laser | 1 | 7 | N | ||
| Ineligible intervention: NPWT (only included in group analysis) | 1 | 6 | N | ||
| Ineligible intervention: povidone iodine + paraffin soaked gauze | 1 | 40 | N | ||
| Ineligible intervention: radiant heat | 2 | 53 | Y | 2 | 53 |
| Ineligible intervention: skin substitute | 2 | 110 | Y | 2 | 110 |
| Ineligible intervention: ultrasound + ultraviolet | 1 | 6 | N | ||
| Ineligible intervention: whirlpool + chloramine dressing | 1 | 52 | N | ||
| Iodine‐containing dressings | 2 | 62 | Y | 2 | 62 |
| Lysosyme ointment | 1 | 69 | N | ||
| Phenytoin topical | 1 | 21 | Y | 1 | 21 |
| Polyvinylpyrrolidone + zinc oxide | 1 | 12 | Y | 1 | 12 |
| Propylene glycol alginate | 1 | 5 | N | ||
| Protease‐modulating dressings | 5 | 116 | Y | 4 | 76 |
| Resin salve | 1 | 16 | N | ||
| Soft polymer dressing | 1 | 18 | Y | 1 | 18 |
| Standard care (only included in group analysis) | 1 | 6 | N | ||
| Sugar + egg white | 1 | 5 | Y | 1 | 5 |
| Sugar + povidone iodine | 1 | 72 | N | ||
| Tripeptide copper + Opsite | 1 | 6 | Y | 1 | 6 |
| Vapour‐permeable dressings | 2 | 57 | Y | 1 | 35 |
| NMA ⇩ | Contributions from each direct evidence contrast | Overall risk |
| 1 vs 2 | 74.5% 1 vs 2 + 5.5% 1 vs 7 + 7.2% 1 vs 8 + 5.5% 2 vs 7 + 7.2% 2 vs 8 | high |
| 1 vs 3 | 27.1% 1 vs 2 + 2.0% 1 vs 7 + 2.6% 1 vs 8 + 31.8% 2 vs 4 + 2.0% 2 vs 7 + 2.6% 2 vs 8 + 31.8% 3 vs 4 | high |
| 1 vs 4 | 39.8% 1 vs 2 + 2.9% 1 vs 7 + 3.9% 1 vs 8 + 46.6% 2 vs 4 + 2.9% 2 vs 7 + 3.9% 2 vs 8 | high |
| 1 vs 5 | 39.8% 1 vs 2 + 2.9% 1 vs 7 + 3.9% 1 vs 8 + 46.6% 2 vs 5 + 2.9% 2 vs 7 + 3.9% 2 vs 8 | high |
| 1 vs 6 | 26.1% 1 vs 2 + 1.9% 1 vs 7 + 2.5% 1 vs 8 + 30.6% 2 vs 5 + 1.9% 2 vs 7 + | high |
| 1 vs 7 | 37.8% 1 vs 2 + 13.4% 1 vs 7 + 3.7% 1 vs 8 + 41.4% 2 vs 7 + 3.7% 2 vs 8 | low |
| 1 vs 8 | 40.8% 1 vs 2 + 3.0% 1 vs 7 + 9.3% 1 vs 8 + 3.0% 2 vs 7 + 43.8% 2 vs 8 | low |
| 1 vs 9 | 23.6% 1 vs 2 + 1.7% 1 vs 7 + 2.3% 1 vs 8 + 27.6% 2 vs 5 + 1.7% 2 vs 7 + | high |
| 1 vs 10 | 39.8% 1 vs 2 + 2.9% 1 vs 7 + 3.9% 1 vs 8 + 2.9% 2 vs 7 + 3.9% 2 vs 8 + 46.9% 2 vs 10 | low |
| Whole network | 8.7% 1 vs 2 + 2.1% 1 vs 7 + 1.6% 1 vs 8 + 14.9% 2 vs 4 + 19.6% 2 vs 5 + | high |
| Key to interventions: 1 = basic dressing; 2 = advanced dressing; 3 = advanced +/‐ antimicrobial dressing; Risk of bias for direct contrasts: Low ‐ 1 vs 7; 1 vs 8; 2 vs 7; 2 vs 8; 2 vs 10; 5 vs 6; 5 vs 9; 6 vs 9. | ||
| Common heterogeneity estimate within each loop | Common heterogeneity estimate for network: tau² (network) = 0.0435 | ||||
| Loop | Ratio of RR (90% CI) | P value | Loop heterogeneity tau² (loop) | Ratio of RR (90% CI) | P value |
| Saline gauze ‐ hydrogel ‐ phenytoin | 3.90 (1.19 to 12.77) | 0.059 | 0.000 | 3.75 (90%CI 1.14 to 12.29) | 0.067 |
| Saline gauze ‐ foam ‐ hydrogel | 1.64 (0.27 to 9.99) | 0.651 | 0.512 | 1.21 (90%CI 0.56 to 2.63) | 0.682 |
| Hydrocolloid ‐ hydrogel ‐ iodine containing dressing | 1.26 (0.44 to 3.61) | 0.721 | 0.084 | 1.28 (90%CI 0.59 to 2.75) | 0.602 |
| Foam ‐ hydrocolloid ‐ protease‐modulating | 1.25 (0.66 to 2.35) | 0.562 | 0 | 1.24 (90%CI 0.66 to 2.35) | 0.572 |
| Foam ‐ hydrocolloid ‐ hydrogel | 1.13 (0.7 to 1.83) | 0.675 | 0.016 | 1.16 (90%CI 0.77 to 1.75) | 0.548 |
| Saline gauze ‐ foam ‐ hydrocolloid | 1.04 (0.45 to 2.41) | 0.936 | 0.084 | 1.04 (90%CI 0.55 to 1.96) | 0.919 |
| Saline gauze ‐ hydrocolloid ‐ hydrogel | 1.01 (0.33 to 3.11) | 0.993 | 0.244 | 1.09 (90%CI 0.62 to 1.89) | 0.808 |
| Contrast | Direct evidence RR (95% CI) | Indirect evidence RR (95% CI) | RR direct/RR indirect (90% CI) | P value | tau² |
| Foam versus saline gauze | 1.52 (0.73 to 3.16) | 1.54 (0.95 to 2.49) | 0.99 (90% CI 0.47 to 2.05) | 0.973 | 0.22 |
| Hydrocolloid versus saline gauze | 1.41 (0.88 to 2.26) | 1.49 (0.87 to 2.56) | 0.95 (90% CI 0.53 to 1.69) | 0.876 | 0.22 |
| Hydrogel versus saline gauze | 1.67 (0.86 to 3.22) | 1.52 (0.91 to 2.54) | 1.10 (90% CI 0.57 to 2.12) | 0.820 | 0.22 |
| Phenytoin versus saline gauze | 3.01 (0.93 to 9.71) | 0.29 (0.05 to 1.51) | 10.06 (90% CI 1.35 to 75.13) | 0.059 | 0.15 |
| Hydrocolloid versus foam | 0.95 (0.68 to 1.32) | 0.91 (0.57 to 1.44) | 1.04 (90% CI 0.65 to 1.68) | 0.881 | 0.23 |
| Hydrogel versus foam | 0.90 (0.51 to 1.58) | 1.10 (0.72 to 1.68) | 0.81 (90% CI 0.45 to 1.47) | 0.568 | 0.23 |
| Protease‐modulating dressing versus foam | 1.22 (0.61 to 2.41) | 0.94 (0.46 to 1.92) | 1.29 (90% CI 0.56 to 2.94) | 0.614 | 0.22 |
| Hydrogel versus hydrocolloid | 1.10 (0.76 to 1.59) | 1.07 (0.68 to 1.68) | 1.02 (90% CI 0.63 to 1.67) | 0.935 | 0.24 |
| Iodine‐containing dressing versus hydrocolloid | 0.90 (0.36 to 2.19) | 0.68 (0.35 to 1.33) | 1.31 (90% CI 0.51 to 3.32) | 0.638 | 0.22 |
| Protease‐modulating dressing versus hydrocolloid | 1.02 (0.53 to 1.97) | 1.32 (0.63 to 2.76) | 0.78 (90% CI 0.34 to 1.77) | 0.614 | 0.22 |
| Iodine‐containing dressing versus hydrogel | 0.64 (0.35 to 1.16) | 0.84 (0.32 to 2.15) | 0.77 (90% CI 0.30 to 1.95) | 0.639 | 0.22 |
| Phenytoin versus hydrogel | 0.71 (0.38 to 1.34) | 7.18 (0.68 to 75.47) | 0.10 (90% CI 0.01 to 0.74) | 0.059 | 0.15 |
| Contrast | Design 1 | NMA results for design 1 | Design 2 | (NMA results for design 2 | NMA results |
| Foam versus saline gauze | 7 vs 1 (3 studies) | 1.53 (0.71 to 2.22) | NA | NA | 1.52 (1.03 to 1.85) |
| Hydrocolloid versus saline gauze | 8 vs 1 (4 studies) | 1.50 (0.9 to 1.92) | NA | NA | 1.43 (1.00 to 1.70) |
| Hydrogel versus saline gauze | 10 vs 1 (2 studies; heterogeneity) | 1.16 (0.51 to 1.73) | 10 vs 1 vs 14 (one 3‐arm study) | 4.22 (1.26 to 7.65) | 1.55 (1.02 to 1.91) |
| Phenytoin versus saline gauze | NA | NA | 14 vs 1 vs 10 | 3.02 (0.86 to 5.56) | 1.28 (0.58 to 1.88) |
| Hydrocolloid versus collagenase | 8 vs 5 (2 studies) | 0.68 (0.35 to 0.95) | NA | NA | 0.68 (0.37 to 0.91) |
| Hydrocolloid versus foam | 8 vs 7 (6 studies) | 0.96 (0.67 to 1.13) | NA | NA | 0.94 (0.73 to 1.07) |
| Hydrogel versus foam | 10 vs 7 (1 study) | 0.90 (0.48 to 1.22) | NA | NA | 1.02 (0.74 to 1.2) |
| Protease‐modulating versus foam | 15 vs 7 (1 study) | 1.22 (0.58 to 1.76) | NA | NA | 1.08 (0.67 to 1.36) |
| Hydrogel versus hydrocolloid | 10 vs 8 (4 studies) | 1.11 (0.74 to 1.35) | NA | NA | 1.09 (0.83 to 1.24) |
| Iodine‐containing dressing versus hydrocolloid | 13 vs 8 (1 study) | 0.90 (0.35 to 1.43) | NA | NA | 0.76 (0.45 to 0.97) |
| Protease‐modulating versus hydrocolloid | 15 vs 8 (1 study) | 1.03 (0.5 to 1.46) | NA | NA | 1.15 (0.72 to 1.45) |
| Iodine‐containing dressing versus hydrogel | 13 vs 10 (1 study) | 0.64 (0.33 to 0.9) | NA | NA | 0.70 (0.43 to 0.88) |
| Phenytoin versus hydrogel | NA | NA | 14 vs 10 vs 1 | 0.71 (0.33 to 1.04) | 0.82 (0.42 to 1.14) |
| Loop | Ratio of RR (90% CI) | P value | Loop heterogeneity ‐ tau² |
| Basic dressing ‐ advanced dressing ‐ phenytoin | 3.04 (0.71 to 13.06) | 0.210 | 0.085 |
| Basic dressing ‐ advanced dressing ‐ protease‐modulating dressing | 1.36 (0.39 to 4.73) | 0.682 | 0.091 |
| Contrast | Direct evidence RR (95% CI) | Indirect evidence RR (95% CI) | RR direct/RR indirect (90% CI) | P value | Tau² |
| Advanced dressing versus basic dressing | 1.41 (0.96 to 2.09) | 1.10 (0.33 to 3.73) | 1.28 (90% CI 0.44 to 3.76) | 0.705 | 0.221791 |
| Phenytoin versus basic dressing | 3.02 (0.97 to 9.38) | 0.24 (0.06 to 1.02) | 12.51 (90% CI 1.87 to 83.55) | 0.029 | 0.048414 |
| Protease‐modulating dressing versus basic dressing | 1.25 (0.4 to 3.87) | 1.60 (0.87 to 2.95) | 0.78 (90% CI 0.27 to 2.3) | 0.707 | 0.221734 |
| Phenytoin versus advanced dressing | 0.71 (0.41 to 1.25) | 8.94 (0.96 to 83.43) | 0.08 (90% CI 0.01 to 0.53) | 0.029 | 0.048424 |
| Protease‐modulating dressing versus advanced dressing | 1.13 (0.71 to 1.79) | 0.88 (0.27 to 2.92) | 1.28 (90% CI 0.44 to 3.76) | 0.706 | 0.221781 |
| Contrast | Design 1 | NMA results for design 1 | Design 2 | NMA results for design 2 | NMA results |
| Advanced dressing versus basic dressing | 2 vs 1 (10 studies; heterogeneity) | 1.21 (0.88 to 1.67) | 2 vs 1 vs 7 (1 study) | 4.22 (1.41 to 12.68) | 1.36 (0.95 to 1.93) |
| Phenytoin versus basic dressing | NA | NA | 7 vs 1 vs 2 (1 study) | 3.02 (0.96 to 9.44) | 1.12 (0.52 to 2.44) |
| Protease‐modulating dressing versus basic dressing | 8 vs 1 (1 study) | 1.25 (0.44 to 3.59) | NA | NA | 1.49 (0.91 to 2.46) |
| Phenytoin versus advanced dressing | NA | NA | 7 vs 2 vs 1 (1 study) | 0.71 (0.4 to 1.27) | 0.83 (0.43 to 1.59) |
| Protease‐modulating dressing versus advanced dressing | 8 vs 2 (3 studies) | 1.12 (0.78 to 1.62) | NA | NA | 1.10 (0.74 to 1.64) |
| Intervention | Mean rank | SUCRA | Probability | Rank at maximum |
| Saline gauze | 16.3 | 0.2 | 16.2 | 17 |
| Alginate dressing | 12.4 | 0.4 | 10.8 | 19 |
| Sequential hydrocolloid alginate dressings | 18.6 | 0.1 | 34.6 | 21 |
| Basic wound contact dressing | 12.4 | 0.4 | 11.6 | 15 |
| Collagenase ointment | 6.9 | 0.7 | 13.5 | 6 |
| Dextranomer | 3.5 | 0.9 | 40.8 | 1 |
| Foam dressing | 10.3 | 0.5 | 15.0 | 10 |
| Hydrocolloid dressing | 11.6 | 0.5 | 18.6 | 11 |
| Hydrocolloid with/without alginate filler | 11.9 | 0.5 | 12.4 | 21 |
| Hydrogel | 9.9 | 0.6 | 14.9 | 10 |
| Ineligible intervention ‐ radiant heat | 11.4 | 0.5 | 12.8 | 20 |
| Ineligible intervention ‐ skin substitute | 6.6 | 0.7 | 15.0 | 4 |
| Iodine‐containing dressing | 15.3 | 0.3 | 13.4 | 17 |
| Phenytoin | 12.6 | 0.4 | 9.4 | 16 |
| Protease‐modulating dressing | 9.3 | 0.6 | 11.8 | 8 |
| PVP + zinc oxide | 11.8 | 0.5 | 8.1 | 20 |
| Silicone + foam dressing | 8.9 | 0.6 | 10.0 | 2 |
| Soft polymer dressing | 11.9 | 0.5 | 7.7 | 16 |
| Sugar + egg white | 14.4 | 0.3 | 31.8 | 21 |
| Tripeptide copper gel | 3.7 | 0.9 | 25.3 | 1 |
| Vapour‐permeable dressing | 11.4 | 0.5 | 8.9 | 13 |
| Contrast | Study | Risk ratio (95% CI) | Hazard ratio (95% CI) | Median times to healing |
| Hydrocolloid versus saline gauze | (6 weeks) | 3.43 (1.32 to 8.89) | 1.88 (0.80 to 4.45) | |
| Xakellis 1992 | 1.04 (0.82 to 1.32) | 1.67 (0.81 to 3.45) | 9 days versus 11 days | |
| Meta‐analysis of 2 studies in 95 participants (Alm 1989; Xakellis 1992) ‐ selected | Meta‐analysis: 1.72 (0.54 to 5.47) I² = 82%, P = 0.02 | Meta‐analysis: 1.75 (95% CI 1.00 to 3.05 I² = 0%, P = 0.84 | ||
| Hydrogel versus hydrocolloid | Brod 1990 (8 weeks) | 1.11 (0.74 to 1.67) | 1.30 (0.54 to 3.13) | 32 days versus 42 days (P = 0.56); Kaplan‐Meier curves crossing |
| Protease‐modulating dressing versus hydrocolloid | Graumlich 2003 (8 weeks) | 1.03 (0.64 to 1.66) | 1.34 (0.67 to 2.65) | 4 weeks and 7 weeks (estimated from Kaplan‐Meier plot); protease‐modulating dressing had more healing from 5 weeks |
| Collagenase ointment versus hydrocolloid | Muller 2001 (16 weeks ‐ probably) | 1.57 (0.95 to 2.61) | 2.58 (1.00 to 6.65) | |
| Hydrocolloid +/‐ alginate versus ineligible: radiant heat | Thomas 2005 (12 weeks) | 0.92 (0.41 to 2.06) | 0.64 (0.23 to 1.77) | > 90 days and 70 days (estimated from Kaplan‐Meier plot); radiant heat had consistently more healing at all time points |
| Foam versus saline gauze | Payne 2009 (4 weeks) | 1.33 (0.62 to 2.88) | 1.12 (0.42 to 3.01) |
| Risk ratio (95% CI) intervention versus saline gauze | Mean rank (of 21 interventions unless otherwise stated) | |||||
| Intervention | Original | Sensitivity analysis 1. Very high risk of bias | Sensitivity analysis 2. Complete case | Original saline 16.3 | Sensitivity analysis 1. Very high risk of bias | Sensitivity analysis 2. Complete case saline = 16.3 |
| Alginate dressing | 1.10 (0.11 to 10.57) | 1.14 (0.11 to 11.45) | 1.08 (0.11 to 10.69) | 12.4 | 11 | 12.6 |
| Sequential hydrocolloid | s0.50 (0.12 to 1.99) | 0.52 (0.12 to 2.20) | 0.51 (0.12 to 2.1) | 18.6 | 15.8 | 18.5 |
| Basic wound contact dressing | 1.30 (0.65 to 2.59) | 1.33 (0.61 to 2.93) | 1.44 (0.76 to 2.73) | 12.4 | 10.6 | 11.1 |
| Collagenase ointment | 2.11 (1.06 to 4.21) | 2.35 (1.02 to 5.44) | 2.01 (0.98 to 4.12) | 6.9 | 5.2 | 7.4 |
| Dextranomer | 4.75 (0.86 to 26.34) | 5.29 (0.87 to 32.26) | 4.51 (0.79 to 25.88) | 3.5 | 2.9 | 3.8 |
| Foam dressing | 1.52 (1.03 to 2.26) | 1.56 (1 to 2.43) | 1.45 (0.97 to 2.15) | 10.3 | 9 | 11.2 |
| Hydrocolloid dressing | 1.43 (1 to 2.05) | 1.50 (0.99 to 2.26) | 1.47 (1.02 to 2.12) | 11.6 | 9.7 | 11.1 |
| Hydrocolloid with/without | 1.23 (0.06 to 24.86) | not in network | 1.33 (0.06 to 27.37) | 11.9 | not in network | 11.5 |
| Hydrogel dressing | 1.55 (1.02 to 2.36) | 1.74 (1.09 to 2.77) | 1.56 (1.02 to 2.37) | 9.9 | 7.5 | 9.8 |
| Ineligible: radiant heat | 1.34 (0.08 to 23.53) | 1.39 (0.07 to 25.76) | 1.62 (0.09 to 29.28) | 11.4 | not in network | 10.2 |
| Ineligible: skin substitute | 2.12 (1.05 to 4.28) | not in network | 1.92 (0.91 to 4.02) | 6.6 | 9.8 | 7.6 |
| Iodine‐containing dressing | 1.08 (0.58 to 2.02) | 1.19 (0.6 to 2.38) | 1.13 (0.58 to 2.18) | 15.3 | 12.1 | 14.7 |
| Phenytoin | 1.28 (0.58 to 2.81) | 1.66 (0.71 to 3.89) | 1.3 (0.57 to 2.96) | 12.6 | 8.6 | 12.4 |
| Protease‐modulating dressing | 1.64 (0.92 to 2.93) | 1.71 (0.89 to 3.26) | 1.63 (0.89 to 2.97) | 9.3 | 7.9 | 9.4 |
| PVP + ZnO | 1.32 (0.37 to 4.64) | 1.37 (0.36 to 5.19) | 1.30 (0.35 to 4.78) | 11.8 | 10.2 | 11.9 |
| Combined silicone foam dressing | 1.93 (0.37 to 9.92) | not in network | 1.74 (0.33 to 9.32) | 8.9 | not in network | 9.7 |
| Soft polymer dressing | 1.35 (0.56 to 3.27) | 1.39 (0.53 to 3.63) | 1.29 (0.52 to 3.23) | 11.9 | 10.2 | 12.3 |
| Sugar + egg white | 0.70 (0.03 to 15.6) | 0.78 (0.03 to 18.33) | 0.67 (0.03 to 15.11) | 14.4 | 12 | 14.6 |
| Tripeptide copper gel | 3.88 (1.03 to 14.56) | 2.78 (0.90 to 8.58) | 3.89 (1.01 to 15) | 3.7 | 4.8 | 3.8 |
| Vapour‐permeable dressing | 1.44 (0.74 to 2.8) | 1.51 (0.70 to 3.25) | 1.48 (0.72 to 3.04) | 11.4 | 9.5 | 11 |
| Outcome or subgroup title | No. of studies | No. of participants | Statistical method | Effect size |
| 1 Interventions vs saline gauze Show forest plot | 10 | Risk Ratio (IV, Random, 95% CI) | Subtotals only | |
| 1.1 Hydrocolloid vs saline gauze | 4 | 279 | Risk Ratio (IV, Random, 95% CI) | 1.89 [0.91, 3.93] |
| 1.2 Hydrogel vs saline gauze | 3 | 110 | Risk Ratio (IV, Random, 95% CI) | 2.44 [0.64, 9.27] |
| 1.3 Foam vs saline gauze | 3 | 93 | Risk Ratio (IV, Random, 95% CI) | 1.51 [0.78, 2.90] |
| 2 Interventions vs hydrocolloid Show forest plot | 13 | Risk Ratio (IV, Random, 95% CI) | Subtotals only | |
| 2.1 Hydrogel vs hydrocolloid | 4 | 322 | Risk Ratio (IV, Random, 95% CI) | 1.11 [0.74, 1.67] |
| 2.2 Foam vs hydrocolloid | 6 | 292 | Risk Ratio (IV, Random, 95% CI) | 1.05 [0.81, 1.36] |
| 2.3 Collagenase ointment vs hydrocolloid | 2 | 61 | Risk Ratio (IV, Random, 95% CI) | 1.51 [0.93, 2.43] |
| 2.4 Protease‐modulating dressing vs hydrocolloid | 1 | 65 | Risk Ratio (IV, Random, 95% CI) | 1.03 [0.64, 1.66] |
| Outcome or subgroup title | No. of studies | No. of participants | Statistical method | Effect size |
| 1 Intervention 1 vs intervention 2 Show forest plot | 18 | Risk Ratio (IV, Random, 95% CI) | Subtotals only | |
| 1.1 Advanced dressing vs basic dressing | 11 | 532 | Risk Ratio (IV, Random, 95% CI) | 1.55 [1.10, 2.19] |
| 1.2 Antimicrobial dressing vs advanced dressing | 2 | 125 | Risk Ratio (IV, Random, 95% CI) | 0.69 [0.48, 0.99] |
| 1.3 Collagenase ointment vs advanced dressing | 2 | 61 | Risk Ratio (IV, Random, 95% CI) | 1.51 [0.93, 2.43] |
| 1.4 Protease‐modulating dressing vs advanced dressing | 3 | 112 | Risk Ratio (IV, Random, 95% CI) | 1.13 [0.80, 1.60] |
| Outcome or subgroup title | No. of studies | No. of participants | Statistical method | Effect size |
| 1 Time‐to‐healing (survival analysis) Show forest plot | 7 | Hazard Ratio (Fixed, 95% CI) | Subtotals only | |
| 1.1 Hydrocolloid versus saline gauze | 2 | 95 | Hazard Ratio (Fixed, 95% CI) | 1.75 [1.00, 3.05] |
| 1.2 Hydrogel versus hydrocolloid | 1 | 43 | Hazard Ratio (Fixed, 95% CI) | 1.30 [0.54, 3.13] |
| 1.3 Protease‐modulating versus hydrocolloid | 1 | 65 | Hazard Ratio (Fixed, 95% CI) | 1.34 [0.67, 2.65] |
| 1.4 Collagenase ointment versus hydrocolloid | 1 | 24 | Hazard Ratio (Fixed, 95% CI) | 2.59 [1.01, 6.62] |
| 1.5 Foam versus saline gauze | 1 | 36 | Hazard Ratio (Fixed, 95% CI) | 1.13 [0.42, 3.00] |
| 1.6 Hydrocolloid +/‐ alginate versus ineligible: radiant heat | 1 | 41 | Hazard Ratio (Fixed, 95% CI) | 0.64 [0.23, 1.77] |
| Outcome or subgroup title | No. of studies | No. of participants | Statistical method | Effect size |
| 1 Time‐to‐healing (survival analysis) Show forest plot | 5 | Hazard Ratio (Fixed, 95% CI) | Subtotals only | |
| 1.1 Advanced dressing versus basic dressing | 3 | Hazard Ratio (Fixed, 95% CI) | 1.57 [0.97, 2.55] | |
| 1.2 Protease‐modulating dressing versus advanced dressing | 1 | Hazard Ratio (Fixed, 95% CI) | 1.34 [0.67, 2.65] | |
| 1.3 Advanced dressings versus collagenase ointment | 1 | Hazard Ratio (Fixed, 95% CI) | 0.27 [0.11, 0.67] | |
| Outcome or subgroup title | No. of studies | No. of participants | Statistical method | Effect size |
| 1 Intervention 1 vs intervention 2 Show forest plot | 4 | Risk Ratio (IV, Random, 95% CI) | Totals not selected | |
| 1.1 Sugar + povidone iodine vs lysosyme | 1 | Risk Ratio (IV, Random, 95% CI) | 0.0 [0.0, 0.0] | |
| 1.2 Enamel matrix protein vs propylene glycol alginate | 1 | Risk Ratio (IV, Random, 95% CI) | 0.0 [0.0, 0.0] | |
| 1.3 Honey vs ethoxy‐diaminoacridine +nitrofurazone dressings | 1 | Risk Ratio (IV, Random, 95% CI) | 0.0 [0.0, 0.0] | |
| 1.4 Resin salve vs hydrocolloid or hydrocolloid silver dressing | 1 | Risk Ratio (IV, Random, 95% CI) | 0.0 [0.0, 0.0] | |