Opatrunki i środki do stosowania miejscowego w leczeniu odleżyn
Abstract
Background
Pressure ulcers, also known as bedsores, decubitus ulcers and pressure injuries, are localised areas of injury to the skin or the underlying tissue, or both. Dressings are widely used to treat pressure ulcers and promote healing, and there are many options to choose from including alginate, hydrocolloid and protease‐modulating dressings. Topical agents have also been used as alternatives to dressings in order to promote healing.
A clear and current overview of all the evidence is required to facilitate decision‐making regarding the use of dressings or topical agents for the treatment of pressure ulcers. Such a review would ideally help people with pressure ulcers and health professionals assess the best treatment options. This review is a network meta‐analysis (NMA) which assesses the probability of complete ulcer healing associated with alternative dressings and topical agents.
Objectives
To assess the effects of dressings and topical agents for healing pressure ulcers in any care setting. We aimed to examine this evidence base as a whole, determining probabilities that each treatment is the best, with full assessment of uncertainty and evidence quality.
Search methods
In July 2016 we searched the Cochrane Wounds Specialised Register; the Cochrane Central Register of Controlled Trials (CENTRAL); Ovid MEDLINE; Ovid MEDLINE (In‐Process & Other Non‐Indexed Citations); Ovid Embase and EBSCO CINAHL Plus. We also searched clinical trials registries for ongoing and unpublished studies, and scanned reference lists of relevant included studies as well as reviews, meta‐analyses, guidelines and health technology reports to identify additional studies. There were no restrictions with respect to language, date of publication or study setting.
Selection criteria
Published or unpublished randomised controlled trials (RCTs) comparing the effects of at least one of the following interventions with any other intervention in the treatment of pressure ulcers (Stage 2 or above): any dressing, or any topical agent applied directly to an open pressure ulcer and left in situ. We excluded from this review dressings attached to external devices such as negative pressure wound therapies, skin grafts, growth factor treatments, platelet gels and larval therapy.
Data collection and analysis
Two review authors independently performed study selection, risk of bias assessment and data extraction. We conducted network meta‐analysis using frequentist mega‐regression methods for the efficacy outcome, probability of complete healing. We modelled the relative effectiveness of any two treatments as a function of each treatment relative to the reference treatment (saline gauze). We assumed that treatment effects were similar within dressings classes (e.g. hydrocolloid, foam). We present estimates of effect with their 95% confidence intervals for individual treatments compared with every other, and we report ranking probabilities for each intervention (probability of being the best, second best, etc treatment). We assessed the certainty (quality) of the body of evidence using GRADE for each network comparison and for the network as whole.
Main results
We included 51 studies (2947 participants) in this review and carried out NMA in a network of linked interventions for the sole outcome of probability of complete healing. The network included 21 different interventions (13 dressings, 6 topical agents and 2 supplementary linking interventions) and was informed by 39 studies in 2127 participants, of whom 783 had completely healed wounds.
We judged the network to be sparse: overall, there were relatively few participants, with few events, both for the number of interventions and the number of mixed treatment contrasts; most studies were small or very small. The consequence of this sparseness is high imprecision in the evidence, and this, coupled with the (mainly) high risk of bias in the studies informing the network, means that we judged the vast majority of the evidence to be of low or very low certainty. We have no confidence in the findings regarding the rank order of interventions in this review (very low‐certainty evidence), but we report here a summary of results for some comparisons of interventions compared with saline gauze. We present here only the findings from evidence which we did not consider to be very low certainty, but these reported results should still be interpreted in the context of the very low certainty of the network as a whole.
It is not clear whether regimens involving protease‐modulating dressings increase the probability of pressure ulcer healing compared with saline gauze (risk ratio (RR) 1.65, 95% confidence interval (CI) 0.92 to 2.94) (moderate‐certainty evidence: low risk of bias, downgraded for imprecision). This risk ratio of 1.65 corresponds to an absolute difference of 102 more people healed with protease modulating dressings per 1000 people treated than with saline gauze alone (95% CI 13 fewer to 302 more). It is unclear whether the following interventions increase the probability of healing compared with saline gauze (low‐certainty evidence): collagenase ointment (RR 2.12, 95% CI 1.06 to 4.22); foam dressings (RR 1.52, 95% CI 1.03 to 2.26); basic wound contact dressings (RR 1.30, 95% CI 0.65 to 2.58) and polyvinylpyrrolidone plus zinc oxide (RR 1.31, 95% CI 0.37 to 4.62); the latter two interventions both had confidence intervals consistent with both a clinically important benefit and a clinically important harm, and the former two interventions each had high risk of bias as well as imprecision.
Authors' conclusions
A network meta‐analysis (NMA) of data from 39 studies (evaluating 21 dressings and topical agents for pressure ulcers) is sparse and the evidence is of low or very low certainty (due mainly to risk of bias and imprecision). Consequently we are unable to determine which dressings or topical agents are the most likely to heal pressure ulcers, and it is generally unclear whether the treatments examined are more effective than saline gauze.
More research is needed to determine whether particular dressings or topical agents improve the probability of healing of pressure ulcers. The NMA is uninformative regarding which interventions might best be included in a large trial, and it may be that research is directed towards prevention, leaving clinicians to decide which treatment to use on the basis of wound symptoms, clinical experience, patient preference and cost.
PICO
Streszczenie prostym językiem
Jakie opatrunki lub środki do stosowania miejscowego są najbardziej skuteczne w leczeniu odleżyn?
Opatrunki i środki do stosowania miejscowego w leczeniu odleżyn
Pytanie badawcze
Dokonaliśmy przeglądu danych naukowych dotyczących skuteczności opatrunków i środków do stosowania miejscowego (np. maści, kremy i żele) w leczeniu odleżyn. Chcieliśmy dowiedzieć się, które z wielu różnych dostępnych opatrunków i środków do stosowania miejscowego były najbardziej skuteczne.
Wprowadzenie
Odleżyny, inaczej owrzodzenia skóry, to rany skóry i czasem tkanki znajdującej się pod nią. Odleżyn mogą być bolesne, może dojść do ich zakażenia, a ich występowanie wpływa na jakość życia. W grupie pacjentów z ryzykiem rozwoju odleżyn znajdują się osoby o ograniczonej sprawności ruchowej: starsze, z chorobami krótko‐ lub długotrwałymi oraz z urazami rdzenia kręgowego. W 2004 r. całkowity roczny koszt leczenia odleżyn w Wielkiej Brytanii oszacowano na 1,4 do 2,1 mld GBP, co stanowi 4% całkowitych wydatków państwowej służby zdrowia.
Środki do stosowania miejscowego, takie jak: maści, kremy lub żele są stosowane na niewyleczone odleżyny i pozostawiane na miejscu w celu przyspieszenia gojenia się rany; mogą być także pokrywane opatrunkiem. Niektóre z tych zabiegów były porównane ze sobą, w badaniach zwykle porównano dwa zabiegi jednocześnie. Zastosowaliśmy metodę "metaanalizy sieciowej", aby w rzetelny sposób połączyć wszystkie wyniki różnych zabiegów. Mamy nadzieję, że ta metoda porównująca wszystkie opcje leczenia, pomoże nam dowiedzieć się, które z nich były najlepsze w leczeniu odleżyn.
Charakterystyka badań
W lipcu 2016 roku poszukiwaliśmy randomizowanych badań z grupą kontrolną analizujących opatrunki i środki stosowane miejscowo w leczeniu odleżyn, które skutkowały kompletnym zagojeniem się ran. Znaleźliśmy 51 badań z udziałem 2947 osób. Dziewięć z tych badań, obejmujących 2127 osób, posiadało wyniki, które mogliśmy połączyć w metaanalizie sieciowej, porównując 21 różnych zabiegów. Większość uczestników stanowiły osoby starsze; w 3 z 39 badań były to osoby z urazami rdzenia kręgowego.
Główne wyniki
Ogólnie, badania, które znaleźliśmy nie miały wielu uczestników, a wyniki były często niejednoznaczne. Ten problem wpłynął na zastosowaną metaanalizę sieciową, przez co otrzymane wyniki można określić jako niejasne. W rezultacie nie było pewności, czy zastosowanie jednego środka stosowanego miejscowo lub opatrunku było lepsze od drugiego. Niektóre wyniki dla indywidualnych porównań mogą być nieco bardziej wiarygodne. Opatrunki modulujące aktywność proteaz, opatrunki piankowe lub maść zawierająca kolagenazę mogą być lepsze dla leczenia odleżyn niż gaza; ale nawet ten wynik nie jest wystarczająco pewny, by stanowić wytyczną dla właściwego leczenia.
Pewność oszacowania danych naukowych
Oceniliśmy jakość zebranych danych naukowych jako bardzo niską lub niską. Kolejnym krokiem mogłoby być wykonanie większej liczby badań, o lepszej jakości, aby zbadać, które opatrunki lub miejscowo stosowane środki najlepiej leczą odleżyny.
Niniejsze streszczenie prostym językiem jest aktualne do lipca 2016 roku.
Authors' conclusions
Summary of findings
| NMA evidence for individual network: proportion with complete healing ‐ interventions versus saline gauze | ||||
| Patient or population: people with pressure ulcers Settings: hospital, community or care home, or combinations | ||||
| Contrasts: interventions versus saline gauze | Relative effect | Anticipated absolute effects* (95% CI) ‐ from median of saline gauze control groups in direct evidence | Certainty (quality) of | |
| Median CGR | With interventions | |||
| Alginate dressings | RR 1.09 | 157 per 1000 | 171 per 1000 (17 to 1000) | ⊕⊝⊝⊝ |
| 14 more people healed per 1000 (140 fewer to 1000 more) | ||||
| Sequential hydrocolloid alginate dressings | RR 0.50 | 157 per 1000 | 78 per 1000 (1.9 to 31.2) | ⊕⊝⊝⊝ |
| 79 fewer people healed per 1000 (138 fewer to 155 more) | ||||
| Basic wound contact dressings | RR 1.30 | 157 per 1000 | 204 per 1000 (102 to 407) | ⊕⊕⊝⊝ |
| 47 more people healed per 1000 (55 fewer to 250 more) | ||||
| Collagenase ointment | RR 2.12 | 157 per 1000 | 333 per 1000 (166 to 663) | ⊕⊕⊝⊝ |
| 176 more people healed per 1000 (9 more to 506 more) | ||||
| Dextranomer | RR 4.76 | 157 per 1000 | 747 per 1000 (135 to 1000) | ⊕⊝⊝⊝ |
| 590 more people healed per 1000 (22 fewer to 1000 more) | ||||
| Foam dressings | RR 1.52 | 157 per 1000 | 239 per 1,000 (162 to 353) | ⊕⊕⊝⊝ |
| 82 more people healed per 1,000 (5 more to 196 more) | ||||
| Hydrocolloid dressing | RR 1.22 | 157 per 1000 | 192 per 1,000 (9 to 1000) | ⊕⊝⊝⊝ |
| 35 more people healed per 1,000 (148 fewer to 1000 more) | ||||
| Hydrocolloid dressings | RR 1.43 | 157 per 1000 | 225 per 1000 (157 to 322) | ⊕⊝⊝⊝ |
| 68 more people healed per 1000 (from 0 fewer to 165 more) | ||||
| Hydrogel | RR 1.55 | 157 per 1000 | 243 per 1000 (160 to 371) | ⊕⊝⊝⊝ |
| 86 more people healed per 1000 (from 3 more to 214 more) | ||||
| Iodine‐containing dressings | RR 1.08 | 157 per 1000 | 170 per 1000 (91 to 316) | ⊕⊝⊝⊝ |
| 13 more people healed per 1000 (from 66 fewer to 159 more) | ||||
| Phenytoin | RR 1.27 | 157 per 1000 | 199 per 1000 (91 to 440) | ⊕⊝⊝⊝ |
| 42 more people healed per 1000 (from 66 fewer to 283 more) | ||||
| Protease‐modulating dressings | RR 1.65 | 157 per 1000 | 259 per 1,000 (144 to 462) | ⊕⊕⊕⊝ |
| 102 more people healed per 1000 (from 13 fewer to 305 more) | ||||
| Polyvinylpyrrolidone + zinc oxide | RR 1.31 | 157 per 1000 | 206 per 1,000 (58 to 732) | ⊕⊕⊝⊝ |
| 49 more people healed per 1000 (from 99 fewer to 575 more) | ||||
| Combination silicone foam dressings | RR 1.93 | 157 per 1000 | 303 per 1,000 (60 to 1,000) | ⊕⊝⊝⊝ |
| 146 more people healed per 1000 (from 97 fewer to 1,000 more) | ||||
| Soft polymer dressings | RR 1.35 | 157 per 1000 | 212 per 1,000 (86 to 517) | ⊕⊝⊝⊝ |
| 55 more people healed per 1000 (from 71 fewer to 360 more) | ||||
| Sugar + egg white | RR 0.70 | 157 per 1000 | 110 per 1000 (5 to 1,000) | ⊕⊝⊝⊝ |
| 47 fewer people healed per 1000 (from 152 fewer to 1000 more) | ||||
| Tripeptide copper gel | RR 3.90 | 157 per 1000 | 612 per 1000 (163 to 1000) | ⊕⊝⊝⊝ |
| 455 more people healed per 1000 (6 more to 1000 more) | ||||
| Vapour‐permeable dressings | RR 1.45 | 157 per 1000 | 228 per 1000 | ⊕⊝⊝⊝ |
| 71 more people healed per 1000 (from 39 fewer to 283 more) | ||||
| *The risk in the intervention group (and its 95% CI) is based on the assumed risk in the comparator group and the relative effect of the intervention (and its 95% CI). | ||||
| GRADE Working Group grades of evidence | ||||
| 1Majority of evidence at high risk of bias (downgraded once); imprecision: very wide CI (crosses 0.75 and 1.25) (downgraded twice). | ||||
Background
Description of the condition
Pressure ulcers, also known as pressure injuries, bedsores, decubitus ulcers or pressure sores, are localised areas of injury to the skin, the underlying tissue or both. They often occur over bony prominences such as the sacrum (base of the spine) and heel (Vanderwee 2007), and are caused by external forces such as pressure, or shear, or a combination of both (EPUAP‐NPUAP‐PPPIA 2014; NPUAP 2016; Dumville 2015a; Dumville 2015b; Keogh 2013; Walker 2014).
Risk factors for pressure ulcer development have been summarised into three main categories: a lack of mobility; poor perfusion (e.g. diabetes and vascular disease) and low skin status (Coleman 2013); the latter category includes the presence of stage 1 pressure ulcers or incontinence or both, which also increases the risk of ulceration by producing a detrimental environment for the skin (Brandeis 1994).
Pressure ulcers vary in severity. One of the most widely recognised systems for categorising pressure ulcers is that of the National Pressure Ulcer Advisory Panel (NPUAP). Their international classification recognises four categories or stages of pressure ulcer and two categories of unclassifiable pressure injury. Stage 1 ulcers involve intact skin, but Stages 2 to 4 describe progressively deeper wounds with larger degrees of skin and tissue loss: Stage 2 pressure ulcers have partial‐thickness skin loss and exposed dermis; Stage 3 refers to full‐thickness skin loss and exposed fat tissue; and Stage 4 ulcers have full‐thickness skin and tissue loss, with exposed fascia, muscle, tendon, ligament, cartilage or bone. The two categories of unclassifiable pressure injury are reserved for wounds for which wound depth or extent, or both, cannot be accurately determined; unclassifiable pressure ulcers are generally severe and would be grouped clinically with Stage 3 or Stage 4 ulcers (EPUAP‐NPUAP‐PPPIA 2014) (see Appendix 1 for further details of grading).
Prevalence
Pressure ulcers are one of the most common types of complex wound. Prevalence estimates differ according to the type of population assessed, the data collection methods used and period of data collection and whether Stage 1 ulcers were included).
One large European study estimated a hospital pressure ulcer prevalence (Stage 2 and above) of 10.5% (Vanderwee 2007) whilst a US study estimated a prevalence of 9.0% (Stage 2 and above) across acute‐care, long‐term care and rehabilitation settings (the highest prevalence of 26% was in long‐term acute‐care settings (VanGilder 2009)). In the UK, national pressure ulcer data are collected across community and acute settings (although data collection is not yet universal) as part of the National Health Service (NHS) Safety Thermometer initiative (Power 2012). About 4.4% of patients across these settings were estimated to have a pressure ulcer (Stage 2 to Stage 4) in November 2014 (NHS Quality Observatory 2015).
We note that all the prevalence figures quoted above are for at‐risk populations currently receiving medical care. The point prevalence of pressure ulceration in the total adult population was recently estimated as 0.31 per 1000 population (including Stage 1) (Hall 2014).
Treatments for pressure ulcers
There are two main strategies in the treatment of pressure ulcers, namely relief of pressure ‐ commonly using specialist support surfaces (McInnes 2011; NICE 2014) ‐ together with management of the wound environment using wound dressings. Other general strategies include patient education, pain management, optimising circulation/perfusion, optimising nutrition and the treatment of clinical infection (EPUAP‐NPUAP‐PPPIA 2014; NICE 2014). Pressure ulcers are normally expected to show signs of healing within two weeks, but this may not occur and there can be deterioration (EPUAP‐NPUAP‐PPPIA 2014).
Impact of pressure ulcers on patients and financial costs
Pressure ulcers have a large impact on those affected; the ulcers can be painful, and may become seriously infected or malodorous. It has been shown that after adjustment for age, sex and co‐morbidities people with pressure ulcers have a lower health‐related quality of life than those without pressure ulcers (Essex 2009).
The financial cost of treating pressure ulcers in the UK has been estimated to range from GBP 1214 for a Stage 1 ulcer to GBP 14,108 for a Stage 4 ulcer. Costs are mainly dominated by health professional time, and for more severe ulcers, by the incidence of complications including hospital admission/length of stay (Dealey 2012). In 2004, the total annual cost of treating pressure ulcers in the UK was estimated as GBP 1.4 to 2.1 billion, which was equivalent to 4% of the total NHS expenditure (Bennett 2004). Pressure ulcers have been shown to increase length of hospital stay and associated hospital costs (Allman 1999). Figures from the USA suggest that for half a million hospital stays in 2006, 'pressure ulcer' was noted as a diagnosis; for adults, the total hospital cost for these stays was USD 11 billion (Russo 2008). Costs to the Australian healthcare system for treating pressure ulceration have been estimated at AUD 285 million annually (Graves 2005).
Description of the intervention
This review includes RCTs of any dressings or topical agents applied directly onto or into wounds and left in situ, as opposed to products used to irrigate, wash or cleanse wounds and those that are only in contact with wounds for a short period.
Dressings
The classification of dressings usually depends on the key material used in their construction, and whether additional substances are added to the dressing. Several attributes of an ideal wound dressing have been described (BNF 2016; Bradley 1999), including the ability of the dressing to:
-
absorb and contain exudate without leakage or strike‐through, in order to maintain a wound that is moist but not macerated;
-
achieve freedom from particulate contaminants or toxic chemicals left in the wound;
-
provide thermal insulation, in order to maintain the optimum temperature for healing;
-
allow permeability to water, but not bacteria;
-
optimise the pH of the wound;
-
minimise wound infection and avoid excessive slough;
-
avoid wound trauma on dressing removal;
-
accommodate the need for frequent dressing changes;
-
provide pain relief; and
-
be comfortable.
There are numerous and diverse dressings available for treating pressure ulcers and their properties are described below.
Absorbent dressings are applied directly to the wound and may be used as secondary absorbent layers in the management of heavily exuding wounds. Examples include Primapore (Smith & Nephew), Mepore (Mölnlycke) and absorbent cotton gauze (BP 1988).
Alginate dressings are highly absorbent fabrics/yarns that come in the form of calcium alginate or calcium sodium alginate and can be combined with collagen. The alginate forms a gel when in contact with the wound surface; this can be lifted off at dressing removal, or rinsed away with sterile saline. Bonding to a secondary viscose pad increases absorbency. Examples include: Curasorb (Covidien), SeaSorb (Coloplast) and Sorbsan (Unomedical).
Capillary‐action dressings consist of an absorbent core of hydrophilic fibres held between two low‐adherent contact layers. Examples include: Advadraw (Advancis) and Vacutex (Protex).
Films, i.e. permeable film and membrane dressings are permeable to water vapour and oxygen, but not to water or micro‐organisms. Examples include Tegaderm (3M) and OpSite (Smith & Nephew).
Foam dressings contain hydrophilic polyurethane foam and are designed to absorb wound exudate and maintain a moist wound surface. There are a variety of versions and some include additional absorbent materials, such as viscose and acrylate fibres, or particles of superabsorbent polyacrylate, which are silicone‐coated for non‐traumatic removal. Examples include: Allevyn (Smith & Nephew), Biatain (Coloplast) and Tegaderm (3M).
Honey‐impregnated dressings contain medical‐grade honey that is purported to have antimicrobial and anti‐inflammatory properties and can be used for acute or chronic wounds. Examples include: Medihoney (Medihoney) and Activon Tulle (Advancis).
Hydrocolloid dressings are usually composed of an absorbent hydrocolloid matrix on a vapour‐permeable film or foam backing. Examples include: Granuflex (ConvaTec) and NU DERM (Systagenix). Fibrous alternatives that resemble alginates and are not occlusive have also been developed: Aquacel (ConvaTec).
Iodine‐impregnated dressings release free iodine, which is thought to act as a wound antiseptic when exposed to wound exudate. Examples include Iodoflex (Smith & Nephew) and Iodozyme (Insense).
Low‐adherence dressings and wound contact materials usually consist of cotton pads that are placed directly in contact with the wound. They can be non‐medicated (e.g. paraffin gauze dressing, saline gauze dressing) or medicated (e.g. containing povidone iodine or chlorhexidine). Examples include paraffin gauze dressing, BP 1993 and Xeroform (Covidien) dressing ‐ a non‐adherent petrolatum blend with 3% bismuth tribromophenate on fine mesh gauze.
Odour‐absorbent dressings contain charcoal and are used to absorb wound odour. Often this type of wound dressing is used in conjunction with a secondary dressing to improve absorbency. An example is CarboFLEX (ConvaTec).
Other antimicrobial dressings are composed of a gauze or low‐adherent dressing impregnated with an ointment thought to have antimicrobial properties. Examples include: chlorhexidine gauze dressing (Smith & Nephew) and Cutimed Sorbact (BSN Medical).
Protease‐modulating matrix dressings alter the activity of proteolytic enzymes in chronic wounds. Examples include: Promogran (Systagenix).
Silver‐impregnated dressings are used to treat infected wounds, as silver ions are thought to have antimicrobial properties. Silver versions of most dressing types are available, including silver impregnated dressings (e.g. silver hydrocolloid etc). Examples include: Acticoat (Smith & Nephew) and Urgosorb Silver (Urgo).
Soft polymer dressings are composed of a soft silicone polymer held in a non‐adherent layer; these are moderately absorbent. Examples include: Mepitel (Mölnlycke) and Urgotul (Urgo).
Topical agents
Topical agents are defined as hydrogels. ointments and creams that are placed in contact with the wound and left in situ; they may be covered with a secondary dressing.The following types of topical agents are considered as interventions in this review:
Cadexomer‐iodine paste consists of a water‐soluble, modified starch polymer containing iodine. It releases free iodine when exposed to wound exudate. The free iodine acts as an antiseptic on the wound surface, and the cadexomer absorbs wound exudate and encourages de‐sloughing. Examples include: Iodosorb (Smith & Nephew) ointment and powder.
Collagenase‐containing ointment is an enzymatic debriding ointment. Collagenase is thought to digest collagen in necrotic tissue and to contribute to granulation and epithelisation.
Hydrogels consist of a starch polymer and up to 96% water. They can absorb wound exudate or rehydrate a wound depending on the wound moisture levels. Hydrogels are often considered to be dressings, but are also topical in nature. They are supplied in either flat sheets, an amorphous hydrogel or as beads. Examples include: ActiformCool (Activa and Aquaflo (Covidien).
Phenytoin topical is thought to promote wound healing by a number of mechanisms, including stimulation of fibroblast proliferation, facilitation of collagen deposition and antibacterial activity.
Silver sulfadiazine cream is a topical antimicrobial cream that is used to treat and prevent infection in wounds by damaging bacterial cell membranes. Examples include Flamazine (Smith & Nephew) and Silvadene (Pfizer).
Products containing growth factors, platelet‐rich plasma or other platelet‐derived products and colony‐stimulating factors are outside the scope of this review.
How the intervention might work
Animal experiments conducted over 40 years ago suggested that acute wounds heal more quickly when their surfaces are kept moist rather than left to dry and scab (Winter 1962; Winter 1963a; Winter 1963b). A moist environment is thought to provide optimal conditions for the cells involved in the healing process, as well as allowing autolytic debridement (removal of dead tissue by natural processes), which is thought to be an important part of the healing pathway (Cardinal 2009).
The desire to maintain a moist wound environment is a key driver for the use of wound dressings and related topical agents. Whilst a moist environment at the wound site has been shown to aid the rate of epithelialisation in superficial wounds, excess moisture at the wound site can cause maceration of the surrounding skin (Cutting 2002), and it has also been suggested that dressings that permit fluid to accumulate might predispose wounds to infection (Hutchinson 1991). Wound treatments vary in their level of absorbency, so that a very wet wound can be treated with an absorbent dressing (such as a foam dressing) to draw excess moisture away and avoid skin damage, whilst a drier wound can be treated with a more occlusive dressing or a hydrogel to maintain a moist environment.
Some dressings are now also formulated with an 'active' ingredient (e.g. silver, honey or protease modulators).
Why it is important to do this review
The diversity of dressings and related materials available to health professionals for treating pressure ulcers makes evidence‐based decision‐making difficult when determining the optimum treatment regimen for a particular patient (Gillespie 2012; NICE 2014). With increasingly sophisticated technology being applied to wound care, practitioners need to know the relative effectiveness and cost‐effectiveness of these sometimes expensive dressings. Even where cost is not an issue, the most effective treatment may not be available (e.g. in some developing countries) or may be difficult or to use, so that information on the second and third best treatments is important too (Salanti 2011).
Current evidence syntheses include four Cochrane Reviews (Dumville 2015a; Dumville 2015b; Keogh 2013; Walker 2014), two other systematic reviews (Reddy 2008; Smith 2013), and two recent clinical guidelines (EPUAP‐NPUAP‐PPPIA 2014; NICE 2014). Each of these consists of a series of pairwise comparisons. No review finds clear evidence of any effect of one dressing compared to another in terms of assessed outcome measures, including complete wound healing.
In the absence of an overview or network meta‐analysis, decision‐makers have to consider the findings of multiple pairwise randomised controlled trials (RCTs) simultaneously and qualitatively to judge, in the face of uncertainty, which dressing they might decide to use. It is extremely difficult to do this effectively, and this difficulty is compounded when the evidence comprises single small trials, about which decision‐makers may have little confidence.
Network meta‐analysis (NMA) is the simultaneous comparison of linked, multiple, competing treatments in a single statistical model (Caldwell 2005; Chaimani 2013a; Lu 2004; Salanti 2008). NMA utilises evidence from 'direct' (head‐to‐head or 'pairwise') comparisons (e.g. trials directly comparing treatments A and B), 'indirect' comparisons (e.g. the combination of trials comparing A with C and trials comparing B with C), and a synthesis of both when available. When pooling relative effect estimates, NMAs preserve within‐trial randomisation (Grant 2013; Thorlund 2012; Tu 2012).
Where there are relevant common comparators across trials that allow treatments to be linked and form a network of evidence, NMA produces a set of effect estimates for each treatment relative to every other, whether or not they have been compared in head‐to‐head trials. In this way NMA allows us to obtain estimates for comparisons for which there is no (direct) trial evidence. Even when direct evidence is available there may not be much of it, so pooling it with data from indirect comparisons generally gives more robust evidence and reduces uncertainty in the estimates of effect (Higgins 1996; Thorlund 2012). From the NMA analysis, it is possible to evaluate the probability of each treatment being the best for a specific outcome: these probabilities reflect the precision surrounding the effect estimates (Caldwell 2014; Salanti 2011).
A glossary of NMA terms is given in Appendix 2.
This review comprised a network meta‐analysis (NMA) for the outcome of pressure ulcer healing, for alternative dressings and topical agents for the treatment of pressure ulcers of Stage 2 and above. The NMA enabled us to compare pairs of dressings/topical agents, taking into account direct and indirect evidence simultaneously, and explicitly determining the uncertainty in effect estimates. The ranking process allowed us to examine the evidence base as a whole, identifying the support of the evidence for each treatment, having consideration for indirect evidence (where it existed) and fully reflecting evidence uncertainties. We also explored assumptions made in the analysis.
Objectives
To assess the effects of dressings and topical agents for healing pressure ulcers in any care setting. We aimed to examine this evidence base as a whole, determining probabilities that each treatment is the best, with full assessment of uncertainty and evidence quality.
Methods
Criteria for considering studies for this review
Types of studies
We included published and unpublished randomised controlled trials (RCTs), irrespective of language of report. We did not identify any cross‐over trials, but we would have included them only if they reported outcome data at the end of the first treatment period and prior to cross‐over. We excluded studies using quasi‐random methods of allocation (such as alternation). We highlighted trials in which three or more interventions were randomised.
Types of participants
We included studies that recruited people with a diagnosis of pressure ulcer, Stage 2 and above (EPUAP‐NPUAP‐PPPIA 2014), managed in any care setting. We excluded studies that only recruited people with Stage 1 ulcers as these are not open wounds requiring dressings.
We accepted study authors' definitions of what they classed as Stage 2 or above, unless it was clear that they included wounds with unbroken skin. Where authors used grading scales other than NPUAP, we attempted to map to the NPUAP scale.
We included studies that recruited participants with pressure ulcers of Stage 2 severity or higher alongside people with Stage 1 pressure ulcers or other types of complex wound (e.g. leg and/or foot ulcers), or both, provided the allocation of participants was stratified by type of wound or pressure ulcer severity at randomisation and provided the results for people with eligible pressure ulcers (that is Stage 2 or higher) were presented separately (or became available from the study authors). Where studies included participants with Stage 1 ulcers or other types of complex wounds, but these made up 25% or less of the total study population we included all study data.
Types of interventions
Interventions of direct interest (decision set)
The interventions in this section were all those that can be directly applied as dressings or topical agents to open pressure ulcers. We presented results for these interventions and included them in summary tables. In the context of a network of competing treatments, there are no 'comparators'.
We considered trials for which at least one of the interventions was (1) any dressing, including impregnated dressings or saline‐moistened dressings or combination dressings or (2) any topical agent applied directly to an open pressure ulcer and left in situ. Combination dressings are when two or more dressings are applied sequentially over time (e.g., hydrocolloid for four weeks followed by alginate for four weeks), or a product contains two or more types of dressing material (e.g., a multilayer product comprising silicone polymer and hydrocolloid). The treatment of interest had to be the only systematic difference between treatment groups. We did not take into account secondary dressings.
Some of the interventions we considered were as follows:
-
Basic wound contact dressings (includes low‐adherence (including paraffin gauze) or absorbent dressings (of any absorbency))
-
Saline‐moistened gauze (all degrees of moistness)
-
Hydrogel dressing (includes hydrogel sheet or hydrogel application (amorphous) or sodium hyaluronate)
-
Vapour‐permeable films and membranes (includes adhesive film (semi‐permeable) or adhesive film with absorbent pad)
-
Soft polymer dressings (with/without absorbent pad or cellulose)
-
Hydrocolloid dressing (with/without adhesive border or matrix hydrocolloid)
-
Fibrous (spun) hydrocolloid
-
Foam dressings (all absorbencies)
-
Alginate dressings
-
Capillary action dressings
-
Alginate dressing with charcoal
-
Other charcoal‐containing dressing
-
Honey sheet dressing or topical honey
-
Cadexomer iodine ointments
-
Iodine‐containing dressings
-
Soft polymer dressing (with silver)
-
Hydrocolloid (with silver)
-
Foam dressings (with silver)
-
Alginate dressings (with silver)
-
Silver sulfadiazine cream
-
Protease‐modulating matrix dressings
-
Collagenase‐containing ointment
-
Topical phenytoin
-
Topical zinc oxide
-
No dressing (wound left exposed)
-
Other treatments considered by the review team (with additional clinical advice where required) to be dressings or topical agents applied directly to the wound and left in‐situ.
The following interventions were not part of the decision set: treatments in which dressings are attached to external devices such as negative pressure wound therapies, skin grafts, growth factor treatments, platelet gels and larval therapy.
We grouped together dressings in the same class (e.g. alginates) (BNF 2016). This was regardless of a particular brand's stated absorbency, size, concentration of active component or the degree of moistness. Thus, where studies only compared two dressings from the same class (for example, two alginates or two foam dressings), we excluded such studies from the review as they contributed no information about the effectiveness of the class.
We included any RCT in which other concurrent therapies were given (e.g. antibiotics, debridement), provided that these treatments were delivered in a standardised way across the trial arms of the individual trial (such that the treatment of interest was the only systematic difference). We did not treat separately comparisons with and without concurrent therapies, that is, we considered intervention 1 + concurrent therapy versus intervention 2 + concurrent therapy to be the same as intervention 1 versus intervention 2.
One of the assumptions underpinning NMA is that interventions in the network are exchangeable, that is, participants in the network could, in principle, be randomised to any of the treatments being compared. For example, a person with a pressure ulcer could be equally likely to be randomised to an alginate dressing, a polyurethane foam dressing, honey or saline gauze. Depending on the wound requirements for the dressing (e.g. highly absorbent), this may not always be a good assumption for individual wounds, but across the population in the trials may be reasonable.
Supplementary intervention set
Some of the trial interventions were not included in the decision set (see above) but were included in a supplementary intervention set if they linked two or more decision set interventions: such supplementary interventions were of value solely because they allowed inferences to be drawn about the treatments of interest. In our individual network, the supplementary intervention set included radiant heat and skin substitute.
Terminology
For the rest of this review, we use the term 'comparison' to mean two interventions compared in a single study or in a pairwise meta‐analysis of direct data. We use the term 'contrast' to mean two interventions compared across all studies in an NMA. This may be either direct or indirect evidence or both. We use the following terms: 'direct contrast' for interventions linked directly in the network; 'indirect contrast' when the two interventions are linked solely via indirect NMA evidence; and 'mixed treatment contrast' when either direct or indirect evidence or both are involved. Direct evidence may be informed by more than one study comparing the two interventions. Indirect estimates may be calculated using a 'node‐splitting' approach, in which the NMA is run after excluding the direct evidence for a particular contrast.
We also use the term 'core intervention' to mean interventions that form part of at least one loop and 'peripheral interventions' to mean interventions that are not part of a loop and are only connected in a peripheral way.
Types of outcome measures
We reported outcome measures at the last time point available (assumed to be length of follow‐up if not specified) or the time point specified in the methods as being of primary interest (if this was different from the latest time point available). Initially, we noted when studies reported results at other time points or whether they included Kaplan‐Meier plots, or both.
Primary outcomes
The primary outcome for this review was complete wound healing.
We regarded the following as providing the most relevant measures of outcome for the analyses:
-
the proportion of wounds healed (frequency of complete healing: arm‐level data);
-
time to complete healing (survival data: study‐level data).
We accepted authors' definitions of what constituted a healed wound.
Secondary outcomes
We did not consider any secondary outcomes, however they are reported in other relevant reviews (Dumville 2015a; Dumville 2015b; Keogh 2013; Walker 2014).
Search methods for identification of studies
Four existing Cochrane Reviews were relevant to this NMA (Dumville 2015a; Dumville 2015b; Keogh 2013; Walker 2014), and the protocol for this NMA complemented the protocols for these four reviews (an author on these four reviews is also a review author here). We automatically included trials from these reviews in this NMA if they reported complete healing outcomes; we planned to use the extracted data from these reviews where possible, supplementing if necessary which was required as some reviews had not been completed.
We conducted searches to identify relevant trials not covered by the four Cochrane Reviews as well as recently published trials. We cross‐checked the identified trials against those in the 2014 NICE guideline and the 2013 US Agency for Healthcare Research and Quality (AHRQ) guideline on treating pressure ulcers to further locate any additional trials (AHRQ 2013; NICE 2014); we also checked the references of 24 systematic reviews identified by our search.
Electronic searches
We searched the following electronic databases to identify reports of relevant randomised clinical trials:
-
the Cochrane Wounds Specialised Register (searched 12 July 2016);
-
the Cochrane Central Register of Controlled Trials (CENTRAL) (in the Cochrane Library) (2016, Issue 6);
-
Ovid MEDILINE (1946 to 12 July 2016);
-
Ovid MEDLINE (In‐Process & Other Non‐Indexed Citations) (12 July 2016);
-
Ovid Embase (1974 to 12 July 2016);
-
EBSCO CINAHL Plus (1937 to 12 July 2016).
The search strategies for CENTRAL, Ovid MEDLINE, Ovid Embase and EBSCO CINAHL Plus can be found in Appendix 3. We combined the Ovid MEDLINE search with the Cochrane Highly Sensitive Search Strategy for identifying randomised trials in MEDLINE: sensitivity‐ and precision‐maximising version (2008 revision) (Lefebvre 2011). We combined the Embase search with the Ovid Embase randomised trials filter terms developed by the UK Cochrane Centre (Lefebvre 2011). We combined the CINAHL search with the randomised trials filter terms developed by the Scottish Intercollegiate Guidelines Network (SIGN 2017). There were no restrictions with respect to language, date of publication or study setting.
We also searched the following clinical trials registries:
-
ClinicalTrials.gov (www.clinicaltrials.gov)
-
WHO International Clinical Trials Registry Platform (ICTRP) (apps.who.int/trialsearch/Default.aspx)
-
EU Clinical Trials Register (www.clinicaltrialsregister.eu/).
Searching other resources
We searched for other potentially eligible trials or ancillary publications in the reference lists of retrieved included studies as well as relevant systematic reviews, meta‐analyses, guidelines and health technology assessment reports.
Data collection and analysis
Data collection and analysis were carried out according to methods stated in the published protocol (Westby 2015), which were based on the Cochrane Handbook for Systematic Reviews of Interventions (Higgins 2011a).
Selection of studies
Two review authors independently assessed the titles and abstracts of the citations retrieved by the searches for relevance. After this initial assessment, we obtained full‐text copies of all studies considered to be potentially relevant. Two review authors independently checked the full papers for eligibility; disagreements were resolved by discussion and, where required, the input of a third review author. We did not contact study authors. We recorded all reasons for exclusion of the studies for which we had obtained full copies. We completed a PRISMA flowchart to summarise this process (Liberati 2009).
Where studies were reported in multiple publications/reports we obtained all publications. Such a study was included only once in the review, but we extracted data from all reports to ensure maximal relevant data were obtained.
Data extraction and management
We extracted the following information from each included study:
-
interventions being compared, including any ineligible interventions randomised to additional trial groups;
-
duration of the intervention;
-
details of any co‐interventions;
-
the unit of randomisation (e.g. participant or ulcer);
-
the number of ulcers per person;
-
the unit of analysis (including any selection methods for people with multiple ulcers);
-
the number of participants in each arm;
-
the hazard ratio and its 95% confidence interval (CI) (or any data that would allow its calculation (Tierney 2007)) for comparisons between arms);
-
the number of participants that healed in each arm, both at the latest time point or (if different) at another time specified as of primary interest in the study's methods section;
-
all other follow‐up times reported;
-
we noted if a Kaplan Meier plot was displayed;
-
missing data rates per arm, and reasons for 'missingness', including the number of people dying.
Data on potential effect modifiers
We were not aware of any population‐specific effect modifiers for this research question: there was no existing evidence to suggest that one type of dressing worked better than another for certain subgroups, for example, people with different depths of tissue damage.
However, we extracted data that allowed us to determine for each included study factors that may act as effect modifiers (in this context):
-
type of funding (e.g. industry, academic, government); this was dichotomised into non‐for‐profit and other;
-
risk of bias (see Assessment of risk of bias in included studies).
Other data
We also extracted the following data regarding patient and study characteristics at baseline for each intervention arm if possible:
-
care setting;
-
age of participants;
-
duration of pressure ulcer(s);
-
severity/grade of pressure ulcer;
-
nature of pressure ulcer wounds (e.g. sloughy, necrotic, infected);
-
size of pressure ulcer(s).
Assessment of risk of bias in included studies
Cochrane risk of bias assessment
We assessed risk of bias for each included study for the complete healing outcome. There is only one outcome in this review (complete wound healing) and so risk of bias assessments at the outcome level apply to the whole study.
Two review authors independently assessed included studies using the Cochrane risk of bias tool (Higgins 2011b) with involvement of a third author where consensus could not be reached. We also determined an all‐domain risk of bias (see below).
Additionally, we reported separately an overall risk of bias for each direct comparison meta‐analysis and for each contrast in the NMA (see next section).
Overall risk of bias and linking to GRADE assessment
In order to link these Cochrane ratings to the GRADE assessment for risk of bias of the evidence (downgrading 0, 1 or 2 times), we used a two‐stage process. Firstly, we obtained an all‐domain risk of bias for each study and then used this to produce an overall risk of bias for each comparison.
All‐domain risk of bias for each study
We summarised data for each of the key domains of selection bias, detection bias, attrition bias, reporting bias and other bias, assigning one of four ratings: low, unclear, high and very high. For example, selection bias was informed by sequence generation, allocation concealment and comparability of baseline characteristics.
In an adaption of the GRADE approach (Guyatt 2011a), we produced an all‐domain risk of bias, with four ratings defined as:
-
'very high' ‐ two or more key domains with a high risk of bias or a single domain with very high levels of uncertainty (e.g. very high degree of differential missing data);
-
'high' ‐ high risk of bias for any one domain or we judged the risk of bias to be 'almost high' across more than one domain;
-
'low' ‐ low risk of bias for each of the key domains;
-
'unclear' ‐ insufficient information for at least one key domain (with the other domains being at low risk of bias).
Then we grouped together the low and unclear all‐domain risk‐of‐bias ratings.
We included this all‐domain risk of bias in the summary 'Risk of bias' figure, by adding two further columns: red in both of the last two columns indicated 'very high' all‐domain risk of bias; red in the penultimate column (but not the last column) indicated 'high' risk of bias; and the combined low/unclear group was marked green in the penultimate column, with the last column remaining blank.
Overall risk of bias for a direct comparison
Wherever more than one study was pooled in a pairwise meta‐analysis, we assigned an overall risk of bias for that comparison, by calculating a weighted average all‐domain risk of bias across studies; weights were those produced in the meta‐analysis (based on the inverse variance). We assigned numerical values to the all‐domain ratings for each study: low/unclear (1), high (2) and very high (3) and calculated the weighted average.
We used the weighted average to give a rating of overall risk of bias for that comparison: low, high and very high, and aligned these ratings respectively with the GRADE categories of no limitations (not downgraded on risk of bias), serious limitations (downgraded once) and very serious limitations (downgraded twice) (Guyatt 2011a; Salanti 2014).
We superimposed the overall risk of bias for each direct comparison (on the basis of the direct meta‐analysis) on the network diagram, using colours to represent different ratings. We used these overall risks of bias to calculate the risk of bias for each mixed treatment contrast (see below).
Overall risk of bias for each mixed treatment contrast in the network
An NMA comprises a set of interventions linked via a series of comparisons ('direct contrasts'). Each direct contrast contributes data to the evidence for all other contrasts in the network to which that contrast is linked indirectly (and becomes indirect evidence). The contribution of each piece of indirect evidence to a mixed treatment contrast depends on its point estimate, precision and relative location within the network, and on that of any direct evidence or other indirect evidence (Chaimani 2013b; Salanti 2014). A recently published tool, Krahn 2013, allows such contributions to be determined for each contrast in the network informed by direct and indirect evidence. We summarised the percentage contribution of each direct contrast to each network estimate in a matrix with columns and rows corresponding to the direct and mixed treatment contrasts respectively.
The overall risk of bias for each mixed treatment contrast is a composite measure of the risks of bias for all the contributing direct contrasts (that is, the sum of the all‐domain risks of bias for all the direct contrasts, each weighted by their percentage contributions to the mixed treatment contrast).
We calculated the overall risk of bias for the entire network using percentage contributions to the whole network for each direct contrast.
Measures of treatment effect
Relative treatment effects
For each contrast in the NMA, we presented the risk ratio with its 95% CI. We used raw data from individual studies, taking the number of ulcers healed at the latest time point, unless otherwise stated.
We also recorded separately the time‐to‐healing outcome for studies that reported this.
Relative treatment ranking
We presented the relative treatment ranking as a cumulative probability at each rank and as a Surface Under the Cumulative RAnking (SUCRA) value for each treatment (see Data synthesis ‐ methods for indirect and mixed comparisons and Appendix 2).
Unit of analysis issues
We expected the main unit of analysis issues to occur when participants had more than one wound per person. In these cases, we treated the participant as the unit of analysis when the number of wounds assessed appeared to be equal to the number of participants (e.g. one wound per person). This included studies in which participants were randomised to treatments and there was more than one wound per person, but results were reported for one selected wound; we considered whether there was risk of bias in the selection process.
Where studies randomised at the participant level, used the allocated treatment on multiple wounds per participant, and measured and analysed outcomes at the wound level (e.g. wound healing), we expected there to be unit of analysis issues if the data were not correctly analysed. In practice, there was insufficient information to approximate the correct analyses (in accordance with Chapter 16 of the Cochrane Handbook for Systematic Reviews of Interventions, using information adapted from Higgins 2011c), so we assessed risk of unit‐of‐analysis bias, taking into account the number of people randomly assigned to each intervention; and the average (mean) number of wounds per person.
Dealing with missing data
It is common to have data missing from trial reports. Excluding participants post‐randomisation, or ignoring those participants who withdrew from the trial or were lost to follow‐up, compromises the randomisation and potentially introduces bias into the trial. Where data were missing for the primary outcome of proportion of ulcers healed, we assumed participants did not have the outcome (i.e. they were considered in the denominator but not the numerator). We examined this assumption in a sensitivity analysis, using a complete case analysis instead.
Assessment of heterogeneity
Assessment of clinical and methodological heterogeneity within treatment comparisons
We assessed the presence of clinical heterogeneity within each pairwise direct comparison (i.e. the degree to which studies varied in terms of participant, intervention and outcome characteristics) by comparing information extracted for included studies.
Assessment of transitivity across treatment contrasts
'Transitivity' refers to the situation in which an intervention effect measured using an indirect contrast is valid and equivalent to the intervention effect measured using a direct contrast. Where there are differences in (known or unknown) effect modifiers across contrasts, the transitivity assumption may not be met which may generate statistical inconsistency in the network (Grant 2013; Jansen 2013). We did not identify any potential effect modifiers from the literature, so there was no evidence that the transitivity assumption was not met. There were also limited underlying theoretical reasons to consider effect modification for these treatments.
If we had had sufficient data we planned to explore the effect of the funding source and differences in risk of bias as possible effect modifiers across the network. However, there was insufficient variation in these factors.
Assessment of reporting biases
We assessed for the presence of publication bias using a contour‐enhanced funnel plot, provided there were at least 10 included studies (Peters 2008; Salanti 2014).
Data synthesis
General methods
We performed analyses in a frequentist framework using the statistical software STATA (STATA 2013). This is a change from the protocol, in which we had proposed a Bayesian framework using the statistical software WinBUGS for most of the analyses (Dias 2016; Lunn 2000; Lunn 2009; Spiegelhalter 2003; WinBUGS 2015), and STATA to calculate contributions of direct contrasts to the NMA results. One major advantage of the Bayesian framework would have been to confer flexibility by explicitly considering the duration of follow‐up across studies by modelling the hazard function (Dias 2016; Saramago 2014; Soares 2014). However, there was insufficient variation in follow‐up duration and fewer than 20% of the studies reported time‐to‐event data, in six contrasts without loops, so we could not justify modelling the outcome data in this way. We therefore conducted analyses using the proportion healed, and we pooled risk ratios, ignoring differences in follow‐up, This lack of need to model time, together with recent software developments in STATA for NMA (especially the contributions matrix routine, important for GRADE analysis), led to a decision to use a frequentist approach in STATA for all analyses (Chaimani 2013a; Chaimani 2013b; Chaimani 2015; Gasparrini 2015; Salanti 2014).
We have given a brief description of the STATA analytical routines used in Appendix 4, together with routines that enabled us to display the output visually (Chaimani 2013b). Where there were zero events in any one arm of a trial, we added 0.5 to the numerator and 1 to the denominator for each arm in the trial, in accordance with the general approach taken by STATA.
Methods for standard meta‐analysis
We performed pairwise meta‐analyses in a frequentist framework, both within the STATA software and also using Review Manager 5 (RevMan 5) (RevMan 2014) for convenience in producing forest plots. For RevMan, we used both inverse variance weighting and a random‐effects model (for consistency with the NMA methods). Results for the two sets of software were compared and found to be identical in most cases; where there were differences we reported both sets of results. Differences were due to how zero cells are dealt with.
Methods for network meta‐analysis
We initially used the STATA software to produce a network diagram based on all included studies in order to inform the analysis plan (Chaimani 2013b). We then excluded from the analysis two‐arm studies in which one of the interventions could be described as 'standard care' or 'mixed care' involving the choice of more than one treatment because they crossed intervention categories. We also excluded from the analysis studies that had one intervention of direct interest (e.g. hydrocolloid) compared with one ineligible intervention (e.g. radiant heat), unless we found, after examining the network diagram, that the ineligible intervention linked two or more interventions of direct interest.
We performed multivariate network meta‐analysis using STATA routines. This took into account correlations between the effect sizes from multi‐arm studies (Chaimani 2013a; Chaimani 2013b; White 2012). We used a consistency model (which assumes that there is agreement between direct and indirect sources of evidence) and assumed a random‐effects model. The NMA results were reported for 'mixed treatment contrasts', which means the evidence synthesis involved both direct evidence and indirect evidence from across the whole network. The output was reported as pooled risk ratios, with their 95% CIs.
We evaluated the surface under the cumulative ranking curve (SUCRA) and obtained mean ranks (Salanti 2011) for each treatment. Both these measures are based on an assessment of the probability of each treatment being best, second best, etc. In general, the probability that a particular treatment ranks best represents the likelihood of it being considered the most effective (within the pool of treatments analysed) reflecting the evidence of effectiveness and the precision surrounding the estimates. It is expressed as a proportion, where a value of 1 means that the evidence determines that a particular treatment is the best with certainty and 0 is the certainty that it is not the best. The SUCRA is a numerical summary of the distribution of ranks for each treatment (probability of being best, second best, etc) and provides a hierarchy of the treatments that accounts both for the location and the variance of all relative treatment effects. The larger the SUCRA value, the better the rank of the treatment.
We conducted two NMAs: one for individual treatments and one in which dressings interventions were grouped in broader categories, with clinical guidance. We had planned the second (grouped) network as a sensitivity analysis at the protocol stage, but later decided to conduct this analysis in parallel with the individual treatment NMA, because we expected the group analysis to provide valuable and complementary clinical information. The results of the group analysis are presented in Appendix 5.
Assessment of statistical heterogeneity
We assessed statistically the presence of heterogeneity within each pairwise comparison using the I² (Higgins 2003) and tau² statistics from the RevMan 5 analyses; I² measures the percentage of variability that cannot be attributed to random error and tau² measures the extent of heterogeneity among the intervention effects observed in different studies. We also took into account the overlap of CIs and the variability in the point estimates.
Assessment of statistical inconsistency
We assessed inconsistency in two main ways: determining local inconsistencies (around particular contrasts in the network) and assessing inconsistency for the network as a whole. These tests are often underpowered so we assessed at the 90% significance level.
Local approaches to evaluating inconsistency
To evaluate the presence of inconsistency locally we considered two main approaches.
Firstly, we used a loop‐specific approach. This method evaluated the consistency assumption in each closed loop of the network separately as the difference between direct and indirect estimates for a specific contrast in the loop (inconsistency factor: IF). We assumed a common heterogeneity estimate within each loop. We report results as the ratio of risk ratios (RoRR) with its 90% CI ‐ the natural logarithm of the RoRR is the same as IF (Appendix 2). The magnitude and 90% CIs were used to draw inferences about the presence of inconsistency in each loop. If the CI excluded 1, statistically there was significant inconsistency. We also considered whether the CI included 2 or more (or 0.5 or less). This means that the direct estimate could be twice as large (half as big) as the indirect estimate, which is an indication of potential inconsistency (Chaimani 2013b). We also report the IF assuming a common heterogeneity estimate for the whole network (Veroniki 2013).
Secondly, we considered a "node splitting" approach (Dias 2010; Salanti 2014) This method was applied, singly, to each direct contrast (called a "node" by Dias 2010). The STATA routine calculated an indirect estimate using the rest of the network, by running the NMA after excluding the direct evidence for that contrast. The indirect estimates were then compared with the respective direct estimates, again calculating a RoRR with its 90% CI for each contrast.
Finally, we compared NMA results using inconsistency versus consistency assumptions for each contrast.
Global approaches to evaluating inconsistency
We evaluated consistency in the entire network simultaneously, by extending the analysis to include an inconsistency model that omitted consistency equations (Dias 2013). The latter used a design‐by‐treatment interaction model, which allowed for different designs (2‐arm trials (A‐X); 2‐arm trials without A, and 3‐arm trials, where A is the base treatment). This approach produced a set of inconsistency parameters. After fitting the inconsistency model, the null hypothesis of consistency is tested for the set of inconsistency parameters using a global Wald test. This test may lack power and we considered a significance level of P < 0.1 (Higgins 2012; White 2012).
Investigation of heterogeneity and inconsistency
If there had been sufficient studies available, we would have performed network meta‐regression or subgroup analyses using funding source and risk of bias as possible sources of inconsistency or heterogeneity, or both. This was not possible.
Sensitivity analysis
We had intended to re‐analyse the network with studies removed that were considered to be at high risk of bias for any one or more of selection, attrition or detection bias, however, due to the sparseness of the data available and the generally poor methodological quality of the studies, this analysis had to be restricted to removing studies with two or more domains at high risk of bias ("very high risk of bias") (Appendix 6).
We conducted a sensitivity analysis to assess the impact of imputing missing outcome data on the network estimates, via assessment of risk of attrition bias (as defined in Appendix 6), testing the assumption of imputation of no event for missing data by conducting a complete case analysis.
Quality assessment of evidence (GRADE) generated from the NMA and 'Summary of findings' table
We summarise the findings according to GRADE principles (Schünemann 2011a; Schünemann 2011b).
The quality of the data included in any synthesis model is key to determining the validity of the results and of inferences made. We explored the application of GRADE methodology to network meta‐analysis, focusing on the approach of Salanti 2014. We assessed evidence quality (certainty) in two main ways, firstly, for each contrast and secondly, for the network as a whole, in order to assess the quality of the ranking order. We assessed GRADE factors as follows:
-
Risk of bias: we considered contributions for each particular contrast, and used them to assess the overall risk of bias for that contrast (see Assessment of risk of bias in included studies section, Risk of bias for each contrast in the network). We assessed overall risk of bias per contrast and also for the network as a whole.
-
Indirectness: we defined this as without limitations in GRADE because we had not identified any effect modifiers.
-
Inconsistency:
-
At the level of the contrast, inconsistency could only be assessed where there was both direct and indirect evidence. We took into consideration heterogeneity in the direct evidence for that contrast (see Data synthesis, Assessment of statistical heterogeneity) and inconsistency, as described above (see Data synthesis, Local approaches to evaluating inconsistency). We assessed GRADE inconsistency as 'serious limitations' if there was heterogeneity in the direct estimate or inconsistency in the network with respect to that contrast. We attributed 'very serious limitations' to the contrast if there was severe heterogeneity or severe inconsistency or limitations with both heterogeneity and inconsistency, as agreed by two review authors.
-
At the level of the network, we considered the global Wald test for inconsistency (see Data synthesis, Assessment of statistical inconsistency). Tests of this nature are typically underpowered, so a P value less than 0.1 was considered significant. Additionally, if several contrasts showed direct and indirect results that would have led to different clinical decisions, we assigned inconsistency.
-
-
Imprecision: currently, NMA GRADE methods do not consider the optimal information size (OIS) approaches used for systematic reviews of pairwise interventions (Guyatt 2011b) and imprecision is based solely on the CI in relation to minimum important difference (MID) values or the null (Salanti 2014), or both. However, in the type of sparse networks typically found in wounds research, the small sample size and ensuing Type I and Type II errors are potentially more of an issue (Dumville 2012; Soares 2014). We firstly considered whether the network was sparse, taking into account the total number of participants, the total number of events and the number of interventions and contrasts in the NMA. If we considered the network not to be sparse, we applied the methods of Salanti 2014. If we considered the network to be sparse, we used the following approach adapted from the Salanti 2014 guidance:
-
At the level of the contrast ‐ we considered the CI for the individual contrast in relation to the GRADE 'default' minimum important difference (MID) values of RR = 1.25 and 0.75. If the CI crossed both of these MIDs, we downgraded twice for imprecision. If the CI crossed one MID, we downgraded once, regardless of whether the null was crossed. For contrasts involving peripheral interventions, for which large effects were found, we additionally took into account the amount of direct evidence involving this intervention, considering (in an analogous way to simple meta‐analysis) whether the evidence was 'fragile' because of small numbers of events (Guyatt 2011b).
-
At the level of the network, we took into consideration the overlap of the rankograms/the magnitude of the SUCRA estimates and the sparseness of the network.
-
-
We assessed publication bias by plotting a contour‐enhanced funnel plot, which allowed visual assessment of asymmetry for either a particular contrast (all one colour) or for the network as a whole. We did this for the former only if there were 10 studies or more.
We have presented the main results of the review in a 'Summary of findings' table, reporting the results for a representative set of contrasts, with one row for each intervention versus saline gauze. Such tables present key information concerning the certainty (formerly, quality) of the evidence, the magnitude of the effects of the interventions examined, and the sum of the available data (Schünemann 2011a). 'Summary of findings' tables also include an overall grading of the evidence using the GRADE approach. The GRADE approach defines the certainty of a body of evidence as the extent to which one can be confident that an estimate of effect or association is close to the true quantity of specific interest.
For calculating absolute risk differences for the probability of healing we used a 'control group risk', calculated as the median of the probability of healing for saline gauze across all studies with these interventions.
Results
Description of studies
Results of the search
The search generated 1038 records: we obtained 381 full papers Figure 1); 305 studies were excluded with reasons (Characteristics of excluded studies). We included 51 studies described in 74 reports. Two protocols of studies were also identified (ISRCTN57842461; ChiCTR‐TRC‐13003959), which appear to be ongoing (see Characteristics of ongoing studies).

Study flow diagram
We also searched reference lists from identified systematic reviews and for two recent guidelines, but found no extra studies outside the electronic searching.
Included studies
This review distinguishes three sets of included studies: (i) all studies that meet the inclusion criteria ('all included studies'); (ii) the subset of (i) for which all studies have interventions that are joined into the network ('the individual network') (see Effects of interventions) and (iii) the subset of (i) for which all studies are joined in a network in which interventions are grouped ('the group network') (see Appendix 5). In this section we have given a brief summary for the individual network. Further details of each set of included studies are given in Table 1.
| Study characteristic | Studies in the individual | Studies in both individual and group networks | Studies in the group network only | Studies included in neither network | |
| Publication (all others were full published papers) | Conference abstracts (5) | ||||
| Multiple interventions | > 2 arms (4) | Nussbaum 1994; Ramos‐Torrecillas 2015 (4 arms) | |||
| Unit of randomisation (all other studies randomised individuals) | Ulcers randomised (5) | ||||
| Cluster‐randomised (2) | |||||
| not stated (3) | |||||
| Funding | Industry funding (18) | Banks 1994c; Belmin 2002; Brod 1990; Brown‐Etris 2008; Hondé 1994; Motta 1999 | Banks 1994a; Burgos 2000b; Colwell 1993; Kraft 1993; Neill 1989a; Payne 2009; Piatkowski 2012; Thomas 1998 | ||
| Mixed industry and non industry (2) | |||||
| Non industry (10) | Brown‐Etris 1997; Hollisaz 2004; Kaya 2005; Muller 2001; Oleske 1986; Xakellis 1992 | ||||
| Not stated (21) | Aguilo Sanchez 2002; Bale 1997a; Brown‐Etris 1996; Darkovich 1990; Meaume 2003; Price 2000; Seeley 1999; Seeley 1999; Thomas 1997a; Thomas 2005 | Alm 1989; Banks 1994b; Barrois 1992; Matzen 1999; Parish 1979; Romanelli 2001; Zeron 2007 | |||
| Setting | Community only (6) | ||||
| Hospital only (20) | Bale 1997a; Banks 1994c; Belmin 2002; Hondé 1994; Sopata 2002 | Alm 1989; Burgos 2000b; Colwell 1993; Kaya 2005; Muller 2001; Oleske 1986; Piatkowski 2012; Zeron 2007 | Gorse 1987; Imamura 1989; Nisi 2005; Nussbaum 1994; Ramos‐Torrecillas 2015; Yapucu Güneş 2007 | ||
| Hospital and other setting (7) | Price 2000 (hospital and community); Darkovich 1990 (hospital and care home); Brown‐Etris 1996 (hospital and community and care home) | Banks 1994b (hospital and community); Kraft 1993; Neill 1989a (hospital and care home); Payne 2009 (hospital and community and care home) | Ashby 2012 (hospital and community) | ||
| Care home and community (5) | |||||
| Care home only (5) | |||||
| Not stated (7) | |||||
| Follow‐up time | < 6 weeks (8) | Oleske 1986; Parish 1979; Payne 2009; Piatkowski 2012; Zeron 2007 | |||
| 6 to 8 weeks (25) | Aguilo Sanchez 2002; Banks 1994c; Belmin 2002; Brod 1990; Brown‐Etris 2008; Hondé 1994; Meaume 2003; Motta 1999; Price 2000; Seeley 1999; Sopata 2002; Thomas 1997a; | Alm 1989; Banks 1994a; Barrois 1992; Brown‐Etris 1997; Graumlich 2003; Hollisaz 2004; Neill 1989a; Romanelli 2001 | Imamura 1989; Nisi 2005; Nussbaum 1994; Sebern 1986; Van De Looverbosch 2004 | ||
| > 8 to 12 weeks (10) | Banks 1994b; Burgos 2000b; Colwell 1993; Matzen 1999; Thomas 1998 | ||||
| ≥ 16 weeks (7) | |||||
| Unclear (1) | |||||
| Mean age | < 65 years (8) | ||||
| Not stated (1) | |||||
| Physical conditions | Spinal cord injuries (4) | ||||
| Other (2) | Sopata 2002 (advanced cancer) | Parish 1979 ("chronically ill or physically disabled") | |||
| Ulcer grade | Mainly Stage 2 (17) | Bale 1997a; Thomas 1997a (Stirling); Brown‐Etris 2008 (classification not stated); Darkovich 1990 (Enis and Sarmiento); Hondé 1994 (Shea); Meaume 2003 (EUPAP) | Colwell 1993 (classification not stated); Graumlich 2003; Kaya 2005; Payne 2009 (NPUAP); Hollisaz 2004; Neill 1989a; Xakellis 1992 (Shea); Kraft 1993 (Enterstomal Therapy); Oleske 1986 (Enis and Sarmiento) | Gorse 1987; Van De Looverbosch 2004 (classification not stated) | |
| Mainly Stage 3 (15) | Belmin 2002 (Yarkony); Seeley 1999 (AHCPR); Thomas 1997a (Stirling); Serena 2010 (NPUAP); Brown‐Etris 1996; Motta 1999; Price 2000; Thomas 2005 (classification not stated) | Burgos 2000b (classification not stated); Piatkowski 2012 (EPUAP) | Sipponen 2008 (EPUAP) | Ashby 2012; Ramos‐Torrecillas 2015; (EPUAP classification); Yapucu Güneş 2007 (AHCRQ); Payne 2004 (classification not stated) | |
| Mainly Stage 4 (2) | Matzen 1999; Muller 2001 (classification not stated) | ||||
| Other (12) | Banks 1994c (II/III); Sopata 2002 II/III (Torrance); Brod 1990 (II/III) (classification not stated) | Banks 1994a (II/III); Brown‐Etris 1997 (II/III/IV) (classification not stated); Banks 1994b (Torrance II/III); Romanelli 2001 (II/III); Zeron 2007(2/3) (NPUAP) | Nisi 2005 (2‐4); Rees 1999 (3/4) (NPUAP); Sebern 1986 (II/III) (Shea); Imamura 1989 (II/III/IV) (classification not stated) | ||
| Not stated (5) | |||||
| Ulcer duration (other studies had ≥ 3 months) | < 3 months (16) | Banks 1994c (median 7 days); Belmin 2002; Brown‐Etris 1996; Brown‐Etris 2008; Meaume 2003; Motta 1999; Seeley 1999; Sopata 2002 (mean 2.5 weeks); Thomas 1997a | Banks 1994a; Burgos 2000b; Colwell 1993; Graumlich 2003; Hollisaz 2004; Kraft 1993; Payne 2009 | ||
| ≥ 3 months (6) | |||||
| Not stated/unclear (29) | Aguilo Sanchez 2002; Bale 1997a; Brod 1990; Darkovich 1990; Hondé 1994; Price 2000; Thomas 2005 | Banks 1994b; Barrois 1992; Brown‐Etris 1997; Kaya 2005; Matzen 1999; Muller 2001; Neill 1989a; Oleske 1986; Parish 1979; Piatkowski 2012 (> 4 weeks); Romanelli 2001; Thomas 1998; Xakellis 1992; Zeron 2007 | Gorse 1987; Imamura 1989; Nisi 2005; Nussbaum 1994 (> 6 weeks); Sebern 1986; Van De Looverbosch 2004 (> 1 month); Yapucu Güneş 2007 | ||
Fifty‐one studies, involving 2947 participants, met the inclusion criteria for the whole review. Most of these studies could be linked to form a network of interventions, but 12 were not linked into the network; further details, and the results for the comparisons reported in these 12 studies are given in Appendix 7. The joined network (Figure 2) included 39 studies (Aguilo Sanchez 2002; Alm 1989; Bale 1997a; Banks 1994b; Banks 1994a; Banks 1994c; Barrois 1992; Belmin 2002; Brod 1990; Brown‐Etris 1996; Brown‐Etris 1997; Brown‐Etris 2008; Burgos 2000b; Colwell 1993; Darkovich 1990; Graumlich 2003; Hollisaz 2004; Hondé 1994; Kaya 2005; Kraft 1993; Matzen 1999; Meaume 2003; Motta 1999; Muller 2001; Neill 1989a; Oleske 1986; Parish 1979; Payne 2009; Piatkowski 2012; Price 2000; Romanelli 2001; Seeley 1999; Serena 2010; Sopata 2002; Thomas 1997a; Thomas 1998; Thomas 2005; Xakellis 1992; Zeron 2007). The median (range) study size was 41 (10 to 168).

Network diagram ‐ individual interventions, by risk of bias (3 categories)
Key: green = low/unclear; yellow = high; red = very high overall risk of bias for the contrast. The number of studies for each contrast is given in Table 2.
The majority of the 39 studies had only two randomised interventions (37), randomised people rather than ulcers or clusters (34), included at least some of the participants from a hospital setting (20), and were not funded by industry (7) or funding was not stated (17). The median follow‐up time was eight weeks; range 10 days to 6 months. Most studies included participants with a mean age more than 65 years (33) and had ulcers that were mainly Stage 2 (15), Stage 3 (10) or Stages 2 and 3 (7). Sixteen studies included participants with ulcers of less than three months' duration; two had more than three months' duration and the rest (21) were unclear on duration. Further details are given in Table 1. We considered the clinical characteristics to be sufficiently similar across the studies to combine in the analysis, particularly since we had not defined clinical effect modifiers.
Excluded studies
We excluded 305 studies from this review (see Characteristics of excluded studies) The most common reasons for exclusion were 67 with a non‐RCT study design; ineligible outcomes in 120 studies (including 64 with healing outcomes that were not reported as the time to complete healing or the probability of complete healing) and 57 had an ineligible patient population. Eleven studies were excluded because they had two interventions in the same class and 36 other studies had ineligible interventions in both randomised arms, or had treatments that could not be classified as a single intervention.
Risk of bias in included studies
Risk of bias for all included studies is summarised in Figure 3. In order to represent 'very high' risk of bias, we have used two columns ‐ so very high risk of bias occurs when the cell is red in the final column (see Assessment of risk of bias in included studies).
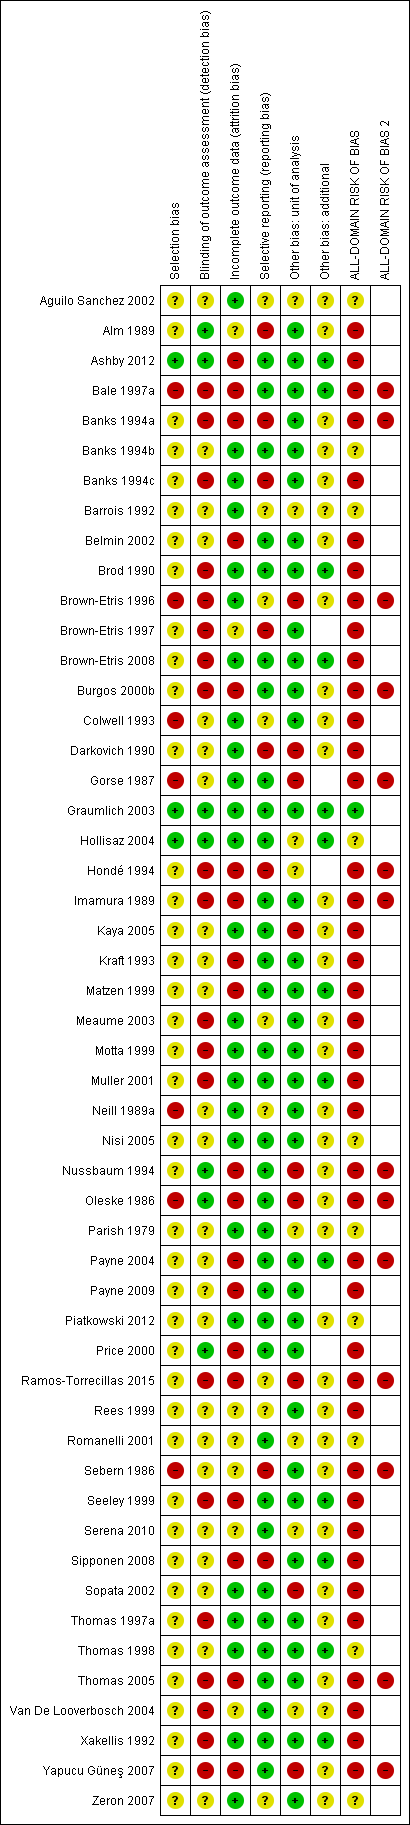
Risk of bias summary: review authors' judgements about each risk of bias item for each included study
We judged only one of the 51 studies (2%) to be at low risk of bias (Graumlich 2003) and ten (20%) to have unclear risk of bias (Aguilo Sanchez 2002; Banks 1994b; Barrois 1992; Hollisaz 2004; Nisi 2005*; Parish 1979; Piatkowski 2012; Romanelli 2001; Thomas 1998; Zeron 2007). We judged 14 (27%) studies to be at very high risk of bias, that is, to have high risk of bias for two or more domains (Bale 1997a; Banks 1994a; Brown‐Etris 1996; Burgos 2000b; Gorse 1987*; Hondé 1994; Imamura 1989*; Nussbaum 1994*; Oleske 1986; Payne 2004*; Ramos‐Torrecillas 2015*; Sebern 1986*; Thomas 2005; Yapucu Güneş 2007*). We assessed the rest of the studies at high risk of bias. We grouped the low and unclear categories together.
*Studies marked with an asterisk were not included in the individual network.
Effects of interventions
In this section, we present the results for the individual NMA. Results for the group network are given in Appendix 5.
We report the results in two ways. Firstly, we give risk ratios (RR) with their 95% CIs for each intervention compared with every other intervention in the network (NMA effect estimates); all results are presented in a forest plot, but we focus on a representative set of comparisons versus a reference intervention (saline gauze for the individual network). Secondly, we summarise findings for the network as a whole, giving the rank order for all the interventions in the network and the probability that a particular intervention is the best, second best, etc treatment.
We report the results alongside the assessment of evidence quality. To do this we applied various statistical techniques and tests, including methods for determining risk of bias in the whole network, examining whether the results for each comparison in the network were consistent with one another, and considering the uncertainty in various measures (e.g. the CI around the RR). For the latter, we downgraded evidence twice if the 95% CI crossed both of the two GRADE 'default' values (RR = 1.25 and RR = 0.75) and once if the 95% CI crossed one of these values. Additionally, if there was a large effect and there were very few events in the direct evidence for a particular intervention, we downgraded the evidence further ('fragility'; see Data synthesis, Quality assessment). We also conducted some sensitivity analyses to test assumptions made in the analysis. Much of the assessment of evidence quality is reported in Appendices, but is summarised in 'Summary of findings' tables for the comparisons with the reference intervention.
Interventions and comparisons
The individual network comprised 21 interventions: 13 eligible dressings (foam, hydrocolloid, alginate, protease‐modulating, iodine‐containing, soft polymer, vapour‐permeable, silicone‐foam combination, two alginate‐hydrocolloid combination or sequential dressings, saline gauze, polyvinylpyrrolidone plus zinc oxide and basic wound contact); six topical agents (hydrogel, dextranomer, collagenase ointment, phenytoin, tripeptide copper gel, and sugar plus egg white) and two supplementary linking interventions (skin substitute and radiant heat dressing).
Two studies were three‐arm trials: Hollisaz 2004 (hydrogel, phenytoin and saline gauze); and Parish 1979 (dextranomer, collagenase ointment, and sugar plus egg white). The total number of comparisons was 43, encompassing a total of 2127 participants, who experienced a total of 783 events (complete healing) ‐ this is 72% of the participants included in all studies in the review before we excluded studies for not fitting into the network. There were 27 different direct contrasts and eight triangular loops, including one that was exclusive to one of the three‐arm trials (Parish 1979).
In the network diagram (Figure 2), node (circle) size reflects weighting according to the number of studies reporting each intervention and the thickness of the edge lines reflects weighting according to the inverse variance of the direct treatment effect estimates for the particular contrast (Chaimani 2013b). We identified seven interventions as 'core interventions' (i.e. part of at least one loop: foam dressing, hydrocolloid dressing, hydrogel, iodine‐containing dressing, phenytoin, protease‐modulating dressing and saline gauze). The other interventions were only connected in a peripheral way.
Risk of bias for the individual network
We report risk of bias in three ways (see Methods: Assessment of risk of bias in included studies):
-
For each study, as the all‐domain risk of bias ‐ taking into account selection bias, detection bias, attrition bias, reporting bias and other bias
-
For each direct comparison of two interventions, as an overall risk of bias ‐ taking into account the all‐domain risk of bias for the studies (1 above) and the weighting in the meta‐analysis for that comparison
-
For each contrast in the network (any pair of interventions in the network) as the overall risk of bias ‐ taking into account the risk of bias for each direct comparison (2 above) and their percentage contributions to the network estimate. We also calculated the overall risk of bias in the network as a whole.
All‐domain risk of bias for each study is shown in Figure 3. We judged one study to be at low risk of bias (Graumlich 2003) and nine at unclear risk of bias (Aguilo Sanchez 2002; Banks 1994b; Barrois 1992; Hollisaz 2004; Parish 1979; Piatkowski 2012; Romanelli 2001; Thomas 1998; Zeron 2007). Seven were at very high risk of bias (Bale 1997a; Banks 1994a; Brown‐Etris 1996; Burgos 2000b; Hondé 1994; Oleske 1986; Thomas 2005) and the rest we assessed to be at high risk of bias. We grouped the low and unclear categories together.
We have indicated the overall risk of bias for each direct comparison in Figure 2, using colour for three risk of bias ratings: low/unclear (green), high (yellow), very high (red). There is a relatively large amount of direct evidence at high or very high risk of bias.
For each contrast in the network, we calculated the overall risk of bias as described in Appendix 8, and the 'Risk of bias' ratings are shown beside the results in Figure 4.
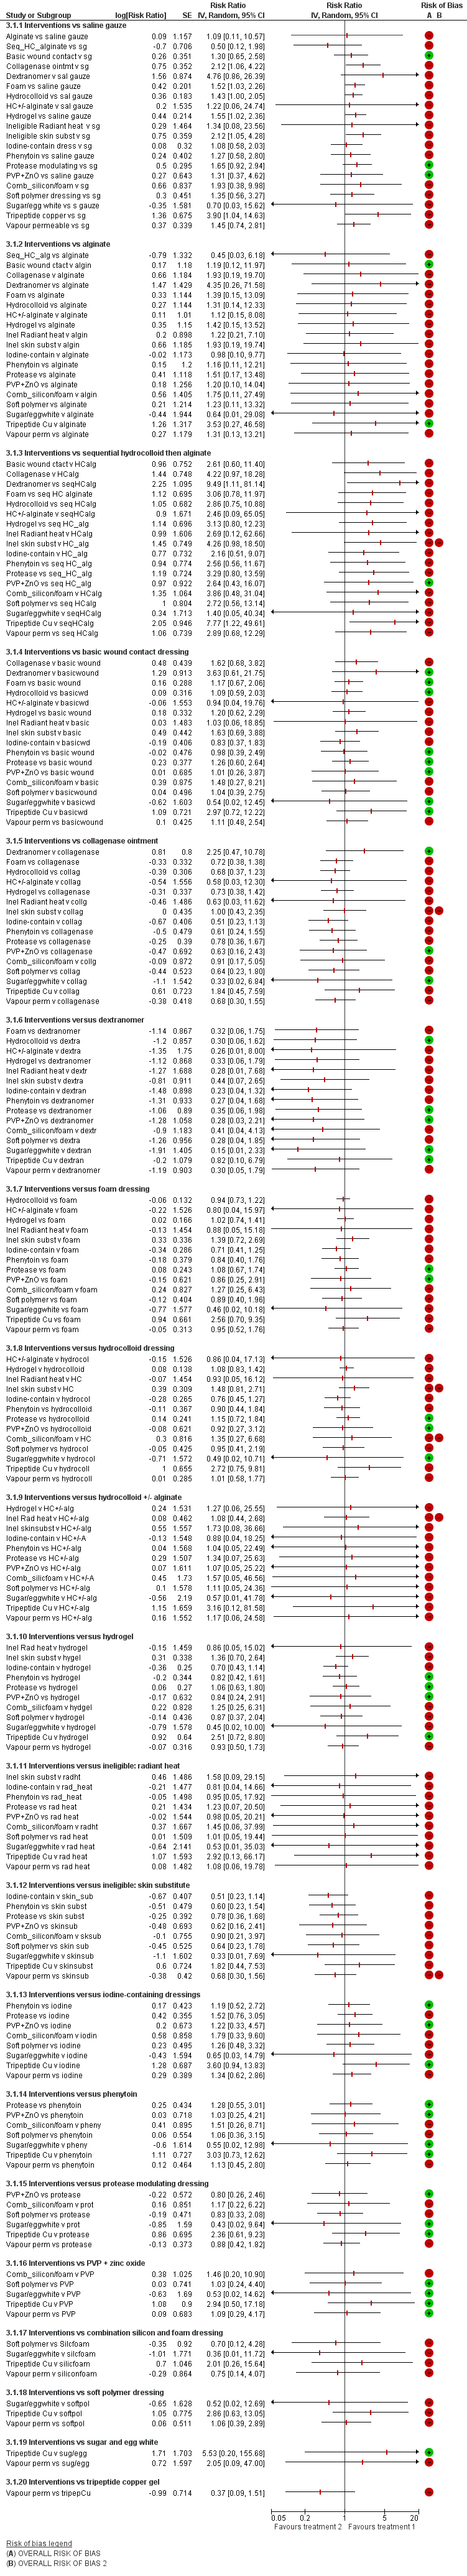
NMA results: individual intervention 1 versus individual intervention 2
Key for overall risk of bias for the contrast: green = low/unclear; one red = high; two reds = very high
Network meta‐analysis results
The NMA generated results for 210 mixed treatment contrasts (i.e. all possible pairwise combinations of the interventions). The data were sparse and there was much uncertainty.
Figure 4 shows all NMA results, with the all‐domain risk of bias shown alongside the forest plot contrasts.
As a consequence of the sparseness in the network, no contrast had precise estimates, all CIs were wide or very wide and we downgraded all evidence at least once for imprecision, some because of 'fragility' (Figure 4). The majority of the evidence for each contrast was informed by studies at high or very high risk of bias. Across all the mixed treatment contrasts, there was only one that we assessed to have moderate‐certainty evidence (downgraded once only): protease‐modulating dressing versus saline gauze. Evidence for all other contrasts was of low or very low certainty, and the moderate‐certainty evidence should also be interpreted in the light of the very low‐certainty evidence for the network from which it was derived.
As a summary, we presented the evidence for the individual mixed treatment contrasts using a representative set of each intervention versus saline gauze (summary of findings Table for the main comparison) and Figure 4, first subgroup of results); we did not include the ineligible interventions (radiant heat and skin substitute) in the 'Summary of findings' table. Further details of information used for GRADE assessment can be found in Appendix 8 and Appendix 9).
It is not clear whether protease‐modulating dressings increase the probability of pressure ulcer healing, compared with saline gauze dressings (RR 1.65; 95% CI 0.92 to 2.94, moderate certainty evidence). This corresponds to an absolute risk difference of 102 more people healed per 1000 (95% CI 13 fewer to 305 more), for a saline gauze median probability of healing of 157 per 1000. We downgraded the evidence once for imprecision (low risk of bias).
For each of four contrasts, it is unclear whether the intervention increases the probability of healing compared with saline gauze dressings: collagenase ointment (RR 2.12; 95% CI 1.06 to 4.22); foam dressing (RR 1.52; 95% CI 1.03 to 2.26); basic wound contact dressing (RR 1.30; 95% CI 0.65 to 2.58) and polyvinylpyrrolidone (PVP) plus zinc oxide (RR 1.31; 95% CI 0.37 to 4.62) (Figure 4). In each of these four contrasts, the evidence was graded as low certainty; downgraded either once for imprecision and once for risk of bias (collagenase ointment and foam dressing) or twice for imprecision and not for risk of bias (basic wound contact dressing and PVP plus zinc oxide).
It is unclear whether there is a difference in the probability of healing associated with the following interventions compared with saline gauze for the remaining 13 contrasts because the evidence is of very low certainty (downgraded mainly for risk of bias (once) and imprecision (twice)): alginate dressings, sequential hydrocolloid alginate dressings, dextranomer, hydrocolloid dressing with/without alginate filler (given if the wound was highly exudative), hydrocolloid dressings, hydrogel, iodine‐containing dressings, phenytoin, silicone‐foam dressings, soft polymer dressings, sugar plus egg white, tripeptide copper gel and vapour‐permeable dressings. Two contrasts were informed by very few participants in the direct evidence, with seven participants (4 events) receiving dextranomer and six participants (5 events) receiving tripeptide copper gel; we therefore downgraded imprecision twice to allow for the fragility this invoked. There was also heterogeneity or inconsistency, or both, for some contrasts.
Ranking of treatments
The NMA produced a large number of estimates. An alternative way of presenting and interpreting data from the whole NMA was to summarise using rankograms: data for each intervention were shown as the probability that each intervention is the best, second best, third best treatment, etc. These probabilities are based on uncertainty, reflecting the effectiveness from the network contrasts and the precision around the estimates. The closer the probability of a rank to 100% (or 0%) and the narrower the distribution across different ranks, the greater the confidence in the ranking. Results are given in Figure 5 and Appendix 10 and summarised here, but must be interpreted in the light of the considerable uncertainty and sparseness in the network and the individual estimates, giving potentially misleading results (see quality assessment below). Numerically, dextranomer and tripeptide copper gel had the highest probabilities of being the best treatments (41% and 25%, respectively), and the sequential hydrocolloid alginate dressings and sugar plus egg white were most likely to be the worst treatments (35% and 32%, respectively). No intervention had more than 50% probability of being the best treatment and the rankograms for each treatment show considerable overlap. However, these rankings are likely to be artificially high: the direct evidence for dextranomer and tripeptide copper involves one study each with, respectively, seven participants (4 events) and six participants (5 events). The NMA results for these peripheral interventions have wide CIs and large point estimates. Consequently, these interventions have a finite probability of having a very large effect estimate (at their upper confidence limit), in turn leading to an artificially high probability of being the best treatment.
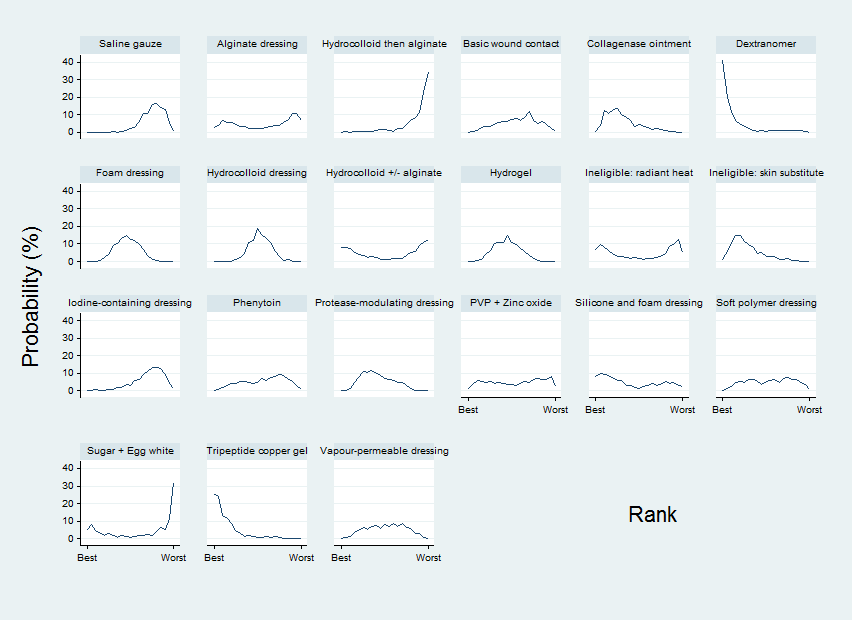
Rankograms for each intervention ‐ individual network
Comparison of results from standard meta‐analysis with NMA findings
We compared the NMA results with the direct comparison (pairwise) results for the proportion completely healed for the 27 different comparisons informing the individual network (Table 2). Six of these comparisons had two or more direct comparison studies (Analysis 1.1; Analysis 1.2). The direct comparison evidence shows heterogeneity for the comparisons of hydrocolloid dressing versus saline gauze dressing; hydrogel versus saline gauze dressing and hydrogel versus hydrocolloid dressing. Direct comparison evidence results for the time‐to‐healing outcome are reported in Appendix 11 for six comparisons in seven studies. The results for the direct comparison evidence and the NMA are shown in Table 2: there is too much uncertainty (wide CIs) to determine whether there are differences.
| Contrast/comparison | Number | RR (95% CI) direct evidence Random‐effects (inverse variance) Heterogeneity statistics | NMA results (consistency assumption) RR (95% CI) |
| Hydrocolloid dressing versus saline gauze dressing | 4 (279) | 1.89 (0.91 to 3.93) Tau² = 0.35; P = 0.01; I² = 73% | 1.43 (1.00 to 2.05) |
| Hydrogel versus saline gauze dressing | 3 (110) | 2.44 (0.64 to 9.27) Tau² = 0.90; P = 0.03; I² = 71% | 1.55 (1.02 to 2.36) |
| Foam dressings versus saline gauze dressing | 3 (93) | 1.51 (0.78 to 2.90) P = 0.41; I² = 0% | 1.52 (1.03 to 2.26) |
| Phenytoin versus saline gauze dressing | 1 (40) | 3.02 (0.97 to 9.35) | 1.27 (0.58 to 2.80) |
| Hydrogel versus hydrocolloid dressings | 4 (322) | 1.11 (0.74 to 1.67) Tau² = 0.08; P = 0.11; I² = 51% | 1.08 (0.83 to 1.42) |
| Foam dressing versus hydrocolloid dressing | 6 (292) | 1.05 (0.81 to 1.36) Tau² = 0.00; P = 0.67; I² = 0% (Stata: 1.05 (0.73 to 1.23)) | 1.07 (0.82 to 1.38) |
| Collagenase ointment versus hydrocolloid dressing | 2 (61) | 1.51 (0.93 to 2.43) P = 0.61; I² = 0% | 1.48 (0.81 to 2.69) |
| Iodine‐containing dressing versus hydrocolloid dressing | 1 (76) | 0.90 (0.41 to 1.96) | 0.76 (0.45 to 1.27) |
| Protease‐modulating dressing versus hydrocolloid dressing | 1 (65) | 1.03 (0.64 to 1.66) | 1.15 (0.72 to 1.84) |
| Vapour‐permeable dressing versus hydrocolloid dressing | 1 (72) | 1.01 (0.69 to 1.47) | 1.01 (0.58 to 1.77) |
| Hydrocolloid dressing 4 weeks then alginate dressing 4 weeks versus hydrocolloid dressing (Belmin 2002) | 1 (110) | 0.35 (0.10 to 1.25) | 0.35 (0.09 to 1.33) |
| Ineligible intervention: skin substitute versus hydrocolloid dressing (Hondé 1994) | 1 (168) | 1.48 (0.95 to 2.32) | 1.48 (0.81 to 2.71) |
| Foam dressing versus hydrogel (Sopata 2002) | 1 (38) | 1.11 (0.80 to 1.54) | 0.98 (0.71 to 1.36) |
| Tripeptide copper versus hydrogel | 1 (12) | 2.50 (0.76 to 8.19) | 2.51 (0.72 to 8.80) |
| Iodine‐containing dressing versus hydrogel | 1 (49) | 0.64 (0.43 to 0.97) | 0.70 (0.43 to 1.14) |
| Phenytoin versus hydrogel (Hollisaz 2004) | 1 (39) | 0.71 (0.41 to 1.24) | 0.82 (0.42 to 1.61) |
| Foam dressing versus protease‐modulating dressing | 1 (10) | 0.82 (0.49 to 1.38) | 0.93 (0.57 to 1.49) |
| Alginate dressing versus protease‐modulating dressing (Brown‐Etris 1997) | 1 (36) | 0.67 (0.08 to 5.75) | 0.30 (0.07 to 1.25) |
| PVP + zinc oxide versus protease‐modulating dressing | 1 (24) | 0.80 (0.28 to 2.27) | 0.80 (0.26 to 2.46) |
| Soft polymer dressing versus foam dressing | 1 (38) | 0.89 (0.45 to 1.75) | 0.89 (0.40 to 1.96) |
| Combination silicone‐foam dressing versus ineligible intervention: skin substitute (Serena 2010) | 1 (74) | 0.91 (0.22 to 3.77) | 0.90 (0.21 to 3.97) |
| Hydrocolloid with/without alginate filler versus ineligible intervention: radiant heat (Thomas 2005) | 1 (41) | 0.92 (0.41 to 2.06) | 0.92 (0.37 to 2.27) |
| Collagenase ointment versus dextranomer | 1 (12) | 0.35 (0.05 to 2.26) (Stata 0.44 (0.10 to 2.02)) | 0.44 (0.09 to 2.13) |
| Collagenase ointment versus sugar + egg white | 1 (10) | 3.00 (0.15 to 59.89) (Stata 3.00 (0.15 to 59.79)) | 3.00 (0.15 to 61.59) |
| Dextranomer versus sugar + egg white | 1 (12) | 6.75 (0.44 to 102.80) | 6.75 (0.43 to 105.99) |
| Foam dressing versus basic wound contact dressing | 1 (50) | 1.17 (0.79 to 1.72) | 1.17 (0.67 to 2.06) |
| Alginate dressing versus ineligible intervention: radiant heat (Price 2000) | 1 (58) | 0.82 (0.15 to 4.55) | 0.82 (0.14 to 4.77) |
Certainty/quality assessment of the evidence across the whole network
The weighted average risk of bias across the network was high (Appendix 8). There did not appear to be much inconsistency in the network (see Appendix 9) and there were relatively few contrasts with conflicting results for direct and indirect or NMA estimates, so across the network we did not downgrade for inconsistency. We downgraded the evidence twice for imprecision: in addition to the sparseness (and probably as a consequence of it), there is substantial overlap of the individual rankograms (see Appendix 10); the mean rank was no smaller than 3.6 and no larger than 18.6 (out of 21) for any intervention, with no SUCRA value being zero or 1 (indicating uncertainty). A contour‐enhanced funnel plot is shown in Figure 6. There may be a small studies effect, but this was too unclear for downgrading. Overall, we classed the evidence for the whole network as being of very low certainty (downgraded once on risk of bias and twice on imprecision).

Funnel plot ‐ individual network
Key to interventions: 1: saline gauze; 2: alginate dressing; 3: sequential hydrocolloid alginate dressings; 4: basic wound contact dressing; 5: collagenase ointment; 6: dextranomer; 7: foam dressing; 8: hydrocolloid dressing; 9: hydrocolloid +/‐ alginate (hydrocolloid dressing with/without alginate filler); 10: hydrogel dressing; 11: ineligible radiant heat; 12: ineligible skin substitute; 13: iodine‐containing dressing; 14: phenytoin; 15: protease‐modulating dressing; 16: PVP + zinc oxide 17: silicone + foam dressing; 18: soft polymer dressing; 19: sugar + egg white; 20: tripeptide copper gel; 21: vapour‐permeable dressing
Overall, we have little confidence in the findings in this network, either in terms of the effect estimates or in the ranking of interventions.
Sensitivity analyses
We carried out the following pre‐specified sensitivity analyses to examine the above inconsistencies: excluding studies at very high risk of bias; and assuming an available case analysis rather than imputing no event for missing values. The sensitivity analyses are discussed in Appendix 12. Neither sensitivity analysis had much impact on the effect estimates or the rankograms. There appeared to be less inconsistency in the sensitivity analysis that excluded studies at very high risk of bias, but this possible improvement was at the expense of precision and resulted a smaller network, and so the original analysis was preserved. An additional post‐hoc sensitivity analysis (Appendix 12) examined the original assumption of combining topical agents and dressings in the same NMA, by restricting the network to studies comparing any two eligible dressings ‐ similar results were found for the contrasts versus saline gauze, and the imprecision in the overall network continued to give uncertainty.
Group network findings
We mapped individual interventions onto the group categories (Appendix 5), grouping together dressings into the following pre‐specified categories: basic wound dressings, advanced dressings and antimicrobial dressings (as described in the BNF 2016), and keeping specialist dressings (e.g. protease‐modulating matrix dressings) and the different topical agents as separate categories. The group network included 22 studies (of 51 included) in 946 participants, encompassing 10 different interventions in 12 direct contrasts and these informed 45 mixed treatment contrasts. The median (range) study size was 38.5 (10 to 100). We had hoped that grouping interventions might increase the power in the network, but fewer than half of the included studies formed the group network (see Appendix 5) and only 32% of the participants were involved; only three contrasts were informed by more than one study.
The group NMA generated results for 45 mixed treatment contrasts. The network was dominated by the advanced dressing versus basic dressing contrast and the rest of the data were sparse. Figure 7 shows all group NMA results, with the all‐domain risk of bias shown alongside the forest plot contrasts. The results and the certainty of the evidence are summarised for a representative set of contrasts (each intervention versus basic dressing) in Table 3. Evidence was of low or very low certainty, with the exception of one contrast, for which we assessed the evidence to be of moderate certainty. As for the individual network, this moderate‐certainty evidence should be interpreted in the light of the very low‐certainty evidence for the network as a whole.

Intervention 1 versus intervention 2 ‐ group network
Key for overall risk of bias for the contrast: green = low/unclear; one red = high; two reds = very high
| NMA evidence for group network: proportion with complete healing ‐ interventions versus basic dressings | ||||
| Patient or population: people with pressure ulcers Settings: hospital, community or care home, or combinations | ||||
| Contrasts: interventions versus basic dressing | Relative effect (95% CI) | Anticipated absolute effects* (95% CI) ‐ from median of basic dressing control groups in direct evidence | Certainty (quality) of the | |
| Median CGR | With interventions | |||
| Advanced dressings versus basic dressing | RR 1.36 | 191 per 1000 | 260 per 1000 | ⊕⊝⊝⊝ |
| 69 more people healed per 1000 (from 10 fewer to 178 more) | ||||
| Advanced + antimicrobial dressing versus basic dressing | RR 0.42 | 191 per 1000 | 80 per 1000 | ⊕⊝⊝⊝ |
| 111 fewer people healed per 1000 (from 67 more to 166 fewer) | ||||
| Antimicrobial dressing versus basic dressing | RR 0.96 | 191 per 1000 | 183 per 1000 | ⊕⊝⊝⊝ |
| 8 fewer people healed per 1000 (from 92 fewer to 147 more) | ||||
| Collagenase ointment versus basic dressing | RR 2.01 | 191 per 1000 | 384 per 1000 | ⊕⊕⊝⊝ |
| 193 more people healed per 1000 (from 10 more to 550 more) | ||||
| Dextranomer versus basic dressing | RR 4.53 | 191 per 1000 | 865 per 1000 | ⊕⊝⊝⊝ |
| 674 more people healed per 1000 (from 31 fewer to 1,000 more) | ||||
| Phenytoin versus basic dressing | RR 1.12 | 191 per 1000 | 214 per 1000 | ⊕⊝⊝⊝ |
| 23 more people healed per 1000 (from 92 fewer to 275 more) | ||||
| Protease‐modulating dressing versus basic dressing | RR 1.49 | 191 per 1000 | 285 per 1000 | ⊕⊕⊕⊝ |
| 94 more people healed per 1000 (from 17 fewer to 279 more) | ||||
| Sugar + egg white versus basic dressing | RR 0.67 (0.03 to 14.69) | 191 per 1000 | 128 per 1000 | ⊕⊝⊝⊝ |
| 63 fewer people healed per 1000 (from 185 fewer to 1000 more) | ||||
| Tripeptide copper gel versus basic dressing | RR 3.39 | 191 per 1000 | 647 per 1000 | ⊕⊕⊝⊝ |
| 456 more people healed per 1000 (from 11 fewer to 1000 more) | ||||
| *The risk in the intervention group (and its 95% CI) is based on the assumed risk in the comparison group and the relative effect of the intervention (and its 95% CI). | ||||
| GRADE Working Group grades of evidence | ||||
1Majority of evidence at high risk of bias (downgraded once); inconsistency: heterogeneity in direct evidence (downgraded once); imprecision: wide CI (downgraded once).
2Majority of evidence at high risk of bias (downgraded once); imprecision: very wide CI (crosses 0.75 and 1.25) (downgraded twice).
3Majority of evidence at high risk of bias (downgraded once); imprecision: wide CI (crosses 1.25) and direct evidence on collagenase from three studies, 11 events (downgraded once).
4Majority of evidence at high risk of bias (downgraded once): imprecision: wide CI (crosses 1.25) and direct evidence on dextranomer from one study, seven participants and four events (downgraded twice).
5Inconsistency: significant difference between direct and indirect estimates (downgraded once); imprecision: very wide CI (crossed 0.75 and 1.25).
6Imprecision: wide CI (crosses 1.25) (downgraded once).
7Imprecision: wide CI (crosses 1.25) and direct evidence on tripeptide copper gel from one study, six participants and five events (downgraded twice).
Rankograms for the group network are shown in Figure 8. There was more of a distinction between interventions, but still overlap of rankograms and the improvement in precision came at the expense of increased inconsistency and possible publication bias (Figure 9). Overall we downgraded the evidence certainty three times for the network as a whole, because of risk of bias (once), imprecision (once) and inconsistency and publication bias (once). As in the individual network, dextranomer and tripeptide copper had high ranks and this was again likely to be an artificial result. Further details of the group network are given in Appendix 5.

Rankograms combined ‐ group network

Funnel plot ‐ group network
Key to interventions: 1: basic dressing; 2: advanced dressing; 3: advanced or antimicrobial dressing; 4: antimicrobial dressing;
5: collagenase ointment; 6: dextranomer; 7: phenytoin; 8: protease‐modulating dressing; 9: sugar + egg white; 10: tripeptide copper gel
Discussion
Summary of main results
We have successfully conducted a network meta‐analysis of dressings and topical agents for healing pressure ulcers. Alongside the analysis we have applied a new method of GRADE assessment (Salanti 2014), which allows us to view the results in the light of our certainty in their findings. Using this approach, we found the majority of the evidence to be of low or very low certainty, and was mainly downgraded for risk of bias and imprecision (see Quality of the evidence). This level of uncertainty within the totality of the dataset impacts on all subsequent interpretation of its outputs.
This review includes 51 RCTs involving a total of 2964 participants, comparing 39 different dressings or topical agents for the healing of pressure ulcers. Most of the studies were in older participants, but four included participants with spinal cord injuries and one was in younger people said to be chronically ill or physically disabled. Seventeen (33%) studies included participants mainly with Stage 2 pressure ulcers and 15 (29%) mainly had Stage 3 pressure ulcers; 13 studies investigated treatment of ulcers with a mean duration of less than three months.
We treated each topical agent as a separate intervention, but initially grouped dressings by class as described in the BNF 2016 (e.g. alginates, hydrocolloids). The network involved 39 studies in 2116 participants, encompassing 21 different interventions in 27 direct contrasts and these informed 210 mixed treatment contrasts.
We reported the evidence in two ways, firstly, as effect estimates for each of 210 NMA mixed treatment contrasts , and secondly as rank order of interventions. We summarised the set of effect estimates using contrasts versus saline gauze.
Overall findings reflect the uncertainty of the component evidence and the sparseness of the network, and even moderate ratings should be interpreted in the context of the network uncertainty. For network contrasts involving saline gauze, it is not clear whether protease‐modulating dressings result in more healing (RR 1.65, 95% CI 0.92 to 2.94; moderate certainty evidence). It is unclear whether four interventions increase the probability of healing compared with saline gauze dressings: collagenase ointment RR 2.12 (95% CI 1.06 to 4.22); foam dressing RR 1.52 (95% CI 1.03 to 2.26); basic wound contact dressing RR 1.30 (95% CI 0.65 to 2.58) and PVP plus zinc oxide RR 1.31 (95% CI 0.37 to 4.62) (all low certainty evidence). It is worth noting that the contrasts for the latter two interventions had CIs consistent with both a clinically important benefit and a clinically important harm, and the other two contrasts had both high risk of bias and some imprecision. The remaining contrasts were all very low‐certainty evidence, with all being imprecise, often with CIs consistent with both a clinically important increase and a clinically important decrease in the probability of healing.
Relative to the median control group risk (probability) (CGR) of healing for saline gauze of 157 per 1000, the absolute risk differences for the above comparisons in the individual network were: protease‐modulating dressings: 102 more people healed per 1000 (13 fewer to 305 more); foam dressings: 82 more per 1000 (5 more to 196 more); collagenase ointment 176 more per 1000 (9 more to 506 more); basic wound contact dressing: 47 more per 1000 (55 fewer to 250 more); polyvinylpyrrolidone plus zinc oxide: 49 more per 1000 (99 fewer to 575 more). Thus, uncertainty notwithstanding, the effect is relatively small and fairly large numbers of wounds remain unhealed.
For the network as a whole, the evidence was of very low certainty, reflecting the general uncertainty surrounding the mixed treatment contrasts, as described above. There was considerable uncertainty in the ranking of interventions and no intervention had more than 50% probability of being the best treatment.
Overall completeness and applicability of evidence
The network is sparse, in terms of the total number of participants, the total number of wounds healed, the number of studies per contrast, the size of the constituent studies and the duration of follow‐up: 21 of 27 direct contrasts were informed by only one study and the average number of events per mixed treatment contrast was around four. The median (range) study size was 41 (10 to 168) and several studies had zero events. The duration of follow‐up was relatively short for most studies (median 8 weeks): only 3/39 studies in the network had a follow‐up duration of 16 weeks or more.
In parallel we conducted a second NMA, grouping together some classes of dressings. We had hoped that the group network would provide more power in the analysis, but in practice too many data were excluded from the network, and the network was also unbalanced, being dominated by the advanced dressing versus basic dressing contrast, which involved about 55% of the participants in the group network. The group network provided equally uncertain evidence and the findings are not discussed further here, but are reported in Appendix 5 for the interested reader.
There may have been small‐study effects, and the contour‐enhanced funnel plot appeared to show some asymmetry. The Chaimani 2013b methodological paper demonstrated that small‐study effects can materially affect the rank order of effectiveness. STATA code is available to adjust for small‐study effects in ranking, however, we did not investigate this approach because the evidence was of such low certainty for reasons of risk of bias, imprecision and inconsistency. Additionally, Kibret 2014 suggested in a simulation study in a Bayesian setting that an unequal number of studies per comparison may result in biased estimates of treatment rank probabilities.
In the absence of evidence for effect modifiers, we can make observations about the population covered and the trial duration, only approximating the applicability of the evidence. In particular, there were eight studies with a follow‐up time of less than six weeks, which may be too short to properly investigate healing, and the reporting of time‐to‐event data was insufficient to understand how the hazard of healing changes over time. Whilst treatments may have impacted on the speed of wound healing as well as the number of healing events per se, this requires further exploration, which would be better supported by increased collection and analysis of time‐to‐healing data in wound care trials. We note that the two small three‐arm trials, which may have shown some incongruent results, were in younger people with spinal cord injuries or chronic illnesses/physical disabilities. Overall, our view is that the results can probably be applied more generally, within the constraints of the uncertainty of the evidence and also the comparisons for which trial data exist. There are many different dressing and topical treatment choices and, whilst several key treatments are represented by trial data, others are addressed only in pilot studies and there may be treatments that are yet to be evaluated in a trial or for which data remain unpublished. We could only assess publication bias in a limited way.
The NMA focused on complete wound healing as the key outcome ‐ this has repeatedly been found to be the most important outcome to patients and health professionals (Cullum 2016; Kelly 2015). Dressings and topical agents are generally low risk treatments so we did not consider adverse events. Other outcomes that might have been useful include those related to the management properties of dressings such as ease of use, exudate management and pain on removal. We did not consider these in the NMA for practical reasons: such outcomes are reported inconsistently with data that rarely allow meta‐analysis. Given that the quality assessment of healing data was based on study‐level issues like small samples and flawed methodology, we can suppose the quality of other outcome data would have been equally sparse and likely uncertain.
Quality of the evidence
We have explored the application of a new approach to GRADE analysis, alongside NMA in STATA (Chaimani 2013b; Salanti 2014). We applied the GRADE approach separately to effect estimates for different contrasts and to the ranking of interventions, but the two aspects are closely inter‐related and, in this review, are a consequence of the sparse network and the high risk of bias through much of the network. The effect estimates were exemplified by contrasts of interventions versus saline gauze.
For the effect estimates' assessment, most of the evidence was of very low certainty (very low quality). The GRADE meaning of 'low‐certainty evidence' is that "our confidence in the effect estimate is limited: the true effect may be substantially different from the estimate of the effect". 'Very low‐certainty evidence' means "We have very little confidence in the effect estimate: the true effect is likely to be substantially different from the estimate of effect". 'Moderate‐certainty evidence' means "We are moderately confident in the effect estimate: the true effect is likely to be close to the estimate of the effect, but there is a possibility that it is substantially different" (Balshem 2011). Exceptions to an assignment of very low certainty were found for contrasts with protease‐modulating dressings (moderate certainty); collagenase ointment, basic wound contact dressing, foam dressing and PVP plus zinc oxide (low‐certainty evidence), We downgraded evidence certainty mainly because of risk of bias and imprecision, although there was inconsistency for the contrasts hydrogel and hydrocolloid versus saline gauze and phenytoin versus saline gauze. Having said this, we are uncertain about the inconsistency assessment because of wide CIs around the test parameters. The majority of the comparisons with saline gauze had high risk of bias. However, a few contrasts had evidence solely downgraded on the basis of wide confidence intervals, that is, random error (protease‐modulating dressings, basic wound contact dressing and PVP plus zinc oxide, each in comparisons with saline gauze). The sparseness of the network led to widespread imprecision in the effect estimates. Although we rated the evidence for one contrast as moderate‐certainty, this result should be interpreted in the context of the network as a whole and not taken as an implication for practice.
Across the network as a whole, the evidence was of very low certainty. There was overall high risk of bias and overlap of the ranking probability distributions, and no clearcut results. The evidence was of such poor quality that we consider it inappropriate to focus on which treatments had the highest probabilities of healing (see also Potential biases in the review process).
Potential biases in the review process
This was a sparse network and there may have been small‐study effects which impacted on the network (see Overall completeness and applicability of evidence). The STATA routines have largely been developed for and tested on larger networks, and our work has contributed to modifications for sparse networks in the netweight routine. Other STATA routines can be modified by the user to take into account small‐study effects, but we did not explore these approaches because there was too much uncertainty in the network for us to be confident of interpreting the results. Instead, we used the standard routines for NMA and adapted the recent approach to GRADE (Salanti 2014) to bring in sparseness when assessing evidence certainty.
The recent GRADE approach has not been applied in many NMA reviews so far, and so could give potential for bias. We judge that it is a useful approach for many of the GRADE factors, however, there is one area in which we consider imprecision is underestimated: the GRADE method does not currently have a way of assessing optimum information size and 'fragility' of the confidence intervals when there are large effect estimates with wide CIs; such effects can result when the direct evidence for a particular intervention derives from very small studies peripheral to the network. Wide CIs can lead some interventions to have a finite probability of having a very large effect estimate, in turn leading to an artificially high probability of being the best treatment. For example, there were only seven participants who actually received dextranomer, yet this intervention was the most highly ranked, and effect estimates versus other treatments were largest for dextranomer. Numerically, when we consider the direct evidence for dextranomer versus collagenase ointment, for example, a missed healing diagnosis for just one person treated with collagenase could change the risk ratio by 50%. This, in turn, could affect the ranking and effect estimates of other contrasts with dextranomer. It was important to capture this potential bias in the review process, and we therefore produced a modification to the GRADE process to enable the 'sample size' of the direct evidence to be considered in a way analogous to the GRADE 'fragility' effects in pairwise meta‐analysis (Guyatt 2011b). Our approach does not change the magnitude of the effect estimate or ranking order, rather it allows us to represent our uncertainty around these values.
A further effect of the sparseness of the network may have been to hide any inconsistencies. The various statistical tests for inconsistency were generally not significant, but this may have been due to a lack of sensitivity of the tests and the wide CIs around the measures. Despite this, we found inconsistencies in the network for contrasts involving phenytoin. We cannot be sure that there are no other inconsistencies, but this may not matter given the already identified large uncertainties.
We have made some assumptions: firstly, to include dressings and topical agents of various types in the same NMA. This implies that dressings and topical agents fulfil the same role and are exchangeable (i.e. that the participants/wounds receiving topical agents are similar to those receiving dressings). We did a post‐hoc sensitivity analysis, which included only trials comparing two dressings, to investigate this assumption. It gave similar effect estimates and CIs for individual contrasts.
Finally, application of the GRADE approach to this NMA has given a rating of moderate‐certainty evidence for only one contrast in the whole NMA, and we recognise that by using a representative set of comparisons and by applying GRADE rules of thumb, however carefully, we may have inadvertently emphasised the importance of one intervention. This is a limitation of the approach. Instead the evidence on protease‐modulating dressings should be set in the context of the uncertainty in the network as a whole.
Agreements and disagreements with other studies or reviews
We have been unable to identify any network meta‐analyses directed at healing pressure ulcers and incorporating both dressings and topical agents. The AHRQ guideline reviewed the evidence for dressings in a series of pairwise comparisons and stated that overall, they did not find substantial evidence to support certain local wound applications over others (AHRQ 2013). The most recent NICE guideline on the prevention and management of pressure ulcers (NICE 2014) considered all RCT evidence on dressings and separately all RCT evidence on topical agents. NICE recommendations are to not use saline gauze dressings and for the health professional and adult to discuss the type of dressing to use, taking into account pain and tolerance, position of the ulcer, amount of exudate and frequency of dressing change. These recommendations rely heavily on consensus decisions, weakly supported by the evidence, and as such, agree with the findings of this review.
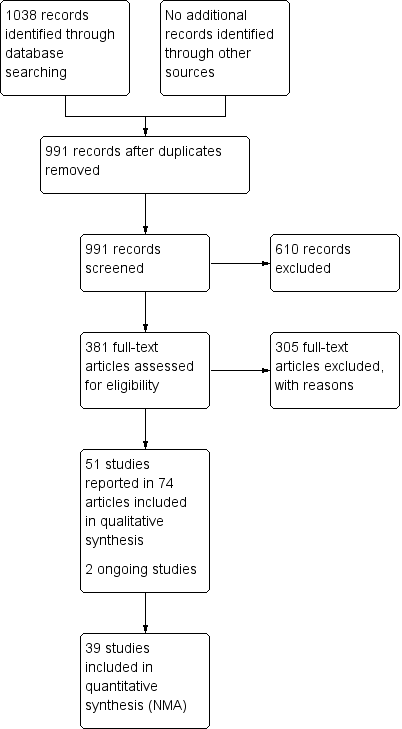
Study flow diagram

Network diagram ‐ individual interventions, by risk of bias (3 categories)
Key: green = low/unclear; yellow = high; red = very high overall risk of bias for the contrast. The number of studies for each contrast is given in Table 2.

Risk of bias summary: review authors' judgements about each risk of bias item for each included study

NMA results: individual intervention 1 versus individual intervention 2
Key for overall risk of bias for the contrast: green = low/unclear; one red = high; two reds = very high

Rankograms for each intervention ‐ individual network

Funnel plot ‐ individual network
Key to interventions: 1: saline gauze; 2: alginate dressing; 3: sequential hydrocolloid alginate dressings; 4: basic wound contact dressing; 5: collagenase ointment; 6: dextranomer; 7: foam dressing; 8: hydrocolloid dressing; 9: hydrocolloid +/‐ alginate (hydrocolloid dressing with/without alginate filler); 10: hydrogel dressing; 11: ineligible radiant heat; 12: ineligible skin substitute; 13: iodine‐containing dressing; 14: phenytoin; 15: protease‐modulating dressing; 16: PVP + zinc oxide 17: silicone + foam dressing; 18: soft polymer dressing; 19: sugar + egg white; 20: tripeptide copper gel; 21: vapour‐permeable dressing
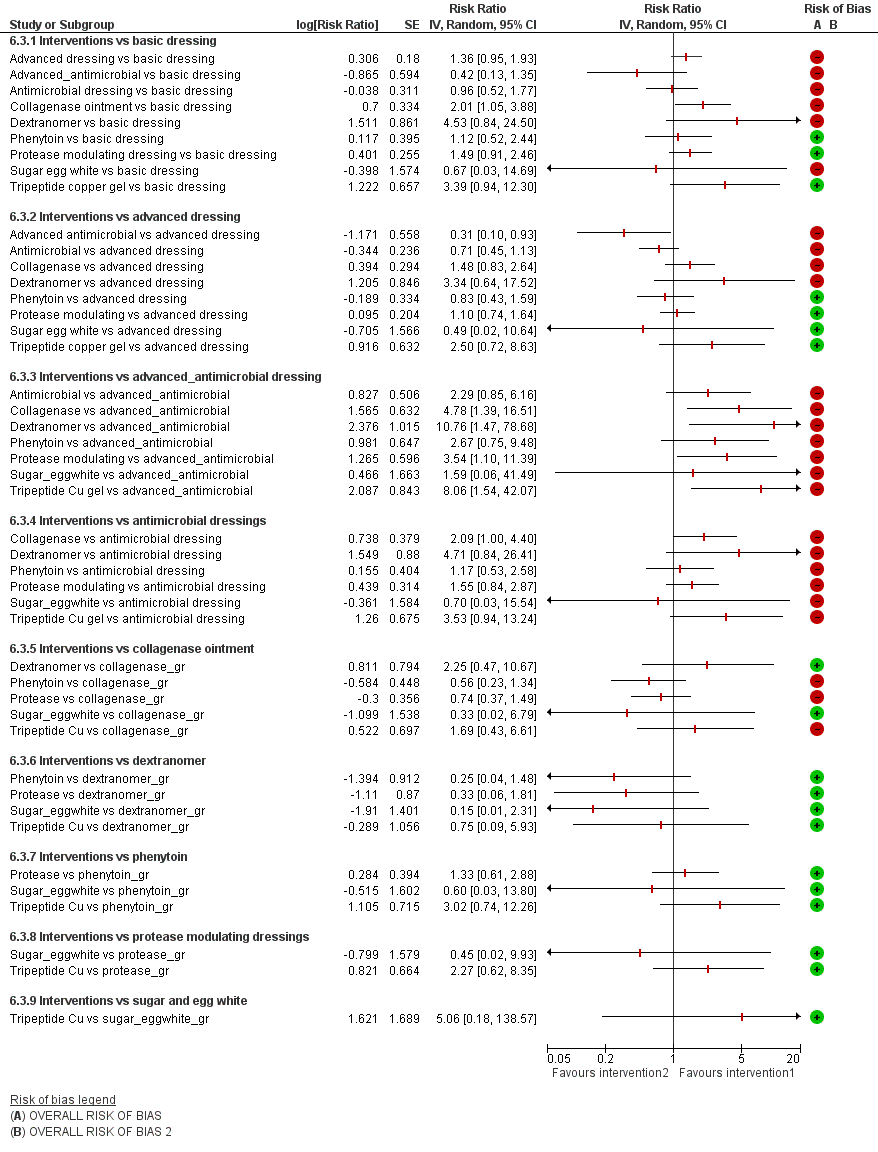
Intervention 1 versus intervention 2 ‐ group network
Key for overall risk of bias for the contrast: green = low/unclear; one red = high; two reds = very high

Rankograms combined ‐ group network

Funnel plot ‐ group network
Key to interventions: 1: basic dressing; 2: advanced dressing; 3: advanced or antimicrobial dressing; 4: antimicrobial dressing;
5: collagenase ointment; 6: dextranomer; 7: phenytoin; 8: protease‐modulating dressing; 9: sugar + egg white; 10: tripeptide copper gel
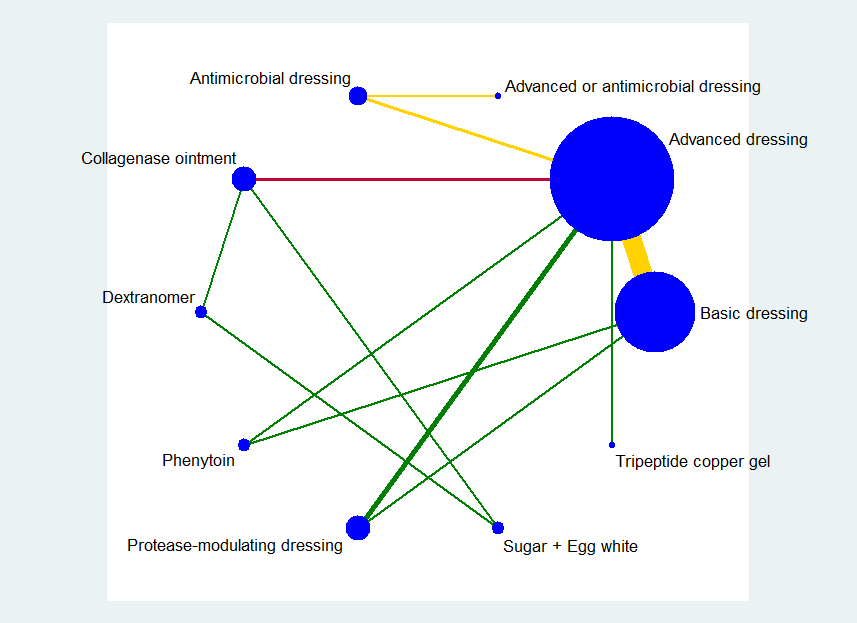
Key: green = low/unclear risk of bias; yellow = high risk of bias; red = very high overall risk of bias for the contrast. The number of studies for each contrast is given in Table 4.
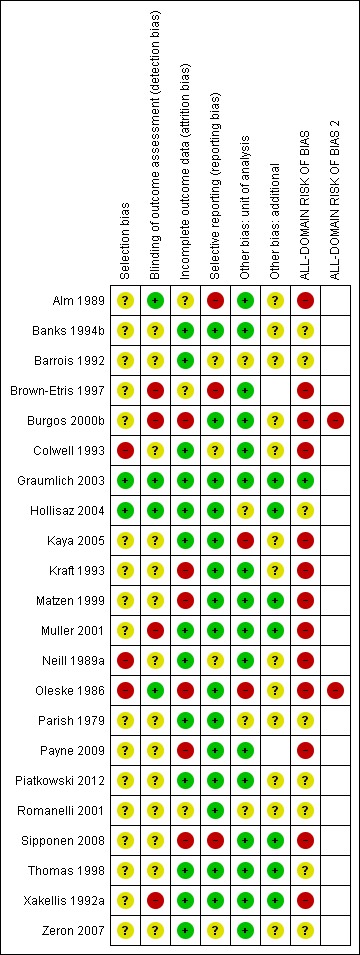
Risk of bias summary ‐ group network: review authors' judgements about each risk of bias item for each included study

Group network ‐ rankograms
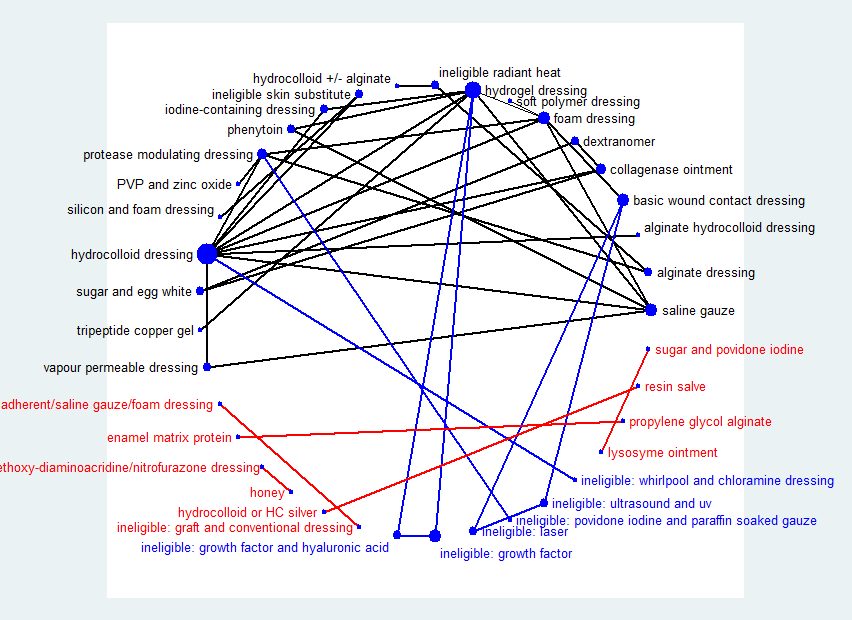
Network diagram ‐ all interventions
Key: red = isolated interventions; blue = ineligible interventions joined to only one eligible intervention. Line and node weights not to scale
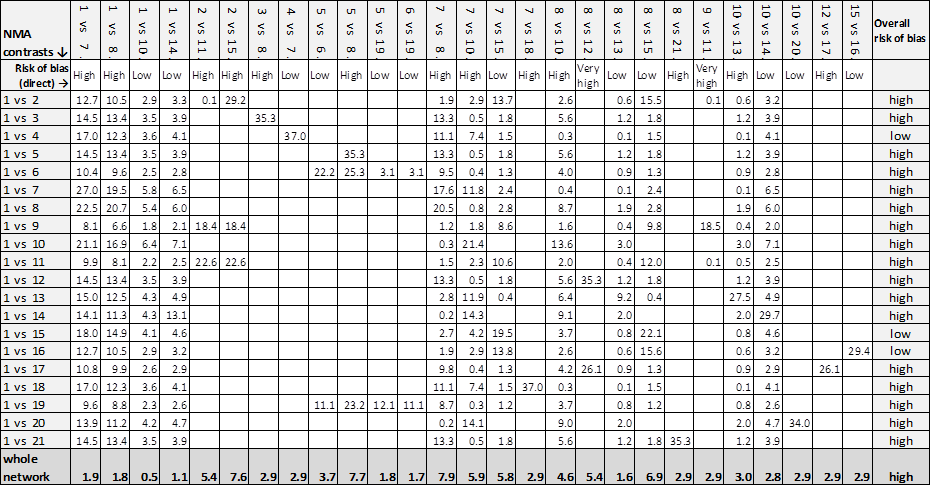
Contributions matrix ‐ interventions versus saline gauze (independent network)
Key: 1 = saline gauze dressing; 2 = alginate dressing; 3 = sequential hydrocolloid alginate dressings; 4 = basic wound contact dressing; 5 = collagenase ointment; 6 = dextranomer; 7 = foam dressing; 8 = hydrocolloid dressing; 9 = hydrocolloid +/‐ alginate (hydrocolloid with/without alginate filler); 10 = hydrogel dressing; 11 = ineligible intervention: radiant heat; 12 = ineligible intervention: skin substitute; 13 = iodine‐containing dressing; 14 = phenytoin; 15 = protease‐modulating dressing; 16 = PVP + zinc oxide; 17 = silicone + foam dressing; 18 = soft polymer dressing; 19 = sugar + egg white; 20 = tripeptide copper gel; 21 = vapour‐permeable dressing.

Rankograms combined ‐ individual network
Key to interventions: 1: saline gauze; 2: alginate dressing; 3: sequential hydrocolloid alginate dressings; 4: basic wound contact dressing; 5: collagenase ointment; 6: dextranomer; 7: foam dressing; 8: hydrocolloid dressing; 9: hydrocolloid +/‐ alginate (hydrocolloid dressing with/without alginate filler); 10: hydrogel dressing; 11: ineligible radiant heat; 12: ineligible skin substitute; 13: iodine‐containing dressing; 14: phenytoin; 15: protease‐modulating dressing; 16: PVP + zinc oxide
17: silicone + foam dressing; 18: soft polymer dressing; 19: sugar + egg white; 20: tripeptide copper gel; 21: vapour‐permeable dressing

Comparison 1 Direct evidence: individual interventions, number with complete healing, Outcome 1 Interventions vs saline gauze.

Comparison 1 Direct evidence: individual interventions, number with complete healing, Outcome 2 Interventions vs hydrocolloid.

Comparison 2 Direct evidence group intervention, number with complete healing, Outcome 1 Intervention 1 vs intervention 2.

Comparison 3 Direct evidence: individual interventions, time‐to‐healing data, Outcome 1 Time‐to‐healing (survival analysis).

Comparison 4 Direct evidence: group interventions, time‐to‐healing data, Outcome 1 Time‐to‐healing (survival analysis).

Comparison 5 Direct evidence ‐ non‐network comparisons, Outcome 1 Intervention 1 vs intervention 2.
| NMA evidence for individual network: proportion with complete healing ‐ interventions versus saline gauze | ||||
| Patient or population: people with pressure ulcers Settings: hospital, community or care home, or combinations | ||||
| Contrasts: interventions versus saline gauze | Relative effect | Anticipated absolute effects* (95% CI) ‐ from median of saline gauze control groups in direct evidence | Certainty (quality) of | |
| Median CGR | With interventions | |||
| Alginate dressings | RR 1.09 | 157 per 1000 | 171 per 1000 (17 to 1000) | ⊕⊝⊝⊝ |
| 14 more people healed per 1000 (140 fewer to 1000 more) | ||||
| Sequential hydrocolloid alginate dressings | RR 0.50 | 157 per 1000 | 78 per 1000 (1.9 to 31.2) | ⊕⊝⊝⊝ |
| 79 fewer people healed per 1000 (138 fewer to 155 more) | ||||
| Basic wound contact dressings | RR 1.30 | 157 per 1000 | 204 per 1000 (102 to 407) | ⊕⊕⊝⊝ |
| 47 more people healed per 1000 (55 fewer to 250 more) | ||||
| Collagenase ointment | RR 2.12 | 157 per 1000 | 333 per 1000 (166 to 663) | ⊕⊕⊝⊝ |
| 176 more people healed per 1000 (9 more to 506 more) | ||||
| Dextranomer | RR 4.76 | 157 per 1000 | 747 per 1000 (135 to 1000) | ⊕⊝⊝⊝ |
| 590 more people healed per 1000 (22 fewer to 1000 more) | ||||
| Foam dressings | RR 1.52 | 157 per 1000 | 239 per 1,000 (162 to 353) | ⊕⊕⊝⊝ |
| 82 more people healed per 1,000 (5 more to 196 more) | ||||
| Hydrocolloid dressing | RR 1.22 | 157 per 1000 | 192 per 1,000 (9 to 1000) | ⊕⊝⊝⊝ |
| 35 more people healed per 1,000 (148 fewer to 1000 more) | ||||
| Hydrocolloid dressings | RR 1.43 | 157 per 1000 | 225 per 1000 (157 to 322) | ⊕⊝⊝⊝ |
| 68 more people healed per 1000 (from 0 fewer to 165 more) | ||||
| Hydrogel | RR 1.55 | 157 per 1000 | 243 per 1000 (160 to 371) | ⊕⊝⊝⊝ |
| 86 more people healed per 1000 (from 3 more to 214 more) | ||||
| Iodine‐containing dressings | RR 1.08 | 157 per 1000 | 170 per 1000 (91 to 316) | ⊕⊝⊝⊝ |
| 13 more people healed per 1000 (from 66 fewer to 159 more) | ||||
| Phenytoin | RR 1.27 | 157 per 1000 | 199 per 1000 (91 to 440) | ⊕⊝⊝⊝ |
| 42 more people healed per 1000 (from 66 fewer to 283 more) | ||||
| Protease‐modulating dressings | RR 1.65 | 157 per 1000 | 259 per 1,000 (144 to 462) | ⊕⊕⊕⊝ |
| 102 more people healed per 1000 (from 13 fewer to 305 more) | ||||
| Polyvinylpyrrolidone + zinc oxide | RR 1.31 | 157 per 1000 | 206 per 1,000 (58 to 732) | ⊕⊕⊝⊝ |
| 49 more people healed per 1000 (from 99 fewer to 575 more) | ||||
| Combination silicone foam dressings | RR 1.93 | 157 per 1000 | 303 per 1,000 (60 to 1,000) | ⊕⊝⊝⊝ |
| 146 more people healed per 1000 (from 97 fewer to 1,000 more) | ||||
| Soft polymer dressings | RR 1.35 | 157 per 1000 | 212 per 1,000 (86 to 517) | ⊕⊝⊝⊝ |
| 55 more people healed per 1000 (from 71 fewer to 360 more) | ||||
| Sugar + egg white | RR 0.70 | 157 per 1000 | 110 per 1000 (5 to 1,000) | ⊕⊝⊝⊝ |
| 47 fewer people healed per 1000 (from 152 fewer to 1000 more) | ||||
| Tripeptide copper gel | RR 3.90 | 157 per 1000 | 612 per 1000 (163 to 1000) | ⊕⊝⊝⊝ |
| 455 more people healed per 1000 (6 more to 1000 more) | ||||
| Vapour‐permeable dressings | RR 1.45 | 157 per 1000 | 228 per 1000 | ⊕⊝⊝⊝ |
| 71 more people healed per 1000 (from 39 fewer to 283 more) | ||||
| *The risk in the intervention group (and its 95% CI) is based on the assumed risk in the comparator group and the relative effect of the intervention (and its 95% CI). | ||||
| GRADE Working Group grades of evidence | ||||
| 1Majority of evidence at high risk of bias (downgraded once); imprecision: very wide CI (crosses 0.75 and 1.25) (downgraded twice). | ||||
| Study characteristic | Studies in the individual | Studies in both individual and group networks | Studies in the group network only | Studies included in neither network | |
| Publication (all others were full published papers) | Conference abstracts (5) | ||||
| Multiple interventions | > 2 arms (4) | Nussbaum 1994; Ramos‐Torrecillas 2015 (4 arms) | |||
| Unit of randomisation (all other studies randomised individuals) | Ulcers randomised (5) | ||||
| Cluster‐randomised (2) | |||||
| not stated (3) | |||||
| Funding | Industry funding (18) | Banks 1994c; Belmin 2002; Brod 1990; Brown‐Etris 2008; Hondé 1994; Motta 1999 | Banks 1994a; Burgos 2000b; Colwell 1993; Kraft 1993; Neill 1989a; Payne 2009; Piatkowski 2012; Thomas 1998 | ||
| Mixed industry and non industry (2) | |||||
| Non industry (10) | Brown‐Etris 1997; Hollisaz 2004; Kaya 2005; Muller 2001; Oleske 1986; Xakellis 1992 | ||||
| Not stated (21) | Aguilo Sanchez 2002; Bale 1997a; Brown‐Etris 1996; Darkovich 1990; Meaume 2003; Price 2000; Seeley 1999; Seeley 1999; Thomas 1997a; Thomas 2005 | Alm 1989; Banks 1994b; Barrois 1992; Matzen 1999; Parish 1979; Romanelli 2001; Zeron 2007 | |||
| Setting | Community only (6) | ||||
| Hospital only (20) | Bale 1997a; Banks 1994c; Belmin 2002; Hondé 1994; Sopata 2002 | Alm 1989; Burgos 2000b; Colwell 1993; Kaya 2005; Muller 2001; Oleske 1986; Piatkowski 2012; Zeron 2007 | Gorse 1987; Imamura 1989; Nisi 2005; Nussbaum 1994; Ramos‐Torrecillas 2015; Yapucu Güneş 2007 | ||
| Hospital and other setting (7) | Price 2000 (hospital and community); Darkovich 1990 (hospital and care home); Brown‐Etris 1996 (hospital and community and care home) | Banks 1994b (hospital and community); Kraft 1993; Neill 1989a (hospital and care home); Payne 2009 (hospital and community and care home) | Ashby 2012 (hospital and community) | ||
| Care home and community (5) | |||||
| Care home only (5) | |||||
| Not stated (7) | |||||
| Follow‐up time | < 6 weeks (8) | Oleske 1986; Parish 1979; Payne 2009; Piatkowski 2012; Zeron 2007 | |||
| 6 to 8 weeks (25) | Aguilo Sanchez 2002; Banks 1994c; Belmin 2002; Brod 1990; Brown‐Etris 2008; Hondé 1994; Meaume 2003; Motta 1999; Price 2000; Seeley 1999; Sopata 2002; Thomas 1997a; | Alm 1989; Banks 1994a; Barrois 1992; Brown‐Etris 1997; Graumlich 2003; Hollisaz 2004; Neill 1989a; Romanelli 2001 | Imamura 1989; Nisi 2005; Nussbaum 1994; Sebern 1986; Van De Looverbosch 2004 | ||
| > 8 to 12 weeks (10) | Banks 1994b; Burgos 2000b; Colwell 1993; Matzen 1999; Thomas 1998 | ||||
| ≥ 16 weeks (7) | |||||
| Unclear (1) | |||||
| Mean age | < 65 years (8) | ||||
| Not stated (1) | |||||
| Physical conditions | Spinal cord injuries (4) | ||||
| Other (2) | Sopata 2002 (advanced cancer) | Parish 1979 ("chronically ill or physically disabled") | |||
| Ulcer grade | Mainly Stage 2 (17) | Bale 1997a; Thomas 1997a (Stirling); Brown‐Etris 2008 (classification not stated); Darkovich 1990 (Enis and Sarmiento); Hondé 1994 (Shea); Meaume 2003 (EUPAP) | Colwell 1993 (classification not stated); Graumlich 2003; Kaya 2005; Payne 2009 (NPUAP); Hollisaz 2004; Neill 1989a; Xakellis 1992 (Shea); Kraft 1993 (Enterstomal Therapy); Oleske 1986 (Enis and Sarmiento) | Gorse 1987; Van De Looverbosch 2004 (classification not stated) | |
| Mainly Stage 3 (15) | Belmin 2002 (Yarkony); Seeley 1999 (AHCPR); Thomas 1997a (Stirling); Serena 2010 (NPUAP); Brown‐Etris 1996; Motta 1999; Price 2000; Thomas 2005 (classification not stated) | Burgos 2000b (classification not stated); Piatkowski 2012 (EPUAP) | Sipponen 2008 (EPUAP) | Ashby 2012; Ramos‐Torrecillas 2015; (EPUAP classification); Yapucu Güneş 2007 (AHCRQ); Payne 2004 (classification not stated) | |
| Mainly Stage 4 (2) | Matzen 1999; Muller 2001 (classification not stated) | ||||
| Other (12) | Banks 1994c (II/III); Sopata 2002 II/III (Torrance); Brod 1990 (II/III) (classification not stated) | Banks 1994a (II/III); Brown‐Etris 1997 (II/III/IV) (classification not stated); Banks 1994b (Torrance II/III); Romanelli 2001 (II/III); Zeron 2007(2/3) (NPUAP) | Nisi 2005 (2‐4); Rees 1999 (3/4) (NPUAP); Sebern 1986 (II/III) (Shea); Imamura 1989 (II/III/IV) (classification not stated) | ||
| Not stated (5) | |||||
| Ulcer duration (other studies had ≥ 3 months) | < 3 months (16) | Banks 1994c (median 7 days); Belmin 2002; Brown‐Etris 1996; Brown‐Etris 2008; Meaume 2003; Motta 1999; Seeley 1999; Sopata 2002 (mean 2.5 weeks); Thomas 1997a | Banks 1994a; Burgos 2000b; Colwell 1993; Graumlich 2003; Hollisaz 2004; Kraft 1993; Payne 2009 | ||
| ≥ 3 months (6) | |||||
| Not stated/unclear (29) | Aguilo Sanchez 2002; Bale 1997a; Brod 1990; Darkovich 1990; Hondé 1994; Price 2000; Thomas 2005 | Banks 1994b; Barrois 1992; Brown‐Etris 1997; Kaya 2005; Matzen 1999; Muller 2001; Neill 1989a; Oleske 1986; Parish 1979; Piatkowski 2012 (> 4 weeks); Romanelli 2001; Thomas 1998; Xakellis 1992; Zeron 2007 | Gorse 1987; Imamura 1989; Nisi 2005; Nussbaum 1994 (> 6 weeks); Sebern 1986; Van De Looverbosch 2004 (> 1 month); Yapucu Güneş 2007 | ||
| Contrast/comparison | Number | RR (95% CI) direct evidence Random‐effects (inverse variance) Heterogeneity statistics | NMA results (consistency assumption) RR (95% CI) |
| Hydrocolloid dressing versus saline gauze dressing | 4 (279) | 1.89 (0.91 to 3.93) Tau² = 0.35; P = 0.01; I² = 73% | 1.43 (1.00 to 2.05) |
| Hydrogel versus saline gauze dressing | 3 (110) | 2.44 (0.64 to 9.27) Tau² = 0.90; P = 0.03; I² = 71% | 1.55 (1.02 to 2.36) |
| Foam dressings versus saline gauze dressing | 3 (93) | 1.51 (0.78 to 2.90) P = 0.41; I² = 0% | 1.52 (1.03 to 2.26) |
| Phenytoin versus saline gauze dressing | 1 (40) | 3.02 (0.97 to 9.35) | 1.27 (0.58 to 2.80) |
| Hydrogel versus hydrocolloid dressings | 4 (322) | 1.11 (0.74 to 1.67) Tau² = 0.08; P = 0.11; I² = 51% | 1.08 (0.83 to 1.42) |
| Foam dressing versus hydrocolloid dressing | 6 (292) | 1.05 (0.81 to 1.36) Tau² = 0.00; P = 0.67; I² = 0% (Stata: 1.05 (0.73 to 1.23)) | 1.07 (0.82 to 1.38) |
| Collagenase ointment versus hydrocolloid dressing | 2 (61) | 1.51 (0.93 to 2.43) P = 0.61; I² = 0% | 1.48 (0.81 to 2.69) |
| Iodine‐containing dressing versus hydrocolloid dressing | 1 (76) | 0.90 (0.41 to 1.96) | 0.76 (0.45 to 1.27) |
| Protease‐modulating dressing versus hydrocolloid dressing | 1 (65) | 1.03 (0.64 to 1.66) | 1.15 (0.72 to 1.84) |
| Vapour‐permeable dressing versus hydrocolloid dressing | 1 (72) | 1.01 (0.69 to 1.47) | 1.01 (0.58 to 1.77) |
| Hydrocolloid dressing 4 weeks then alginate dressing 4 weeks versus hydrocolloid dressing (Belmin 2002) | 1 (110) | 0.35 (0.10 to 1.25) | 0.35 (0.09 to 1.33) |
| Ineligible intervention: skin substitute versus hydrocolloid dressing (Hondé 1994) | 1 (168) | 1.48 (0.95 to 2.32) | 1.48 (0.81 to 2.71) |
| Foam dressing versus hydrogel (Sopata 2002) | 1 (38) | 1.11 (0.80 to 1.54) | 0.98 (0.71 to 1.36) |
| Tripeptide copper versus hydrogel | 1 (12) | 2.50 (0.76 to 8.19) | 2.51 (0.72 to 8.80) |
| Iodine‐containing dressing versus hydrogel | 1 (49) | 0.64 (0.43 to 0.97) | 0.70 (0.43 to 1.14) |
| Phenytoin versus hydrogel (Hollisaz 2004) | 1 (39) | 0.71 (0.41 to 1.24) | 0.82 (0.42 to 1.61) |
| Foam dressing versus protease‐modulating dressing | 1 (10) | 0.82 (0.49 to 1.38) | 0.93 (0.57 to 1.49) |
| Alginate dressing versus protease‐modulating dressing (Brown‐Etris 1997) | 1 (36) | 0.67 (0.08 to 5.75) | 0.30 (0.07 to 1.25) |
| PVP + zinc oxide versus protease‐modulating dressing | 1 (24) | 0.80 (0.28 to 2.27) | 0.80 (0.26 to 2.46) |
| Soft polymer dressing versus foam dressing | 1 (38) | 0.89 (0.45 to 1.75) | 0.89 (0.40 to 1.96) |
| Combination silicone‐foam dressing versus ineligible intervention: skin substitute (Serena 2010) | 1 (74) | 0.91 (0.22 to 3.77) | 0.90 (0.21 to 3.97) |
| Hydrocolloid with/without alginate filler versus ineligible intervention: radiant heat (Thomas 2005) | 1 (41) | 0.92 (0.41 to 2.06) | 0.92 (0.37 to 2.27) |
| Collagenase ointment versus dextranomer | 1 (12) | 0.35 (0.05 to 2.26) (Stata 0.44 (0.10 to 2.02)) | 0.44 (0.09 to 2.13) |
| Collagenase ointment versus sugar + egg white | 1 (10) | 3.00 (0.15 to 59.89) (Stata 3.00 (0.15 to 59.79)) | 3.00 (0.15 to 61.59) |
| Dextranomer versus sugar + egg white | 1 (12) | 6.75 (0.44 to 102.80) | 6.75 (0.43 to 105.99) |
| Foam dressing versus basic wound contact dressing | 1 (50) | 1.17 (0.79 to 1.72) | 1.17 (0.67 to 2.06) |
| Alginate dressing versus ineligible intervention: radiant heat (Price 2000) | 1 (58) | 0.82 (0.15 to 4.55) | 0.82 (0.14 to 4.77) |
| NMA evidence for group network: proportion with complete healing ‐ interventions versus basic dressings | ||||
| Patient or population: people with pressure ulcers Settings: hospital, community or care home, or combinations | ||||
| Contrasts: interventions versus basic dressing | Relative effect (95% CI) | Anticipated absolute effects* (95% CI) ‐ from median of basic dressing control groups in direct evidence | Certainty (quality) of the | |
| Median CGR | With interventions | |||
| Advanced dressings versus basic dressing | RR 1.36 | 191 per 1000 | 260 per 1000 | ⊕⊝⊝⊝ |
| 69 more people healed per 1000 (from 10 fewer to 178 more) | ||||
| Advanced + antimicrobial dressing versus basic dressing | RR 0.42 | 191 per 1000 | 80 per 1000 | ⊕⊝⊝⊝ |
| 111 fewer people healed per 1000 (from 67 more to 166 fewer) | ||||
| Antimicrobial dressing versus basic dressing | RR 0.96 | 191 per 1000 | 183 per 1000 | ⊕⊝⊝⊝ |
| 8 fewer people healed per 1000 (from 92 fewer to 147 more) | ||||
| Collagenase ointment versus basic dressing | RR 2.01 | 191 per 1000 | 384 per 1000 | ⊕⊕⊝⊝ |
| 193 more people healed per 1000 (from 10 more to 550 more) | ||||
| Dextranomer versus basic dressing | RR 4.53 | 191 per 1000 | 865 per 1000 | ⊕⊝⊝⊝ |
| 674 more people healed per 1000 (from 31 fewer to 1,000 more) | ||||
| Phenytoin versus basic dressing | RR 1.12 | 191 per 1000 | 214 per 1000 | ⊕⊝⊝⊝ |
| 23 more people healed per 1000 (from 92 fewer to 275 more) | ||||
| Protease‐modulating dressing versus basic dressing | RR 1.49 | 191 per 1000 | 285 per 1000 | ⊕⊕⊕⊝ |
| 94 more people healed per 1000 (from 17 fewer to 279 more) | ||||
| Sugar + egg white versus basic dressing | RR 0.67 (0.03 to 14.69) | 191 per 1000 | 128 per 1000 | ⊕⊝⊝⊝ |
| 63 fewer people healed per 1000 (from 185 fewer to 1000 more) | ||||
| Tripeptide copper gel versus basic dressing | RR 3.39 | 191 per 1000 | 647 per 1000 | ⊕⊕⊝⊝ |
| 456 more people healed per 1000 (from 11 fewer to 1000 more) | ||||
| *The risk in the intervention group (and its 95% CI) is based on the assumed risk in the comparison group and the relative effect of the intervention (and its 95% CI). | ||||
| GRADE Working Group grades of evidence | ||||
| 1Majority of evidence at high risk of bias (downgraded once); inconsistency: heterogeneity in direct evidence (downgraded once); imprecision: wide CI (downgraded once). | ||||
| Individual intervention | Group intervention (studies in final network) |
| Basic wound contact dressing | Basic dressing (12 studies) |
| Saline gauze dressing | |
| Polyvinylpyrrolidone | |
| Hydrocolloid dressing | Advanced dressing (19 studies) |
| Foam dressing | |
| Hydrogel dressing | |
| Soft polymer dressing | |
| Alginate dressing | |
| Vapour‐permeable dressing | |
| Combination silicone foam dressing | |
| Hydrocolloid with/without alginate | |
| Standard care as described in Ashby 2012 | |
| Honey | Antimicrobial dressing (3 studies) |
| Iodine‐containing dressing | |
| Ethoxy diaminoacridine + nitrofurazone dressing | |
| Resin salve | |
| Hydrocolloid or hydrocolloid silver dressing | Advanced or antimicrobial dressing (1 study) |
| Protease‐modulating dressing | Protease‐modulating dressing (4 studies) |
| Collagenase ointment | Collagenase ointment (3 studies) |
| Dextranomer | Dextranomer (1 study) |
| Phenytoin topical | Phenytoin topical (1 study) |
| Sugar + egg white | Sugar + egg white (1 study) |
| Tripeptide copper gel | Tripeptide copper gel (1 study) |
| Contrast/comparison | Number | RR (95% CI) direct evidence Random‐effects (inverse variance) Heterogeneity statistics | NMA results (consistency assumption) RR (95% CI) |
| Advanced dressings versus basic dressings (Alm 1989; Banks 1994b; Colwell 1993; Hollisaz 2004; Kraft 1993; Matzen 1999; | 11 (532) | 1.55 (1.10 to 2.19) Tau² = 0.13; P = 0.02; I² = 52% | 1.36 (0.95 to 1.93) |
| Phenytoin versus basic dressing | 1 (40) | 3.02 (0.97 to 9.35) | 1.12 (0.52 to 2.44) |
| Protease‐modulating dressing versus basic dressing (Zeron 2007) | 1 (24) | 1.25 (0.44 to 3.55) | 1.49 (0.91 to 2.46) |
| Antimicrobial dressings versus advanced dressings (Barrois 1992; Kaya 2005) | 2 (125) | 0.69 (0.48 to 0.99) Tau² = 0.00; P = 0.46; I² = 0% | 0.71 (0.45 to 1.13) |
| Collagenase ointment versus advanced dressings | 2 (61) | 1.51 (0.93 to 2.43) Tau² = 0.00; P = 0.61 ; I² = 0% | 1.48 (0.83 to 2.64) |
| Phenytoin versus advanced dressing | 1 (39) | 0.71 (0.41 to 1.24) | 0.83 (0.43 to 1.59) |
| Protease‐modulating dressing versus advanced dressing (Brown‐Etris 1997; Graumlich 2003; Piatkowski 2012) | 3 (112) | 1.13 (0.80 to 1.60) Tau² = 0.00; P = 0.84 ; I² = 0% (Stata: 1.12 (0.79 to 1.59)) | 1.10 (0.74 to 1.64) |
| Tripeptide copper gel versus advanced dressing | 1 (12) | 2.50 (0.76 to 8.19) | 2.50 (0.72 to 8.63) |
| Antimicrobial dressing versus advanced antimicrobial dressing (Sipponen 2008) | 1 (37) | 2.29 (0.91 to 5.77) | 2.29 (0.85 to 6.16) |
| Collagenase versus dextranomer | 1 (12) | 0.35 (0.05 to 2.26) (Stata 0.44 (0.10 to 2.02)) | 0.44 (0.09 to 2.11) |
| Collagenase ointment versus sugar + egg white (part of 3‐arm trial) (Parish 1979) | 1 (10) | 3.00 (0.15 to 59.89) (Stata 3.00 (0.15 to 59.79)) | 3.00 (0.15 to 61.18) |
| Dextranomer versus sugar + egg white (part of 3‐arm trial) (Parish 1979) | 1 (12) | 6.75 (0.44 to 102.80) | 6.75 (0.43 to 105.22) |
| TOTAL | 22 (959) |
| Group intervention | Mean rank | SUCRA | Probability at | Rank at maximum |
| Basic dressing | 7.3 | 0.3 | 30.6 | 8 |
| Advanced dressing | 5.2 | 0.5 | 38.8 | 5 |
| Advanced ‐ antimicrobial dressing | 9.4 | 0.1 | 57.0 | 10 |
| Antimicrobial dressing | 7.4 | 0.3 | 31.9 | 8 |
| Collagenase ointment | 3.3 | 0.7 | 39.4 | 3 |
| Dextranomer | 2 | 0.9 | 55.3 | 1 |
| Phenytoin | 6.5 | 0.4 | 20.5 | 7 |
| Protease‐modulating dressing | 4.6 | 0.6 | 31.2 | 4 |
| Sugar + egg white | 7 | 0.3 | 36.5 | 10 |
| Tripeptide copper gel | 2.3 | 0.9 | 36.2 | 2 |
| Intervention | Number of | Number of participants | In joined | Number of studies | Number of participants |
| Alginate dressings | 2 | 38 | Y | 2 | 38 |
| Basic wound contact dressings | 2 | 33 | Y | 1 | 24 |
| Collagenase‐containing ointment | 3 | 35 | Y | 3 | 35 |
| Combination dressing: non‐adherent + saline gauze + foam | 1 | 16 | N | ||
| Combination dressing: silicone + foam | 1 | 44 | Y | 1 | 44 |
| Dextranomer | 1 | 7 | Y | 1 | 7 |
| Enamel matrix protein | 1 | 6 | N | ||
| Ethoxy‐diaminoacridine plus nitrofurazone dressing | 1 | 26 | N | ||
| Foam dressings | 13 | 266 | Y | 13 | 266 |
| Gauze saline dressings | 11 | 245 | Y | 10 | 233 |
| Honey | 1 | 25 | N | ||
| Hydrocolloid dressings | 22 | 791 | Y | 21 | 715 |
| Hydrocolloid or hydrocolloid silver dressing | 1 | 16 | N | ||
| Hydrocolloid with or without alginate filler | 1 | 20 | Y | 1 | 20 |
| Hydrocolloid‐alginate sequential dressings | 1 | 57 | Y | 1 | 57 |
| Hydrogel | 12 | 335 | Y | 10 | 279 |
| Ineligible intervention: graft + conventional dressing | 1 | 18 | N | ||
| Ineligible intervention: growth factor + hyaluronic acid | 1 | 40 | N | ||
| Ineligible intervention: growth factor | 2 | 152 | N | ||
| Ineligible intervention laser | 1 | 7 | N | ||
| Ineligible intervention: NPWT (only included in group analysis) | 1 | 6 | N | ||
| Ineligible intervention: povidone iodine + paraffin soaked gauze | 1 | 40 | N | ||
| Ineligible intervention: radiant heat | 2 | 53 | Y | 2 | 53 |
| Ineligible intervention: skin substitute | 2 | 110 | Y | 2 | 110 |
| Ineligible intervention: ultrasound + ultraviolet | 1 | 6 | N | ||
| Ineligible intervention: whirlpool + chloramine dressing | 1 | 52 | N | ||
| Iodine‐containing dressings | 2 | 62 | Y | 2 | 62 |
| Lysosyme ointment | 1 | 69 | N | ||
| Phenytoin topical | 1 | 21 | Y | 1 | 21 |
| Polyvinylpyrrolidone + zinc oxide | 1 | 12 | Y | 1 | 12 |
| Propylene glycol alginate | 1 | 5 | N | ||
| Protease‐modulating dressings | 5 | 116 | Y | 4 | 76 |
| Resin salve | 1 | 16 | N | ||
| Soft polymer dressing | 1 | 18 | Y | 1 | 18 |
| Standard care (only included in group analysis) | 1 | 6 | N | ||
| Sugar + egg white | 1 | 5 | Y | 1 | 5 |
| Sugar + povidone iodine | 1 | 72 | N | ||
| Tripeptide copper + Opsite | 1 | 6 | Y | 1 | 6 |
| Vapour‐permeable dressings | 2 | 57 | Y | 1 | 35 |
| NMA ⇩ | Contributions from each direct evidence contrast | Overall risk |
| 1 vs 2 | 74.5% 1 vs 2 + 5.5% 1 vs 7 + 7.2% 1 vs 8 + 5.5% 2 vs 7 + 7.2% 2 vs 8 | high |
| 1 vs 3 | 27.1% 1 vs 2 + 2.0% 1 vs 7 + 2.6% 1 vs 8 + 31.8% 2 vs 4 + 2.0% 2 vs 7 + 2.6% 2 vs 8 + 31.8% 3 vs 4 | high |
| 1 vs 4 | 39.8% 1 vs 2 + 2.9% 1 vs 7 + 3.9% 1 vs 8 + 46.6% 2 vs 4 + 2.9% 2 vs 7 + 3.9% 2 vs 8 | high |
| 1 vs 5 | 39.8% 1 vs 2 + 2.9% 1 vs 7 + 3.9% 1 vs 8 + 46.6% 2 vs 5 + 2.9% 2 vs 7 + 3.9% 2 vs 8 | high |
| 1 vs 6 | 26.1% 1 vs 2 + 1.9% 1 vs 7 + 2.5% 1 vs 8 + 30.6% 2 vs 5 + 1.9% 2 vs 7 + | high |
| 1 vs 7 | 37.8% 1 vs 2 + 13.4% 1 vs 7 + 3.7% 1 vs 8 + 41.4% 2 vs 7 + 3.7% 2 vs 8 | low |
| 1 vs 8 | 40.8% 1 vs 2 + 3.0% 1 vs 7 + 9.3% 1 vs 8 + 3.0% 2 vs 7 + 43.8% 2 vs 8 | low |
| 1 vs 9 | 23.6% 1 vs 2 + 1.7% 1 vs 7 + 2.3% 1 vs 8 + 27.6% 2 vs 5 + 1.7% 2 vs 7 + | high |
| 1 vs 10 | 39.8% 1 vs 2 + 2.9% 1 vs 7 + 3.9% 1 vs 8 + 2.9% 2 vs 7 + 3.9% 2 vs 8 + 46.9% 2 vs 10 | low |
| Whole network | 8.7% 1 vs 2 + 2.1% 1 vs 7 + 1.6% 1 vs 8 + 14.9% 2 vs 4 + 19.6% 2 vs 5 + | high |
| Key to interventions: 1 = basic dressing; 2 = advanced dressing; 3 = advanced +/‐ antimicrobial dressing; Risk of bias for direct contrasts: Low ‐ 1 vs 7; 1 vs 8; 2 vs 7; 2 vs 8; 2 vs 10; 5 vs 6; 5 vs 9; 6 vs 9. | ||
| Common heterogeneity estimate within each loop | Common heterogeneity estimate for network: tau² (network) = 0.0435 | ||||
| Loop | Ratio of RR (90% CI) | P value | Loop heterogeneity tau² (loop) | Ratio of RR (90% CI) | P value |
| Saline gauze ‐ hydrogel ‐ phenytoin | 3.90 (1.19 to 12.77) | 0.059 | 0.000 | 3.75 (90%CI 1.14 to 12.29) | 0.067 |
| Saline gauze ‐ foam ‐ hydrogel | 1.64 (0.27 to 9.99) | 0.651 | 0.512 | 1.21 (90%CI 0.56 to 2.63) | 0.682 |
| Hydrocolloid ‐ hydrogel ‐ iodine containing dressing | 1.26 (0.44 to 3.61) | 0.721 | 0.084 | 1.28 (90%CI 0.59 to 2.75) | 0.602 |
| Foam ‐ hydrocolloid ‐ protease‐modulating | 1.25 (0.66 to 2.35) | 0.562 | 0 | 1.24 (90%CI 0.66 to 2.35) | 0.572 |
| Foam ‐ hydrocolloid ‐ hydrogel | 1.13 (0.7 to 1.83) | 0.675 | 0.016 | 1.16 (90%CI 0.77 to 1.75) | 0.548 |
| Saline gauze ‐ foam ‐ hydrocolloid | 1.04 (0.45 to 2.41) | 0.936 | 0.084 | 1.04 (90%CI 0.55 to 1.96) | 0.919 |
| Saline gauze ‐ hydrocolloid ‐ hydrogel | 1.01 (0.33 to 3.11) | 0.993 | 0.244 | 1.09 (90%CI 0.62 to 1.89) | 0.808 |
| Contrast | Direct evidence RR (95% CI) | Indirect evidence RR (95% CI) | RR direct/RR indirect (90% CI) | P value | tau² |
| Foam versus saline gauze | 1.52 (0.73 to 3.16) | 1.54 (0.95 to 2.49) | 0.99 (90% CI 0.47 to 2.05) | 0.973 | 0.22 |
| Hydrocolloid versus saline gauze | 1.41 (0.88 to 2.26) | 1.49 (0.87 to 2.56) | 0.95 (90% CI 0.53 to 1.69) | 0.876 | 0.22 |
| Hydrogel versus saline gauze | 1.67 (0.86 to 3.22) | 1.52 (0.91 to 2.54) | 1.10 (90% CI 0.57 to 2.12) | 0.820 | 0.22 |
| Phenytoin versus saline gauze | 3.01 (0.93 to 9.71) | 0.29 (0.05 to 1.51) | 10.06 (90% CI 1.35 to 75.13) | 0.059 | 0.15 |
| Hydrocolloid versus foam | 0.95 (0.68 to 1.32) | 0.91 (0.57 to 1.44) | 1.04 (90% CI 0.65 to 1.68) | 0.881 | 0.23 |
| Hydrogel versus foam | 0.90 (0.51 to 1.58) | 1.10 (0.72 to 1.68) | 0.81 (90% CI 0.45 to 1.47) | 0.568 | 0.23 |
| Protease‐modulating dressing versus foam | 1.22 (0.61 to 2.41) | 0.94 (0.46 to 1.92) | 1.29 (90% CI 0.56 to 2.94) | 0.614 | 0.22 |
| Hydrogel versus hydrocolloid | 1.10 (0.76 to 1.59) | 1.07 (0.68 to 1.68) | 1.02 (90% CI 0.63 to 1.67) | 0.935 | 0.24 |
| Iodine‐containing dressing versus hydrocolloid | 0.90 (0.36 to 2.19) | 0.68 (0.35 to 1.33) | 1.31 (90% CI 0.51 to 3.32) | 0.638 | 0.22 |
| Protease‐modulating dressing versus hydrocolloid | 1.02 (0.53 to 1.97) | 1.32 (0.63 to 2.76) | 0.78 (90% CI 0.34 to 1.77) | 0.614 | 0.22 |
| Iodine‐containing dressing versus hydrogel | 0.64 (0.35 to 1.16) | 0.84 (0.32 to 2.15) | 0.77 (90% CI 0.30 to 1.95) | 0.639 | 0.22 |
| Phenytoin versus hydrogel | 0.71 (0.38 to 1.34) | 7.18 (0.68 to 75.47) | 0.10 (90% CI 0.01 to 0.74) | 0.059 | 0.15 |
| Contrast | Design 1 | NMA results for design 1 | Design 2 | (NMA results for design 2 | NMA results |
| Foam versus saline gauze | 7 vs 1 (3 studies) | 1.53 (0.71 to 2.22) | NA | NA | 1.52 (1.03 to 1.85) |
| Hydrocolloid versus saline gauze | 8 vs 1 (4 studies) | 1.50 (0.9 to 1.92) | NA | NA | 1.43 (1.00 to 1.70) |
| Hydrogel versus saline gauze | 10 vs 1 (2 studies; heterogeneity) | 1.16 (0.51 to 1.73) | 10 vs 1 vs 14 (one 3‐arm study) | 4.22 (1.26 to 7.65) | 1.55 (1.02 to 1.91) |
| Phenytoin versus saline gauze | NA | NA | 14 vs 1 vs 10 | 3.02 (0.86 to 5.56) | 1.28 (0.58 to 1.88) |
| Hydrocolloid versus collagenase | 8 vs 5 (2 studies) | 0.68 (0.35 to 0.95) | NA | NA | 0.68 (0.37 to 0.91) |
| Hydrocolloid versus foam | 8 vs 7 (6 studies) | 0.96 (0.67 to 1.13) | NA | NA | 0.94 (0.73 to 1.07) |
| Hydrogel versus foam | 10 vs 7 (1 study) | 0.90 (0.48 to 1.22) | NA | NA | 1.02 (0.74 to 1.2) |
| Protease‐modulating versus foam | 15 vs 7 (1 study) | 1.22 (0.58 to 1.76) | NA | NA | 1.08 (0.67 to 1.36) |
| Hydrogel versus hydrocolloid | 10 vs 8 (4 studies) | 1.11 (0.74 to 1.35) | NA | NA | 1.09 (0.83 to 1.24) |
| Iodine‐containing dressing versus hydrocolloid | 13 vs 8 (1 study) | 0.90 (0.35 to 1.43) | NA | NA | 0.76 (0.45 to 0.97) |
| Protease‐modulating versus hydrocolloid | 15 vs 8 (1 study) | 1.03 (0.5 to 1.46) | NA | NA | 1.15 (0.72 to 1.45) |
| Iodine‐containing dressing versus hydrogel | 13 vs 10 (1 study) | 0.64 (0.33 to 0.9) | NA | NA | 0.70 (0.43 to 0.88) |
| Phenytoin versus hydrogel | NA | NA | 14 vs 10 vs 1 | 0.71 (0.33 to 1.04) | 0.82 (0.42 to 1.14) |
| Loop | Ratio of RR (90% CI) | P value | Loop heterogeneity ‐ tau² |
| Basic dressing ‐ advanced dressing ‐ phenytoin | 3.04 (0.71 to 13.06) | 0.210 | 0.085 |
| Basic dressing ‐ advanced dressing ‐ protease‐modulating dressing | 1.36 (0.39 to 4.73) | 0.682 | 0.091 |
| Contrast | Direct evidence RR (95% CI) | Indirect evidence RR (95% CI) | RR direct/RR indirect (90% CI) | P value | Tau² |
| Advanced dressing versus basic dressing | 1.41 (0.96 to 2.09) | 1.10 (0.33 to 3.73) | 1.28 (90% CI 0.44 to 3.76) | 0.705 | 0.221791 |
| Phenytoin versus basic dressing | 3.02 (0.97 to 9.38) | 0.24 (0.06 to 1.02) | 12.51 (90% CI 1.87 to 83.55) | 0.029 | 0.048414 |
| Protease‐modulating dressing versus basic dressing | 1.25 (0.4 to 3.87) | 1.60 (0.87 to 2.95) | 0.78 (90% CI 0.27 to 2.3) | 0.707 | 0.221734 |
| Phenytoin versus advanced dressing | 0.71 (0.41 to 1.25) | 8.94 (0.96 to 83.43) | 0.08 (90% CI 0.01 to 0.53) | 0.029 | 0.048424 |
| Protease‐modulating dressing versus advanced dressing | 1.13 (0.71 to 1.79) | 0.88 (0.27 to 2.92) | 1.28 (90% CI 0.44 to 3.76) | 0.706 | 0.221781 |
| Contrast | Design 1 | NMA results for design 1 | Design 2 | NMA results for design 2 | NMA results |
| Advanced dressing versus basic dressing | 2 vs 1 (10 studies; heterogeneity) | 1.21 (0.88 to 1.67) | 2 vs 1 vs 7 (1 study) | 4.22 (1.41 to 12.68) | 1.36 (0.95 to 1.93) |
| Phenytoin versus basic dressing | NA | NA | 7 vs 1 vs 2 (1 study) | 3.02 (0.96 to 9.44) | 1.12 (0.52 to 2.44) |
| Protease‐modulating dressing versus basic dressing | 8 vs 1 (1 study) | 1.25 (0.44 to 3.59) | NA | NA | 1.49 (0.91 to 2.46) |
| Phenytoin versus advanced dressing | NA | NA | 7 vs 2 vs 1 (1 study) | 0.71 (0.4 to 1.27) | 0.83 (0.43 to 1.59) |
| Protease‐modulating dressing versus advanced dressing | 8 vs 2 (3 studies) | 1.12 (0.78 to 1.62) | NA | NA | 1.10 (0.74 to 1.64) |
| Intervention | Mean rank | SUCRA | Probability | Rank at maximum |
| Saline gauze | 16.3 | 0.2 | 16.2 | 17 |
| Alginate dressing | 12.4 | 0.4 | 10.8 | 19 |
| Sequential hydrocolloid alginate dressings | 18.6 | 0.1 | 34.6 | 21 |
| Basic wound contact dressing | 12.4 | 0.4 | 11.6 | 15 |
| Collagenase ointment | 6.9 | 0.7 | 13.5 | 6 |
| Dextranomer | 3.5 | 0.9 | 40.8 | 1 |
| Foam dressing | 10.3 | 0.5 | 15.0 | 10 |
| Hydrocolloid dressing | 11.6 | 0.5 | 18.6 | 11 |
| Hydrocolloid with/without alginate filler | 11.9 | 0.5 | 12.4 | 21 |
| Hydrogel | 9.9 | 0.6 | 14.9 | 10 |
| Ineligible intervention ‐ radiant heat | 11.4 | 0.5 | 12.8 | 20 |
| Ineligible intervention ‐ skin substitute | 6.6 | 0.7 | 15.0 | 4 |
| Iodine‐containing dressing | 15.3 | 0.3 | 13.4 | 17 |
| Phenytoin | 12.6 | 0.4 | 9.4 | 16 |
| Protease‐modulating dressing | 9.3 | 0.6 | 11.8 | 8 |
| PVP + zinc oxide | 11.8 | 0.5 | 8.1 | 20 |
| Silicone + foam dressing | 8.9 | 0.6 | 10.0 | 2 |
| Soft polymer dressing | 11.9 | 0.5 | 7.7 | 16 |
| Sugar + egg white | 14.4 | 0.3 | 31.8 | 21 |
| Tripeptide copper gel | 3.7 | 0.9 | 25.3 | 1 |
| Vapour‐permeable dressing | 11.4 | 0.5 | 8.9 | 13 |
| Contrast | Study | Risk ratio (95% CI) | Hazard ratio (95% CI) | Median times to healing |
| Hydrocolloid versus saline gauze | (6 weeks) | 3.43 (1.32 to 8.89) | 1.88 (0.80 to 4.45) | |
| Xakellis 1992 | 1.04 (0.82 to 1.32) | 1.67 (0.81 to 3.45) | 9 days versus 11 days | |
| Meta‐analysis of 2 studies in 95 participants (Alm 1989; Xakellis 1992) ‐ selected | Meta‐analysis: 1.72 (0.54 to 5.47) I² = 82%, P = 0.02 | Meta‐analysis: 1.75 (95% CI 1.00 to 3.05 I² = 0%, P = 0.84 | ||
| Hydrogel versus hydrocolloid | Brod 1990 (8 weeks) | 1.11 (0.74 to 1.67) | 1.30 (0.54 to 3.13) | 32 days versus 42 days (P = 0.56); Kaplan‐Meier curves crossing |
| Protease‐modulating dressing versus hydrocolloid | Graumlich 2003 (8 weeks) | 1.03 (0.64 to 1.66) | 1.34 (0.67 to 2.65) | 4 weeks and 7 weeks (estimated from Kaplan‐Meier plot); protease‐modulating dressing had more healing from 5 weeks |
| Collagenase ointment versus hydrocolloid | Muller 2001 (16 weeks ‐ probably) | 1.57 (0.95 to 2.61) | 2.58 (1.00 to 6.65) | |
| Hydrocolloid +/‐ alginate versus ineligible: radiant heat | Thomas 2005 (12 weeks) | 0.92 (0.41 to 2.06) | 0.64 (0.23 to 1.77) | > 90 days and 70 days (estimated from Kaplan‐Meier plot); radiant heat had consistently more healing at all time points |
| Foam versus saline gauze | Payne 2009 (4 weeks) | 1.33 (0.62 to 2.88) | 1.12 (0.42 to 3.01) |
| Risk ratio (95% CI) intervention versus saline gauze | Mean rank (of 21 interventions unless otherwise stated) | |||||
| Intervention | Original | Sensitivity analysis 1. Very high risk of bias | Sensitivity analysis 2. Complete case | Original saline 16.3 | Sensitivity analysis 1. Very high risk of bias | Sensitivity analysis 2. Complete case saline = 16.3 |
| Alginate dressing | 1.10 (0.11 to 10.57) | 1.14 (0.11 to 11.45) | 1.08 (0.11 to 10.69) | 12.4 | 11 | 12.6 |
| Sequential hydrocolloid | s0.50 (0.12 to 1.99) | 0.52 (0.12 to 2.20) | 0.51 (0.12 to 2.1) | 18.6 | 15.8 | 18.5 |
| Basic wound contact dressing | 1.30 (0.65 to 2.59) | 1.33 (0.61 to 2.93) | 1.44 (0.76 to 2.73) | 12.4 | 10.6 | 11.1 |
| Collagenase ointment | 2.11 (1.06 to 4.21) | 2.35 (1.02 to 5.44) | 2.01 (0.98 to 4.12) | 6.9 | 5.2 | 7.4 |
| Dextranomer | 4.75 (0.86 to 26.34) | 5.29 (0.87 to 32.26) | 4.51 (0.79 to 25.88) | 3.5 | 2.9 | 3.8 |
| Foam dressing | 1.52 (1.03 to 2.26) | 1.56 (1 to 2.43) | 1.45 (0.97 to 2.15) | 10.3 | 9 | 11.2 |
| Hydrocolloid dressing | 1.43 (1 to 2.05) | 1.50 (0.99 to 2.26) | 1.47 (1.02 to 2.12) | 11.6 | 9.7 | 11.1 |
| Hydrocolloid with/without | 1.23 (0.06 to 24.86) | not in network | 1.33 (0.06 to 27.37) | 11.9 | not in network | 11.5 |
| Hydrogel dressing | 1.55 (1.02 to 2.36) | 1.74 (1.09 to 2.77) | 1.56 (1.02 to 2.37) | 9.9 | 7.5 | 9.8 |
| Ineligible: radiant heat | 1.34 (0.08 to 23.53) | 1.39 (0.07 to 25.76) | 1.62 (0.09 to 29.28) | 11.4 | not in network | 10.2 |
| Ineligible: skin substitute | 2.12 (1.05 to 4.28) | not in network | 1.92 (0.91 to 4.02) | 6.6 | 9.8 | 7.6 |
| Iodine‐containing dressing | 1.08 (0.58 to 2.02) | 1.19 (0.6 to 2.38) | 1.13 (0.58 to 2.18) | 15.3 | 12.1 | 14.7 |
| Phenytoin | 1.28 (0.58 to 2.81) | 1.66 (0.71 to 3.89) | 1.3 (0.57 to 2.96) | 12.6 | 8.6 | 12.4 |
| Protease‐modulating dressing | 1.64 (0.92 to 2.93) | 1.71 (0.89 to 3.26) | 1.63 (0.89 to 2.97) | 9.3 | 7.9 | 9.4 |
| PVP + ZnO | 1.32 (0.37 to 4.64) | 1.37 (0.36 to 5.19) | 1.30 (0.35 to 4.78) | 11.8 | 10.2 | 11.9 |
| Combined silicone foam dressing | 1.93 (0.37 to 9.92) | not in network | 1.74 (0.33 to 9.32) | 8.9 | not in network | 9.7 |
| Soft polymer dressing | 1.35 (0.56 to 3.27) | 1.39 (0.53 to 3.63) | 1.29 (0.52 to 3.23) | 11.9 | 10.2 | 12.3 |
| Sugar + egg white | 0.70 (0.03 to 15.6) | 0.78 (0.03 to 18.33) | 0.67 (0.03 to 15.11) | 14.4 | 12 | 14.6 |
| Tripeptide copper gel | 3.88 (1.03 to 14.56) | 2.78 (0.90 to 8.58) | 3.89 (1.01 to 15) | 3.7 | 4.8 | 3.8 |
| Vapour‐permeable dressing | 1.44 (0.74 to 2.8) | 1.51 (0.70 to 3.25) | 1.48 (0.72 to 3.04) | 11.4 | 9.5 | 11 |
| Outcome or subgroup title | No. of studies | No. of participants | Statistical method | Effect size |
| 1 Interventions vs saline gauze Show forest plot | 10 | Risk Ratio (IV, Random, 95% CI) | Subtotals only | |
| 1.1 Hydrocolloid vs saline gauze | 4 | 279 | Risk Ratio (IV, Random, 95% CI) | 1.89 [0.91, 3.93] |
| 1.2 Hydrogel vs saline gauze | 3 | 110 | Risk Ratio (IV, Random, 95% CI) | 2.44 [0.64, 9.27] |
| 1.3 Foam vs saline gauze | 3 | 93 | Risk Ratio (IV, Random, 95% CI) | 1.51 [0.78, 2.90] |
| 2 Interventions vs hydrocolloid Show forest plot | 13 | Risk Ratio (IV, Random, 95% CI) | Subtotals only | |
| 2.1 Hydrogel vs hydrocolloid | 4 | 322 | Risk Ratio (IV, Random, 95% CI) | 1.11 [0.74, 1.67] |
| 2.2 Foam vs hydrocolloid | 6 | 292 | Risk Ratio (IV, Random, 95% CI) | 1.05 [0.81, 1.36] |
| 2.3 Collagenase ointment vs hydrocolloid | 2 | 61 | Risk Ratio (IV, Random, 95% CI) | 1.51 [0.93, 2.43] |
| 2.4 Protease‐modulating dressing vs hydrocolloid | 1 | 65 | Risk Ratio (IV, Random, 95% CI) | 1.03 [0.64, 1.66] |
| Outcome or subgroup title | No. of studies | No. of participants | Statistical method | Effect size |
| 1 Intervention 1 vs intervention 2 Show forest plot | 18 | Risk Ratio (IV, Random, 95% CI) | Subtotals only | |
| 1.1 Advanced dressing vs basic dressing | 11 | 532 | Risk Ratio (IV, Random, 95% CI) | 1.55 [1.10, 2.19] |
| 1.2 Antimicrobial dressing vs advanced dressing | 2 | 125 | Risk Ratio (IV, Random, 95% CI) | 0.69 [0.48, 0.99] |
| 1.3 Collagenase ointment vs advanced dressing | 2 | 61 | Risk Ratio (IV, Random, 95% CI) | 1.51 [0.93, 2.43] |
| 1.4 Protease‐modulating dressing vs advanced dressing | 3 | 112 | Risk Ratio (IV, Random, 95% CI) | 1.13 [0.80, 1.60] |
| Outcome or subgroup title | No. of studies | No. of participants | Statistical method | Effect size |
| 1 Time‐to‐healing (survival analysis) Show forest plot | 7 | Hazard Ratio (Fixed, 95% CI) | Subtotals only | |
| 1.1 Hydrocolloid versus saline gauze | 2 | 95 | Hazard Ratio (Fixed, 95% CI) | 1.75 [1.00, 3.05] |
| 1.2 Hydrogel versus hydrocolloid | 1 | 43 | Hazard Ratio (Fixed, 95% CI) | 1.30 [0.54, 3.13] |
| 1.3 Protease‐modulating versus hydrocolloid | 1 | 65 | Hazard Ratio (Fixed, 95% CI) | 1.34 [0.67, 2.65] |
| 1.4 Collagenase ointment versus hydrocolloid | 1 | 24 | Hazard Ratio (Fixed, 95% CI) | 2.59 [1.01, 6.62] |
| 1.5 Foam versus saline gauze | 1 | 36 | Hazard Ratio (Fixed, 95% CI) | 1.13 [0.42, 3.00] |
| 1.6 Hydrocolloid +/‐ alginate versus ineligible: radiant heat | 1 | 41 | Hazard Ratio (Fixed, 95% CI) | 0.64 [0.23, 1.77] |
| Outcome or subgroup title | No. of studies | No. of participants | Statistical method | Effect size |
| 1 Time‐to‐healing (survival analysis) Show forest plot | 5 | Hazard Ratio (Fixed, 95% CI) | Subtotals only | |
| 1.1 Advanced dressing versus basic dressing | 3 | Hazard Ratio (Fixed, 95% CI) | 1.57 [0.97, 2.55] | |
| 1.2 Protease‐modulating dressing versus advanced dressing | 1 | Hazard Ratio (Fixed, 95% CI) | 1.34 [0.67, 2.65] | |
| 1.3 Advanced dressings versus collagenase ointment | 1 | Hazard Ratio (Fixed, 95% CI) | 0.27 [0.11, 0.67] | |
| Outcome or subgroup title | No. of studies | No. of participants | Statistical method | Effect size |
| 1 Intervention 1 vs intervention 2 Show forest plot | 4 | Risk Ratio (IV, Random, 95% CI) | Totals not selected | |
| 1.1 Sugar + povidone iodine vs lysosyme | 1 | Risk Ratio (IV, Random, 95% CI) | 0.0 [0.0, 0.0] | |
| 1.2 Enamel matrix protein vs propylene glycol alginate | 1 | Risk Ratio (IV, Random, 95% CI) | 0.0 [0.0, 0.0] | |
| 1.3 Honey vs ethoxy‐diaminoacridine +nitrofurazone dressings | 1 | Risk Ratio (IV, Random, 95% CI) | 0.0 [0.0, 0.0] | |
| 1.4 Resin salve vs hydrocolloid or hydrocolloid silver dressing | 1 | Risk Ratio (IV, Random, 95% CI) | 0.0 [0.0, 0.0] | |