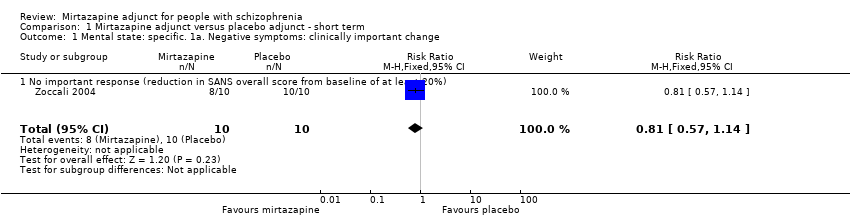
| 1 Mental state: specific. 1a. Negative symptoms: clinically important change Show forest plot | 1 | 20 | Risk Ratio (M‐H, Fixed, 95% CI) | 0.81 [0.57, 1.14] |
|
| 1.1 No important response (reduction in SANS overall score from baseline of at least 20%) | 1 | 20 | Risk Ratio (M‐H, Fixed, 95% CI) | 0.81 [0.57, 1.14] |
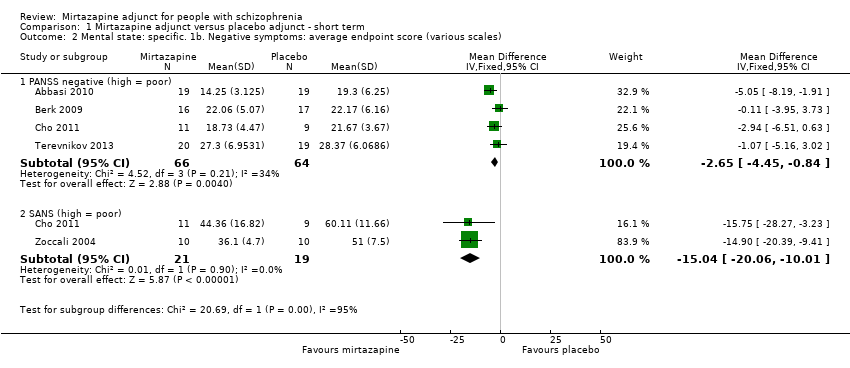
| 2 Mental state: specific. 1b. Negative symptoms: average endpoint score (various scales) Show forest plot | 5 | | Mean Difference (IV, Fixed, 95% CI) | Subtotals only |
|
| 2.1 PANSS negative (high = poor) | 4 | 130 | Mean Difference (IV, Fixed, 95% CI) | ‐2.65 [‐4.45, ‐0.84] |
| 2.2 SANS (high = poor) | 2 | 40 | Mean Difference (IV, Fixed, 95% CI) | ‐15.04 [‐20.06, ‐10.01] |
| 3 Mental sate: specific. 1c. Negative symptoms: average endpoint score (PANSS negative, high = poor) ‐skewed data Show forest plot | | | Other data | No numeric data |
|
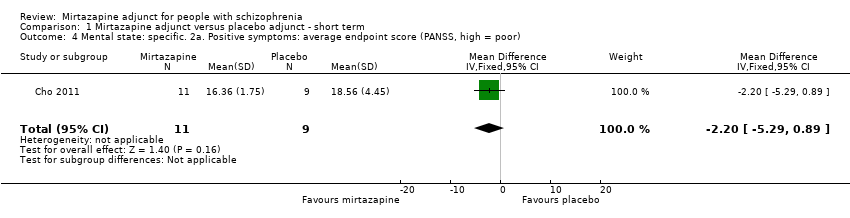
| 4 Mental state: specific. 2a. Positive symptoms: average endpoint score (PANSS, high = poor) Show forest plot | 1 | 20 | Mean Difference (IV, Fixed, 95% CI) | ‐2.20 [‐5.29, 0.89] |
|
| 5 Mental state: specific. 2b. Positive symptoms: average endpoint score (various scales) ‐ skewed data Show forest plot | | | Other data | No numeric data |
|
| 6 Mental state: overall. 3a. Clinically important change (at least 20% change PANSS) Show forest plot | 2 | 77 | Risk Ratio (M‐H, Fixed, 95% CI) | 0.69 [0.51, 0.92] |
|
| 6.1 No response | 2 | 77 | Risk Ratio (M‐H, Fixed, 95% CI) | 0.69 [0.51, 0.92] |
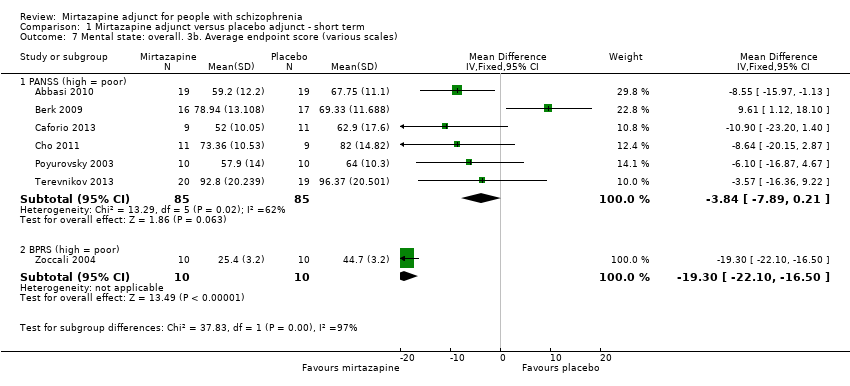
| 7 Mental state: overall. 3b. Average endpoint score (various scales) Show forest plot | 7 | | Mean Difference (IV, Fixed, 95% CI) | Subtotals only |
|
| 7.1 PANSS (high = poor) | 6 | 170 | Mean Difference (IV, Fixed, 95% CI) | ‐3.84 [‐7.89, 0.21] |
| 7.2 BPRS (high = poor) | 1 | 20 | Mean Difference (IV, Fixed, 95% CI) | ‐19.30 [‐22.10, ‐16.50] |
| 8 Mental state: overall. 3c. Average change score (various scales) ‐ skewed data Show forest plot | | | Other data | No numeric data |
|
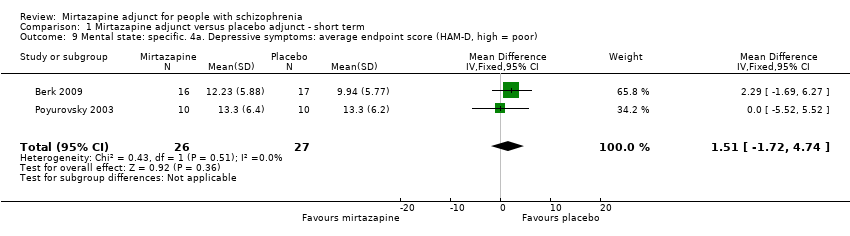
| 9 Mental state: specific. 4a. Depressive symptoms: average endpoint score (HAM‐D, high = poor) Show forest plot | 2 | 53 | Mean Difference (IV, Fixed, 95% CI) | 1.51 [‐1.72, 4.74] |
|
| 10 Mental state: specific. 4b. Depressive symptoms: average change score (various scales) ‐ skewed data Show forest plot | | | Other data | No numeric data |
|
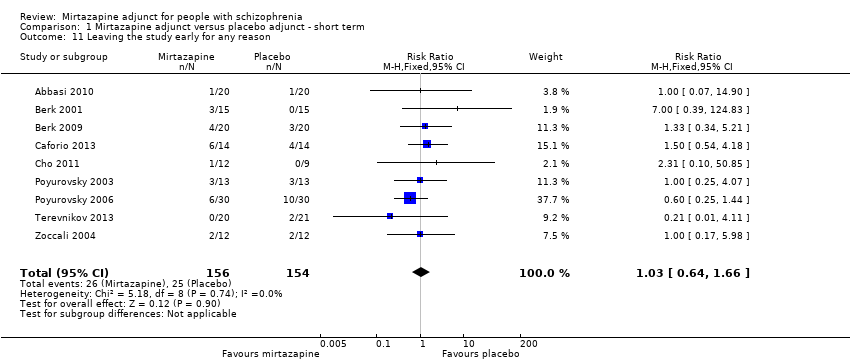
| 11 Leaving the study early for any reason Show forest plot | 9 | 310 | Risk Ratio (M‐H, Fixed, 95% CI) | 1.03 [0.64, 1.66] |
|
| 12 Global state: 1. Average endpoint score (CGI severity, high = poor) Show forest plot | 1 | 39 | Mean Difference (IV, Fixed, 95% CI) | ‐0.10 [‐0.68, 0.48] |
|
| 13 Global state: 2a. Average change score (PGI, high = poor) Show forest plot | 1 | 39 | Mean Difference (IV, Fixed, 95% CI) | ‐0.54 [‐0.97, ‐0.11] |
|
| 14 Global state: 2b. Average change date (various scales) ‐ skewed data Show forest plot | | | Other data | No numeric data |
|
| 15 Cognitive functioning: other data Show forest plot | | | Other data | No numeric data |
|
| 15.1 Other data tables | | | Other data | No numeric data |
| 16 Adverse events: 1a. General (participants with at least one adverse event) Show forest plot | 2 | 71 | Risk Ratio (M‐H, Fixed, 95% CI) | 0.96 [0.81, 1.12] |
|
| 17 Adverse events: 1b. General (total number of adverse events) ‐ count data Show forest plot | | | Other data | No numeric data |
|
| 18 Adverse effects: 2a. Extrapyramidal: clinically important change akathisia Show forest plot | 2 | 86 | Risk Ratio (M‐H, Fixed, 95% CI) | 0.33 [0.20, 0.52] |
|
| 18.1 No clinically important response (reduction of at least 2 on BAS) | 2 | 86 | Risk Ratio (M‐H, Fixed, 95% CI) | 0.33 [0.20, 0.52] |
| 19 Adverse effects: 2b. Extrapyramidal ‐ full resolution of akathisia Show forest plot | 1 | | Risk Ratio (M‐H, Fixed, 95% CI) | Subtotals only |
|
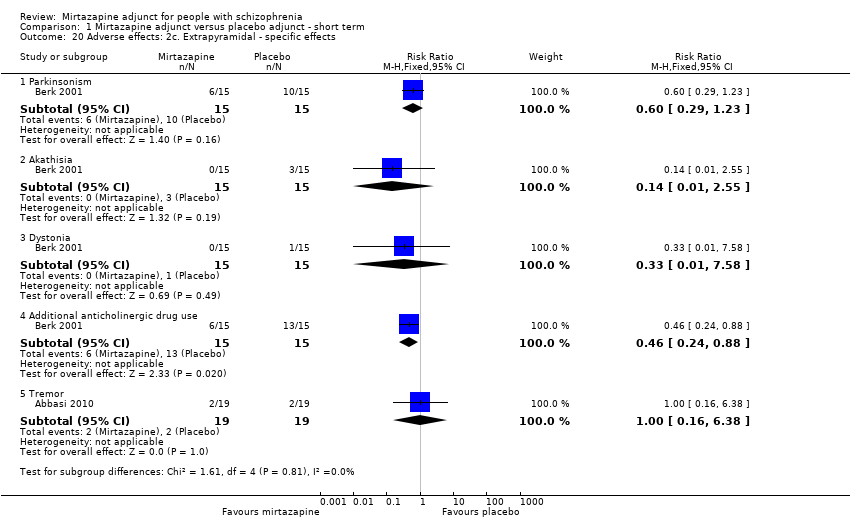
| 20 Adverse effects: 2c. Extrapyramidal ‐ specific effects Show forest plot | 2 | | Risk Ratio (M‐H, Fixed, 95% CI) | Subtotals only |
|
| 20.1 Parkinsonism | 1 | 30 | Risk Ratio (M‐H, Fixed, 95% CI) | 0.6 [0.29, 1.23] |
| 20.2 Akathisia | 1 | 30 | Risk Ratio (M‐H, Fixed, 95% CI) | 0.14 [0.01, 2.55] |
| 20.3 Dystonia | 1 | 30 | Risk Ratio (M‐H, Fixed, 95% CI) | 0.33 [0.01, 7.58] |
| 20.4 Additional anticholinergic drug use | 1 | 30 | Risk Ratio (M‐H, Fixed, 95% CI) | 0.46 [0.24, 0.88] |
| 20.5 Tremor | 1 | 38 | Risk Ratio (M‐H, Fixed, 95% CI) | 1.0 [0.16, 6.38] |
| 21 Adverse effects: 2d. Extrapyramidal: average change score (various scales) Show forest plot | 1 | | Mean Difference (IV, Fixed, 95% CI) | Subtotals only |
|
| 21.1 SAS, high = poor | 1 | 60 | Mean Difference (IV, Fixed, 95% CI) | ‐0.27 [‐1.97, 1.43] |
| 21.2 BAS , high = poor | 1 | 60 | Mean Difference (IV, Fixed, 95% CI) | ‐0.03 [‐0.69, 0.63] |
| 22 Adverse effects: 2e. Extrapyramidal: average endpoint score (various scales) ‐ skewed or unusable data Show forest plot | | | Other data | No numeric data |
|
| 23 Adverse effects: 2f. Extrapyramidal: treatment details ‐ skewed data Show forest plot | | | Other data | No numeric data |
|
| 24 Adverse events: 3. Other specific effects Show forest plot | 8 | | Risk Ratio (M‐H, Fixed, 95% CI) | Subtotals only |
|
| 24.1 Weight gain | 4 | 127 | Risk Ratio (M‐H, Fixed, 95% CI) | 3.19 [1.17, 8.65] |
| 24.2 Headache | 4 | 157 | Risk Ratio (M‐H, Fixed, 95% CI) | 1.44 [0.54, 3.82] |
| 24.3 Sedation/drowsiness | 7 | 223 | Risk Ratio (M‐H, Fixed, 95% CI) | 1.64 [1.01, 2.68] |
| 24.4 Increased appetite | 2 | 77 | Risk Ratio (M‐H, Fixed, 95% CI) | 2.57 [0.66, 10.07] |
| 24.5 Weakness | 1 | 39 | Risk Ratio (M‐H, Fixed, 95% CI) | 2.86 [0.12, 66.11] |
| 24.6 Hypersedimentaiton | 1 | 39 | Risk Ratio (M‐H, Fixed, 95% CI) | 2.86 [0.12, 66.11] |
| 24.7 Arrythmia/palpitations | 1 | 60 | Risk Ratio (M‐H, Fixed, 95% CI) | 1.0 [0.15, 6.64] |
| 24.8 Uterine myoma | 1 | 39 | Risk Ratio (M‐H, Fixed, 95% CI) | 2.86 [0.12, 66.11] |
| 24.9 Dizziness | 3 | 137 | Risk Ratio (M‐H, Fixed, 95% CI) | 2.32 [0.83, 6.51] |
| 24.10 Collapse | 1 | 39 | Risk Ratio (M‐H, Fixed, 95% CI) | 0.32 [0.01, 7.35] |
| 24.11 Acute Respiratory Distress Syndrome | 1 | 39 | Risk Ratio (M‐H, Fixed, 95% CI) | 0.32 [0.01, 7.35] |
| 24.12 Nausea | 2 | 77 | Risk Ratio (M‐H, Fixed, 95% CI) | 1.55 [0.45, 5.41] |
| 24.13 Agitation | 2 | 77 | Risk Ratio (M‐H, Fixed, 95% CI) | 0.70 [0.15, 3.32] |
| 24.14 Sleep disturbance | 2 | 77 | Risk Ratio (M‐H, Fixed, 95% CI) | 0.20 [0.02, 1.61] |
| 24.15 Dry mouth | 2 | 98 | Risk Ratio (M‐H, Fixed, 95% CI) | 2.25 [0.74, 6.81] |
| 24.16 Blurred vision | 1 | 60 | Risk Ratio (M‐H, Fixed, 95% CI) | 1.33 [0.33, 5.45] |
| 24.17 Conjunctivitis | 1 | 39 | Risk Ratio (M‐H, Fixed, 95% CI) | 0.32 [0.01, 7.35] |