Análisis moleculares para el diagnóstico de la sepsis en los recién nacidos
Información
- DOI:
- https://doi.org/10.1002/14651858.CD011926.pub2Copiar DOI

- Base de datos:
-
- Cochrane Database of Systematic Reviews
- Versión publicada:
-
- 25 febrero 2017see what's new
- Tipo:
-
- Diagnostic
- Etapa:
-
- Review
- Grupo Editorial Cochrane:
-
Grupo Cochrane de Neonatología
- Copyright:
-
- Copyright © 2017 The Cochrane Collaboration. Published by John Wiley & Sons, Ltd.
Cifras del artículo
Altmetric:
Citado por:
Autores
Contributions of authors
MP conceived the project, searched literature, extracted and analyzed data, and wrote the review.
AF participated in the design, searched literature, extracted data, performed the QUADAS evaluation of included studies and assisted in writing the review.
JV provided critical intellectual input and revised the review.
ML provided critical intellectual input and revised the review.
Sources of support
Internal sources
-
No sources of support supplied
External sources
-
Eunice Kennedy Shriver National Institute of Child Health and Human Development National Institutes of Health, Department of Health and Human Services, USA.
Editorial support of the Cochrane Neonatal Review Group has been funded with Federal funds from the Eunice Kennedy Shriver National Institute of Child Health and Human Development National Institutes of Health, Department of Health and Human Services, USA, under Contract No. HHSN275201100016C
Declarations of interest
Mohan Pammi, Angela Flores, James Versalovic and Mariska MG Leeflang have no financial or other conflicts of interest to disclose.
Acknowledgements
The Cochrane Neonatal Group has been funded in part with federal funds from the Eunice Kennedy Shriver National Institute of Child Health and Human Development National Institutes of Health, Department of Health and Human Services, USA, under Contract No. HHSN267200603418C. We acknowledge the help of Nha Huynh, librarian at the Texas Medical Center library in Houston, TX, USA and Milagros De Jesus, librarian at Texas Technical University Health Sciences Center, Lubbock, TX, USA for invaluable help with search strategy.
We acknowledge the help of Joe Hagan, statistician, Section of Neonatology at Baylor College of Medicine in creating the Deeks' funnel plot and checking the statistics for the hierarchical summary receiver operating characteristic (HSROC) and the bivariate model.
Version history
| Published | Title | Stage | Authors | Version |
| 2017 Feb 25 | Molecular assays for the diagnosis of sepsis in neonates | Review | Mohan Pammi, Angela Flores, James Versalovic, Mariska MG Leeflang | |
| 2015 Nov 05 | Molecular assays for the diagnosis of sepsis in neonates | Protocol | Mohan Pammi, Angela Flores, James Versalovic, Mariska MG Leeflang | |
Differences between protocol and review
1. We decided post‐hoc to present quality of evidence using GRADE methodology recommended for diagnostic tests.
2. Some studies did not include an upper limit for age and hence some infants were over 28 days of age. We made a post‐hoc decision that we would include studies where an upper age limit was not specified but where more than 50% of the samples were from newborn less than 28 days of age. Our decision was supported by the reasoning that LOS extends up to three months of age and participant characteristics are similar in the first two to three months of age.
Keywords
MeSH
Medical Subject Headings (MeSH) Keywords
Medical Subject Headings Check Words
Humans; Infant, Newborn;

Study flow diagram.

Deeks' funnel plot for publication bias.

Risk of bias and applicability concerns graph: review authors' judgments about each domain presented as percentages across included studies.

Risk of bias and applicability concerns summary: review authors' judgments about each domain for each included study.

Forest plot of 1 All molecular tests. CI: confidence interval; FN: false negative; FP: false positive; TN: true negative; TP: true positive.

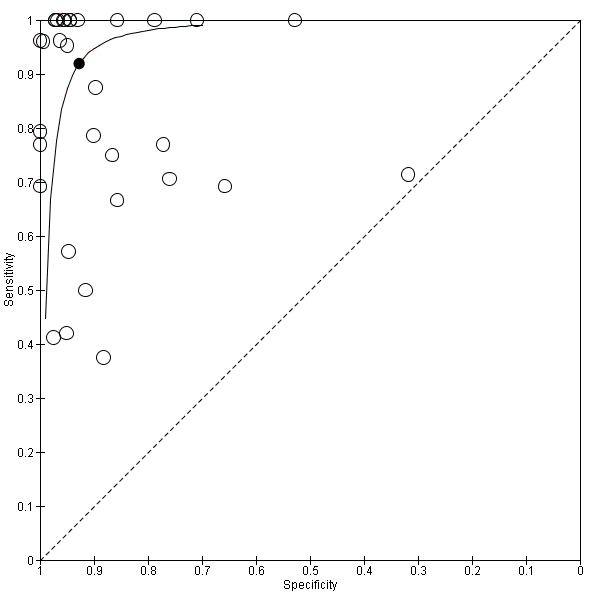
Summary receiver operating characteristic plot of all molecular tests.
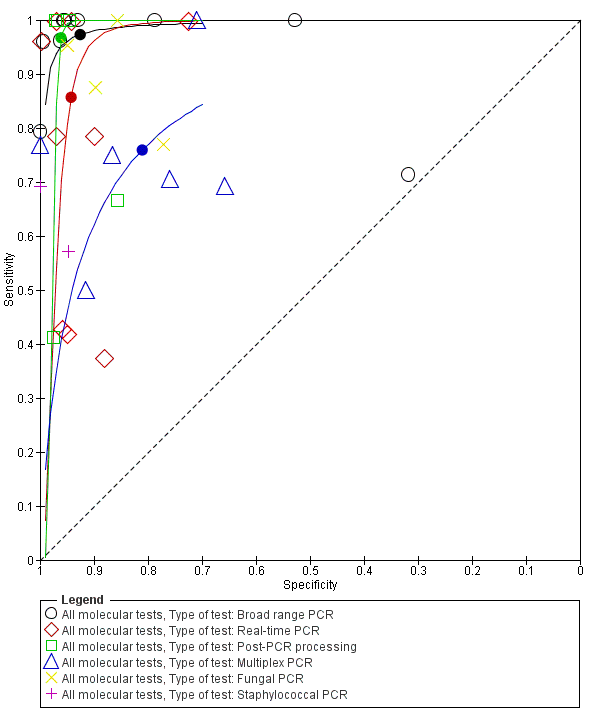
Summary receiver operating characteristic plot by type of molecular test. PCR: polymerase chain reaction.

Summary receiver operating characteristic plot subgrouped by sepsis onset.

Summary receiver operating characteristic plot subgrouped by gestational age.

Forest plot of all molecular tests sorted in order of prevalence. CI: confidence interval; FN: false negative; FP: false positive; TN: true negative; TP: true positive.

Summary receiver operating characteristic plot of all molecular tests where the size of the study symbol is directly proportional to the prevalence of sepsis in the study.
Summary receiver operating characteristic plot of studies that performed molecular tests on blood samples only.

Summary receiver operating characteristic plot of molecular tests with good methodologic quality.

All molecular tests.

Molecular tests: blood samples only.

Molecular tests with good methodologic quality.
| Groups | Number of studies | Sensitivity (95% CI) | Specificity (95% CI) | Quality of evidence using GRADE | |
| All studies | ‐ | 35 | 0.90 (0.82 to 0.95) | 0.93 (0.89 to 0.96) | Moderate quality evidence* |
| Type of test | Broad‐range PCR | 9 | 0.97 (0.86 to 1.00) | 0.93 (0.77 to 0.98) | Moderate quality evidence* |
| Real‐time PCR | 9 | 0.86 (0.59 to 0.96) | 0.94 (0.90 to 0.97) | Moderate quality evidence* | |
| Post‐PCR processing | 5 | 0.97 (0.40 to 1.00) | 0.96 (0.93 to 0.98) | Low quality evidence** | |
| Multiplex PCR | 6 | 0.76 (0.60 to 0.88) | 0.81 (0.70 to 0.89) | Low quality evidence** | |
| Staphylococcal PCR* | 2 | ‐ | ‐ | Low quality evidence** | |
| Fungal PCR* | 4 | ‐ | ‐ | Low quality evidence** | |
| Type of sepsis | EOS* | 2 | ‐ | ‐ | Low quality evidence** |
| LOS | 10 | 0.79 (0.69 to 0.86) | 0.94 (0.85 to 0.98) | Low quality evidence** | |
| Mixed EOS and LOS | 23 | 0.94 (0.84 to 0.98) | 0.92 (0.87 to 0.95) | Moderate quality evidence* | |
| Gestational age | Preterm | 5 | 0.89 (0.75 to 0.96) | 0.87 (0.71 to 0.94) | Low quality evidence** |
| Mixed term and preterm | 30 | 0.90 (0.80 to 0.96) | 0.94 (0.90 to 0.96) | Moderate quality evidence* | |
| Prevalence | < 15% | 20 | 0.94 (0.80 to 0.99) | 0.95 (0.92 to 0.97) | Moderate quality evidence* |
| 15% to 30% | 8 | 0.85 (0.67 to 0.94) | 0.88 (0.79 to 0.94) | Low quality evidence** | |
| >30% | 7 | 0.87 (0.75 to 0.93) | 0.93 (0.64 to 0.99) | Low quality evidence** | |
| Specimen | Blood only | 32 | 0.92 (0.84 to 0.96) | 0.93 (0.89 to 0.95) | Low quality evidence** |
| Blood and CSF* | 3 | ‐ | ‐ | Moderate quality evidence* | |
| Quality | Good methodologic studies only | 22 | 0.90 (0.78 to 0.96) | 0.93 (0.88 to 0.96) | Moderate quality evidence* |
| CI: confidence interval; CSF: cerebrospinal fluid; EOS: early‐onset sepsis; LOS: late‐onset sepsis; PCR: polymerase chain reaction. Summary estimates of sensitivity and specificity were derived from meta‐analyses using the bivariate random‐effects model using statistical software STATA. Summary estimates for the subgroups are presented, where number of studies ≥ 4. *Summary estimates of sensitivity and specificity could not be calculated using STATA if number of studies ≤ 4. GRADE rating of evidence: reasons for downgrading quality of evidence (Gopalakrishna 2014) * Evidence downgraded one level for inconsistency of evidence. ** Evidence downgraded two levels for inconsistency and imprecision. | |||||
| Test | No. of studies | No. of participants |
| 1 All molecular tests Show forest plot | 35 | 7339 |
| 2 Molecular tests: blood samples only Show forest plot | 32 | 6999 |
| 3 Molecular tests with good methodologic quality Show forest plot | 22 | 4150 |