Asai molekular untuk diagnosis sepsis dalam bayi baru lahir
Abstract
Background
Microbial cultures for diagnosis of neonatal sepsis have low sensitivity and reporting delay. Advances in molecular microbiology have fostered new molecular assays that are rapid and may improve neonatal outcomes.
Objectives
To assess the diagnostic accuracy of various molecular methods for the diagnosis of culture‐positive bacterial and fungal sepsis in neonates and to explore heterogeneity among studies by analyzing subgroups classified by gestational age and type of sepsis onset and compare molecular tests with one another.
Search methods
We performed the systematic review as recommended by the Cochrane Diagnostic Test Accuracy Working Group. On 19 January 2016, we searched electronic bibliographic databases (the Cochrane Library, PubMed (from 1966), Embase (from 1982), and CINAHL (from 1982)), conference proceedings of the Pediatric Academic Societies annual conference (from 1990), clinical trial registries (ClinicalTrials.gov, International Standard Randomised Controlled Trial Number (ISRCTN) registry, and World Health Organization (WHO) International Clinical Trials Platform (ICTRP) Search portal), and Science Citation Index. We contacted experts in the field for studies.
Selection criteria
We included studies that were prospective or retrospective, cohort or cross‐sectional design, which evaluated molecular assays (index test) in neonates with suspected sepsis (participants) in comparison with microbial cultures (reference standard).
Data collection and analysis
Two review authors independently assessed the methodologic quality of the studies and extracted data. We performed meta‐analyses using the bivariate and hierarchical summary receiver operating characteristic (HSROC) models and entered data into Review Manager 5.
Main results
Thirty‐five studies were eligible for inclusion and the summary estimate of sensitivity was 0.90 (95% confidence interval (CI) 0.82 to 0.95) and of specificity was 0.93 (95% CI 0.89 to 0.96) (moderate quality evidence). We explored heterogeneity by subgroup analyses of type of test, gestational age, type of sepsis onset, and prevalence of sepsis and we did not find sufficient explanations for the heterogeneity (moderate to very low quality evidence). Sensitivity analyses by including studies that analyzed blood samples and by good methodology revealed similar results (moderate quality evidence).
Authors' conclusions
Molecular assays have the advantage of producing rapid results and may perform well as 'add‐on' tests.
Ringkasan bahasa mudah
Ujian molekular untuk mengesan jangkitan‐jangkitan dalam bayi baru lahir
Soalan ulasan: Adakah ujian molekular mengesan jangkitan lebih baik berbanding kaedah kultur piawai untuk mengesan jangkitan dalam bayi baru lahir?
Latar belakang
Kaedah semasa untuk mengesan jangkitan (penyakit yang disebabkan oleh kuman) pada bayi baru lahir adalah dengan mendapatkan darah atau cecair badan yang lain (atau kedua‐duanya) dan kultur (penghasilan) bakteria (kuman) di dalam makmal. Walau bagaimanapun, kaedah kultur gagal mengenalpasti beberapa jangkitan dan mengambil masa yang lama untuk menghasilkan keputusan (48 hingga 72 jam). Kaedah yang lebih terkini untuk mengesan jangkitan adalah berasaskan pengesanan DNA (molekul yang membawa arahan genetik yang digunakan dalam pertumbuhan, perkembangan, fungsi, dan pembiakan) daripada bakteria dan organisma lain yang menyebabkan jangkitan. Kemajuan dalam mikrobiologi telah memperkenalkan ujian molekular yang baru untuk mengesan jangkitan. Ujian molekular adalah pantas dan mungkin mengesan lebih banyak jangkitan berbanding dengan kaedah kultur yang tradisional.
Ciri‐ciri kajian
Kami mencari bukti bagi penggunaan kaedah molekular untuk mengesan jangkitan dalam bayi baru lahir. Kami mendapati 35 kajian yang membandingkan antara kaedah baru molekular dengan kaedah kultur darah dan bendalir tulang belakang untuk mendiagnosis jangkitan.
Sumber dana kajian
Tiada.
Hasil‐hasil utama
Kami mendapati bahawa kaedah molekular mungkin sangat membantu sebagai ujian tambahan kerana ia memberikan hasil yang cepat.
Kualiti bukti
Walaupun terdapat beberapa isu dengan pemilihan bayi baru lahir untuk ulasan ini, secara keseluruhannya kaedah‐kaedah yang digunakan oleh kajian‐kajian adalah mencukupi. Kami menaraf kualiti bukti sebagai sederhana hingga rendah.
Authors' conclusions
Summary of findings
| Groups | Number of studies | Sensitivity (95% CI) | Specificity (95% CI) | Quality of evidence using GRADE | |
| All studies | ‐ | 35 | 0.90 (0.82 to 0.95) | 0.93 (0.89 to 0.96) | Moderate quality evidence* |
| Type of test | Broad‐range PCR | 9 | 0.97 (0.86 to 1.00) | 0.93 (0.77 to 0.98) | Moderate quality evidence* |
| Real‐time PCR | 9 | 0.86 (0.59 to 0.96) | 0.94 (0.90 to 0.97) | Moderate quality evidence* | |
| Post‐PCR processing | 5 | 0.97 (0.40 to 1.00) | 0.96 (0.93 to 0.98) | Low quality evidence** | |
| Multiplex PCR | 6 | 0.76 (0.60 to 0.88) | 0.81 (0.70 to 0.89) | Low quality evidence** | |
| Staphylococcal PCR* | 2 | ‐ | ‐ | Low quality evidence** | |
| Fungal PCR* | 4 | ‐ | ‐ | Low quality evidence** | |
| Type of sepsis | EOS* | 2 | ‐ | ‐ | Low quality evidence** |
| LOS | 10 | 0.79 (0.69 to 0.86) | 0.94 (0.85 to 0.98) | Low quality evidence** | |
| Mixed EOS and LOS | 23 | 0.94 (0.84 to 0.98) | 0.92 (0.87 to 0.95) | Moderate quality evidence* | |
| Gestational age | Preterm | 5 | 0.89 (0.75 to 0.96) | 0.87 (0.71 to 0.94) | Low quality evidence** |
| Mixed term and preterm | 30 | 0.90 (0.80 to 0.96) | 0.94 (0.90 to 0.96) | Moderate quality evidence* | |
| Prevalence | < 15% | 20 | 0.94 (0.80 to 0.99) | 0.95 (0.92 to 0.97) | Moderate quality evidence* |
| 15% to 30% | 8 | 0.85 (0.67 to 0.94) | 0.88 (0.79 to 0.94) | Low quality evidence** | |
| >30% | 7 | 0.87 (0.75 to 0.93) | 0.93 (0.64 to 0.99) | Low quality evidence** | |
| Specimen | Blood only | 32 | 0.92 (0.84 to 0.96) | 0.93 (0.89 to 0.95) | Low quality evidence** |
| Blood and CSF* | 3 | ‐ | ‐ | Moderate quality evidence* | |
| Quality | Good methodologic studies only | 22 | 0.90 (0.78 to 0.96) | 0.93 (0.88 to 0.96) | Moderate quality evidence* |
| CI: confidence interval; CSF: cerebrospinal fluid; EOS: early‐onset sepsis; LOS: late‐onset sepsis; PCR: polymerase chain reaction. Summary estimates of sensitivity and specificity were derived from meta‐analyses using the bivariate random‐effects model using statistical software STATA. Summary estimates for the subgroups are presented, where number of studies ≥ 4. *Summary estimates of sensitivity and specificity could not be calculated using STATA if number of studies ≤ 4. GRADE rating of evidence: reasons for downgrading quality of evidence (Gopalakrishna 2014) * Evidence downgraded one level for inconsistency of evidence. ** Evidence downgraded two levels for inconsistency and imprecision. | |||||
Background
Sepsis is a frequent life‐threatening event among neonates, particularly in very low birth weight infants (VLBW) (birth weight less than 1500 g) and is responsible for significant mortality and morbidity (Adams‐Chapman 2006; Stoll 2002; Stoll 2004). Early diagnosis of infections in newborns may improve clinical outcomes. Microbial cultures of blood or other sterile body fluids are the gold standard in the diagnosis of neonatal bacterial and fungal sepsis. Blood cultures are generally assumed to have low sensitivity in neonates for the following reasons: low degree of neonatal bacteremia or fungemia, small inoculation volumes in culture bottles, and the use of intrapartum antibiotics (Chiesa 2004; Schelonka 1996). In addition, results of the microbial culture are not available for at least 24 to 72 hours. Diagnostic capabilities of blood culture systems have improved since the early 2000s with the advent of automated continuous blood culture monitoring systems but still, subcultures for specific assays (e.g. biochemical) are ultimately needed for pathogen identification. New molecular methods for detection of infection may provide results earlier and improve neonatal outcomes.
Target condition being diagnosed
Neonatal bacterial and fungal sepsis is the target condition to be diagnosed and often described based on the age of the infant at the onset of infection. Early‐onset bacterial or fungal sepsis (sepsis in 72 hours of life or less) occurs in 1.5% to 1.9% of VLBW infants and late‐onset bacterial or fungal sepsis (sepsis onset after 72 hours of life) in about 20% of VLBW infants (Stoll 2002). Neonatal mortality in late‐onset sepsis (LOS) is approximately 18%, and in Gram‐negative infections as high as 36%. The incidence of LOS in neonates less than 33 weeks' postmenstrual age (PMA) in the Canadian neonatal network was 10% but varied from 0.61% to 14% in other studies (Canadian Neonatal Network 2014; Dong 2015). Sepsis increases neonatal morbidities including patent ductus arteriosus, need for intravascular access, need for parenteral nutrition, bronchopulmonary dysplasia, necrotizing enterocolitis and length of hospital stay. In addition, sepsis significantly impairs long‐term neurodevelopmental outcomes either by direct infection of the central nervous system or as a result of inflammatory injury (Adams‐Chapman 2006). In one large cohort study of more than 6000 extremely low birth weight infants (birth weight 1000 g or less), infected infants had a significantly higher incidence of adverse developmental outcomes at follow‐up, including cerebral palsy, lower Bayley's scores of infant development and visual impairment when compared to uninfected infants (Stoll 2004). Clinical signs and symptoms of neonatal sepsis are often nonspecific and early diagnosis and treatment may be critical to improve neonatal outcomes. Overdiagnosis of neonatal sepsis can lead to inappropriate antibiotic use that may foster antibiotic resistance.
Index test(s)
Advances in molecular microbiology have provided new molecular assays for the detection of infection. Molecular assays can be completed in less than 12 hours and may have better sensitivity than microbial cultures. In addition, the significant increase in workload related to bloodstream infections for the clinical microbiologic laboratory could potentially be offset by high‐throughput molecular assays coupled with automation (Rodriguez‐Creixems 2008). However, molecular assays do not provide information on antibiotic susceptibility.
Molecular pathogen detection methods are based on hybridization or amplification of pathogen DNA. Hybridization based methods (e.g. fluorescence in situ hybridization) have not yet been evaluated in the diagnosis of neonatal sepsis. However, neonatal studies have been conducted using amplification methods (e.g. polymerase chain reaction (PCR)) that amplify specific target regions in the microbial genome. Broad‐range PCR targets the 16S ribosomal ribonucleic acid (rRNA) gene, a ubiquitous gene that is preserved in all bacteria and comprises both conserved and variable regions (Woese 1987). The conserved regions are targeted by universal primers for identifying bacterial infection, and the variable regions by genus or species‐specific assays (Isaacman 1996; Relman 1999). Fungal PCRs target specific regions of the fungal genome (most commonly internal transcribed spacer regions of the rRNA). Amplified target regions may then be subjected to downstream applications such as sequencing or microarray/probe hybridization.
Amplification methods that have been evaluated in neonates for the diagnosis of sepsis can be grouped as follows.
-
Broad‐range conventional PCR assays: PCR amplification strategies targeting conserved regions such as 16S rRNA in bacteria.
-
Real‐time PCR, where amplification of the template is monitored in real time.
-
PCR followed by post‐PCR processing, such as sequencing or hybridization.
-
Multiplex‐PCR, where amplification is directed against multiple organisms in the same assay.
-
Species‐ or genus‐specific assays: staphylococcal, fungal PCR assays or other organism‐specific assays.
Clinical pathway
Neonates with clinical signs and symptoms of sepsis including lethargy, apnea, hypotension and oliguria are investigated for sepsis with a blood, cerebrospinal fluid (CSF) and urine cultures with or without markers of inflammation such as a white blood cell count, C‐reactive protein (CRP) or others. However, to prove an infection beyond doubt, cultures should be positive, which takes more than 24 hours and usually 48 hours. Also, the sensitivity of cultures has been questioned. An ideal diagnostic test for neonatal bacterial or fungal sepsis should be rapid, sensitive, specific, detect all organisms relevant to neonatal sepsis and not be affected by maternal antibiotics. The test should have high sensitivity so that infections are not missed and a negative test should reliably exclude sepsis so that no neonate is unnecessarily treated with antibiotics.
Alternative test(s)
Traditionally sepsis diagnosis is aided by abnormal white blood cell count (white blood cell less than 5000 cells/μL, sensitivity 0.2, specificity 0.96; white blood cell less than 1000 cells/μL, sensitivity 0.3 specificity 1.0), altered white cell indices, differential white cell count, elevation of immature white cells (I:T ratio greater than 0.20, sensitivity 0.55 and specificity 0.74) and low platelet count (less than 50 × 109/L, sensitivity 0.8 and specificity 0.99) (Hornik 2012). Serum biomarkers of infection consisting of acute‐phase proteins namely CRP (sensitivity 0.6 to 0.84, specificity 0.84 to 1.00), procalcitonin (sensitivity 0.77, specificity 0.62) or elevation of inflammatory cytokines; tumor necrosis factor (TNF)‐α (sensitivity 0.6 to 0.82, specificity 0.86 to 0.93) and interleukin (IL)‐6 (sensitivity 0.58 to 0.89, specificity 0.84 to 0.96) have also been used (Blommendahl 2002; Ng 1997; Ng 2012; Verboon‐Maciolek 2006). All sensitivities and specificities were calculated with culture as the reference standard. White cell indices and other serum biomarkers may aid in the diagnosis but not necessarily confirm infection.
Rationale
Blood cultures are generally assumed to have a relatively low sensitivity for the diagnosis of neonatal bacterial or fungal sepsis and results of the microbial culture are not available for at least 24 to 72 hours. Also, some cases of sepsis may be missed by cultures and a more sensitive diagnostic test such as a molecular test may be useful. Rapid advances in technology have led to molecular methods with rapid turnaround times, that may be more sensitive than culture and which may have an impact on current clinical practice. We will not be able to show that the molecular tests are more sensitive than culture, as culture is our reference standard. Still, culture is used in practice as a confirmation test (100% specificity) and thus knowing the relative performance of molecular tests compared to culture is very relevant. If a test misses too many culture‐positive samples, the test will not be implemented in practice. Alternative tests such as evaluation of acute phase reactants or cytokines are often used in conjunction with blood cultures but do not have sufficient diagnostic accuracy to replace microbial cultures as the reference standard. We have previously systematically reviewed molecular assays in the diagnosis of neonatal sepsis (Pammi 2011), but this is a rapidly advancing field. Optimization of the older molecular methods and development of newer methods may change the diagnostic accuracy of these tests and may change our clinical practice. In our view, a Cochrane Review is justified as new literature has accumulated since our last published review and will allow for updates as new studies are performed. We are not aware of any other systematic review on this topic in neonates although there are narrative reviews.
Objectives
To assess the diagnostic accuracy of various molecular methods for the diagnosis of culture‐positive bacterial and fungal sepsis in neonates and to explore heterogeneity among studies by analyzing subgroups classified by gestational age and type of sepsis onset and compare molecular tests with one another.
Methods
Criteria for considering studies for this review
Types of studies
We included prospective or retrospective, cohort or cross‐sectional studies that assessed the diagnostic accuracy of a molecular test in the clinical context of diagnosis of neonatal bacterial or fungal sepsis. We excluded studies that assessed the diagnostic accuracy of the test using only positive samples or healthy controls and not in the clinical context of suspected neonatal bacterial or fungal sepsis.
Participants
Neonates with clinically suspected bacterial or fungal sepsis. Clinical signs and symptoms of sepsis in neonates can be nonspecific and hence a high index of clinical suspicion is required for the diagnosis. Neonates are defined as a newborn of 28 days of age or less. We defined gestational age subgroups of preterm and term infants as:
-
preterm: neonates born at less than 37 completed weeks of gestation;
-
term: neonates born at 37 completed weeks of gestation or greater.
We made a post‐hoc decision to include data from studies that included infants aged more than 28 days if more than 50% of the study participants were under 28 days of age.
Index tests
We defined molecular assays as any assay that involves extraction and evaluation of nucleic acid from bacteria or fungi, and performed for the diagnosis of neonatal sepsis. The results of the index test were dichotomous; positive or negative. We assessed the results of the index test with the reference standard done at approximately same time. In the event of the index test identifying a different organism compared to the reference standard or identifying an organism when the reference standard was negative, we discussed among our author group as to whether we should discard or include as a false positive based on whether it was a contaminant or not. We analyzed subgroups of type of molecular assay namely broad‐range conventional PCR, real‐time PCR, PCR followed by post‐PCR processing, multiplex PCR, staphylococcal PCR and fungal PCR. New tests/methodology may arrive in the future as the technology advances and we will address this by subgroup analyses and using year of publication as a covariate in future meta‐analyses. We excluded molecular methods assessing infections other than those caused by bacteria or fungi (e.g. viruses or protozoa).
Target conditions
Neonatal bacterial or fungal sepsis, defined as a neonate with a positive culture of bacteria or fungi from the blood or CSF, or both. We analyzed subgroups of type of sepsis onset namely early‐onset sepsis (EOS) (72 hours of age or less) and LOS (greater than 72 hours of age).
Reference standards
The reference standard for the diagnosis of sepsis was microbial culture of blood or CSF, or both, for bacteria or fungi, or both. Microbial cultures are generally assumed to have low sensitivity but this decreased sensitivity has not been quantified. The low sensitivity of cultures in neonates may be due to the low degree of neonatal bacteremia or fungemia, small inoculation volumes in culture bottles and the use of intrapartum antibiotics. We documented the participant characteristics, risk factors and outcomes of people who were index test positive and reference standard negative to gain insight into the sensitivity of the reference standard. Alternative tests, such as evaluation of acute phase reactants or cytokines, are often used in conjunction with blood cultures but do not have sufficient diagnostic accuracy to replace microbial cultures as the reference standard.
Search methods for identification of studies
We used the standard search methods recommended by the Cochrane Neonatal Group and searched the literature on 19 January 2016. We applied no language restrictions in our search methods.
Electronic searches
-
Bibliographic databases: the Cochrane Library (2016, Issue 1), PubMed (from 1966), Embase (from 1982) and CINAHL (from 1982) using the search engines at Texas Medical Center library.
-
Abstract of conferences: proceedings of meetings of American Pediatric Society, Society for Pediatric Research and European Society for Pediatric Research (from 1990).
-
ClinicalTrials.gov (clinicaltrials.gov/), International Standard Randomised Controlled Trial Number (ISRCTN) registry (www.isrctn.com/), and the World Health Organization (WHO) International Clinical Trials Platform (ICTRP) Search portal (apps.who.int/trialsearch/).
-
Science Citation Index, Web of Science using subject search.
Our search strategies for PubMed and other databases including the platforms are outlined in Appendix 1. The search strategy was developed by discussion between the review author team, librarians and the Cochrane Neonatal Group's Trials Search Co‐ordinator.
Searching other resources
We screened reference lists of identified studies, relevant review articles and other publications held in our personal files. We also searched for ongoing and unpublished studies by contacting experts in this field.
Data collection and analysis
Selection of studies
Two review authors (MP, AF) screened all titles and abstracts identified by our search strategy for relevance to the inclusion criteria as detailed in Criteria for considering studies for this review. We retrieved full‐text articles of all identified articles that were deemed relevant to the review and evaluated them against our inclusion eligibility. We resolved disagreements by mutual discussion.
Data extraction and management
Two review authors (MP, AF) independently extracted the following data.
-
Author, year of publication and name of journal.
-
Study design including sample size, type of study (prospective or retrospective, cohort or cross‐sectional).
-
Study population characteristics and the clinical context in which the test was evaluated (e.g. suspected sepsis), and type of participant sample tested.
-
Type of reference standard, performance of the reference standard and whether evaluated manually or automated.
-
Index tests, performance of the index tests, type of assay, manufacturer, positivity thresholds, time between the performance of index and reference tests.
-
Information regarding quality assessment items of the Quality Assessment of Diagnostic Accuracy Studies‐2 (QUADAS‐2) tool (Assessment of methodological quality).
-
Data in two by two tables for calculation of diagnostic accuracy parameters.
Studies report number of neonates or episodes of sepsis as the unit of analysis. Some studies included neonates with more than one episode of sepsis. As the comparison here was between two tests, cultures versus molecular tests, we included the number of samples wherever possible for our analysis and most studies reported only one sample per participant which we analyzed as such. We compared the extracted data, and resolved discrepancies found upon comparison by mutual discussion. Data extracted from included studies are presented in Appendix 2.
Assessment of methodological quality
We assessed methodologic quality of each included study following guidance from the Cochrane Diagnostic Test Accuracy Working Group, which is adapted from the QUADAS‐2 tool (Whiting 2011). The four domains assessed for risk of bias are participant selection, index test, reference test, and flow and timing. Applicability concerns were assessed in the first three domains (participant selection, index test, reference test). In each domain, we answered the questions with 'Yes', 'No' or 'Unclear' and for each domain judged the risk of bias as 'Low', 'High' or 'Unclear' risk (Appendix 3).
Sources of bias in diagnostic accuracy studies that we assessed include those related to participants (spectrum bias and selection bias), the index test (information bias), the reference standard (misclassification bias, partial verification bias, differential verification bias, incorporation bias, disease progression bias and information bias) and data analysis (excluded data bias) (Appendix 3).
In addition, we decided post‐hoc to present quality of evidence using GRADE methodology recommended for diagnostic tests (Gopalakrishna 2014).
Statistical analysis and data synthesis
In our included studies, the reference standard and the index tests have dichotomous outcomes. We constructed two by two tables for all included studies and enumerated true positives, false positives, false negatives and true negatives. Any positive blood or CSF culture was considered a positive for the reference standard. Nine studies reported data from episodes of sepsis and hence more than one sample from some infants and other studies reported one episode of sepsis from one infant. We have meta‐analyzed data from both studies that reported as episodes of sepsis or as number of infants in this review with advice from our statistician.
As the results of the index tests were dichotomous without an explicit threshold, we used a bivariate random‐effects approach to estimate summary sensitivity and specificity for each index test type separately (Macaskill 2010; Reitsma 2009). The bivariate random‐effects approach enabled us to calculate the summary estimates of sensitivity and specificity, while dealing with the imprecision by which sensitivity and specificity have been measured within each study, variation beyond chance in sensitivity and specificity between studies and any correlation that may exist between sensitivity and specificity. We calculated summary estimates of sensitivity and specificity using 'xtmelogit' in the STATA software (Stata 2011) (Harbord 2007; Harbord 2008; Harbord 2009).
We generated forest plots with 95% confidence intervals (CIs) for sensitivity and specificity for each study using Review Manager 5 (RevMan 2014). We entered the relevant 'xtmelogit' STATA output in Review Manager 5 (RevMan 2014) for the creation of receiver operating characteristic (ROC) space, including summary estimates with 95% CIs and the summary curve.
Investigations of heterogeneity
Sepsis prevalence is higher in premature infants than in term infants because of their relative immunodeficiency, compromise in mucosal and skin integrity, need for intensive care and exposure to invasive procedures. The diagnostic accuracy parameters are likely to be influenced by prevalence of sepsis in term and preterm infants. Therefore, we investigated the effect of prevalence by including it as a covariate in the bivariate model. The same will be true for the onset of sepsis: prevalence rates and spectrum of organisms are different in late‐onset and early‐onset disease and may account for variation among studies. Therefore, we also included sepsis onset as a covariate in the models.
We compared the accuracy of different test types by comparing their summary estimates of sensitivity and specificity and the respective CIs. We did not report P values because the results are prone to confounding due to variations in participant characteristics and study methodology.
We used statistical tests using the 'xtmelogit' command in the statistical software STATA (Stata 2011) for evaluation of heterogeneity by subgroup and sensitivity analysis. We reported summary sensitivity and specificity for each subgroup in the subgroup analyses.
Sensitivity analyses
After performing analyses with data of all included studies, we performed sensitivity analysis to assess test accuracy in studies that evaluated blood samples only as well as studies that evaluated both blood and CSF samples, to test if inhibitors of PCRs in blood samples might influence our results. Furthermore, we investigated the effect of the potential sources of bias by removing biased studies from the total set of studies and re‐analyzing this new set.
Assessment of reporting bias
We used the Deeks' test to assess publication or reporting bias in this diagnostic test accuracy review (Reitsma 2009; Van Enst 2014).
Results
Results of the search
Our comprehensive search identified 932 studies of which we selected 47 relevant articles based on the title and abstract. We obtained the full publications whenever possible for the 47 relevant articles. Twelve articles were irrelevant to this review and discarded. Thirty‐five studies met the inclusion criteria assessing the diagnostic accuracy of molecular assays in neonatal sepsis. The inclusion process is detailed in the PRISMA flow diagram (Figure 1). Some studies did not include an upper limit for age and hence some infants were greater than 28 days of age (Chan 2009; Enomoto 2009; Esparcia 2011; Fujimori 2010; Jordan 2000; Lima 2007; Makhoul 2005; Makhoul 2006; Ohlin 2008; Ohlin 2012; Tirodker 2003; Torres‐Martos 2013). We made a post‐hoc decision that we would include studies where an upper age limit was not specified but more than 50% of the sample were from newborn to less than 28 days of age. Our decision was supported by the reasoning that LOS extends up to three months of age and participant characteristics are similar in the first two to three months of age. The included studies and their risk of bias are presented in Characteristics of included studies table and 12 excluded studies with reasons for exclusion are presented in the Characteristics of excluded studies table. We found no publication bias. Funnel plots were created with ln(DOR) on the x‐axis and the reciprocal of the effective sample size (ESS) on the y‐axis where 1/ESS = (1/(FP + TN) + 1/(TP + FN))1/2 (Figure 2). Then Deeks' test for publication bias was applied by computing Spearman's rank correlation (rs) for the association between ln(DOR) and 1/ESS. Asymmetry is not evident in the funnel plot, and Deeks' test did not indicate the presence of publication bias (rs = 0.012, p = 0.944).
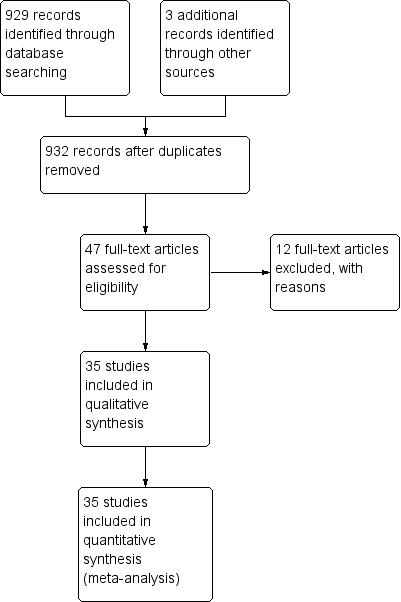
Study flow diagram.
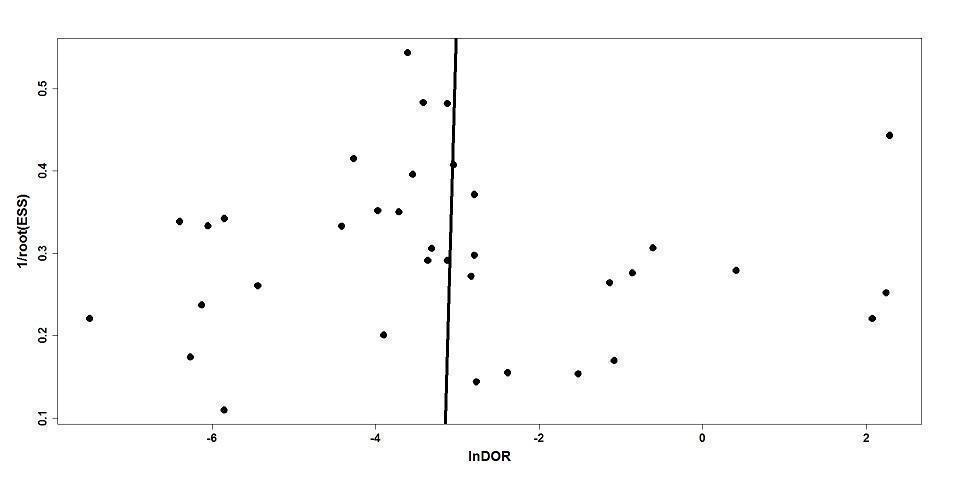
Deeks' funnel plot for publication bias.
Methodological quality of included studies
The results of the methodologic assessment of the studies included in the meta‐analyses are presented in Figure 3; Figure 4. Major risks for bias pertained to participant selection and blinding of index test. Applicability concerns pertained to selection of participants and blinding of the index test and blinding of the reference standard. All studies used an acceptable reference standard, avoided partial and differential verification, and avoided incorporation of the reference standard. Uninterpretable results and withdrawals were explained where applicable.
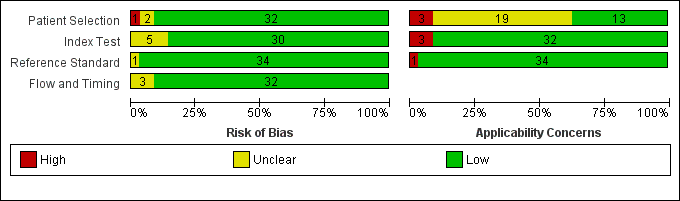
Risk of bias and applicability concerns graph: review authors' judgments about each domain presented as percentages across included studies.
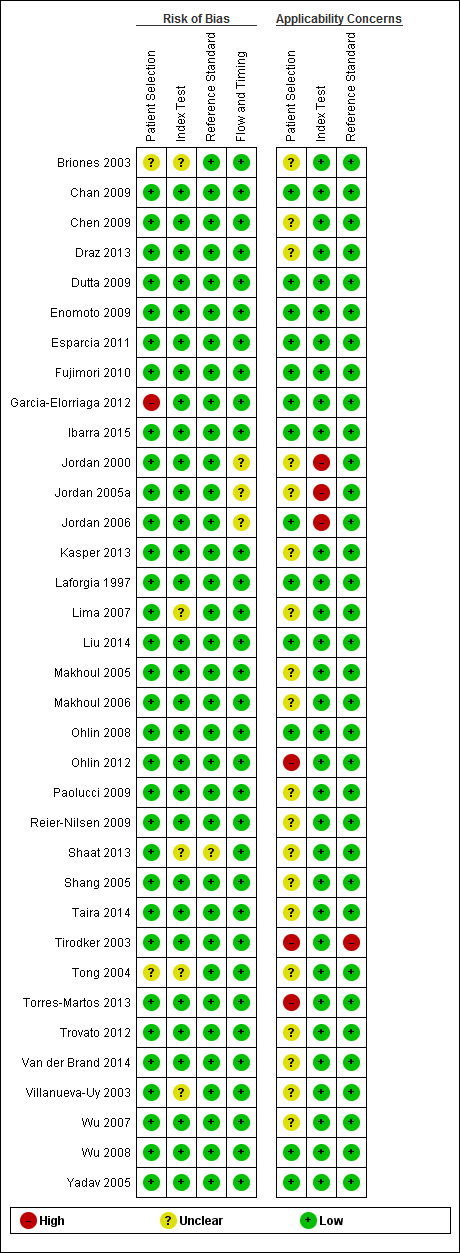
Risk of bias and applicability concerns summary: review authors' judgments about each domain for each included study.
Findings
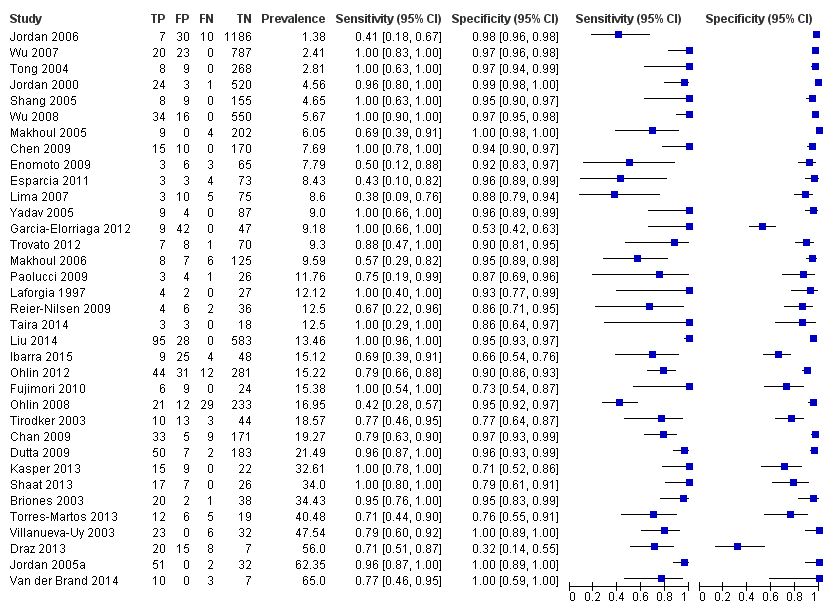
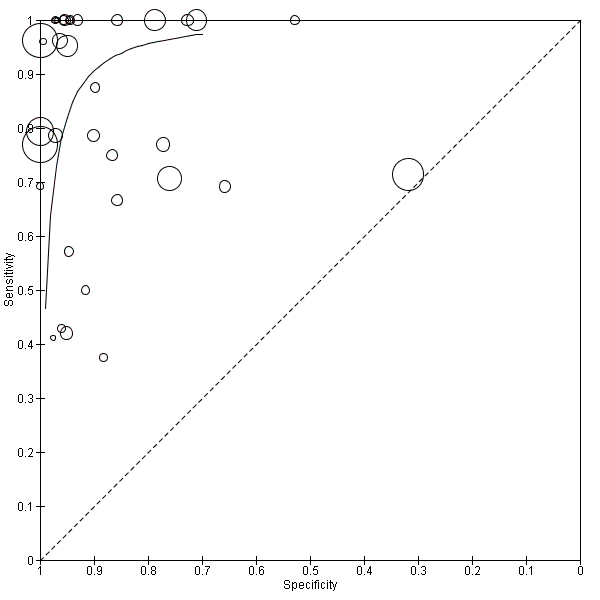
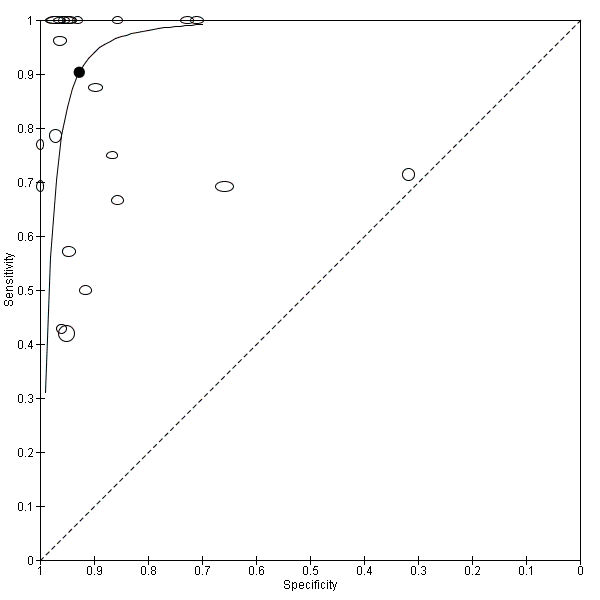
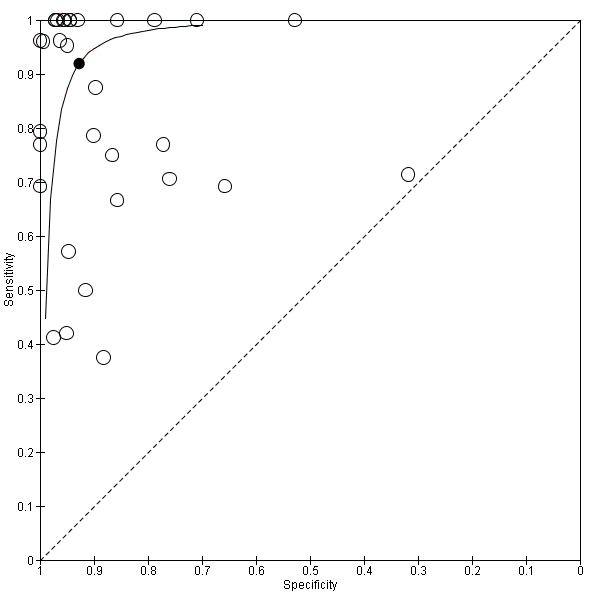
Summary estimates of mean sensitivity for the 35 included studies were 0.90 (95% CI 0.82 to 0.95), while the mean specificity was 0.93 (95% CI 0.89 to 0.96) (moderate quality evidence) (summary of findings Table). Forest plot (Figure 5) shows that sensitivity across studies ranged for 0.38 to 1.0 and specificity from 0.32 to 1.0. We also plotted the included studies in the ROC space to give a sense of distribution of sensitivity and specificity of the studies (Figure 6). Each study is represented by an oval symbol, with the width proportional to the inverse standard error of the specificity and the height to the inverse standard error of sensitivity.
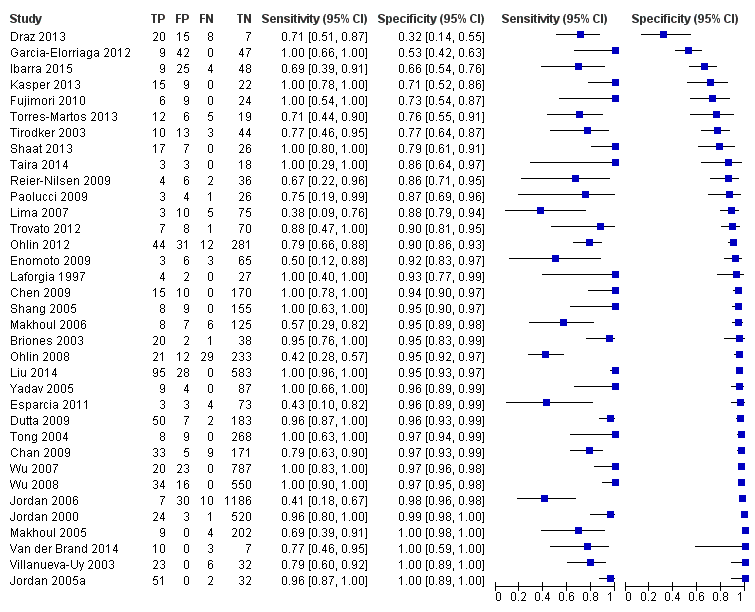
Forest plot of 1 All molecular tests. CI: confidence interval; FN: false negative; FP: false positive; TN: true negative; TP: true positive.
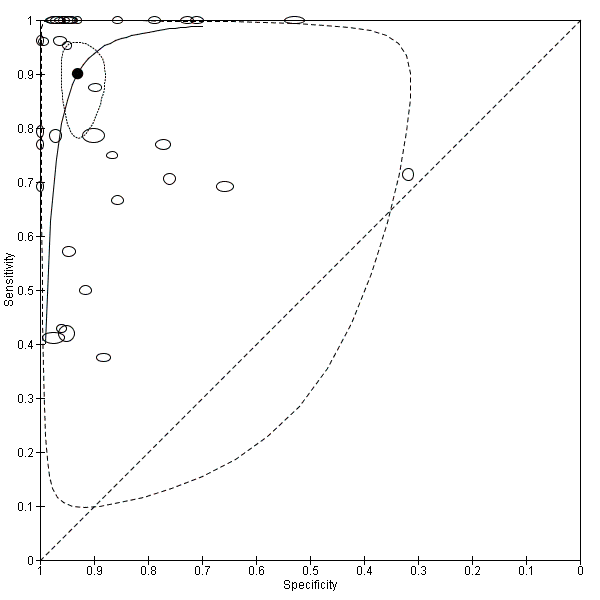
Summary receiver operating characteristic plot of all molecular tests.
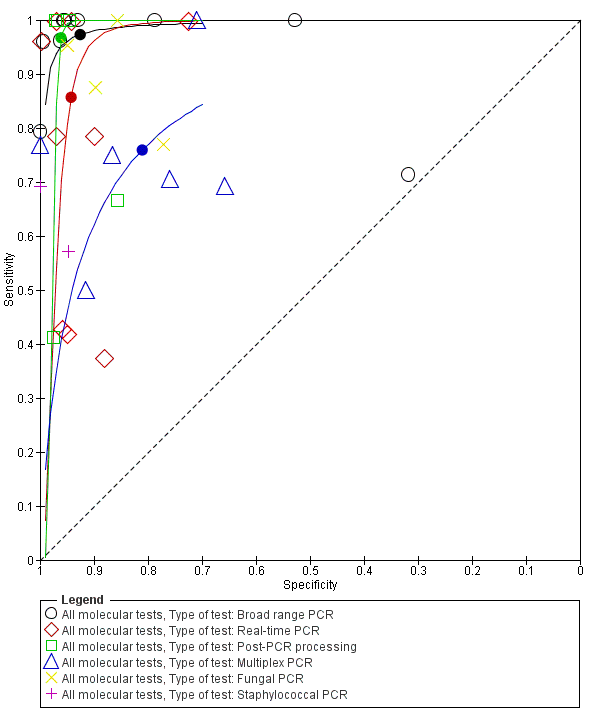
We explored heterogeneity by differentiating studies based on the type of molecular assay, onset of sepsis, gestational age and prevalence, and plotted the subgroups of studies in the ROC space (moderate to low quality evidence). Figure 7 represents the studies differentiated by the type of molecular assay in the ROC space. Summary estimates for real‐time PCR assays were sensitivity 0.86 (95% CI 0.59 to 0.96) and specificity 0.94 (95% CI 0.90 to 0.97). Broad‐range conventional PCR performed with sensitivity 0.97 (95% CI 0.86 to 1.00), specificity 0.93 (95% CI 0.77 to 0.98), tests with post‐PCR processing, sensitivity 0.97 (95% CI 0.40 to 1.00) and specificity 0.96 (95% CI 0.93 to 0.98) and multiplex PCR, sensitivity 0.76 (95% CI 0.60 to 0.88), specificity 0.81 (95% CI 0.70 to 0.89) (summary of findings Table). Summary estimates of sensitivity and specificity for Staphylococcal PCR and fungal PCR were not possible as there four or fewer studies.

Summary receiver operating characteristic plot by type of molecular test. PCR: polymerase chain reaction.
Two studies reported on EOS, 10 on only LOS and 23 studies on both. Summary estimates for the molecular tests in the diagnosis of LOS were sensitivity 0.79 (95% CI 0.69 to 0.86), specificity 0.94 (95% CI 0.85 to 0.98) and mixed EOS and LOS were sensitivity 0.94 (95% CI 0.84 to 0.98), specificity 0.92 (95% CI 0.87 to 0.95) (Figure 8; summary of findings Table).
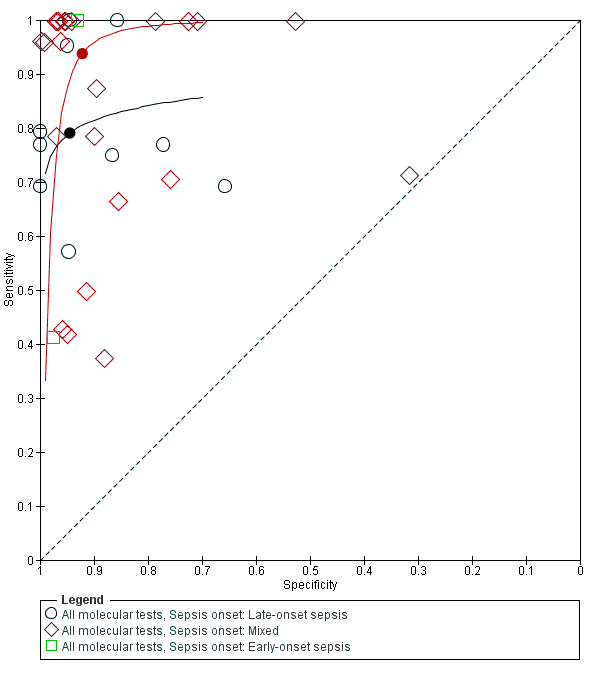
Summary receiver operating characteristic plot subgrouped by sepsis onset.
Five studies reported on testing on preterm infants only and 30 studies on a combination of preterm and term infants. Summary estimates for studies reporting on only preterm infants were sensitivity 0.89 (95% CI 0.75 to 0.96), specificity 0.87 (95% CI 0.71 to 0.94) and those for mixed term and preterm infants were sensitivity 0.90 (95% CI 0.80 to 0.96), specificity 0.94 (0.90 to 0.96) (Figure 9; summary of findings Table).
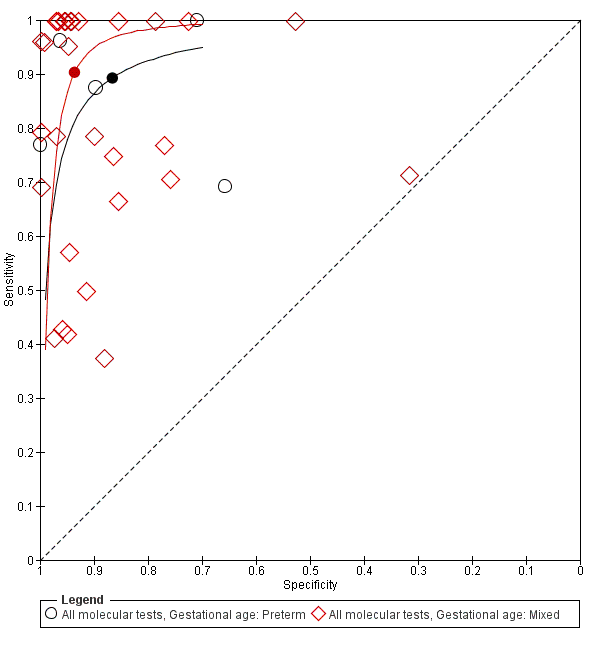
Summary receiver operating characteristic plot subgrouped by gestational age.
We categorized studies into three groups based on prevalence less than 15%, 15 % to 30% and greater than 30%. Summary estimates for 20 studies with a prevalence of less than 15% were sensitivity 0.94 (95% CI 0.80 to 0.99), specificity 0.95 (95% CI 0.92 to 0.97), with prevalence 15% to 30% were sensitivity 0.85 (95% CI 0.67 to 0.94), specificity 0.88 (95% CI 0.79 to 0.94) and those for studies with a sepsis prevalence greater than 30% were sensitivity 0.87 (95% CI 0.75 to 0.93), specificity 0.93 (95% CI 0.64 to 0.99) (moderate to low quality evidence) (summary of findings Table; Figure 10; Figure 11).
Forest plot of all molecular tests sorted in order of prevalence. CI: confidence interval; FN: false negative; FP: false positive; TN: true negative; TP: true positive.
Summary receiver operating characteristic plot of all molecular tests where the size of the study symbol is directly proportional to the prevalence of sepsis in the study.
We performed sensitivity analyses using data from studies evaluating blood samples alone (not CSF) excluding three studies; the summary sensitivity was 0.92 (95% CI 0.84 to 0.96), specificity 0.93 (95% CI 0.89 to 0.95) (Figure 12; summary of findings Table) (moderate quality evidence). Furthermore, we investigated the effect of the potential sources of bias by removing studies with unclear or high risk of bias or applicability concerns (13 studies) from the total set of studies and re‐analyzing this new set (22 studies) and found no differences in summary estimates; the summary sensitivity was 0.90 (95% CI 0.78 to 0.96), specificity 0.93 (95% CI 0.88 to 0.96) (moderate quality evidence) (summary of findings Table).

Summary receiver operating characteristic plot of studies that performed molecular tests on blood samples only.
Discussion
Summary of main results
Our search strategy identified 35 eligible studies and mean sensitivity of molecular tests in the diagnosis of neonatal sepsis was 0.90 (95% CI 0.82 to 0.95) and specificity was 0.93 (95% CI 0.89 to 0.96) and evidence was of moderate quality. We explored heterogeneity by subgroup analyses based on type of test, gestational age, type of sepsis onset and prevalence of neonatal sepsis (moderate to low quality evidence). We also performed sensitivity analysis by excluding studies which used both blood and CSF samples and excluding studies with high or uncertain risk of bias and applicability concerns.
Low sensitivity (less than 0.7 in nine studies) in some of the studies may be explained by the technicalities of the multiplex PCR assay, use of stored blood samples that were drawn by heel stick at a different time to the blood culture sample, participant characteristics and to Staphylococcus‐specific PCR. Jordon and colleagues commented that presence of white blood cells in the samples and hence human genomic DNA interference may have inhibited the PCR assay accounting for low sensitivity (Jordan 2006). However, 13 studies reported a sensitivity of 1.00 that did not conform to any particular type of test or participant population. In contrast, specificity was consistently higher than sensitivity and all except three of the included studies had specificity more than 0.70 (Draz 2013; Garcia‐Elorriaga 2012; Ibarra 2015). Primers used in the tests and differences in participant characteristics may accounted for low specificity. Four studies reported a specificity of 1.00 but with varying sensitivities and type of molecular assays (Jordan 2005a; Makhoul 2005; Van der Brand 2014; Villanueva‐Uy 2003).
We explored sources of heterogeneity by subgroup analyses based on type of test, gestational age, type of sepsis onset and prevalence. We found that studies evaluating molecular tests with post‐PCR processing, real‐time PCR and broad‐range conventional PCR plotted in the left upper corner of the ROC space and had higher sensitivity and specificity than multiplex PCR assay. Summary sensitivities from subgroups based on gestational age were similar with overlapping CIs and summary specificity was higher in studies that evaluated both preterm and term infants. In 10 studies that evaluated only LOS, the sensitivity was lower than the summary estimate for mixed EOS and LOS (0.79 (95% CI 0.66 to 0.87) versus 0.94 (95% CI 0.84 to 0.98)) but had higher specificity (0.94 (95% CI 0.85 to 0.98) versus 0.92 (95% CI 0.87 to 0.95)). But the wide 95% CIs precluded any delineation based on these subgroup analyses.
We categorized studies into three groups based on sepsis prevalence less than 15%, 15% to 30% and greater than 30%. Studies that evaluated molecular tests in a population with a sepsis prevalence less than 15% had higher sensitivity and specificity (sensitivity 0.94 (95% CI 0.80 to 0.99), specificity 0.95 (95% CI 0.92 to 0.97)) compared with studies in a higher sepsis prevalence population (summary of findings Table). Variations in participant characteristics or test methodology may account for some of these differences.
We performed sensitivity analyses by type of samples used (blood or both blood and CSF, because inhibitors of PCRs may be present only in blood samples) and for studies evaluating blood samples alone (not CSF), the summary sensitivity was 0.92 (95% CI 0.84 to 0.96) and specificity 0.93 (95% CI 0.89 to 0.95) (Figure 12; summary of findings Table). We also investigated the effect of the potential sources of bias by removing studies with unclear or high risk of bias or applicability concerns (13 studies) from the total set of studies and re‐analyzing this new set (22 studies) and found no differences (summary sensitivity 0.90 (95% CI 0.78 to 0.96), specificity 0.93 (95% CI 0.88 to 0.96)) (Figure 13; summary of findings Table).
Summary receiver operating characteristic plot of molecular tests with good methodologic quality.
Other sources for variation of diagnostic test accuracy among studies evaluating molecular tests may be due to methods of DNA extraction or preprocessing the sample before DNA extraction (e.g. preincubation of the blood culture media before DNA extraction). Studies using whole blood DNA extraction had low sensitivity and preincubation of sample for five hours in tryptic soy broth increased sensitivity significantly. However, the methodologies of DNA extraction, samples from which DNA were extracted, varied considerably among the studies to make any meaningful comparisons.
New diagnostic tests can assume the following roles in a diagnostic pathway: replacement of the existing test, triage or 'add on' to the existing test (Bossuyt 2006). Our meta‐analysis estimated a mean sensitivity of 0.90 (95% CI 0.82 to 0.95) and a mean specificity 0.93 (95% CI 0.89 to 0.96) for molecular assays. The mean estimated sensitivity of molecular assays are better than other alternative tests used to diagnose sepsis such as platelet count, CRP, procalcitonin, TNF and IL‐6 while mean specificity was similar to these tests (Blommendahl 2002; Hornik 2012; Ng 1997; Ng 2012; Verboon‐Maciolek 2006). Theoretically, in 1000 VLBW neonates screened for EOS, where the prevalence was 2% (using the summary estimates of this review), we would miss two cases of sepsis and overtreat 69 neonates without sepsis. Similarly, in 1000 VLBW neonates screened for LOS (prevalence 10%), we would miss 10 culture‐positive cases and overtreat 63 neonates without sepsis. Thus, currently available molecular assays may not have sufficient diagnostic accuracy to replace microbial cultures. However, advancing technologies in molecular microbiology may bring forth newer assays with higher sensitivity and specificity, sufficient to replace microbial cultures in the diagnosis of neonatal sepsis.
In addition to test accuracy, it is important to consider management strategies for neonatal sepsis where molecular tests may be useful. Evidence to decision frameworks are recommended to assess how test results affect participant outcomes (Schünemann 2016; Trenti 2016). In the context of neonatal sepsis, molecular assays are unlikely to be used as a triage test that will select neonates who would undergo cultures. An unwanted delay in performing blood cultures may ensue and may postpone treatment. False negatives on the molecular tests will compromise neonatal safety. However, molecular assays have a faster turnaround time and may perform well as 'add‐on' tests where molecular assays may be performed concurrently with the gold standard (cultures). Results of molecular assays are available in six to eight hours and may help in optimizing clinical therapy. If the molecular test is negative, antibiotics may be discontinued if the test assay has high specificity and high negative predictive value. Decrease in antibiotic doses and decreased length of stay are potential advantages of such a strategy (Brozanski 2006). If the molecular test assay is positive (and if the assay has high sensitivity) then a case could be made for continuation of antibiotics. Molecular assays may theoretically diagnose sepsis in neonates exposed to antibiotics including maternal exposure to antibiotics in EOS, where cultures are negative and potentially decrease resource utilization. Combination of blood cultures with an 'add‐on' molecular test may improve sensitivity at the cost of specificity. Newer molecular assays that can identify the organism or detect antibiotic resistance can guide antibiotic therapy.
Jordan and colleagues and our group reviewed the methodology of molecular assays used in the diagnosis of neonatal sepsis without synthesizing data using meta‐analyses (Jordan 2010; Venkatesh 2010). Our group published one systematic review with meta‐analysis of 23 studies evaluating molecular assays in the diagnosis of neonatal sepsis (Pammi 2011). Overall, the summary estimates of sensitivity and specificity were similar with larger CIs and slightly higher specificity (sensitivity 0.90 (95% CI 0.78 to 0.95), specificity 0.96 (95% CI 0.94 to 0.97)). In our previous review, we were unable to analyze reasons for heterogeneity as data were not available, which we were able to do in this review.
Strengths and weaknesses of the review
Strengths: our systematic review was based on methodology recommended by the Cochrane Diagnostic Test Accuracy Working Group (Leeflang 2008). We performed a comprehensive search for all eligible studies using clinically relevant inclusion criteria. We used the bivariate random‐effects model for meta‐analyses of the included studies. We strived to explain the sources of heterogeneity by subgroup analyses using test type, gestational age of participants, type of sepsis onset and prevalence.
Weaknesses: evolution in methodology in the included studies over time (1997 to 2016) may account for variations in the diagnostic accuracy among studies. Unlike meta‐analyses of randomized controlled trials, heterogeneity is a well‐recognized problem in reviews of diagnostic test accuracy (Reitsma 2009). Despite our extensive search strategy, we may have missed potential studies, as diagnostic accuracy studies are poorly tagged in electronic databases. Publication bias in studies reporting diagnostic test accuracy has been poorly studied (Leeflang 2008). Poor reporting of study design, method of enrollment and participant characteristics may hamper methodologic assessment and external validity of the studies. Another limitation of our review might be that the reference standard (microbial cultures) is thought to be far from perfect. Interpretation of the accuracy of molecular assays is challenging given the assumed low sensitivity of the blood cultures. However, as our summary sensitivity of the molecular assays was poor (0.90) and the proportion of false positives was low, it does not seem to be the case.
Applicability of findings to the review question
Molecular assays have significant advantages when performed in conjunction with microbial cultures as an 'add‐on' test. The high specificity of molecular assay in LOS evaluation (0.94 (95% CI 0.85 to 0.98)) has the potential of decreasing antibiotic exposure by aiding physicians to make earlier decisions about discontinuation of antibiotics. Molecular assays, including PCR and hybridization methods, are feasible in neonates and have rapid detection times compared to blood cultures (six to eight hours versus 20 to 36 hours). Detection of pathogen DNA in the absence of viable organisms by culture and false‐negative results due to the presence of inhibitors may require careful interpretation. Molecular assays may have a significant impact on early diagnosis and treatment of neonatal sepsis. However, current molecular assays do not provide antibiotic susceptibility that may be important clinically. Microbiologic cultures detect most organisms causing neonatal sepsis, whereas molecular assays focused on fungi or a specific organism (Staphylococcus‐ or fungus‐specific PCR) do not. Costs, availability of equipment and technical skills in the microbiologic laboratory are important considerations that will impact applicability.

Study flow diagram.

Deeks' funnel plot for publication bias.

Risk of bias and applicability concerns graph: review authors' judgments about each domain presented as percentages across included studies.

Risk of bias and applicability concerns summary: review authors' judgments about each domain for each included study.

Forest plot of 1 All molecular tests. CI: confidence interval; FN: false negative; FP: false positive; TN: true negative; TP: true positive.

Summary receiver operating characteristic plot of all molecular tests.
Summary receiver operating characteristic plot by type of molecular test. PCR: polymerase chain reaction.

Summary receiver operating characteristic plot subgrouped by sepsis onset.

Summary receiver operating characteristic plot subgrouped by gestational age.

Forest plot of all molecular tests sorted in order of prevalence. CI: confidence interval; FN: false negative; FP: false positive; TN: true negative; TP: true positive.

Summary receiver operating characteristic plot of all molecular tests where the size of the study symbol is directly proportional to the prevalence of sepsis in the study.
Summary receiver operating characteristic plot of studies that performed molecular tests on blood samples only.

Summary receiver operating characteristic plot of molecular tests with good methodologic quality.

All molecular tests.

Molecular tests: blood samples only.

Molecular tests with good methodologic quality.
| Groups | Number of studies | Sensitivity (95% CI) | Specificity (95% CI) | Quality of evidence using GRADE | |
| All studies | ‐ | 35 | 0.90 (0.82 to 0.95) | 0.93 (0.89 to 0.96) | Moderate quality evidence* |
| Type of test | Broad‐range PCR | 9 | 0.97 (0.86 to 1.00) | 0.93 (0.77 to 0.98) | Moderate quality evidence* |
| Real‐time PCR | 9 | 0.86 (0.59 to 0.96) | 0.94 (0.90 to 0.97) | Moderate quality evidence* | |
| Post‐PCR processing | 5 | 0.97 (0.40 to 1.00) | 0.96 (0.93 to 0.98) | Low quality evidence** | |
| Multiplex PCR | 6 | 0.76 (0.60 to 0.88) | 0.81 (0.70 to 0.89) | Low quality evidence** | |
| Staphylococcal PCR* | 2 | ‐ | ‐ | Low quality evidence** | |
| Fungal PCR* | 4 | ‐ | ‐ | Low quality evidence** | |
| Type of sepsis | EOS* | 2 | ‐ | ‐ | Low quality evidence** |
| LOS | 10 | 0.79 (0.69 to 0.86) | 0.94 (0.85 to 0.98) | Low quality evidence** | |
| Mixed EOS and LOS | 23 | 0.94 (0.84 to 0.98) | 0.92 (0.87 to 0.95) | Moderate quality evidence* | |
| Gestational age | Preterm | 5 | 0.89 (0.75 to 0.96) | 0.87 (0.71 to 0.94) | Low quality evidence** |
| Mixed term and preterm | 30 | 0.90 (0.80 to 0.96) | 0.94 (0.90 to 0.96) | Moderate quality evidence* | |
| Prevalence | < 15% | 20 | 0.94 (0.80 to 0.99) | 0.95 (0.92 to 0.97) | Moderate quality evidence* |
| 15% to 30% | 8 | 0.85 (0.67 to 0.94) | 0.88 (0.79 to 0.94) | Low quality evidence** | |
| >30% | 7 | 0.87 (0.75 to 0.93) | 0.93 (0.64 to 0.99) | Low quality evidence** | |
| Specimen | Blood only | 32 | 0.92 (0.84 to 0.96) | 0.93 (0.89 to 0.95) | Low quality evidence** |
| Blood and CSF* | 3 | ‐ | ‐ | Moderate quality evidence* | |
| Quality | Good methodologic studies only | 22 | 0.90 (0.78 to 0.96) | 0.93 (0.88 to 0.96) | Moderate quality evidence* |
| CI: confidence interval; CSF: cerebrospinal fluid; EOS: early‐onset sepsis; LOS: late‐onset sepsis; PCR: polymerase chain reaction. Summary estimates of sensitivity and specificity were derived from meta‐analyses using the bivariate random‐effects model using statistical software STATA. Summary estimates for the subgroups are presented, where number of studies ≥ 4. *Summary estimates of sensitivity and specificity could not be calculated using STATA if number of studies ≤ 4. GRADE rating of evidence: reasons for downgrading quality of evidence (Gopalakrishna 2014) * Evidence downgraded one level for inconsistency of evidence. ** Evidence downgraded two levels for inconsistency and imprecision. | |||||
| Test | No. of studies | No. of participants |
| 1 All molecular tests Show forest plot | 35 | 7339 |
| 2 Molecular tests: blood samples only Show forest plot | 32 | 6999 |
| 3 Molecular tests with good methodologic quality Show forest plot | 22 | 4150 |