Inserción posparto inmediata versus diferida de implantes anticonceptivos y DIU para la anticoncepción
Información
- DOI:
- https://doi.org/10.1002/14651858.CD011913.pub3Copiar DOI

- Base de datos:
-
- Cochrane Database of Systematic Reviews
- Versión publicada:
-
- 27 octubre 2022see what's new
- Tipo:
-
- Intervention
- Etapa:
-
- Review
- Grupo Editorial Cochrane:
-
Grupo Cochrane de Regulación de la fertilidad
- Copyright:
-
- Copyright © 2022 The Cochrane Collaboration. Published by John Wiley & Sons, Ltd.
Cifras del artículo
Altmetric:
Citado por:
Autores
Contributions of authors
Jen Sothornwit initiated the review topic.
Jen Sothornwit and Srinaree Kaewrudee screened and selected the studies.
Jen Sothornwit and Sarah Averbach made risk of bias judgements.
Jen Sothornwit and Srinaree Kaewrudee extracted data.
Porjai Pattanittum entered data into RevMan 5.
Pisake Lumbiganon or Sarah Averbach checked all study characteristics for accuracy against the trial reports.
Porjai Pattanittum and Jen Sothornwit performed the meta‐analysis.
Jen Sothornwit, Sarah Averbach, Porjai Pattanittum, Srinaree Kaewrudee, and Pisake Lumbiganon drafted the review.
All authors reviewed and approved the final version of the review.
Sources of support
Internal sources
-
Department of Obstetrics and Gynecology, Faculty of Medicine, Khon Kaen University, Thailand
-
Department of Epidemiology and Biostatistics, Faculty of Public Health, Khon Kaen University, Thailand
External sources
-
Thailand Research Fund (Distinguished Professor Awards), Thailand
-
Cochrane Thailand, Thailand
-
Long‐term Institutional Development HUBs (LID‐HUBs), the Human Reproduction Programme (HRP) Alliance for Research Capacity Strenghtening, Department of Reproductive Health and Research, World Health Organization, Switzerland
-
National Institutes of Health, USA
Dr. Averbach is supported by the National Institutes of Health Eunice Kennedy Shriver National Institute of Child Health & Human Development (NICHD) physician scientist award (K12HD001259).
Declarations of interest
Jen Sothornwit: none known
Srinaree Kaewrudee: none known
Pisake Lumbiganon: none known
Porjai Pattanittum: none known
Sarah Averbach: none known
Acknowledgements
We thank the Cochrane Fertility Regulation Review Group for their contributions to the editorial process and clinical advice, Robin Paynter for designing the search strategies and running the search, and the referees for their useful suggestions and comments during the prepublication editorial process.
Version history
| Published | Title | Stage | Authors | Version |
| 2022 Oct 27 | Immediate versus delayed postpartum insertion of contraceptive implant and IUD for contraception | Review | Jen Sothornwit, Srinaree Kaewrudee, Pisake Lumbiganon, Porjai Pattanittum, Sarah H Averbach | |
| 2017 Apr 22 | Immediate versus delayed postpartum insertion of contraceptive implant for contraception | Review | Jen Sothornwit, Yuthapong Werawatakul, Srinaree Kaewrudee, Pisake Lumbiganon, Malinee Laopaiboon | |
| 2015 Oct 25 | Immediate versus delayed postpartum insertion of contraceptive implant for contraception | Protocol | Jen Sothornwit, Yuthapong Werawatakul, Srinaree Kaewrudee, Pisake Lumbiganon, Malinee Laopaiboon | |
Differences between protocol and review
Primary review outcome
In our protocol the primary outcome was 'Postpartum contraceptive prevalence at the first postpartum check‐up visit'. This has been rephrased as 'Rate of contraceptive implant initiation at the first postpartum visit (four to eight weeks postpartum)'. 'Continuation rate' has been rephrased as 'utilization rate'.
Keywords
MeSH
Medical Subject Headings (MeSH) Keywords
Medical Subject Headings Check Words
Female; Humans; Pregnancy;
PICO
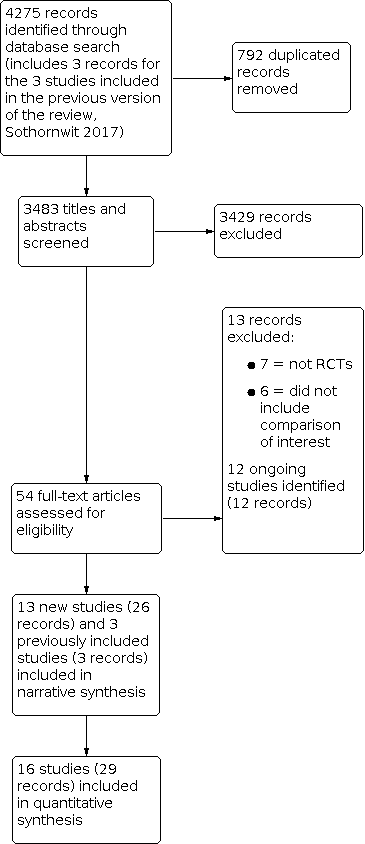
Study flow diagram

Risk of bias graph: review authors' judgements about each risk of bias item presented as percentages across all included studies

Risk of bias summary: review authors' judgements about each risk of bias item for each included study

Forest plot of comparison: 1 Immediate versus delayed postpartum insertion of contraceptive implants, outcome: 1.1 Rate of initiation of contraceptive implants

Forest plot of comparison: 1 Immediate versus delayed postpartum insertion of contraceptive implants, outcome: 1.4 Other adverse effects

Forest plot of comparison: 1 Immediate versus delayed postpartum insertion of contraceptive implants, outcome: 1.2 Utilization rate

Comparison 1: Immediate versus delayed postpartum insertion of contraceptive implants, Outcome 1: Rate of initiation of contraceptive implants

Comparison 1: Immediate versus delayed postpartum insertion of contraceptive implants, Outcome 2: Utilization rate

Comparison 1: Immediate versus delayed postpartum insertion of contraceptive implants, Outcome 3: Adverse effect: mean days of duration of vaginal bleeding

Comparison 1: Immediate versus delayed postpartum insertion of contraceptive implants, Outcome 4: Other adverse effects

Comparison 1: Immediate versus delayed postpartum insertion of contraceptive implants, Outcome 5: Participant satisfaction

Comparison 1: Immediate versus delayed postpartum insertion of contraceptive implants, Outcome 6: Unintended pregnancy rate

Comparison 1: Immediate versus delayed postpartum insertion of contraceptive implants, Outcome 7: Breastfeeding at 6 months postpartum

Comparison 2: Immediate versus delayed postpartum insertion of IUDs, Outcome 1: Rate of initiation of IUDs

Comparison 2: Immediate versus delayed postpartum insertion of IUDs, Outcome 2: Utilization rate

Comparison 2: Immediate versus delayed postpartum insertion of IUDs, Outcome 3: Expulsion

Comparison 2: Immediate versus delayed postpartum insertion of IUDs, Outcome 4: Participant satisfaction

Comparison 2: Immediate versus delayed postpartum insertion of IUDs, Outcome 5: Unintended pregnancy rate

Comparison 2: Immediate versus delayed postpartum insertion of IUDs, Outcome 6: Breastfeeding (LNG‐IUS)
| Immediate compared to delayed postpartum insertion of contraceptive implants for contraception | ||||||
| Participant or population: postpartum people who desire a contraceptive implant for contraception Settings: tertiary hospitals Intervention: immediate postpartum insertion Comparison: delayed insertion | ||||||
| Outcomes | Anticipated absolute effects* (95% CI) | Relative effect | № of participants | Certainty of the evidence | Comments | |
|---|---|---|---|---|---|---|
| Risk with delayed postpartum insertion of contraceptive implants | Risk with immediate postpartum insertion of contraceptive implants | |||||
| Rate of initiation of contraceptive implants | Study population | RR 1.48 | 715 | ⊕⊕⊕⊝ | ||
| 633 per 1000 | 936 per 1000 | |||||
| Utilization rate at 6 months postpartum | Study population | RR 1.16 | 330 | ⊕⊝⊝⊝ | ||
| 712 per 1000 | 826 per 1000 | |||||
| Utilization rate at 12 months postpartum | Study population | RR 0.98 | 164 | ⊕⊝⊝⊝ | ||
| 922 per 1000 | 904 per 1000 | |||||
| Adverse effect: mean days of prolonged vaginal bleeding within 6 weeks postpartum | Mean 17.8 days | MD 2.98 higher | MD 2.98 (2.71 to 8.66) | 420 | ⊕⊕⊝⊝ | |
| Adverse effects other than prolonged vaginal bleeding | Study population | RR 2.06 | 215 | ⊕⊕⊝⊝ | ||
| 229 per 1000 | 472 per 1000 | |||||
| Unintended pregnancy rate at 12 months postpartum | Study population | RR 1.82 | 64 | ⊕⊝⊝⊝ | ||
| 74 per 1000 | 135 per 1000 | |||||
| Any breastfeeding at six months postpartum | Study population | RR 0.97 | 225 | ⊕⊕⊝⊝ | ||
| 775 per 1000 | 751 per 1000 | |||||
| *The risk in the intervention group (and its 95% confidence interval) is based on the assumed risk in the comparison group and the relative effect of the intervention (and its 95% CI). | ||||||
| GRADE Working Group grades of evidence | ||||||
| 1Downgraded by one level owing to inconsistency across studies (I2 > 50%). 2Downgraded by one level owing to serious imprecision (e.g. 95% CI includes both appreciable appreciable benefit and harm, or because of low number of participants (total number of participants < 400)) 3Downgraded by one level owing to serious imprecision (low number of events (total number of events < 300)). 4Downgraded by one level owing to serious risk of attrition bias. 5Downgraded by one level owing to serious risk of assessment bias. | ||||||
| Immediate compared to delayed postpartum insertion of IUDs for contraception | ||||||
| Patient or population: postpartum people who desire IUDs for contraception | ||||||
| Outcomes | Anticipated absolute effects* (95% CI) | Relative effect | № of participants | Certainty of the evidence | Comments | |
|---|---|---|---|---|---|---|
| Risk with delayed postpartum insertion of IUD | Risk with immediate insertion of IUD | |||||
| Rate of initiation of IUDs | Study population | RR 1.27 | 1894 | ⊕⊕⊕⊝ | ||
| 614 per 1000 | 780 per 1000 | |||||
| Expulsion by 6 months | Study population | RR 4.55 | 1206 | ⊕⊕⊝⊝ | ||
| 21 per 1000 | 94 per 1000 | |||||
| Utilization rate at 6 months postpartum | Study population | RR 1.02 | 971 | ⊕⊝⊝⊝ | ||
| 822 per 1000 | 838 per 1000 | |||||
| Utilization rate at 12 months postpartum | Study population | RR 0.86 | 796 | ⊕⊝⊝⊝ | ||
| 781 per 1000 | 672 per 1000 | |||||
| Unintended pregnancy at 12 months postpartum | Study population | RR 0.26 | 1000 | ⊕⊕⊝⊝ | ||
| 168 per 1000 | 44 per 1000 | |||||
| Any breastfeeding at 6 months (hormonal IUD) | Study population | RR 0.90 | 435 | ⊕⊝⊝⊝ | ||
| 468 per 1000 | 421 per 1000 | |||||
| *The risk in the intervention group (and its 95% confidence interval) is based on the assumed risk in the comparison group and the relative effect of the intervention (and its 95% CI). | ||||||
| GRADE Working Group grades of evidence | ||||||
| 1Downgraded by one level owing to inconsistency across studies (I2 > 50%). 2Downgraded by one level owing to serious imprecision (low number of events (total number of events < 300)). 3Downgraded by one level owing to serious risk of attrition bias. 4Downgraded by one level owing to serious imprecision (e.g. 95% CI includes both appreciable appreciable benefit and harm, or because of low number of participants (total number of participants < 400)). 5Downgraded by one level owing to serious risk of assessment bias. | ||||||
| Outcome or subgroup title | No. of studies | No. of participants | Statistical method | Effect size |
| 1.1 Rate of initiation of contraceptive implants Show forest plot | 5 | 715 | Risk Ratio (IV, Random, 95% CI) | 1.48 [1.11, 1.98] |
| 1.1.1 High‐income countries | 3 | 410 | Risk Ratio (IV, Random, 95% CI) | 1.41 [1.28, 1.55] |
| 1.1.2 Middle‐ to low‐income countries | 2 | 305 | Risk Ratio (IV, Random, 95% CI) | 1.57 [0.61, 4.05] |
| 1.2 Utilization rate Show forest plot | 4 | Risk Ratio (IV, Random, 95% CI) | Subtotals only | |
| 1.2.1 At 6 months postpartum | 3 | 330 | Risk Ratio (IV, Random, 95% CI) | 1.16 [0.90, 1.50] |
| 1.2.2 At 12 months postpartum | 2 | 164 | Risk Ratio (IV, Random, 95% CI) | 0.98 [0.93, 1.04] |
| 1.3 Adverse effect: mean days of duration of vaginal bleeding Show forest plot | 2 | Mean Difference (IV, Random, 95% CI) | Subtotals only | |
| 1.3.1 Mean days of prolonged vaginal bleeding within 6 weeks postpartum | 2 | 420 | Mean Difference (IV, Random, 95% CI) | 2.98 [‐2.71, 8.66] |
| 1.4 Other adverse effects Show forest plot | 4 | Risk Ratio (M‐H, Fixed, 95% CI) | Subtotals only | |
| 1.4.1 Prolonged bleeding at 3 months postpartum | 2 | 225 | Risk Ratio (M‐H, Fixed, 95% CI) | 0.39 [0.10, 1.47] |
| 1.4.2 Prolonged bleeding at 6 months postpartum | 2 | 252 | Risk Ratio (M‐H, Fixed, 95% CI) | 1.19 [0.29, 4.94] |
| 1.4.3 Other vaginal bleeding or associated severe cramping within 12 months | 1 | 64 | Risk Ratio (M‐H, Fixed, 95% CI) | 1.01 [0.72, 1.44] |
| 1.4.4 Adverse effects other than prolonged vaginal bleeding | 1 | 215 | Risk Ratio (M‐H, Fixed, 95% CI) | 2.06 [1.38, 3.06] |
| 1.5 Participant satisfaction Show forest plot | 2 | Risk Ratio (IV, Fixed, 95% CI) | Subtotals only | |
| 1.5.1 At 6 months postpartum | 1 | 152 | Risk Ratio (IV, Fixed, 95% CI) | 0.97 [0.90, 1.04] |
| 1.5.2 At 12 months postpartum | 1 | 64 | Risk Ratio (IV, Fixed, 95% CI) | 1.01 [0.77, 1.31] |
| 1.6 Unintended pregnancy rate Show forest plot | 2 | Risk Ratio (M‐H, Fixed, 95% CI) | Subtotals only | |
| 1.6.1 At 6 months postpartum | 1 | 205 | Risk Ratio (M‐H, Fixed, 95% CI) | 0.20 [0.01, 4.08] |
| 1.6.2 At 12 months postpartum | 1 | 64 | Risk Ratio (M‐H, Fixed, 95% CI) | 1.82 [0.38, 8.71] |
| 1.7 Breastfeeding at 6 months postpartum Show forest plot | 3 | Risk Ratio (IV, Fixed, 95% CI) | Subtotals only | |
| 1.7.1 Exclusive breastfeeding | 2 | 261 | Risk Ratio (IV, Fixed, 95% CI) | 0.89 [0.66, 1.21] |
| 1.7.2 Any breastfeeding | 2 | 225 | Risk Ratio (IV, Fixed, 95% CI) | 0.97 [0.92, 1.01] |
| Outcome or subgroup title | No. of studies | No. of participants | Statistical method | Effect size |
| 2.1 Rate of initiation of IUDs Show forest plot | 11 | 1894 | Risk Ratio (IV, Random, 95% CI) | 1.27 [1.07, 1.51] |
| 2.1.1 Copper IUDs | 5 | 1329 | Risk Ratio (IV, Random, 95% CI) | 1.38 [0.96, 1.97] |
| 2.1.2 Levonorgestrel IUDs | 5 | 453 | Risk Ratio (IV, Random, 95% CI) | 1.11 [1.05, 1.18] |
| 2.1.3 Any types of IUDs | 1 | 112 | Risk Ratio (IV, Random, 95% CI) | 1.56 [1.25, 1.94] |
| 2.2 Utilization rate Show forest plot | 7 | Risk Ratio (IV, Random, 95% CI) | Subtotals only | |
| 2.2.1 At 6 months postpartum | 6 | 971 | Risk Ratio (IV, Random, 95% CI) | 1.02 [0.65, 1.62] |
| 2.2.2 At 12 months postpartum | 3 | 796 | Risk Ratio (IV, Random, 95% CI) | 0.86 [0.50, 1.47] |
| 2.3 Expulsion Show forest plot | 8 | Risk Ratio (M‐H, Fixed, 95% CI) | Subtotals only | |
| 2.3.1 Expulsion by 6 months postpartum | 8 | 1206 | Risk Ratio (M‐H, Fixed, 95% CI) | 4.55 [2.52, 8.19] |
| 2.4 Participant satisfaction Show forest plot | 2 | Risk Ratio (IV, Fixed, 95% CI) | Subtotals only | |
| 2.4.1 At 6 months postpartum | 1 | 69 | Risk Ratio (IV, Fixed, 95% CI) | 0.93 [0.83, 1.03] |
| 2.4.2 At 12 months postpartum | 1 | 598 | Risk Ratio (IV, Fixed, 95% CI) | 1.05 [0.98, 1.12] |
| 2.5 Unintended pregnancy rate Show forest plot | 4 | Risk Ratio (M‐H, Fixed, 95% CI) | Subtotals only | |
| 2.5.1 at 6 months postpartum | 3 | 268 | Risk Ratio (M‐H, Fixed, 95% CI) | Not estimable |
| 2.5.2 at 12 months postpartum | 1 | 1000 | Risk Ratio (M‐H, Fixed, 95% CI) | 0.26 [0.17, 0.41] |
| 2.6 Breastfeeding (LNG‐IUS) Show forest plot | 5 | Risk Ratio (M‐H, Random, 95% CI) | Subtotals only | |
| 2.6.1 Exclusive breastfeeding at 6 months | 2 | 297 | Risk Ratio (M‐H, Random, 95% CI) | 0.52 [0.08, 3.19] |
| 2.6.2 Any breastfeeding at 6 months | 5 | 435 | Risk Ratio (M‐H, Random, 95% CI) | 0.90 [0.63, 1.30] |