Inserción posparto inmediata versus diferida de implantes anticonceptivos y DIU para la anticoncepción
Resumen
Antecedentes
Los anticonceptivos reversibles de acción prolongada (ARAP), que incluyen los dispositivos intrauterinos (DIU) y los implantes anticonceptivos, son métodos anticonceptivos reversibles de gran eficacia. Proporcionar métodos ARAP durante el período posparto es importante para apoyar la elección de anticonceptivos y para prevenir los embarazos no deseados y los intervalos intergenésicos cortos. Retrasar la oferta de anticonceptivos a las puérperas hasta la primera visita integral posparto, tradicionalmente en torno a las seis semanas después del parto, podría poner a algunas puérperas en riesgo de embarazos no deseados, ya sea por la pérdida de seguimiento o por el inicio de las relaciones sexuales antes de recibir la anticoncepción. Por lo tanto, proporcionar anticonceptivos altamente eficaces de forma inmediata, antes del alta hospitalaria, tiene el potencial de mejorar el uso de anticonceptivos y prevenir los embarazos no deseados y los intervalos intergenésicos cortos.
Objetivos
Comparar la tasa de iniciación, las tasas de utilización (a los seis y a los 12 meses después del parto), la efectividad y los efectos adversos de la inserción posparto inmediata versus diferida de implantes y DIU para la anticoncepción.
Métodos de búsqueda
Hasta diciembre de 2020 se realizaron búsquedas de estudios elegibles en el Registro Cochrane central de ensayos controlados (Cochrane Central Register of Controlled Trials; CENTRAL), MEDLINE, Embase y POPLINE. Se examinaron los artículos de revisión y se estableció contacto con investigadores. Se verificaron los registros de ensayos clínicos en curso, las listas de citas de los estudios incluidos, los libros de texto clave, la literatura gris y las revisiones sistemáticas anteriores en busca de estudios potencialmente relevantes.
Criterios de selección
Se buscaron ensayos controlados aleatorizados (ECA) que compararan la inserción posparto inmediata versus diferida de implantes anticonceptivos y DIU para la anticoncepción.
Obtención y análisis de los datos
Dos autores de la revisión (JS, SK) revisaron de forma independiente los títulos y resúmenes de los resultados de la búsqueda y evaluaron los artículos de texto completo de los estudios potencialmente relevantes para inclusión. Además extrajeron los datos de los estudios incluidos, evaluaron el riesgo de sesgo, compararon los resultados y resolvieron los desacuerdos consultando a un tercer autor de la revisión (PL, SA o PP). Cuando fue posible, se estableció contacto con los investigadores para solicitar datos adicionales. Se calculó la razón de riesgos (RR) de Mantel‐Haenszel o la varianza inversa con un intervalo de confianza (IC) del 95% para los desenlaces binarios y la diferencia de medias (DM) con un IC del 95% para las variables continuas.
Resultados principales
En esta revisión actualizada, 16 estudios cumplieron los criterios de inclusión; cinco eran estudios de implantes anticonceptivos (715 participantes) y 11 eran estudios de DIU (1894 participantes). Se identificaron 12 estudios en curso. Los resultados de esta revisión se evaluaron con el método GRADE; la certeza general de la evidencia para cada desenlace varió de moderada a muy baja, siendo las principales limitaciones el riesgo de sesgo, la inconsistencia y la imprecisión.
Implantes anticonceptivos
La inserción inmediata probablemente mejora la tasa de iniciación de los implantes anticonceptivos en comparación con la inserción diferida (RR 1,48; IC del 95%: 1,11 a 1,98; cinco estudios, 715 participantes; I2 = 95%; evidencia de certeza moderada).
No se sabe si hubo una diferencia entre los dos grupos en la tasa de utilización de los implantes anticonceptivos a los seis meses después del parto (RR 1,16; IC del 95%: 0,90 a 1,50; tres estudios, 330 participantes; I2 = 89%; evidencia de certeza muy baja) o a los 12 meses después de la inserción (RR 0,98; IC del 95%: 0,93 a 1,04; dos estudios, 164 participantes; I2 = 0%; evidencia de certeza muy baja).
Las personas que recibieron la inserción de un implante anticonceptivo inmediatamente después del parto podrían haber tenido un mayor número medio de días de sangrado vaginal prolongado dentro de las seis semanas posteriores al parto (diferencia de medias [DM] 2,98 días; IC del 95%: ‐2,71 a 8.66; dos estudios, 420 participantes; I2 = 91%; evidencia de certeza baja) y una mayor tasa de otros efectos adversos en las primeras seis semanas después del parto (RR 2,06; IC del 95%: 1,38 a 3,06; un estudio, 215 participantes; evidencia de certeza baja) que las que recibieron una inserción posparto diferida. No se sabe con certeza si hubo una diferencia entre los dos grupos en el sangrado prolongado a los seis meses después del parto (RR 1,19; IC del 95%: 0,29 a 4,94; dos estudios, 252 participantes; I2 = 0%; evidencia de certeza muy baja).
Podría haber poca o ninguna diferencia entre los dos grupos en cuanto a las tasas de embarazos no deseados a los seis meses (RR 0,20; IC del 95%: 0,01 a 4,08; un estudio, 205 participantes; evidencia de certeza baja). No se sabe con certeza si hubo una diferencia en las tasas de embarazos no deseados a los 12 meses posparto (RR 1,82; IC del 95%: 0,38 a 8,71; un estudio, 64 participantes; evidencia de certeza muy baja). Podría haber poca o ninguna diferencia entre los dos grupos en cualquier tasa de lactancia materna a los seis meses (RR 0,97; IC del 95%: 0,92 a 1,01; dos estudios, 225 participantes; I2 = 48%; evidencia de certeza baja).
DIU
La inserción inmediata de DIU probablemente mejora la tasa de iniciación en comparación con la inserción diferida, independientemente del tipo de DIU (RR 1,27; IC del 95%: 1,07 a 1,51; diez estudios, 1894 participantes; I2 = 98%; evidencia de certeza moderada). Sin embargo, las personas que recibieron una inserción de DIU inmediatamente después del parto podrían haber tenido una mayor tasa de expulsión a los seis meses después del parto (RR 4,55; IC del 95%: 2,52 a 8,19; ocho estudios, 1206 participantes; I2 = 31%; evidencia de certeza baja) que las que recibieron una inserción posparto diferida.
No se sabe con certeza si hubo una diferencia entre los dos grupos en la utilización de los DIU a los seis meses después de la inserción (RR 1,02; IC del 95%: 0,65 a 1,62; seis estudios, 971 participantes; I2 = 96%; evidencia de certeza muy baja) o a los 12 meses después de la inserción (RR 0,86; IC del 95%: 0,5 a 1,47; tres estudios, 796 participantes; I2 = 92%; evidencia de certeza muy baja).
La inserción inmediata de DIU podría reducir los embarazos no deseados a los 12 meses (RR 0,26; IC del 95%: 0,17 a 0,41; un estudio, 1000 participantes; evidencia de certeza baja). No se sabe con certeza si hubo diferencias en las tasas de lactancia a los seis meses en las personas que recibieron DIU liberadores de progestina (RR 0,90; IC del 95%: 0,63 a 1,30; cinco estudios, 435 participantes; I2 = 54%; evidencia de certeza muy baja).
Conclusiones de los autores
La evidencia de esta revisión actualizada indica que la inserción posparto inmediata mejora la tasa de iniciación tanto de los implantes anticonceptivos como de los DIU en la primera visita posparto en comparación con la inserción diferida. Sin embargo, no está claro si existen diferencias en las tasas de utilización a los seis y 12 meses después del parto. No se sabe si hay alguna diferencia en la tasa de embarazos no deseados a los 12 meses. El suministro de implantes liberadores de progestina y DIU inmediatamente después del parto podría tener poco o ningún impacto negativo en la lactancia. Sin embargo, la tasa de expulsión de los DIU y el sangrado vaginal prolongado asociado con los implantes colocados de forma inmediata parecen ser mayores.
PICO
Resumen en términos sencillos
¿Es mejor colocar un implante o un dispositivo intrauterino (DIU) para la anticoncepción a los pocos días del parto o esperar de cuatro a seis semanas?
Cuando se utiliza el término "personas" en este resumen, se hace referencia a aquellas con la capacidad de quedar embarazada.
Mensajes clave
‐ La inserción de implantes anticonceptivos o dispositivos intrauterinos (DIU) a los pocos días del parto (inserción inmediata, mientras se está en el hospital), en lugar de esperar de cuatro a seis semanas para la inserción (inserción diferida), aumenta el número de personas en las que se insertan.
‐ El momento de la inserción supone una diferencia escasa o nula en el número de personas que utilizan estos métodos anticonceptivos a los seis o 12 meses después del parto.
‐ La expulsión del DIU parece ser más frecuente en las personas a las que se les realiza una inserción inmediata.
‐ Se necesitan más investigaciones sobre las tasas de embarazos no deseados tanto con la inserción inmediata como con la inserción diferida de implantes y DIU.
¿Qué son los implantes anticonceptivos o dispositivos intrauterinos?
Los implantes anticonceptivos y los dispositivos intrauterinos (DIU) son métodos anticonceptivos muy eficaces, reversibles y seguros para su uso poco después del parto. Los implantes se insertan en la parte superior del brazo y los DIU en el útero, por personal médico o de enfermería. Las personas que utilizan estos métodos anticonceptivos utilizan un implante o un DIU.
El espaciamiento adecuado de los embarazos es bueno para la salud de las embarazadas y de los recién nacidos. Normalmente, la anticoncepción se proporciona en la primera visita de salud integral tras el parto (normalmente unas seis semanas después de dar a luz). Sin embargo, algunas personas mantienen relaciones sexuales antes de esta visita o no acuden a ella, lo que aumenta el riesgo de embarazo no planeado. La inserción de un implante anticonceptivo o un DIU en los días posteriores al parto, antes del alta hospitalaria, es conveniente para las pacientes y el personal médico. Se sabe que la persona que lleva el implante o el DIU no está embarazada y esta práctica podría aumentar el número de personas que pueden utilizar estos métodos anticonceptivos.
¿Qué se quería averiguar?
Se quería averiguar si la inserción de implantes anticonceptivos o DIU a los pocos días de dar a luz era mejor que esperar de seis a ocho semanas en cuanto a:
‐ el número de personas que aceptaron la inserción (tasa de inserción);
‐ el número de personas que siguieron utilizando estos métodos anticonceptivos (tasa de utilización);
‐ prevenir el embarazo; y
‐ si la inserción de implantes anticonceptivos o DIU en los días posteriores al parto se asoció con algún efecto no deseado.
¿Qué se hizo?
Se buscaron estudios que investigaran la inserción de implantes anticonceptivos o DIU en personas a los pocos días del parto ("inserción inmediata") en comparación con la inserción entre seis y ocho semanas después del parto ("inserción diferida").
Se compararon y resumieron los resultados de los estudios y la confianza en la evidencia se evaluó sobre la base de factores como la metodología y el tamaño de los estudios.
¿Qué se encontró?
Se encontraron 16 estudios con un total de 2609 personas (715 personas en estudios de implantes anticonceptivos y 1894 personas en estudios de DIU). Todos los estudios se realizaron en hospitales. La mayor parte se realizó en EE.UU., pero otros tuvieron lugar en Uganda, Egipto, Brasil y Sri Lanka. Los estudios incluyeron a personas que acababan de dar a luz, la mayoría de las cuales tenían 18 años o más, aunque un estudio incluyó a personas más jóvenes. Los estudios investigaron diferentes tipos de implantes anticonceptivos y DIU.
Resultados principales
Implantes anticonceptivos
Las personas tenían un 48% más de probabilidades de colocarse implantes anticonceptivos cuando podían insertarse a los pocos días del parto, en comparación con la inserción diferida.
El momento de la inserción apenas supuso una diferencia en el número de personas que utilizaron implantes anticonceptivos a los seis o 12 meses después del parto.
El sangrado vaginal pareció durar más tiempo en las personas a las que se les insertaron los implantes unos días después del parto en comparación con la inserción diferida (tres días más de sangrado), pero no hubo diferencias entre los grupos en el sangrado a los seis meses después del parto.
No está claro si hubo una diferencia en las tasas de embarazos no deseados entre los grupos a los seis y 12 meses después del parto.
DIU
Las personas tenían un 27% más de probabilidades de colocarse el DIU cuando se podía insertar a los pocos días del parto, en comparación con la inserción diferida.
No estuvo claro si el momento de la inserción supuso alguna diferencia en el número de personas que utilizaron el DIU a los seis o 12 meses después del parto.
Seis meses después del parto, la expulsión del DIU del útero parecía ocurrir con más frecuencia en las personas a las que se les había insertado el DIU a los pocos días del parto.
No está claro si hubo una diferencia en las tasas de embarazos no deseados entre los grupos a los seis y 12 meses después del parto.
¿Cuáles son las limitaciones de la evidencia?
La confianza en la evidencia de los diferentes resultados varía de moderada a incierta. Esto se debe a que las personas que participaron en los estudios sabían cuándo se les habían colocado los implantes o los DIU, lo que podría haber afectado la comunicación de algunos desenlaces y debido a la tasa de abandono de los estudios. Además, no todos los estudios proporcionaron datos sobre todos los resultados de interés, por lo que algunos resultados se basan en un número menor de personas.
¿Cuál es el grado de actualización de esta evidencia?
La evidencia está actualizada hasta diciembre de 2020.
Authors' conclusions
Summary of findings
| Immediate compared to delayed postpartum insertion of contraceptive implants for contraception | ||||||
| Participant or population: postpartum people who desire a contraceptive implant for contraception Settings: tertiary hospitals Intervention: immediate postpartum insertion Comparison: delayed insertion | ||||||
| Outcomes | Anticipated absolute effects* (95% CI) | Relative effect | № of participants | Certainty of the evidence | Comments | |
|---|---|---|---|---|---|---|
| Risk with delayed postpartum insertion of contraceptive implants | Risk with immediate postpartum insertion of contraceptive implants | |||||
| Rate of initiation of contraceptive implants | Study population | RR 1.48 | 715 | ⊕⊕⊕⊝ | ||
| 633 per 1000 | 936 per 1000 | |||||
| Utilization rate at 6 months postpartum | Study population | RR 1.16 | 330 | ⊕⊝⊝⊝ | ||
| 712 per 1000 | 826 per 1000 | |||||
| Utilization rate at 12 months postpartum | Study population | RR 0.98 | 164 | ⊕⊝⊝⊝ | ||
| 922 per 1000 | 904 per 1000 | |||||
| Adverse effect: mean days of prolonged vaginal bleeding within 6 weeks postpartum | Mean 17.8 days | MD 2.98 higher | MD 2.98 (2.71 to 8.66) | 420 | ⊕⊕⊝⊝ | |
| Adverse effects other than prolonged vaginal bleeding | Study population | RR 2.06 | 215 | ⊕⊕⊝⊝ | ||
| 229 per 1000 | 472 per 1000 | |||||
| Unintended pregnancy rate at 12 months postpartum | Study population | RR 1.82 | 64 | ⊕⊝⊝⊝ | ||
| 74 per 1000 | 135 per 1000 | |||||
| Any breastfeeding at six months postpartum | Study population | RR 0.97 | 225 | ⊕⊕⊝⊝ | ||
| 775 per 1000 | 751 per 1000 | |||||
| *The risk in the intervention group (and its 95% confidence interval) is based on the assumed risk in the comparison group and the relative effect of the intervention (and its 95% CI). | ||||||
| GRADE Working Group grades of evidence | ||||||
| 1Downgraded by one level owing to inconsistency across studies (I2 > 50%). 2Downgraded by one level owing to serious imprecision (e.g. 95% CI includes both appreciable appreciable benefit and harm, or because of low number of participants (total number of participants < 400)) 3Downgraded by one level owing to serious imprecision (low number of events (total number of events < 300)). 4Downgraded by one level owing to serious risk of attrition bias. 5Downgraded by one level owing to serious risk of assessment bias. | ||||||
| Immediate compared to delayed postpartum insertion of IUDs for contraception | ||||||
| Patient or population: postpartum people who desire IUDs for contraception | ||||||
| Outcomes | Anticipated absolute effects* (95% CI) | Relative effect | № of participants | Certainty of the evidence | Comments | |
|---|---|---|---|---|---|---|
| Risk with delayed postpartum insertion of IUD | Risk with immediate insertion of IUD | |||||
| Rate of initiation of IUDs | Study population | RR 1.27 | 1894 | ⊕⊕⊕⊝ | ||
| 614 per 1000 | 780 per 1000 | |||||
| Expulsion by 6 months | Study population | RR 4.55 | 1206 | ⊕⊕⊝⊝ | ||
| 21 per 1000 | 94 per 1000 | |||||
| Utilization rate at 6 months postpartum | Study population | RR 1.02 | 971 | ⊕⊝⊝⊝ | ||
| 822 per 1000 | 838 per 1000 | |||||
| Utilization rate at 12 months postpartum | Study population | RR 0.86 | 796 | ⊕⊝⊝⊝ | ||
| 781 per 1000 | 672 per 1000 | |||||
| Unintended pregnancy at 12 months postpartum | Study population | RR 0.26 | 1000 | ⊕⊕⊝⊝ | ||
| 168 per 1000 | 44 per 1000 | |||||
| Any breastfeeding at 6 months (hormonal IUD) | Study population | RR 0.90 | 435 | ⊕⊝⊝⊝ | ||
| 468 per 1000 | 421 per 1000 | |||||
| *The risk in the intervention group (and its 95% confidence interval) is based on the assumed risk in the comparison group and the relative effect of the intervention (and its 95% CI). | ||||||
| GRADE Working Group grades of evidence | ||||||
| 1Downgraded by one level owing to inconsistency across studies (I2 > 50%). 2Downgraded by one level owing to serious imprecision (low number of events (total number of events < 300)). 3Downgraded by one level owing to serious risk of attrition bias. 4Downgraded by one level owing to serious imprecision (e.g. 95% CI includes both appreciable appreciable benefit and harm, or because of low number of participants (total number of participants < 400)). 5Downgraded by one level owing to serious risk of assessment bias. | ||||||
Background
Note: when we use the term 'people' in this summary, we mean individuals with presumed current or past ability to become pregnant.
Description of the condition
Traditionally, the comprehensive postpartum visit is scheduled around six weeks after childbirth (Speroff 2008). At this visit, healthcare providers typically assess recovery after childbirth and address contraceptive needs. Although the postpartum visit is an ideal time to discuss and provide family planning services, there is a notably poor attendance at postpartum appointments, particularly among adolescents. This results in delayed or missed opportunities to counsel about contraception (Moore 2015; Nkwabong 2015). In addition, nearly half of people who have given birth report unprotected vaginal sexual intercourse before attending a six‐week postpartum visit (Brito 2009; Chaovisitsaree 2012). Delayed initiation of contraception after childbirth and having unprotected sexual intercourse before attending the postpartum visit can put people at risk of unintended pregnancy (Wilson 2011), as well as short interpregnancy intervals ‐ defined as a pregnancy within two years of the previous pregnancy (WHO 2005). As unintended pregnancy and short interpregnancy intervals have a negative impact on maternal and infant health (Finer 2011; Fraser 1995; Singh 2010; WHO 2005), designing effective contraceptive practices to reduce undesired pregnancy among people who are at high risk of becoming pregnant is of utmost importance.
Description of the intervention
Provision of contraception usually occurs around six weeks postpartum. However, a study conducted in the USA indicated that only 41% of birthing people received contraceptives within 90 days of delivery (Thiel de Bocanegra 2013). This is similar to results reported from low‐ and middle‐income countries (Moore 2015; Nkwabong 2015). Therefore immediate provision of effective contraception is an important public health concern. According to ACOG 2016, the term 'immediate postpartum' refers to the period between delivery and hospital discharge.
Long‐acting reversible contraception (LARC) methods include contraceptive implants and intrauterine devices (IUDs), which are extremely effective and safe methods of contraception (ACOG 2017). Currently, two types of progestins are used in contraceptive implants, levonorgestrel and etonogestrel.
The primary mechanism of action of the implant is to suppress ovulation by altering the hypothalamic–pituitary–ovarian axis; secondary mechanisms include thickening of cervical mucous and altering the endometrial lining (ACOG 2017).
With regard to IUDs, hormonal and non‐hormonal IUDs are available. The primary mechanism of action for both types of IUDs is prevention of fertilization. The progestogenic effects of hormonal IUDs cause the thickening of cervical mucous that hinders sperm transport and alterations of the endometrium that inhibit fertilization (Ortiz 1996; Stanford 2002). Non‐hormonal IUDs inhibit sperm motility.
These contraceptive methods offer between three to 12 years of reliable pregnancy prevention once inserted in people with a cervix. The typical use failure rate is less than 1% for both implants and IUDs (ACOG 2017). The satisfaction rates for implants and IUDs are reported to be high, and are reflected in high continuation rates (Hubacher 2018).
Based on their high efficacy and safety, LARC methods are suitable for nearly all people with a cervix who need contraception (ACOG 2018; WHO 2015). The common adverse effects of contraceptive implants include amenorrhea (absence of menstrual bleeding), irregular unpredictable menstrual bleeding or spotting, and headache. However, most adverse effects are mild, well‐tolerated, and some resolve within the first few months of use; potential users should receive counseling in order to understand the adverse effects. Common adverse effects associated with non‐hormonal IUDs include heavy and prolonged menstruation and pain, while hormonal IUDs have progestin‐related adverse effects that include decreases in menstrual bleeding and irregular menstrual bleeding or spotting.
How the intervention might work
There is an increased risk of unintended pregnancy among people who have not initiated contraception after childbirth and have unprotected sexual intercourse before attending a postpartum visit to discuss contraception. Immediate postpartum provision of highly effective contraception, including IUDs and contraceptive implants, has been proposed as an intervention to prevent unintended pregnancy and short interpregnancy intervals (ACOG 2017).
Based on a previous Cochrane systematic review, immediate postpartum insertion of IUDs appears to be safe and effective (Lopez 2015). Advantages of this practice include high motivation and convenience for both postpartum people and providers. However, the expulsion rate of IUDs inserted immediately postpartum is slightly higher than in people who have delayed insertion of IUDs (Lopez 2015).
Immediate postpartum provision of the contraceptive implant has not been shown to have any significant negative impacts on maternal health, breastfeeding or infant health, but data are limited (Phillips 2016). The World Health Organization's (WHO's) medical eligibility criteria for contraceptive use supports contraceptive implant insertion prior to hospital discharge regardless of lactation status (WHO 2015; Whaley 2015). The adverse effects of immediate postpartum insertion of contraceptive implants also appear to be similar to those of delayed insertion (Ireland 2014). Additionally, the three‐year continuation rate of this method is as high as 66% when contraceptive implants are inserted immediately postpartum, which suggests a high level of satisfaction with this practice (Wilson 2014).
Why it is important to do this review
Immediate postpartum insertion of a LARC device could be a promising choice for timing and location of contraceptive method initiation. The postnatal hospital stay provides a timely opportunity to offer contraception to postpartum people. However, IUD expulsion has been shown to be higher in the immediate postpartum period so IUD continuation rates may be affected (Jatlaoui 2018). It is generally accepted that people using IUDs need to check their IUD string regularly to avoid being at risk of unintended pregnancy. In addition, the natural postpartum decline in serum progesterone after delivery has been proposed as a trigger for lactogenesis (Rodriguez 2009). Therefore, administration of progestin‐containing contraceptives such as implants and LNG‐IUS immediately postpartum could, theoretically, have a negative impact on breastfeeding initiation.
This is an update to the Sothornwit 2017 review. In this previous Cochrane Review, we found and included only three studies and concluded that immediate insertion of contraceptive implants improves initiation rate compared to delayed insertion. However, evidence about utilization was lacking. In order to make a more comprehensive review, we broadened our scope in this update to cover immediate versus delayed postpartum LARCs, including both implants and IUDs.
Objectives
To compare the initiation rate, utilization rates (at six months and 12 months after delivery), effectiveness, and adverse effects of immediate versus delayed postpartum insertion of implants and IUDs for contraception.
Methods
Criteria for considering studies for this review
Types of studies
We included randomized controlled trials (RCTs), irrespective of blinding, language, publication status, or sample size. We did not include controlled clinical trials (CCTs) that used non‐random methods of assigning participants to treatment, such as by alternation, by birth date, or by medical record number, as they may be subject to high risk of bias.
Types of participants
Postpartum people who requested a long‐acting reversible contraceptive method and were recruited before hospital discharge.
Types of interventions
Contraceptive implants:
-
immediate postpartum insertion of contraceptive implants (after delivery and before hospital discharge) compared to delayed postpartum insertion (during a postpartum visit after hospital discharge), which is often referred to as standard, or interval, insertion.
IUDs:
-
immediate postpartum insertion, including both immediate postplacental insertion (within 10 minutes of placenta delivery, following vaginal or cesarean delivery) and early postpartum insertion (10 minutes after delivery to hospital discharge), compared to delayed postpartum insertion (during a postpartum visit four or more weeks after hospital discharge), which is often referred to as standard, or interval, insertion.
Types of outcome measures
Primary outcomes
-
Rate of insertion of contraceptive implants and IUDs at the first postpartum visit (four to six weeks postpartum).
Secondary outcomes
-
Expulsion rate of IUDs at 6, 12, and 24 months after delivery.
-
Utilization rate at 6, 12, and 24 months after delivery.
-
Adverse effects:
-
for contraceptive implants: bleeding, including mean days of bleeding and proportion of people experiencing irregular bleeding, and adverse effects or harms other than bleeding;
-
for IUDs: perforation, and infection.
-
-
Participant satisfaction.
-
Unintended pregnancy rate at 6, 12, and 24 months after delivery.
-
Rapid repeat pregnancy (pregnancy within 18 months of delivery).
-
Breastfeeding at six months postpartum.
Search methods for identification of studies
Electronic searches
We searched the following electronic databases:
-
Cochrane Central Register of Controlled Trials (via Ovid EBM Reviews, CENTRAL, 2020, issue 12);
-
MEDLINE ALL (Ovid) (1946 to December week 2, 2020);
-
Embase.com (1980 to December 2020);
-
POPLINE (1970 to December 2020).
We have provided the search strategies in Appendix 1.
Searching other resources
We checked the citation lists of included studies, key textbooks, and systematic reviews for potentially relevant references. We searched the WHO International Clinical Trials Registry Platform (WHO ICTRP) (www.who.int/ictrp/en) and ClinicalTrials.gov to identify ongoing trials. We applied modified versions of the same search strategy to check the following databases for grey literature: OpenGrey, GreyNet, Scirus, Social Care Online, National Research Register, NIHR portfolio database, and Index to theses.
Data collection and analysis
Selection of studies
Before examining the identified trials for possible inclusion, we developed and piloted a data collection form, as described in the Cochrane Handbook for Systematic Reviews of Interventions (Higgins 2019). We downloaded all titles and abstracts retrieved by electronic searching. After removal of duplicates, all references were transferred to Covidence. Two review authors, JS and SK, independently screened the titles and abstracts of the remaining studies. We excluded studies that clearly did not meet the inclusion criteria. We obtained full‐text copies of potentially relevant studies. Two review authors, JS and SK, independently assessed the eligibility of the retrieved reports and publications. We resolved any disagreement through discussion or, if required, we consulted a third review author (PL, SA or PP). We identified and intended to collate multiple reports of the same study so that each study, rather than each report, was the unit of interest in the review. We recorded the selection process in sufficient detail to complete a PRISMA flow diagram (Liberati 2009), and a.'Characteristics of excluded studies table.
Data extraction and management
Two review authors, JS and SK, independently extracted study characteristics and outcome data from the included studies using a piloted data collection form. When the included trials did not report outcome data in a usable way, we noted in this the Characteristics of included studies table. We then contacted the trial authors for further information. We resolved disagreements by consensus or by involving a third review author (PL, SA or PP). One review author, PP, entered data into Review Manager 5 (RevMan 5) (RevMan 2014). We double‐checked whether data were entered correctly by comparing the data presented in the systematic review with the study reports. A second review author (PL or SA) checked all study characteristics for accuracy against the trial report.
For included studies, we extracted the following data:
-
author, year of publication, and journal citation (including language);
-
country;
-
setting;
-
inclusion and exclusion criteria;
-
study design and methodology;
-
study population;
-
study outcomes and their related summary statistics.
Assessment of risk of bias in included studies
We assessed and reported on the methodological risk of bias of included studies in accordance with the Cochrane Handbook for Systematic Reviews of Interventions (Higgins 2019), which recommends an assessment is made for each of the following domains for RCTs:
-
selection bias: random sequence generation and allocation concealment;
-
performance bias: blinding of participants and personnel (participants and treatment providers);
-
detection bias: blinding of outcome assessors;
-
attrition bias: incomplete outcome data;
-
reporting bias: selective reporting of outcomes.
Two review authors, JS and SA, independently applied the risk of bias tool (ROB 1) to each included study and resolved differences by discussion or by consulting a third review author (PL or PP). SA was a study author on two studies, so other review authors assessed these studies for risk of bias (JS and PL). We judged each item as at being at either 'high’, 'low’, or 'unclear’ risk of bias, as set out in the criteria provided by Higgins 2019, and provided a quotation from the study report or a statement as justification for the judgement for each item in the risk of bias table. We summarized the results in both a risk of bias graph and a risk of bias summary. When we interpreted treatment effects and meta‐analyses, we took into account the risk of bias for the studies that contributed to that outcome. Where information on risk of bias was related to unpublished data or correspondence with a trial author, we noted this in the risk of bias table.
Measures of treatment effect
We used the following measures of the effect of treatment.
-
For dichotomous outcomes, such as the rates of contraceptive implantation and IUD initiation, we used number of events and number of participants assessed for both the intervention and comparison groups to calculate the risk ratio (RR) and 95% confidence interval (CI).
-
For continuous outcomes, such as satisfaction rate, we used mean, standard deviation (SD), and the number of participants assessed for both the intervention and comparison groups to calculate mean difference (MD) with 95% CI.
Unit of analysis issues
We intended to include studies where postpartum people were randomized individually and also cluster‐randomized studies where, for example, the hospital was the unit of randomization. However, we did not find any relevant cluster‐randomized studies. In future updates of this review, if we identify studies that use a cluster‐randomized design but do not have any information related to the design effect, we will estimate the design effect based on a fairly large assumed intra‐cluster correlation of 0.10. We will base this assumption by analogy on studies about implementation research (Campbell 2000; Ukoumunne 1999).
Dealing with missing data
We did not impute any missing outcome data and we tried to contact the trial authors for missing data.
Assessment of heterogeneity
We assessed heterogeneity by visual inspection of the forest plots. We also assessed statistical heterogeneity in each meta‐analysis using the I² statistic and Chi² test. We regarded heterogeneity as substantial if the I² statistic value was greater than 50%, or there was a low P value (less than 0.10) in the Chi² test for heterogeneity (Deeks 2001).
Assessment of reporting biases
We considered all 16 studies to be at low risk of selective reporting bias, since all relevant outcomes were reported by all included studies.
Data synthesis
We undertook meta‐analysis for all the outcomes where suitable data were available. We described skewed data reported as medians and interquartile ranges narratively.
Using RevMan 5, we performed statistical analyses (RevMan 2014). We used a fixed‐effect model to combine data where it was reasonable to assume that studies were estimating the same underlying treatment effect, that is where studies were examining the same intervention, and we judged the studies' populations and methods to be sufficiently similar. If there was unexplained clinical heterogeneity sufficient to expect that the underlying treatment effects differed between studies, or if we detected substantial statistical heterogeneity, we used a random‐effects meta‐analysis to produce an overall summary, but only where it was possible to derive a meaningful meta‐analysis. For example, population differences (high‐income and low‐ and middle‐income countries), type of IUDs (non‐hormonal IUDs, hormonal IUDs, and any other type of IUD). When we used random‐effects meta‐analysis, we treated the pooled treatment effect as the average range of possible treatment effects, and discussed the clinical implications of treatment effects differing between studies. When we used random‐effects analyses, we presented the results as the pooled treatment effect with 95% CIs, and estimates of the T² and I² statistic (DerSimonian 1986). We prepared a summary of findings table to present the results of meta‐analysis, based on the methods described in the Cochrane Handbook for Systematic Reviews of Interventions (Schünemann 2011). For the data that we were unable to pool for meta‐analysis, we conducted a narrative synthesis of the results.
Subgroup analysis and investigation of heterogeneity
We planned to perform subgroup analyses according to:
-
age of participants (teens (13‐19 years old) versus non‐teens);
-
type of IUDs (non‐hormonal IUDs versus hormonal IUDs); and
-
population differences (high‐income versus low‐ and middle‐income countries, according to World Bank 2020).
We performed subgroup analyses for the primary outcome of rate of insertion at first postpartum visit (six to eight weeks postpartum) to assess:
-
population differences for contraceptive implants, and
-
types of IUDs.
We did not perform subgroup analyses according to age as the number of included studies that would allow this subgroup analysis was limited.
Sensitivity analysis
We performed the following sensitivity analyses in order to determine the impact of the following factors on effect size:
-
repeating the analysis excluding unpublished studies (if any);
-
repeating the analysis excluding trials rated as 'high' or 'unclear' for risk of selection bias.
Summary of findings and assessment of the certainty of the evidence
Two review authors working independently prepared a summary of findings table, and disagreements were resolved by consensus. The following outcomes were reported in the table reporting on contraceptive implants:
-
rate of initiation;
-
utilization rate at six months postpartum;
-
utilization rate at 12 months postpartum;
-
adverse effects of contraceptive implants: prolonged vaginal bleeding within six weeks postpartum;
-
adverse effects other than prolonged vaginal bleeding;
-
unintended pregnancy rate at 12 months postpartum; and
-
any breastfeeding at six months postpartum.
The following outcomes were reported in the table reporting on IUDs:
-
rate of initiation;
-
expulsion by six months postpartum;
-
utilization rate at six months postpartum;
-
utilization rate at 12 months postpartum;
-
unintended pregnancy rate at 12 months postpartum; and
-
any breastfeeding at six months postpartum.
We used the GRADE approach (consideration of study limitations, consistency of effect, imprecision, indirectness and publication bias) to assess the certainty of the evidence (GRADEproGDT 2014). We used methods and recommendations described in Section 8.5 and Chapter 12 of the Cochrane Handbook for Systematic Reviews of Interventions (Higgins 2019). We justified all decisions to downgrade the certainty of evidence, using footnotes.
Results
Description of studies
Results of the search
We identified 4275 references from the combined searches for this updated review. After removing 792 duplicated references, we screened the titles and abstracts of 3483 references and discarded 3429 as it was obvious that they did not meet the inclusion criteria. The 54 references that potentially met the inclusion criteria, included the three studies that had been included in the original review, as well as 13 studies that we excluded because they did not meet the inclusion criteria (see the 'Characteristics of excluded studies' table), 12 ongoing studies (see the 'Characteristics of ongoing studies'), and 13 new studies (26 records) that we included; see the 'Characteristics of included studies' table. We checked the reference lists of the included studies, key textbooks, and systematic reviews for additional relevant references but found no other relevant studies. Figure 1 displays the PRISMA flow diagram.

Study flow diagram
Included studies
Study design and setting
We included 16 RCTs, and presented the details in the Characteristics of included studies table. Two of the trials were multi‐centre studies (Turok 2017; Whitaker 2014), while the others were single‐centre studies. All were conducted in tertiary or university hospitals: 11 in the USA (Bryant 2017; Chen 2010; Dahlke 2011; Gurtcheff 2011; Levi 2015; Ogburn 2013; Phemister 1995; Soon 2018; Stuart 2015; Turok 2017; Whitaker 2014), two in Uganda (Averbach 2017; Lester 2015); and one each in Egypt (Bayoumi 2020), Brazil (Carmo 2017), and Sri Lanka (Dias 2015). Dahlke 2011 and Soon 2018 were pilot studies.
Participants
Most studies included participants aged 18 and above. The five studies that investigated contraceptive implants included 361 people in the intervention groups (immediate postpartum insertion) and 354 people in the control groups (delayed insertion). Only Bryant 2017 focused on postpartum adolescents (aged 14 to 24 years).
The 11 studies that investigated IUDs included 954 people in the intervention groups that received non‐hormonal IUDs or hormonal IUDs immediately postpartum, and 940 people in the comparator groups. Soon 2018 was the only trial that included teenagers (14‐ to 19‐years old).
Details of the inclusion and exclusion criteria for each trial are found in Characteristics of included studies.
Intervention
Five studies reported outcomes pertaining to LNG contraceptive implants (Averbach 2017; Phemister 1995), or etonogestrel‐releasing (ENG) implants (Bryant 2017; Carmo 2017; Gurtcheff 2011), while 11 studies reported outcomes pertaining to IUDs, including five studies of hormonal IUDs (Chen 2010; Dahlke 2011; Soon 2018; Stuart 2015; Turok 2017), and five studies of non‐hormonal IUDs (Bayoumi 2020; Dias 2015; Lester 2015; Ogburn 2013; Whitaker 2014). Levi 2015 included both types of IUD. We included studies where immediate postpartum IUDs were inserted after vaginal or cesarean delivery.
-
Five studies investigated insertion of IUDs after vaginal delivery (Chen 2010; Dahlke 2011; Soon 2018; Stuart 2015; Turok 2017).
-
Four studies investigated insertion of IUDs after cesarean delivery (Bayoumi 2020; Lester 2015; Levi 2015; Whitaker 2014).
-
Ogburn 2013 investigated insertion after either vaginal or cesarean birth.
-
Dias 2015 did not specify the route of delivery.
Primary outcomes
Initiation rate
Contraceptive implants
All five of the included contraceptive implant studies reported the initiation rate. Initiation rates in the delayed groups were measured at four to eight weeks after delivery.
IUDs
All 11 IUD studies reported this outcome. Five studies reported initiation rate of non‐hormonal IUDs (Bayoumi 2020; Dias 2015; Lester 2015; Ogburn 2013; Whitaker 2014), while five studies reported this outcome for hormonal IUDs (Chen 2010; Dahlke 2011; Soon 2018; Stuart 2015; Turok 2017). Levi 2015 included both types of IUDs.
Secondary outcomes
Utilization rate
Contraceptive implants
Four studies reported utilization rate (Averbach 2017; Bryant 2017; Carmo 2017; Gurtcheff 2011), of which three reported rates at six months postpartum (Averbach 2017; Bryant 2017; Gurtcheff 2011), and two at 12 months postpartum (Bryant 2017; Carmo 2017).
IUDs
Seven studies reported utilization rate (Bayoumi 2020; Chen 2010; Dahlke 2011; Lester 2015; Levi 2015; Ogburn 2013; Whitaker 2014), of which five reported rates at six months postpartum (Chen 2010; Dahlke 2011; Lester 2015; Levi 2015; Whitaker 2014), two at 12 months postpartum (Ogburn 2013; Whitaker 2014), and one at both six and 12 months postpartum (Bayoumi 2020).
Adverse effects
Contraceptive implants
Two studies reported mean number of days of prolonged vaginal bleeding within six weeks postpartum (Averbach 2017; Phemister 1995). Three studies reported prolonged vaginal bleeding at three, six, and 12 months postpartum (Averbach 2017; Bryant 2017; Carmo 2017). Only Phemister 1995 reported adverse effects other than vaginal bleeding.
IUDs
No included study reported on adverse effects of IUDs.
Expulsion
IUDs
Eight studies reported expulsion rate of IUDs. Most studies reported the rate at six months (Bayoumi 2020; Chen 2010; Dahlke 2011; Lester 2015; Levi 2015; Stuart 2015; Turok 2017; Whitaker 2014).
Participant satisfaction
Contraceptive implants
Averbach 2017 reported satisfaction rate at six months postpartum and Carmo 2017 reported the rate at 12 months postpartum.
IUDs
Levi 2015 reported satisfaction rate at six months postpartum and Bayoumi 2020 reported the rate at 12 months postpartum.
Breastfeeding
Contraceptive implants
Two studies reported exclusive breastfeeding rates (Averbach 2017; Carmo 2017), and two studies reported any breastfeeding rates at six months (Averbach 2017; Bryant 2017).
LNG‐IUS
Five studies reported breastfeeding rates at six months postpartum (Chen 2010; Dahlke 2011; Levi 2015; Stuart 2015; Turok 2017). Only Chen 2010 reported rates of exclusive breastfeeding.
Unintended pregnancy
Contraceptive implants
Averbach 2017 reported unintended pregnancy rates at six months postpartum and Bryant 2017 reported the rates at 12 months postpartum.
IUDs
Only Bayoumi 2020 reported the rates at 12 months postpartum.
Excluded studies
After assessing the full texts of potentially eligible studies, we excluded 13 studies because of the following main reasons (see the Characteristics of excluded studies table):
-
six studies were not RCTs or CCTs (Bryant 2013; Gariepy 2015; Ireland 2014; Taneepanichkul 2001; Tocce 2012; Wilson 2014);
-
seven studies did not compare immediate postpartum insertion with delayed insertion of LARC (Baldwin 2014; Braga 2015; Brito 2009; Brito 2012; Pentickly 2013; Shabaan 1985; VanDerPas 1980).
Risk of bias in included studies
Figure 2 and Figure 3 summarize the risk of bias items presented as percentages across all included studies.

Risk of bias graph: review authors' judgements about each risk of bias item presented as percentages across all included studies

Risk of bias summary: review authors' judgements about each risk of bias item for each included study
Allocation
Random sequence generation and allocation concealment
Fourteen included studies randomly allocated participants to the comparison groups using adequate methods for sequence generation and allocation concealment (Averbach 2017; Bayoumi 2020; Bryant 2017; Carmo 2017; Chen 2010; Dahlke 2011; Gurtcheff 2011; Lester 2015; Levi 2015; Phemister 1995; Soon 2018; Stuart 2015; Turok 2017; Whitaker 2014). We therefore judged these studies as being at low risk of selection bias. Two studies did not provide enough information about randomization process and we judged these studies to be at unclear risk of bias (Dias 2015; Ogburn 2013)
Blinding
Although the timing of contraceptive implant and IUD insertion could not be blinded, we judged all 16 included studies as being at low risk of performance and detection biases for the primary outcomes, because blinding is unlikely to affect these outcome measures. However, as knowledge of group assignment may affect self‐report of satisfaction and adverse effects, we considered this domain to be at high risk of bias for these outcomes.
Incomplete outcome data
Nine included studies had rates of incomplete outcome data of less than 20% (Averbach 2017; Carmo 2017; Chen 2010; Dahlke 2011; Gurtcheff 2011; Lester 2015; Levi 2015; Phemister 1995; Turok 2017). Thus, we judged all these studies to be at low risk of attrition bias (Figure 3). We judged five studies to be at high risk of attrition bias: two because they had more than 20% of incomplete outcome data in at least one arm (Bayoumi 2020; Bryant 2017), and three because they were stopped early by the Data and Safety Monitoring Board or because of slow recruitment (Soon 2018; Stuart 2015; Whitaker 2014). Two studies did not report loss to follow‐up clearly (Dias 2015; Ogburn 2013), so we deemed these to be at unclear risk of attrition bias.
Selective reporting
The trial investigators of all included studies reported all relevant outcomes for their objectives, so we judged this domain as being at low risk of reporting bias for all included studies.
Other potential sources of bias
We judged six studies to be at unclear risk of bias for other sources of bias for the following reasons:
-
in two studies, the trial investigators excluded people after randomization (Phemister 1995; Turok 2017);
-
in three studies the trial investigators did not state their definitions for prolonged vaginal bleeding, which was an outcome of interest for these contraceptive implants studies (Bryant 2017; Gurtcheff 2011; Phemister 1995); and
-
the two pilot studies were not powered for the outcomes of interest (Dahlke 2011; Soon 2018).
Effects of interventions
See: Summary of findings 1 Immediate compared to delayed postpartum insertion of contraceptive implants for contraception; Summary of findings 2 Immediate compared to delayed postpartum insertion of IUDs for contraception
See summary of findings Table 1.
Primary outcome
Rate of initiation of contraceptive implant
All included studies reported the rate of initiation of contraceptive implants by the first postpartum visit (four to six weeks postpartum in Bryant 2017, Carmo 2017 and Phemister 1995; and four to eight weeks postpartum in Averbach 2017 and Gurtcheff 2011). There was a higher rate of contraceptive implant initiation among people assigned to the immediate insertion group compared with those in the delayed insertion group (risk ratio (RR) 1.48, 95% confidence interval (CI) 1.11 to 1.98; 5 studies, 715 participants; I2 = 95%; moderate‐certainty evidence; Analysis 1.1; Figure 4; summary of findings Table 1). The evidence suggests that if the initiation rate with delayed insertion is assumed to be 63%, the initiation rate with immediate insertion would be between 70% and 100%.

Forest plot of comparison: 1 Immediate versus delayed postpartum insertion of contraceptive implants, outcome: 1.1 Rate of initiation of contraceptive implants
We detected substantial heterogeneity, and, therefore, performed subgroup analysis for HICs versus LMICs, as planned, for this comparison. The test for subgroup differences did not indicate a difference in the effect by the study setting for this comparison (P = 0.82), but this may have been due to the small number of studies available for the comparison (n = 5).
We performed sensitivity analysis and restricted the analysis to the two studies with low risk of bias (Averbach 2017; Carmo 2017). The estimated effect increased slightly, but the confidence interval was wider and contained the null; heterogeneity remained substantial (RR 1.57, 95% CI 0.61 to 4.05; 2 studies, 305 participants; I2 = 98%).
Rate of initiation of IUDs
Immediate insertion of IUDs likely improves the initiation rate compared with delayed insertion (RR 1.27, 95% CI 1.07 to 1.51; 11 studies, 1894 participants; I2 = 98%; moderate‐certainty evidence; Analysis 2.1; Figure 5; summary of findings Table 2). The evidence suggests that the chance of initiation of IUDs with immediate insertion is between 66% and 93%, while the chance of initiation of IUDs with delayed insertion is 61%. We performed a planned subgroup analysis by IUD type. Immediate insertion may improve the initiation rate when compared to delayed insertion for both the non‐hormonal IUDs subgroup (RR 1.38, 95% CI 0.96 to 1.97; 5 studies, 1329 participants; I2= 95%) and the hormonal subgroup (RR 1.11, 95% CI 1.05 to 1.18; 5 studies, 453 participants; I2= 0%). The heterogeneity may be partially explained by the difference in IUD type although it remained substantial (test for subgroup difference: P = 0.005, I2 = 78.7%).

Forest plot of comparison: 1 Immediate versus delayed postpartum insertion of contraceptive implants, outcome: 1.4 Other adverse effects
Findings were not influenced by sensitivity analysis restricting to the three studies with low risk of bias; one hormonal IUDs study (Lester 2015), one LNG‐IUS (Chen 2010), and one mostly hormonal IUDs study (Levi 2015). The estimated effect increased slightly but the confidence interval was wider (RR 1.43,95% CI 1.02 to 2.01; 3 studies, 282 participants; I2 =88%; forest plot not shown).
Secondary outcome: utilization rate
It is unclear whether there was a difference in utilization rates of both contraceptive implants and IUDs at six and 12 months after delivery.
Contraceptive implants
Utilization rate at six months postpartum
We are uncertain whether immediate insertion of contraceptive implants improves utilization rate at six months (RR 1.16, 95% CI 0.9 to 1.5; 3 studies, 330 participants; I2 = 89%; very low certainty evidence; Analysis 1.2; Figure 6; summary of findings Table 1). The evidence suggests that if the utilization rate with delayed insertion is assumed to be 71%, the utilization rate with immediate insertion would be between 64% and 100%.

Forest plot of comparison: 1 Immediate versus delayed postpartum insertion of contraceptive implants, outcome: 1.2 Utilization rate
Utilization rate at 12 months postpartum
We are uncertain whether immediate insertion of contraceptive implants improves utilization rate at 12 months (RR 0.98, 95% CI 0.93 to 1.04; 2 studies, 164 participants; I2 = 0%; very low‐certainty evidence; Analysis 1.2; Figure 6; summary of findings Table 1). The evidence suggests that if the utilization rate with delayed insertion is assumed to be 92%, the utilization rate with immediate insertion would be between 86% and 96%.
Utilization rate at 24 months postpartum
No studies reported this outcome.
IUDs
Utilization rate at six months postpartum
We are uncertain whether immediate postpartum insertion of IUDs improves utilization rate at six months compared with delayed insertion (RR 1.02, 95% CI 0.65 to 1.62; 6 studies, 971 participants; I2 = 96%; very low‐certainty evidence; Analysis 2.2; summary of findings Table 2). This suggests that if the utilization rate at six months with delayed insertion is assumed to be 82%, the utilization rate with immediate insertion would be between 52% and 100%.
Utilization rate at 12 months postpartum
We are uncertain whether immediate insertion improves utilization rate at 12 months (RR 0.86, 95% CI 0.5 to 1.47; 3 studies, 796 participants; I2 = 91%; very low‐certainty evidence; Analysis 2.2; Figure 6; summary of findings Table 2). The evidence suggests that if the utilization rate with delayed insertion is assumed to be 78%, the utilization rate with immediate insertion would be between 39% and 100%.
Utilization rate at 24 months after delivery
No studies reported this outcome.
Secondary outcome: expulsion rate of IUDs
Expulsion rate at six months postpartum
Expulsion rate for IUDs at six months postpartum may be higher with immediate insertion than with delayed insertion (RR 4.55, 95% CI 2.52 to 8.19; 9 studies, 1269 participants; I2 = 31%; low‐certainty evidence; Analysis 2.3; summary of findings Table 2). The evidence suggests that if the expulsion rate with delayed insertion is assumed to be 2%, the rate with immediate insertion would be between 5% and 17%.
Expulsion rate at 12 months postpartum
No studies reported this outcome.
Expulsion rate at 24 months postpartum
No studies reported this outcome.
Secondary outcome: adverse effects
Mean days of vaginal bleeding within six weeks postpartum with contraceptive implants
For contraceptive implants, the duration of prolonged vaginal bleeding among participants in the immediate insertion group may have been longer than for participants in the delayed insertion group (mean difference (MD) 2.98 days, 95% CI ‐2.71 to 8.66; 2 studies, 420 participants; I2 = 91%; low‐certainty evidence; Analysis 1.3; summary of findings Table 1).
Prolonged bleeding at three months postpartum with contraceptive implants
Due to very low‐certainty evidence, we are uncertain whether immediate insertion was associated with a reduction in prolonged bleeding at three months (RR 0.39, 95% CI 0.10 to 1.47; 2 studies, 225 participants; I2 = not applicable; very low‐certainty evidence; Analysis 1.4; Figure 5). This suggests that if the rate of prolonged bleeding with delayed insertion is assumed to be 5%, the rate with immediate insertion would be between 0.5% and 7%.
Prolonged bleeding at six months postpartum with contraceptive implants
Due to very low‐certainty evidence, we are uncertain whether immediate insertion was associated with prolonged bleeding at six months (RR 1.19, 95% CI 0.29 to 4.94; 2 studies, 252 participants; I2 = 0%; very low‐certainty evidence; Analysis 1.4; Figure 5). This suggests that if the rate of prolonged bleeding with delayed insertion is assumed to be 3%, the rate with immediate insertion would be between 0.8% and 14%.
Other vaginal bleeding or associated severe cramping within 12 months postpartum with contraceptive implants
One included study reported the rate of heavy, irregular bleeding, or associated cramping evaluated at 12 months among participants who had immediate insertion compared to participants who had delayed insertion of contraceptive implant (Bryant 2017). It was unclear whether there was any difference between the two groups (RR 1.01, 95% CI 0.72 to 1.44; 1 study, 64 participants; very low‐certainty evidence; Analysis 1.4; Figure 5). The evidence suggests that the risk of having heavy, irregular vaginal bleeding or associated severe cramping within 12 months of immediate insertion was between 48% and 96%, while the risk with delayed insertion was 67%.
Other adverse effects
Phemister 1995 reported that participants in the immediate insertion group experienced a higher rate of other adverse effects including nausea, headache, and acne than reported among participants in the delayed insertion group (RR 2.06; 95% CI 1.38 to 3.06; 1 study, 215 participants; low‐certainty evidence; Analysis 1.4; Figure 5; summary of findings Table 1). This suggests that if the risk of having other adverse effects with delayed insertion is assumed to be 23%, the risk with immediate insertion would be between 32% and 70%.
Secondary outcome: participant satisfaction
Contraceptive implants
Participant satisfaction at six months postpartum
In Averbach 2017, the trial investigators reported an overall high satisfaction rate during the six‐month follow‐up. There was probably little or no difference between the immediate and delayed groups (RR 0.97, 95% CI 0.90 to 1.04; 1 study, 152 participants; very low‐certainty evidence; Analysis 1.5). This suggests that if the rate of satisfaction with delayed insertion is assumed to be 97%, then with immediate insertion, the satisfaction rate would be between 87% and 100%.
Participant satisfaction at 12 months postpartum
One RCT undertaken in Brazil reported on this outcome (Bryant 2017). We are uncertain whether there was any difference in satisfaction rate at 12 months between the groups (RR 1.01, 95% CI 0.77 to 1.31; 1 study, 64 participants; very low‐certainty evidence; Analysis 1.5). This suggests that if the rate of satisfaction with delayed insertion is assumed to be 78%, then for people with the immediate insertion, the satisfaction rate would be between 60% and 100%.
IUDs
Participant satisfaction at six months postpartum
Levi 2015 found that there was little or no difference between immediate and delayed insertion of IUDs for participant satisfaction at six months postpartum (RR 0.93, 95% CI 0.83 to 1.03; 1 study, 69 participants; very low‐certainty evidence; Analysis 2.4). The evidence from this one included trial suggested that participants' satisfaction with immediate insertion was 92% (36/39), and was 100% (30/30) for delayed insertion.
Participant satisfaction at 12 months postpartum
Bayoumi 2020 found that there was little or no difference between immediate and delayed insertion of IUDs (RR 1.05, 95% CI 0.98 to 1.12; 1 study, 598 participants; low‐certainty evidence; Analysis 2.4; summary of findings Table 1). The evidence from the one included trial suggested that participants' satisfaction with immediate insertion was 90% (357/396), and was 86% (174/202) for delayed insertion.
Secondary outcome: unintended pregnancy rates
Contraceptive implants
Unintended pregnancy rates at six months postpartum
Only one included study reported the unintended pregnancy rate at six months postpartum in people who used contraceptive implants (Averbach 2017). No pregnancies occurred during the follow‐up period in the immediate insertion group (0/103), compared to 1% (2/102) in the delayed insertion group. We are uncertain whether there was a difference in unintended pregnancy rates between the groups (RR 0.20, 95% CI 0.01 to 4.08; one study, 205 participants; low‐certainty evidence; Analysis 1.6).
Unintended pregnancy rates at 12 months postpartum
Bryant 2017 reported that the rates of unintended pregnancy within one year of delivery were 13.5% and 7.0% among participants allocated to immediate and delayed insertion groups, respectively. It was unclear whether there was any difference between the groups (RR 1.82, 95% CI 0.38 to 8.71; 1 study, 64 participants; very low‐certainty evidence; Analysis 1.6; summary of findings Table 1).
Unintended pregnancy rates at 24 months postpartum
No studies reported this outcome.
IUDs
Unintended pregnancy rates at six months postpartum
Three studies reported pregnancy rate in people who used IUDs for contraception, however, no pregnancies occurred during the follow‐up period of these studies. We were, therefore, unable to estimate the effect of the intervention for this outcome.
Unintended pregnancy rates at 12 months postpartum
Only one included trial reported the unintended pregnancy rate at 12 months postpartum (Bayoumi 2020). The rates of unintended pregnancy were 4.4% and 16.8% among participants allocated to the immediate and delayed insertion groups, respectively. The rate of unintended pregnancies may have been lower in the immediate insertion group (RR 0.26, 95% CI 0.17 to 0.41; 1 study, 1000 participants; low‐certainty evidence; Analysis 2.5; summary of findings Table 2).
Unintended pregnancy rates at 24 months postpartum
No studies reported this outcome.
Secondary outcome: short interpregnancy interval (defined as pregnancy onset within two years of the previous pregnancy)
No studies reported this outcome.
Secondary outcome: breastfeeding at six months postpartum
Contraceptive implants
Exclusive breast feeding
There was little or no difference between the two groups in exclusive breastfeeding rate between immediate and delayed insertion of contraceptive implants (RR 0.89, 95% CI 0.66 to 1.21; 2 studies, 261 participants; I2 = 27%; low‐certainty evidence; Analysis 1.7). This suggests that if the exclusive breastfeeding rate with delayed insertion is assumed to be 34%, the rate with immediate insertion would be between 23% and 42%.
Any breastfeeding
Averbach 2017, Bryant 2017, and Gurtcheff 2011 reported any breastfeeding rate at six months. Gurtcheff 2011, however, presented Kaplan‐Meier curves to evaluate the impact of immediate postpartum insertion of contraceptive implants on exclusive or any breastfeeding compared to that of delayed postpartum insertion. The rates between the two groups were not significantly different at any time period. However, numerical data for this outcome were insufficient to allow us to determine the relative effect at each time point. Attempts to obtain additional data from the investigators were unsuccessful since the trial authors did not reply to our requests.
There may be little or no difference between the two groups for any breastfeeding (RR 0.97, 95% CI 0.92 to 1.01; 2 studies, 225 participants; I2= 48%; low‐certainty evidence; Analysis 1.7; summary of findings Table 1). The evidence suggested that if the breastfeeding rate with delayed insertion is assumed to be 78%, the rate with immediate insertion would be between 71% and 78%.
Hormonal IUDs
Exclusive breast feeding
Chen 2010 and Turok 2017 reported exclusive breastfeeding rate at six months. There may be little or no difference between the two groups in exclusive breastfeeding rate between immediate and delayed insertion of hormonal IUDs (RR 0.52, 95% CI 0.08 to 3.19; 2 studies, 297 participants; I2 = 68%; low‐certainty evidence; Analysis 2.6). This suggests that if the exclusive breastfeeding rate with delayed insertion is assumed to be 20%, the rate with immediate insertion would be between 2% and 64%.
Any breastfeeding
We are uncertain whether there was any difference in the breastfeeding rate between immediate and delayed insertion of hormonal IUDs (RR 0.90, 95% CI 0.63 to 1.30; 5 studies, 435 participants; I2 = 54%; very low‐certainty evidence; Analysis 2.6; summary of findings Table 2). This suggests that if the rate for any breastfeeding with delayed insertion is assumed to be 47%, the rate with immediate insertion would be between 30% and 61%.
Discussion
Summary of main results
Sixteen studies conducted in five countries from both low‐to‐middle‐income and high‐income settings were included in our analysis. Moderate‐certainty evidence demonstrated that immediate insertion at the first postpartum visit likely increases the rate of initiation of both contraceptive implant and IUDs. However, the certainty of the evidence was very low for estimating the utilization rate at six and 12 months postpartum. It is uncertain whether immediate postpartum insertion has an effect on utilization at these time points. Low‐certainty evidence suggests the immediate insertion of IUDs may be associated with a higher expulsion rate. The mean prolonged vaginal bleeding among people receiving immediate insertion of contraceptive implants was longer than that noted among people receiving delayed insertion, however, this difference is unlikely to be clinically meaningful, as the mean difference in duration of days of bleeding was only three days. Additionally, rates of prolonged bleeding between the two comparison groups were comparable regardless of the severity of bleeding. Because the timing of LARC insertion cannot be blinded, the difference in the rate of self‐reported adverse effects between the immediate and delayed postpartum insertion of contraceptive implant and IUDs remains inconclusive. Based on the limited data available, we are uncertain whether there are any differences between the two groups in terms of participant satisfaction, unintended pregnancy rate at 12 months, and rate of breastfeeding at six months postpartum for both contraceptive implants and IUDs.
Overall completeness and applicability of evidence
This review included 16 RCTs. Of these, five trials evaluated immediate versus delayed postpartum insertion of contraceptive implants for contraception in 715 participants while 11 trials evaluated the IUDs in 1894 participants. The study participants were recruited from four countries, but mainly from the USA. Additionally, the study settings were large hospitals. Only three of the included studies were mainly conducted in low‐ to middle‐income countries (LMICs), which often have low postpartum contraceptive prevalence (UN 2013). Thus, generalization of these findings to LMICs settings should be done with caution since studies in these populations are lacking.
Contraceptive implants
For contraceptive implants, five included studies reported the initiation rate of contraceptive implants by the first postpartum follow‐up visit, which was the primary outcome of this review. For this update, two studies were added, allowing us to perform planned subgroup analysis based on the resource setting. The results, however, did not affect interpretation of the main analysis. Only three included studies reported utilization rate at six months after delivery. Moreover, a limited number of included studies reported adverse effects which meant that only one or two studies could be included in the analysis for each effect. Administration of progestogen‐releasing modes of contraception may be delayed because of concerns about the effect on lactation. Two studies reported data regarding the impact of the insertion time of contraceptive implant on exclusive breastfeeding at six months postpartum (Averbach 2017; Carmo 2017). Three trials reported on the outcome of any breastfeeding, Averbach 2017; Bryant 2017; and Gurtcheff 2011. However, we could not include results from Gurtcheff 2011 in our analysis since the report did not provide data regarding the number of people breastfeeding in each comparison group. More studies focusing on both types of breastfeeding are needed. Data regarding long‐term utilization rate, rate of unintended pregnancies or short‐interval pregnancies, and participant satisfaction were limited as only one or two included studies reported these data.
IUDs
For IUDs, 11 studies assessed our primary objective. Studies of hormonal IUDs were all conducted in the USA, but studies of non‐hormonal IUDs included one each from the USA, Sri Lanka, Egypt, and Uganda. The Levi 2015 study, conducted in the USA, included both types of IUDs. Due to limited number of included studies, we were unable to perform planned subgroup analyses based on the setting (high‐income versus LMICs). However, we performed subgroup analyses based on the type of IUDs (non‐hormonal IUDs versus hormonal IUDs). The result showed that immediate insertion seems to have a beneficial effect on utilization at the first follow‐up visit regardless of the type of IUD. The expulsion rate at six months postpartum was reported by eight included studies. A higher expulsion rate was observed in the immediate insertion group with low heterogeneity. Three studies reported on the unintended pregnancy rate at six months postpartum, but the effect of the intervention could not be estimated as there were no unintended pregnancies in either group. The unintended pregnancy rate at 12 months postpartum seemed to be lower in the immediate insertion group according to one included study.
Insertion of hormonal IUDs may be delayed because of concerns about the effect on lactation. Five included studies did provide data on lactation with hormonal IUDs use. The exclusive breastfeeding rates, however, were addressed by only two included studies.
Quality of the evidence
Although it was not possible to blind the timing of the intervention, blinding was unlikely to affect the rate of initiation and utilization rate of contraceptive implant or IUDs. However, the awareness of the intervention assigned may have affected self‐reporting of treatment‐related adverse effects, thus indicating a high risk of performance and assessment biases for this outcome measures. This compromises the internal validity of the included studies when determining self‐reported subjective outcomes, such as adverse effects and participant satisfaction. The higher risk of adverse effects among people who received an immediate postpartum insertion versus those who received a delayed insertion should be viewed cautiously. It is not known whether this was due to participants knowing which intervention had been administered, or the timing of the insertion itself. We extracted data regarding participant satisfaction and unintended pregnancies from a single study for each outcome for both contraceptive implants and IUDs. Most of the studies that provided data for the analysis regarding breastfeeding were secondary analyses which may have had insufficient power.
We determined the certainty of evidence using the GRADE approach for each outcome. We downgraded the certainty of the evidence to moderate certainty for rate of initiation of contraceptive implants and IUDs. We downgraded the evidence to low‐ or very low‐certainty for the utilization rate, prolonged vaginal bleeding, adverse effects other than vaginal bleeding, participant satisfaction, rates of unintended pregnancy, and breastfeeding at six months (see summary of findings Table 1; summary of findings Table 2).
Thus, the certainty of the evidence ranged from moderate to very low. The main limitations were imprecision, inconsistency, and risk of bias (related to lack of blinding and to attrition). There is substantial heterogeneity of the pooled effect estimate of the primary outcome, which can be accounted for in part by differences in study populations and types of IUDs.
Potential biases in the review process
With assistance from the Information Specialist of the Cochrane Fertility Regulation Group, we made every attempt to include all potentially relevant studies through a thorough search of the standard databases, grey literature, conference proceedings, and ongoing trials. However, since we were only able to include, at most, nine studies for each outcome, we cannot exclude the possibility of publication bias.
None of the review authors has any links to pharmaceutical companies or a financial interest in the prescription of the drugs under assessment. One of the review authors, SA, is an author of two included studies (Averbach 2017; Lester 2015). However, she was not involved in the selection process or judgements about risk of bias for these studies. We followed Cochrane guidelines to extract data and assess the certainty and potential risks of different types of biases in all included studies. Thus, there were no issues related to conflicts of interests in this review.
Agreements and disagreements with other studies or reviews
To date, there are no other systematic reviews that compare immediate versus delayed postpartum insertion of contraceptive implants. For IUDs, a Cochrane Review that assessed the effectiveness of immediate postplacental (within 10 minutes of placenta delivery) insertion of IUDs for contraception compared to early postpartum insertion (after 10 minutes to 48 hours) and the standard insertion (during the postpartum visit) demonstrated that there was no significant difference in the rates of IUD use among people who received an immediate insertion compared to those who received an early postpartum insertion (odds ratio (OR) 0.46, 95% CI 0.04 to 5.75) (Lopez 2015). In this updated review, however, immediate insertion was associated with a slight increase in the rate of initiation by the first postpartum visit compared to delayed insertion for both contraceptive implants and IUDs (RR 1.48; 95% CI 1.11 to 1.98 and RR 1.27; 95% CI 1.07 to 1.51, respectively).
In the previous version of this review, IUD use at six months was more likely with immediate insertion than with delayed insertion (OR 2.04, 95% CI 1.01 to 4.09) (Lopez 2015), but in this update, the meta‐analysis revealed little to no difference in the rate of both contraceptive implant and IUD utilization among people assigned to receive immediate insertion compared with delayed insertion at six and 12 months after delivery. For IUDs, the higher expulsion rate in the immediate insertion group may contribute to this similar rate of continuation, despite higher initiation (RR 4.55; 95% CI 2.52 to 8.19). Immediate postpartum insertion of IUDs can be subcategorized as immediate postplacental (within 10 minutes of placenta delivery) or early postpartum insertion (10 minutes to hospital discharge). This difference makes it challenging to make comparisons across studies. A recent systematic review also suggested that immediate and early postpartum IUD placement was associated with increased risk of expulsion compared with interval placements (adjusted RR 8.33; 95% CI 4.32 to 16.08 and adjusted RR 5.27; 95% CI 2.56 to 10.85, respectively) (Averbach 2017). A preliminary result from a recent large Food and Drugs Agency (FDA)‐mandated retrospective cohort multi‐center study utilizing Kaiser Permanente's observational clinical data also found the highest risk of expulsion occurred with immediate postpartum insertion (0 to 3 days postpartum) compared to insertion after 52 weeks or more postpartum or with no evidence of delivery (adjusted hazard ratio 5.34, 95% CI 4.47 to 6.39) (Reed 2020).
For contraceptive implants, the inability to blind the timing of the intervention assignment in the included studies in this review precluded a reliable assessment of the difference in the rate of self‐reported adverse effects between the immediate and delayed postpartum insertion of contraceptive implants. A two‐year observational study conducted in the USA with 414 people showed no difference in removal rate due to prolonged vaginal bleeding among people who received immediate and delayed postpartum insertion of contraceptive implants (19.3% versus 18.4%, respectively) (Ireland 2014). In a prospective cohort from Thailand that evaluated the safety of immediate postpartum insertion of contraceptive implants among 88 asymptomatic, HIV type‐1 positive people, 62.5% of participants who had immediate insertion reported having irregular bleeding at six months, which appeared to be comparable to people who received a standard insertion (Taneepanichkul 2001). Likewise, our review demonstrated that the prolonged vaginal bleeding among people in the immediate insertion group was comparable to that noted among people who received delayed insertion of contraceptive implants (mean difference (MD) 2.98 days; 95% CI ‐2.71 to 7.81; 2 studies, 420 participants). Although immediate insertion has higher initiation and does not appear to be associated with prolonged bleeding, the continuation rate did not differ according to placement timing. Greater numbers of adverse effects other than vaginal bleeding observed by Phemister 1995 may explain this finding.
Lopez 2015 reported no difference in pregnancy rate between immediate postplacental and standard insertion, which is consistent with the results of this review for both contraceptive implant and IUDs. However, the number of studies assessing pregnancy are limited, which means we also lack important information about the effect of immediate postpartum insertion of LARC on pregnancy. For instance, conditions such as lactational amenorrhea were not adequately measured and reported. Moreover, the rate of unintended pregnancy differs between populations on the basis of age and sexual activity. Further prospective data are needed to enable us to understand the association between immediate initiation of LARC methods and subsequent risk of unintended and short interval pregnancies better.
As the postpartum decrease in the progesterone level is supposed to trigger the onset of lactogenesis, theoretically, immediate postpartum administration of progestin contraception could have a negative impact on initiation of breastfeeding. However, we found that rates of exclusive and any breastfeeding in this review were similar between the groups at six months. A previous systematic review was also unable to identify a detrimental effect of progestin‐only contraception on breastfeeding (Phillips 2016).
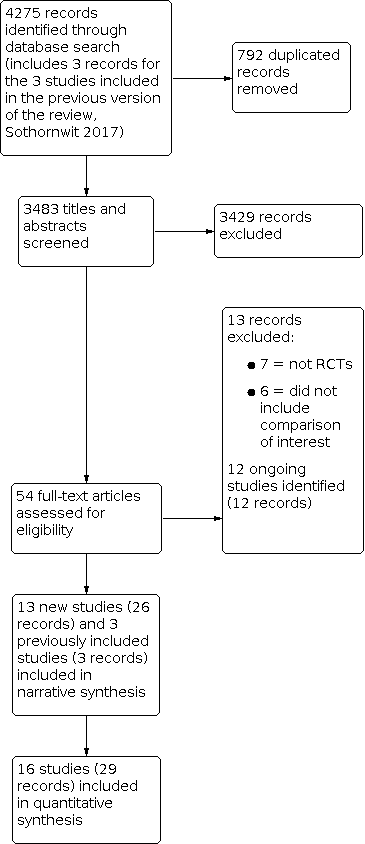
Study flow diagram

Risk of bias graph: review authors' judgements about each risk of bias item presented as percentages across all included studies

Risk of bias summary: review authors' judgements about each risk of bias item for each included study

Forest plot of comparison: 1 Immediate versus delayed postpartum insertion of contraceptive implants, outcome: 1.1 Rate of initiation of contraceptive implants

Forest plot of comparison: 1 Immediate versus delayed postpartum insertion of contraceptive implants, outcome: 1.4 Other adverse effects

Forest plot of comparison: 1 Immediate versus delayed postpartum insertion of contraceptive implants, outcome: 1.2 Utilization rate

Comparison 1: Immediate versus delayed postpartum insertion of contraceptive implants, Outcome 1: Rate of initiation of contraceptive implants

Comparison 1: Immediate versus delayed postpartum insertion of contraceptive implants, Outcome 2: Utilization rate

Comparison 1: Immediate versus delayed postpartum insertion of contraceptive implants, Outcome 3: Adverse effect: mean days of duration of vaginal bleeding

Comparison 1: Immediate versus delayed postpartum insertion of contraceptive implants, Outcome 4: Other adverse effects

Comparison 1: Immediate versus delayed postpartum insertion of contraceptive implants, Outcome 5: Participant satisfaction

Comparison 1: Immediate versus delayed postpartum insertion of contraceptive implants, Outcome 6: Unintended pregnancy rate

Comparison 1: Immediate versus delayed postpartum insertion of contraceptive implants, Outcome 7: Breastfeeding at 6 months postpartum

Comparison 2: Immediate versus delayed postpartum insertion of IUDs, Outcome 1: Rate of initiation of IUDs

Comparison 2: Immediate versus delayed postpartum insertion of IUDs, Outcome 2: Utilization rate

Comparison 2: Immediate versus delayed postpartum insertion of IUDs, Outcome 3: Expulsion

Comparison 2: Immediate versus delayed postpartum insertion of IUDs, Outcome 4: Participant satisfaction

Comparison 2: Immediate versus delayed postpartum insertion of IUDs, Outcome 5: Unintended pregnancy rate

Comparison 2: Immediate versus delayed postpartum insertion of IUDs, Outcome 6: Breastfeeding (LNG‐IUS)
| Immediate compared to delayed postpartum insertion of contraceptive implants for contraception | ||||||
| Participant or population: postpartum people who desire a contraceptive implant for contraception Settings: tertiary hospitals Intervention: immediate postpartum insertion Comparison: delayed insertion | ||||||
| Outcomes | Anticipated absolute effects* (95% CI) | Relative effect | № of participants | Certainty of the evidence | Comments | |
|---|---|---|---|---|---|---|
| Risk with delayed postpartum insertion of contraceptive implants | Risk with immediate postpartum insertion of contraceptive implants | |||||
| Rate of initiation of contraceptive implants | Study population | RR 1.48 | 715 | ⊕⊕⊕⊝ | ||
| 633 per 1000 | 936 per 1000 | |||||
| Utilization rate at 6 months postpartum | Study population | RR 1.16 | 330 | ⊕⊝⊝⊝ | ||
| 712 per 1000 | 826 per 1000 | |||||
| Utilization rate at 12 months postpartum | Study population | RR 0.98 | 164 | ⊕⊝⊝⊝ | ||
| 922 per 1000 | 904 per 1000 | |||||
| Adverse effect: mean days of prolonged vaginal bleeding within 6 weeks postpartum | Mean 17.8 days | MD 2.98 higher | MD 2.98 (2.71 to 8.66) | 420 | ⊕⊕⊝⊝ | |
| Adverse effects other than prolonged vaginal bleeding | Study population | RR 2.06 | 215 | ⊕⊕⊝⊝ | ||
| 229 per 1000 | 472 per 1000 | |||||
| Unintended pregnancy rate at 12 months postpartum | Study population | RR 1.82 | 64 | ⊕⊝⊝⊝ | ||
| 74 per 1000 | 135 per 1000 | |||||
| Any breastfeeding at six months postpartum | Study population | RR 0.97 | 225 | ⊕⊕⊝⊝ | ||
| 775 per 1000 | 751 per 1000 | |||||
| *The risk in the intervention group (and its 95% confidence interval) is based on the assumed risk in the comparison group and the relative effect of the intervention (and its 95% CI). | ||||||
| GRADE Working Group grades of evidence | ||||||
| 1Downgraded by one level owing to inconsistency across studies (I2 > 50%). 2Downgraded by one level owing to serious imprecision (e.g. 95% CI includes both appreciable appreciable benefit and harm, or because of low number of participants (total number of participants < 400)) 3Downgraded by one level owing to serious imprecision (low number of events (total number of events < 300)). 4Downgraded by one level owing to serious risk of attrition bias. 5Downgraded by one level owing to serious risk of assessment bias. | ||||||
| Immediate compared to delayed postpartum insertion of IUDs for contraception | ||||||
| Patient or population: postpartum people who desire IUDs for contraception | ||||||
| Outcomes | Anticipated absolute effects* (95% CI) | Relative effect | № of participants | Certainty of the evidence | Comments | |
|---|---|---|---|---|---|---|
| Risk with delayed postpartum insertion of IUD | Risk with immediate insertion of IUD | |||||
| Rate of initiation of IUDs | Study population | RR 1.27 | 1894 | ⊕⊕⊕⊝ | ||
| 614 per 1000 | 780 per 1000 | |||||
| Expulsion by 6 months | Study population | RR 4.55 | 1206 | ⊕⊕⊝⊝ | ||
| 21 per 1000 | 94 per 1000 | |||||
| Utilization rate at 6 months postpartum | Study population | RR 1.02 | 971 | ⊕⊝⊝⊝ | ||
| 822 per 1000 | 838 per 1000 | |||||
| Utilization rate at 12 months postpartum | Study population | RR 0.86 | 796 | ⊕⊝⊝⊝ | ||
| 781 per 1000 | 672 per 1000 | |||||
| Unintended pregnancy at 12 months postpartum | Study population | RR 0.26 | 1000 | ⊕⊕⊝⊝ | ||
| 168 per 1000 | 44 per 1000 | |||||
| Any breastfeeding at 6 months (hormonal IUD) | Study population | RR 0.90 | 435 | ⊕⊝⊝⊝ | ||
| 468 per 1000 | 421 per 1000 | |||||
| *The risk in the intervention group (and its 95% confidence interval) is based on the assumed risk in the comparison group and the relative effect of the intervention (and its 95% CI). | ||||||
| GRADE Working Group grades of evidence | ||||||
| 1Downgraded by one level owing to inconsistency across studies (I2 > 50%). 2Downgraded by one level owing to serious imprecision (low number of events (total number of events < 300)). 3Downgraded by one level owing to serious risk of attrition bias. 4Downgraded by one level owing to serious imprecision (e.g. 95% CI includes both appreciable appreciable benefit and harm, or because of low number of participants (total number of participants < 400)). 5Downgraded by one level owing to serious risk of assessment bias. | ||||||
| Outcome or subgroup title | No. of studies | No. of participants | Statistical method | Effect size |
| 1.1 Rate of initiation of contraceptive implants Show forest plot | 5 | 715 | Risk Ratio (IV, Random, 95% CI) | 1.48 [1.11, 1.98] |
| 1.1.1 High‐income countries | 3 | 410 | Risk Ratio (IV, Random, 95% CI) | 1.41 [1.28, 1.55] |
| 1.1.2 Middle‐ to low‐income countries | 2 | 305 | Risk Ratio (IV, Random, 95% CI) | 1.57 [0.61, 4.05] |
| 1.2 Utilization rate Show forest plot | 4 | Risk Ratio (IV, Random, 95% CI) | Subtotals only | |
| 1.2.1 At 6 months postpartum | 3 | 330 | Risk Ratio (IV, Random, 95% CI) | 1.16 [0.90, 1.50] |
| 1.2.2 At 12 months postpartum | 2 | 164 | Risk Ratio (IV, Random, 95% CI) | 0.98 [0.93, 1.04] |
| 1.3 Adverse effect: mean days of duration of vaginal bleeding Show forest plot | 2 | Mean Difference (IV, Random, 95% CI) | Subtotals only | |
| 1.3.1 Mean days of prolonged vaginal bleeding within 6 weeks postpartum | 2 | 420 | Mean Difference (IV, Random, 95% CI) | 2.98 [‐2.71, 8.66] |
| 1.4 Other adverse effects Show forest plot | 4 | Risk Ratio (M‐H, Fixed, 95% CI) | Subtotals only | |
| 1.4.1 Prolonged bleeding at 3 months postpartum | 2 | 225 | Risk Ratio (M‐H, Fixed, 95% CI) | 0.39 [0.10, 1.47] |
| 1.4.2 Prolonged bleeding at 6 months postpartum | 2 | 252 | Risk Ratio (M‐H, Fixed, 95% CI) | 1.19 [0.29, 4.94] |
| 1.4.3 Other vaginal bleeding or associated severe cramping within 12 months | 1 | 64 | Risk Ratio (M‐H, Fixed, 95% CI) | 1.01 [0.72, 1.44] |
| 1.4.4 Adverse effects other than prolonged vaginal bleeding | 1 | 215 | Risk Ratio (M‐H, Fixed, 95% CI) | 2.06 [1.38, 3.06] |
| 1.5 Participant satisfaction Show forest plot | 2 | Risk Ratio (IV, Fixed, 95% CI) | Subtotals only | |
| 1.5.1 At 6 months postpartum | 1 | 152 | Risk Ratio (IV, Fixed, 95% CI) | 0.97 [0.90, 1.04] |
| 1.5.2 At 12 months postpartum | 1 | 64 | Risk Ratio (IV, Fixed, 95% CI) | 1.01 [0.77, 1.31] |
| 1.6 Unintended pregnancy rate Show forest plot | 2 | Risk Ratio (M‐H, Fixed, 95% CI) | Subtotals only | |
| 1.6.1 At 6 months postpartum | 1 | 205 | Risk Ratio (M‐H, Fixed, 95% CI) | 0.20 [0.01, 4.08] |
| 1.6.2 At 12 months postpartum | 1 | 64 | Risk Ratio (M‐H, Fixed, 95% CI) | 1.82 [0.38, 8.71] |
| 1.7 Breastfeeding at 6 months postpartum Show forest plot | 3 | Risk Ratio (IV, Fixed, 95% CI) | Subtotals only | |
| 1.7.1 Exclusive breastfeeding | 2 | 261 | Risk Ratio (IV, Fixed, 95% CI) | 0.89 [0.66, 1.21] |
| 1.7.2 Any breastfeeding | 2 | 225 | Risk Ratio (IV, Fixed, 95% CI) | 0.97 [0.92, 1.01] |
| Outcome or subgroup title | No. of studies | No. of participants | Statistical method | Effect size |
| 2.1 Rate of initiation of IUDs Show forest plot | 11 | 1894 | Risk Ratio (IV, Random, 95% CI) | 1.27 [1.07, 1.51] |
| 2.1.1 Copper IUDs | 5 | 1329 | Risk Ratio (IV, Random, 95% CI) | 1.38 [0.96, 1.97] |
| 2.1.2 Levonorgestrel IUDs | 5 | 453 | Risk Ratio (IV, Random, 95% CI) | 1.11 [1.05, 1.18] |
| 2.1.3 Any types of IUDs | 1 | 112 | Risk Ratio (IV, Random, 95% CI) | 1.56 [1.25, 1.94] |
| 2.2 Utilization rate Show forest plot | 7 | Risk Ratio (IV, Random, 95% CI) | Subtotals only | |
| 2.2.1 At 6 months postpartum | 6 | 971 | Risk Ratio (IV, Random, 95% CI) | 1.02 [0.65, 1.62] |
| 2.2.2 At 12 months postpartum | 3 | 796 | Risk Ratio (IV, Random, 95% CI) | 0.86 [0.50, 1.47] |
| 2.3 Expulsion Show forest plot | 8 | Risk Ratio (M‐H, Fixed, 95% CI) | Subtotals only | |
| 2.3.1 Expulsion by 6 months postpartum | 8 | 1206 | Risk Ratio (M‐H, Fixed, 95% CI) | 4.55 [2.52, 8.19] |
| 2.4 Participant satisfaction Show forest plot | 2 | Risk Ratio (IV, Fixed, 95% CI) | Subtotals only | |
| 2.4.1 At 6 months postpartum | 1 | 69 | Risk Ratio (IV, Fixed, 95% CI) | 0.93 [0.83, 1.03] |
| 2.4.2 At 12 months postpartum | 1 | 598 | Risk Ratio (IV, Fixed, 95% CI) | 1.05 [0.98, 1.12] |
| 2.5 Unintended pregnancy rate Show forest plot | 4 | Risk Ratio (M‐H, Fixed, 95% CI) | Subtotals only | |
| 2.5.1 at 6 months postpartum | 3 | 268 | Risk Ratio (M‐H, Fixed, 95% CI) | Not estimable |
| 2.5.2 at 12 months postpartum | 1 | 1000 | Risk Ratio (M‐H, Fixed, 95% CI) | 0.26 [0.17, 0.41] |
| 2.6 Breastfeeding (LNG‐IUS) Show forest plot | 5 | Risk Ratio (M‐H, Random, 95% CI) | Subtotals only | |
| 2.6.1 Exclusive breastfeeding at 6 months | 2 | 297 | Risk Ratio (M‐H, Random, 95% CI) | 0.52 [0.08, 3.19] |
| 2.6.2 Any breastfeeding at 6 months | 5 | 435 | Risk Ratio (M‐H, Random, 95% CI) | 0.90 [0.63, 1.30] |