Terapia familiar para los trastornos del espectro autista
Información
- DOI:
- https://doi.org/10.1002/14651858.CD011894.pub2Copiar DOI

- Base de datos:
-
- Cochrane Database of Systematic Reviews
- Versión publicada:
-
- 16 mayo 2017see what's new
- Tipo:
-
- Intervention
- Etapa:
-
- Review
- Grupo Editorial Cochrane:
-
Grupo Cochrane de Problemas de desarrollo, psicosociales y de aprendizaje
- Copyright:
-
- Copyright © 2017 The Cochrane Collaboration. Published by John Wiley & Sons, Ltd.
Cifras del artículo
Altmetric:
Citado por:
Autores
Contributions of authors
Debbie Spain: review of proposal; design and preparation of the protocol; contributed to screening of abstracts and studies, initiating requests for further information from researchers who had undertaken potentially relevant studies, and preparation of the review.
Jacqueline Sin: design and preparation of the protocol; contributed to screening of abstracts and studies, and preparation of the review.
Eleni Paliokosta: design and preparation of the protocol; contributed to screening of abstracts and studies, and preparation of the review.
Marie Furuta: design and preparation of the protocol; provided statistical advice and preparation of the review.
Jonathan E Prunty: preparation of the protocol; and preparation of the review.
Trudie Chalder: preparation of the protocol; and preparation of the review.
Declan G Murphy: preparation of the protocol; and preparation of the review.
Francesca G Happé: preparation of the protocol; and preparation of the review.
Debbie Spain holds overall responsibility for the review.
Sources of support
Internal sources
-
King's College London, UK.
DS, JS, TC, DGM, FGH receive a salary from King's College London.
-
Kyoto University, Japan.
MF receives a salary from Kyoto University.
-
Tavistock and Portman National Health Service (NHS) Foundation Trust, UK.
EP receives a salary from Tavistock and Portman NHS Foundation Trust.
-
South London and Maudsley (SLaM) NHS Foundation Trust, UK.
DS, TC, and DGM undertake clinical work at SLaM.
External sources
-
National Institute for Health Research (NIHR), UK.
Financial support for DS and JS. The review presents independent research funded by the NIHR. The views expressed are those of the authors and not necessarily those of the NHS, the NIHR, or the Department of Health.
-
NIHR Biomedical Research Centre (BRC) at South London and Maudsley NHS Foundation Trust and Institute of Psychiatry, Psychology & Neuroscience at King's College London, UK.
Partial financial support for TC and DGM.
-
Dr Mortimer and Theresa Sackler Foundation, Other.
Partial financial support for DGM.
-
NIHR Biomedical Research Centre, based at Guy's & St Thomas' NHS Foundation Trust and King's College London, UK.
JS was supported with funded research sessions.
Declarations of interest
Debbie Spain and her institute have received funds from a National Institute for Health Research (NIHR) Clinical Doctoral Research Fellowship (CDRF‐2012‐03‐059, 2013 to 2018).
Jacqueline Sin's institute received funds from a NIHR Doctoral Research Fellowship (2012 to 2014), for a NIHR Post‐Doctoral Fellowship (2016 onward), and a clinical lectureship (NIHR BRC (Biomedical Research Centre)) based at Guy’s and St Thomas’s NHS Foundation Trust and King’s College London (2015 to 2017).
Eleni Paliokosta – none known.
Marie Furuta – none known.
Jonathan E Prunty – none known.
Trudie Chalder is the named supervisor on the NIHR PhD Fellowship for Debbie Spain. She has received payment for workshops held for clinicians on chronic fatigue syndrome (CFS) and receives royalties for self‐help books on CFS. She has received payment for travel, accommodation and meeting expenses to attend conferences related to cognitive‐behavioural psychotherapy.
Declan G Murphy – none known.
Francesca G Happé (FGH) holds positions related to her autism research for which she is not paid but which involve travel to meetings for which she is reimbursed. She also received royalties on books and chapters, and occasional honoraria for writing or presenting, but these support her autism research in general and do not conflict with, or influence, her impartial involvement in the current review. FGH supervises Debbie Spain's PhD, and her institution receives a grant from the NIHR to do so. FGH is the president and board member of the International Society for Autism Research and cofounder of the Forum for Neuroscience and Special Education. FGH's institution has received fees for her membership of the Methusalem grant review panel. Her institution has received grants from the UK Medical Research Council for a population‐based twin study of autism spectrum disorders: genetic and environmental sources of cognitive and clinical heterogeneity; from the Baily Thomas Fund for work on the transition to young adulthood in autism spectrum disorder: mental health and well‐being in a population‐based sample of twins; the Wellcome Trust for work on glutamate and gamma‐Aminobutyric acid (GABA) in adults with autism: an in vivo study using magnetic resonance spectroscopy; and has grants pending from the Economic and Social Research Council for a topic not relevant to this review. FGH's institution has received honorarium from the British Academy for a lecture she carried out in 2014 and honorarium from the Journal of Child Psychiatry and Psychology for an invited annual review article. FGH receives royalties for the publications 'Autism and Talent' and 'Autism and Other Neurodevelopmental Disorders Affecting Cognition'. She has received travel, accommodation and meeting expenses from the British Psychological Society, Simons Foundation, and the University of Leuven.
Acknowledgements
We would like to thank the Cochrane Developmental, Psychosocial and Learning Problems editorial staff, in particular Geraldine Macdonald, Joanne Wilson and Margaret Anderson; the reviewers; and Johanna McMahon for support with review administration.
Version history
| Published | Title | Stage | Authors | Version |
| 2017 May 16 | Family therapy for autism spectrum disorders | Review | Debbie Spain, Jacqueline Sin, Eleni Paliokosta, Marie Furuta, Jonathan E Prunty, Trudie Chalder, Declan G Murphy, Francesca G Happé | |
| 2015 Oct 11 | Family therapy for autism spectrum disorders | Protocol | Debbie Spain, Jacqueline Sin, Eleni Paliokosta, Marie Furuta, Trudie Chalder, Declan G Murphy, Francesca G Happé | |
Differences between protocol and review
We did not produce a 'Summary of findings' table(s), as planned, as no studies were included in this review.
Keywords
MeSH
Medical Subject Headings (MeSH) Keywords
Medical Subject Headings Check Words
Adolescent; Adult; Child; Humans;
PICO
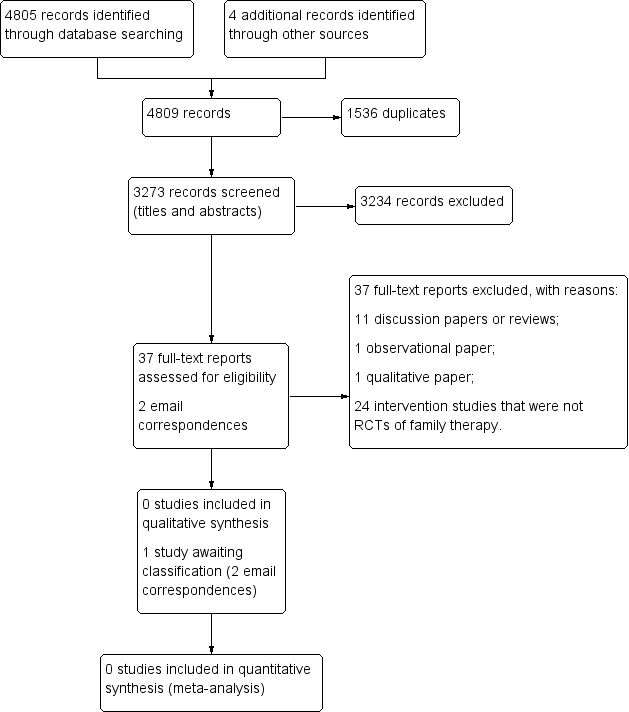
Study flow diagram.
| Unused methods | Description of methods |
| Data extraction and management | The data extraction form will include subheadings relating to the following areas.
We will attempt to separate the outcomes and results between sites for any multi‐centre studies. In the event that data described appear ambiguous for any of the reports, we will contact the authors for clarification. If we are unable to liaise with report authors, we will document this within the review, and the review team will discuss the discrepancies. For any non‐English language studies, we will endeavour to arrange for report translation. |
| Assessment of risk of bias in included studies | DS and JS will independently assess the risk of bias of all included studies across seven domains: random sequence generation; allocation concealment; blinding of participants and trial staff; blinding of outcome assessments; incomplete outcome data; selective outcome reporting; and any other potential sources of bias. For each included study, we will assign each of these domains one of three ratings: high risk of bias, low risk of bias, or unclear risk of bias. We have detailed criteria for rating various domains of bias below, with examples drawn from Chapter 8.5 of the Cochrane Handbook for Systematic Reviews of Interventions (Higgins 2011a). Random sequence generation
Allocation concealment
Blinding of participants and research personnel
Blinding of outcome assessment
Incomplete outcome data
Selective reporting
Other sources of bias
We will obtain a third opinion from EP, MF or FH should there be disagreement about the 'Risk of bias' assessment or a lack of consensus about any of the individual domains per study or in terms of the overall appraisal of the trial. We will also attempt to contact report authors to provide clarification about aspects of the trial, as needed. |
| 'Summary of findings' tables | We will import data from Review Manager (Review Manager 2014), into GRADEprofiler (GRADEpro GDT), and use this software to create 'Summary of findings' tables. These tables will provide outcome‐specific information concerning the overall quality of the body of evidence from the studies included in the comparison, the magnitude of effect of the interventions examined, and the sum of available data on outcomes rated as relevant to patient care and decision making. We will include the following outcomes in the 'Summary of findings' tables.
|
| Measures of treatment effect | Dichotomous data For dichotomous outcomes, such as the presence or absence of challenging behaviour(s), we will use the Mantel‐Haenszel method for computing the pooled risk ratio (RR) (Mantel 1959). We will use the RR in meta‐analyses, rather than the odds ratio (OR), because the OR can be susceptible to misinterpretation, which can lead to overestimation of the benefits and harms of the intervention (Deeks 2011, Section 9.4.4.4). We will report the RR with 95% CIs. Continuous data When different measures are used, we will calculate the standardised mean difference and 95% CI. We will calculate the mean difference and 95% CI when all outcomes are measured using the same scale in the same way. |
| Unit of analysis issues | Cluster trials In cluster trials, the independence of individuals cannot be assumed (Higgins 2011b). As we are examining the effectiveness of an intervention for both individuals and family members, we may identify cluster‐randomised trials. If clustering has been incorporated into the analyses of primary studies, we plan to present these data as if from a non‐cluster‐randomised study, but adjust for the clustering effect. We will contact study authors for more information if needed. If we identify cluster trials that have been analysed using incorrect statistical methods (i.e. not taking the clustering into account), we will contact study authors to request individual participant data so that we may calculate an estimate of the intracluster correlation coefficient (ICC). If we are unable to obtain this information, we will adjust sample sizes using an estimate of the ICC from the trial or from a trial of a similar population, with advice from a statistician, and use this to re‐analyse the data. In the event that we are unable to adjust for incorrect statistical methods used by the cluster trials, and therefore cannot estimate the ICC with any a degree of confidence, we will exclude the trial (Higgins 2011b). We will investigate the robustness of our results by conducting sensitivity analyses, for example, to explore the impact of different types of cluster‐randomisation units (such as families, health practitioners) (Higgins 2011b). We will also compare the results with and without cluster trials that have not been analysed correctly by the trialists (where the ICC is estimated from other trials for the adjustment of cluster effect) (see Sensitivity analysis). Cross‐over trials Due to the issue of carry‐over, that is, whereby the effectiveness of a second intervention may be mediated by the first intervention, we will exclude cross‐over trials. Multiple comparisons Where a trial involves more than two treatment (or comparator) arms, we will first assess which intervention (or comparator) groups are relevant to our review. We will use data from the arms of the trial that are relevant to the review objectives, but present all intervention groups in the 'Characteristics of included studies' tables, providing a detailed description of why we have selected particular groups and excluded others. In the event that studies have more than two intervention groups and a control group that are relevant to the review, we will split the control group data proportionately to the other two groups. Repeated measures When a trial reports outcome data obtained at more than one time point, we will conduct analyses separately for each time point (e.g. postintervention and at follow‐up, if follow‐up is specified by the trialist). |
| Dealing with missing data | We will consider the possible impact of missing data on the results of the review. Data may be missing either because (1) they have been insufficiently or inadequately reported, or (2) due to dropout or attrition. In the event of insufficient or inadequate reporting, we will first try to obtain any missing data from the trial authors, including unreported data (e.g. group means and SDs), details of dropouts, and interventions provided. We will describe the missing data in the 'Risk of bias' table. In either case outlined above, and when we cannot obtain data, we will conduct analyses using ITT principles. For dichotomous outcomes (those not deemed to be missing at random), we will impute the outcomes for the missing participants using both the most optimistic (i.e. assuming participants with missing data improve) and the most pessimistic (i.e. assuming participants with missing data deteriorate) scenarios. When data are missing for continuous outcomes (e.g. data pertaining to means or SD), we will attempt to calculate them based on the standard errors, CIs, and t values, according to the rules described in the Cochrane Handbook for Systematic Reviews of Interventions (Higgins 2011c). If this information is missing, and we are unable to obtain it from trial authors, we will report it as missing data in the review. We will also conduct a sensitivity analysis to compare the results from the ITT analysis with the imputation and ‘available case’ analysis (see Sensitivity analysis). If these analyses yield similar results in terms of the effects of treatment, we will present the results of the available case analyses. |
| Assessment of heterogeneity | Within each comparison, we will first assess clinical heterogeneity (e.g. variability in active and comparator interventions, participant characteristics, or outcome measures used) and methodological heterogeneity (e.g. variability in study design, including differences in the nature of the randomisation unit and the size of cluster randomised; and risk of bias, which we will assess according to the criteria outlined in the Cochrane Handbook for Systematic Reviews of Interventions (Deeks 2011)). If there is clinical or methodological heterogeneity, we will extract and document all of these characteristics onto the data extraction form and synthesise the results narratively. We will then assess statistical heterogeneity using the I² and Chi² statistics, and by visually inspecting the forest plots. If we identify a substantial level of heterogeneity in trials (e.g. the I² is more than 30% to 60%, the P value is less than 0.10 in the Chi² test for heterogeneity, or there is a different direction of the effects), we will conduct prespecified subgroup analyses (see Subgroup analysis and investigation of heterogeneity). |
| Assessment of reporting biases | We will assess reporting biases, including (multiple) publication, selective reporting, outcome and language biases (Sterne 2011, Table 10.1.a). First, we will try to locate protocols of included trials. If the protocol is available, we will compare outcomes documented in the protocol and the published report. If the protocol is not available, we will compare outcomes listed in the methods section of the trial report with the reported results. In addition, we will create funnel plots to investigate the possibility of publication bias and other small‐study effects when there is a sufficient number of trials (10 or more). While funnel plots may be useful in investigating reporting biases, there is some concern that tests for funnel plot asymmetry have limited power to detect small‐study effects, particularly when there are fewer than 10 studies, or when all studies are of a similar sample size (Sterne 2011). In the event that funnel plots are possible, we will produce them and seek statistical advice in their interpretation. |
| Data synthesis | We will conduct random‐effects meta‐analyses to produce the average effect size of the intervention across trials. A random‐effects model is considered more appropriate than a fixed‐effect model because the population and setting of trials are likely to be different, and therefore the effects are also likely to be different (Deeks 2011). |
| Subgroup analysis and assessment of heterogeneity | Depending on the sample size and heterogeneity of study populations, we propose to undertake subgroup analyses as follows:
To limit the risk of multiple comparisons, we will conduct subgroup analyses on primary outcomes only. |
| Sensitivity analysis | We will undertake sensitivity analyses to evaluate the impact of excluding trials (or trial data) that are judged to have a high risk of bias (e.g. in terms of the domains of random sequence generation, allocation concealment, blinding, or outcome reporting). We will also undertake sensitivity analyses to assess the potential impact of missing outcome data. |
| ASD: autism spectrum disorder; CI: confidence interval; GRADE: Grades of Recommendation, Assessment, Development and Evaluation; ITT: intention‐to‐treat; IQ: intelligence quotient; RCTs: randomised controlled trials; SD: standard deviation. | |