ஆட்டிசம் ஸ்பெக்ட்ரம் கோளாறுக்கான குடும்ப சிகிச்சை
Abstract
Background
Autism spectrum disorders (ASDs) are characterised by impairments in communication and reciprocal social interaction. These impairments can impact on relationships with family members, augment stress and frustration, and contribute to behaviours that can be described as challenging. Family members of individuals with ASD can experience high rates of carer stress and burden, and poor parental efficacy. While there is evidence to suggest that individuals with ASD and family members derive benefit from psychological interventions designed to reduce stress and mental health morbidity, and enhance coping, most studies to date have targeted the needs of either individuals with ASD, or family members. We wanted to examine whether family (systemic) therapy, aimed at enhancing communication, relationships or coping, is effective for individuals with ASD and their wider family network.
Objectives
To evaluate the clinical effectiveness and acceptability of family therapy as a treatment to enhance communication or coping for individuals with ASD and their family members. If possible, we will also seek to establish the economic costs associated with family therapy for this clinical population.
Search methods
On 16 January 2017 we searched CENTRAL, MEDLINE, Embase, 10 other databases and three trials registers. We also handsearched reference lists of existing systematic reviews and contacted study authors in the field.
Selection criteria
Randomised controlled trials (RCTs) and quasi‐RCTs investigating the effectiveness of family therapy for young people or adults with ASD or family members, or both, delivered via any modality and for an unspecified duration, compared with either standard care, a wait‐list control, or an active intervention such as an alternative type of psychological therapy.
Data collection and analysis
Two authors independently screened each title and abstract and all full‐text reports retrieved. To enhance rigour, 25% of these were independently screened by a third author.
Main results
The search yielded 4809 records. Of these, we retrieved 37 full‐text reports for further scrutiny, which we subsequently excluded as they did not meet the review inclusion criteria, and identified one study awaiting classification.
Authors' conclusions
Few studies have examined the effectiveness of family therapy for ASD, and none of these are RCTs. Further research studies employing methodologically robust trial designs are needed to establish whether family therapy interventions are clinically beneficial for enhancing communication, strengthening relationships, augmenting coping and reducing mental health morbidity for individuals with ASD and family members.
PICO
எளியமொழிச் சுருக்கம்
ஆட்டிசம் ஸ்பெக்ட்ரம் கோளாறுக்கான குடும்ப சிகிச்சை
விமர்சன கேள்வி
ஆட்டிசம் ஸ்பெக்ட்ரம் கோளாறால் பாதிக்கப்பட்டவர்கள் அல்லது அவர்களது குடும்ப உறுப்பினர்கள் அல்லது இருவருமே இவர்களுக்கு இடையிலான தொடர்பு, உறவுகளை வலிமையாக்குதல், அவர்களை சமாளித்தல் போன்றவற்றை மேம்படுத்த குடும்ப நல சிகிச்சை எப்படி உதவ முடியும் என்பதற்கான ஆதாரங்கள் என்ன ?
பின்னணி
ASD யால் பாதிக்கப்பட்டவர்கள் மற்றவர்களுடன் எவ்வாறு தொடர்பு கொள்வது, நட்புகள் மற்றும் உறவுகளை வளர்ப்பது,பராமரிப்பது ஆகியவற்றில் பெரும்பாலும் சிரமங்களை எதிர்கொள்கின்றனர். அவர்கள் வழக்கமான மாற்றங்களை நிர்வகிக்க கடினமாக உள்ளது. ASD உள்ளவர்கள் தங்களது வயது முதிர்ந்த காலங்களில் பெரும்பாலும் குடும்ப உறுப்பினர்கள், பெற்றோர்கள் மற்றும் உடன்பிறப்புகளை நம்பியுள்ளனர். ASD உடைய நபர்களின் குடும்ப உறுப்பினர்கள் சிலநேரங்களில் மன அழுத்தம், கவலை மற்றும் மன அழுத்தம் ஆகியவற்றை அனுபவிக்கின்றனர்.
பல ஆய்வுகள் ASD அல்லது குடும்ப அங்கத்தினர்களுடன் பேசும் சிகிச்சையின் நன்மைகள் பற்றி ஆய்வு செய்துள்ளன. இந்த சிகிச்சைகள் அவர்களுடனான தொடர்பு மற்றும் சமாளிப்பு,மனநல ஆரோக்கியம் மற்றும் நல்வாழ்வை மேம்படுத்த முடியும் என்று ஆய்வு கண்டுபிடிப்புகள் தெரிவிக்கின்றன. சிகிச்சையின் விளைவுகள் வழக்கமாக ASD மக்கள் அல்லது அவர்களது குடும்ப உறுப்பினர்களாலும் பெறப்படுகிறது. ஆனால் இருவரிடம் இருந்தும் அல்ல.
குடும்ப சிகிச்சை முறை குடும்பத்தினர் சிக்கலான சூழ்நிலைகளை உணருவதற்கும், ,கஷ்டங்களைப் பற்றி சிந்திக்கவும், நிர்வகிக்கவும் புதிய வழிகளை வளர்த்துக் கொள்ளவும் உதவும் முறையில் வடிவமைக்கப்பட்டுள்ளது. ASD யால் பாதிக்கப்பட்டவர்கள்,மற்றும் அவர்களது குடும்பத்து உறவினர்களுக்கு ASD யின் முக்கிய அறிகுறிகளின் தாக்கம்,மற்றும் அதிக சிரமங்களை அனுபவிக்கும் மக்கள்,குடும்பத்தின் மீது தாக்கம் ஆகியவை குடும்ப சிகிச்சை முறையின் உதவியால் மிக முக்கியமாக கண்டறியப்பட்டது
ASD க்கான குடும்ப சிகிச்சையைப் பரிசீலித்த, 2017 ஆம் ஆண்டு ஜனவரி 16 ஆம் தேதி வரை வெளியிடப்பட்ட அல்லது வெளியிடப்படாத அனைத்து ஆதாரங்களையும் நாங்கள் தேடினோம்.
ஆய்வு பண்புகள்
ASD க்கான குடும்ப சிகிச்சையின் தலையீடுகளின் நன்மைகள் பற்றி ஆராயும் சில ஆய்வுகள் இருந்தாலும் ,எந்த சிகிச்சையும் குடும்ப சிகிச்சையையும் அல்லது சிகிச்சை அற்ற முறையையும் ஒப்பிடவில்லை. சிகிச்சையை தொடங்குவதற்காக காத்திருக்கும் மக்கள் குழுவினர் அல்லது மற்றொரு மனநல சிகிச்சைக்காக. மேலும் ஒரு ஆய்வு வகைப்படுத்த காத்திருப்பு நிலையில் உள்ளது.
ஆதாரங்களின் தரம்
குடும்ப சிகிச்சை முறை ASD மக்களுக்கும் அவர்களது உறவினர்களுக்கும் பயன்படுவதை பற்றிய ஆய்வுகள் குறிப்பிடப்படும் அளவு மட்டுமே உள்ளன. குடும்பத்தின் கவனம் சார்ந்த தலையீடுகள் மன அழுத்தத்தை குறைப்பதற்கும் சமாளிப்பதற்கும்,தொடர்புகளை மேம்படுத்துவத்ற்கும் இன்னும் அதிகமான மதிப்பீட்டு திறனாய்வுகள் தேவைப்படுகிறது.
Authors' conclusions
Background
Description of the condition
Autism spectrum disorders (ASDs) are a cluster of childhood‐onset, neurodevelopmental conditions characterised by qualitative impairments in communication, reciprocal social interaction, and restricted and repetitive interests and behaviours (WHO 1992). There is substantial heterogeneity in the ASD symptom profile and clinical presentation; hence, diagnosis is often not made until late adolescence or adulthood (NICE 2012). Once thought to be fairly rare, current prevalence estimates indicate that ASD is relatively common, affecting at least 1% of the population (Brugha 2011).
The degree of impairment resulting from core ASD characteristics varies widely. Educational attainments are often poorer for younger people with ASD in comparison to typically developing peers (Levy 2011). Similarly, the adult ASD population experiences significant difficulty with gaining and sustaining meaningful employment (Howlin 2013; Mavranezouli 2014). A lack of peer and intimate relationships are frequently the norm (White 2009a), leading to diminished social opportunities beyond those that stem from the family network, social isolation and loneliness. Daily living and self‐sufficiency skills can also be impeded, and individuals with ASD often depend on ongoing support from family members well into adulthood (Gray 2014; Magiati 2014).
ASDs are commonly associated with learning disability and high rates of psychiatric comorbidity (Hofvander 2009; Joshi 2013; Simonoff 2008), including anxiety disorders (Van Steensel 2011; White 2009b), depression (Ghaziuddin 2002), attention deficit hyperactivity disorder traits (Taylor 2013), and more general "emotional and behavioural problems" (Maskey 2013). Comorbidities further compound difficulties across multiple domains of functioning and exacerbate reliance on family members as well as carer stress and burden (Cadman 2012).
The experiences and needs of family members of individuals with ASD have garnered increasing attention in recent years. Findings from epidemiological and genetic studies indicate that ASD is a highly heritable condition (Hallmayer 2011; Lichtenstein 2010; Lundström 2010). Also, studies have found that parents of people with ASD can present with higher levels of stress, distress, fatigue, anxiety, and depression symptoms than those reported for parents of typically developing or other clinical populations (Cadman 2012; Firth 2013; Giallo 2013; Hoefman 2014). Additionally, research findings suggest that carers can experience concerns about their parental efficacy and coping (Karst 2012), and that marital satisfaction can be affected (Hartley 2011). There has been some, albeit limited, research about siblings of individuals with ASD. Tentative study findings suggest that some siblings may experience slightly elevated levels of "behavioural problems" compared to non‐clinical populations (Hastings 2014), or features of anxiety (Shivers 2013). Sibling adjustment and relationships may be affected by the severity of ASD and associated symptoms (Petalas 2012; Rivers 2003). Siblings may also be expected to take on more household duties (e.g. chores), or more responsibility (e.g. informal caregiving) compared to the individual with ASD, although this is not a consistent finding across studies (Meirsschaut 2011).
Description of the intervention
Family therapy can be defined as a formal, psychotherapeutic intervention, which seeks to understand and enhance relationships, communication, and functioning between members of a family (Dallos 2010). While there are several types of family therapy, they are predominantly underpinned by systemic theories and share central tenets (Hayes 1991). First, it is proposed that various problems, such as mental health functioning or the development and maintenance of interpersonal relationships, are contextually bound (that is, they are likely to be predisposed and perpetuated by the context and system(s) within which they occur, rather than solely being attributed to the individual themselves) (Dallos 2010). Second, it is suggested that societal and cultural norms, values and expectations influence and shape familial beliefs and behaviours both collectively (that is, the intergenerational family unit) and individually, and that problems are best understood and addressed in terms of these influences. Third, it is hypothesised that the family unit and the relationships between family members are dynamic (that is, that the reactions and responses of one person affect those of others in the system, in a bi‐directional fashion, linearly and longitudinally). Fourth, families are said to develop ways of coping with periods of change and transition (e.g. births, marriages and bereavements), and illness or adversity, in order to maintain stability as a unit (Goldenberg 2012). Often these patterns of coping are adaptive and shared between all family members; yet, on occasion, individuals (within the family) may adopt distinct coping styles leading to communication and relationship difficulties. Finally, it is considered that there are commonalities in the ways that family members use language and narratives to converse and make sense of their own and others’ experiences but also subtle differences, which, in turn, may lead to or exacerbate ambiguity, misinterpretation or disagreements.
Family therapists use a range of interventions (Dallos 2010), including psychoeducation; development of genograms to map out cultural, resilience or other familial patterns (Butler 2008); narrative techniques (e.g. to explore language, meanings and attributions) (Carr 1998); and the use of particular questioning styles (e.g. circular and reflexive questions to enhance the breadth and depth of discussion) (Hayes 1991). In clinical practice, individuals presenting for family therapy may be part of the same family or part of the wider friendship group. Individuals are encouraged to decide for themselves who can and will engage in treatment, and the configuration of those attending may vary from session to session. The duration of therapy can be several weeks to several months. Choices about the number of sessions to offer are largely dependent on the service model and constraints, familial presenting needs and the therapist’s theoretical stance.
How the intervention might work
Family therapy for ASD can be hypothesised to work in several ways (Goepfert 2015; Helps 2016; Ramisch 2013; Solomon 2012). Individuals with ASD and family members can be supported to understand and make sense of the diagnosis (e.g. through the use of psychoeducation). Discussion can be facilitated about preferences for using different terminology to describe the core symptoms (e.g. autism spectrum ‘disorder’ or autism spectrum ‘condition’) and the narratives and meanings that arise from this for individuals and the family unit collectively. The impact of core characteristics (e.g. engagement in routines or impairments in socioemotional reciprocity such as a lack of empathy) can be explored with a view to reducing feelings of frustration or annoyance. Interventions can encourage discussion about broad factors and familial patterns or responses that may contribute to difficulties with communication and relationships or challenging behaviour, and support the identification of strategies to promote cohesion within the system. Family therapy can also encourage open dialogue between carers (e.g. about potential guilt or feelings of stress or worry), and, in turn, strategies can be developed to enhance marital relationships, resilience and coping, and positive parental mental health. Family therapy also provides a supportive therapeutic space for siblings to explore their concerns or unanswered questions (e.g. about heredity factors or their current and potential prospective role as a carer).
Why it is important to do this review
ASDs are common, lifelong disorders characterised by overt and subtle qualitative impairments in communication, social interaction and relatedness, and preferences for engaging in restricted interests and repetitive behaviours (WHO 1992). Difficulties with tolerating uncertainty, ambiguity, and change within and beyond the immediate environment are additional hallmark characteristics (APA 2013). Core ASD symptoms can impact significantly on daily social and occupational functioning during childhood and adulthood. Individuals with ASD may find it difficult to initiate and sustain interactions with others despite the desire for relationships (and increased social opportunities). Also, symptoms of ASD typically impact others in the family (Hoefman 2014). Parents (carers) and siblings often must accommodate restricted interests and adherence to seemingly non‐functional routines. Inherent difficulties with communication and interaction can adversely affect relationships with, and between, family members. The need to provide intensive and ongoing support to individuals with ASD can incur stress, anxiety and depression in carers, as well as poor perceived parental efficacy and coping (Karst 2012).
There is no cure for ASD per se, and the heterogeneity of the disorder negates the use of monotherapy. Instead, the more parsimonious approach is to develop combinations of interventions that 1) reduce or ameliorate the effect and impact of core ASD symptoms, and 2) support individuals and others around them to enhance their repertoire of skills (Smith 2014; Woodman 2015). Further, interventions are needed across the lifespan to address the needs of children as well as adults with ASD. There is promising evidence for the use of psychological interventions for individuals with ASD, such as behavioural and cognitive‐behavioural (Lang 2010; Spain 2015a; Sukhodolsky 2013), social cognition (Fletcher‐Watson 2014), and skills‐based interventions (Reichow 2013; Spain 2015b), but a limitation to these approaches is that they do not explicitly address relationship and communication issues between family members, nor do they seek to enhance familial coping strategies or resilience factors. Similarly, a recent review has highlighted the potential effectiveness of parent training for ASD (Oono 2013), but this approach encourages parents to take on a more facilitative role, rather than specifically targeting their (potential) concurrent needs and the bi‐directional relationship between individuals. Conversely, family therapy is a more inclusive intervention and has been found to be effective for different clinical populations (Carr 2009). Whether the structure or content of family therapy for individuals with ASD requires adaptation (as is the case for other psychological therapies), for example to accommodate the impact of inherent impairments, is not wholly clear. Undertaking a systematic review of the empirical data is important in order to:
-
ascertain the potential effectiveness and acceptability of formal family therapy work for individuals with ASD;
-
establish whether there are integral features of these approaches that are associated with improved outcomes; and
-
consider how best interventions can be tailored to the specific lifelong needs of this clinical population and their family members.
Objectives
To evaluate the clinical effectiveness and acceptability of family therapy as a treatment to enhance communication or coping for individuals with ASD and their family members. If possible, we will also seek to establish the economic costs associated with family therapy for this clinical population.
Methods
Criteria for considering studies for this review
Types of studies
Randomised controlled trials (RCTs) and quasi‐RCTs (in which participants were allocated by alternate allocation, for example according to days of the week). We excluded cross‐over trials and studies employing non‐RCT designs (such as case studies or case series), due to the methodological limitations these can incur.
Types of participants
Families that have at least one person — child or adolescent (aged 17 years and under) or adult (aged 18 years and over) — diagnosed with an ASD.
We defined ASD according to clinical criteria of either the International Classification of Diseases (WHO 1992), or the Diagnostic and Statistical Manual of Mental Disorders (APA 2013), and ideally (but not necessarily) diagnosed using standardised methods of assessment (e.g. the Autism Diagnostic Interview ‐ Revised (Lord 1994), or the Autism Diagnostic Observation Schedule (Lord 2000)).
We defined family members as individuals from multi‐generations (parents, grandparents, siblings, children, or spouses), either biologically related to the individual with ASD, or related through marriage or cohabitation. We also included non‐professional carers (e.g. individuals providing foster or respite care) and significant others such as friends.
We included studies that described interventions delivered to participants residing in the same dwelling, or interventions offered to family members living separately.
We included studies in which participants had a comorbidity or were receiving other treatments concurrently to the family therapy, although the intention was to clarify this level of detail from reports or by contacting trial authors.
Types of interventions
Family therapy
We included family therapy interventions delivered by at least one suitably qualified clinician, derived from systemic theories, and specifically focusing on understanding, enhancing and improving aspects of relationships between individuals with ASD and at least one family member; or between two or more members of the family of an individual with ASD (e.g. parents, or parents and siblings). We included the following modalities of family therapy: systemic therapy; structural family therapy; strategic family therapy; Milan approaches; solution‐focused therapy; narrative therapy; and behavioural family therapy. The intervention had to have been offered either face‐to‐face or via web‐based real‐time sessions. We excluded studies that described pure bibliotherapy, psychoeducation or parent training techniques. There was no stipulation regarding the number or duration of sessions delivered.
Control condition
We included four main types of comparator interventions.
-
No treatment.
-
Provision of standard clinical care (i.e. treatment as usual).
-
A wait‐list control (e.g. a delayed‐start intervention).
-
An active comparator (e.g. an alternative psychological intervention such as applied behavioural analysis or cognitive behavioural therapy).
Types of outcome measures
We identified primary and secondary outcomes for individuals with ASD and family members. We included outcome measures that generated either dichotomous or continuous data. To be eligible for inclusion, outcome measures needed to be standardised and validated. While measures may not necessarily have been specifically validated for use with the ASDs population, many intervention studies that include participants with ASD utilise measures (e.g. self‐report questionnaires) that have been validated in non‐ASD samples (Lang 2010; Reichow 2013; Spain 2015a; Spain 2015b). The intention was to describe the psychometric properties of outcome measures, when possible, and highlight whether there are indicative, normative thresholds (that is, cut‐off scores) for ASD samples.
Outcome measures could have been completed by individuals with ASD, family members, or via objective (clinician‐administered) instruments. Outcome measures could have been completed at different time points, including postintervention or at follow‐up, or relating to short‐term changes (such as attributions about coping or satisfaction with the intervention), and longer‐term outcomes (such as direct and indirect costs).
Primary outcomes
-
Quality or quantity of social interaction and communication (e.g. Social Responsiveness Scale by Constantino 2003; Autism Diagnostic Observation Schedule by Lord 2000).
-
Mental health morbidity, including stress, anxiety or depression (e.g. Hospital Anxiety and Depression Scale by Zigmond 1983).
-
Quality of life (e.g. EQ‐5D by Szenda 2007), including quality of relationships with family members (e.g. Family Questionnaire by Wiedemann 2002).
-
Adverse effects or events (e.g. increased mental health morbidities, as measured by the Hospital Anxiety and Depression Scale (Zigmond 1983); or an increase in challenging behaviour).
Secondary outcomes
-
Confidence in, or attributions about, coping (e.g. Attributional Style Questionnaire by Seligman 1984).
-
Satisfaction with treatment (e.g. Client Satisfaction Questionnaire by Attkisson 1982).
-
Dropout from treatment.
-
Health economic outcomes, including direct costs (e.g. treatment costs) and indirect costs (e.g. use of clinical services or work absence due to stress).
Search methods for identification of studies
We used a search strategy that combined two concepts: the condition (ASD) AND intervention (family therapy). We did not limit the search by language, date, or publication status.
Electronic searches
We searched the following electronic databases and trial registers between 22 October and 4 November 2015 and again in January 2017:
-
Cochrane Central Register of Controlled Trials (CENTRAL; 2016, Issue 11) in the Cochrane Library, which includes the Cochrane Developmental, Psychosocial and Learning Problems Specialised Register (searched 18 January 2017);
-
MEDLINE Ovid (1946 to December Week 1 2016);
-
MEDLINE Ovid Epub Ahead of Print (16 January 2017);
-
MEDLINE Ovid In‐Process & Other Non‐Indexed Citations (16 January 2017);
-
Embase Ovid (1974 to 2017 Week 03);
-
CINAHL Plus EBSCOhost (Cumulative Index to Nursing and Allied Health Literature; 1937 to 17 January 2017);
-
Cochrane Database of Systematic Reviews (CDSR; 2017, Issue 1) part of the Cochrane Library (searched 18 January 2017);
-
Database of Abstracts of Reviews of Effects (DARE; 2015, Issue 2) part of the Cochrane Library (searched 18 January 2017);
-
ERIC EBSCOhost (Education Resources Information Center; 1966 to 17 January 2017);
-
PsycINFO Ovid (1967 to January Week 2 2017);
-
Sociological Abstracts ProQuest (1952 to 18 January 2017);
-
Dissertation Abstracts International ProQuest (1743 to 16 January 2017);
-
AutismData (autism.org.uk/autismdata; searched 18 January 2017);
-
UK Clinical Trials Gateway (UKCTG; ukctg.nihr.ac.uk; searched 18 January 2017); replaces UK Clinical Research Network Study Portfolio.
-
ClinicalTrials.gov (clinicaltrials.gov; searched 18 January 2017);
-
World Health Organisation International Clinical Trials Registry Platform (WHO ICTRP; apps.who.int/trialsearch/default.asp; searched 18 January 2017).
The exact strategy for each database is reported in Appendix 1. See Appendix 2 for a detailed summary of the searches to date.
Searching other resources
We also undertook additional searches as follows: 1) we handsearched the reference lists of 10 review papers (Banda 2015; Cridland 2014; Dababnah 2016; Da Paz 2017; Gingerich 2013; Goepfert 2015; Karst 2012; Kaslow 2012; Ramisch 2013; Wainer 2016); and 2) we contacted a number of clinicians, including researchers who have undertaken studies in the field, to ask if they knew of any studies not already identified by the searches.
Data collection and analysis
Selection of studies
Selection of studies involved several steps. We initially imported all citations retrieved from the searches into EndNote (EndNote X7). After removing duplicates, DS and JS independently screened the list of titles and abstracts for relevance. Next, DS and JS inspected full reports of studies that appeared relevant or for which more information was needed. They then independently assessed each text for eligibility based on the inclusion criteria outlined above (Criteria for considering studies for this review). To enhance reliability and rigour, EP independently reviewed a random 25% of the total sample of all titles and abstracts obtained, and a random 25% of all full‐text reports retrieved. There were no disputes about the screening and inspection of reports. We recorded our decisions in a study flow diagram (Moher 2009).
Data extraction and management
No studies met the inclusion criteria for this review (Criteria for considering studies for this review).
Please see the protocol (Spain 2015c) and Table 1 for more information on methods archived for use in future updates of this review.
| Unused methods | Description of methods |
| Data extraction and management | The data extraction form will include subheadings relating to the following areas.
We will attempt to separate the outcomes and results between sites for any multi‐centre studies. In the event that data described appear ambiguous for any of the reports, we will contact the authors for clarification. If we are unable to liaise with report authors, we will document this within the review, and the review team will discuss the discrepancies. For any non‐English language studies, we will endeavour to arrange for report translation. |
| Assessment of risk of bias in included studies | DS and JS will independently assess the risk of bias of all included studies across seven domains: random sequence generation; allocation concealment; blinding of participants and trial staff; blinding of outcome assessments; incomplete outcome data; selective outcome reporting; and any other potential sources of bias. For each included study, we will assign each of these domains one of three ratings: high risk of bias, low risk of bias, or unclear risk of bias. We have detailed criteria for rating various domains of bias below, with examples drawn from Chapter 8.5 of the Cochrane Handbook for Systematic Reviews of Interventions (Higgins 2011a). Random sequence generation
Allocation concealment
Blinding of participants and research personnel
Blinding of outcome assessment
Incomplete outcome data
Selective reporting
Other sources of bias
We will obtain a third opinion from EP, MF or FH should there be disagreement about the 'Risk of bias' assessment or a lack of consensus about any of the individual domains per study or in terms of the overall appraisal of the trial. We will also attempt to contact report authors to provide clarification about aspects of the trial, as needed. |
| 'Summary of findings' tables | We will import data from Review Manager (Review Manager 2014), into GRADEprofiler (GRADEpro GDT), and use this software to create 'Summary of findings' tables. These tables will provide outcome‐specific information concerning the overall quality of the body of evidence from the studies included in the comparison, the magnitude of effect of the interventions examined, and the sum of available data on outcomes rated as relevant to patient care and decision making. We will include the following outcomes in the 'Summary of findings' tables.
|
| Measures of treatment effect | Dichotomous data For dichotomous outcomes, such as the presence or absence of challenging behaviour(s), we will use the Mantel‐Haenszel method for computing the pooled risk ratio (RR) (Mantel 1959). We will use the RR in meta‐analyses, rather than the odds ratio (OR), because the OR can be susceptible to misinterpretation, which can lead to overestimation of the benefits and harms of the intervention (Deeks 2011, Section 9.4.4.4). We will report the RR with 95% CIs. Continuous data When different measures are used, we will calculate the standardised mean difference and 95% CI. We will calculate the mean difference and 95% CI when all outcomes are measured using the same scale in the same way. |
| Unit of analysis issues | Cluster trials In cluster trials, the independence of individuals cannot be assumed (Higgins 2011b). As we are examining the effectiveness of an intervention for both individuals and family members, we may identify cluster‐randomised trials. If clustering has been incorporated into the analyses of primary studies, we plan to present these data as if from a non‐cluster‐randomised study, but adjust for the clustering effect. We will contact study authors for more information if needed. If we identify cluster trials that have been analysed using incorrect statistical methods (i.e. not taking the clustering into account), we will contact study authors to request individual participant data so that we may calculate an estimate of the intracluster correlation coefficient (ICC). If we are unable to obtain this information, we will adjust sample sizes using an estimate of the ICC from the trial or from a trial of a similar population, with advice from a statistician, and use this to re‐analyse the data. In the event that we are unable to adjust for incorrect statistical methods used by the cluster trials, and therefore cannot estimate the ICC with any a degree of confidence, we will exclude the trial (Higgins 2011b). We will investigate the robustness of our results by conducting sensitivity analyses, for example, to explore the impact of different types of cluster‐randomisation units (such as families, health practitioners) (Higgins 2011b). We will also compare the results with and without cluster trials that have not been analysed correctly by the trialists (where the ICC is estimated from other trials for the adjustment of cluster effect) (see Sensitivity analysis). Cross‐over trials Due to the issue of carry‐over, that is, whereby the effectiveness of a second intervention may be mediated by the first intervention, we will exclude cross‐over trials. Multiple comparisons Where a trial involves more than two treatment (or comparator) arms, we will first assess which intervention (or comparator) groups are relevant to our review. We will use data from the arms of the trial that are relevant to the review objectives, but present all intervention groups in the 'Characteristics of included studies' tables, providing a detailed description of why we have selected particular groups and excluded others. In the event that studies have more than two intervention groups and a control group that are relevant to the review, we will split the control group data proportionately to the other two groups. Repeated measures When a trial reports outcome data obtained at more than one time point, we will conduct analyses separately for each time point (e.g. postintervention and at follow‐up, if follow‐up is specified by the trialist). |
| Dealing with missing data | We will consider the possible impact of missing data on the results of the review. Data may be missing either because (1) they have been insufficiently or inadequately reported, or (2) due to dropout or attrition. In the event of insufficient or inadequate reporting, we will first try to obtain any missing data from the trial authors, including unreported data (e.g. group means and SDs), details of dropouts, and interventions provided. We will describe the missing data in the 'Risk of bias' table. In either case outlined above, and when we cannot obtain data, we will conduct analyses using ITT principles. For dichotomous outcomes (those not deemed to be missing at random), we will impute the outcomes for the missing participants using both the most optimistic (i.e. assuming participants with missing data improve) and the most pessimistic (i.e. assuming participants with missing data deteriorate) scenarios. When data are missing for continuous outcomes (e.g. data pertaining to means or SD), we will attempt to calculate them based on the standard errors, CIs, and t values, according to the rules described in the Cochrane Handbook for Systematic Reviews of Interventions (Higgins 2011c). If this information is missing, and we are unable to obtain it from trial authors, we will report it as missing data in the review. We will also conduct a sensitivity analysis to compare the results from the ITT analysis with the imputation and ‘available case’ analysis (see Sensitivity analysis). If these analyses yield similar results in terms of the effects of treatment, we will present the results of the available case analyses. |
| Assessment of heterogeneity | Within each comparison, we will first assess clinical heterogeneity (e.g. variability in active and comparator interventions, participant characteristics, or outcome measures used) and methodological heterogeneity (e.g. variability in study design, including differences in the nature of the randomisation unit and the size of cluster randomised; and risk of bias, which we will assess according to the criteria outlined in the Cochrane Handbook for Systematic Reviews of Interventions (Deeks 2011)). If there is clinical or methodological heterogeneity, we will extract and document all of these characteristics onto the data extraction form and synthesise the results narratively. We will then assess statistical heterogeneity using the I² and Chi² statistics, and by visually inspecting the forest plots. If we identify a substantial level of heterogeneity in trials (e.g. the I² is more than 30% to 60%, the P value is less than 0.10 in the Chi² test for heterogeneity, or there is a different direction of the effects), we will conduct prespecified subgroup analyses (see Subgroup analysis and investigation of heterogeneity). |
| Assessment of reporting biases | We will assess reporting biases, including (multiple) publication, selective reporting, outcome and language biases (Sterne 2011, Table 10.1.a). First, we will try to locate protocols of included trials. If the protocol is available, we will compare outcomes documented in the protocol and the published report. If the protocol is not available, we will compare outcomes listed in the methods section of the trial report with the reported results. In addition, we will create funnel plots to investigate the possibility of publication bias and other small‐study effects when there is a sufficient number of trials (10 or more). While funnel plots may be useful in investigating reporting biases, there is some concern that tests for funnel plot asymmetry have limited power to detect small‐study effects, particularly when there are fewer than 10 studies, or when all studies are of a similar sample size (Sterne 2011). In the event that funnel plots are possible, we will produce them and seek statistical advice in their interpretation. |
| Data synthesis | We will conduct random‐effects meta‐analyses to produce the average effect size of the intervention across trials. A random‐effects model is considered more appropriate than a fixed‐effect model because the population and setting of trials are likely to be different, and therefore the effects are also likely to be different (Deeks 2011). |
| Subgroup analysis and assessment of heterogeneity | Depending on the sample size and heterogeneity of study populations, we propose to undertake subgroup analyses as follows:
To limit the risk of multiple comparisons, we will conduct subgroup analyses on primary outcomes only. |
| Sensitivity analysis | We will undertake sensitivity analyses to evaluate the impact of excluding trials (or trial data) that are judged to have a high risk of bias (e.g. in terms of the domains of random sequence generation, allocation concealment, blinding, or outcome reporting). We will also undertake sensitivity analyses to assess the potential impact of missing outcome data. |
ASD: autism spectrum disorder; CI: confidence interval; GRADE: Grades of Recommendation, Assessment, Development and Evaluation; ITT: intention‐to‐treat; IQ: intelligence quotient; RCTs: randomised controlled trials; SD: standard deviation.
Results
Description of studies
Results of the search
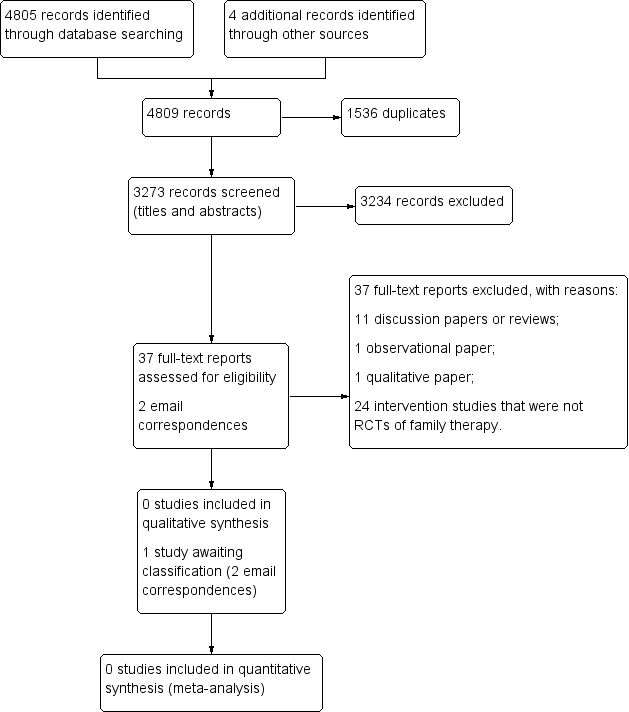
Please see Figure 1 for a flow diagram of the selection process.

Study flow diagram.
Our searches yielded 4805 database records (Electronic searches), and four additional records from other sources (Searching other resources). We removed 1536 duplicates and reviewed 3273 records for eligibility (Criteria for considering studies for this review). Two review authors (DS, JS) independently screened all titles and abstracts. A third author (EP) screened 800 titles and abstracts (25%) independently to enhance rigour. We excluded 3234 records, as none of these pertained to RCTs of family therapy for people with ASD.
We retrieved a total of 37 full‐text reports for further evaluation. Thirty‐four reports were written in English, one was written in Chinese (Chen 2006), one in Japanese (Abe 2014), and one in German (Goll‐Kopka 2009). None of these described RCTs of family therapy and all were excluded (see Excluded studies). One excluded study, Wagner 2014, made reference to another, potentially relevant study. We contacted the author on two occasions but no further information was available at this time, therefore we classified this as awaiting classification (Spain 2017 [pers comm]).
Included studies
None of the reports retrieved met the inclusion criteria for this review (Criteria for considering studies for this review).
Excluded studies
We excluded 37 reports. We excluded 11 discussion papers or reviews (Affleck 1982; Alonim 2004; Brockman 2016; Coleman 2015; Heller 2015; Helps 2016; Johnson 2012; Lordi 1964; Pickard 2017; Smock Jordan 2016; Wagner 2014), one observational report (Altiere 2009), one qualitative study (Coogle 2016), and 24 intervention studies that were not RCTs of family therapy (Abe 2014; Aerts 2011; Allen 1980; Alquraini 2015; Bennett 1983; Bennett 1986; Casenhiser 2011; Chen 2006; Chou 1992; Clancy 1972; Davis 1991; George 1988; Drahota 2008; Estreicher 1982; Goll‐Kopka 2009; Keen 2010; NCT01919970; Pillay 2010; Roux 2013; Shank 1991; Siller 2013; Solomon 2008; Wang 2008; Whittingham 2009).
See Characteristics of excluded studies tables.
Risk of bias in included studies
Given that no studies met the review inclusion criteria (Criteria for considering studies for this review), we were unable to assess risk of bias.
Effects of interventions
It was not possible to establish intervention effectiveness, given the absence of data.
Discussion
Summary of main results
We sought to establish the clinical and cost effectiveness of family therapy for individuals with ASD. Despite an extensive search, no RCTs met the a priori review inclusion criteria (Criteria for considering studies for this review), implying a gap in the literature. One study is awaiting classification as no further information is available at this time.
Overall completeness and applicability of evidence
We were unable to assess completeness and applicability of evidence as no studies were included in this review.
Quality of the evidence
We were unable to assess the quality of the evidence as no studies were included in this review.
Potential biases in the review process
We consider that our search was rigorous and comprehensive. We conducted searches in 13 databases, including seeking unpublished studies such as those described in dissertations and the grey literature. We also handsearched the reference lists of a number of systematic and literature reviews. Finally, we contacted a couple of study authors to ascertain whether they were aware of trial data that may be eligible for inclusion in this review.
Agreements and disagreements with other studies or reviews
No other systematic reviews focusing on RCTs of family therapy or systemic therapy for ASD were retrieved by our search. We identified (but excluded) a few non‐randomised intervention studies that incorporated elements of systemic therapy for family members of individuals with ASD (e.g. George 1988; Goll‐Kopka 2009; Wagner 2014). Evidence from these studies suggests that knowledge and understanding of the core disorder (i.e. ASD), and coping styles may be improved postintervention, albeit that use of less rigorous study designs means that results should be interpreted with a degree of caution.
Study flow diagram.
| Unused methods | Description of methods |
| Data extraction and management | The data extraction form will include subheadings relating to the following areas.
We will attempt to separate the outcomes and results between sites for any multi‐centre studies. In the event that data described appear ambiguous for any of the reports, we will contact the authors for clarification. If we are unable to liaise with report authors, we will document this within the review, and the review team will discuss the discrepancies. For any non‐English language studies, we will endeavour to arrange for report translation. |
| Assessment of risk of bias in included studies | DS and JS will independently assess the risk of bias of all included studies across seven domains: random sequence generation; allocation concealment; blinding of participants and trial staff; blinding of outcome assessments; incomplete outcome data; selective outcome reporting; and any other potential sources of bias. For each included study, we will assign each of these domains one of three ratings: high risk of bias, low risk of bias, or unclear risk of bias. We have detailed criteria for rating various domains of bias below, with examples drawn from Chapter 8.5 of the Cochrane Handbook for Systematic Reviews of Interventions (Higgins 2011a). Random sequence generation
Allocation concealment
Blinding of participants and research personnel
Blinding of outcome assessment
Incomplete outcome data
Selective reporting
Other sources of bias
We will obtain a third opinion from EP, MF or FH should there be disagreement about the 'Risk of bias' assessment or a lack of consensus about any of the individual domains per study or in terms of the overall appraisal of the trial. We will also attempt to contact report authors to provide clarification about aspects of the trial, as needed. |
| 'Summary of findings' tables | We will import data from Review Manager (Review Manager 2014), into GRADEprofiler (GRADEpro GDT), and use this software to create 'Summary of findings' tables. These tables will provide outcome‐specific information concerning the overall quality of the body of evidence from the studies included in the comparison, the magnitude of effect of the interventions examined, and the sum of available data on outcomes rated as relevant to patient care and decision making. We will include the following outcomes in the 'Summary of findings' tables.
|
| Measures of treatment effect | Dichotomous data For dichotomous outcomes, such as the presence or absence of challenging behaviour(s), we will use the Mantel‐Haenszel method for computing the pooled risk ratio (RR) (Mantel 1959). We will use the RR in meta‐analyses, rather than the odds ratio (OR), because the OR can be susceptible to misinterpretation, which can lead to overestimation of the benefits and harms of the intervention (Deeks 2011, Section 9.4.4.4). We will report the RR with 95% CIs. Continuous data When different measures are used, we will calculate the standardised mean difference and 95% CI. We will calculate the mean difference and 95% CI when all outcomes are measured using the same scale in the same way. |
| Unit of analysis issues | Cluster trials In cluster trials, the independence of individuals cannot be assumed (Higgins 2011b). As we are examining the effectiveness of an intervention for both individuals and family members, we may identify cluster‐randomised trials. If clustering has been incorporated into the analyses of primary studies, we plan to present these data as if from a non‐cluster‐randomised study, but adjust for the clustering effect. We will contact study authors for more information if needed. If we identify cluster trials that have been analysed using incorrect statistical methods (i.e. not taking the clustering into account), we will contact study authors to request individual participant data so that we may calculate an estimate of the intracluster correlation coefficient (ICC). If we are unable to obtain this information, we will adjust sample sizes using an estimate of the ICC from the trial or from a trial of a similar population, with advice from a statistician, and use this to re‐analyse the data. In the event that we are unable to adjust for incorrect statistical methods used by the cluster trials, and therefore cannot estimate the ICC with any a degree of confidence, we will exclude the trial (Higgins 2011b). We will investigate the robustness of our results by conducting sensitivity analyses, for example, to explore the impact of different types of cluster‐randomisation units (such as families, health practitioners) (Higgins 2011b). We will also compare the results with and without cluster trials that have not been analysed correctly by the trialists (where the ICC is estimated from other trials for the adjustment of cluster effect) (see Sensitivity analysis). Cross‐over trials Due to the issue of carry‐over, that is, whereby the effectiveness of a second intervention may be mediated by the first intervention, we will exclude cross‐over trials. Multiple comparisons Where a trial involves more than two treatment (or comparator) arms, we will first assess which intervention (or comparator) groups are relevant to our review. We will use data from the arms of the trial that are relevant to the review objectives, but present all intervention groups in the 'Characteristics of included studies' tables, providing a detailed description of why we have selected particular groups and excluded others. In the event that studies have more than two intervention groups and a control group that are relevant to the review, we will split the control group data proportionately to the other two groups. Repeated measures When a trial reports outcome data obtained at more than one time point, we will conduct analyses separately for each time point (e.g. postintervention and at follow‐up, if follow‐up is specified by the trialist). |
| Dealing with missing data | We will consider the possible impact of missing data on the results of the review. Data may be missing either because (1) they have been insufficiently or inadequately reported, or (2) due to dropout or attrition. In the event of insufficient or inadequate reporting, we will first try to obtain any missing data from the trial authors, including unreported data (e.g. group means and SDs), details of dropouts, and interventions provided. We will describe the missing data in the 'Risk of bias' table. In either case outlined above, and when we cannot obtain data, we will conduct analyses using ITT principles. For dichotomous outcomes (those not deemed to be missing at random), we will impute the outcomes for the missing participants using both the most optimistic (i.e. assuming participants with missing data improve) and the most pessimistic (i.e. assuming participants with missing data deteriorate) scenarios. When data are missing for continuous outcomes (e.g. data pertaining to means or SD), we will attempt to calculate them based on the standard errors, CIs, and t values, according to the rules described in the Cochrane Handbook for Systematic Reviews of Interventions (Higgins 2011c). If this information is missing, and we are unable to obtain it from trial authors, we will report it as missing data in the review. We will also conduct a sensitivity analysis to compare the results from the ITT analysis with the imputation and ‘available case’ analysis (see Sensitivity analysis). If these analyses yield similar results in terms of the effects of treatment, we will present the results of the available case analyses. |
| Assessment of heterogeneity | Within each comparison, we will first assess clinical heterogeneity (e.g. variability in active and comparator interventions, participant characteristics, or outcome measures used) and methodological heterogeneity (e.g. variability in study design, including differences in the nature of the randomisation unit and the size of cluster randomised; and risk of bias, which we will assess according to the criteria outlined in the Cochrane Handbook for Systematic Reviews of Interventions (Deeks 2011)). If there is clinical or methodological heterogeneity, we will extract and document all of these characteristics onto the data extraction form and synthesise the results narratively. We will then assess statistical heterogeneity using the I² and Chi² statistics, and by visually inspecting the forest plots. If we identify a substantial level of heterogeneity in trials (e.g. the I² is more than 30% to 60%, the P value is less than 0.10 in the Chi² test for heterogeneity, or there is a different direction of the effects), we will conduct prespecified subgroup analyses (see Subgroup analysis and investigation of heterogeneity). |
| Assessment of reporting biases | We will assess reporting biases, including (multiple) publication, selective reporting, outcome and language biases (Sterne 2011, Table 10.1.a). First, we will try to locate protocols of included trials. If the protocol is available, we will compare outcomes documented in the protocol and the published report. If the protocol is not available, we will compare outcomes listed in the methods section of the trial report with the reported results. In addition, we will create funnel plots to investigate the possibility of publication bias and other small‐study effects when there is a sufficient number of trials (10 or more). While funnel plots may be useful in investigating reporting biases, there is some concern that tests for funnel plot asymmetry have limited power to detect small‐study effects, particularly when there are fewer than 10 studies, or when all studies are of a similar sample size (Sterne 2011). In the event that funnel plots are possible, we will produce them and seek statistical advice in their interpretation. |
| Data synthesis | We will conduct random‐effects meta‐analyses to produce the average effect size of the intervention across trials. A random‐effects model is considered more appropriate than a fixed‐effect model because the population and setting of trials are likely to be different, and therefore the effects are also likely to be different (Deeks 2011). |
| Subgroup analysis and assessment of heterogeneity | Depending on the sample size and heterogeneity of study populations, we propose to undertake subgroup analyses as follows:
To limit the risk of multiple comparisons, we will conduct subgroup analyses on primary outcomes only. |
| Sensitivity analysis | We will undertake sensitivity analyses to evaluate the impact of excluding trials (or trial data) that are judged to have a high risk of bias (e.g. in terms of the domains of random sequence generation, allocation concealment, blinding, or outcome reporting). We will also undertake sensitivity analyses to assess the potential impact of missing outcome data. |
| ASD: autism spectrum disorder; CI: confidence interval; GRADE: Grades of Recommendation, Assessment, Development and Evaluation; ITT: intention‐to‐treat; IQ: intelligence quotient; RCTs: randomised controlled trials; SD: standard deviation. | |