افزایش دوز داروی آنتیسایکوتیک برای عدم پاسخ به درمان در بیماری اسکیزوفرنی
Referencias
منابع مطالعات واردشده در این مرور
منابع مطالعات خارجشده از این مرور
منابع اضافی
منابع دیگر نسخههای منتشرشده این مرور
Characteristics of studies
Characteristics of included studies [ordered by study ID]
Ir a:
| Methods | Allocation: randomised, no further details | |
| Participants | Diagnosis: chronic schizophrenia, severity of illness was 4 to 6 according to the disability scale used (0 indicated no symptoms, while a score of 7 indicated extremely severe degree of illness), no further details. | |
| Interventions | All participants firstly received open‐label 2 mg haloperidol tablets for 4 weeks (maximum dosage being 12 mg/day). Participants were then randomised to either: 1. dose increase: 20 mg haloperidol tablets; mean 103 mg/day at endpoint. N = 12; or 2. dose maintenance: 2 mg haloperidol tablets; mean 15 mg/day at endpoint. N = 11. The starting dose corresponded to the number of tablets reached during the open pretest period (mean 10 mg/day in both groups). During the first 6 weeks, the dose was adjusted according to effect and side effects, while during the following 6 weeks the dose was maintained constant as far as possible. Rescue medication: orphenadrine and chloralodol; no further details. | |
| Outcomes | Clinically relevant response (defined as > 0% BPRS total score reduction) Global state: improved, possible improved, unchanged, or deteriorated (Global Assessment Scale) Adverse effects Unable to use: Leaving the study early (no separate numbers for the two groups) Mental state: general (BPRS total score, no mean, no SD), Nurses Observation Scale for Inpatient Evaluation (NOSIE total score, no SD) Plasma levels of haloperidol (no mean, no SD) and prolactin (no SD), and not protocol outcomes Other laboratory investigations (no mean, no SD), and not protocol outcomes | |
| Notes | In this study, there was a 4‐week, open, pretest period during which participants received 2 mg haloperidol tablets (mean 10 mg/day). It is not clearly indicated whether all participants entering the double‐blind phase were non‐responders during the run‐in phase. Nevertheless, based on participant description and BPRS total scores at baseline, we assumed this is the case. | |
| Risk of bias | ||
| Bias | Authors' judgement | Support for judgement |
| Random sequence generation (selection bias) | Unclear risk | Quote: "...patients were randomized..." (pg. 18); no further details |
| Allocation concealment (selection bias) | Unclear risk | No details were presented |
| Blinding of participants and personnel (performance bias) | Unclear risk | Quote: "...12‐week double‐blind phase..." (pg. 18); no further details |
| Blinding of outcome assessment (detection bias) | Unclear risk | Quote: "...12‐week double‐blind phase..." (pg. 18); no further details |
| Incomplete outcome data (attrition bias) | High risk | Quote: "Twenty‐nine male, chronic schizophrenic patients ... consent to participate in the study. Six of the patients dropped out during the study, independent of the drug administered. The 23 patients completing the study ..." (pg. 18); no further details. Only completers were analysed. |
| Selective reporting (reporting bias) | High risk | BPRS total score, NOSIE, plasma levels and other laboratory values were assessed but no usable data were reported in the results. |
| Other bias | Low risk | No obvious risk for other bias |
| Methods | Allocation: randomised, no further details | |
| Participants | Diagnosis: schizophrenia or schizoaffective disorder (DSM‐IV) | |
| Interventions | All participants firstly received open‐label ziprasidone treatment, titrated up to 160 mg/day, for a minimum of 3 weeks. Participants with persistent psychotic symptoms defined by a score of 4 (moderate) or greater on any item of PANSS despite ziprasidone treatment were then randomised to either: 1. dose increase: ziprasidone 320 mg/day; dose could be decreased to 240 mg/day. N = 38; or 2. dose maintenance: ziprasidone 160 mg/day. N = 37. Rescue medication: benztropine, propranolol, lorazepam, zolpidem; no further details. | |
| Outcomes | Global state: clinically relevant response (defined as ≥20% PANSS total score reduction) Mental state: positive symptoms (PANSS positive subscore) Adverse effects: cardiac — QTc prolongation (number of participants with QTc longer than 500 msec) Unable to use: Leaving the study early (numbers not presented) Overall mental state (PANSS total score, no mean, no SD) Global state (change in CGI‐I, no SD; and CGI‐S, no mean, no SD) Negative symptoms (PANSS negative subscore, no mean, no SD) Depression (Calgary Depression Rating Scale (CDRS), no mean, no SD) Functioning (Global Assessment of Functioning, GAF, no mean, no SD) Adverse effects (EPS ‐ SAS (no mean, no SD), Akathisia ‐ BAS (no mean, no SD), tardive dyskinesia ‐ AIMS (no mean, no SD), Side Effect Checklist (no numbers), rate of adverse effects (no SD)) Vital signs (no numbers) Plasma levels (no SD) Cognition (Schizophrenia Cognition Rating Scale, no mean, no SD) | |
| Notes | ||
| Risk of bias | ||
| Bias | Authors' judgement | Support for judgement |
| Random sequence generation (selection bias) | Unclear risk | Quote: "...eligible patients were randomly assigned to ziprasidone 40 mg capsules or matching placebo in a 1:1 ratio stratified according to the duration of prior ziprasidone treatment..." (pg. 486); no further details. |
| Allocation concealment (selection bias) | Unclear risk | No details were presented |
| Blinding of participants and personnel (performance bias) | Unclear risk | Quote: " For the 8‐week double‐blind, placebo‐controlled trial..." (pg. 486); no further details. |
| Blinding of outcome assessment (detection bias) | Unclear risk | Quote: " For the 8‐week double‐blind, placebo‐controlled trial..." (pg. 486); no further details. |
| Incomplete outcome data (attrition bias) | High risk | 44% of the participants left the study early. Numbers per group as well as reasons for leaving the study early were not specified. For the primary outcome of clinically relevant response, only completers were analysed. |
| Selective reporting (reporting bias) | High risk | PANSS total score, PANSS negative sbscore, CGI, CDRS, SCoRS, SAS, BAS, AIMS, Side Effect Checklist, vital signs and plasma levels were assessed but no usable data were reported in the results. |
| Other bias | Low risk | No obvious risk for other bias |
| Methods | Allocation: randomised, 2:1 with a computerised schedule | |
| Participants | Diagnosis: schizophrenia or schizoaffective disorder (DSM IV) | |
| Interventions | All participants firstly received open‐label quetiapine treatment 800 mg/day for 4 weeks. Participants with persistent positive and negative symptoms and CGI≥4 despite quetiapine treatment were then randomised to either: 1. dose increase: quetiapine 1200 mg/day; dose could be decreased. N = 88; or 2. dose maintenance: quetiapine 800 mg/day. N = 43. Rescue medication: flurazepam, zaleplon, lorazepam, anticholinergic medication. | |
| Outcomes | Global state: clinically relevant response (defined as ≥ 20% PANSS total score reduction) Leaving the study early (due to side effects, any reason, inefficacy) Mental state: general mental state (PANSS total score), positive symptoms (PANSS positive subscore), negative symptoms (PANSS negative subscore) Global state (CGI‐Severity) Adverse effects: (at least one adverse effect, SAS (improved, no change, worsened), BAS (improved, no change, worsened), AIMS (improved, no change, worsened), death/suicide, BMI & weight increase, increase in heart rate, QTcF prolongation (≥450 ms), dizziness, headache, fatigue, somnolence, anxiety, dyskinesia, tremor). Functioning (SOFAS) Unable to use: Plasma levels, not a protocol outcome | |
| Notes | ||
| Risk of bias | ||
| Bias | Authors' judgement | Support for judgement |
| Random sequence generation (selection bias) | Low risk | Quote: "...randomised (2:1, with a computerized schedule) to supplementation with quetiapine or with placebo. The person who generated the randomization schedule was not involved in determining subject eligibility, administering treatment, or determining outcome." (pg. 14). |
| Allocation concealment (selection bias) | Low risk | Quote: "The person who generated the randomization schedule was not involved in determining subject eligibility, administering treatment, or determining outcome." (pg. 14). |
| Blinding of participants and personnel (performance bias) | Unclear risk | Quote: "...double‐blind, placebo‐controlled trial..." (pg. 13); no further details. |
| Blinding of outcome assessment (detection bias) | Unclear risk | Quote: "...double‐blind, placebo‐controlled trial..." (pg. 13); no further details. |
| Incomplete outcome data (attrition bias) | Low risk | 21.3% of the participants left the study early. Reasons for leaving the study early were described. An ITT approach was used. |
| Selective reporting (reporting bias) | Low risk | Free from selective reporting |
| Other bias | Low risk | No obvious risk for other bias |
| Methods | Randomisation: randomised, no further details | |
| Participants | Diagnosis: schizophrenia (DSM III); treatment resistant. | |
| Interventions | All participants firstly received single‐blind thiothixene 60 mg/day for 2 weeks to confirm treatment resistance e.g. not showing moderate improvement during the first 3 weeks of treatment. Participants were then randomised to either: 1. dose increase: thiothixene up to 400 mg/day. N = 25; or 2. dose maintenance: thiothixene 60 mg/day. N = 25. Rescue medication: benztropine; no further details. | |
| Outcomes | Global state: clinically relevant response (defined as moderate improvement in Roerig Global Scale (RGS) (Guy 1976)) Leaving the study early (due to adverse events, any reason and inefficacy) Mental state (BPRS total score, BPRS factors such as anxiety‐depression, anergia, thought disturbance, activity, hostility‐suspicion), Nurses Observation Scale for Inpatient Evaluation (NOSIE total score, NOSIE factors such as social competence, social interest, personal neatness, irritability, manifest psychosis, retardation, depression). Adverse effects (side effect check list, dystonia, dry mouth, blurred vision, drowsiness, orthostatic hypotension, tremor, dizziness, drooling, constipation, ataxia, akathisia, palpitations, headache, premature ventricular contractions). Unable to use: Vital signs (CBC, urinalysis, SMA‐12, ECG, blood pressure, pulse rate); no data were presented and not protocol outcomes. | |
| Notes | 50 participants were randomised. Eight of the 50 participants (4 in each group) showing moderate improvement on the RGS in the first 21 days were eliminated from the study as they were not considered to be treatment‐resistant. | |
| Risk of bias | ||
| Bias | Authors' judgement | Support for judgement |
| Random sequence generation (selection bias) | Unclear risk | Quote: "...randomly assigned..." (pg. 70); no further details |
| Allocation concealment (selection bias) | Unclear risk | No details were presented |
| Blinding of participants and personnel (performance bias) | Unclear risk | Quote: "...under double‐blind control to..." (pg. 70); no further details |
| Blinding of outcome assessment (detection bias) | Unclear risk | Quote: "...under double‐blind control to..." (pg. 70); no further details |
| Incomplete outcome data (attrition bias) | Unclear risk | Unclear whether all those who left early were reported. It may be that 26% (13/50) left the study early. |
| Selective reporting (reporting bias) | High risk | No usable data on vital signs were reported in the results |
| Other bias | Low risk | No obvious risk for other bias |
| Methods | Randomisation: randomised, stratified based on week 3 serum fluphenazine levels | |
| Participants | Diagnosis: schizophrenia, schizoaffective disorder or schizophreniform disorder (DSM III‐R) | |
| Interventions | All participants firstly received open label fluphenazine 20 mg/day for 4 weeks (N = 156). Participants who had a rating of worse than mild on each of the four BPRS psychotic items and a rating of less than much improved on the CGI‐I were considered non‐responders (N = 58) and were then randomised to: 1. dose increase: Fluphenazine 80 mg/day. N = 16; or 2. dose maintenance: Fluphenazine 20 mg/day. N = 18; or 3. additional intervention: haloperidol 20 mg/day. N = 13. Rescue medication: benztropine, no further details. | |
| Outcomes | Global state: clinically relevant response (defined as CGI‐I ≤ 2, at least much improved) Mental state: general (BRPS total score), negative symptoms (modified SANS) Unable to use: Extrapyramidal symptoms (modified SAS, no mean) | |
| Notes | ||
| Risk of bias | ||
| Bias | Authors' judgement | Support for judgement |
| Random sequence generation (selection bias) | Unclear risk | Quote: "Non responders were then randomly assigned to double‐blind treatment for...", "Subjects were stratified |
| Allocation concealment (selection bias) | Unclear risk | No details were presented |
| Blinding of participants and personnel (performance bias) | Unclear risk | Quote: "...double‐blind treatment..." (pg.310); no further details |
| Blinding of outcome assessment (detection bias) | Unclear risk | Quote: "...double‐blind treatment..." (pg.310); no further details |
| Incomplete outcome data (attrition bias) | Unclear risk | Outcome not addressed. Data were presented for 81% (47/58) of all randomised participants |
| Selective reporting (reporting bias) | High risk | SAS was used but scores were available only for two items, not total |
| Other bias | Low risk | No obvious risk for other bias |
| Methods | Randomisation: randomised, no further details | |
| Participants | Diagnosis: schizophrenia or schizoaffective disorder (DSM‐IV‐R); suboptimal past treatment response | |
| Interventions | All participants firstly received open label quetiapine 600 mg/day for 4 weeks. Participants who did not demonstrate an initial response to quetiapine treatment defined as ≤ 15% PANSS total score reduction were then randomised to either: 1. dose increase: quetiapine 1200 mg/day. N = 29; or 2. dose maintenance: quetiapine 600 mg/day. N = 31. Concomitant mood stabilisers on a stable dose for the past 2 months before trial initiation were allowed to continue. | |
| Outcomes | Global state: clinically relevant response (defined as ≥ 20% PANSS total score reduction) Leaving the study early (due to side effects, any reason, inefficacy) Mental state: general (PANSS total score), positive symptoms (PANSS positive subscore), negative symptoms (PANSS negative subscore) Adverse effects: (SAS, AIMS, BAS, BMI/weight change, orthostatic hypotension, somnolence, agitation, constipation, weight gain) Functional changes (Social‐Adaptive Functioning Evaluation ‐ SAFE) Aggressive behaviour (BARS total score at endpoint) Unable to use: Global state (CGI no numbers presented) Vital signs and ECG; no data presented and not protocol outcomes Laboratory values (ALT, AST, GGT, glukose, lactate dehydrogenase, cholesterol, triglycerides), not protocol outcomes | |
| Notes | ||
| Risk of bias | ||
| Bias | Authors' judgement | Support for judgement |
| Random sequence generation (selection bias) | Unclear risk | Quote: "...patients were randomly assigned to...", "Stratification was done at the time of randomization to avoid imbalances secondary to the presence of concomitant mood stabilizer medications or the use of benztropine (or other antiparkinsonian agents) at baseline." (pg. 161); no further details. |
| Allocation concealment (selection bias) | Unclear risk | No details were presented |
| Blinding of participants and personnel (performance bias) | Low risk | Quote: "This was a prospective, randomised, double‐blind, parallel group, 8‐week trial of...", "All clinical and research stuff (subject, caregiver, investigator, outcomes assessor), except for the research pharmacists, were blinded to the randomization status." (pg. 161). |
| Blinding of outcome assessment (detection bias) | Low risk | Quote: "This was a prospective, randomised, double‐blind, parallel group, 8‐week trial of...", "All clinical and research stuff (subject, caregiver, investigator, outcomes assessor), except for the research pharmacists, were blinded to the randomization status." (pg. 161). |
| Incomplete outcome data (attrition bias) | High risk | 53.3% of the participants left the study early. Numbers per group as well as reasons for leaving the study early were specified. Last observation carried forward (LOCF) methods were used. |
| Selective reporting (reporting bias) | High risk | Data on CGI, vital signs and ECG were not reported in the results. |
| Other bias | Low risk | No obvious risk for other bias |
| Methods | Randomisation: randomised, no further details | |
| Participants | Diagnosis: acute schizophrenia, no further details N = 95 History: no details | |
| Interventions | Participants were firstly randomised to double‐blind treatment with lurasidone 20 mg/day, lurasidone 80 mg/day, or placebo. After 2 weeks, only participants who were randomised to lurasidone 80 mg/day (N = 198) and showed < 20% PANSS total score reduction, were re‐randomised to either: 1. dose increase: lurasidone 160 mg/day. N = 43; or 2. dose maintenance: lurasidone 80 mg/day. N = 52. Rescue medication: no details | |
| Outcomes | Leaving the study early: due to side effects Mental state: general (PANSS total score) Global state (CGI‐Severity change) Unable to use: Weight gain (not separately presented for the two groups) | |
| Notes | ||
| Risk of bias | ||
| Bias | Authors' judgement | Support for judgement |
| Random sequence generation (selection bias) | Unclear risk | Quote: "Eligible patients were randomised to..." (pg. 476); no further details |
| Allocation concealment (selection bias) | Unclear risk | No details are presented |
| Blinding of participants and personnel (performance bias) | Unclear risk | Quote: "...to double‐blind treatment with..." (pg. 476); no further details |
| Blinding of outcome assessment (detection bias) | Unclear risk | Quote: "...to double‐blind treatment with..." (pg. 476); no further details |
| Incomplete outcome data (attrition bias) | Unclear risk | Outcome not addressed |
| Selective reporting (reporting bias) | Unclear risk | Insufficient information to permit judgement |
| Other bias | Low risk | No obvious risk for other bias |
| Methods | Randomisation: randomised, no further details | |
| Participants | Diagnosis: schizophrenia or schizoaffective disorder (RDC). N = 48 History: no details | |
| Interventions | All participants firstly received open label haloperidol at antipsychotic threshold (NT)* for at least 2 weeks. Non‐responding participants (not ready for discharge) were then randomised to either: 1. dose increase: haloperidol at a dosage two to ten times higher than NT dosage; mean 11.6 mg/day (SD = 4.7). N = 25; or 2. dose maintenance: haloperidol at NT dosage; mean 3.4 mg/day (SD = 2.3). N = 23. Rescue medication: biperiden, lorazepam, diphenhydramine, no further details | |
| Outcomes | Global state: clinically relevant response (defined as BPRS total score ≤ 32 (16 items), with all psychosis items (conceptual disorganisation, hallucinatory behavior, hostility, suspiciousness. and unusual thought content) rated "mild" or less; their CGl global severity item was rated "mild" or less; and their CGI global change item was rated at least "moderately improved"). Leaving the study early: due to adverse events Mental sate: general (BRPS total score) Global state (CGI‐S) Unable to use: Negative symptoms: Wing negative symptoms scale (no mean, no SD) Mental state; self‐report of perceived medication effects: Medication Response Questionnaire (no mean, no SD) Adverse events: Extrapyramidal Side Effects Scale (no mean, no SD) and anticholonergic side effects (no numbers presented) | |
| Notes | * Antipsychotic threshold (NT): the lowest antipsychotic dosage at which individual patients develop slight increase in rigidity is hypothesised to correspond to the lowest dosages at which these patients attain maximum antipsychotic benefit (Haase 1961). ** Response criterion: BPRS total score ≤ 32 (16 items), with all psychosis items (conceptual disorganisation, hallucinatory behaviour, hostility, suspiciousness. and unusual thought content) rated "mild" or less; their CGl global severity item was rated "mild" or less; and their CGI global change item was rated at least "moderately improved". | |
| Risk of bias | ||
| Bias | Authors' judgement | Support for judgement |
| Random sequence generation (selection bias) | Unclear risk | Quote: "...patients were randomly assigned..." (pg. 740); no further details |
| Allocation concealment (selection bias) | Unclear risk | No details are presented |
| Blinding of participants and personnel (performance bias) | Unclear risk | Quote: "...on a double‐blind basis..." (pg. 740); no further details |
| Blinding of outcome assessment (detection bias) | Unclear risk | Quote: "...on a double‐blind basis..." (pg. 740); no further details |
| Incomplete outcome data (attrition bias) | Low risk | An ITT approach was used. 8.3% (4/48) of participants left the study early due to severe extrapyramidal side effects. This is probably the overall attrition rate. |
| Selective reporting (reporting bias) | High risk | Wing negative symptom scale, Medication Response Questionnaire, Extrapyramidal Side Effects Scale and anticholinergic side effects were not presented separately for the group of non‐responders |
| Other bias | Low risk | No obvious risk for other bias |
| Methods | Randomisation: randomised, no further details | |
| Participants | Diagnosis: schizophrenia, schizophreniform, schizoaffective, delusional disorder, psychotic disorder not otherwise specified, or brief psychosis (DSM‐IV); first psychotic episode | |
| Interventions | All participants firstly received open label risperidone 2 mg/day for 4 weeks. Participants who were considered 'slow responders' defined as a score of > 3 on each of the BPRS psychosis subscale items (i.e. mild), a CGI‐S > 3, and a CGI‐I > 3 were then randomised to: 1. dose increase: risperidone 3 or 4 mg/day (if required). N = 9; or 2. dose maintenance: risperidone 2 mg/day. N = 8; or 3. additional intervention: risperidone 2 mg/day with addition of lithium, titrated up to therapeutic levels (0.6 to 1.2 mmol). N = 9. | |
| Outcomes | Global state: clinically relevant response (defined as ≥ 20% BPRS total score reduction) Global state (CGI‐I, no numbers) Extrapyramidal adverse events (not separately presented for the group of 'slow responders') and weight gain (no SD). | |
| Notes | ||
| Risk of bias | ||
| Bias | Authors' judgement | Support for judgement |
| Random sequence generation (selection bias) | Unclear risk | Quote: "...slow responders were randomised..." (pg. 3); no further details |
| Allocation concealment (selection bias) | Unclear risk | No details are presented |
| Blinding of participants and personnel (performance bias) | High risk | Quote: "...randomised single blind to one of three open treatment groups" (pg. 3); no further details |
| Blinding of outcome assessment (detection bias) | Unclear risk | Quote: "...randomised single blind to one of three open treatment groups" (pg. 3); no further details |
| Incomplete outcome data (attrition bias) | Low risk | 19.2% (5/26) participants left the study early. A LOCF approach was adopted for analysis of Phase II data |
| Selective reporting (reporting bias) | High risk | Original study author sent us data on most outcomes but data on CGI‐I, extrapyramidal side effects and weight gain were not reported. |
| Other bias | Low risk | No obvious risk for other bias |
| Methods | Randomisation: randomised to 1 of the 2 treatment groups in a 1:1 ratio by simple randomisation stratified by their antipsychotic type and treatment setting; computer‐generated randomisation list. | |
| Participants | Diagnosis: schizophrenia, schizoaffective or persistent delusional disorder (ICD‐10) N = 103 History: duration of illness ‒ mean 16.05 years (SD = 14.4); total duration of antipsychotic treatment‐ mean 10.9 years (SD = 14). | |
| Interventions | All participants had been receiving olanzapine 10 mg/day or risperidone 3 mg/day for at least 4 weeks. Participants who had a total score ≥ 60 on the PANSS, ≥ 3 on the CGI‐S, and ≤ 70 on the GAF were considered non‐responders and were randomised to either: 1. dose increase: olanzapine 20 mg/day or risperidone 6 mg/day (double antipsychotic dose). N = 52; or 2. dose maintenance: olanzapine 10 mg/day or risperidone 3 mg/day. N = 51. | |
| Outcomes | Global state: clinically relevant response (defined as ≥ 25% PANSS total score reduction) Mental state: general (PANSS total score), positive symptoms (PANSS positive subscore), negative symptoms (PANSS negative subscore) Global state (CGI‐I) Functioning: overall (GAF) Adverse effects (EPS ‐ SAS, Akathisia ‐ BAS, tardive dyskinesia ‐ AIMS) Unable to use: Global state: CGI‐S (no mean, no SD) Plasma concentrations, not a protocol outcome | |
| Notes | ||
| Risk of bias | ||
| Bias | Authors' judgement | Support for judgement |
| Random sequence generation (selection bias) | Low risk | Quote: "...randomly allocated to 1 of the 2 treatment groups in a 1:1 ratio by simple randomization stratified by their antipsychotic type (ie, olanzapine or risperidone) and treatment setting (ie, inpatient or outpatient)....according to a computer‐generated randomization list..." (pg. 1382). |
| Allocation concealment (selection bias) | Low risk | Quote: "The person who was independent of this study in the central office prepared a piece of paper on which 1 of the assigned groups was designated according to a computer‐generated randomization list, inserted it into an envelope on which a participant ID number was written, and sealed it. Upon registration of each participant, 1 of the investigators opened the envelope that corresponded to the participant's ID, and the person who prepared the envelopes confirmed that the envelopes were appropriately opened." (pg. 1382). |
| Blinding of participants and personnel (performance bias) | Low risk | Quote: "During the 4‐week observation, all antipsychotic drugs were provided in identical powder form in amount and color with lactose added... Thus, the participants were blinded to their allocated intervention." (pg. 1382). |
| Blinding of outcome assessment (detection bias) | Low risk | Quote: "The following assessments were performed by assessors who were blinded to the allocation..." (pg. 1383). |
| Incomplete outcome data (attrition bias) | Low risk | Significantly more participants in the dose increase group (30.8%) than in the dose continuation group (13.7%) left the study early due to side effects. Reasons for leaving the study early were described. An ITT approach was used. Results between ITT analysis and only competers were similar. |
| Selective reporting (reporting bias) | High risk | CGI‐S was used but scores at endpoint were not available |
| Other bias | Low risk | No obvious risk for other bias |
Scales
AIMS: Abnormal Involuntary Movement Score BAS: Barnes Akathisia Scale
BARS: Behavioral Activity Rating Scale
BAS: Barnes Akathisia Rating Scale
BPRS: Brief Psychiatric Rating Scale
CDRS: Calgary Depression Rating Scale
CGI‐I: Clinical Global impression‐Improvement
CGI‐S: Clinical Global impression‐Severity
CPRS: Comprehensive Psychopathological Rating Scale
GAF: Global Assessment of Functioning
HQLS: Heinrichs‐Carpenter‐Hanlon Quality of Life Scale
NOSIE: Nurse's Observation Scale for Inpatient Evaluation
PANSS: Positive and Negative Syndrome Scale for Schizophrenia
RGS: Roering Global Scale
SAFE: Social‐Adaptive Functioning Evaluation
SANS: Scale for the Assessment of Negative Symptoms
SAS: Simpson Angus Scale
SCoRS: Schizophrenia Cognition Rating Scale
SOFAS: Social and Occupational Functioning Scale
Diagnostic Tools
DSM: Diagnostic and Statistical Manual of Mental Disorders
ICD: International Classification of Diseases
RDC: Research Diagnostic Criteria for schizophrenia or schizoaffective disorders
Others
BMI: Body‐mass‐index
ECG: Electrocardiogram
EPS: Extrapyramidal Symptoms
ITT: Intention‐to‐treat
LOCF: Last observation carried forward
mg: Milligram
msec: Millisecond
N: Number
n.i.: Not indicated
SD: Standard deviation
Characteristics of excluded studies [ordered by study ID]
Ir a:
| Study | Reason for exclusion |
| Allocation: not randomised | |
| Allocation: randomised | |
| Allocation: not randomised | |
| Allocation: randomised | |
| Allocation: not indicated | |
| Allocation: randomised | |
| Allocation: randomised | |
| Allocation: randomised | |
| Allocation: randomised | |
| Allocation: not indicated | |
| Allocation: distributed by drawing of lots | |
| Allocation: randomised | |
| Allocation: randomised | |
| Allocation: randomised | |
| Allocation: not indicated | |
| Allocation: randomised | |
| Allocation: not randomised for non‐responders | |
| Allocation: randomised Interventions: 250 mg fluphenazine enanthate per week versus 12.5 mg fluphenazine enanthate per week. | |
| Allocation: randomised | |
| Allocation: not indicated | |
| Allocation: randomised | |
| Allocation: not indicated | |
| Allocation: not indicated | |
| Allocation: randomised | |
| Allocation: not indicated. | |
| Allocation: randomised. | |
| Allocation: not indicated. | |
| Allocation: randomised. Participants: schizophrenia; no run‐in phase to confirm that participants have not responded to their current antipsychotic treatment. | |
| Allocation: randomised | |
| Allocation: randomised | |
| Allocation: randomised | |
| Allocation: randomised | |
| Allocation: randomised | |
| Allocation: randomised | |
| Allocation: randomised | |
| Allocation: randomised | |
| Allocation: not randomised for the group of non‐responders |
Data and analyses
| Outcome or subgroup title | No. of studies | No. of participants | Statistical method | Effect size |
| 1 Global state: 1a. Clinically relevant response as defined by trials Show forest plot | 9 | 533 | Risk Ratio (M‐H, Random, 95% CI) | 1.09 [0.86, 1.40] |
| Analysis 1.1  Comparison 1 Antipsychotic dose increase versus antipsychotic dose maintenance, Outcome 1 Global state: 1a. Clinically relevant response as defined by trials. | ||||
| 2 Global state: 1b. Any change (improvement in Global Assesment scale) Show forest plot | 1 | 23 | Risk Ratio (M‐H, Random, 95% CI) | 0.76 [0.32, 1.80] |
| Analysis 1.2 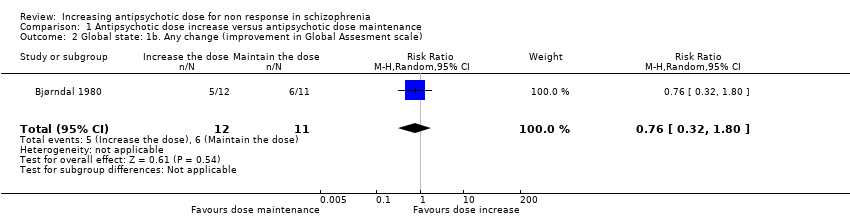 Comparison 1 Antipsychotic dose increase versus antipsychotic dose maintenance, Outcome 2 Global state: 1b. Any change (improvement in Global Assesment scale). | ||||
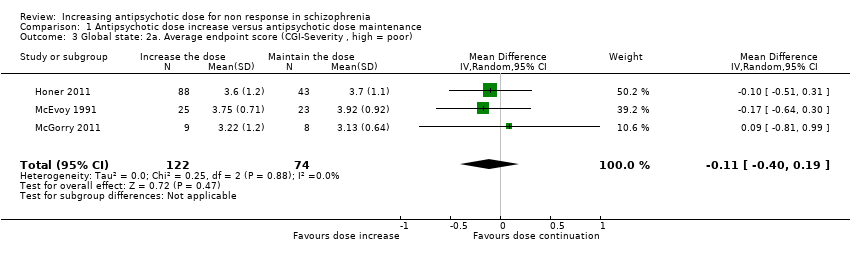
| 3 Global state: 2a. Average endpoint score (CGI‐Severity , high = poor) Show forest plot | 3 | 196 | Mean Difference (IV, Random, 95% CI) | ‐0.11 [‐0.40, 0.19] |
| Analysis 1.3  Comparison 1 Antipsychotic dose increase versus antipsychotic dose maintenance, Outcome 3 Global state: 2a. Average endpoint score (CGI‐Severity , high = poor). | ||||
| 4 Global state: 2b. Average change score ( CGI‐Severity, high = poor) Show forest plot | 1 | 95 | Mean Difference (IV, Random, 95% CI) | ‐0.4 [‐0.80, ‐0.00] |
| Analysis 1.4  Comparison 1 Antipsychotic dose increase versus antipsychotic dose maintenance, Outcome 4 Global state: 2b. Average change score ( CGI‐Severity, high = poor). | ||||
| 5 Global state: 2c. Average endpoint score (CGI‐Improvement, high = poor) Show forest plot | 1 | 103 | Mean Difference (IV, Random, 95% CI) | 0.0 [‐0.35, 0.35] |
| Analysis 1.5  Comparison 1 Antipsychotic dose increase versus antipsychotic dose maintenance, Outcome 5 Global state: 2c. Average endpoint score (CGI‐Improvement, high = poor). | ||||
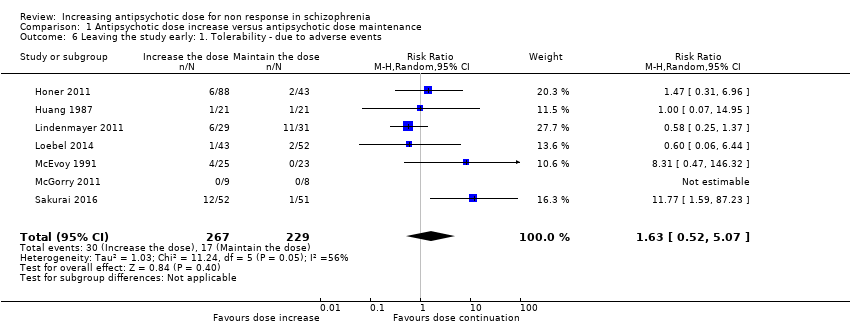
| 6 Leaving the study early: 1. Tolerability ‐ due to adverse events Show forest plot | 7 | 496 | Risk Ratio (M‐H, Random, 95% CI) | 1.63 [0.52, 5.07] |
| Analysis 1.6  Comparison 1 Antipsychotic dose increase versus antipsychotic dose maintenance, Outcome 6 Leaving the study early: 1. Tolerability ‐ due to adverse events. | ||||
| 7 Leaving the study early: 2. Acceptability of treatment ‐ due to any reason Show forest plot | 5 | 353 | Risk Ratio (M‐H, Random, 95% CI) | 1.30 [0.89, 1.90] |
| Analysis 1.7  Comparison 1 Antipsychotic dose increase versus antipsychotic dose maintenance, Outcome 7 Leaving the study early: 2. Acceptability of treatment ‐ due to any reason. | ||||
| 8 Leaving the study early: 3. Efficacy ‐ due to inefficacy Show forest plot | 4 | 336 | Risk Ratio (M‐H, Random, 95% CI) | 0.82 [0.30, 2.28] |
| Analysis 1.8 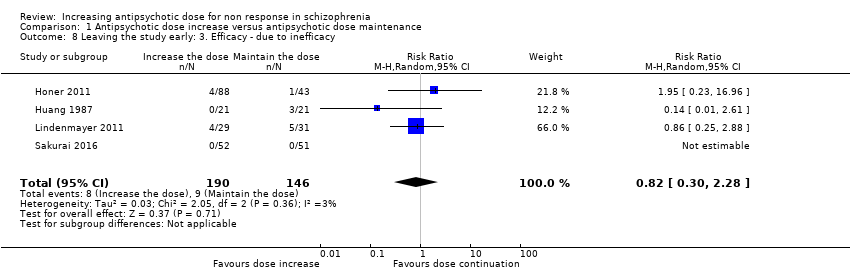 Comparison 1 Antipsychotic dose increase versus antipsychotic dose maintenance, Outcome 8 Leaving the study early: 3. Efficacy ‐ due to inefficacy. | ||||
| 9 Mental state: 1a. General ‐ average endpoint score (PANSS total, high = poor) Show forest plot | 2 | 191 | Mean Difference (IV, Random, 95% CI) | ‐1.81 [‐7.31, 3.69] |
| Analysis 1.9 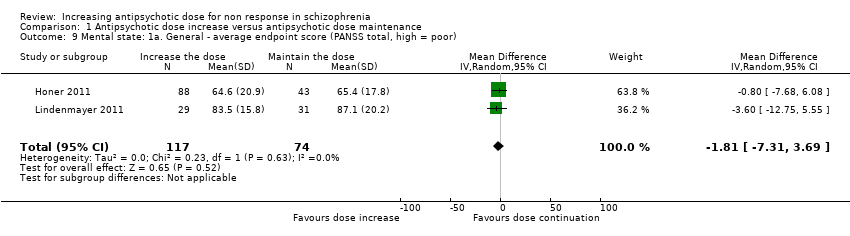 Comparison 1 Antipsychotic dose increase versus antipsychotic dose maintenance, Outcome 9 Mental state: 1a. General ‐ average endpoint score (PANSS total, high = poor). | ||||
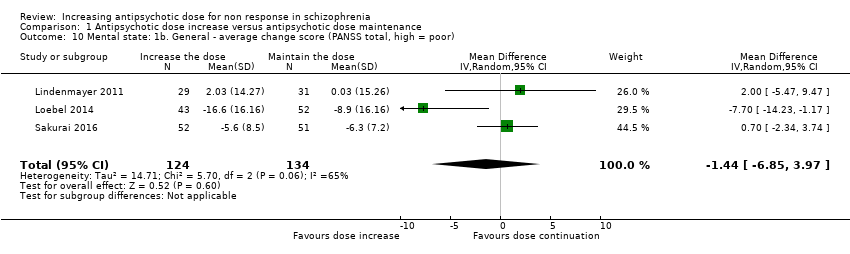
| 10 Mental state: 1b. General ‐ average change score (PANSS total, high = poor) Show forest plot | 3 | 258 | Mean Difference (IV, Random, 95% CI) | ‐1.44 [‐6.85, 3.97] |
| Analysis 1.10  Comparison 1 Antipsychotic dose increase versus antipsychotic dose maintenance, Outcome 10 Mental state: 1b. General ‐ average change score (PANSS total, high = poor). | ||||
| 11 Mental state: 1c. General ‐ average endpoint and/or change score (PANSS total, high = poor) Show forest plot | 4 | 389 | Mean Difference (IV, Random, 95% CI) | ‐2.13 [‐6.16, 1.90] |
| Analysis 1.11 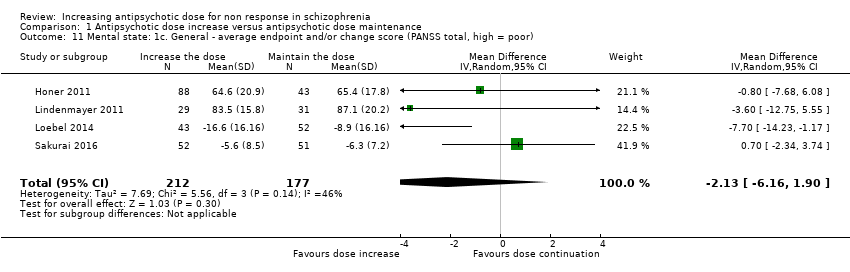 Comparison 1 Antipsychotic dose increase versus antipsychotic dose maintenance, Outcome 11 Mental state: 1c. General ‐ average endpoint and/or change score (PANSS total, high = poor). | ||||
| 12 Mental state: 1d. General ‐ average endpoint score (BPRS total, high = poor) Show forest plot | 3 | 99 | Mean Difference (IV, Random, 95% CI) | ‐1.25 [‐4.60, 2.11] |
| Analysis 1.12 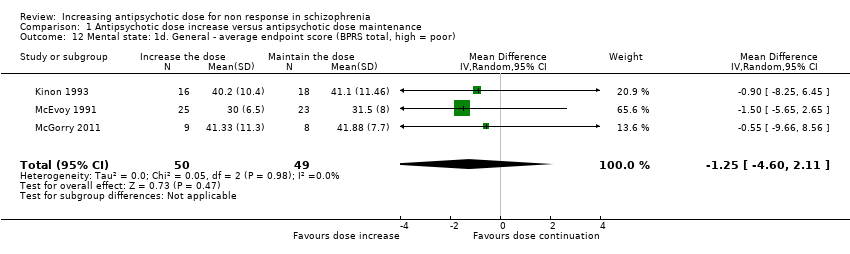 Comparison 1 Antipsychotic dose increase versus antipsychotic dose maintenance, Outcome 12 Mental state: 1d. General ‐ average endpoint score (BPRS total, high = poor). | ||||
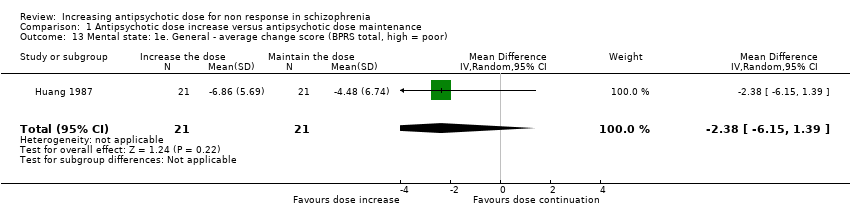
| 13 Mental state: 1e. General ‐ average change score (BPRS total, high = poor) Show forest plot | 1 | 42 | Mean Difference (IV, Random, 95% CI) | ‐2.38 [‐6.15, 1.39] |
| Analysis 1.13  Comparison 1 Antipsychotic dose increase versus antipsychotic dose maintenance, Outcome 13 Mental state: 1e. General ‐ average change score (BPRS total, high = poor). | ||||
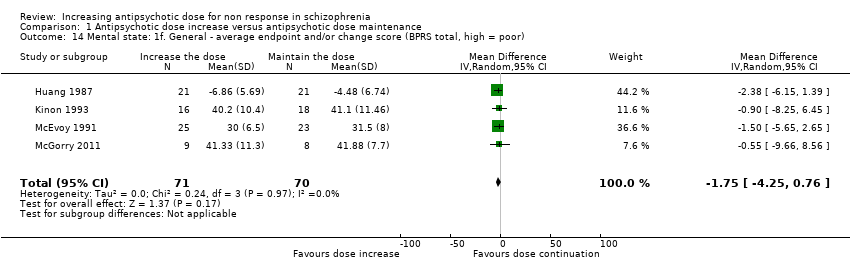
| 14 Mental state: 1f. General ‐ average endpoint and/or change score (BPRS total, high = poor) Show forest plot | 4 | 141 | Mean Difference (IV, Random, 95% CI) | ‐1.75 [‐4.25, 0.76] |
| Analysis 1.14  Comparison 1 Antipsychotic dose increase versus antipsychotic dose maintenance, Outcome 14 Mental state: 1f. General ‐ average endpoint and/or change score (BPRS total, high = poor). | ||||
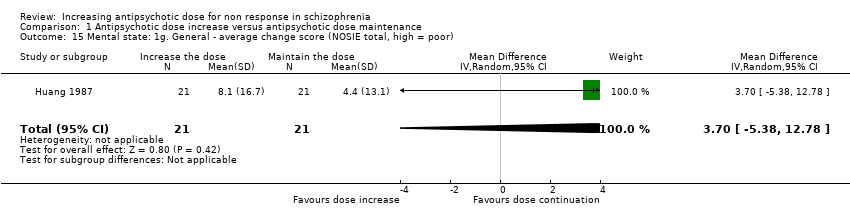
| 15 Mental state: 1g. General ‐ average change score (NOSIE total, high = poor) Show forest plot | 1 | 42 | Mean Difference (IV, Random, 95% CI) | 3.70 [‐5.38, 12.78] |
| Analysis 1.15  Comparison 1 Antipsychotic dose increase versus antipsychotic dose maintenance, Outcome 15 Mental state: 1g. General ‐ average change score (NOSIE total, high = poor). | ||||
| 16 Mental state: 2a. Positive symptoms ‐ Clinically important change Show forest plot | 1 | 17 | Risk Ratio (M‐H, Random, 95% CI) | 1.33 [0.58, 3.07] |
| Analysis 1.16  Comparison 1 Antipsychotic dose increase versus antipsychotic dose maintenance, Outcome 16 Mental state: 2a. Positive symptoms ‐ Clinically important change. | ||||
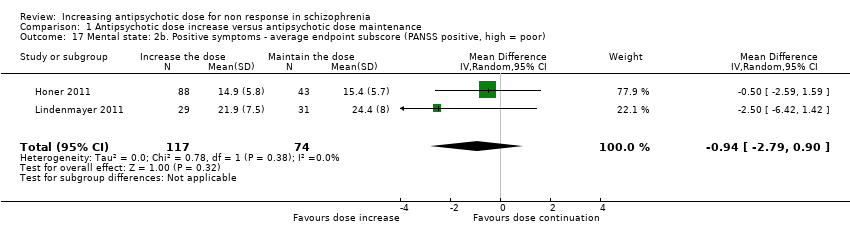
| 17 Mental state: 2b. Positive symptoms ‐ average endpoint subscore (PANSS positive, high = poor) Show forest plot | 2 | 191 | Mean Difference (IV, Random, 95% CI) | ‐0.94 [‐2.79, 0.90] |
| Analysis 1.17  Comparison 1 Antipsychotic dose increase versus antipsychotic dose maintenance, Outcome 17 Mental state: 2b. Positive symptoms ‐ average endpoint subscore (PANSS positive, high = poor). | ||||
| 18 Mental state: 2c. Positive symptoms ‐ average change subscore (PANSS positive, high = poor) Show forest plot | 3 | 238 | Mean Difference (IV, Random, 95% CI) | 0.04 [‐1.31, 1.40] |
| Analysis 1.18 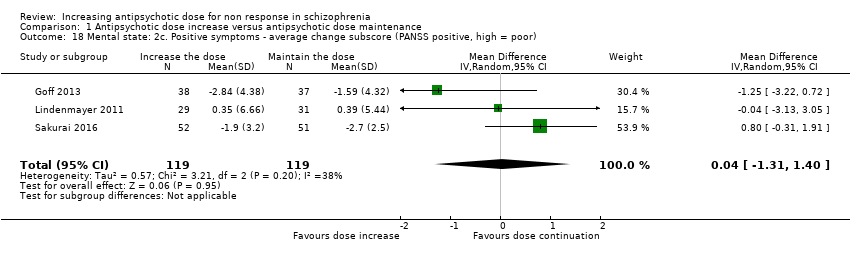 Comparison 1 Antipsychotic dose increase versus antipsychotic dose maintenance, Outcome 18 Mental state: 2c. Positive symptoms ‐ average change subscore (PANSS positive, high = poor). | ||||
| 19 Mental state: 2d. Positive symptoms ‐ average endpoint subscore (BPRS positive,high = poor) Show forest plot | 1 | 17 | Mean Difference (IV, Random, 95% CI) | 0.40 [‐2.94, 3.74] |
| Analysis 1.19 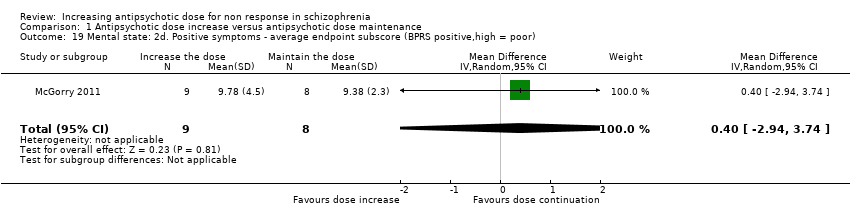 Comparison 1 Antipsychotic dose increase versus antipsychotic dose maintenance, Outcome 19 Mental state: 2d. Positive symptoms ‐ average endpoint subscore (BPRS positive,high = poor). | ||||
| 20 Mental state: 3a. Negative symptoms ‐ average endpoint subscore (PANSS negative, high = poor) Show forest plot | 2 | 191 | Mean Difference (IV, Random, 95% CI) | 0.32 [‐1.48, 2.11] |
| Analysis 1.20  Comparison 1 Antipsychotic dose increase versus antipsychotic dose maintenance, Outcome 20 Mental state: 3a. Negative symptoms ‐ average endpoint subscore (PANSS negative, high = poor). | ||||
| 21 Mental state: 3b. Negative symptoms ‐ average change subscore (PANSS negative, high = poor) Show forest plot | 2 | 163 | Mean Difference (IV, Random, 95% CI) | ‐0.15 [‐0.96, 0.67] |
| Analysis 1.21  Comparison 1 Antipsychotic dose increase versus antipsychotic dose maintenance, Outcome 21 Mental state: 3b. Negative symptoms ‐ average change subscore (PANSS negative, high = poor). | ||||
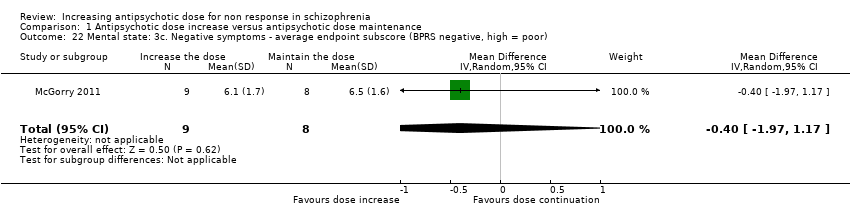
| 22 Mental state: 3c. Negative symptoms ‐ average endpoint subscore (BPRS negative, high = poor) Show forest plot | 1 | 17 | Mean Difference (IV, Random, 95% CI) | ‐0.40 [‐1.97, 1.17] |
| Analysis 1.22  Comparison 1 Antipsychotic dose increase versus antipsychotic dose maintenance, Outcome 22 Mental state: 3c. Negative symptoms ‐ average endpoint subscore (BPRS negative, high = poor). | ||||
| 23 Mental state: 3d. Negative symptoms ‐ average endpoint score (SANS, high = poor) Show forest plot | 1 | 34 | Mean Difference (IV, Random, 95% CI) | 1.5 [‐14.33, 17.33] |
| Analysis 1.23  Comparison 1 Antipsychotic dose increase versus antipsychotic dose maintenance, Outcome 23 Mental state: 3d. Negative symptoms ‐ average endpoint score (SANS, high = poor). | ||||
| 24 Adverse effects ‐ At least one adverse effect Show forest plot | 2 | 191 | Risk Ratio (M‐H, Random, 95% CI) | 0.91 [0.55, 1.50] |
| Analysis 1.24 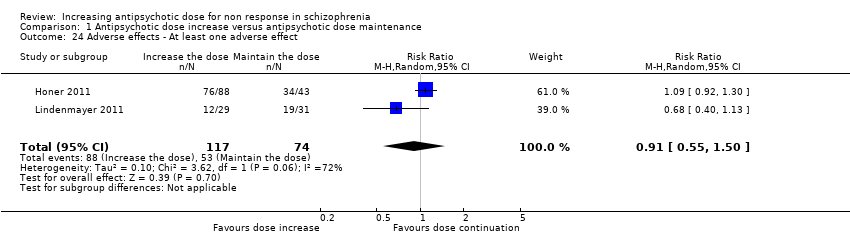 Comparison 1 Antipsychotic dose increase versus antipsychotic dose maintenance, Outcome 24 Adverse effects ‐ At least one adverse effect. | ||||
| 25 Adverse effects ‐ Cardiac: QTc prolongation Show forest plot | 2 | 206 | Risk Ratio (M‐H, Random, 95% CI) | 2.47 [0.12, 50.39] |
| Analysis 1.25 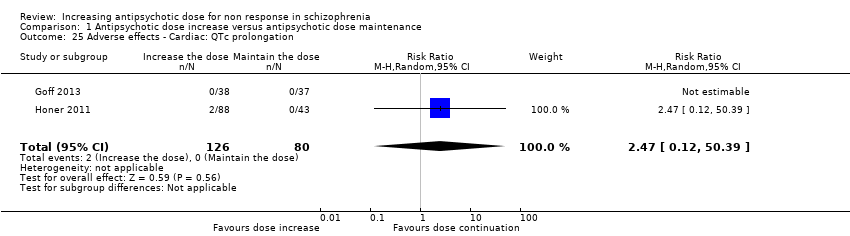 Comparison 1 Antipsychotic dose increase versus antipsychotic dose maintenance, Outcome 25 Adverse effects ‐ Cardiac: QTc prolongation. | ||||
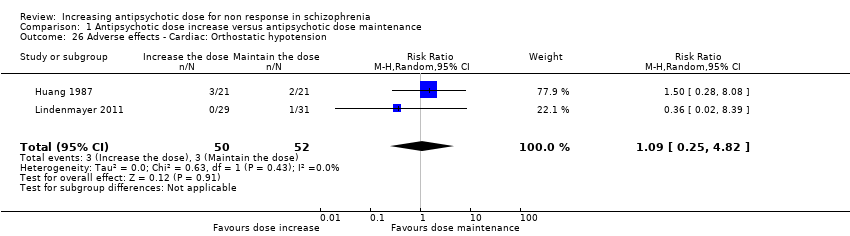
| 26 Adverse effects ‐ Cardiac: Orthostatic hypotension Show forest plot | 2 | 102 | Risk Ratio (M‐H, Random, 95% CI) | 1.09 [0.25, 4.82] |
| Analysis 1.26  Comparison 1 Antipsychotic dose increase versus antipsychotic dose maintenance, Outcome 26 Adverse effects ‐ Cardiac: Orthostatic hypotension. | ||||
| 27 Adverse effects ‐ Cardiac: Palpitations Show forest plot | 1 | 42 | Risk Ratio (M‐H, Random, 95% CI) | 3.0 [0.13, 69.70] |
| Analysis 1.27  Comparison 1 Antipsychotic dose increase versus antipsychotic dose maintenance, Outcome 27 Adverse effects ‐ Cardiac: Palpitations. | ||||
| 28 Adverse effects ‐ Cardiac: Premature Ventricular Contractions Show forest plot | 1 | 42 | Risk Ratio (M‐H, Random, 95% CI) | 3.0 [0.13, 69.70] |
| Analysis 1.28  Comparison 1 Antipsychotic dose increase versus antipsychotic dose maintenance, Outcome 28 Adverse effects ‐ Cardiac: Premature Ventricular Contractions. | ||||
| 29 Adverse effects ‐ Constipation Show forest plot | 2 | 102 | Risk Ratio (M‐H, Random, 95% CI) | 1.53 [0.44, 5.38] |
| Analysis 1.29 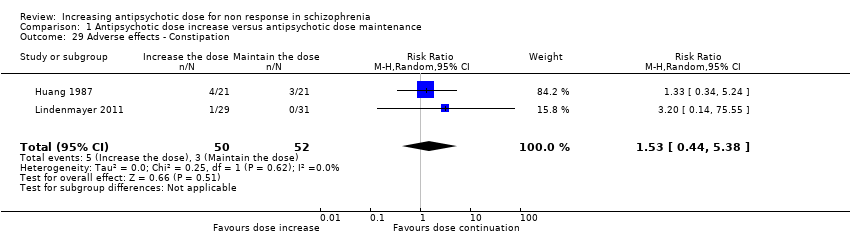 Comparison 1 Antipsychotic dose increase versus antipsychotic dose maintenance, Outcome 29 Adverse effects ‐ Constipation. | ||||
| 30 Adverse effects ‐ Dizziness Show forest plot | 2 | 173 | Risk Ratio (M‐H, Random, 95% CI) | 0.77 [0.41, 1.44] |
| Analysis 1.30  Comparison 1 Antipsychotic dose increase versus antipsychotic dose maintenance, Outcome 30 Adverse effects ‐ Dizziness. | ||||
| 31 Adverse effects ‐ Drooling Show forest plot | 1 | 42 | Risk Ratio (M‐H, Random, 95% CI) | 2.0 [0.20, 20.41] |
| Analysis 1.31  Comparison 1 Antipsychotic dose increase versus antipsychotic dose maintenance, Outcome 31 Adverse effects ‐ Drooling. | ||||
| 32 Adverse effects ‐ Death (suicide or naturalistic cause) Show forest plot | 1 | 131 | Risk Ratio (M‐H, Random, 95% CI) | 0.0 [0.0, 0.0] |
| Analysis 1.32 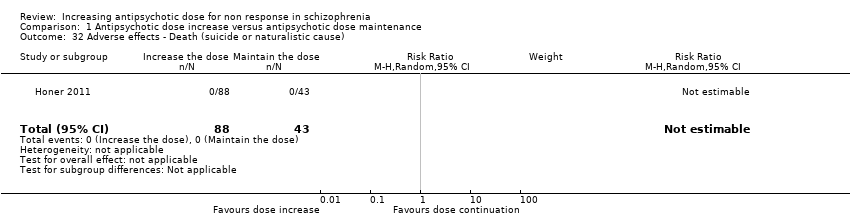 Comparison 1 Antipsychotic dose increase versus antipsychotic dose maintenance, Outcome 32 Adverse effects ‐ Death (suicide or naturalistic cause). | ||||
| 33 Adverse effects ‐ Extrapyramidal: Categorical deterioration (AIMS, high = poor) Show forest plot | 1 | 131 | Risk Ratio (M‐H, Random, 95% CI) | 1.38 [0.59, 3.26] |
| Analysis 1.33  Comparison 1 Antipsychotic dose increase versus antipsychotic dose maintenance, Outcome 33 Adverse effects ‐ Extrapyramidal: Categorical deterioration (AIMS, high = poor). | ||||
| 34 Adverse effects ‐ Extrapyramidal: average endpoint score (AIMS, high = poor) Show forest plot | 1 | 60 | Mean Difference (IV, Random, 95% CI) | 0.7 [‐0.87, 2.27] |
| Analysis 1.34 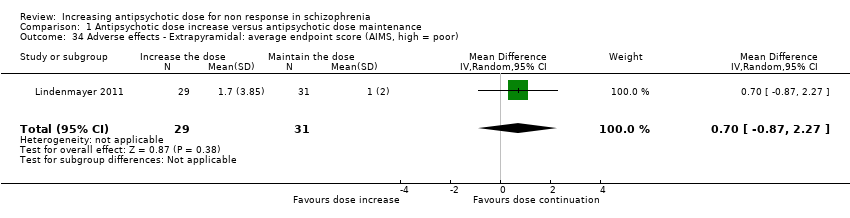 Comparison 1 Antipsychotic dose increase versus antipsychotic dose maintenance, Outcome 34 Adverse effects ‐ Extrapyramidal: average endpoint score (AIMS, high = poor). | ||||
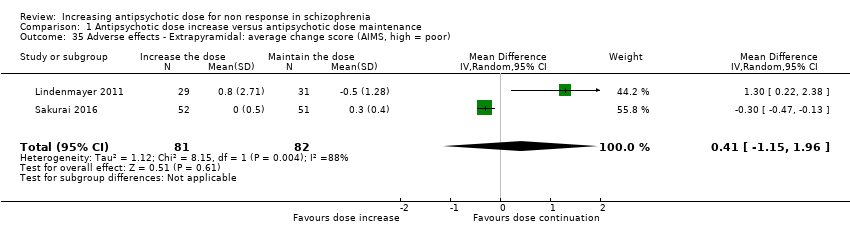
| 35 Adverse effects ‐ Extrapyramidal: average change score (AIMS, high = poor) Show forest plot | 2 | 163 | Mean Difference (IV, Random, 95% CI) | 0.41 [‐1.15, 1.96] |
| Analysis 1.35  Comparison 1 Antipsychotic dose increase versus antipsychotic dose maintenance, Outcome 35 Adverse effects ‐ Extrapyramidal: average change score (AIMS, high = poor). | ||||
| 36 Adverse effects ‐ Extrapyramidal: akathisia Show forest plot | 2 | 65 | Risk Ratio (M‐H, Random, 95% CI) | 0.74 [0.04, 14.02] |
| Analysis 1.36  Comparison 1 Antipsychotic dose increase versus antipsychotic dose maintenance, Outcome 36 Adverse effects ‐ Extrapyramidal: akathisia. | ||||
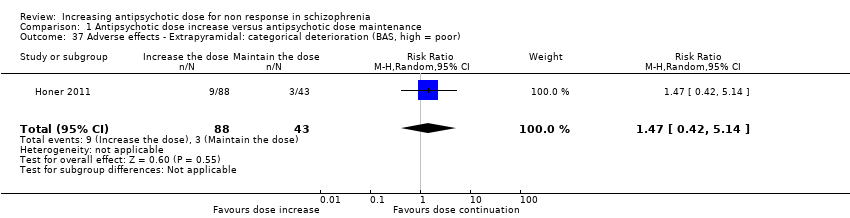
| 37 Adverse effects ‐ Extrapyramidal: categorical deterioration (BAS, high = poor) Show forest plot | 1 | 131 | Risk Ratio (M‐H, Random, 95% CI) | 1.47 [0.42, 5.14] |
| Analysis 1.37  Comparison 1 Antipsychotic dose increase versus antipsychotic dose maintenance, Outcome 37 Adverse effects ‐ Extrapyramidal: categorical deterioration (BAS, high = poor). | ||||
| 38 Adverse effects ‐ Extrapyramidal: average endpoint score (BAS, high = poor) Show forest plot | 1 | 60 | Mean Difference (IV, Random, 95% CI) | ‐0.2 [‐0.74, 0.34] |
| Analysis 1.38 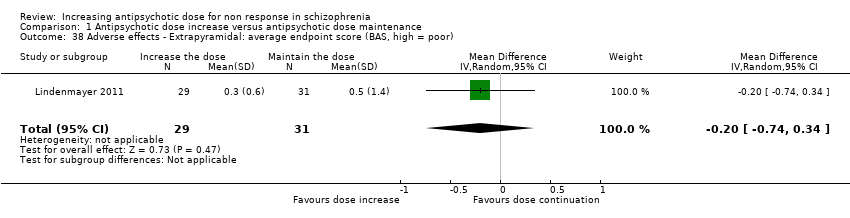 Comparison 1 Antipsychotic dose increase versus antipsychotic dose maintenance, Outcome 38 Adverse effects ‐ Extrapyramidal: average endpoint score (BAS, high = poor). | ||||
| 39 Adverse effects ‐ Extrapyramidal: average change score (BAS, high = poor) Show forest plot | 2 | 163 | Mean Difference (IV, Random, 95% CI) | ‐0.11 [‐0.59, 0.37] |
| Analysis 1.39 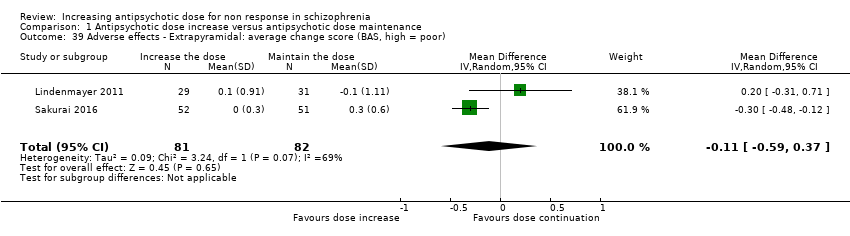 Comparison 1 Antipsychotic dose increase versus antipsychotic dose maintenance, Outcome 39 Adverse effects ‐ Extrapyramidal: average change score (BAS, high = poor). | ||||
| 40 Adverse effects ‐ Extrapyramidal: dystonia and/or dyskinesia Show forest plot | 3 | 196 | Risk Ratio (M‐H, Random, 95% CI) | 0.48 [0.09, 2.73] |
| Analysis 1.40  Comparison 1 Antipsychotic dose increase versus antipsychotic dose maintenance, Outcome 40 Adverse effects ‐ Extrapyramidal: dystonia and/or dyskinesia. | ||||
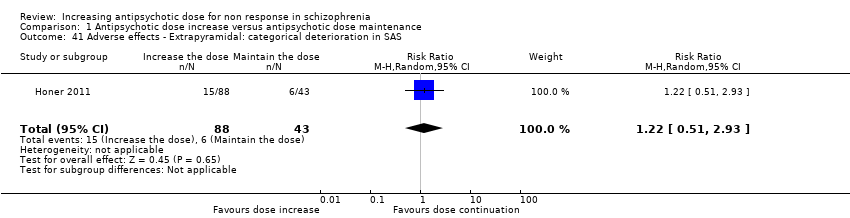
| 41 Adverse effects ‐ Extrapyramidal: categorical deterioration in SAS Show forest plot | 1 | 131 | Risk Ratio (M‐H, Random, 95% CI) | 1.22 [0.51, 2.93] |
| Analysis 1.41  Comparison 1 Antipsychotic dose increase versus antipsychotic dose maintenance, Outcome 41 Adverse effects ‐ Extrapyramidal: categorical deterioration in SAS. | ||||
| 42 Adverse effects ‐ Extrapyramidal: average endpoint score (SAS, high = poor) Show forest plot | 2 | 191 | Mean Difference (IV, Random, 95% CI) | 0.93 [‐1.04, 2.91] |
| Analysis 1.42 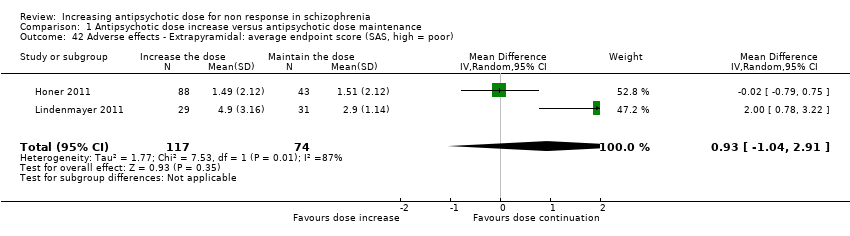 Comparison 1 Antipsychotic dose increase versus antipsychotic dose maintenance, Outcome 42 Adverse effects ‐ Extrapyramidal: average endpoint score (SAS, high = poor). | ||||
| 43 Adverse effects ‐ Extrapyramidal: average change score (SA, high = poor) Show forest plot | 2 | 163 | Mean Difference (IV, Random, 95% CI) | 0.21 [‐0.83, 1.26] |
| Analysis 1.43  Comparison 1 Antipsychotic dose increase versus antipsychotic dose maintenance, Outcome 43 Adverse effects ‐ Extrapyramidal: average change score (SA, high = poor). | ||||
| 44 Adverse effects ‐ Extrapyramidal: tremor Show forest plot | 2 | 173 | Risk Ratio (M‐H, Random, 95% CI) | 1.59 [0.59, 4.26] |
| Analysis 1.44  Comparison 1 Antipsychotic dose increase versus antipsychotic dose maintenance, Outcome 44 Adverse effects ‐ Extrapyramidal: tremor. | ||||
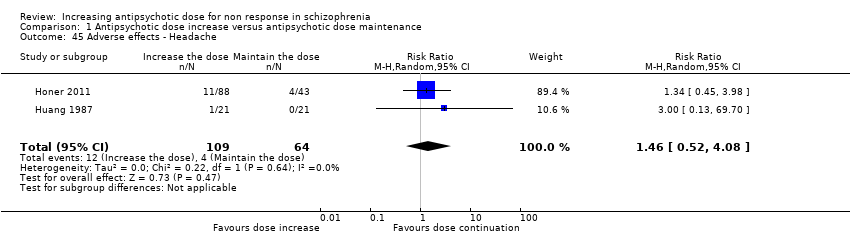
| 45 Adverse effects ‐ Headache Show forest plot | 2 | 173 | Risk Ratio (M‐H, Random, 95% CI) | 1.46 [0.52, 4.08] |
| Analysis 1.45  Comparison 1 Antipsychotic dose increase versus antipsychotic dose maintenance, Outcome 45 Adverse effects ‐ Headache. | ||||
| 46 Adverse effects ‐ Somnolence and/or drowsiness Show forest plot | 4 | 256 | Risk Ratio (M‐H, Random, 95% CI) | 1.76 [0.81, 3.81] |
| Analysis 1.46  Comparison 1 Antipsychotic dose increase versus antipsychotic dose maintenance, Outcome 46 Adverse effects ‐ Somnolence and/or drowsiness. | ||||
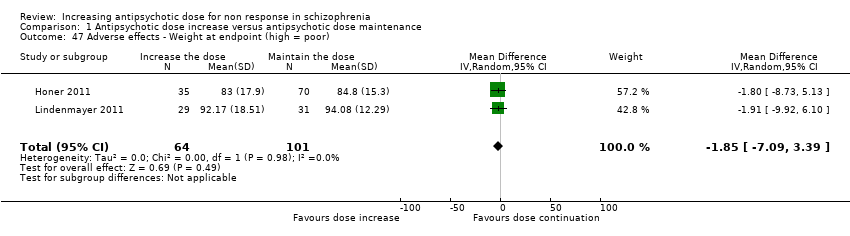
| 47 Adverse effects ‐ Weight at endpoint (high = poor) Show forest plot | 2 | 165 | Mean Difference (IV, Random, 95% CI) | ‐1.85 [‐7.09, 3.39] |
| Analysis 1.47  Comparison 1 Antipsychotic dose increase versus antipsychotic dose maintenance, Outcome 47 Adverse effects ‐ Weight at endpoint (high = poor). | ||||
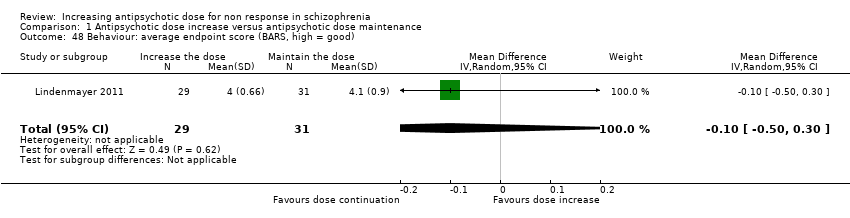
| 48 Behaviour: average endpoint score (BARS, high = good) Show forest plot | 1 | 60 | Mean Difference (IV, Random, 95% CI) | ‐0.10 [‐0.50, 0.30] |
| Analysis 1.48  Comparison 1 Antipsychotic dose increase versus antipsychotic dose maintenance, Outcome 48 Behaviour: average endpoint score (BARS, high = good). | ||||
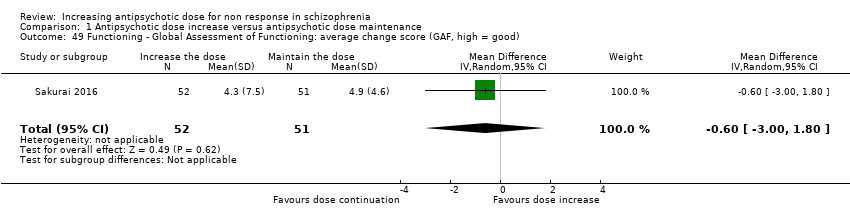
| 49 Functioning ‐ Global Assessment of Functioning: average change score (GAF, high = good) Show forest plot | 1 | 103 | Mean Difference (IV, Random, 95% CI) | ‐0.60 [‐1.00, 1.80] |
| Analysis 1.49  Comparison 1 Antipsychotic dose increase versus antipsychotic dose maintenance, Outcome 49 Functioning ‐ Global Assessment of Functioning: average change score (GAF, high = good). | ||||
| 50 Functioning ‐ Social ‐ Adaptive Functioning Evaluation: average endpoint score (SAFE, high = poor) Show forest plot | 1 | 60 | Mean Difference (IV, Random, 95% CI) | 0.16 [‐0.47, 0.79] |
| Analysis 1.50  Comparison 1 Antipsychotic dose increase versus antipsychotic dose maintenance, Outcome 50 Functioning ‐ Social ‐ Adaptive Functioning Evaluation: average endpoint score (SAFE, high = poor). | ||||
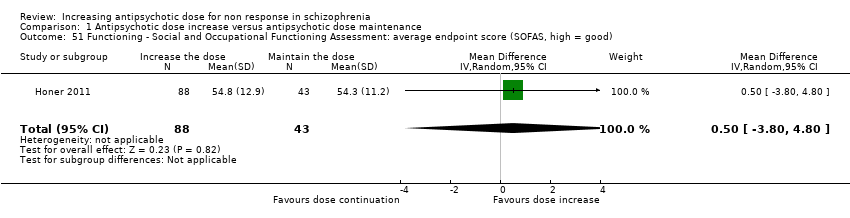
| 51 Functioning ‐ Social and Occupational Functioning Assessment: average endpoint score (SOFAS, high = good) Show forest plot | 1 | 131 | Mean Difference (IV, Random, 95% CI) | 0.5 [‐3.80, 4.80] |
| Analysis 1.51  Comparison 1 Antipsychotic dose increase versus antipsychotic dose maintenance, Outcome 51 Functioning ‐ Social and Occupational Functioning Assessment: average endpoint score (SOFAS, high = good). | ||||
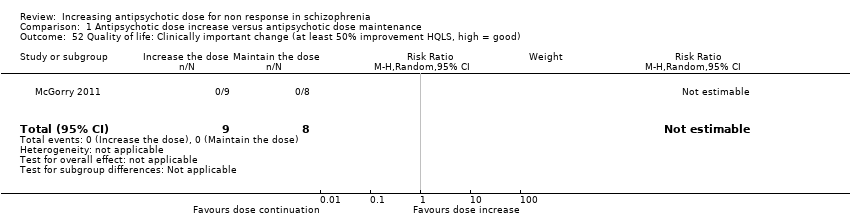
| 52 Quality of life: Clinically important change (at least 50% improvement HQLS, high = good) Show forest plot | 1 | 17 | Risk Ratio (M‐H, Random, 95% CI) | 0.0 [0.0, 0.0] |
| Analysis 1.52  Comparison 1 Antipsychotic dose increase versus antipsychotic dose maintenance, Outcome 52 Quality of life: Clinically important change (at least 50% improvement HQLS, high = good). | ||||
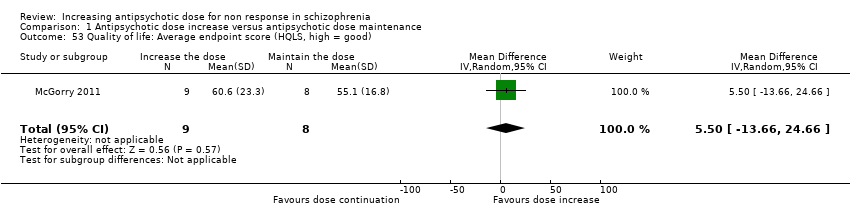
| 53 Quality of life: Average endpoint score (HQLS, high = good) Show forest plot | 1 | 17 | Mean Difference (IV, Random, 95% CI) | 5.5 [‐13.66, 24.66] |
| Analysis 1.53  Comparison 1 Antipsychotic dose increase versus antipsychotic dose maintenance, Outcome 53 Quality of life: Average endpoint score (HQLS, high = good). | ||||
| Outcome or subgroup title | No. of studies | No. of participants | Statistical method | Effect size |
| 1 Single antipsychotic drugs Show forest plot | 8 | Risk Ratio (M‐H, Random, 95% CI) | Subtotals only | |
| Analysis 2.1  Comparison 2 Subgroup analysis and investigation of heterogeneity, Outcome 1 Single antipsychotic drugs. | ||||
| 1.1 Fluphenazine | 1 | 34 | Risk Ratio (M‐H, Random, 95% CI) | 2.25 [0.22, 22.53] |
| 1.2 Haloperidol | 2 | 71 | Risk Ratio (M‐H, Random, 95% CI) | 1.10 [0.67, 1.80] |
| 1.3 Quetiapine | 2 | 191 | Risk Ratio (M‐H, Random, 95% CI) | 0.65 [0.15, 2.86] |
| 1.4 Risperidone | 1 | 17 | Risk Ratio (M‐H, Random, 95% CI) | 9.9 [0.63, 155.08] |
| 1.5 Thiothixene | 1 | 42 | Risk Ratio (M‐H, Random, 95% CI) | 1.75 [0.94, 3.26] |
| 1.6 Ziprasidone | 1 | 75 | Risk Ratio (M‐H, Random, 95% CI) | 0.79 [0.45, 1.41] |
| 2 Clinical state, stage or problem Show forest plot | 9 | Risk Ratio (M‐H, Random, 95% CI) | Subtotals only | |
| Analysis 2.2  Comparison 2 Subgroup analysis and investigation of heterogeneity, Outcome 2 Clinical state, stage or problem. | ||||
| 2.1 First episode patients | 1 | 17 | Risk Ratio (M‐H, Random, 95% CI) | 9.9 [0.63, 155.08] |
| 2.2 Not first episode patients | 8 | 516 | Risk Ratio (M‐H, Random, 95% CI) | 1.07 [0.86, 1.34] |
| Outcome or subgroup title | No. of studies | No. of participants | Statistical method | Effect size |
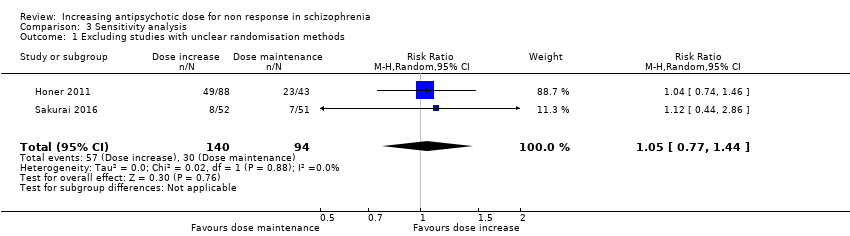
| 1 Excluding studies with unclear randomisation methods Show forest plot | 2 | 234 | Risk Ratio (M‐H, Random, 95% CI) | 1.05 [0.77, 1.44] |
| Analysis 3.1  Comparison 3 Sensitivity analysis, Outcome 1 Excluding studies with unclear randomisation methods. | ||||
| 2 Excluding studies with unclear allocation concealment methods Show forest plot | 2 | 234 | Risk Ratio (M‐H, Random, 95% CI) | 1.05 [0.77, 1.44] |
| Analysis 3.2  Comparison 3 Sensitivity analysis, Outcome 2 Excluding studies with unclear allocation concealment methods. | ||||
| 3 Exclusion of studies with high risk of bias regarding blinding Show forest plot | 8 | 516 | Risk Ratio (M‐H, Random, 95% CI) | 1.07 [0.86, 1.34] |
| Analysis 3.3 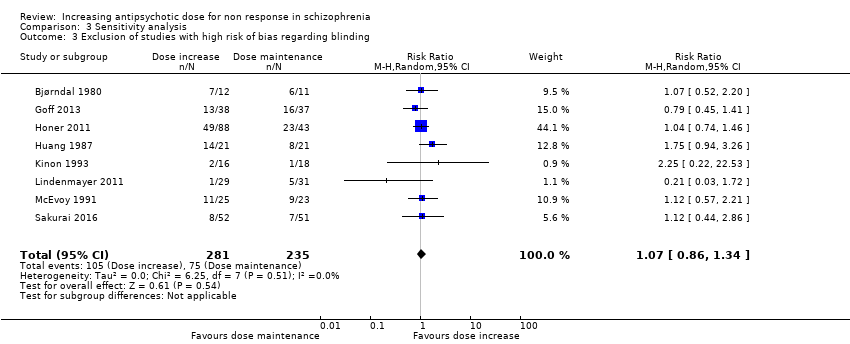 Comparison 3 Sensitivity analysis, Outcome 3 Exclusion of studies with high risk of bias regarding blinding. | ||||
| 4 Exclusion of studies with high risk of bias regarding incomplete outcome data Show forest plot | 6 | 375 | Risk Ratio (M‐H, Random, 95% CI) | 1.19 [0.92, 1.54] |
| Analysis 3.4 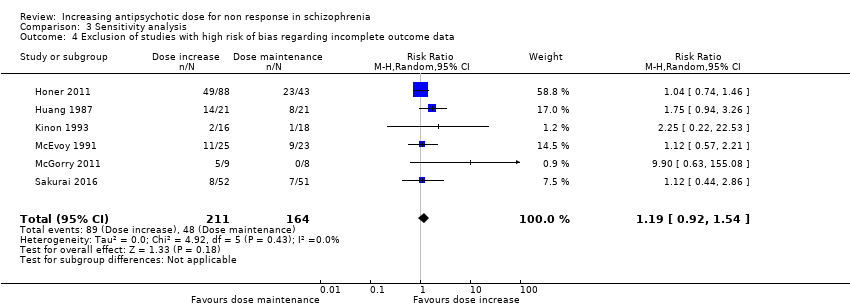 Comparison 3 Sensitivity analysis, Outcome 4 Exclusion of studies with high risk of bias regarding incomplete outcome data. | ||||
| 5 Exclusion of studies with imputed values Show forest plot | 8 | 458 | Risk Ratio (M‐H, Random, 95% CI) | 1.16 [0.90, 1.50] |
| Analysis 3.5  Comparison 3 Sensitivity analysis, Outcome 5 Exclusion of studies with imputed values. | ||||
| 6 Fixed effects Show forest plot | 9 | 533 | Risk Ratio (M‐H, Fixed, 95% CI) | 1.10 [0.88, 1.38] |
| Analysis 3.6 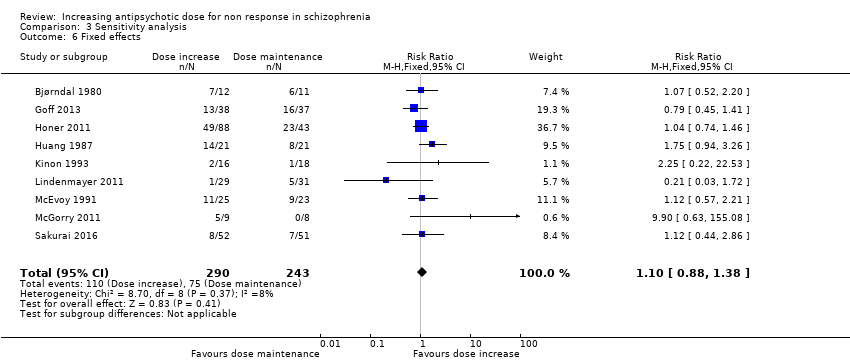 Comparison 3 Sensitivity analysis, Outcome 6 Fixed effects. | ||||
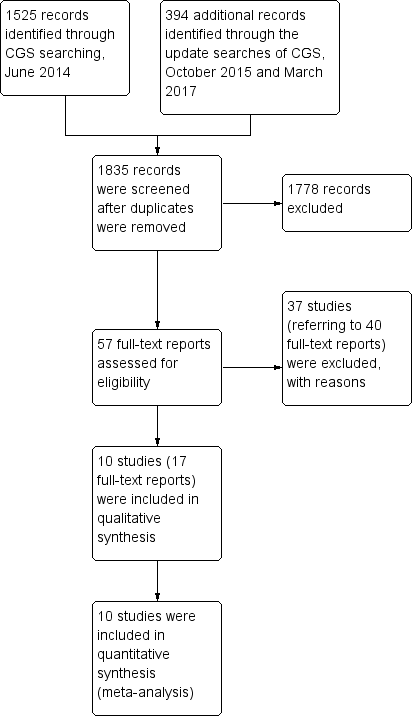
Study flow diagram.
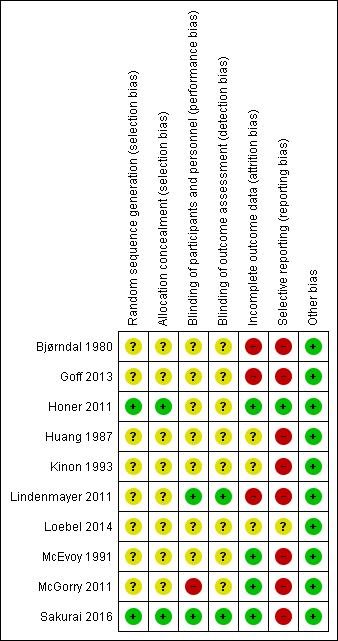
Risk of bias summary: review authors' judgements about each risk of bias item for each included study.
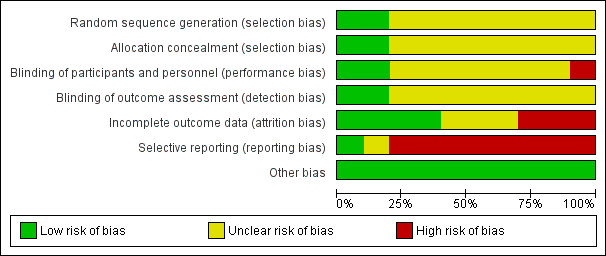
Risk of bias graph: review authors' judgements about each risk of bias item presented as percentages across all included studies.

Comparison 1 Antipsychotic dose increase versus antipsychotic dose maintenance, Outcome 1 Global state: 1a. Clinically relevant response as defined by trials.

Comparison 1 Antipsychotic dose increase versus antipsychotic dose maintenance, Outcome 2 Global state: 1b. Any change (improvement in Global Assesment scale).
Comparison 1 Antipsychotic dose increase versus antipsychotic dose maintenance, Outcome 3 Global state: 2a. Average endpoint score (CGI‐Severity , high = poor).

Comparison 1 Antipsychotic dose increase versus antipsychotic dose maintenance, Outcome 4 Global state: 2b. Average change score ( CGI‐Severity, high = poor).

Comparison 1 Antipsychotic dose increase versus antipsychotic dose maintenance, Outcome 5 Global state: 2c. Average endpoint score (CGI‐Improvement, high = poor).
Comparison 1 Antipsychotic dose increase versus antipsychotic dose maintenance, Outcome 6 Leaving the study early: 1. Tolerability ‐ due to adverse events.

Comparison 1 Antipsychotic dose increase versus antipsychotic dose maintenance, Outcome 7 Leaving the study early: 2. Acceptability of treatment ‐ due to any reason.

Comparison 1 Antipsychotic dose increase versus antipsychotic dose maintenance, Outcome 8 Leaving the study early: 3. Efficacy ‐ due to inefficacy.

Comparison 1 Antipsychotic dose increase versus antipsychotic dose maintenance, Outcome 9 Mental state: 1a. General ‐ average endpoint score (PANSS total, high = poor).
Comparison 1 Antipsychotic dose increase versus antipsychotic dose maintenance, Outcome 10 Mental state: 1b. General ‐ average change score (PANSS total, high = poor).

Comparison 1 Antipsychotic dose increase versus antipsychotic dose maintenance, Outcome 11 Mental state: 1c. General ‐ average endpoint and/or change score (PANSS total, high = poor).

Comparison 1 Antipsychotic dose increase versus antipsychotic dose maintenance, Outcome 12 Mental state: 1d. General ‐ average endpoint score (BPRS total, high = poor).
Comparison 1 Antipsychotic dose increase versus antipsychotic dose maintenance, Outcome 13 Mental state: 1e. General ‐ average change score (BPRS total, high = poor).
Comparison 1 Antipsychotic dose increase versus antipsychotic dose maintenance, Outcome 14 Mental state: 1f. General ‐ average endpoint and/or change score (BPRS total, high = poor).
Comparison 1 Antipsychotic dose increase versus antipsychotic dose maintenance, Outcome 15 Mental state: 1g. General ‐ average change score (NOSIE total, high = poor).

Comparison 1 Antipsychotic dose increase versus antipsychotic dose maintenance, Outcome 16 Mental state: 2a. Positive symptoms ‐ Clinically important change.
Comparison 1 Antipsychotic dose increase versus antipsychotic dose maintenance, Outcome 17 Mental state: 2b. Positive symptoms ‐ average endpoint subscore (PANSS positive, high = poor).

Comparison 1 Antipsychotic dose increase versus antipsychotic dose maintenance, Outcome 18 Mental state: 2c. Positive symptoms ‐ average change subscore (PANSS positive, high = poor).

Comparison 1 Antipsychotic dose increase versus antipsychotic dose maintenance, Outcome 19 Mental state: 2d. Positive symptoms ‐ average endpoint subscore (BPRS positive,high = poor).

Comparison 1 Antipsychotic dose increase versus antipsychotic dose maintenance, Outcome 20 Mental state: 3a. Negative symptoms ‐ average endpoint subscore (PANSS negative, high = poor).

Comparison 1 Antipsychotic dose increase versus antipsychotic dose maintenance, Outcome 21 Mental state: 3b. Negative symptoms ‐ average change subscore (PANSS negative, high = poor).
Comparison 1 Antipsychotic dose increase versus antipsychotic dose maintenance, Outcome 22 Mental state: 3c. Negative symptoms ‐ average endpoint subscore (BPRS negative, high = poor).

Comparison 1 Antipsychotic dose increase versus antipsychotic dose maintenance, Outcome 23 Mental state: 3d. Negative symptoms ‐ average endpoint score (SANS, high = poor).

Comparison 1 Antipsychotic dose increase versus antipsychotic dose maintenance, Outcome 24 Adverse effects ‐ At least one adverse effect.

Comparison 1 Antipsychotic dose increase versus antipsychotic dose maintenance, Outcome 25 Adverse effects ‐ Cardiac: QTc prolongation.
Comparison 1 Antipsychotic dose increase versus antipsychotic dose maintenance, Outcome 26 Adverse effects ‐ Cardiac: Orthostatic hypotension.

Comparison 1 Antipsychotic dose increase versus antipsychotic dose maintenance, Outcome 27 Adverse effects ‐ Cardiac: Palpitations.

Comparison 1 Antipsychotic dose increase versus antipsychotic dose maintenance, Outcome 28 Adverse effects ‐ Cardiac: Premature Ventricular Contractions.

Comparison 1 Antipsychotic dose increase versus antipsychotic dose maintenance, Outcome 29 Adverse effects ‐ Constipation.

Comparison 1 Antipsychotic dose increase versus antipsychotic dose maintenance, Outcome 30 Adverse effects ‐ Dizziness.

Comparison 1 Antipsychotic dose increase versus antipsychotic dose maintenance, Outcome 31 Adverse effects ‐ Drooling.

Comparison 1 Antipsychotic dose increase versus antipsychotic dose maintenance, Outcome 32 Adverse effects ‐ Death (suicide or naturalistic cause).

Comparison 1 Antipsychotic dose increase versus antipsychotic dose maintenance, Outcome 33 Adverse effects ‐ Extrapyramidal: Categorical deterioration (AIMS, high = poor).

Comparison 1 Antipsychotic dose increase versus antipsychotic dose maintenance, Outcome 34 Adverse effects ‐ Extrapyramidal: average endpoint score (AIMS, high = poor).
Comparison 1 Antipsychotic dose increase versus antipsychotic dose maintenance, Outcome 35 Adverse effects ‐ Extrapyramidal: average change score (AIMS, high = poor).

Comparison 1 Antipsychotic dose increase versus antipsychotic dose maintenance, Outcome 36 Adverse effects ‐ Extrapyramidal: akathisia.
Comparison 1 Antipsychotic dose increase versus antipsychotic dose maintenance, Outcome 37 Adverse effects ‐ Extrapyramidal: categorical deterioration (BAS, high = poor).

Comparison 1 Antipsychotic dose increase versus antipsychotic dose maintenance, Outcome 38 Adverse effects ‐ Extrapyramidal: average endpoint score (BAS, high = poor).

Comparison 1 Antipsychotic dose increase versus antipsychotic dose maintenance, Outcome 39 Adverse effects ‐ Extrapyramidal: average change score (BAS, high = poor).

Comparison 1 Antipsychotic dose increase versus antipsychotic dose maintenance, Outcome 40 Adverse effects ‐ Extrapyramidal: dystonia and/or dyskinesia.
Comparison 1 Antipsychotic dose increase versus antipsychotic dose maintenance, Outcome 41 Adverse effects ‐ Extrapyramidal: categorical deterioration in SAS.

Comparison 1 Antipsychotic dose increase versus antipsychotic dose maintenance, Outcome 42 Adverse effects ‐ Extrapyramidal: average endpoint score (SAS, high = poor).

Comparison 1 Antipsychotic dose increase versus antipsychotic dose maintenance, Outcome 43 Adverse effects ‐ Extrapyramidal: average change score (SA, high = poor).

Comparison 1 Antipsychotic dose increase versus antipsychotic dose maintenance, Outcome 44 Adverse effects ‐ Extrapyramidal: tremor.
Comparison 1 Antipsychotic dose increase versus antipsychotic dose maintenance, Outcome 45 Adverse effects ‐ Headache.

Comparison 1 Antipsychotic dose increase versus antipsychotic dose maintenance, Outcome 46 Adverse effects ‐ Somnolence and/or drowsiness.
Comparison 1 Antipsychotic dose increase versus antipsychotic dose maintenance, Outcome 47 Adverse effects ‐ Weight at endpoint (high = poor).
Comparison 1 Antipsychotic dose increase versus antipsychotic dose maintenance, Outcome 48 Behaviour: average endpoint score (BARS, high = good).
Comparison 1 Antipsychotic dose increase versus antipsychotic dose maintenance, Outcome 49 Functioning ‐ Global Assessment of Functioning: average change score (GAF, high = good).

Comparison 1 Antipsychotic dose increase versus antipsychotic dose maintenance, Outcome 50 Functioning ‐ Social ‐ Adaptive Functioning Evaluation: average endpoint score (SAFE, high = poor).
Comparison 1 Antipsychotic dose increase versus antipsychotic dose maintenance, Outcome 51 Functioning ‐ Social and Occupational Functioning Assessment: average endpoint score (SOFAS, high = good).
Comparison 1 Antipsychotic dose increase versus antipsychotic dose maintenance, Outcome 52 Quality of life: Clinically important change (at least 50% improvement HQLS, high = good).
Comparison 1 Antipsychotic dose increase versus antipsychotic dose maintenance, Outcome 53 Quality of life: Average endpoint score (HQLS, high = good).

Comparison 2 Subgroup analysis and investigation of heterogeneity, Outcome 1 Single antipsychotic drugs.

Comparison 2 Subgroup analysis and investigation of heterogeneity, Outcome 2 Clinical state, stage or problem.
Comparison 3 Sensitivity analysis, Outcome 1 Excluding studies with unclear randomisation methods.

Comparison 3 Sensitivity analysis, Outcome 2 Excluding studies with unclear allocation concealment methods.

Comparison 3 Sensitivity analysis, Outcome 3 Exclusion of studies with high risk of bias regarding blinding.

Comparison 3 Sensitivity analysis, Outcome 4 Exclusion of studies with high risk of bias regarding incomplete outcome data.

Comparison 3 Sensitivity analysis, Outcome 5 Exclusion of studies with imputed values.

Comparison 3 Sensitivity analysis, Outcome 6 Fixed effects.
| Methods | Randomisation: random. Allocation: concealed. Setting: in‐ or out‐patients. |
| Participants | Diagnosis: patients with schizophrenia, schizoaffective disorder or schizophreniform disorder. N > 300 |
| Interventions | All patients firstly receive treatment with one antipsychotic drug for at least 2 weeks. Those patients who do not at least minimally improve after 2 weeks of treatment, are considered non‐responders and are randomised to: 1. Increasing the dose of the antipsychotic drug above the officially recommended dose range. 2. Continuing treatment with the antipsychotic drug at the same, initial dose (within the officially recommended dose range). |
| Outcomes | Response (e.g. defined as PANSS or BPRS decrease ≥ 50%).* Relapse. Leaving the study early due to any reason. Leaving the study early due to side effects. General mental state‐average change in general mental state scores. Adverse effects‐ at least one adverse effect; clinically important general adverse effects; sudden and unexpected death. Service use‐ time in hospital. Quality of life. All outcomes by time ‐ short term (up to 12 weeks), medium term (13 to 26 weeks) and long term (over 26 weeks). |
| Notes | *Primary outcome of interest. |
| Antipsychotic dose increase compared to antipsychotic dose continuation for non response in schizophrenia | ||||||
| Patient or population: non response in schizophrenia | ||||||
| Outcomes | Anticipated absolute effects* (95% CI) | Relative effect | № of participants | Certainty of the evidence | Comments | |
| Risk with antipsychotic dose continuation | Risk with antipsychotic dose increase | |||||
| Global state: clinically relevant response: Assessed with response ratio | Study population | RR 1.09 | 533 | ⊕⊕⊝⊝ | ||
| 309 per 1000 | 336 per 1000 | |||||
| Leaving the study early: tolerability ‐ leaving early due to adverse effects. | Study population | RR 1.63 | 496 | ⊕⊝⊝⊝ | ||
| 74 per 1000 | 121 per 1000 | |||||
| Leaving the study early: acceptability ‐ leaving early due to any reason. | Study population | RR 1.30 | 353 | ⊕⊕⊝⊝ | ||
| 23 per 100 | 30 per 100 | |||||
| General mental state : PANSS total score change* | The mean general mental state ‐ PANSS total score change ranged from −8.9 to 0.03 points | MD 1.44 points lower | ‐ | 258 | ⊕⊝⊝⊝ | One other trial used the BPRS total score change and showed no clear difference between the two groups. Pre‐defined outcome: Clinically important change in general mental state not reported. |
| Adverse effects ‐ at least one adverse effect | Study population | RR 0.91 | 191 | ⊕⊝⊝⊝ | ||
| 716 per 1000 | 652 per 1000 | |||||
| Service use: time in hospital | ‐ | see comment | ‐ | (0 studies) | ‐ | No studies reported this outcome. |
| Quality of life ‐ clinically important change in quality of life (defined as at least 50% improvement in HQLS) | Study population | not estimable | 17 | ⊕⊕⊝⊝ | ||
| 0 per 1000 | 0 per 1000 | |||||
| *The risk in the intervention group (and its 95% confidence interval) is based on the assumed risk in the comparison group and the relative effect of the intervention (and its 95% CI). | ||||||
| GRADE Working Group grades of evidence | ||||||
| 1 Imprecision for dichotomous outcomes: a) sample size should be >800 and/or total number of events>300; in our review, both numbers are much smaller. b) the pooled estimate of effect includes both no effect and an appreciable benefit or appreciable harm. 2 Inconsistency: Heterogeneity: Tau² = 1.03; Chi² = 11.24, df = 5 (P = 0.05); I² = 56% 3 Inconsistency: Heterogeneity: Tau² = 14.71; Chi² = 5.70, df = 2 (P = 0.06); I² = 65% 4 Imprecision for continuous outcomes: a) sample size is lower than 400, b) confidence interval includes no effect and the upper or lower confidence limit crosses the minimal important difference (MID), either for benefit of harm 5 Indirectness: The pre‐specified outcome (clinical important change in mental state) was not reported. 6 Inconsistency: Heterogeneity: Tau² = 0.10; Chi² = 3.62, df = 1 (P = 0.06); I² = 72% | ||||||
| Outcome or subgroup title | No. of studies | No. of participants | Statistical method | Effect size |
| 1 Global state: 1a. Clinically relevant response as defined by trials Show forest plot | 9 | 533 | Risk Ratio (M‐H, Random, 95% CI) | 1.09 [0.86, 1.40] |
| 2 Global state: 1b. Any change (improvement in Global Assesment scale) Show forest plot | 1 | 23 | Risk Ratio (M‐H, Random, 95% CI) | 0.76 [0.32, 1.80] |
| 3 Global state: 2a. Average endpoint score (CGI‐Severity , high = poor) Show forest plot | 3 | 196 | Mean Difference (IV, Random, 95% CI) | ‐0.11 [‐0.40, 0.19] |
| 4 Global state: 2b. Average change score ( CGI‐Severity, high = poor) Show forest plot | 1 | 95 | Mean Difference (IV, Random, 95% CI) | ‐0.4 [‐0.80, ‐0.00] |
| 5 Global state: 2c. Average endpoint score (CGI‐Improvement, high = poor) Show forest plot | 1 | 103 | Mean Difference (IV, Random, 95% CI) | 0.0 [‐0.35, 0.35] |
| 6 Leaving the study early: 1. Tolerability ‐ due to adverse events Show forest plot | 7 | 496 | Risk Ratio (M‐H, Random, 95% CI) | 1.63 [0.52, 5.07] |
| 7 Leaving the study early: 2. Acceptability of treatment ‐ due to any reason Show forest plot | 5 | 353 | Risk Ratio (M‐H, Random, 95% CI) | 1.30 [0.89, 1.90] |
| 8 Leaving the study early: 3. Efficacy ‐ due to inefficacy Show forest plot | 4 | 336 | Risk Ratio (M‐H, Random, 95% CI) | 0.82 [0.30, 2.28] |
| 9 Mental state: 1a. General ‐ average endpoint score (PANSS total, high = poor) Show forest plot | 2 | 191 | Mean Difference (IV, Random, 95% CI) | ‐1.81 [‐7.31, 3.69] |
| 10 Mental state: 1b. General ‐ average change score (PANSS total, high = poor) Show forest plot | 3 | 258 | Mean Difference (IV, Random, 95% CI) | ‐1.44 [‐6.85, 3.97] |
| 11 Mental state: 1c. General ‐ average endpoint and/or change score (PANSS total, high = poor) Show forest plot | 4 | 389 | Mean Difference (IV, Random, 95% CI) | ‐2.13 [‐6.16, 1.90] |
| 12 Mental state: 1d. General ‐ average endpoint score (BPRS total, high = poor) Show forest plot | 3 | 99 | Mean Difference (IV, Random, 95% CI) | ‐1.25 [‐4.60, 2.11] |
| 13 Mental state: 1e. General ‐ average change score (BPRS total, high = poor) Show forest plot | 1 | 42 | Mean Difference (IV, Random, 95% CI) | ‐2.38 [‐6.15, 1.39] |
| 14 Mental state: 1f. General ‐ average endpoint and/or change score (BPRS total, high = poor) Show forest plot | 4 | 141 | Mean Difference (IV, Random, 95% CI) | ‐1.75 [‐4.25, 0.76] |
| 15 Mental state: 1g. General ‐ average change score (NOSIE total, high = poor) Show forest plot | 1 | 42 | Mean Difference (IV, Random, 95% CI) | 3.70 [‐5.38, 12.78] |
| 16 Mental state: 2a. Positive symptoms ‐ Clinically important change Show forest plot | 1 | 17 | Risk Ratio (M‐H, Random, 95% CI) | 1.33 [0.58, 3.07] |
| 17 Mental state: 2b. Positive symptoms ‐ average endpoint subscore (PANSS positive, high = poor) Show forest plot | 2 | 191 | Mean Difference (IV, Random, 95% CI) | ‐0.94 [‐2.79, 0.90] |
| 18 Mental state: 2c. Positive symptoms ‐ average change subscore (PANSS positive, high = poor) Show forest plot | 3 | 238 | Mean Difference (IV, Random, 95% CI) | 0.04 [‐1.31, 1.40] |
| 19 Mental state: 2d. Positive symptoms ‐ average endpoint subscore (BPRS positive,high = poor) Show forest plot | 1 | 17 | Mean Difference (IV, Random, 95% CI) | 0.40 [‐2.94, 3.74] |
| 20 Mental state: 3a. Negative symptoms ‐ average endpoint subscore (PANSS negative, high = poor) Show forest plot | 2 | 191 | Mean Difference (IV, Random, 95% CI) | 0.32 [‐1.48, 2.11] |
| 21 Mental state: 3b. Negative symptoms ‐ average change subscore (PANSS negative, high = poor) Show forest plot | 2 | 163 | Mean Difference (IV, Random, 95% CI) | ‐0.15 [‐0.96, 0.67] |
| 22 Mental state: 3c. Negative symptoms ‐ average endpoint subscore (BPRS negative, high = poor) Show forest plot | 1 | 17 | Mean Difference (IV, Random, 95% CI) | ‐0.40 [‐1.97, 1.17] |
| 23 Mental state: 3d. Negative symptoms ‐ average endpoint score (SANS, high = poor) Show forest plot | 1 | 34 | Mean Difference (IV, Random, 95% CI) | 1.5 [‐14.33, 17.33] |
| 24 Adverse effects ‐ At least one adverse effect Show forest plot | 2 | 191 | Risk Ratio (M‐H, Random, 95% CI) | 0.91 [0.55, 1.50] |
| 25 Adverse effects ‐ Cardiac: QTc prolongation Show forest plot | 2 | 206 | Risk Ratio (M‐H, Random, 95% CI) | 2.47 [0.12, 50.39] |
| 26 Adverse effects ‐ Cardiac: Orthostatic hypotension Show forest plot | 2 | 102 | Risk Ratio (M‐H, Random, 95% CI) | 1.09 [0.25, 4.82] |
| 27 Adverse effects ‐ Cardiac: Palpitations Show forest plot | 1 | 42 | Risk Ratio (M‐H, Random, 95% CI) | 3.0 [0.13, 69.70] |
| 28 Adverse effects ‐ Cardiac: Premature Ventricular Contractions Show forest plot | 1 | 42 | Risk Ratio (M‐H, Random, 95% CI) | 3.0 [0.13, 69.70] |
| 29 Adverse effects ‐ Constipation Show forest plot | 2 | 102 | Risk Ratio (M‐H, Random, 95% CI) | 1.53 [0.44, 5.38] |
| 30 Adverse effects ‐ Dizziness Show forest plot | 2 | 173 | Risk Ratio (M‐H, Random, 95% CI) | 0.77 [0.41, 1.44] |
| 31 Adverse effects ‐ Drooling Show forest plot | 1 | 42 | Risk Ratio (M‐H, Random, 95% CI) | 2.0 [0.20, 20.41] |
| 32 Adverse effects ‐ Death (suicide or naturalistic cause) Show forest plot | 1 | 131 | Risk Ratio (M‐H, Random, 95% CI) | 0.0 [0.0, 0.0] |
| 33 Adverse effects ‐ Extrapyramidal: Categorical deterioration (AIMS, high = poor) Show forest plot | 1 | 131 | Risk Ratio (M‐H, Random, 95% CI) | 1.38 [0.59, 3.26] |
| 34 Adverse effects ‐ Extrapyramidal: average endpoint score (AIMS, high = poor) Show forest plot | 1 | 60 | Mean Difference (IV, Random, 95% CI) | 0.7 [‐0.87, 2.27] |
| 35 Adverse effects ‐ Extrapyramidal: average change score (AIMS, high = poor) Show forest plot | 2 | 163 | Mean Difference (IV, Random, 95% CI) | 0.41 [‐1.15, 1.96] |
| 36 Adverse effects ‐ Extrapyramidal: akathisia Show forest plot | 2 | 65 | Risk Ratio (M‐H, Random, 95% CI) | 0.74 [0.04, 14.02] |
| 37 Adverse effects ‐ Extrapyramidal: categorical deterioration (BAS, high = poor) Show forest plot | 1 | 131 | Risk Ratio (M‐H, Random, 95% CI) | 1.47 [0.42, 5.14] |
| 38 Adverse effects ‐ Extrapyramidal: average endpoint score (BAS, high = poor) Show forest plot | 1 | 60 | Mean Difference (IV, Random, 95% CI) | ‐0.2 [‐0.74, 0.34] |
| 39 Adverse effects ‐ Extrapyramidal: average change score (BAS, high = poor) Show forest plot | 2 | 163 | Mean Difference (IV, Random, 95% CI) | ‐0.11 [‐0.59, 0.37] |
| 40 Adverse effects ‐ Extrapyramidal: dystonia and/or dyskinesia Show forest plot | 3 | 196 | Risk Ratio (M‐H, Random, 95% CI) | 0.48 [0.09, 2.73] |
| 41 Adverse effects ‐ Extrapyramidal: categorical deterioration in SAS Show forest plot | 1 | 131 | Risk Ratio (M‐H, Random, 95% CI) | 1.22 [0.51, 2.93] |
| 42 Adverse effects ‐ Extrapyramidal: average endpoint score (SAS, high = poor) Show forest plot | 2 | 191 | Mean Difference (IV, Random, 95% CI) | 0.93 [‐1.04, 2.91] |
| 43 Adverse effects ‐ Extrapyramidal: average change score (SA, high = poor) Show forest plot | 2 | 163 | Mean Difference (IV, Random, 95% CI) | 0.21 [‐0.83, 1.26] |
| 44 Adverse effects ‐ Extrapyramidal: tremor Show forest plot | 2 | 173 | Risk Ratio (M‐H, Random, 95% CI) | 1.59 [0.59, 4.26] |
| 45 Adverse effects ‐ Headache Show forest plot | 2 | 173 | Risk Ratio (M‐H, Random, 95% CI) | 1.46 [0.52, 4.08] |
| 46 Adverse effects ‐ Somnolence and/or drowsiness Show forest plot | 4 | 256 | Risk Ratio (M‐H, Random, 95% CI) | 1.76 [0.81, 3.81] |
| 47 Adverse effects ‐ Weight at endpoint (high = poor) Show forest plot | 2 | 165 | Mean Difference (IV, Random, 95% CI) | ‐1.85 [‐7.09, 3.39] |
| 48 Behaviour: average endpoint score (BARS, high = good) Show forest plot | 1 | 60 | Mean Difference (IV, Random, 95% CI) | ‐0.10 [‐0.50, 0.30] |
| 49 Functioning ‐ Global Assessment of Functioning: average change score (GAF, high = good) Show forest plot | 1 | 103 | Mean Difference (IV, Random, 95% CI) | ‐0.60 [‐1.00, 1.80] |
| 50 Functioning ‐ Social ‐ Adaptive Functioning Evaluation: average endpoint score (SAFE, high = poor) Show forest plot | 1 | 60 | Mean Difference (IV, Random, 95% CI) | 0.16 [‐0.47, 0.79] |
| 51 Functioning ‐ Social and Occupational Functioning Assessment: average endpoint score (SOFAS, high = good) Show forest plot | 1 | 131 | Mean Difference (IV, Random, 95% CI) | 0.5 [‐3.80, 4.80] |
| 52 Quality of life: Clinically important change (at least 50% improvement HQLS, high = good) Show forest plot | 1 | 17 | Risk Ratio (M‐H, Random, 95% CI) | 0.0 [0.0, 0.0] |
| 53 Quality of life: Average endpoint score (HQLS, high = good) Show forest plot | 1 | 17 | Mean Difference (IV, Random, 95% CI) | 5.5 [‐13.66, 24.66] |
| Outcome or subgroup title | No. of studies | No. of participants | Statistical method | Effect size |
| 1 Single antipsychotic drugs Show forest plot | 8 | Risk Ratio (M‐H, Random, 95% CI) | Subtotals only | |
| 1.1 Fluphenazine | 1 | 34 | Risk Ratio (M‐H, Random, 95% CI) | 2.25 [0.22, 22.53] |
| 1.2 Haloperidol | 2 | 71 | Risk Ratio (M‐H, Random, 95% CI) | 1.10 [0.67, 1.80] |
| 1.3 Quetiapine | 2 | 191 | Risk Ratio (M‐H, Random, 95% CI) | 0.65 [0.15, 2.86] |
| 1.4 Risperidone | 1 | 17 | Risk Ratio (M‐H, Random, 95% CI) | 9.9 [0.63, 155.08] |
| 1.5 Thiothixene | 1 | 42 | Risk Ratio (M‐H, Random, 95% CI) | 1.75 [0.94, 3.26] |
| 1.6 Ziprasidone | 1 | 75 | Risk Ratio (M‐H, Random, 95% CI) | 0.79 [0.45, 1.41] |
| 2 Clinical state, stage or problem Show forest plot | 9 | Risk Ratio (M‐H, Random, 95% CI) | Subtotals only | |
| 2.1 First episode patients | 1 | 17 | Risk Ratio (M‐H, Random, 95% CI) | 9.9 [0.63, 155.08] |
| 2.2 Not first episode patients | 8 | 516 | Risk Ratio (M‐H, Random, 95% CI) | 1.07 [0.86, 1.34] |
| Outcome or subgroup title | No. of studies | No. of participants | Statistical method | Effect size |
| 1 Excluding studies with unclear randomisation methods Show forest plot | 2 | 234 | Risk Ratio (M‐H, Random, 95% CI) | 1.05 [0.77, 1.44] |
| 2 Excluding studies with unclear allocation concealment methods Show forest plot | 2 | 234 | Risk Ratio (M‐H, Random, 95% CI) | 1.05 [0.77, 1.44] |
| 3 Exclusion of studies with high risk of bias regarding blinding Show forest plot | 8 | 516 | Risk Ratio (M‐H, Random, 95% CI) | 1.07 [0.86, 1.34] |
| 4 Exclusion of studies with high risk of bias regarding incomplete outcome data Show forest plot | 6 | 375 | Risk Ratio (M‐H, Random, 95% CI) | 1.19 [0.92, 1.54] |
| 5 Exclusion of studies with imputed values Show forest plot | 8 | 458 | Risk Ratio (M‐H, Random, 95% CI) | 1.16 [0.90, 1.50] |
| 6 Fixed effects Show forest plot | 9 | 533 | Risk Ratio (M‐H, Fixed, 95% CI) | 1.10 [0.88, 1.38] |