Aumento de la dosis del antipsicótico para la falta de respuesta en la esquizofrenia
Resumen
Antecedentes
Muchos pacientes con esquizofrenia no logran una respuesta clínica satisfactoria con una dosis estándar del fármaco antipsicótico prescrito inicialmente. En dichos casos, los médicos enfrentan el dilema de aumentar la dosis del antipsicótico para mejorar la eficacia del antipsicótico.
Objetivos
Examinar la eficacia del aumento de la dosis del antipsicótico en comparación con el mantenimiento de la misma dosis en el tratamiento de los pacientes con esquizofrenia que no han respondido (según se definió en los estudios individuales) a una prueba inicial del fármaco antipsicótico. También se examinan los efectos adversos asociados con dicho procedimiento.
Métodos de búsqueda
Se hicieron búsquedas en el registro de ensayos del Grupo Cochrane de Esquizofrenia (Cochrane Schizophrenia Group Trials Register) (10 junio 2014, 6 octubre 2015 y 30 marzo 2017). Se examinaron las referencias de todos los estudios incluidos para obtener ensayos adicionales.
Criterios de selección
Todos los ensayos controlados aleatorios (ECA) relevantes que informaran datos utilizables y que compararan el aumento de la dosis del antipsicótico en lugar del mantenimiento de la dosis original en los pacientes con esquizofrenia que no responden al tratamiento antipsicótico inicial.
Obtención y análisis de los datos
Al menos dos autores de la revisión extrajeron los datos de forma independiente. Los datos dicotómicos se analizaron mediante los riesgos relativos (RR) y los intervalos de confianza (IC) del 95%. Los datos continuos se analizaron mediante las diferencias de medias (DM) y sus IC del 95%. Se evaluó el riesgo de sesgo de los estudios incluidos y se utilizó GRADE para crear la tabla "Resumen de los hallazgos".
Resultados principales
Se incluyen en esta revisión 10 ECA relevantes con 675 participantes. Todos los ensayos fueron doble ciego excepto uno que fue simple ciego. Todos los estudios tuvieron una fase de preinclusión para confirmar que no respondían al tratamiento antipsicótico inicial. Los ensayos se publicaron entre 1980 y 2016. En la mayoría de los estudios, los métodos de asignación al azar, de ocultación de la asignación y de cegamiento se informaron de manera deficiente. Además a menudo los tamaños de la muestra fueron pequeños, lo que limita la calidad general de la evidencia. En términos generales, no se encontraron diferencias claras entre los grupos en cuanto al número de participantes que mostraron una respuesta clínicamente relevante (RR 1,09; IC del 95%: 0,86 a 1,40; nueve ECA, N = 533; evidencia de baja calidad) o que abandonaron el estudio de forma precoz debido a los efectos adversos (RR 1,63; IC del 95%: 0,52 a 5,07; evidencia de muybaja calidad) o debido a cualquier razón (RR 1,30; IC del 95%: 0,89 a 1,90; cinco ECA, N = 353, evidencia de baja calidad). De igual manera, no se encontraron diferencias claras en el estado mental general medido según el cambio en las puntuaciones totales de la PANSS (DM ‐1,44; IC del 95%: ‐6,85 a 3,97; tres ECA, N = 258, evidencia de muy baja calidad). Al menos un efecto adverso fue ambiguo entre los grupos (RR 0,91; IC del 95%: 0,55 a 1,50; dos ECA, N = 191, evidencia de muy baja calidad). No se informaron datos sobre los resultados del tiempo en el hospital ni de la calidad de vida. Finalmente, los análisis de subgrupos y de sensibilidad no mostraron efectos sobre el resultado primario, pero claramente estos análisis tuvieron un escaso poder estadístico.
Conclusiones de los autores
Los datos actuales no muestran diferencias claras entre el aumento o el mantenimiento de la dosis del antipsicótico en los pacientes con esquizofrenia que no responden al tratamiento antipsicótico inicial. El informe de los efectos adversos fue limitado y deficiente. Hay una necesidad urgente de ensayos adicionales para determinar la estrategia de tratamiento opcional en dichos casos.
PICO
Resumen en términos sencillos
Aumento versus mantenimiento de la dosis del antipsicótico para los pacientes con esquizofrenia que no responden al tratamiento
Pregunta de la revisión
¿Si un paciente con esquizofrenia no responde inicialmente a un antipsicótico, el aumento de la dosis de dicho antipsicótico es efectivo y seguro?
Antecedentes
Muchos pacientes con esquizofrenia, una enfermedad mental grave, no responden completamente (es decir, aún presentan síntomas como delirios y alucinaciones) con una dosis estándar del fármaco antipsicótico prescrito inicialmente. En dichos casos, los médicos pueden considerar aumentar la dosis del antipsicótico más allá de los umbrales regulares o cambiar a un fármaco antipsicótico diferente para mejorar la eficacia del antipsicótico. La evidencia en cuanto a la estrategia de tratamiento óptima es escasa.
Búsqueda de la evidencia
El especialista en información del Grupo Cochrane de Esquizofrenia realizó una búsqueda electrónica del registro especializado hasta el 30 de marzo de 2017 para obtener ensayos que asignaron al azar a los pacientes con esquizofrenia que no respondían al tratamiento antipsicótico inicial a recibir un aumento de la dosis del antipsicótico o continuar con la misma dosis. La búsqueda obtuvo 1919 registros, cuya elegibilidad fue verificada por los autores de la revisión.
Evidencia encontrada
Diez ensayos cumplieron con los requisitos de la revisión y proporcionaron datos utilizables. No se observaron diferencias claras entre el aumento de la dosis del fármaco antipsicótico y la continuación del tratamiento antipsicótico con la misma dosis en cuanto a cualquier resultado de eficacia (respuesta clínica) o de seguridad (incidencia de efectos adversos). La evidencia actualmente disponible es limitada y de calidad baja o muy baja. En particular, muy pocos estudios informaron los efectos adversos de manera adecuada.
Conclusiones
Los resultados de la presente revisión indican que no existe evidencia de buena calidad para apoyar o refutar la hipótesis de que el aumento de la dosis del antipsicótico en los pacientes que no responden al tratamiento antipsicótico inicial es diferente a continuar del tratamiento antipsicótico con la misma dosis. No existe evidencia clara disponible con respecto a la seguridad. Por lo tanto, no se pueden establecer conclusiones firmes. Se necesitan ensayos más grandes y bien diseñados.
Conclusiones de los autores
Summary of findings
| Antipsychotic dose increase compared to antipsychotic dose continuation for non response in schizophrenia | ||||||
| Patient or population: non response in schizophrenia | ||||||
| Outcomes | Anticipated absolute effects* (95% CI) | Relative effect | № of participants | Certainty of the evidence | Comments | |
| Risk with antipsychotic dose continuation | Risk with antipsychotic dose increase | |||||
| Global state: clinically relevant response: Assessed with response ratio | Study population | RR 1.09 | 533 | ⊕⊕⊝⊝ | ||
| 309 per 1000 | 336 per 1000 | |||||
| Leaving the study early: tolerability ‐ leaving early due to adverse effects. | Study population | RR 1.63 | 496 | ⊕⊝⊝⊝ | ||
| 74 per 1000 | 121 per 1000 | |||||
| Leaving the study early: acceptability ‐ leaving early due to any reason. | Study population | RR 1.30 | 353 | ⊕⊕⊝⊝ | ||
| 23 per 100 | 30 per 100 | |||||
| General mental state : PANSS total score change* | The mean general mental state ‐ PANSS total score change ranged from −8.9 to 0.03 points | MD 1.44 points lower | ‐ | 258 | ⊕⊝⊝⊝ | One other trial used the BPRS total score change and showed no clear difference between the two groups. Pre‐defined outcome: Clinically important change in general mental state not reported. |
| Adverse effects ‐ at least one adverse effect | Study population | RR 0.91 | 191 | ⊕⊝⊝⊝ | ||
| 716 per 1000 | 652 per 1000 | |||||
| Service use: time in hospital | ‐ | see comment | ‐ | (0 studies) | ‐ | No studies reported this outcome. |
| Quality of life ‐ clinically important change in quality of life (defined as at least 50% improvement in HQLS) | Study population | not estimable | 17 | ⊕⊕⊝⊝ | ||
| 0 per 1000 | 0 per 1000 | |||||
| *The risk in the intervention group (and its 95% confidence interval) is based on the assumed risk in the comparison group and the relative effect of the intervention (and its 95% CI). | ||||||
| GRADE Working Group grades of evidence | ||||||
| 1 Imprecision for dichotomous outcomes: a) sample size should be >800 and/or total number of events>300; in our review, both numbers are much smaller. b) the pooled estimate of effect includes both no effect and an appreciable benefit or appreciable harm. 2 Inconsistency: Heterogeneity: Tau² = 1.03; Chi² = 11.24, df = 5 (P = 0.05); I² = 56% 3 Inconsistency: Heterogeneity: Tau² = 14.71; Chi² = 5.70, df = 2 (P = 0.06); I² = 65% 4 Imprecision for continuous outcomes: a) sample size is lower than 400, b) confidence interval includes no effect and the upper or lower confidence limit crosses the minimal important difference (MID), either for benefit of harm 5 Indirectness: The pre‐specified outcome (clinical important change in mental state) was not reported. 6 Inconsistency: Heterogeneity: Tau² = 0.10; Chi² = 3.62, df = 1 (P = 0.06); I² = 72% | ||||||
Antecedentes
Entre un quinto y un tercio de los pacientes con esquizofrenia no responde al tratamiento antipsicótico estándar de forma adecuada (Barnes 2003). Una posibilidad para ayudar a estos pacientes es aumentar la dosis del antipsicótico prescrito actualmente. Este enfoque se basa en la premisa de que el aumento de la dosis de un fármaco antipsicótico daría lugar a una mejoría en la eficacia del tratamiento (Kinon 2004). En los años setenta y ochenta hubo una tendencia al uso de dosis altas para el tratamiento de la esquizofrenia. Esta estrategia, a veces también llamada " neuroleptización rápida" (Neborsky 1981), posteriormente fue abandonada cuando una revisión narrativa indicó que las dosis altas no eran más eficaces que las dosis bajas (Baldessarini 1988). Sin embargo, dicha revisión no estuvo restringida a los pacientes que no responden, los que se podrían beneficiar con un aumento de la dosis cuando las dosis estándar no son efectivas. La administración de dosis altas de antipsicóticos es la práctica frecuente por lo que es importante realizar una revisión sistemática sobre este tema.
Descripción de la afección
La esquizofrenia a menudo es un trastorno psiquiátrico crónico e invalidante. Afecta aproximadamente al 1% de la población a nivel global con pocas diferencias entre los sexos. Sus manifestaciones características son síntomas “positivos” como ideas fijas, creencias falsas (delirios) y percepciones sin causa (alucinaciones), síntomas “negativos” como la apatía y la falta de iniciativa, desorganización del comportamiento y del pensamiento y síntomas catatónicos como manierismos y posturas extrañas (Carpenter 1994). El grado de sufrimiento y discapacidad es considerable, entre el 80% y el 90% de los pacientes no trabaja (Marvaha 2004) y alrededor del 5% muere por suicidio (Palmer 2005). Los antipsicóticos son el tratamiento actual de preferencia en la esquizofrenia (Kane 1996). Desafortunadamente, un gran número de pacientes no presenta mejorías significativas a pesar del tratamiento farmacológico (Lieberman 2005). Estos pacientes suelen ser considerados "pacientes que no responden al tratamiento". La epidemiología exacta de este fenómeno no se comprende claramente y una razón es que los criterios para la falta de respuesta o la resistencia al tratamiento difieren (Howes 2017). Sin embargo, las guías dicen que aproximadamente del 20% al 30% de los pacientes no responde a una prueba adecuada de un fármaco antipsicótico (Lehmann 2004). No hay una variable predictiva clara de la falta de respuesta a los antipsicóticos, pero está bien establecido que los pacientes con un primer episodio responden mejor que los pacientes con enfermedad crónica (Jäger 2007).
Descripción de la intervención
El aumento de la dosis del antipsicótico en los pacientes con esquizofrenia que no responden al tratamiento a menudo se realiza de forma gradual — la dosis se aumenta de forma sistemática hasta lograr una respuesta clínica o hasta que los efectos secundarios se vuelvan demasiado pronunciados y no se obtengan beneficios adicionales en la eficacia. Los rangos de dosis efectivos de los antipsicóticos de segunda generación en general se comprenden mejor que los de los antipsicóticos de primera generación (Davis 2004; Baldessarini 1988). Sin embargo, incluso en dicho caso, los rangos de dosis efectivos sólo se basan en los valores medios de muchos pacientes. Pacientes individuales podrían necesitar dosis mayores más allá de los rangos oficialmente aprobados. Los estudios sobre los niveles de antipsicóticos en plasma revelan que hay mucha variabilidad interindividual, es decir dos pacientes diferentes pueden tener niveles plasmáticos muy diferentes cuando reciben la misma dosis de un antipsicótico, por ejemplo debido a la actividad diferente de las enzimas hepáticas que metabolizan estos fármacos (principalmente de la familia del citocromo P450). Este hecho puede explicar por qué algunos pacientes necesitan dosis mucho mayores que otros (Hiemke 2011).
De qué manera podría funcionar la intervención
La idea detrás del aumento de la dosis del antipsicótico es que en el caso de un determinado paciente con esquizofrenia que no responde al tratamiento se debe lograr un umbral individual de sensibilidad para que el fármaco sea efectivo. Es bien conocido que hay considerables diferencias individuales con respecto a la farmacocinética de los antipsicóticos, lo que influye directamente en su eficacia (Miller 2009). Un factor principal reside en las diferencias en la expresión de las enzimas del citocromo P450 que son responsables del metabolismo de muchos fármacos antipsicóticos. Existen polimorfismos en los genes que codifican estas enzimas y pueden dar lugar a su expresión excesiva y, por lo tanto, a la eliminación demasiado rápida de los fármacos (denominados "metabolizadores ultrarrápidos") y a la falta de respuesta posterior. Un trabajo más reciente indicó que algunas de las diferencias individuales en la respuesta a los fármacos antipsicóticos podrían tener su fuente en la variabilidad de los genotipos ABCB1, lo que significa que los individuos con una configuración genotípica favorable muestran un riesgo menor de desarrollar refractividad al aumento de la dosis del antipsicótico (Vijayan 2012).
Por qué es importante realizar esta revisión
Uno de los retos principales en el tratamiento farmacológico de la esquizofrenia es la falta de respuesta a los antipsicóticos. El aumento de la dosis del antipsicótico es una de las estrategias principales para hacer lo que con frecuencia se aplica en la práctica clínica. Desafortunadamente, no existe evidencia clara sobre hasta qué punto estas estrategias son efectivas. Lo anterior a menudo da lugar a decisiones clínicas no fundamentadas que pueden provocar efectos secundarios graves, exacerbaciones de la psicosis o recurrencias en muchos pacientes con esquizofrenia. El objetivo es proporcionar una familia de revisiones sistemáticas relacionadas sobre este tema para contribuir a más práctica clínica basada en la evidencia. La revisión también es potencialmente importante para los elaboradores de políticas, debido a que la alta frecuencia de falta de respuesta y de resistencia al tratamiento da lugar a tasas altas de discapacidad y, por lo tanto, a costos para la sociedad (Vos 2012).
Esta revisión forma parte de tres Revisiones Cochrane "relacionadas", que investigan la falta de respuesta en los pacientes con esquizofrenia ("Aumento de la dosis del antipsicótico versus cambio de antipsicótico para la falta de respuesta en la esquizofrenia" [Samara 2015b] y "Reducción de la dosis del antipsicótico para los pacientes con esquizofrenia" [título solamente]).
Objetivos
Examinar la eficacia del aumento de la dosis del antipsicótico en comparación con el mantenimiento de la misma dosis en el tratamiento de los pacientes con esquizofrenia que no han respondido (según se definió en los estudios individuales) a una prueba inicial del fármaco antipsicótico. También se examinan los efectos adversos asociados con dicho procedimiento.
Métodos
Criterios de inclusión de estudios para esta revisión
Tipos de estudios
Todos los ensayos controlados aleatorios relevantes. Si un ensayo se describió como doble ciego, pero estuvo implícito que la asignación fue aleatoria, se incluyó en un análisis de sensibilidad (ver "Análisis de sensibilidad"). Se excluyeron los estudios cuasialeatorios, como los que asignaron por días alternos de la semana. Cuando los pacientes recibieron tratamientos adicionales, sólo se incluyeron los datos si el tratamiento complementario se distribuyó por igual entre los grupos y sólo se asignó al azar el grupo de aumento de la dosis.
Tipos de participantes
Adultos, como sea que se hayan definido, con esquizofrenia o trastornos relacionados — incluido el trastorno esquizofreniforme, el trastorno esquizoafectivo y el trastorno delusorio, por cualquier medio de diagnóstico — que no responden al tratamiento antipsicótico actual, independientemente de la edad, el sexo o la raza. Se aceptó cualquier definición de falta de respuesta utilizada en los estudios individuales. Es una estrategia general del Grupo Cochrane de Esquizofrenia (Cochrane Schizophrenia Group) para incluir también estudios que no utilizaron los criterios de diagnóstico operacionalizados como los del Diagnostic and Statistical Manual of Mental Disorders 5th Edition (DSM‐5), debido a que en la práctica clínica habitual dichos criterios tampoco se utilizan de forma meticulosa.
Tipos de intervenciones
1. Aumento de la dosis
Cualquier aumento de la dosis del antipsicótico, independientemente de cómo se definió. Las dosis nuevas podrían estar dentro de los rangos de dosis proyectados recomendados según se describe en las etiquetas de los antipsicóticos o en las recomendaciones internacionales (Gardner 2010) o ser mayores.
2. Continuación de la dosis
Continuación de la dosis del antipsicótico actual.
Tipos de medida de resultado
Todos los resultados se dividieron en a corto plazo (hasta tres meses), a plazo medio (más de tres meses hasta seis meses) y a largo plazo (más de seis meses).
Se realizó un esfuerzo por informar los resultados binarios registrando los grados de cambio claros y clínicamente significativos (p.ej. impresión global de mucha mejoría o mejoría mayor del 50% en la escala de calificación definida en los ensayos) antes que cualquier otro. Más adelante se enumeran los otros resultados binarios y luego los que son continuos.
Resultados primarios
1. Estado global: respuesta clínicamente relevante ‐ según lo definido por los ensayos *
* Se esperó que diferentes ensayos utilizaran diferentes definiciones de respuesta. Sin embargo, los estudios han mostrado que, siempre que se apliquen medidas relativas del riesgo (riesgos relativos, odds ratios), los resultados metanalíticos no difieren mucho en dependencia del valor de corte exacto aplicado (Furukawa 2011).
2. Abandono precoz del estudio
2.1 Tolerabilidad ‐ abandono precoz debido a los efectos adversos
Resultados secundarios
1. Abandono precoz del estudio
1.1 Aceptabilidad ‐ abandono precoz del estudio por cualquier razón
1.2 Eficacia ‐ abandono precoz por ineficacia del tratamiento
2. Estado mental
2.1 Estado mental general
2.1.1 Cambio de importancia clínica en el estado mental general ‐ según se definió en cada uno de los estudios
2.1.2 Puntuación final promedio del estado mental general
2.1.3 Cambio promedio en las puntuaciones del estado mental general
2.2 Síntomas positivos
2.2.1 Cambio de importancia clínica en los síntomas positivos ‐ según se definió en cada uno de los estudios
2.2.2 Puntuación promedio de los síntomas positivos al final del estudio
2.2.3 Cambio promedio en las puntuaciones de síntomas positivos
2.3 Síntomas negativos
2.3.1 Cambio de importancia clínica en los síntomas negativos ‐ según se definió en cada uno de los estudios
2.3.2 Puntuación promedio de los síntomas negativos al final del estudio
2.3.3 Cambio promedio en las puntuaciones de síntomas negativos
3. Depresión
3.1 Cambio de importancia clínica en los síntomas depresivos ‐ según se definió en cada uno de los estudios
3.2 Puntuación promedio de los síntomas depresivos al final del estudio
3.3 Cambio promedio en las puntuaciones de síntomas depresivos
4. Comportamiento agresivo
4.1 Cambio de importancia clínica en la conducta agresiva ‐ según se definió en cada uno de los estudios
4.2 Puntuación promedio de la conducta agresiva al final del estudio
4.3 Cambio promedio en la puntuación del comportamiento agresivo
5. Exacerbaciones de la psicosis (según se definió en los estudios individuales)
5.1. Duración de la enfermedad (número de días con exacerbaciones)
6. Uso de servicios
6.1 Hospitalización ‐ tiempo en el hospital (días)
7. Efectos adversos
7.1. Por lo menos, un efecto adverso
7.2. Efectos secundarios específicos (según los definieron los autores originales, basado en cualquier valor de referencia aplicado)
8. Calidad de vida
8.1 Cambio de importancia clínica en la calidad de vida ‐ según se definió en cada uno de los estudios
8.2 Promedio final de la calidad de vida
8.3 Cambio promedio de la calidad de vida
9. Satisfacción con la atención
9.1 Cambio de importancia clínica en la satisfacción con la atención ‐ según se definió en cada uno de los estudios
9.2 Satisfacción promedio final con la atención
9.3 Cambio promedio en la satisfacción con la atención
Tabla "Resumen de los hallazgos"
Se utilizó el enfoque GRADE para interpretar los hallazgos (Schünemann 2011), y el GRADE profiler (GRADE pro GDT) para exportar los datos de esta revisión y crear las tablas "Resumen de los hallazgos". Estas tablas aportan información específica de los resultados en cuanto a la calidad general de la evidencia de cada estudio incluido en la comparación, la magnitud del efecto de las intervenciones examinadas y la suma de los datos disponibles sobre todos los resultados que se consideraron importantes para la atención del paciente y la toma de decisiones.
Se intentaron seleccionar los siguientes resultados importantes para su inclusión en la tabla "Resumen de los hallazgos".
-
Estado global: respuesta clínicamente relevante ‐ según lo definido por los ensayos.
-
Abandono precoz del estudio: tolerabilidad ‐ abandono precoz debido a los efectos adversos.
-
Abandono precoz del estudio: aceptabilidad ‐ abandono precoz del estudio por cualquier razón.
-
Estado mental general ‐ cambio clínicamente importante en las puntuaciones del estado mental general.
-
Efectos adversos ‐ al menos un efecto adverso.
-
Uso de servicios ‐ tiempo en el hospital.
-
Calidad de vida ‐ sin cambios clínicamente significativos en la calidad de vida.
Cuando los datos no estaban disponibles para estos resultados predeterminados pero estaban disponibles para los que son similares, se presentó el resultado más cercano al predeterminado en la tabla pero se consideró este hecho al calificar el resultado.
Métodos de búsqueda para la identificación de los estudios
We applied no language restriction within the limitations of the search tools.
Búsquedas electrónicas
1. Cochrane Schizophrenia Group’s Study‐Based Register of Trials
On 30 March 2017, the Information Specialist searched the register using the following search strategies.
(Dosage Increasing*) in Intervention Field of STUDY
The Cochrane Schizophrenia Group’s Registry of Trials is compiled by systematic searches of major resources (including AMED, BIOSIS, CINAHL, Embase, MEDLINE, PsycINFO, PubMed, and registries of clinical trials) and their monthly updates, handsearches, grey literature, and conference proceedings (see Group Module). There were no language, date, document type, or publication status limitations for inclusion of records into the register.
Búsqueda de otros recursos
1. Reference searching
We inspected references of all included studies for further relevant studies.
2. Personal contact
We contacted the first author of each included study for information regarding unpublished trials. We noted any response in the Characteristics of included studies and thanked the authors in the Acknowledgements.
Obtención y análisis de los datos
Selección de los estudios
At least two authors (EK, MTS) independently inspected citations from the searches to identify relevant abstracts. Where disputes arose, we acquired the full report for more detailed scrutiny. At least two review authors (EK, MTS) obtained and independently inspected full reports of the abstracts meeting the review criteria. We resolved disagreements by discussion with SL. Where it was not possible to resolve disagreement by discussion, we attempted to contact the authors of the study for clarification.
Extracción y manejo de los datos
1. Extraction
Two review authors (MS, EK) independently extracted data from all included studies. Again, we discussed any disagreement, eventually with SL; documented decisions; and, if necessary, contacted authors of studies for clarification. We extracted data presented only in graphs and figures whenever necessary and possible. We attempted to contact authors through an open‐ended request in order to obtain missing information or for clarification whenever necessary.
2. Management
2.1 Forms
We extracted data onto standard, simple forms.
2.2 Scale‐derived data
We included continuous data from rating scales only if:
a) the psychometric properties of the measuring instrument have been described in a peer‐reviewed journal (Marshall 2000);
b) the measuring instrument has not been written or modified by one of the trialists for that particular trial; and
c) the instrument is a global assessment of an area of functioning and not sub‐scores which are not, in themselves, validated or shown to be reliable. There are exceptions, however: we included sub‐scores from mental state scales measuring positive and negative symptoms of schizophrenia.
Ideally the measuring instrument should either be i. a self‐report or ii. completed by an independent rater or relative (not the therapist). We realise that this is not often reported clearly: we note if this is the case or not in Description of studies.
2.3 Endpoint versus change data
There are advantages of both endpoint and change data. Change data can remove a component of between‐person variability from the analysis. On the other hand calculation of change needs two assessments (baseline and endpoint) which can be difficult in unstable and difficult‐to‐measure conditions such as schizophrenia. We decided to use endpoint data primarily, and only use change data if the latter were not available. We combined endpoint and change data as we preferred to used mean differences (MD) rather than standardised mean differences (Deeks 2011).
2.4 Skewed data
Continuous data on clinical and social outcomes are often not normally distributed. To avoid the pitfall of applying parametric tests to non‐parametric data, we applied the following standards to relevant continuous data before inclusion.
For endpoint data from studies including fewer than 200 participants:
-
when a scale starts from the finite number zero, we subtracted the lowest possible value from the mean, and divided this by the standard deviation. If this value is lower than 1, it strongly suggests that the data are skewed and we would exclude these data. If this ratio is higher than 1 but less than 2, there is a suggestion that the data are skewed: we would enter these data and test whether their inclusion or exclusion would change the results substantially. If such data changed results we would enter as 'other data'. Finally, if the ratio is larger than 2 we would include these data, because it is less likely that they are skewed (Altman 1996; Higgins 2011).
-
if a scale starts from a positive value (such as the Positive and Negative Syndrome Scale (PANSS), which can have values from 30 to 210 (Kay 1986)), we would modify the calculation described above to take the scale starting point into account. In these cases skewed data are present if 2 SD > (S − S min), where S is the mean score and 'S min' is the minimum score.
Please note: we would have entered all relevant data from studies of more than 200 participants in the analysis irrespective of the above rules, because skewed data pose less of a problem in large studies. We also entered all relevant change data, as when continuous data are presented on a scale that includes a possibility of negative values (such as change data), it is difficult to tell whether or not data are skewed.
2.5 Common measure
To facilitate comparison between trials, we intended to convert variables that can be reported in different metrics, such as days in hospital (mean days per year, per week or per month) to a common metric (e.g. mean days per month).
2.6 Conversion of continuous to binary
Where possible, we made efforts to convert outcome measures to dichotomous data. This can be done by identifying cut‐off points on rating scales and dividing participants accordingly into 'clinically improved' or 'not clinically improved'. It is generally assumed that if there is a 50% reduction in a scale‐derived score such as the Brief Psychiatric Rating Scale (BPRS, Overall 1962), or the Positive and Negative Syndrome Scale (PANSS, Kay 1986), this could be considered as a clinically significant response (Leucht 2005a; Leucht 2005b). If data based on these thresholds were not available, we used the primary cut‐off presented by the original authors.
2.7 Direction of graphs
Where possible, we entered data in such a way that the area to the left of the line of no effect indicated a favourable outcome for increased dose group. Where keeping to this made it impossible to avoid outcome titles with clumsy double‐negatives (e.g. 'Not un‐improved') we reported data where the left of the line indicated an unfavourable outcome. We noted this in the relevant graphs.
Evaluación del riesgo de sesgo de los estudios incluidos
Review authors (MTS and EK) worked independently to assess risk of bias by using criteria described in the Cochrane Handbook for Systematic Reviews of Interventions to assess trial quality (Higgins 2011b). This set of criteria is based on evidence of associations between overestimate of effect and high risk of bias of the article such as sequence generation, allocation concealment, blinding, incomplete outcome data and selective reporting.
If MTS and EK disagreed, they involved SI to make the final rating by consensus. Where inadequate details of randomisation and other characteristics of trials were provided, we contacted authors of the studies in order to obtain further information. We reported non‐concurrence in quality assessment, but if disputes arose as to which category we would allocate a trial then again we resolved by discussion.
The level of risk of bias was noted in the text of the review (Risk of bias in included studies), the Characteristics of included studies table and in the Summary of findings table 1.
Medidas del efecto del tratamiento
1. Binary data
For binary outcomes we calculated a standard estimation of the risk ratio (RR) and its 95% confidence interval (CI). It has been shown that RR is more intuitive than odds ratios (Boissel 1999); and that odds ratios tend to be interpreted as RR by clinicians (Deeks 2000). The number needed to treat for an additional beneficial outcome (NNTB) and number needed to treat for an additional harmful outcome (NNTH), with confidence intervals, is intuitively attractive to clinicians but is problematic both in its accurate calculation in meta‐analyses and interpretation (Hutton 2009). For binary data presented in the 'Summary of findings' table, we calculated illustrative comparative risks where possible.
2. Continuous data
For continuous outcomes we estimated mean difference (MD) between groups. We preferred not to calculate effect size measures (standardised mean difference (SMD)). However if scales of very considerable similarity were used, we presumed there was a small difference in measurement, and we calculated effect size and transformed the effect back to the units of one or more of the specific instruments.
Cuestiones relativas a la unidad de análisis
1. Cluster trials
Studies increasingly employ 'cluster randomisation' (such as randomisation by clinician or practice) but analysis and pooling of clustered data poses problems. Firstly, authors often fail to account for intra‐class correlation in clustered studies, leading to a 'unit of analysis' error (Divine 1992), whereby P values are spuriously low, confidence intervals unduly narrow and statistical significance overestimated. This causes type I errors (Bland 1997; Gulliford 1999).
If clustering had not been accounted for in primary studies, we would have presented data in a table, with a (*) symbol to indicate the presence of a probable unit of analysis error. We would have contacted first authors of studies to obtain intra‐class correlation coefficients for their clustered data and to adjust for this by using accepted methods (Gulliford 1999). If clustering had been incorporated into the analysis of primary studies, we presented these data as if from a non‐cluster randomised study, but adjusted for the clustering effect.
We have sought statistical advice and have been advised that the binary data as presented in a report should be divided by a 'design effect'. This is calculated using the mean number of participants per cluster (m) and the intra‐class correlation coefficient (ICC) [Design effect = 1 + (m − 1) * ICC] (Donner 2002). If the ICC was not reported we assumed it to be 0.1 (Ukoumunne 1999).
If cluster studies had been appropriately analysed taking into account intra‐class correlation coefficients and relevant data documented in the report, synthesis with other studies would have been possible using the generic inverse variance technique.
2. Cross‐over trials
A major concern of cross‐over trials is the carry‐over effect. It occurs if an effect (e.g. pharmacological, physiological or psychological) of the treatment in the first phase is carried over to the second phase. As a consequence, on entry to the second phase the participants can differ systematically from their initial state despite a wash‐out phase. For the same reason cross‐over trials are not appropriate if the condition of interest is unstable (Elbourne 2002). As both effects are very likely in people with severe mental illness, we used data of the first phase only of cross‐over studies.
3. Studies with multiple treatment groups
Where a study involves more than two treatment arms, if relevant we presented the additional treatment arms in comparisons. If data were binary we simply added and combined within the two‐by‐two table. If data were continuous we combined data following the formula in the Cochrane Handbook for Systematic Reviews of Interventions (Higgins 2011a). Where the additional treatment arms were not relevant, we did not use these data.
Manejo de los datos faltantes
1. Overall loss of credibility
We share the concern that at some degree of loss to follow‐up, data must lose credibility (Xia 2010). However, from which degree of attrition onward this is a problem is unclear. Therefore we did not exclude studies on the basis of degree of attrition, but we took attrition into account in the 'Risk of bias' assessment.
2. Binary
We presented data on a 'once randomised, always analyse' basis (an intention‐to‐treat analysis, ITT). Those leaving the study early were all assumed to have the same rates of outcome as those who completed.
3. Continuous
3.1 Assumptions about participants who left the trials early or who were lost to follow‐up
Various methods are available to account for participants who left the trials early or were lost to follow‐up. Some trials just present the results of study completers, others use the method of 'last observation carried forward' (LOCF, Leucht 2007), while more recently methods such as multiple imputation or mixed‐effects models for repeated measurements (MMRM) have become more of a standard. While the last two methods seem somewhat better than LOCF (Leon 2006), we felt that the high percentage of participants leaving the studies early and differences in the reasons for leaving the studies early between groups is often the core problem in randomised schizophrenia trials. We therefore did not exclude studies based on the statistical approach used. However, for preference we used the more sophisticated approaches. For example, we preferred MMRM or multiple imputation to LOCF and we only presented completer analyses if some kind of ITT data were not available at all. Moreover, we addressed attrition in the 'Risk of bias' assessment.
3.2 Standard deviations
If standard deviations were not reported, we first tried to obtain the missing values from the authors. If not available, where there were missing measures of variance for continuous data, but an exact standard error and confidence intervals available for group means, and either P value or t value available for differences in mean, we calculated them according to the rules described in the Cochrane Handbook for Systematic Reviews of Interventions (Higgins 2011a). When only the standard error (SE) was reported, we calculated standard deviations (SDs) by the formula SD = SE * √(n). The Cochrane Handbook for Systematic Reviews of Interventions presents detailed formulae for estimating SDs from P values, t or F values, confidence intervals, ranges or other statistics (Higgins 2011a). If these formulae did not apply, we calculated the SDs according to a validated imputation method which is based on the SDs of the other included studies (Furukawa 2006). Although some of these imputation strategies can introduce error, the alternative would be to exclude a given study’s outcome and thus to lose information. We nevertheless examined the validity of the imputations in a sensitivity analysis excluding imputed values.
Evaluación de la heterogeneidad
1. Clinical heterogeneity
We considered all included studies initially, without seeing comparison data, to judge clinical heterogeneity. We simply inspected all studies for clearly outlying people or situations which we had not predicted would arise. When such situations or participant groups arose, we discussed these.
2. Methodological heterogeneity
We considered all included studies initially, without seeing comparison data, to judge methodological heterogeneity. We simply inspected all studies for clearly outlying methods which we had not predicted would arise. When such methodological outliers arose, we discussed these.
3. Statistical heterogeneity
3.1 Visual inspection
We visually inspected graphs to investigate the possibility of statistical heterogeneity.
3.2 Employing the I² statistic
We investigated statistical heterogeneity between studies by considering the I² statistic alongside the Chi² P value. The I² statistic provides an estimate of the percentage of inconsistency thought to be due to chance (Higgins 2003). The importance of the observed value of I² depends on i. magnitude and direction of effects and ii. strength of evidence for heterogeneity (e.g. P value from Chi² test, or a confidence interval for I²). We considered an I² estimate greater than or equal to 50% accompanied by a statistically significant Chi² statistic as evidence of substantial levels of heterogeneity (Deeks 2011). When substantial levels of heterogeneity were found in the primary outcome, we explored reasons for heterogeneity (Subgroup analysis and investigation of heterogeneity).
Evaluación de los sesgos de notificación
Reporting biases arise when the dissemination of research findings is influenced by the nature and direction of results (Egger 1997). These are described in Chapter 10 of the Cochrane Handbook for Systematic Reviews of Interventions (Sterne 2011).
1. Protocol versus full study
We tried to locate protocols of included randomised trials. If the protocol was available, we compared outcomes in the protocol and in the published report . If the protocol was not available, we compared outcomes listed in the Methods section of the trial report with actually reported results.
2. Funnel plot
We are aware that funnel plots may be useful in investigating reporting biases but are of limited power to detect small‐study effects. We planned not to use funnel plots for outcomes where there are 10 or fewer studies, or where all studies are of similar size. In future versions, where funnel plots are possible we will seek statistical advice in their interpretation.
Síntesis de los datos
We understand that there is no closed argument for preference for use of fixed‐effect or random‐effects models. The random‐effects method incorporates an assumption that the different studies are estimating different, yet related, intervention effects. This does seem true to us as we are a priori expecting some clinical heterogeneity between the participants in the different trials. Therefore we chose the random‐effects model for analyses (DerSimonian 1986). There is, however, a disadvantage to the random‐effects model: it puts added weight onto small studies which often are the most biased ones. Depending on the direction of effect, these studies can either inflate or deflate the effect size.
Análisis de subgrupos e investigación de la heterogeneidad
1. Subgroup analyses
1.1 Antipsychotic drugs
We performed subgroup analyses based on the antipsychotic drugs included in the selected studies.
1.2 Clinical state, stage or problem
We undertook this review and provided an overview of the effects of dose increase versus dose maintenance for people with schizophrenia in general. In addition, however, we aimed to report data on subgroups of people in the same clinical state, stage and with similar problems.
2. Investigation of heterogeneity
We reported if heterogeneity was high. First, we investigated whether data had been entered correctly. Second, if data were correct we visually inspected the graph and we inspected closely studies outside of the company of the rest to identify reasons that might explain the heterogeneity. Decisions as to whether single studies should be excluded from the analysis, or whether a formal meta‐analysis should not be undertaken at all depend on issues such as whether the heterogeneity was due to differences in direction of effect or only to the degree of the difference between intervention and control (Higgins 2011a). When unanticipated clinical or methodological heterogeneity was obvious we simply stated hypotheses regarding these for future reviews or versions of this review. We did not anticipate undertaking analyses relating to these.
Análisis de sensibilidad
1. Implication of randomisation
We aimed to include trials in a sensitivity analysis if they were described in some way as to imply randomisation. For the primary outcomes we included these studies; if their inclusion did not result in a substantive difference, they remained in the analyses. If their inclusion did result in important clinically significant but not necessarily statistically significant differences, we did not add the data from these lower quality studies to the results of the better trials, but presented such data within a subcategory.
2. Risk of bias
We analysed the effects of excluding trials that were judged to be at high risk of bias across one or more of the domains described in Assessment of risk of bias in included studies. If the exclusion of trials at high risk of bias did not substantially alter the direction of effect or the precision of the effect estimates, then we included relevant data from these trials in the analysis. Studies with a high risk of bias in terms of randomisation or allocation concealment were excluded right from the start. When randomisation and allocation methods had not been described (and risk of bias was usually rated as unclear) we also entered such trials in a sensitivity analysis.
3. Imputed values
Where we had to make assumptions regarding missing SDs (see Dealing with missing data), we compared the findings of the primary outcomes when we used our assumption/s and when we used data only from studies which provided SDs.
We also undertook a sensitivity analysis to assess the effects of including data from trials where we used imputed values for ICC in calculating the design effect in cluster randomised trials.
4. Fixed and random effects
We synthesised data using a random‐effects model; however, we also synthesised data for the primary outcomes using a fixed‐effect model to evaluate whether this altered the results.
If substantial differences were noted in the direction or precision of effect estimates in any of the sensitivity analyses listed above, we did not pool data from the excluded trials with the other trials contributing to the outcome, but presented them separately.
Results
Description of studies
For substantive description of studies please see Characteristics of included studies and Characteristics of excluded studies tables.
Results of the search
The initial search of the Cochrane Schizophrenia Group Trials Register yielded 1525 reports. We made two later searches of the same Trials Register (using the same search strategy): one in October 2015 which yielded 386 records; and one in March 2017 which yielded 8 records. A total of 1835 records remained after we removed duplicates. After excluding 1778 records based on abstract or title, we obtained and closely inspected 57 full‐text reports. From these, we included 10 studies (referring to 17 full‐text reports); and excluded 37 studies (referring to 40 full‐text reports) (see Figure 1).
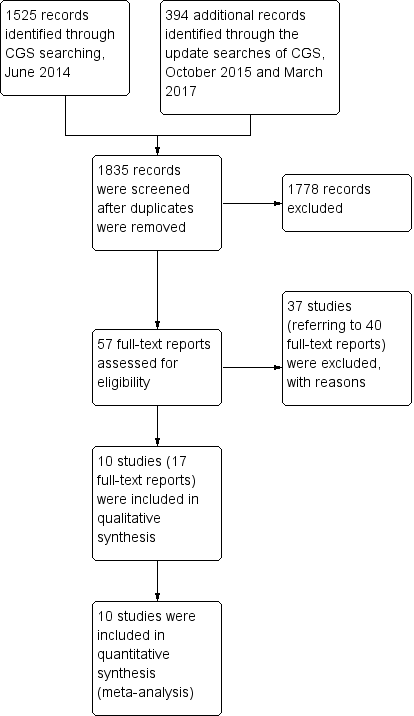
Study flow diagram.
Included studies
We selected 10 studies for inclusion in this review. The studies were published between 1980 and 2016 (for more details, see Characteristics of included studies and the accompanying ‘Risk of bias’ tables).
1. Study design
All studies were randomised; however, only two studies provided an adequate description of randomisation (Honer 2011; Sakurai 2016). All studies had a non‐randomised run‐in phase apart from one trial which had a randomised double‐blind run‐in phase of 2 weeks' duration (Loebel 2014).
2. Length of trials
The included trials varied in duration, both in terms of the run‐in phase and the main phase. The run‐in phase varied from 2 weeks (Huang 1987; Loebel 2014) to 4 weeks (Bjørndal 1980; Honer 2011; Kinon 1993; Lindenmayer 2011; McEvoy 1991; McGorry 2011; Sakurai 2016), whereas the main phase varied from 2 weeks (McEvoy 1991) to 12 weeks (Bjørndal 1980).
3. Participants
There were a total of 675 participants in the 10 included studies. Participants in seven of the included trials appear to have been inpatients (Bjørndal 1980; Huang 1987; Kinon 1993; Lindenmayer 2011; Loebel 2014; McEvoy 1991; McGorry 2011); while in the remaining three studies participants could be either in‐ or outpatients (Goff 2013; Honer 2011; Sakurai 2016). All studies bar one included patients with a diagnosis of schizophrenia according to different operational diagnostic criteria such as Research Diagnostic Criteria (RDC) (McEvoy 1991), DSM‐III (Huang 1987), DSM‐III‐R (Kinon 1993), DSM‐IV (Goff 2013; Honer 2011), DSM‐IV‐TR (Lindenmayer 2011; McGorry 2011), and ICD‐10 (Sakurai 2016) — the exception was Bjørndal 1980, which did not describe any diagnostic criteria. All studies included both male and female participants apart from two: Bjørndal 1980 included only male participants and Huang 1987 did not provide any data on the sex of the participants. The mean age of participants was 36.4 years.
4. Study size
Honer 2011 was the largest study (131 participants) followed by Sakurai 2016 (103 participants) and Loebel 2014 (95 participants) whereas Bjørndal 1980 and McGorry 2011 were the smallest studies (29 and 26 participants respectively). The remaining five studies had 48 to 75 participants.
5. Interventions
Ten studies compared antipsychotic dose increase versus antipsychotic dose continuation. In four studies the dose increase was flexible (Bjørndal 1980; Honer 2011; McEvoy 1991; McGorry 2011), whereas in the remaining studies it was fixed. There was one study on fluphenazine (Kinon 1993), two on haloperidol (Bjørndal 1980; McEvoy 1991), two on quetiapine (Honer 2011; Lindenmayer 2011), one on lurasidone (Loebel 2014), one on risperidone (McGorry 2011), one on thiothixene (Huang 1987), one on ziprasidone (Goff 2013), and one on olanzapine or risperidone (Sakurai 2016).
6. Outcomes
A variety of scales were used to assess clinical response and adverse events. The reporting on efficacy and side effects was incomplete in the original publications. However, we were able to improve this situation by contacting the authors, some of whom agreed to share their data with us (see Acknowledgements).
6.1 Outcome scales
Details of scales that provided usable data are shown below.
6.1.1 Global state
Clinical Global Impression ‒ CGI (Guy 1976)
CGI is a 7‐point rating instrument that is commonly used in studies on schizophrenia. It enables clinicians to quantify severity of illness (CGI‐Severity) and/or overall clinical improvement (CGI‐Improvement) during therapy with low scores indicating decreased severity or greater improvement.
6.1.2 Mental state
Brief Psychiatric Rating Scale ‒ BPRS (Overall 1962)
The BPRS is a scale used to measure the severity of psychiatric symptoms, including psychotic symptoms. The scale usually has 18 items (depending on the version the number of items could vary from 16 to 24), and each item is rated on a seven‐point scoring system varying from 'not present' (1) to 'extremely severe' (7). Higher scores indicate more pronounced symptomatology.
Nurses' Observation Scale for Inpatient Evaluation ‐ NOSIE‐30 (Honigfeld 1965; Honigfeld 1973)
The NOSIE‐30 is a ward behaviour rating scale, especially designed for use by nurses and other subprofessional personnel. This 30‐item scale is quick (can be completed in 5 to 10 minutes) and simple (requires minimum training). The 30 items (behaviours) are rated on a 5‐point scoring system varying from 'never' (0) to 'always' (4) based on their frequency during the three days prior to examination. Higher scores indicate more pronounced symptomatology.
Positive and Negative Symptom Scale ‒ PANSS (Kay 1986)
The PANSS was developed from the BPRS and the Psychopathology Rating Scale. It is used to evaluate the positive, negative and general symptoms in schizophrenia. The scale has 30 items, and each item is rated on a 7‐point scoring system varying from 'absent' (1) to 'extreme' (7). Higher scores indicate more pronounced symptomatology.
Scale for the Assessment of Negative Symptoms ‒ SANS (Andreasen 1982)
The SANS is a scale used to measure the severity of negative symptoms in schizophrenia. The scale is used to evaluate five domains of symptoms: alogia, affective blunting, avolition‒apathy, anhedonia‒asociality and attention impairment. Each symptom is rated on a 6‐point scoring system varying from 'absent' (0) to 'severe' (5). Higher scores indicate more pronounced symptomatology.
6.1.3 Adverse events
Simpson Angus Scale ‒ SAS (Simpson 1970)
This 10‐item scale, with a scoring system of 0 to 4 for each item, measures drug‐induced parkinsonism, a short‐term drug‐induced movement disorder. A low score indicates low levels of parkinsonism.
Abnormal Involuntary Movement Scale ‒ AIMS (NIMH 1970)
The AIMS has been used to assess tardive dyskinesia, a long‐term, drug‐induced movement disorder. However, using this scale in short‐term trials may also be helpful to assess some rapidly occurring abnormal movement disorders such as tremor. A low score indicates low levels of abnormal involuntary movements.
Barnes Akathisia Rating Scale ‒ BAS (Barnes 1989)
This scale comprises items rating the observable, restless movements that characterise akathisia, the subjective awareness of restlessness and any distress associated with the condition. These items are rated from 'normal' (0) to 'severe' (3). In addition, there is an item for rating the global severity (from 'absent' (0) to 'severe' (5)). A low score indicates low levels of akathisia.
6.1.4 Behaviour
Behavioral Activity Rating Scale ‒ BARS (Swift 2002)
The BARS was designed to measure the degree of activity for patients with agitated behaviour rather than to represent the severity of a specific diagnostic entity such as schizophrenia. The BARS describes seven levels of activity, from 'difficult or unable to rouse' (1) to 'violent, requires restraint' (7).
6.1.5 Functioning
Global Assessment of Functioning ‒ GAF (DSM‐IV‐TR 1994)
The GAF has been used to rate the social, occupational, and psychological functioning on a hypothetical continuum of mental health‒illness. The lowest scores are 1 to 10 corresponding to 'Persistent danger of severely hurting self or others OR persistent inability to maintain minimal personal hygiene OR serious suicidal act with clear expectation of death' and the highest scores are 91 to 100 corresponding to 'No symptoms, life's problems never seem to get out of hand, is sought out by others because of his or her many positive qualities'. A score of 0 is given for inadequate information. A high score indicates good functioning.
Social‐Adaptive Functioning Evaluation ‒ SAFE (Harvey 1997)
The SAFE was originally designed to rate severity of impairment in crucial adaptive functioning domains of geriatric patients in a restricted setting, but has now been adapted for use with people of all ages. The scale has 17 items that measure social‒interpersonal, instrumental, and life skills functioning and are rated by observation, caregiver contact, and interaction with the subject if possible. Scoring ranges from 'no impairment' (0) to 'extreme impairment' (4). A low score indicates good functioning.
Social and Occupational Functioning Assessment Scale ‒ SOFAS (DSM‐IV‐TR 1994)
The SOFAS has been used to rate the social and occupational functioning on a hypothetical continuum of mental health‒illness. It takes into account impairments in functioning due to physical limitations or mental impairments, but not due to lack of opportunity and other environmental limitations. The lowest scores are 1 to 10 corresponding to 'Persistent hygiene problems, inability to maintain minimal personal hygiene. Unable to function without harming self or others or without considerable external support' and the highest scores are 91 to 100 corresponding to 'Superior functioning in a wide range of activities'. A score of 0 is given for inadequate information. A high score indicates good functioning.
6.1.6 Quality of Life
Heinrichs‐Carpenter‐Hanlon Quality of Life Scale ‒ HQLS (Heinrichs 1984; Carpenter 1994)
The HQLS is a semi‐structured interviewer‐administered scale containing 21 items divided in four subscales. The structure of the instrument establishes a series of topics to be explored, using specified sample probes. Each item is rated on a 7‐point scale (0 to 6) for which descriptive anchors are provided. High scores reflect normal or unimpaired function, and low scores reflect severe impairment of function.
Excluded studies
We excluded 40 full‐text articles on 37 trials. Three studies were excluded because they were not appropriately randomised (Agid 2013; Bai 2002; DeBuck 1972). Twenty‐three studies were excluded because they did not examine suitable participants (e.g. stable participants or not selected after a run‐in phase to confirm that they had failed to improve with their current antipsychotic treatment (Badgett 1996; Baker 2003; Bastecky 1982; Bondolfi 1995; Branchey 1981; Canuso 2010; Chen 1998; Clerc 1989; Daniel 1997; Ericksen 1978; Gardos 1971; Gulliver 2010; Harris 1997; Hirschowitz 1995; Itil 1970; Kane 1985; Lehmann 1980; McCreadie 1979; Mitchell 2004; NCT00862992; NCT01457339; NCT01569659; Suzuki 1992). Nine studies were excluded because of wrong interventions, most of them did not have a continuation control group (Bitter 1989; CN138032; Coryell 1998; Cookson 1987; de Leon 2007; Hirschowitz 1997; Janicak 1997; Simpson 1999; Volavka 1996). Two studies were excluded since no usable data were presented (NCT00539071; Dencker 1978).
Studies awaiting assessment
None.
Ongoing studies
None.
Risk of bias in included studies
For graphical representations of our judgements of risk of bias please refer to Figure 2 and Figure 3. Full details of judgements are seen in the 'Risk of bias' tables.

Risk of bias summary: review authors' judgements about each risk of bias item for each included study.

Risk of bias graph: review authors' judgements about each risk of bias item presented as percentages across all included studies.
Allocation
We rated no studies at high risk for allocation bias. In two studies, random sequence generation was adequate (Honer 2011; Sakurai 2016). In the remaining eight studies, this was unclear: they were described as randomised, but none of them provided any further details about random sequence generation. As for allocation concealment, again only two studies provided information and we rated them as adequate (Honer 2011; Sakurai 2016). The remaining eight studies did not provide any details on allocation concealment.
Blinding
Concerning performance bias, we rated two studies at low risk of bias since it was explicitly mentioned that subjects, caregivers and investigators were blinded to the randomisation status (Lindenmayer 2011), and antipsychotics were provided in identical powder form in amount and colour (Sakurai 2016). However we rated one study at high risk of bias since it was described as single‐blind (McGorry 2011). The remaining seven studies we rated with an unclear risk of bias since the term "double‐blind" was the only description provided by the authors.
Concerning detection bias, we rated two studies with a low risk of bias since it was explicitly mentioned that outcome assessors were blinded to the randomisation status (Lindenmayer 2011; Sakurai 2016). All the remaining eight studies we rated with an unclear risk of bias since the term "blind" was the only description provided by the authors.
Incomplete outcome data
The number of participants leaving the studies early was relatively low (< 25%) in four studies which also used an ITT approach to analyse the results (Honer 2011; McEvoy 1991; McGorry 2011; Sakurai 2016); thus we rated these studies at low risk of bias. Three studies had an unclear risk of bias since this outcome was not adequately addressed (Huang 1987; Kinon 1993; Loebel 2014). The remaining three studies we rated with a high risk of bias (Bjørndal 1980; Goff 2013; Lindenmayer 2011).
Selective reporting
One study reported data on all predefined outcomes and we therefore rated it at low risk of bias (Honer 2011). We rated one study with an unclear risk of bias (Loebel 2014). The remaining eight studies we rated with a high risk of bias as not all outcomes were reported; usually, data on adverse effects were missing.
Other potential sources of bias
We judged all studies to be free of other potential sources of bias.
Effects of interventions
See: summary of findings Table for the main comparison for the main comparison 'Antipsychotic dose increase versus antipsychotic dose continuation'. We used risk ratios (RR) for dichotomous data and mean differences (MD) for continuous data, with their respective 95% confidence intervals (CIs) throughout.
1. Comparison: Antipsychotic dose increase versus antipsychotic dose maintenance
1.1 Global state: 1a. Clinically relevant response ‒ as defined by trials
Nine studies provided data on the number of responders in the dose increase versus dose maintenance group; only Loebel 2014 did not provide any data on this outcome. There was no clear difference between dose increase versus dose maintenance in any of the nine included studies either when examined separately or pooled (RR 1.09, 95% CI 0.86 to 1.40, 9 RCTs, N = 533, Analysis 1.1). Moreover, no significant heterogeneity was indicated (P = 0.37, I² = 8%). Response was defined as a higher than 0% BPRS total score reduction in Bjørndal 1980; as a 20% or more PANSS total score reduction in Goff 2013, Honer 2011 and Lindenmayer 2011; as a 20% or more BPRS total score reduction in McGorry 2011; and as a 25% or more PANSS total score reduction in Sakurai 2016. In the remaining three studies, response was defined by the score on a global improvement scale (Huang 1987; Kinon 1993); or by a combination of various criteria (McEvoy 1991).
1.2 Global state: 1b. Any change (improvement on Global Assessment scale)
There was no clear difference in one single small study by Bjørndal 1980 for this outcome (RR 0.76, 95% CI 0.32 to 1.80, 1 RCT, N = 23, Analysis 1.2).
1.3 Global state: 2a. Average endpoint score (CGI‐Severity, high = poor)
Three studies reported the average CGI‐Severity score at endpoint (Honer 2011; McEvoy 1991; McGorry 2011). There was no clear difference between dose increase and dose maintenance antipsychotic treatment (MD −0.11, 95% CI −0.40 to 0.19, 3 RCTs, N = 99, Analysis 1.3 ). Moreover, no significant heterogeneity was indicated (P = 0.88, I² = 0%).
1.4 Global state: 2b. Average change score (CGI‐Severity, high = poor)
One study reported the average CGI‐Severity score at change (Loebel 2014). No clear effect between antipsychotic dose increase and dose maintenance was observed (MD −0.40, 95% CI −0.80 to −0.00, 1 RCT, N = 95, Analysis 1.4 ).
1.5 Global state: 2c. Average endpoint score (CGI‐Improvement, high = poor)
One study reported the average CGI‐Improvement score at endpoint (Sakurai 2016), and showed no difference between the two groups (MD 0.00, 95% CI −0.35 to 0.35, 1 RCT, N = 103, Analysis 1.5).
1.6 Leaving the study early: 1. Tolerability ‒ due to side effects
Seven studies provided data on the number of participants leaving early due to side effects in the dose increase versus dose maintenance group (Honer 2011; Huang 1987; Lindenmayer 2011; Loebel 2014; McEvoy 1991; McGorry 2011; Sakurai 2016). There was no clear difference between dose increase versus dose maintenance group (RR 1.63, 95% CI 0.52 to 5.07, 7 RCTs, N = 496, Analysis 1.6), but there was some heterogeneity (P = 0.05, I² = 56%). The heterogeneity was due to Sakurai 2016 which had less attrition due to side effects in the dose continuation group compared to the dose increase group. There was no clear difference between the two groups in the remaining six studies.
1.7 Leaving the study early: 2. Acceptability ‒ due to any reason
Five studies provided data on the number of participants leaving early due to any reason in the dose increase versus dose maintenance group (Honer 2011; Huang 1987; Lindenmayer 2011; McGorry 2011; Sakurai 2016). There was no clear difference between dose increase versus dose maintenance group in any of the five included studies either when examined separately or pooled (RR 1.30, 95% CI 0.89 to 1.90, 5 RCTs, N = 353, Analysis 1.7). Moreover, no significant heterogeneity was indicated (P = 0.36, I² = 8%).
1.8 Leaving the study early: 3. Efficacy ‒ due to inefficacy
Four studies provided data on the number of participants leaving early due to inefficacy in the dose increase versus dose maintenance group (Honer 2011; Huang 1987; Lindenmayer 2011; Sakurai 2016). There was no clear difference between dose increase versus dose maintenance group in any of the four included studies either when examined separately or pooled (RR 0.82, 95% CI 0.30 to 2.28, 4 RCTs, N = 336, Analysis 1.8). Moreover, no significant heterogeneity was indicated (P = 0.36, I² = 3%).
1.9 Mental state: 1a. General ‒ average endpoint score (PANSS total, high = poor)
Two studies reported the average PANSS total score at endpoint (Honer 2011; Lindenmayer 2011). There was no clear difference between dose increase and dose maintenance antipsychotic treatment for this outcome (MD −1.81, 95% CI −7.31 to 3.69, 2 RCTs, N = 191, Analysis 1.9). Moreover, no significant heterogeneity was indicated (P = 0.63, I² = 0%).
1.10 Mental state: 1b. General ‒ average change score (PANSS total, high = poor)
Three studies reported the average PANSS total score change (Lindenmayer 2011; Loebel 2014; Sakurai 2016). Lindenmayer 2011 and Sakurai 2016 showed a trend in favour of dose maintenance versus dose increase whereas Loebel 2014 study showed a clear difference in favour of dose increase versus dose maintenance. Overall, there was no clear difference between dose increase and dose maintenance antipsychotic treatment for this outcome (MD −1.44, 95% CI −6.85 to 3.97, 3 RCTs, N = 258, Analysis 1.10) but heterogeneity was considerable, even though not significant (P = 0.06, I² = 65%).
1.11 Mental state: 1c. General ‒ average endpoint and/or change score (PANSS total, high = poor)
Four studies reported the average PANSS total score at endpoint or change or both; Honer 2011 reported only endpoint scores, Loebel 2014 and Sakurai 2016 only change scores, whereas Lindenmayer 2011 reported both endpoint and change scores. In this analysis we used endpoint scores for the latter study in accordance with our protocol. There was no clear difference between dose increase and dose maintenance antipsychotic treatment for this outcome (MD −2.13, 95% CI −6.16 to 1.90, 4 RCTs, N = 389, Analysis 1.11). Moreover, no significant heterogeneity was indicated (P = 0.14, I² = 46%).
1.12 Mental state: 1d. General ‒ average endpoint score (BPRS total, high = poor)
Three studies reported the average BPRS total score at endpoint (Kinon 1993; McEvoy 1991; McGorry 2011). There was no clear difference between dose increase and dose maintenance antipsychotic treatment (MD −1.25, 95% CI −4.60 to 2.11, 3 RCTs, N = 99, Analysis 1.12). Moreover, no significant heterogeneity was indicated (P = 0.98, I² = 0%).
1.13 Mental state: 1e. General ‒ average change score (BPRS total, high = poor)
Only one study reported the average BPRS total score change (Huang 1987). There was no clear difference between dose increase and dose maintenance antipsychotic treatment (MD −2.38, 95% CI −6.15 to 1.39, 1 RCT, N = 42, Analysis 1.13).
1.14 Mental state: 1f. General ‒ average endpoint and/or change score (BPRS total, high = poor)
Four studies reported the average BPRS total score at endpoint or change (Huang 1987; Kinon 1993; McEvoy 1991; McGorry 2011). There was no clear difference between dose increase and dose maintenance antipsychotic treatment for this outcome (MD −1.75, 95% CI −4.25 to 0.76, 4 RCTs, N = 141, Analysis 1.14). Moreover, no significant heterogeneity was indicated (P = 0.97, I² = 0%).
1.15 Mental state: 1g. General average change score (NOSIE total, high = poor)
Only one study reported the average NOSIE total score change (Huang 1987). There was no clear difference between dose increase and dose maintenance antipsychotic treatment (MD 3.70, 95% CI −5.38 to 12.78, 1 RCT, N = 42, Analysis 1.15).
1.16 Mental state: 2a. Positive symptoms ‒ clinically important change
There was no clear difference in one single small study by McGorry 2011 for this outcome (RR 1.33, 95% CI 0.58 to 3.07, 1 RCT, N = 17, Analysis 1.16).
1.17 Mental state: 2b. Positive symptoms ‒ average endpoint subscore (PANSS positive, high = poor)
Two studies reported the average PANSS positive subscore at endpoint (Honer 2011; Lindenmayer 2011). There was no clear difference between dose increase and dose maintenance antipsychotic treatment for this outcome (MD −0.94, 95% CI −2.79 to 0.90, 2 RCTs, N = 191, Analysis 1.17). Moreover, no significant heterogeneity was indicated (P = 0.38, I² = 0%).
1.18 Mental state: 2c. Positive symptoms ‒ average change subscore (PANSS positive, high = poor)
Three studies reported the average PANSS positive subscore change (Goff 2013; Lindenmayer 2011; Sakurai 2016). There was no clear difference between dose increase and dose maintenance antipsychotic treatment for this outcome (MD 0.04, 95% CI −1.31 to 1.40, 3 RCTs, N = 238, Analysis 1.18). Moreover, no significant heterogeneity was indicated (P = 0.20, I² = 38%).
1.19 Mental state: 2d. Positive symptoms ‒ average endpoint subscore (BPRS positive subscore, high = poor)
There was no clear difference in one single small study by McGorry 2011 for this outcome (MD 0.40, 95% CI −2.94 to 3.74, 1 RCT, N = 17, Analysis 1.19).
1.20 Mental state: 3a. Negative symptoms ‒ average endpoint subscore (PANSS negative, high = poor)
Two studies reported the average PANSS negative subscore at endpoint (Honer 2011; Lindenmayer 2011). There was no clear difference between dose increase and dose maintenance antipsychotic treatment for this outcome (MD 0.32, 95% CI −1.48 to 2.11, 2 RCTs, N = 191, Analysis 1.20). Moreover, no significant heterogeneity was indicated (P = 0.64, I² = 0%).
1.21 Mental state: 3b. Negative symptoms ‒ average change subscore (PANSS negative, high = poor)
Two studies reported the average PANSS negative subscore change (Lindenmayer 2011; Sakurai 2016). There was no clear difference between dose increase and dose maintenance antipsychotic treatment for this outcome (MD −0.15, 95% CI −0.96 to 0.67, 2 RCTs, N = 163, Analysis 1.21). Moreover, no significant heterogeneity was indicated (P = 0.80, I² = 0%).
1.22 Mental state: 3c. Negative symptoms ‒ average endpoint subscore (BPRS negative, high = poor)
There was no clear difference in one single small study by McGorry 2011 for this outcome (MD −0.40, 95% CI −1.97 to 1.17, 1 RCT, N = 17, Analysis 1.22).
1.23 Mental state: 3d. Negative symptoms ‒ average endpoint score (SANS, high = poor)
One study reported the average SANS score at endpoint (Kinon 1993). There was no clear difference between dose increase and dose maintenance antipsychotic treatment for this outcome (MD 1.50, 95% CI −14.33 to 17.33, 1 RCT, N = 34, Analysis 1.23).
1.24 Adverse effects ‒ At least one adverse effect
Two studies — Honer 2011 and Lindenmayer 2011 — reported the numbers of participants with at least one adverse effect but did not reveal a clear difference between the antipsychotic dose increase group (75.2%) versus the antipsychotic dose maintenance group (71.6%), Analysis 1.24. The results were considerably but not significantly heterogeneous (P = 0.06, I² = 72%). It should be noted that, particularly in recent trials, efficacy related events such as exacerbation of psychosis can also be considered adverse events which may in part explain the heterogeneity.
1.25 Adverse effects ‒ Cardiac: QTc prolongation
Two studies reported the numbers of participants with QTc prolongation (Goff 2013; Honer 2011). There was no clear difference between the two groups. In total there were two participants with QTc prolongation in the antipsychotic dose increase group (1.6%) and no events in the dose maintenance group (0%) (RR 2.47, 95% CI 0.12 to 50.39, 2 RCTs, N = 206; heterogeneity test: not applicable, Analysis 1.25).
1.26 Adverse effects ‒ Cardiac: Orthostatic hypotension
Two studies reported the numbers of participants with orthostatic hypotension (Huang 1987; Lindenmayer 2011). There was no clear difference between the two groups. In total, 3 out of 50 participants in the antipsychotic dose increase group and 3 out of 52 participants in the dose maintenance group presented with orthostatic hypotension (RR 1.09, 95% CI 0.25 to 4.82, 2 RCTs, N = 102; heterogeneity test: P = 0.43, I² = 0%, Analysis 1.26).
1.27 Adverse effects ‒ Cardiac: Palpitations
One study reported data in terms of participants reporting palpitations (Huang 1987). There was no clear difference between the antipsychotic dose increase group (4.8%) versus the antipsychotic dose maintenance group (0%) (RR 3.00, 95% CI 0.13 to 69.70, 1 RCT, N = 42, Analysis 1.27).
1.28 Adverse effects ‒ Cardiac: Premature Ventricular Contractions
One study reported data in terms of participants with premature ventricular contractions (Huang 1987). There was no clear difference between the antipsychotic dose increase group (4.8%) versus the antipsychotic dose maintenance group (0%) (RR 3.00, 95% CI 0.13 to 69.70, 1 RCT, N = 42, Analysis 1.28).
1.29 Adverse effects ‒ Constipation
Two studies reported the numbers of participants with constipation (Huang 1987; Lindenmayer 2011). There was no clear difference between the two groups. In total there were five participants with constipation in the antipsychotic dose increase group (10%) and three participants in the dose maintenance group (5.8%) (RR 1.53, 95% CI 0.44 to 5.38, 2 RCTs, N = 102; heterogeneity test: P = 0.62, I² = 0%, Analysis 1.29).
1.30 Adverse effects ‐ Dizziness
Two studies reported the numbers of participants with dizziness (Honer 2011; Huang 1987). There was no clear difference between the two groups. In total there were 18 patients with dizziness in the antipsychotic dose increase group (16.5%) and 15 patients in the dose maintenance group (23.4%) (RR 0.77, 95% CI 0.41 to 1.44, 2 RCTs, N = 173; heterogeneity test: P = 0.56, I² = 0%, Analysis 1.30).
1.31 Adverse effects ‒ Drooling
One study reported data in terms of participants complaining of drooling (Huang 1987). There was no clear difference between the antipsychotic dose increase group (9.5%) versus the antipsychotic dose maintenance group (4.8%) (RR 2.00, 95% CI 0.20 to 20.41, 1 RCT, N = 42, Analysis 1.31).
1.32 Adverse effects ‒ Death (suicide or natural cause)
One study reported that there were no deaths or suicides during the trial in any of the two groups (Honer 2011).
1.33 Adverse effects ‒ Extrapyramidal: Categorical deterioration (AIMS score)
One study reported data in terms of categorical change (deterioration) in AIMS scores (Honer 2011). There was no clear difference between the antipsychotic dose increase group (19%) versus the antipsychotic dose maintenance group (14%) (RR 1.38, 95% CI 0.59 to 3.26, 1 RCT, N = 131, Analysis 1.33).
1.34 Adverse effects ‒ Extrapyramidal: average endpoint score (AIMS, high = poor)
One study reported the average AIMS score at endpoint (Lindenmayer 2011). There was no clear difference between groups (MD 0.70, 95% CI −0.87 to 2.27, 1 RCT, N = 60, Analysis 1.34 ).
1.35 Adverse effects ‐ Extrapyramidal: average change score (AIMS, high = poor)
Two studies reported the average AIMS score change (Lindenmayer 2011; Sakurai 2016). Lindenmayer 2011 favoured dose continuation group whereas Sakurai 2016 favoured dose increase group. Nevertheless, in both studies AIMS scores were very low at baseline. When pooling, there was no clear difference between the two groups (MD 0.41, 95% CI −1.15 to 1.96, 2 RCTs, N = 163, Analysis 1.35), but heterogeneity was significant (P = 0.004, I² = 88%).
1.36 Adverse effects ‒ Extrapyramidal: Akathisia
Two studies reported the numbers of participants with akathisia (Bjørndal 1980; Huang 1987). There was no clear difference between the two groups. In total there were three participants with akathisia in the antipsychotic dose increase group (9.1%) and four participants in the dose maintenance group (12.5%) (RR 0.74, 95% CI 0.04 to 14.02, 2 RCTs, N = 65; heterogeneity test: P = 0.10, I² = 63%, Analysis 1.36).
1.37 Adverse effects ‒ Extrapyramidal: Categorical deterioration (BAS, high = poor)
One study reported data in terms of categorical change (deterioration) in BAS scores (Honer 2011). There was no clear difference between the antipsychotic dose increase group (10%) versus the antipsychotic dose maintenance group (7%) (RR 1.47, 95% CI 0.42 to 5.14, 1 RCT, N = 131, Analysis 1.37).
1.38 Adverse effects ‒ Extrapyramidal: average endpoint (BAS, high = poor)
One study reported the average BAS score at endpoint (Lindenmayer 2011). There was no clear difference between groups (MD −0.20, 95% CI −0.74 to 0.34, 1 RCT, N = 60, Analysis 1.38).
1.39 Adverse effects ‒ Extrapyramidal: average change score (BAS, high = poor)
Two studies reported the average BAS score change (Lindenmayer 2011; Sakurai 2016). Lindenmayer 2011 showed a trend in favour of dose continuation group whereas Sakurai 2016 favoured dose increase group. When pooling, there was no clear difference between the two groups (MD −0.11, 95% CI −0.59 to 0.37, 2 RCTs, N = 163, Analysis 1.39), but there was heterogeneity (I² = 69%).
1.40 Adverse effect ‒ Extrapyramidal: dystonia and/or dyskinesia
Three studies reported the numbers of participants with dystonia or dyskinesia (Bjørndal 1980; Honer 2011; Huang 1987). There was no clear difference between the two groups. In total there were 13 participants with dystonia or dyskinesia in the antipsychotic dose increase group (10.7 %) and 14 participants in the dose maintenance group (18.7%) (RR 0.48, 95% CI 0.09 to 2.73, 3 RCTs, N = 196; heterogeneity test: P = 0.07, I² = 62%, Analysis 1.40).
1.41 Adverse effects ‒ Extrapyramidal: Categorical deterioration (SAS, high = poor)
One study reported data in terms of categorical change (deterioration) in SAS scores (Honer 2011). There was no clear difference between the antipsychotic dose increase group (17%) versus the antipsychotic dose maintenance group (14%) (RR 1.22, 95% CI 0.51 to 2.93, 1 RCT, N = 131, Analysis 1.41).
1.42 Adverse effects ‒ Extrapyramidal: average endpoint score (SAS, high = poor)
Two studies reported the average SAS score at endpoint (Honer 2011; Lindenmayer 2011). Overall, there was no clear difference between groups (MD 0.93, 95% CI −1.04 to 2.91, 2 RCTs, N = 191), but the studies' results were significantly heterogeneous (P = 0.006, I² = 87%). Honer 2011 showed no difference in SAS endpoint scores between the two groups (MD −0.02, 95% CI −0.79 to 0.75) whereas Lindenmayer 2011 showed a superiority of the antipsychotic dose maintenance group versus the antipsychotic dose increase group (MD 2.00, 95% CI 0.78 to 3.22). Nevertheless, the Lindenmayer 2011 results favouring the dose maintenance group at endpoint could be attributed to a baseline imbalance in SAS scores between the two groups. This claim is supported by the results of the repeated measures analysis of variance (ANOVA) model with accounted effects for baseline values that showed no clear difference between the two groups at endpoint (P = 0.249) and the analysis of the SAS change scores (see Analysis 1.42).
1.43 Adverse effects ‒ Extrapyramidal: average change score (SAS, high = poor)
Two studies reported the SAS score change (Lindenmayer 2011; Sakurai 2016). There was no clear difference between groups (MD 0.21, 95% CI −0.83 to 1.26, 2 RCTs, N = 163; heterogeneity test: P = 0.08, I² = 67%, Analysis 1.43).
1.44 Adverse effects ‒ Extrapyramidal: Tremor
Two studies reported the numbers of participants with tremor (Honer 2011; Huang 1987). There was no clear difference between the two groups. In total there were 10 participants with headache in the antipsychotic dose increase group (9.2%) and 5 participants in the dose maintenance group (7.8%) (RR 1.59, 95% CI 0.59 to 4.26, 2 RCTs, N = 173; heterogeneity test: P = 0.83, I² = 0%, Analysis 1.44).
1.45 Adverse effects ‒ Headache
Two studies reported the numbers of participants with headache (Honer 2011; Huang 1987). There was no clear difference between the two groups. In total there were 12 participants with headache in the antipsychotic dose increase group (11%) and 4 participants in the dose maintenance group (6.3%) (RR 1.46, 95% CI 0.52 to 4.08, 2 RCTs, N = 173; heterogeneity test: P = 0.64, I² = 0%, Analysis 1.45).
1.46 Adverse effects ‒ Somnolence and/or drowsiness
Four studies reported the numbers of participants with somnolence or drowsiness (Bjørndal 1980; Honer 2011; Huang 1987; Lindenmayer 2011). There was no clear difference between the two groups. In total there were 25 participants with somnolence or drowsiness in the antipsychotic dose increase group (16.7%) and 11 participants in the dose maintenance group (10.4%) (RR 1.76, 95% CI 0.81 to 3.81, 4 RCTs, N = 256; heterogeneity test: P = 0.32, I² = 13%, Analysis 1.46).
1.47 Adverse effects ‒ Weight at endpoint (high = poor)
Two studies reported data in terms of weight at endpoint (Honer 2011; Lindenmayer 2011). There was no clear difference between groups (MD −1.85, 95% CI −7.09 to 3.39, 2 RCTs, N = 165; heterogeneity test: P = 0.98, I² = 0%, Analysis 1.47).
1.48 Behaviour: Average endpoint score (BARS, high = poor)
One study — Lindenmayer 2011 — reported the average BARS symptom score at endpoint and showed no clear difference between the two groups (MD −0.10, 95% CI −0.50 to 0.30, 1 RCT, N = 60, Analysis 1.48).
1.49 Functioning ‒ Global Assessment of Functioning: average change score (GAF, high = good)
One study — Sakurai 2016 — reported the average GAF score change and showed no clear difference between the two groups (MD −0.60, 95% CI −3.00 to 1.80, 1 RCT, N = 103, Analysis 1.49).
1.50 Functioning ‒ Social‐Adaptive Functioning Evaluation: average endpoint score (SAFE, high = poor)
One study — Lindenmayer 2011 — reported the average SAFE score at endpoint and showed no clear difference between the two groups (MD 0.16, 95% CI −0.47 to 0.79, 1 RCT, N = 60, Analysis 1.50).
1.51 Functioning ‒ Social and Occupational Functioning Assessment: average endpoint score (SOFAS, high = good)
One study — Honer 2011 — reported the average SOFAS symptom score at endpoint and showed no clear difference between the two groups (MD 0.50, 95% CI −3.80 to 4.80, 1 RCT, N = 131, Analysis 1.51).
1.52 Quality of life: Clinically important change (at least 50% improvement HQLS, high = good)
One study — McGorry 2011 — reported that there were no participants, from either group, that improved in terms of quality of life, measured by a 50% or more Heinrichs Quality of Life Scale (HQLS) symptom score change, Analysis 1.52
1.53 Quality of life: Average endpoint score (HQLS, high = good)
One study — McGorry 2011 — reported the average HQLS symptom score at endpoint and showed no clear difference between the two groups (MD 5.50, 95% CI −13.66 to 24.66, 1 RCT, N = 17, Analysis 1.53 ).
2. Subgroup analyses and investigation of heterogeneity
All subgroup analyses were only performed on the primary outcome "clinically relevant response as defined by authors".
2.1 Single antipsychotic drugs
There were no differences between the single antipsychotic drugs (i.e. fluphenazine, haloperidol, quetiapine, risperidone, thiothixene and ziprasidone) that were included in the present review (test for subgroup differences: Chi² = 6.65, df = 5 (P = 0.25), I² = 24.8%).
2.2 Clinical state, stage or problem
There were no differences between first‐episode and multiple‐episode participants (test for subgroup differences: Chi² = 2.49, df = 1 (P = 0.11), I² = 59.9%).
3. Publication bias
Due to the small number of included studies a funnel plot analysis was not performed.
4. Sensitivity analyses
We only performed sensitivity analyses on the primary outcome "clinically relevant response as defined by authors". As there was no study in which randomisation was implied, this pre‐planned sensitivity analysis did not apply to our review.
4.1 Exclusion of studies with unclear randomisation methods
We judged all but two studies — Honer 2011 and Sakurai 2016 — to have used unclear randomisation methods. Excluding these studies did not change the overall results (RR 1.05, 95% CI 0.77 to 1.44, 2 RCTs, N = 234; heterogeneity test: P = 0.88, I² = 0%).
4.2 Exclusion of studies with unclear allocation concealment methods
We judged all but two studies — Honer 2011 and Sakurai 2016 — to have used unclear allocation concealment methods. Excluding these studies did not change the overall results (RR 1.05, 95% CI 0.77 to 1.44, 2 RCTs, N = 234; heterogeneity test: P = 0.88, I² = 0%).
4.3 Exclusion of studies with high risk of bias regarding blinding
There was only one study with high risk of bias regarding blinding of participants and personnel (McGorry 2011). Excluding this study did not change the overall results (RR 1.07, 95% CI 0.86 to 1.34, 8 RCTs, N = 516; heterogeneity test: P = 0.51, I² = 0%). There was no study with high risk of bias regarding blinding of outcome assessment.
4.4 Exclusion of studies with high risk of bias regarding incomplete outcome data
There were three studies with high risk of bias regarding incomplete outcome data (Bjørndal 1980; Goff 2013; Lindenmayer 2011). Excluding these studies did not change the overall results (RR 1.19, 95% CI 0.92 to 1.54, 6 RCTs, N = 375; heterogeneity test: P = 0.43, I² = 0%).
4.5 Exclusion of studies with imputed values
There was only one study with imputed values for the primary outcome (Goff 2013). In this study, those leaving the study early were all assumed to have the same rates of response as those who completed. Excluding this study did not change the overall results (RR 1.16, 95% CI 0.90 to 1.50, 8 RCTs, N = 458; heterogeneity test: P = 0.40, I² = 4%).
4.6 Fixed‐effect model
When a fixed‐effect model was applied, the overall results did not change (RR 1.10, 95% CI 0.88 to 1.38, 9 RCTs, N = 533; heterogeneity test: P = 0.37, I² = 8%).
Discusión
Resumen de los resultados principales
1. Generales
Esta revisión incluyó diez estudios con 675 participantes que compararon el aumento de la dosis del antipsicótico versus mantenimiento de la dosis del antipsicótico en pacientes con esquizofrenia o trastornos relacionados que no respondían al tratamiento antipsicótico inicial. Los estudios incluidos se publicaron durante un período prolongado (de 1980 a 2016) y variaron en cuanto a la duración de la fase de preinclusión (p.ej. dos a cuatro semanas) y la fase principal (p.ej. dos a 12 semanas). A pesar de la búsqueda electrónica y bibliográfica integral y de la aplicación de criterios de inclusión amplios, el total de diez estudios incluidos con 675 participantes es una base pequeña sobre la cual evaluar la efectividad del aumento de la dosis del antipsicótico versus el mantenimiento de la dosis. Los ensayos con tamaños de muestras pequeñas carecen de suficiente poder estadístico como para detectar un efecto pequeño a moderado y, por lo tanto, los resultados de dichos ensayos, por lo general, no son definitivos aún cuando existe un efecto real. Una revisión de Davey Smith y colegas indicó que los metanálisis sobre la base del resumen de pequeños ensayos se pueden interpretar como inconclusos, independientemente de si fue significativa la estimación combinada. (Davey Smith 1998). Por lo tanto, los estudios incluidos en esta revisión no proporcionaron datos suficientes sobre si el aumento de la dosis del fármaco antipsicótico inicial da lugar a mejores resultados que el mantenimiento de la misma dosis durante un período más prolongado después de un período inicial de falta de respuesta.
2. Efectos del tratamiento
2.1 Estado global: respuesta clínicamente importante ‐ según la definición de los autores
Nueve de los diez estudios incluidos presentaron datos sobre el resultado primario "respuesta clínicamente relevante según lo definieron los autores". El metanálisis de los datos no mostró una superioridad significativa del aumento de la dosis versus el mantenimiento de la dosis, pero debido a que el número total de estudios y participantes es bajo, se justifica la realización de más ensayos y no es posible establecer conclusiones sólidas.
2.2 Estado global: cualquier cambio ‐ mejoría
Un estudio informó cuántos participantes mejoraron sobre la base del estado global, tres estudios informaron la puntuación promedio del CGI‐Severity al final del estudio, un estudio el cambio promedio en las puntuaciones del CGI‐Severity, y un estudio informó la puntuación promedio del CGI‐Improvement al final del estudio. En términos generales, no se observaron diferencias claras entre el grupo de aumento de la dosis del antipsicótico y el de mantenimiento de la dosis del antipsicótico. No obstante, debido a que hay pocos datos disponibles en cuanto al estado global, nuevamente los resultados son no concluyentes y se necesitan más estudios.
2.3 Abandono precoz del estudio: tolerabilidad ‐ debido a los efectos secundarios
Sólo 47 de 496 participantes abandonaron los estudios de forma precoz debido a los efectos secundarios, sin diferencias entre los grupos (30 de 267 participantes del grupo de aumento de la dosis del antipsicótico y 17 de 229 participantes del grupo de mantenimiento de la dosis del antipsicótico). Se podría indicar que las dosis mayores de los antipsicóticos parecen ser bien toleradas en los pacientes con esquizofrenia que no responden al tratamiento antipsicótico inicial. Sin embargo, los datos fueron heterogéneos; la mayoría de los estudios no mostraron diferencias entre los grupos, pero Sakurai 2016 favoreció al grupo de continuación de la dosis de forma significativa (menos deserción debido a los efectos secundarios). Además, debido a que eventos como el "empeoramiento de la psicosis" por definición se registran como eventos adversos, especialmente en los ensayos modernos, este resultado puede no ser una medida ideal de la tolerabilidad general. Asimismo, debido a que sólo siete estudios presentaron datos sobre este resultado, se justifica la realización de más estudios para establecer cualquier conclusión sólida.
2.4 Abandono precoz del estudio: aceptabilidad ‐ debido a cualquier causa
En los cinco estudios que proporcionaron datos, 90 de 353 participantes abandonaron los estudios de forma precoz debido a cualquier razón sin diferencia entre los grupos (55 de 199 participantes del grupo de aumento de la dosis del antipsicótico y 35 de 154 participantes del grupo de mantenimiento de la dosis del antipsicótico). El abandono de un estudio debido a cualquier razón a menudo se considera una medida de la aceptabilidad del tratamiento. No obstante, debido a que sólo cinco estudios presentaron datos sobre este resultado, se justifica la realización de más estudios.
2.5 Abandono precoz del estudio: eficacia ‐ debido a la ineficacia
En los cuatro estudios que proporcionaron datos, 17 de 336 participantes abandonaron los estudios de forma precoz debido a ineficacia sin diferencia entre los grupos (ocho de 190 participantes del grupo de aumento de la dosis del antipsicótico y nueve de 146 participantes del grupo de mantenimiento de la dosis del antipsicótico). El abandono de un estudio debido a ineficacia se podría considerar una medida de la eficacia del tratamiento. Sin embargo, nuevamente, debido a que sólo cuatro estudios presentaron datos sobre este resultado, los resultados no son concluyentes y se necesitan más estudios.
2.6 Estado mental: generales
Dos estudios informaron la puntuación total promedio de la PANSS al final del estudio sin diferencias entre el grupo de aumento de la dosis del antipsicótico y de mantenimiento de la dosis del antipsicótico (Honer 2011; Lindenmayer 2011). Con respecto al cambio en la puntuación total de la PANSS, se incluyeron tres estudios en el análisis (Lindenmayer 2011; Loebel 2014; Sakurai 2016) y nuevamente no se observaron diferencias entre los dos grupos. No obstante, en este análisis hubo una heterogeneidad considerable, aunque no estadísticamente significativa, en cuanto a los resultados del estudio. Lindenmayer 2011 y Sakurai 2016 no mostraron diferencias entre los grupos mientras que Loebel 2014 favoreció al grupo de aumento de la dosis. Además de los diferentes antipsicóticos utilizados, la inspección de los tres estudios no mostró una diferencia importante que pudiera explicar la considerable heterogeneidad; en el estudio Lindenmayer 2011 se utilizó quetiapina y excedió el rango de dosis recomendado, en el estudio Sakurai 2016 se empleó olanzapina o risperidona pero no excedieron el rango de dosis recomendado y en Loebel 2014 se empleó lurasidona pero no excedió el rango de dosis recomendado. Para la lurasidona, hay alguna evidencia de estudios a dosis fija de que hasta el presente la dosis de 160 mg/día de lurasidona había sido la más eficaz de cualquier modo (Loebel 2013). Cuando se combinaron las puntuaciones finales y de cambio de la PANSS, nuevamente no se observaron diferencias claras entre los dos grupos. En cuanto a la escala BPRS, tres estudios informaron la puntuación total promedio en la BPRS al final del estudio y sólo un estudio informó el cambio en la puntuación total promedio de la BPRS. Ninguno de los dos análisis mostró diferencias entre los grupos. Cuando se combinaron las puntuaciones finales y de cambio de la BPRS, nuevamente no se observaron diferencias claras entre los dos grupos. En cuanto a la escala NOSIE, sólo un estudio informó el cambio promedio en las puntuaciones sin diferencia entre los grupos. No obstante, debido a que hubo pocos estudios y participantes incluidos en todos los análisis anteriores, los resultados no son concluyentes y se necesitan más estudios.
2.7 Estado mental: síntomas positivos y negativos
Pocos ensayos (número máximo = 3) informaron los síntomas específicos de la esquizofrenia, p.ej. síntomas positivos y negativos. No se observaron diferencias entre el grupo de aumento de la dosis del antipsicótico y de mantenimiento de la dosis del antipsicótico, pero como se incluyeron muy pocos estudios en los análisis no es posible hacer afirmaciones significativas.
2.8 Efectos adversos
Los efectos adversos a menudo se informaron de manera deficiente e incompleta y en general los datos fueron muy escasos. Algunos resultados relacionados con los síntomas extrapiramidales fueron heterogéneos, pero debido a que sólo dos o tres estudios presentaron datos relevantes por resultado y las puntuaciones fueron muy bajas al inicio, no fue posible realizar una interpretación clínica significativa. Se necesitan más estudios.
2.9 Comportamiento, funcionalidad y calidad de vida
Se dispuso de pocos datos en cuanto al comportamiento, las escalas de calificación de la funcionalidad y la calidad de vida. No se encontraron diferencias claras, pero se justifica la realización de más estudios. Se cree que la mejoría en la funcionalidad y la calidad de vida de los pacientes son metas importantes y desafiantes de las estrategias del tratamiento antipsicótico y se deben incluir en el temario de investigación futuro.
3. Análisis de subgrupos e investigación de la heterogeneidad
No hubo heterogeneidad estáticamente significativa en el metanálisis del resultado primario "respuesta clínicamente relevante según lo definieron los autores". Además, ningún análisis de subgrupos mostró diferencias estadísticamente significativas, pero el poder para detectar una diferencia real fue muy escaso.
4. Análisis de sensibilidad
Los hallazgos en cuanto al resultado primario no fueron muy diferentes en una serie de análisis de sensibilidad preplanificados de los cuales se excluyeron los estudios con una asignación al azar incierta, una ocultación incierta de la asignación, un alto riesgo de sesgo con respecto al cegamiento o datos de resultado incompletos, así como los estudios con valores imputados; o cuando se aplicó un modelo de efectos fijos en lugar de un modelo de efectos aleatorios. No obstante, el poder estadístico de estos análisis fue escaso.
Compleción y aplicabilidad general de las pruebas
En la revisión sólo fue posible incluir diez estudios que examinaron el aumento de la dosis del antipsicótico versus el mantenimiento de la dosis del antipsicótico en pacientes con esquizofrenia que no responden al tratamiento antipsicótico actual. Los diez estudios se realizaron sobre diferentes antipsicóticos, tuvieron diferentes duraciones de las fases de preinclusión y de seguimiento, utilizaron definiciones diferentes de la falta de respuesta y se realizaron en diferentes contextos y poblaciones. No hubo diferencias claras entre los dos grupos en los resultados de eficacia. Además, los datos sobre la mayoría de los resultados secundarios fueron escasos (generalmente uno o dos estudios incluidos por resultado). Además, los análisis de subgrupos y de sensibilidad no detectaron efectos pero el poder estadístico de estos análisis fue escaso. Por lo tanto, se necesitan más estudios y se deben explorar estrategias de tratamiento alternativas para los pacientes que no responden.
Calidad de la evidencia
La calidad de la evidencia es baja a muy baja según GRADE (Schünemann 2011). Todos los estudios fueron aleatorios y todos, excepto McGorry 2011, fueron doble ciego. No obstante, en la mayoría no se presentaron detalles. Por lo tanto, no está claro si los estudios realizaron una asignación al azar adecuada, si realmente se realizó la ocultación de la asignación al tratamiento ni si el cegamiento funcionó. Además, muchos resultados se evaluaron en tamaños de la muestra demasiado pequeños para detectar diferencias claras, de existir.
Sesgos potenciales en el proceso de revisión
Se decidió a priori agrupar todos los fármacos antipsicóticos en esta revisión. Lo anterior se justifica para los resultados relacionados con la eficacia debido a que la mayoría de los compuestos antipsicóticos no difieren en eficacia y, si existen diferencias entre algunos, las mismas no son considerables (Leucht 2009; Leucht 2013). La decisión de agrupar todos los estudios independientemente del fármaco antipsicótico administrado es más problemática para los efectos adversos porque los antipsicóticos difieren en gran medida en este sentido. Este hecho también podría explicar en parte la considerable heterogeneidad que estuvo presente en el metanálisis de algunos resultados de los efectos adversos. Además, se espera que la heterogeneidad entre los estudios sea más grande para los estudios pequeños (IntHout 2015) y es difícil de calcular cuando hay pocos estudios incluidos en un metanálisis (Friede 2017; von Hippel 2015), como en este caso.
La búsqueda se basó en gran parte en el registro de ensayos del Grupo Cochrane de Esquizofrenia. Este registro está constituido en gran parte por las búsquedas de la bibliografía publicada. Es posible que haya estudios no publicados que no se conocen, y existe la posibilidad de sesgo de publicación, pero no fue posible realizar el gráfico en embudo propuesto para investigar la presencia de sesgo de publicación debido a que se incluyeron menos de diez estudios por resultado en los análisis. Se ha decidido utilizar el modelo de efectos aleatorios para los análisis, que no supone que las poblaciones de las cuales se derivan los diferentes ensayos sean iguales. Esta técnica destaca los resultados de los ensayos más pequeños y estos estudios son los que tienen probabilidades de ser más proclives al sesgo. No obstante, los resultados de un modelo de efectos fijos en un análisis de sensibilidad del resultado primario fueron similares.
En resumen, se debe señalar que en la presente revisión se incluyeron pocos ensayos y la mayoría de los análisis claramente tuvieron un escaso poder estadístico, lo que aumenta la posibilidad de errores tipo II (es decir, fracaso para encontrar una diferencia aunque esté presente).
Acuerdos y desacuerdos con otros estudios o revisiones
Las guías de tratamiento de la esquizofrenia reconocen que existe evidencia limitada en cuanto a las estrategias de tratamiento en el caso de la falta de respuesta al tratamiento antipsicótico inicial; no obstante, no se recomienda el exceso de dosis del antipsicótico fuera del rango recomendado (Hasan 2012). Dold 2015, una revisión reciente sobre el mismo tema, estableció una conclusión similar a la de esta revisión; no obstante, los autores no lograron incluir casi la mitad de los estudios relevantes.

Study flow diagram.
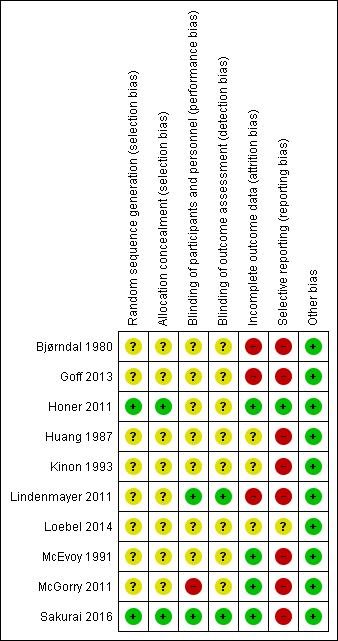
Risk of bias summary: review authors' judgements about each risk of bias item for each included study.
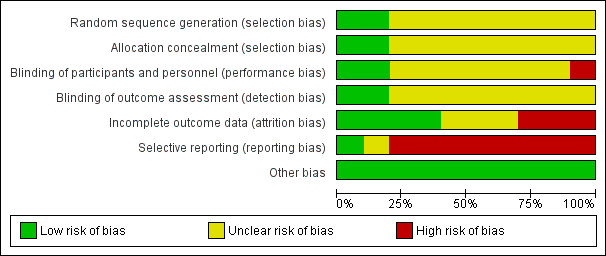
Risk of bias graph: review authors' judgements about each risk of bias item presented as percentages across all included studies.

Comparison 1 Antipsychotic dose increase versus antipsychotic dose maintenance, Outcome 1 Global state: 1a. Clinically relevant response as defined by trials.

Comparison 1 Antipsychotic dose increase versus antipsychotic dose maintenance, Outcome 2 Global state: 1b. Any change (improvement in Global Assesment scale).
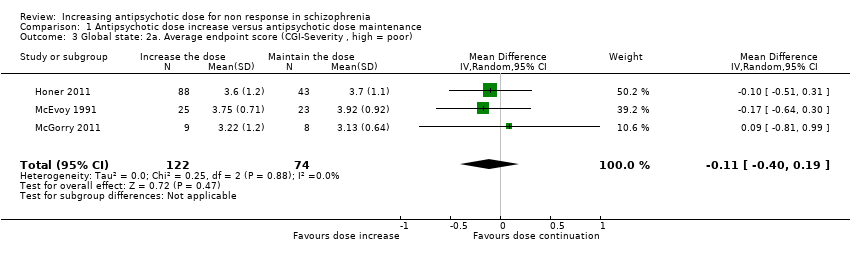
Comparison 1 Antipsychotic dose increase versus antipsychotic dose maintenance, Outcome 3 Global state: 2a. Average endpoint score (CGI‐Severity , high = poor).

Comparison 1 Antipsychotic dose increase versus antipsychotic dose maintenance, Outcome 4 Global state: 2b. Average change score ( CGI‐Severity, high = poor).

Comparison 1 Antipsychotic dose increase versus antipsychotic dose maintenance, Outcome 5 Global state: 2c. Average endpoint score (CGI‐Improvement, high = poor).
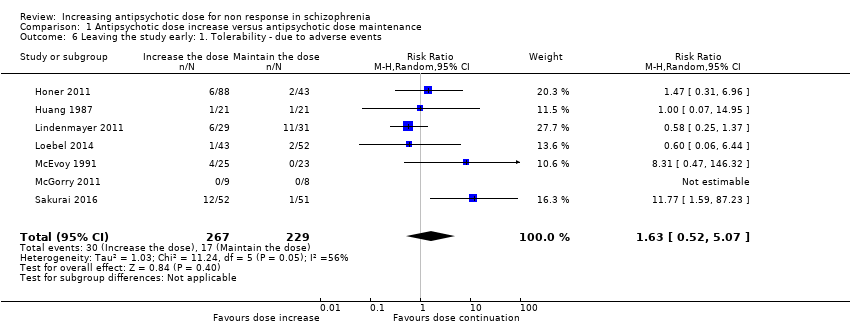
Comparison 1 Antipsychotic dose increase versus antipsychotic dose maintenance, Outcome 6 Leaving the study early: 1. Tolerability ‐ due to adverse events.

Comparison 1 Antipsychotic dose increase versus antipsychotic dose maintenance, Outcome 7 Leaving the study early: 2. Acceptability of treatment ‐ due to any reason.
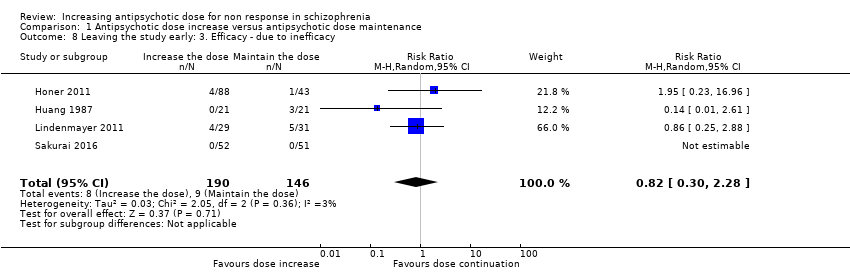
Comparison 1 Antipsychotic dose increase versus antipsychotic dose maintenance, Outcome 8 Leaving the study early: 3. Efficacy ‐ due to inefficacy.

Comparison 1 Antipsychotic dose increase versus antipsychotic dose maintenance, Outcome 9 Mental state: 1a. General ‐ average endpoint score (PANSS total, high = poor).
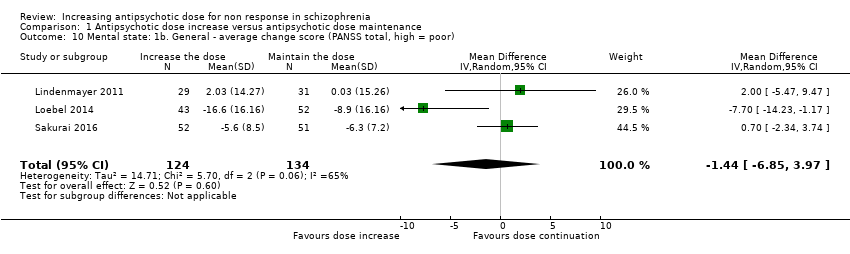
Comparison 1 Antipsychotic dose increase versus antipsychotic dose maintenance, Outcome 10 Mental state: 1b. General ‐ average change score (PANSS total, high = poor).

Comparison 1 Antipsychotic dose increase versus antipsychotic dose maintenance, Outcome 11 Mental state: 1c. General ‐ average endpoint and/or change score (PANSS total, high = poor).

Comparison 1 Antipsychotic dose increase versus antipsychotic dose maintenance, Outcome 12 Mental state: 1d. General ‐ average endpoint score (BPRS total, high = poor).
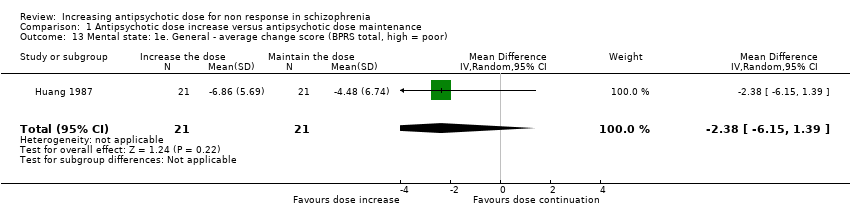
Comparison 1 Antipsychotic dose increase versus antipsychotic dose maintenance, Outcome 13 Mental state: 1e. General ‐ average change score (BPRS total, high = poor).
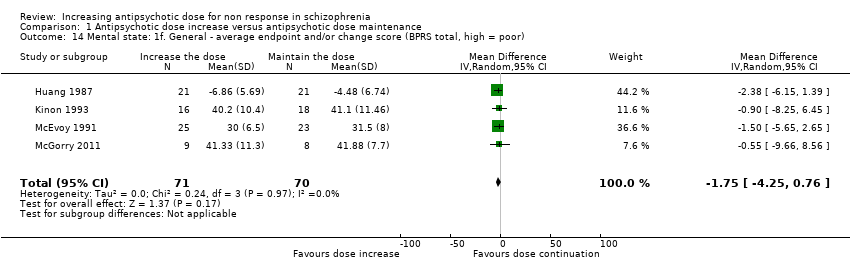
Comparison 1 Antipsychotic dose increase versus antipsychotic dose maintenance, Outcome 14 Mental state: 1f. General ‐ average endpoint and/or change score (BPRS total, high = poor).
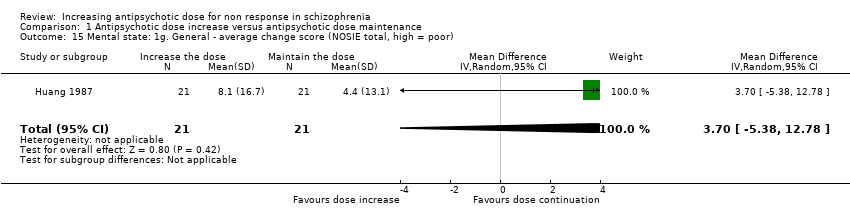
Comparison 1 Antipsychotic dose increase versus antipsychotic dose maintenance, Outcome 15 Mental state: 1g. General ‐ average change score (NOSIE total, high = poor).

Comparison 1 Antipsychotic dose increase versus antipsychotic dose maintenance, Outcome 16 Mental state: 2a. Positive symptoms ‐ Clinically important change.
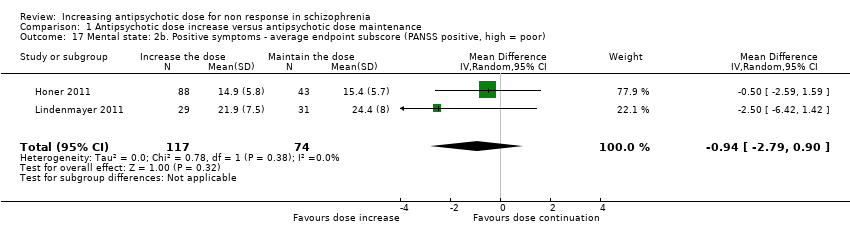
Comparison 1 Antipsychotic dose increase versus antipsychotic dose maintenance, Outcome 17 Mental state: 2b. Positive symptoms ‐ average endpoint subscore (PANSS positive, high = poor).
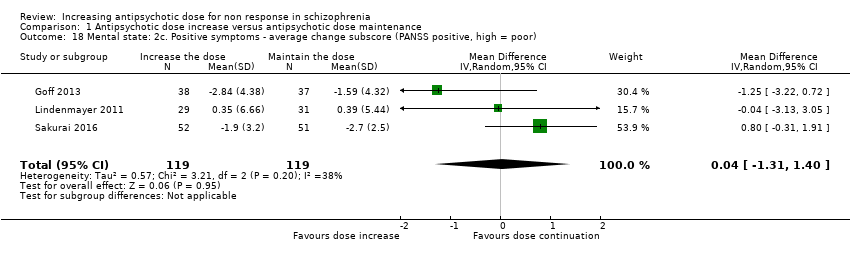
Comparison 1 Antipsychotic dose increase versus antipsychotic dose maintenance, Outcome 18 Mental state: 2c. Positive symptoms ‐ average change subscore (PANSS positive, high = poor).

Comparison 1 Antipsychotic dose increase versus antipsychotic dose maintenance, Outcome 19 Mental state: 2d. Positive symptoms ‐ average endpoint subscore (BPRS positive,high = poor).

Comparison 1 Antipsychotic dose increase versus antipsychotic dose maintenance, Outcome 20 Mental state: 3a. Negative symptoms ‐ average endpoint subscore (PANSS negative, high = poor).

Comparison 1 Antipsychotic dose increase versus antipsychotic dose maintenance, Outcome 21 Mental state: 3b. Negative symptoms ‐ average change subscore (PANSS negative, high = poor).
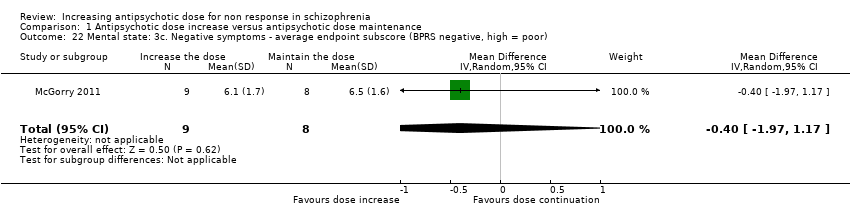
Comparison 1 Antipsychotic dose increase versus antipsychotic dose maintenance, Outcome 22 Mental state: 3c. Negative symptoms ‐ average endpoint subscore (BPRS negative, high = poor).

Comparison 1 Antipsychotic dose increase versus antipsychotic dose maintenance, Outcome 23 Mental state: 3d. Negative symptoms ‐ average endpoint score (SANS, high = poor).

Comparison 1 Antipsychotic dose increase versus antipsychotic dose maintenance, Outcome 24 Adverse effects ‐ At least one adverse effect.

Comparison 1 Antipsychotic dose increase versus antipsychotic dose maintenance, Outcome 25 Adverse effects ‐ Cardiac: QTc prolongation.
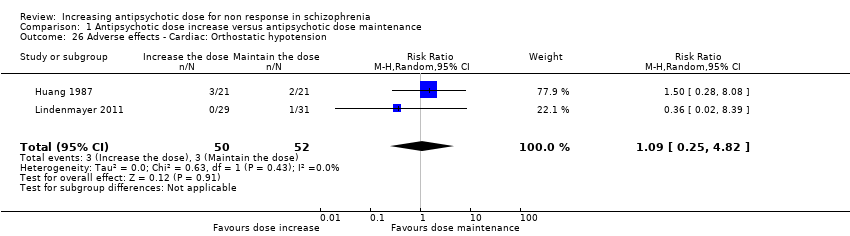
Comparison 1 Antipsychotic dose increase versus antipsychotic dose maintenance, Outcome 26 Adverse effects ‐ Cardiac: Orthostatic hypotension.

Comparison 1 Antipsychotic dose increase versus antipsychotic dose maintenance, Outcome 27 Adverse effects ‐ Cardiac: Palpitations.

Comparison 1 Antipsychotic dose increase versus antipsychotic dose maintenance, Outcome 28 Adverse effects ‐ Cardiac: Premature Ventricular Contractions.
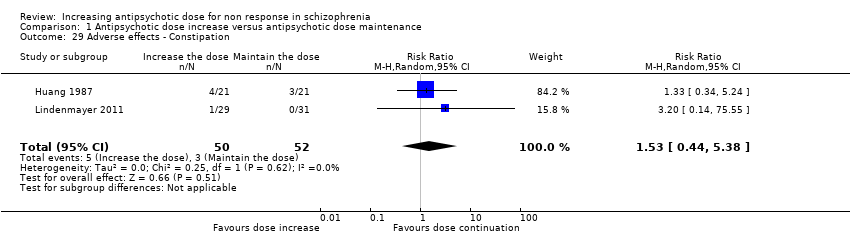
Comparison 1 Antipsychotic dose increase versus antipsychotic dose maintenance, Outcome 29 Adverse effects ‐ Constipation.

Comparison 1 Antipsychotic dose increase versus antipsychotic dose maintenance, Outcome 30 Adverse effects ‐ Dizziness.

Comparison 1 Antipsychotic dose increase versus antipsychotic dose maintenance, Outcome 31 Adverse effects ‐ Drooling.
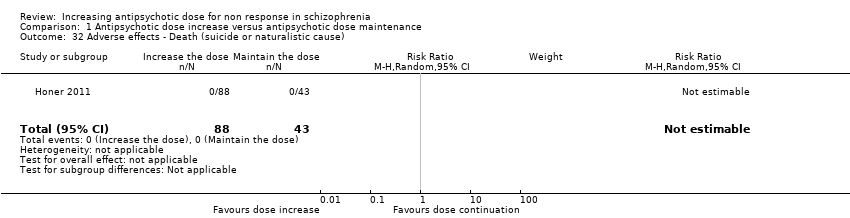
Comparison 1 Antipsychotic dose increase versus antipsychotic dose maintenance, Outcome 32 Adverse effects ‐ Death (suicide or naturalistic cause).

Comparison 1 Antipsychotic dose increase versus antipsychotic dose maintenance, Outcome 33 Adverse effects ‐ Extrapyramidal: Categorical deterioration (AIMS, high = poor).

Comparison 1 Antipsychotic dose increase versus antipsychotic dose maintenance, Outcome 34 Adverse effects ‐ Extrapyramidal: average endpoint score (AIMS, high = poor).
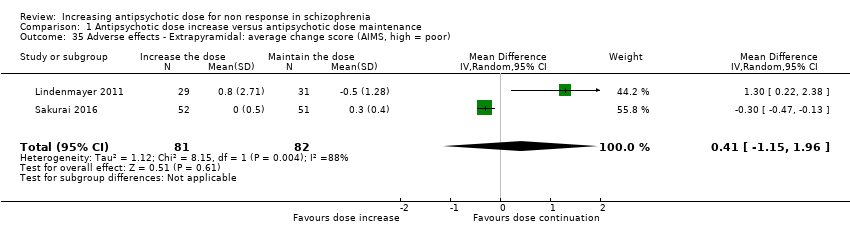
Comparison 1 Antipsychotic dose increase versus antipsychotic dose maintenance, Outcome 35 Adverse effects ‐ Extrapyramidal: average change score (AIMS, high = poor).

Comparison 1 Antipsychotic dose increase versus antipsychotic dose maintenance, Outcome 36 Adverse effects ‐ Extrapyramidal: akathisia.
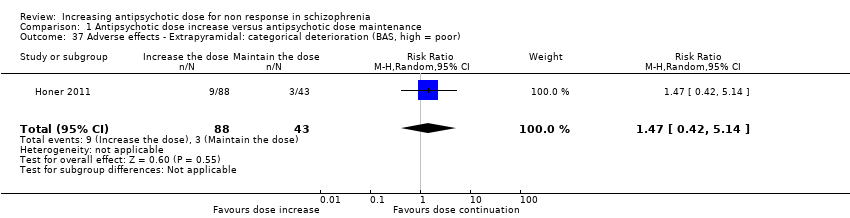
Comparison 1 Antipsychotic dose increase versus antipsychotic dose maintenance, Outcome 37 Adverse effects ‐ Extrapyramidal: categorical deterioration (BAS, high = poor).
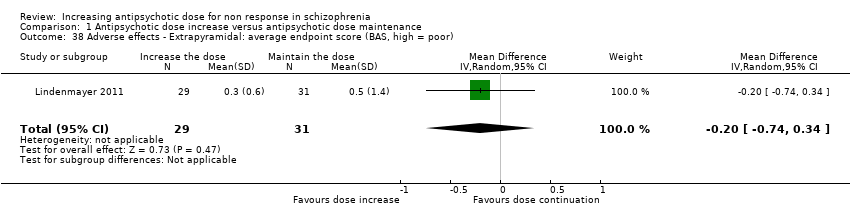
Comparison 1 Antipsychotic dose increase versus antipsychotic dose maintenance, Outcome 38 Adverse effects ‐ Extrapyramidal: average endpoint score (BAS, high = poor).
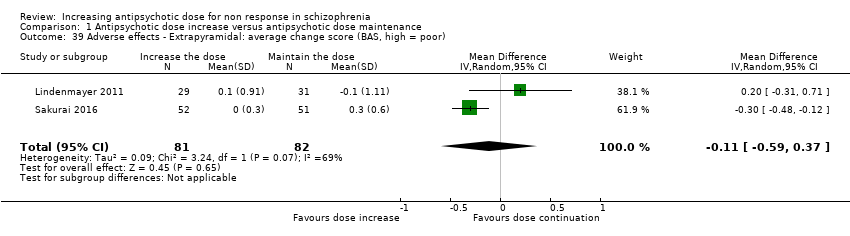
Comparison 1 Antipsychotic dose increase versus antipsychotic dose maintenance, Outcome 39 Adverse effects ‐ Extrapyramidal: average change score (BAS, high = poor).

Comparison 1 Antipsychotic dose increase versus antipsychotic dose maintenance, Outcome 40 Adverse effects ‐ Extrapyramidal: dystonia and/or dyskinesia.
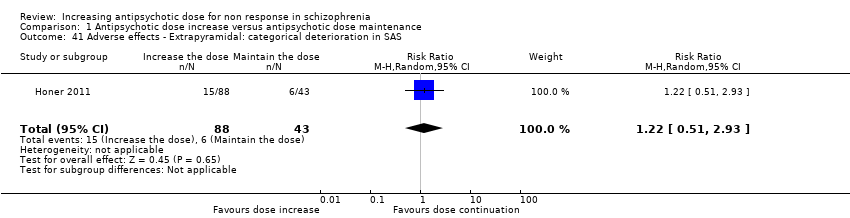
Comparison 1 Antipsychotic dose increase versus antipsychotic dose maintenance, Outcome 41 Adverse effects ‐ Extrapyramidal: categorical deterioration in SAS.
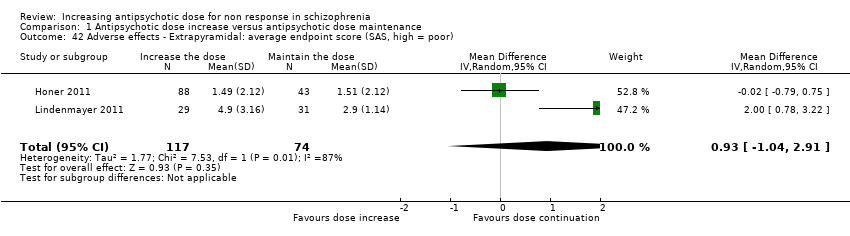
Comparison 1 Antipsychotic dose increase versus antipsychotic dose maintenance, Outcome 42 Adverse effects ‐ Extrapyramidal: average endpoint score (SAS, high = poor).

Comparison 1 Antipsychotic dose increase versus antipsychotic dose maintenance, Outcome 43 Adverse effects ‐ Extrapyramidal: average change score (SA, high = poor).

Comparison 1 Antipsychotic dose increase versus antipsychotic dose maintenance, Outcome 44 Adverse effects ‐ Extrapyramidal: tremor.
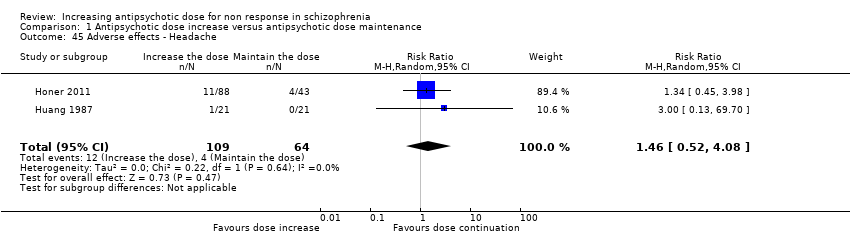
Comparison 1 Antipsychotic dose increase versus antipsychotic dose maintenance, Outcome 45 Adverse effects ‐ Headache.

Comparison 1 Antipsychotic dose increase versus antipsychotic dose maintenance, Outcome 46 Adverse effects ‐ Somnolence and/or drowsiness.
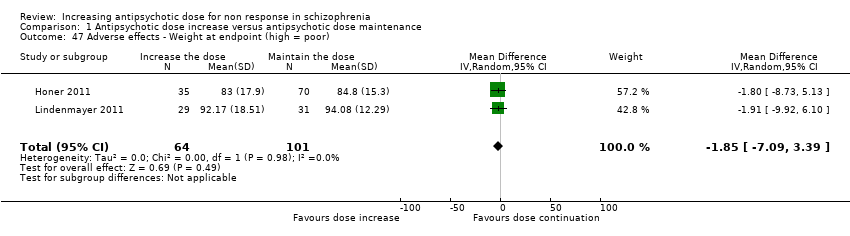
Comparison 1 Antipsychotic dose increase versus antipsychotic dose maintenance, Outcome 47 Adverse effects ‐ Weight at endpoint (high = poor).
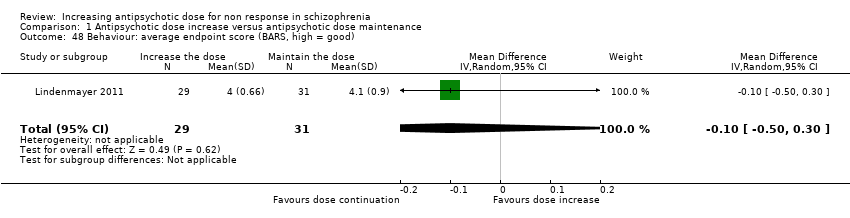
Comparison 1 Antipsychotic dose increase versus antipsychotic dose maintenance, Outcome 48 Behaviour: average endpoint score (BARS, high = good).
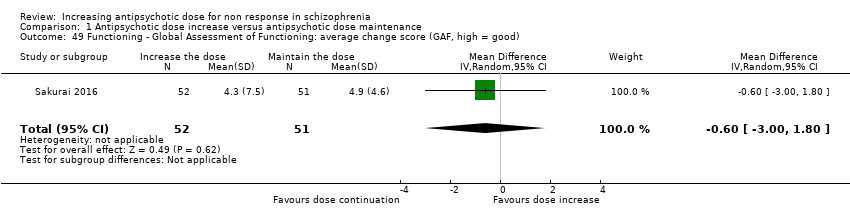
Comparison 1 Antipsychotic dose increase versus antipsychotic dose maintenance, Outcome 49 Functioning ‐ Global Assessment of Functioning: average change score (GAF, high = good).

Comparison 1 Antipsychotic dose increase versus antipsychotic dose maintenance, Outcome 50 Functioning ‐ Social ‐ Adaptive Functioning Evaluation: average endpoint score (SAFE, high = poor).
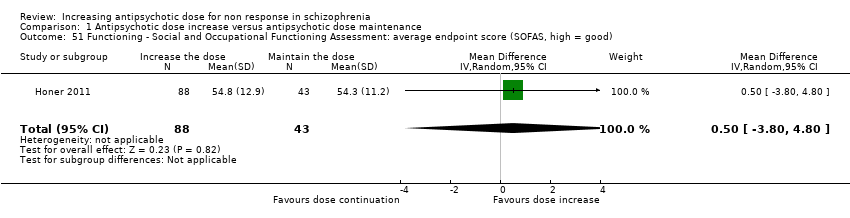
Comparison 1 Antipsychotic dose increase versus antipsychotic dose maintenance, Outcome 51 Functioning ‐ Social and Occupational Functioning Assessment: average endpoint score (SOFAS, high = good).
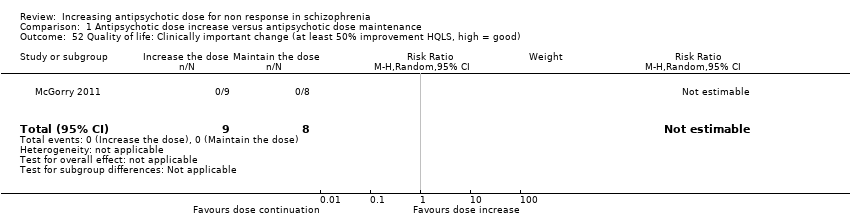
Comparison 1 Antipsychotic dose increase versus antipsychotic dose maintenance, Outcome 52 Quality of life: Clinically important change (at least 50% improvement HQLS, high = good).
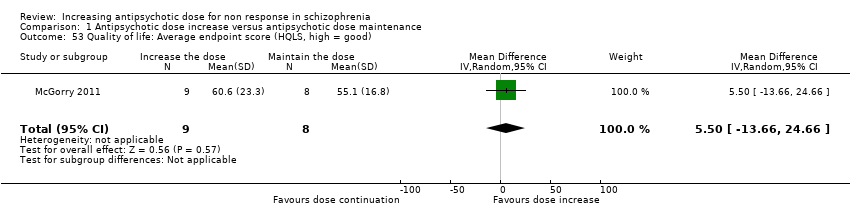
Comparison 1 Antipsychotic dose increase versus antipsychotic dose maintenance, Outcome 53 Quality of life: Average endpoint score (HQLS, high = good).

Comparison 2 Subgroup analysis and investigation of heterogeneity, Outcome 1 Single antipsychotic drugs.

Comparison 2 Subgroup analysis and investigation of heterogeneity, Outcome 2 Clinical state, stage or problem.
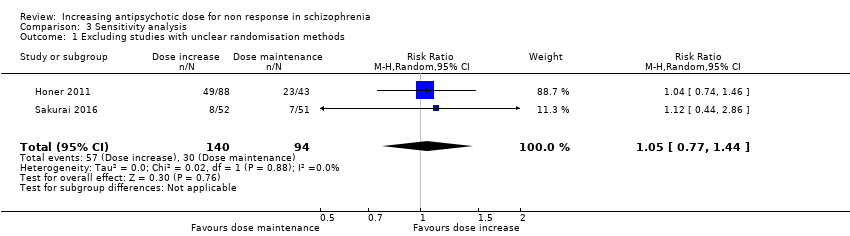
Comparison 3 Sensitivity analysis, Outcome 1 Excluding studies with unclear randomisation methods.

Comparison 3 Sensitivity analysis, Outcome 2 Excluding studies with unclear allocation concealment methods.
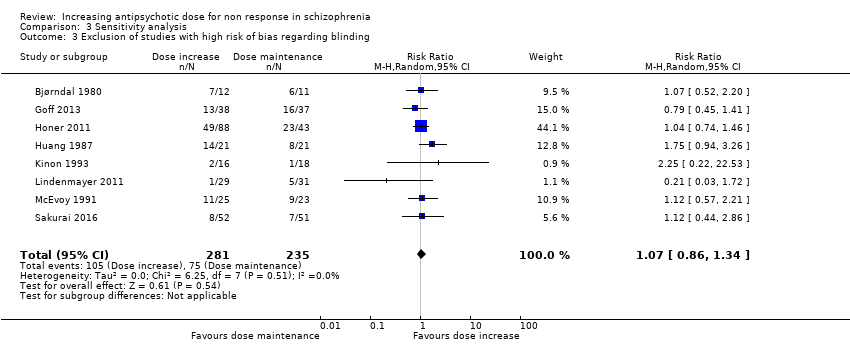
Comparison 3 Sensitivity analysis, Outcome 3 Exclusion of studies with high risk of bias regarding blinding.

Comparison 3 Sensitivity analysis, Outcome 4 Exclusion of studies with high risk of bias regarding incomplete outcome data.

Comparison 3 Sensitivity analysis, Outcome 5 Exclusion of studies with imputed values.

Comparison 3 Sensitivity analysis, Outcome 6 Fixed effects.
| Methods | Randomisation: random. Allocation: concealed. Setting: in‐ or out‐patients. |
| Participants | Diagnosis: patients with schizophrenia, schizoaffective disorder or schizophreniform disorder. N > 300 |
| Interventions | All patients firstly receive treatment with one antipsychotic drug for at least 2 weeks. Those patients who do not at least minimally improve after 2 weeks of treatment, are considered non‐responders and are randomised to: 1. Increasing the dose of the antipsychotic drug above the officially recommended dose range. 2. Continuing treatment with the antipsychotic drug at the same, initial dose (within the officially recommended dose range). |
| Outcomes | Response (e.g. defined as PANSS or BPRS decrease ≥ 50%).* Relapse. Leaving the study early due to any reason. Leaving the study early due to side effects. General mental state‐average change in general mental state scores. Adverse effects‐ at least one adverse effect; clinically important general adverse effects; sudden and unexpected death. Service use‐ time in hospital. Quality of life. All outcomes by time ‐ short term (up to 12 weeks), medium term (13 to 26 weeks) and long term (over 26 weeks). |
| Notes | *Primary outcome of interest. |
| Antipsychotic dose increase compared to antipsychotic dose continuation for non response in schizophrenia | ||||||
| Patient or population: non response in schizophrenia | ||||||
| Outcomes | Anticipated absolute effects* (95% CI) | Relative effect | № of participants | Certainty of the evidence | Comments | |
| Risk with antipsychotic dose continuation | Risk with antipsychotic dose increase | |||||
| Global state: clinically relevant response: Assessed with response ratio | Study population | RR 1.09 | 533 | ⊕⊕⊝⊝ | ||
| 309 per 1000 | 336 per 1000 | |||||
| Leaving the study early: tolerability ‐ leaving early due to adverse effects. | Study population | RR 1.63 | 496 | ⊕⊝⊝⊝ | ||
| 74 per 1000 | 121 per 1000 | |||||
| Leaving the study early: acceptability ‐ leaving early due to any reason. | Study population | RR 1.30 | 353 | ⊕⊕⊝⊝ | ||
| 23 per 100 | 30 per 100 | |||||
| General mental state : PANSS total score change* | The mean general mental state ‐ PANSS total score change ranged from −8.9 to 0.03 points | MD 1.44 points lower | ‐ | 258 | ⊕⊝⊝⊝ | One other trial used the BPRS total score change and showed no clear difference between the two groups. Pre‐defined outcome: Clinically important change in general mental state not reported. |
| Adverse effects ‐ at least one adverse effect | Study population | RR 0.91 | 191 | ⊕⊝⊝⊝ | ||
| 716 per 1000 | 652 per 1000 | |||||
| Service use: time in hospital | ‐ | see comment | ‐ | (0 studies) | ‐ | No studies reported this outcome. |
| Quality of life ‐ clinically important change in quality of life (defined as at least 50% improvement in HQLS) | Study population | not estimable | 17 | ⊕⊕⊝⊝ | ||
| 0 per 1000 | 0 per 1000 | |||||
| *The risk in the intervention group (and its 95% confidence interval) is based on the assumed risk in the comparison group and the relative effect of the intervention (and its 95% CI). | ||||||
| GRADE Working Group grades of evidence | ||||||
| 1 Imprecision for dichotomous outcomes: a) sample size should be >800 and/or total number of events>300; in our review, both numbers are much smaller. b) the pooled estimate of effect includes both no effect and an appreciable benefit or appreciable harm. 2 Inconsistency: Heterogeneity: Tau² = 1.03; Chi² = 11.24, df = 5 (P = 0.05); I² = 56% 3 Inconsistency: Heterogeneity: Tau² = 14.71; Chi² = 5.70, df = 2 (P = 0.06); I² = 65% 4 Imprecision for continuous outcomes: a) sample size is lower than 400, b) confidence interval includes no effect and the upper or lower confidence limit crosses the minimal important difference (MID), either for benefit of harm 5 Indirectness: The pre‐specified outcome (clinical important change in mental state) was not reported. 6 Inconsistency: Heterogeneity: Tau² = 0.10; Chi² = 3.62, df = 1 (P = 0.06); I² = 72% | ||||||
| Outcome or subgroup title | No. of studies | No. of participants | Statistical method | Effect size |
| 1 Global state: 1a. Clinically relevant response as defined by trials Show forest plot | 9 | 533 | Risk Ratio (M‐H, Random, 95% CI) | 1.09 [0.86, 1.40] |
| 2 Global state: 1b. Any change (improvement in Global Assesment scale) Show forest plot | 1 | 23 | Risk Ratio (M‐H, Random, 95% CI) | 0.76 [0.32, 1.80] |
| 3 Global state: 2a. Average endpoint score (CGI‐Severity , high = poor) Show forest plot | 3 | 196 | Mean Difference (IV, Random, 95% CI) | ‐0.11 [‐0.40, 0.19] |
| 4 Global state: 2b. Average change score ( CGI‐Severity, high = poor) Show forest plot | 1 | 95 | Mean Difference (IV, Random, 95% CI) | ‐0.4 [‐0.80, ‐0.00] |
| 5 Global state: 2c. Average endpoint score (CGI‐Improvement, high = poor) Show forest plot | 1 | 103 | Mean Difference (IV, Random, 95% CI) | 0.0 [‐0.35, 0.35] |
| 6 Leaving the study early: 1. Tolerability ‐ due to adverse events Show forest plot | 7 | 496 | Risk Ratio (M‐H, Random, 95% CI) | 1.63 [0.52, 5.07] |
| 7 Leaving the study early: 2. Acceptability of treatment ‐ due to any reason Show forest plot | 5 | 353 | Risk Ratio (M‐H, Random, 95% CI) | 1.30 [0.89, 1.90] |
| 8 Leaving the study early: 3. Efficacy ‐ due to inefficacy Show forest plot | 4 | 336 | Risk Ratio (M‐H, Random, 95% CI) | 0.82 [0.30, 2.28] |
| 9 Mental state: 1a. General ‐ average endpoint score (PANSS total, high = poor) Show forest plot | 2 | 191 | Mean Difference (IV, Random, 95% CI) | ‐1.81 [‐7.31, 3.69] |
| 10 Mental state: 1b. General ‐ average change score (PANSS total, high = poor) Show forest plot | 3 | 258 | Mean Difference (IV, Random, 95% CI) | ‐1.44 [‐6.85, 3.97] |
| 11 Mental state: 1c. General ‐ average endpoint and/or change score (PANSS total, high = poor) Show forest plot | 4 | 389 | Mean Difference (IV, Random, 95% CI) | ‐2.13 [‐6.16, 1.90] |
| 12 Mental state: 1d. General ‐ average endpoint score (BPRS total, high = poor) Show forest plot | 3 | 99 | Mean Difference (IV, Random, 95% CI) | ‐1.25 [‐4.60, 2.11] |
| 13 Mental state: 1e. General ‐ average change score (BPRS total, high = poor) Show forest plot | 1 | 42 | Mean Difference (IV, Random, 95% CI) | ‐2.38 [‐6.15, 1.39] |
| 14 Mental state: 1f. General ‐ average endpoint and/or change score (BPRS total, high = poor) Show forest plot | 4 | 141 | Mean Difference (IV, Random, 95% CI) | ‐1.75 [‐4.25, 0.76] |
| 15 Mental state: 1g. General ‐ average change score (NOSIE total, high = poor) Show forest plot | 1 | 42 | Mean Difference (IV, Random, 95% CI) | 3.70 [‐5.38, 12.78] |
| 16 Mental state: 2a. Positive symptoms ‐ Clinically important change Show forest plot | 1 | 17 | Risk Ratio (M‐H, Random, 95% CI) | 1.33 [0.58, 3.07] |
| 17 Mental state: 2b. Positive symptoms ‐ average endpoint subscore (PANSS positive, high = poor) Show forest plot | 2 | 191 | Mean Difference (IV, Random, 95% CI) | ‐0.94 [‐2.79, 0.90] |
| 18 Mental state: 2c. Positive symptoms ‐ average change subscore (PANSS positive, high = poor) Show forest plot | 3 | 238 | Mean Difference (IV, Random, 95% CI) | 0.04 [‐1.31, 1.40] |
| 19 Mental state: 2d. Positive symptoms ‐ average endpoint subscore (BPRS positive,high = poor) Show forest plot | 1 | 17 | Mean Difference (IV, Random, 95% CI) | 0.40 [‐2.94, 3.74] |
| 20 Mental state: 3a. Negative symptoms ‐ average endpoint subscore (PANSS negative, high = poor) Show forest plot | 2 | 191 | Mean Difference (IV, Random, 95% CI) | 0.32 [‐1.48, 2.11] |
| 21 Mental state: 3b. Negative symptoms ‐ average change subscore (PANSS negative, high = poor) Show forest plot | 2 | 163 | Mean Difference (IV, Random, 95% CI) | ‐0.15 [‐0.96, 0.67] |
| 22 Mental state: 3c. Negative symptoms ‐ average endpoint subscore (BPRS negative, high = poor) Show forest plot | 1 | 17 | Mean Difference (IV, Random, 95% CI) | ‐0.40 [‐1.97, 1.17] |
| 23 Mental state: 3d. Negative symptoms ‐ average endpoint score (SANS, high = poor) Show forest plot | 1 | 34 | Mean Difference (IV, Random, 95% CI) | 1.5 [‐14.33, 17.33] |
| 24 Adverse effects ‐ At least one adverse effect Show forest plot | 2 | 191 | Risk Ratio (M‐H, Random, 95% CI) | 0.91 [0.55, 1.50] |
| 25 Adverse effects ‐ Cardiac: QTc prolongation Show forest plot | 2 | 206 | Risk Ratio (M‐H, Random, 95% CI) | 2.47 [0.12, 50.39] |
| 26 Adverse effects ‐ Cardiac: Orthostatic hypotension Show forest plot | 2 | 102 | Risk Ratio (M‐H, Random, 95% CI) | 1.09 [0.25, 4.82] |
| 27 Adverse effects ‐ Cardiac: Palpitations Show forest plot | 1 | 42 | Risk Ratio (M‐H, Random, 95% CI) | 3.0 [0.13, 69.70] |
| 28 Adverse effects ‐ Cardiac: Premature Ventricular Contractions Show forest plot | 1 | 42 | Risk Ratio (M‐H, Random, 95% CI) | 3.0 [0.13, 69.70] |
| 29 Adverse effects ‐ Constipation Show forest plot | 2 | 102 | Risk Ratio (M‐H, Random, 95% CI) | 1.53 [0.44, 5.38] |
| 30 Adverse effects ‐ Dizziness Show forest plot | 2 | 173 | Risk Ratio (M‐H, Random, 95% CI) | 0.77 [0.41, 1.44] |
| 31 Adverse effects ‐ Drooling Show forest plot | 1 | 42 | Risk Ratio (M‐H, Random, 95% CI) | 2.0 [0.20, 20.41] |
| 32 Adverse effects ‐ Death (suicide or naturalistic cause) Show forest plot | 1 | 131 | Risk Ratio (M‐H, Random, 95% CI) | 0.0 [0.0, 0.0] |
| 33 Adverse effects ‐ Extrapyramidal: Categorical deterioration (AIMS, high = poor) Show forest plot | 1 | 131 | Risk Ratio (M‐H, Random, 95% CI) | 1.38 [0.59, 3.26] |
| 34 Adverse effects ‐ Extrapyramidal: average endpoint score (AIMS, high = poor) Show forest plot | 1 | 60 | Mean Difference (IV, Random, 95% CI) | 0.7 [‐0.87, 2.27] |
| 35 Adverse effects ‐ Extrapyramidal: average change score (AIMS, high = poor) Show forest plot | 2 | 163 | Mean Difference (IV, Random, 95% CI) | 0.41 [‐1.15, 1.96] |
| 36 Adverse effects ‐ Extrapyramidal: akathisia Show forest plot | 2 | 65 | Risk Ratio (M‐H, Random, 95% CI) | 0.74 [0.04, 14.02] |
| 37 Adverse effects ‐ Extrapyramidal: categorical deterioration (BAS, high = poor) Show forest plot | 1 | 131 | Risk Ratio (M‐H, Random, 95% CI) | 1.47 [0.42, 5.14] |
| 38 Adverse effects ‐ Extrapyramidal: average endpoint score (BAS, high = poor) Show forest plot | 1 | 60 | Mean Difference (IV, Random, 95% CI) | ‐0.2 [‐0.74, 0.34] |
| 39 Adverse effects ‐ Extrapyramidal: average change score (BAS, high = poor) Show forest plot | 2 | 163 | Mean Difference (IV, Random, 95% CI) | ‐0.11 [‐0.59, 0.37] |
| 40 Adverse effects ‐ Extrapyramidal: dystonia and/or dyskinesia Show forest plot | 3 | 196 | Risk Ratio (M‐H, Random, 95% CI) | 0.48 [0.09, 2.73] |
| 41 Adverse effects ‐ Extrapyramidal: categorical deterioration in SAS Show forest plot | 1 | 131 | Risk Ratio (M‐H, Random, 95% CI) | 1.22 [0.51, 2.93] |
| 42 Adverse effects ‐ Extrapyramidal: average endpoint score (SAS, high = poor) Show forest plot | 2 | 191 | Mean Difference (IV, Random, 95% CI) | 0.93 [‐1.04, 2.91] |
| 43 Adverse effects ‐ Extrapyramidal: average change score (SA, high = poor) Show forest plot | 2 | 163 | Mean Difference (IV, Random, 95% CI) | 0.21 [‐0.83, 1.26] |
| 44 Adverse effects ‐ Extrapyramidal: tremor Show forest plot | 2 | 173 | Risk Ratio (M‐H, Random, 95% CI) | 1.59 [0.59, 4.26] |
| 45 Adverse effects ‐ Headache Show forest plot | 2 | 173 | Risk Ratio (M‐H, Random, 95% CI) | 1.46 [0.52, 4.08] |
| 46 Adverse effects ‐ Somnolence and/or drowsiness Show forest plot | 4 | 256 | Risk Ratio (M‐H, Random, 95% CI) | 1.76 [0.81, 3.81] |
| 47 Adverse effects ‐ Weight at endpoint (high = poor) Show forest plot | 2 | 165 | Mean Difference (IV, Random, 95% CI) | ‐1.85 [‐7.09, 3.39] |
| 48 Behaviour: average endpoint score (BARS, high = good) Show forest plot | 1 | 60 | Mean Difference (IV, Random, 95% CI) | ‐0.10 [‐0.50, 0.30] |
| 49 Functioning ‐ Global Assessment of Functioning: average change score (GAF, high = good) Show forest plot | 1 | 103 | Mean Difference (IV, Random, 95% CI) | ‐0.60 [‐1.00, 1.80] |
| 50 Functioning ‐ Social ‐ Adaptive Functioning Evaluation: average endpoint score (SAFE, high = poor) Show forest plot | 1 | 60 | Mean Difference (IV, Random, 95% CI) | 0.16 [‐0.47, 0.79] |
| 51 Functioning ‐ Social and Occupational Functioning Assessment: average endpoint score (SOFAS, high = good) Show forest plot | 1 | 131 | Mean Difference (IV, Random, 95% CI) | 0.5 [‐3.80, 4.80] |
| 52 Quality of life: Clinically important change (at least 50% improvement HQLS, high = good) Show forest plot | 1 | 17 | Risk Ratio (M‐H, Random, 95% CI) | 0.0 [0.0, 0.0] |
| 53 Quality of life: Average endpoint score (HQLS, high = good) Show forest plot | 1 | 17 | Mean Difference (IV, Random, 95% CI) | 5.5 [‐13.66, 24.66] |
| Outcome or subgroup title | No. of studies | No. of participants | Statistical method | Effect size |
| 1 Single antipsychotic drugs Show forest plot | 8 | Risk Ratio (M‐H, Random, 95% CI) | Subtotals only | |
| 1.1 Fluphenazine | 1 | 34 | Risk Ratio (M‐H, Random, 95% CI) | 2.25 [0.22, 22.53] |
| 1.2 Haloperidol | 2 | 71 | Risk Ratio (M‐H, Random, 95% CI) | 1.10 [0.67, 1.80] |
| 1.3 Quetiapine | 2 | 191 | Risk Ratio (M‐H, Random, 95% CI) | 0.65 [0.15, 2.86] |
| 1.4 Risperidone | 1 | 17 | Risk Ratio (M‐H, Random, 95% CI) | 9.9 [0.63, 155.08] |
| 1.5 Thiothixene | 1 | 42 | Risk Ratio (M‐H, Random, 95% CI) | 1.75 [0.94, 3.26] |
| 1.6 Ziprasidone | 1 | 75 | Risk Ratio (M‐H, Random, 95% CI) | 0.79 [0.45, 1.41] |
| 2 Clinical state, stage or problem Show forest plot | 9 | Risk Ratio (M‐H, Random, 95% CI) | Subtotals only | |
| 2.1 First episode patients | 1 | 17 | Risk Ratio (M‐H, Random, 95% CI) | 9.9 [0.63, 155.08] |
| 2.2 Not first episode patients | 8 | 516 | Risk Ratio (M‐H, Random, 95% CI) | 1.07 [0.86, 1.34] |
| Outcome or subgroup title | No. of studies | No. of participants | Statistical method | Effect size |
| 1 Excluding studies with unclear randomisation methods Show forest plot | 2 | 234 | Risk Ratio (M‐H, Random, 95% CI) | 1.05 [0.77, 1.44] |
| 2 Excluding studies with unclear allocation concealment methods Show forest plot | 2 | 234 | Risk Ratio (M‐H, Random, 95% CI) | 1.05 [0.77, 1.44] |
| 3 Exclusion of studies with high risk of bias regarding blinding Show forest plot | 8 | 516 | Risk Ratio (M‐H, Random, 95% CI) | 1.07 [0.86, 1.34] |
| 4 Exclusion of studies with high risk of bias regarding incomplete outcome data Show forest plot | 6 | 375 | Risk Ratio (M‐H, Random, 95% CI) | 1.19 [0.92, 1.54] |
| 5 Exclusion of studies with imputed values Show forest plot | 8 | 458 | Risk Ratio (M‐H, Random, 95% CI) | 1.16 [0.90, 1.50] |
| 6 Fixed effects Show forest plot | 9 | 533 | Risk Ratio (M‐H, Fixed, 95% CI) | 1.10 [0.88, 1.38] |