Scolaris Content Display Scolaris Content Display

Study flow diagram.
Figuras y tablas -
Figure 1

Study flow diagram.

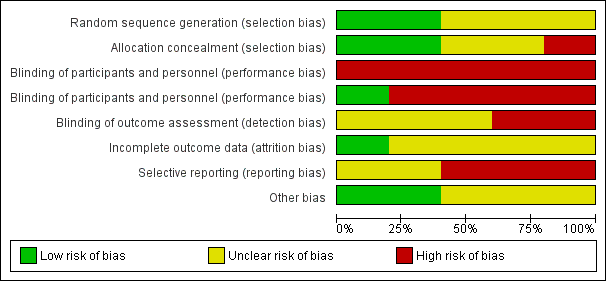
Risk of bias graph: review authors' judgements about each risk of bias item presented as percentages across all included studies.
Figuras y tablas -
Figure 2

Risk of bias graph: review authors' judgements about each risk of bias item presented as percentages across all included studies.

Risk of bias summary: review authors' judgements about each risk of bias item for each included study.
Figuras y tablas -
Figure 3

Risk of bias summary: review authors' judgements about each risk of bias item for each included study.

Comparison 1 Lispro versus regular insulin (Different insulin types within similar insulin regimens), Outcome 1 Perinatal death.
Figuras y tablas -
Analysis 1.1

Comparison 1 Lispro versus regular insulin (Different insulin types within similar insulin regimens), Outcome 1 Perinatal death.

Comparison 1 Lispro versus regular insulin (Different insulin types within similar insulin regimens), Outcome 2 Caesarean section.
Figuras y tablas -
Analysis 1.2

Comparison 1 Lispro versus regular insulin (Different insulin types within similar insulin regimens), Outcome 2 Caesarean section.

Comparison 1 Lispro versus regular insulin (Different insulin types within similar insulin regimens), Outcome 3 Pregnancy‐induced hypertension and pre‐eclampsia.
Figuras y tablas -
Analysis 1.3

Comparison 1 Lispro versus regular insulin (Different insulin types within similar insulin regimens), Outcome 3 Pregnancy‐induced hypertension and pre‐eclampsia.

Comparison 1 Lispro versus regular insulin (Different insulin types within similar insulin regimens), Outcome 4 Fetal anomaly.
Figuras y tablas -
Analysis 1.4

Comparison 1 Lispro versus regular insulin (Different insulin types within similar insulin regimens), Outcome 4 Fetal anomaly.

Comparison 1 Lispro versus regular insulin (Different insulin types within similar insulin regimens), Outcome 5 Birth trauma, including shoulder dystocia, nerve palsy, and fracture.
Figuras y tablas -
Analysis 1.5

Comparison 1 Lispro versus regular insulin (Different insulin types within similar insulin regimens), Outcome 5 Birth trauma, including shoulder dystocia, nerve palsy, and fracture.

Comparison 1 Lispro versus regular insulin (Different insulin types within similar insulin regimens), Outcome 6 Vaginal delivery (spontaneous, ventouse, forceps).
Figuras y tablas -
Analysis 1.6

Comparison 1 Lispro versus regular insulin (Different insulin types within similar insulin regimens), Outcome 6 Vaginal delivery (spontaneous, ventouse, forceps).

Comparison 1 Lispro versus regular insulin (Different insulin types within similar insulin regimens), Outcome 7 Blood glucose (mmol/L) week 14 (after lunch).
Figuras y tablas -
Analysis 1.7

Comparison 1 Lispro versus regular insulin (Different insulin types within similar insulin regimens), Outcome 7 Blood glucose (mmol/L) week 14 (after lunch).

Comparison 1 Lispro versus regular insulin (Different insulin types within similar insulin regimens), Outcome 8 Blood glucose (mmol/L) weeks 21, 28, and 34 combined (after lunch).
Figuras y tablas -
Analysis 1.8

Comparison 1 Lispro versus regular insulin (Different insulin types within similar insulin regimens), Outcome 8 Blood glucose (mmol/L) weeks 21, 28, and 34 combined (after lunch).

Comparison 1 Lispro versus regular insulin (Different insulin types within similar insulin regimens), Outcome 9 Postprandial increase of blood glucose (mmol/L) before week 14 (lunch).
Figuras y tablas -
Analysis 1.9

Comparison 1 Lispro versus regular insulin (Different insulin types within similar insulin regimens), Outcome 9 Postprandial increase of blood glucose (mmol/L) before week 14 (lunch).

Comparison 1 Lispro versus regular insulin (Different insulin types within similar insulin regimens), Outcome 10 Postprandial increase of blood glucose (mmol/L) during weeks 21, 28, and 34 combined (lunch).
Figuras y tablas -
Analysis 1.10

Comparison 1 Lispro versus regular insulin (Different insulin types within similar insulin regimens), Outcome 10 Postprandial increase of blood glucose (mmol/L) during weeks 21, 28, and 34 combined (lunch).

Comparison 1 Lispro versus regular insulin (Different insulin types within similar insulin regimens), Outcome 11 Maternal hypoglycaemia and hyperglycaemia episodes requiring intervention.
Figuras y tablas -
Analysis 1.11

Comparison 1 Lispro versus regular insulin (Different insulin types within similar insulin regimens), Outcome 11 Maternal hypoglycaemia and hyperglycaemia episodes requiring intervention.

Comparison 1 Lispro versus regular insulin (Different insulin types within similar insulin regimens), Outcome 12 Retinopathy.
Figuras y tablas -
Analysis 1.12

Comparison 1 Lispro versus regular insulin (Different insulin types within similar insulin regimens), Outcome 12 Retinopathy.

Comparison 1 Lispro versus regular insulin (Different insulin types within similar insulin regimens), Outcome 13 Ventouse delivery.
Figuras y tablas -
Analysis 1.13

Comparison 1 Lispro versus regular insulin (Different insulin types within similar insulin regimens), Outcome 13 Ventouse delivery.

Comparison 2 Human insulin (recombinant deoxyribonucleic acid ‐ Humulin) versus animal insulin (Different insulin types within similar insulin regimens), Outcome 1 Small‐for‐gestational age at delivery.
Figuras y tablas -
Analysis 2.1

Comparison 2 Human insulin (recombinant deoxyribonucleic acid ‐ Humulin) versus animal insulin (Different insulin types within similar insulin regimens), Outcome 1 Small‐for‐gestational age at delivery.

Comparison 2 Human insulin (recombinant deoxyribonucleic acid ‐ Humulin) versus animal insulin (Different insulin types within similar insulin regimens), Outcome 2 Preterm birth (< 37 weeks).
Figuras y tablas -
Analysis 2.2

Comparison 2 Human insulin (recombinant deoxyribonucleic acid ‐ Humulin) versus animal insulin (Different insulin types within similar insulin regimens), Outcome 2 Preterm birth (< 37 weeks).

Comparison 2 Human insulin (recombinant deoxyribonucleic acid ‐ Humulin) versus animal insulin (Different insulin types within similar insulin regimens), Outcome 3 Birthweight centile (%).
Figuras y tablas -
Analysis 2.3

Comparison 2 Human insulin (recombinant deoxyribonucleic acid ‐ Humulin) versus animal insulin (Different insulin types within similar insulin regimens), Outcome 3 Birthweight centile (%).

Comparison 2 Human insulin (recombinant deoxyribonucleic acid ‐ Humulin) versus animal insulin (Different insulin types within similar insulin regimens), Outcome 4 Infant length (cm).
Figuras y tablas -
Analysis 2.4

Comparison 2 Human insulin (recombinant deoxyribonucleic acid ‐ Humulin) versus animal insulin (Different insulin types within similar insulin regimens), Outcome 4 Infant length (cm).

Comparison 2 Human insulin (recombinant deoxyribonucleic acid ‐ Humulin) versus animal insulin (Different insulin types within similar insulin regimens), Outcome 5 Skinfold thickness (mm).
Figuras y tablas -
Analysis 2.5

Comparison 2 Human insulin (recombinant deoxyribonucleic acid ‐ Humulin) versus animal insulin (Different insulin types within similar insulin regimens), Outcome 5 Skinfold thickness (mm).

Comparison 2 Human insulin (recombinant deoxyribonucleic acid ‐ Humulin) versus animal insulin (Different insulin types within similar insulin regimens), Outcome 6 Body weight percentile (%).
Figuras y tablas -
Analysis 2.6

Comparison 2 Human insulin (recombinant deoxyribonucleic acid ‐ Humulin) versus animal insulin (Different insulin types within similar insulin regimens), Outcome 6 Body weight percentile (%).

Comparison 2 Human insulin (recombinant deoxyribonucleic acid ‐ Humulin) versus animal insulin (Different insulin types within similar insulin regimens), Outcome 7 Head circumference (cm).
Figuras y tablas -
Analysis 2.7

Comparison 2 Human insulin (recombinant deoxyribonucleic acid ‐ Humulin) versus animal insulin (Different insulin types within similar insulin regimens), Outcome 7 Head circumference (cm).

Comparison 2 Human insulin (recombinant deoxyribonucleic acid ‐ Humulin) versus animal insulin (Different insulin types within similar insulin regimens), Outcome 8 Macrosomia.
Figuras y tablas -
Analysis 2.8

Comparison 2 Human insulin (recombinant deoxyribonucleic acid ‐ Humulin) versus animal insulin (Different insulin types within similar insulin regimens), Outcome 8 Macrosomia.

Comparison 2 Human insulin (recombinant deoxyribonucleic acid ‐ Humulin) versus animal insulin (Different insulin types within similar insulin regimens), Outcome 9 Insulin requirement during pregnancy (U/kg/24 hour).
Figuras y tablas -
Analysis 2.9

Comparison 2 Human insulin (recombinant deoxyribonucleic acid ‐ Humulin) versus animal insulin (Different insulin types within similar insulin regimens), Outcome 9 Insulin requirement during pregnancy (U/kg/24 hour).

Comparison 2 Human insulin (recombinant deoxyribonucleic acid ‐ Humulin) versus animal insulin (Different insulin types within similar insulin regimens), Outcome 10 Birthweight (g).
Figuras y tablas -
Analysis 2.10

Comparison 2 Human insulin (recombinant deoxyribonucleic acid ‐ Humulin) versus animal insulin (Different insulin types within similar insulin regimens), Outcome 10 Birthweight (g).

Comparison 2 Human insulin (recombinant deoxyribonucleic acid ‐ Humulin) versus animal insulin (Different insulin types within similar insulin regimens), Outcome 11 Infant fasting C‐peptide level at 3 months (pmol/mL).
Figuras y tablas -
Analysis 2.11

Comparison 2 Human insulin (recombinant deoxyribonucleic acid ‐ Humulin) versus animal insulin (Different insulin types within similar insulin regimens), Outcome 11 Infant fasting C‐peptide level at 3 months (pmol/mL).

Comparison 2 Human insulin (recombinant deoxyribonucleic acid ‐ Humulin) versus animal insulin (Different insulin types within similar insulin regimens), Outcome 12 Infant C‐peptide level 1 hour after glucose‐amino acid challenge at 3 months (pmol/mL).
Figuras y tablas -
Analysis 2.12

Comparison 2 Human insulin (recombinant deoxyribonucleic acid ‐ Humulin) versus animal insulin (Different insulin types within similar insulin regimens), Outcome 12 Infant C‐peptide level 1 hour after glucose‐amino acid challenge at 3 months (pmol/mL).

Comparison 2 Human insulin (recombinant deoxyribonucleic acid ‐ Humulin) versus animal insulin (Different insulin types within similar insulin regimens), Outcome 13 Infant glucose fasting level at 3 months (pmol/mL).
Figuras y tablas -
Analysis 2.13

Comparison 2 Human insulin (recombinant deoxyribonucleic acid ‐ Humulin) versus animal insulin (Different insulin types within similar insulin regimens), Outcome 13 Infant glucose fasting level at 3 months (pmol/mL).

Comparison 2 Human insulin (recombinant deoxyribonucleic acid ‐ Humulin) versus animal insulin (Different insulin types within similar insulin regimens), Outcome 14 Infant glucose level 1 hour after glucose‐amino acid challenge at 3 months (pmol/mL).
Figuras y tablas -
Analysis 2.14

Comparison 2 Human insulin (recombinant deoxyribonucleic acid ‐ Humulin) versus animal insulin (Different insulin types within similar insulin regimens), Outcome 14 Infant glucose level 1 hour after glucose‐amino acid challenge at 3 months (pmol/mL).

Comparison 2 Human insulin (recombinant deoxyribonucleic acid ‐ Humulin) versus animal insulin (Different insulin types within similar insulin regimens), Outcome 15 Gestational age at delivery (weeks).
Figuras y tablas -
Analysis 2.15

Comparison 2 Human insulin (recombinant deoxyribonucleic acid ‐ Humulin) versus animal insulin (Different insulin types within similar insulin regimens), Outcome 15 Gestational age at delivery (weeks).

Comparison 2 Human insulin (recombinant deoxyribonucleic acid ‐ Humulin) versus animal insulin (Different insulin types within similar insulin regimens), Outcome 16 Maternal ketonuria.
Figuras y tablas -
Analysis 2.16

Comparison 2 Human insulin (recombinant deoxyribonucleic acid ‐ Humulin) versus animal insulin (Different insulin types within similar insulin regimens), Outcome 16 Maternal ketonuria.

Comparison 3 Pre‐mixed insulin (70 NPH/30 REG) versus self‐mixed split dose insulin (Different insulin regimens with similar insulin types used within the regimen), Outcome 1 Macrosomia.
Figuras y tablas -
Analysis 3.1

Comparison 3 Pre‐mixed insulin (70 NPH/30 REG) versus self‐mixed split dose insulin (Different insulin regimens with similar insulin types used within the regimen), Outcome 1 Macrosomia.

Comparison 3 Pre‐mixed insulin (70 NPH/30 REG) versus self‐mixed split dose insulin (Different insulin regimens with similar insulin types used within the regimen), Outcome 2 Caesarean section.
Figuras y tablas -
Analysis 3.2

Comparison 3 Pre‐mixed insulin (70 NPH/30 REG) versus self‐mixed split dose insulin (Different insulin regimens with similar insulin types used within the regimen), Outcome 2 Caesarean section.

Comparison 3 Pre‐mixed insulin (70 NPH/30 REG) versus self‐mixed split dose insulin (Different insulin regimens with similar insulin types used within the regimen), Outcome 3 Antepartum capillary glucose measurement (mg/dL), 2 hours postprandial (after lunch).
Figuras y tablas -
Analysis 3.3

Comparison 3 Pre‐mixed insulin (70 NPH/30 REG) versus self‐mixed split dose insulin (Different insulin regimens with similar insulin types used within the regimen), Outcome 3 Antepartum capillary glucose measurement (mg/dL), 2 hours postprandial (after lunch).

Comparison 3 Pre‐mixed insulin (70 NPH/30 REG) versus self‐mixed split dose insulin (Different insulin regimens with similar insulin types used within the regimen), Outcome 4 Postpartum infection: endometritis.
Figuras y tablas -
Analysis 3.4

Comparison 3 Pre‐mixed insulin (70 NPH/30 REG) versus self‐mixed split dose insulin (Different insulin regimens with similar insulin types used within the regimen), Outcome 4 Postpartum infection: endometritis.

Comparison 3 Pre‐mixed insulin (70 NPH/30 REG) versus self‐mixed split dose insulin (Different insulin regimens with similar insulin types used within the regimen), Outcome 5 Use of healthcare resources (maternal hospital days).
Figuras y tablas -
Analysis 3.5

Comparison 3 Pre‐mixed insulin (70 NPH/30 REG) versus self‐mixed split dose insulin (Different insulin regimens with similar insulin types used within the regimen), Outcome 5 Use of healthcare resources (maternal hospital days).

Comparison 3 Pre‐mixed insulin (70 NPH/30 REG) versus self‐mixed split dose insulin (Different insulin regimens with similar insulin types used within the regimen), Outcome 6 Birthweight (g).
Figuras y tablas -
Analysis 3.6

Comparison 3 Pre‐mixed insulin (70 NPH/30 REG) versus self‐mixed split dose insulin (Different insulin regimens with similar insulin types used within the regimen), Outcome 6 Birthweight (g).

Comparison 3 Pre‐mixed insulin (70 NPH/30 REG) versus self‐mixed split dose insulin (Different insulin regimens with similar insulin types used within the regimen), Outcome 7 Compliance score.
Figuras y tablas -
Analysis 3.7

Comparison 3 Pre‐mixed insulin (70 NPH/30 REG) versus self‐mixed split dose insulin (Different insulin regimens with similar insulin types used within the regimen), Outcome 7 Compliance score.

Comparison 4 Insulin injected with a Novolin pen versus insulin injected with a needle (syringe) (Different insulin regimens with similar insulin types used within the regimen), Outcome 1 Macrosomia.
Figuras y tablas -
Analysis 4.1

Comparison 4 Insulin injected with a Novolin pen versus insulin injected with a needle (syringe) (Different insulin regimens with similar insulin types used within the regimen), Outcome 1 Macrosomia.

Comparison 4 Insulin injected with a Novolin pen versus insulin injected with a needle (syringe) (Different insulin regimens with similar insulin types used within the regimen), Outcome 2 Caesarean section.
Figuras y tablas -
Analysis 4.2

Comparison 4 Insulin injected with a Novolin pen versus insulin injected with a needle (syringe) (Different insulin regimens with similar insulin types used within the regimen), Outcome 2 Caesarean section.

Comparison 4 Insulin injected with a Novolin pen versus insulin injected with a needle (syringe) (Different insulin regimens with similar insulin types used within the regimen), Outcome 3 Antepartum capillary glucose measurement (mg/dL) 2 hours postprandial (after lunch).
Figuras y tablas -
Analysis 4.3

Comparison 4 Insulin injected with a Novolin pen versus insulin injected with a needle (syringe) (Different insulin regimens with similar insulin types used within the regimen), Outcome 3 Antepartum capillary glucose measurement (mg/dL) 2 hours postprandial (after lunch).

Comparison 4 Insulin injected with a Novolin pen versus insulin injected with a needle (syringe) (Different insulin regimens with similar insulin types used within the regimen), Outcome 4 Postpartum infection: endometritis.
Figuras y tablas -
Analysis 4.4

Comparison 4 Insulin injected with a Novolin pen versus insulin injected with a needle (syringe) (Different insulin regimens with similar insulin types used within the regimen), Outcome 4 Postpartum infection: endometritis.

Comparison 4 Insulin injected with a Novolin pen versus insulin injected with a needle (syringe) (Different insulin regimens with similar insulin types used within the regimen), Outcome 5 Use of healthcare resources (maternal hospital days).
Figuras y tablas -
Analysis 4.5

Comparison 4 Insulin injected with a Novolin pen versus insulin injected with a needle (syringe) (Different insulin regimens with similar insulin types used within the regimen), Outcome 5 Use of healthcare resources (maternal hospital days).

Comparison 4 Insulin injected with a Novolin pen versus insulin injected with a needle (syringe) (Different insulin regimens with similar insulin types used within the regimen), Outcome 6 Birthweight (g).
Figuras y tablas -
Analysis 4.6

Comparison 4 Insulin injected with a Novolin pen versus insulin injected with a needle (syringe) (Different insulin regimens with similar insulin types used within the regimen), Outcome 6 Birthweight (g).

Comparison 4 Insulin injected with a Novolin pen versus insulin injected with a needle (syringe) (Different insulin regimens with similar insulin types used within the regimen), Outcome 7 Compliance score.
Figuras y tablas -
Analysis 4.7

Comparison 4 Insulin injected with a Novolin pen versus insulin injected with a needle (syringe) (Different insulin regimens with similar insulin types used within the regimen), Outcome 7 Compliance score.

Comparison 5 Insulin Aspart + NPH insulin versus Human insulin + NPH insulin (Different insulin types within similar insulin regimens), Outcome 1 A1c (%) third trimester visit.
Figuras y tablas -
Analysis 5.1

Comparison 5 Insulin Aspart + NPH insulin versus Human insulin + NPH insulin (Different insulin types within similar insulin regimens), Outcome 1 A1c (%) third trimester visit.

Comparison 5 Insulin Aspart + NPH insulin versus Human insulin + NPH insulin (Different insulin types within similar insulin regimens), Outcome 2 Average plasma glucose (mmol/L) third trimester visit.
Figuras y tablas -
Analysis 5.2

Comparison 5 Insulin Aspart + NPH insulin versus Human insulin + NPH insulin (Different insulin types within similar insulin regimens), Outcome 2 Average plasma glucose (mmol/L) third trimester visit.

Comparison 5 Insulin Aspart + NPH insulin versus Human insulin + NPH insulin (Different insulin types within similar insulin regimens), Outcome 3 Maternal hypoglycaemic episodes.
Figuras y tablas -
Analysis 5.3

Comparison 5 Insulin Aspart + NPH insulin versus Human insulin + NPH insulin (Different insulin types within similar insulin regimens), Outcome 3 Maternal hypoglycaemic episodes.

Comparison 6 Insulin Detemir + prandial insulin Aspart versus NPH insulin + prandial insulin Aspart (Different insulin types within similar insulin regimens), Outcome 1 Major congenital malformation.
Figuras y tablas -
Analysis 6.1

Comparison 6 Insulin Detemir + prandial insulin Aspart versus NPH insulin + prandial insulin Aspart (Different insulin types within similar insulin regimens), Outcome 1 Major congenital malformation.

Comparison 6 Insulin Detemir + prandial insulin Aspart versus NPH insulin + prandial insulin Aspart (Different insulin types within similar insulin regimens), Outcome 2 Major congenital malformation.
Figuras y tablas -
Analysis 6.2

Comparison 6 Insulin Detemir + prandial insulin Aspart versus NPH insulin + prandial insulin Aspart (Different insulin types within similar insulin regimens), Outcome 2 Major congenital malformation.

Comparison 6 Insulin Detemir + prandial insulin Aspart versus NPH insulin + prandial insulin Aspart (Different insulin types within similar insulin regimens), Outcome 3 Minor congenital malformation.
Figuras y tablas -
Analysis 6.3

Comparison 6 Insulin Detemir + prandial insulin Aspart versus NPH insulin + prandial insulin Aspart (Different insulin types within similar insulin regimens), Outcome 3 Minor congenital malformation.

Comparison 6 Insulin Detemir + prandial insulin Aspart versus NPH insulin + prandial insulin Aspart (Different insulin types within similar insulin regimens), Outcome 4 Minor congenital malformation.
Figuras y tablas -
Analysis 6.4

Comparison 6 Insulin Detemir + prandial insulin Aspart versus NPH insulin + prandial insulin Aspart (Different insulin types within similar insulin regimens), Outcome 4 Minor congenital malformation.

Summary of findings for the main comparison. Lispro versus regular insulin (Different insulin types within similar insulin regimens)

Lispro versus regular insulin (Different insulin types within similar insulin regimens)

Patient or population: pregnant women with pre‐existing diabetes
Setting: four centres in Sweden. The Departments of Obstetrics and Gynaecology in Huddinge Hospital, Karolinska Hospital, Södersjukhuset in Stockholm, and Örebro Regional Hospital
Intervention: Lispro
Comparison: regular insulin

Outcomes

Anticipated absolute effects* (95% CI)

Relative effect
(95% CI)

№ of participants
(studies)

Quality of the evidence
(GRADE)

Comments

Risk with regular insulin

Risk with Lispro

Macrosomia

(0 studies)

Not reported

Perinatal death

Study population

not estimable

33
(1 RCT)

⊕⊝⊝⊝
VERY LOW 1, 2, 3

0 per 1000

0 per 1000
(0 to 0)

Pre‐eclampsia

Study population

RR 0.68
(0.35 to 1.30)

33
(1 RCT)

⊕⊝⊝⊝
VERY LOW 1, 3, 4, 5

647 per 1000

440 per 1000
(226 to 841)

Caesarean section

Study population

RR 0.59
(0.25 to 1.39)

33
(1 RCT)

⊕⊝⊝⊝
VERY LOW 1, 3, 4, 5

529 per 1000

312 per 1000
(132 to 736)

Fetal anomaly

Study population

RR 0.35
(0.02 to 8.08)

33
(1 RCT)

⊕⊝⊝⊝
VERY LOW 1, 3, 4, 5

59 per 1000

21 per 1000
(1 to 475)

Birth trauma, including shoulder dystocia, nerve palsy, and fracture

Study population

Not estimable

33
(1 RCT)

⊕⊝⊝⊝
VERY LOW 1, 2, 3

0 per 1000

0 per 1000
(0 to 0)

Composite outcome measure of neonatal morbidity

(0 studies)

Not reported

*The risk in the intervention group (and its 95% confidence interval) is based on the assumed risk in the comparison group and the relative effect of the intervention (and its 95% CI).

CI: Confidence interval; RR: Risk ratio; OR: Odds ratio;

GRADE Working Group grades of evidence
High quality: We are very confident that the true effect lies close to that of the estimate of the effect
Moderate quality: We are moderately confident in the effect estimate: The true effect is likely to be close to the estimate of the effect, but there is a possibility that it is substantially different
Low quality: Our confidence in the effect estimate is limited: The true effect may be substantially different from the estimate of the effect
Very low quality: We have very little confidence in the effect estimate: The true effect is likely to be substantially different from the estimate of effect

1 High or unclear risk of bias for allocation concealment, blinding of participants and personnel, blinding of outcome assessment, incomplete outcome data, selective outcome reporting, and other biases

2 Small sample size and no events

3 One study with design limitations

4 Very wide 95% confidence intervals crossing the line of no effect

5 Small sample size with few events

Figuras y tablas -
Summary of findings for the main comparison. Lispro versus regular insulin (Different insulin types within similar insulin regimens)
Summary of findings 2. Human insulin versus animal insulin (Different insulin types within similar insulin regimens)

Human insulin versus animal insulin (Different insulin types within similar insulin regimens)

Patient or population: pregnant women with pre‐existing diabetes
Setting: The Children's Hospital of San Francisco and Cornell University Medical College, New York
Intervention: human insulin (recombinant deoxyribonucleic acid ‐ Humulin)
Comparison: animal insulin

Outcomes

Anticipated absolute effects* (95% CI)

Relative effect
(95% CI)

№ of participants
(studies)

Quality of the evidence
(GRADE)

Comments

Risk with animal insulin

Risk with human insulin (Humulin)

Macrosomia

Study population

RR 0.22
(0.01 to 4.30)

42
(1 RCT)

⊕⊝⊝⊝
VERY LOW 1 2 3 4

91 per 1000

20 per 1000
(1 to 391)

Perinatal death

(0 studies)

Not reported

Pre‐eclampsia

(0 studies)

Not reported

Caesarean section

(0 studies)

Not reported

Fetal anomaly

(0 studies)

Not reported

Birth trauma including shoulder dystocia, nerve palsy, and fracture

(0 studies)

Not reported

Composite outcome measure of neonatal morbidity

(0 studies)

Not reported

*The risk in the intervention group (and its 95% confidence interval) is based on the assumed risk in the comparison group and the relative effect of the intervention (and its 95% CI).

CI: Confidence interval; RR: Risk ratio; OR: Odds ratio;

GRADE Working Group grades of evidence
High quality: We are very confident that the true effect lies close to that of the estimate of the effect
Moderate quality: We are moderately confident in the effect estimate: The true effect is likely to be close to the estimate of the effect, but there is a possibility that it is substantially different
Low quality: Our confidence in the effect estimate is limited: The true effect may be substantially different from the estimate of the effect
Very low quality: We have very little confidence in the effect estimate: The true effect is likely to be substantially different from the estimate of effect

1 Risk of bias was high or unclear for random sequence generation, allocation concealment, blinding of participants and personnel, blinding of outcome assessment, incomplete outcome data, and selective outcome reporting

2 One study with serious design limitations including lack of blinding for allocation concealment

3 Very wide 95% confidence intervals crossing the line of no effect

4 Small sample size and few events

Figuras y tablas -
Summary of findings 2. Human insulin versus animal insulin (Different insulin types within similar insulin regimens)
Summary of findings 3. Pre‐mixed insulin (70 NPH/30 REG) versus self‐mixed split dose insulin (Different insulin regimens with similar insulin types used within the regimen)

Pre‐mixed insulin (70 NPH/30 REG) versus self‐mixed split dose insulin (Different insulin regimens with similar insulin types used within the regimen)

Patient or population: pregnant women with pre‐existing diabetes
Setting: University of Mississippi Medical Centre, USA
Intervention: pre‐mixed insulin (70 NPH/30 REG)
Comparison: self‐mixed split dose insulin

Outcomes

Anticipated absolute effects* (95% CI)

Relative effect
(95% CI)

№ of participants
(studies)

Quality of the evidence
(GRADE)

Comments

Risk with self‐mixed split dose insulin

Risk with pre‐mixed insulin (70 NPH/30 REG)

Macrosomia

Study population

RR 0.49
(0.09 to 2.54)

93
(1 RCT)

⊕⊝⊝⊝
VERY LOW 1, 2, 3

87 per 1000

43 per 1000
(8 to 221)

Perinatal death

(0 studies)

Not reported

Pre‐eclampsia

(0 studies)

Not reported

Caesarean section 4

Study population

RR 0.57
(0.25 to 1.32)

93
(1 RCT)

⊕⊝⊝⊝
VERY LOW 1 2 3

261 per 1000

149 per 1000
(65 to 344)

Fetal anomaly

(0 studies)

Not reported

Birth trauma including shoulder dystocia, nerve palsy, or fracture

(0 studies)

Not reported

Composite outcome measure of neonatal morbidity

(0 studies)

Not reported

*The risk in the intervention group (and its 95% confidence interval) is based on the assumed risk in the comparison group and the relative effect of the intervention (and its 95% CI).

CI: Confidence interval; RR: Risk ratio; OR: Odds ratio;

GRADE Working Group grades of evidence
High quality: We are very confident that the true effect lies close to that of the estimate of the effect
Moderate quality: We are moderately confident in the effect estimate: The true effect is likely to be close to the estimate of the effect, but there is a possibility that it is substantially different
Low quality: Our confidence in the effect estimate is limited: The true effect may be substantially different from the estimate of the effect
Very low quality: We have very little confidence in the effect estimate: The true effect is likely to be substantially different from the estimate of effect

1 Very wide 95% confidence intervals crossing the line of no effect

2 Small sample size and few events

3 One study with serious design limitations

4 Caesarean section for cephalo‐pelvic disproportion

Figuras y tablas -
Summary of findings 3. Pre‐mixed insulin (70 NPH/30 REG) versus self‐mixed split dose insulin (Different insulin regimens with similar insulin types used within the regimen)
Summary of findings 4. Insulin injected with a Novolin pen versus insulin injected with a needle or syringe (Different insulin regimens with similar insulin types used within the regimen)

Insulin injected with a Novolin pen versus insulin injected with a needle or syringe (Different insulin regimens with similar insulin types used within the regimen)

Patient or population: pregnant women with pre‐existing diabetes
Setting: University of Mississippi Medical Centre, USA
Intervention: insulin injected with a Novolin pen
Comparison: insulin injected with a needle or syringe

Outcomes

Anticipated absolute effects* (95% CI)

Relative effect
(95% CI)

№ of participants
(studies)

Quality of the evidence
(GRADE)

Comments

Risk with insulin injected with a needle or syringe

Risk with insulin injected with a Novolin pen

Macrosomia

Study population

RR 0.21
(0.03 to 1.76)

93
(1 RCT)

⊕⊝⊝⊝
VERY LOW 1, 2 ,3

104 per 1000

22 per 1000
(3 to 183)

Perinatal death

(0 studies)

Not reported

Pre‐eclampsia

(0 studies)

Not reported

Caesarean section 4

Study population

RR 0.38
(0.15 to 0.97)

93
(1 RCT)

⊕⊝⊝⊝
VERY LOW 1, 2, 3

292 per 1000

111 per 1000
(44 to 283)

Fetal anomaly

(0 studies)

Not reported

Birth trauma including shoulder dystocia, nerve palsy, or fracture

(0 studies)

Not reported

Composite outcome measure of neonatal morbidity

(0 studies)

Not reported

*The risk in the intervention group (and its 95% confidence interval) is based on the assumed risk in the comparison group and the relative effect of the intervention (and its 95% CI).

CI: Confidence interval; RR: Risk ratio; OR: Odds ratio;

GRADE Working Group grades of evidence
High quality: We are very confident that the true effect lies close to that of the estimate of the effect
Moderate quality: We are moderately confident in the effect estimate: The true effect is likely to be close to the estimate of the effect, but there is a possibility that it is substantially different
Low quality: Our confidence in the effect estimate is limited: The true effect may be substantially different from the estimate of the effect
Very low quality: We have very little confidence in the effect estimate: The true effect is likely to be substantially different from the estimate of effect

1 Very wide 95% confidence intervals crossing the line of no effect

2 Small sample size with few events

3 One study with serious design limitations

4 Caesarean section for cephalo‐pelvic disproportion

Figuras y tablas -
Summary of findings 4. Insulin injected with a Novolin pen versus insulin injected with a needle or syringe (Different insulin regimens with similar insulin types used within the regimen)
Summary of findings 5. Insulin Aspart (+ NPH) compared to human insulin (+ NPH insulin) for pregnant women with pre‐existing diabetes (Different insulin types within similar insulin regimens)

Insulin Aspart (+ NPH) compared to human insulin (+ NPH) for pregnant women with pre‐existing diabetes (Different insulin types within similar insulin regimens)

Patient or population: pregnant women with pre‐existing diabetes
Setting: 63 different sites in 18 countries
Intervention: insulin Aspart (+ NPH insulin)
Comparison: human insulin (+ NPH insulin)

Outcomes

Anticipated absolute effects* (95% CI)

Relative effect
(95% CI)

№ of participants
(studies)

Quality of the evidence
(GRADE)

Comments

Risk with human insulin (+ NPH)

Risk with insulin Aspart (+ NPH)

Macrosomia

Not reported

Perinatal death

Not reported

Pre‐eclampsia

Not reported

Caesarean section

Not reported

Fetal anomaly

Not reported

Birth trauma including shoulder dystocia, nerve palsy and fracture

Not reported

Composite outcome measure of neonatal morbidity

Not reported

*The risk in the intervention group (and its 95% confidence interval) is based on the assumed risk in the comparison group and the relative effect of the intervention (and its 95% CI).

CI: Confidence interval; RR: Risk ratio; OR: Odds ratio;

GRADE Working Group grades of evidence
High quality: We are very confident that the true effect lies close to that of the estimate of the effect
Moderate quality: We are moderately confident in the effect estimate: The true effect is likely to be close to the estimate of the effect, but there is a possibility that it is substantially different
Low quality: Our confidence in the effect estimate is limited: The true effect may be substantially different from the estimate of the effect
Very low quality: We have very little confidence in the effect estimate: The true effect is likely to be substantially different from the estimate of effect

Figuras y tablas -
Summary of findings 5. Insulin Aspart (+ NPH) compared to human insulin (+ NPH insulin) for pregnant women with pre‐existing diabetes (Different insulin types within similar insulin regimens)
Summary of findings 6. Insulin Detemir + prandial insulin Aspart versus NPH insulin + prandial insulin Aspart (Different insulin types within similar insulin regimens)

Insulin Detemir + prandial insulin Aspart versus NPH insulin + prandial insulin Aspart (Different insulin types within similar insulin regimens)

Patient or population: pregnant women with pre‐existing diabetes
Setting: 79 sites in 17 countries, mainly within Europe
Intervention: insulin Detemir (+ Aspart)
Comparison: NPH (+ Aspart)

Outcomes

Anticipated absolute effects* (95% CI)

Relative effect
(95% CI)

№ of participants
(studies)

Quality of the evidence
(GRADE)

Comments

Risk with NPH (+ Aspart)

Risk with insulin Detemir (+ Aspart)

Macrosomia

(0 studies)

Not reported

Perinatal death

(0 studies)

Not reported

Pre‐eclampsia

(0 studies)

Not reported

Caesarean section

(0 studies)

Not reported

Fetal anomaly (major) 1

Study population

RR 3.15
(0.33 to 29.67)

162
(1 RCT)

⊕⊝⊝⊝
VERY LOW 2, 3, 4, 5

12 per 1000

38 per 1000
(4 to 357)

Birth trauma including shoulder dystocia, nerve palsy, or fracture

(0 studies)

Not reported

Composite outcome measure of neonatal morbidity

(0 studies)

Not reported

*The risk in the intervention group (and its 95% confidence interval) is based on the assumed risk in the comparison group and the relative effect of the intervention (and its 95% CI).

CI: Confidence interval; RR: Risk ratio; OR: Odds ratio;

GRADE Working Group grades of evidence
High quality: We are very confident that the true effect lies close to that of the estimate of the effect
Moderate quality: We are moderately confident in the effect estimate: The true effect is likely to be close to the estimate of the effect, but there is a possibility that it is substantially different
Low quality: Our confidence in the effect estimate is limited: The true effect may be substantially different from the estimate of the effect
Very low quality: We have very little confidence in the effect estimate: The true effect is likely to be substantially different from the estimate of effect

1 Assessed by an expert who was blinded to the outcome

2 One study with design limitations

3 Very wide 95% confidence intervals crossing the line of no effect

4 Large effect estimate

5 Small sample size with few events

Figuras y tablas -
Summary of findings 6. Insulin Detemir + prandial insulin Aspart versus NPH insulin + prandial insulin Aspart (Different insulin types within similar insulin regimens)
Comparison 1. Lispro versus regular insulin (Different insulin types within similar insulin regimens)

Outcome or subgroup title

No. of studies

No. of participants

Statistical method

Effect size

1 Perinatal death Show forest plot

1

33

Risk Ratio (M‐H, Fixed, 95% CI)

0.0 [0.0, 0.0]

2 Caesarean section Show forest plot

1

33

Risk Ratio (M‐H, Fixed, 95% CI)

0.59 [0.25, 1.39]

3 Pregnancy‐induced hypertension and pre‐eclampsia Show forest plot

1

33

Risk Ratio (M‐H, Fixed, 95% CI)

0.68 [0.35, 1.30]

4 Fetal anomaly Show forest plot

1

33

Risk Ratio (M‐H, Fixed, 95% CI)

0.35 [0.02, 8.08]

5 Birth trauma, including shoulder dystocia, nerve palsy, and fracture Show forest plot

1

33

Risk Ratio (M‐H, Fixed, 95% CI)

0.0 [0.0, 0.0]

6 Vaginal delivery (spontaneous, ventouse, forceps) Show forest plot

1

33

Risk Ratio (M‐H, Fixed, 95% CI)

1.46 [0.80, 2.67]

7 Blood glucose (mmol/L) week 14 (after lunch) Show forest plot

1

33

Mean Difference (IV, Fixed, 95% CI)

‐1.09 [‐3.60, 1.42]

8 Blood glucose (mmol/L) weeks 21, 28, and 34 combined (after lunch) Show forest plot

1

33

Mean Difference (IV, Fixed, 95% CI)

‐0.04 [‐2.10, 2.02]

9 Postprandial increase of blood glucose (mmol/L) before week 14 (lunch) Show forest plot

1

33

Mean Difference (IV, Fixed, 95% CI)

1.0 [‐1.52, 3.52]

10 Postprandial increase of blood glucose (mmol/L) during weeks 21, 28, and 34 combined (lunch) Show forest plot

1

33

Mean Difference (IV, Fixed, 95% CI)

0.10 [‐2.12, 2.32]

11 Maternal hypoglycaemia and hyperglycaemia episodes requiring intervention Show forest plot

1

33

Risk Ratio (M‐H, Fixed, 95% CI)

0.21 [0.01, 4.10]

12 Retinopathy Show forest plot

1

33

Risk Ratio (M‐H, Fixed, 95% CI)

1.06 [0.17, 6.67]

13 Ventouse delivery Show forest plot

1

33

Risk Ratio (M‐H, Fixed, 95% CI)

3.19 [0.37, 27.58]

Figuras y tablas -
Comparison 1. Lispro versus regular insulin (Different insulin types within similar insulin regimens)
Comparison 2. Human insulin (recombinant deoxyribonucleic acid ‐ Humulin) versus animal insulin (Different insulin types within similar insulin regimens)

Outcome or subgroup title

No. of studies

No. of participants

Statistical method

Effect size

1 Small‐for‐gestational age at delivery Show forest plot

1

42

Risk Ratio (M‐H, Fixed, 95% CI)

0.0 [0.0, 0.0]

2 Preterm birth (< 37 weeks) Show forest plot

1

42

Risk Ratio (M‐H, Fixed, 95% CI)

7.67 [0.42, 139.83]

3 Birthweight centile (%) Show forest plot

1

42

Mean Difference (IV, Fixed, 95% CI)

‐6.70 [‐23.64, 10.24]

4 Infant length (cm) Show forest plot

1

42

Mean Difference (IV, Fixed, 95% CI)

‐3.30 [‐6.74, 0.14]

5 Skinfold thickness (mm) Show forest plot

1

42

Mean Difference (IV, Fixed, 95% CI)

‐4.10 [‐13.28, 5.08]

6 Body weight percentile (%) Show forest plot

1

42

Mean Difference (IV, Fixed, 95% CI)

‐6.70 [‐23.74, 10.34]

7 Head circumference (cm) Show forest plot

1

42

Mean Difference (IV, Fixed, 95% CI)

‐5.10 [‐9.52, ‐0.68]

8 Macrosomia Show forest plot

1

42

Risk Ratio (M‐H, Fixed, 95% CI)

0.22 [0.01, 4.30]

9 Insulin requirement during pregnancy (U/kg/24 hour) Show forest plot

1

42

Mean Difference (IV, Fixed, 95% CI)

‐0.33 [‐0.45, ‐0.21]

10 Birthweight (g) Show forest plot

1

42

Mean Difference (IV, Fixed, 95% CI)

‐591.0 [‐1066.27, ‐115.73]

11 Infant fasting C‐peptide level at 3 months (pmol/mL) Show forest plot

1

42

Mean Difference (IV, Fixed, 95% CI)

‐0.07 [‐0.13, ‐0.01]

12 Infant C‐peptide level 1 hour after glucose‐amino acid challenge at 3 months (pmol/mL) Show forest plot

1

42

Mean Difference (IV, Fixed, 95% CI)

‐0.11 [‐0.19, ‐0.03]

13 Infant glucose fasting level at 3 months (pmol/mL) Show forest plot

1

42

Mean Difference (IV, Fixed, 95% CI)

‐0.20 [‐0.62, 0.22]

14 Infant glucose level 1 hour after glucose‐amino acid challenge at 3 months (pmol/mL) Show forest plot

1

42

Mean Difference (IV, Fixed, 95% CI)

0.5 [‐0.04, 1.04]

15 Gestational age at delivery (weeks) Show forest plot

1

42

Mean Difference (IV, Fixed, 95% CI)

0.5 [‐3.70, 4.70]

16 Maternal ketonuria Show forest plot

1

42

Risk Ratio (M‐H, Fixed, 95% CI)

0.37 [0.08, 1.61]

Figuras y tablas -
Comparison 2. Human insulin (recombinant deoxyribonucleic acid ‐ Humulin) versus animal insulin (Different insulin types within similar insulin regimens)
Comparison 3. Pre‐mixed insulin (70 NPH/30 REG) versus self‐mixed split dose insulin (Different insulin regimens with similar insulin types used within the regimen)

Outcome or subgroup title

No. of studies

No. of participants

Statistical method

Effect size

1 Macrosomia Show forest plot

1

93

Risk Ratio (M‐H, Fixed, 95% CI)

0.49 [0.09, 2.54]

2 Caesarean section Show forest plot

1

93

Risk Ratio (M‐H, Fixed, 95% CI)

0.57 [0.25, 1.32]

3 Antepartum capillary glucose measurement (mg/dL), 2 hours postprandial (after lunch) Show forest plot

1

10218

Mean Difference (IV, Fixed, 95% CI)

‐11.25 [‐12.55, ‐9.95]

4 Postpartum infection: endometritis Show forest plot

1

93

Risk Ratio (M‐H, Fixed, 95% CI)

0.52 [0.26, 1.04]

5 Use of healthcare resources (maternal hospital days) Show forest plot

1

94

Mean Difference (IV, Fixed, 95% CI)

‐0.50 [‐1.40, 0.41]

6 Birthweight (g) Show forest plot

1

93

Mean Difference (IV, Fixed, 95% CI)

‐116.56 [‐391.81, 158.69]

7 Compliance score Show forest plot

1

49

Mean Difference (IV, Fixed, 95% CI)

0.0 [‐0.87, 0.87]

Figuras y tablas -
Comparison 3. Pre‐mixed insulin (70 NPH/30 REG) versus self‐mixed split dose insulin (Different insulin regimens with similar insulin types used within the regimen)
Comparison 4. Insulin injected with a Novolin pen versus insulin injected with a needle (syringe) (Different insulin regimens with similar insulin types used within the regimen)

Outcome or subgroup title

No. of studies

No. of participants

Statistical method

Effect size

1 Macrosomia Show forest plot

1

93

Risk Ratio (M‐H, Fixed, 95% CI)

0.21 [0.03, 1.76]

2 Caesarean section Show forest plot

1

93

Risk Ratio (M‐H, Fixed, 95% CI)

0.38 [0.15, 0.97]

3 Antepartum capillary glucose measurement (mg/dL) 2 hours postprandial (after lunch) Show forest plot

1

10218

Mean Difference (IV, Fixed, 95% CI)

‐7.23 [‐8.51, ‐5.95]

4 Postpartum infection: endometritis Show forest plot

1

93

Risk Ratio (M‐H, Fixed, 95% CI)

0.56 [0.28, 1.14]

5 Use of healthcare resources (maternal hospital days) Show forest plot

1

93

Mean Difference (IV, Fixed, 95% CI)

‐0.56 [‐1.45, 0.33]

6 Birthweight (g) Show forest plot

1

93

Mean Difference (IV, Fixed, 95% CI)

‐162.36 [‐438.25, 113.53]

7 Compliance score Show forest plot

1

93

Mean Difference (IV, Fixed, 95% CI)

‐0.21 [‐0.83, 0.41]

Figuras y tablas -
Comparison 4. Insulin injected with a Novolin pen versus insulin injected with a needle (syringe) (Different insulin regimens with similar insulin types used within the regimen)
Comparison 5. Insulin Aspart + NPH insulin versus Human insulin + NPH insulin (Different insulin types within similar insulin regimens)

Outcome or subgroup title

No. of studies

No. of participants

Statistical method

Effect size

1 A1c (%) third trimester visit Show forest plot

1

223

Mean Difference (IV, Fixed, 95% CI)

‐0.10 [‐0.28, 0.08]

2 Average plasma glucose (mmol/L) third trimester visit Show forest plot

1

223

Mean Difference (IV, Fixed, 95% CI)

‐0.20 [‐0.53, 0.13]

3 Maternal hypoglycaemic episodes Show forest plot

1

223

Risk Ratio (M‐H, Fixed, 95% CI)

1.06 [0.99, 1.14]

Figuras y tablas -
Comparison 5. Insulin Aspart + NPH insulin versus Human insulin + NPH insulin (Different insulin types within similar insulin regimens)
Comparison 6. Insulin Detemir + prandial insulin Aspart versus NPH insulin + prandial insulin Aspart (Different insulin types within similar insulin regimens)

Outcome or subgroup title

No. of studies

No. of participants

Statistical method

Effect size

1 Major congenital malformation Show forest plot

1

162

Risk Ratio (M‐H, Fixed, 95% CI)

3.15 [0.33, 29.67]

2 Major congenital malformation Show forest plot

1

162

Risk Ratio (M‐H, Fixed, 95% CI)

2.10 [0.19, 22.72]

3 Minor congenital malformation Show forest plot

1

162

Risk Ratio (M‐H, Fixed, 95% CI)

0.35 [0.01, 8.47]

4 Minor congenital malformation Show forest plot

1

162

Risk Ratio (M‐H, Fixed, 95% CI)

1.05 [0.22, 5.05]

Figuras y tablas -
Comparison 6. Insulin Detemir + prandial insulin Aspart versus NPH insulin + prandial insulin Aspart (Different insulin types within similar insulin regimens)