بررسی انواع و رژیمهای متفاوت انسولین برای زنان بارداری که از قبل مبتلا به دیابت هستند
چکیده
پیشینه
میزان نیاز به انسولین میتواند در طول بارداری تغییر کند و درمان بهینه برای دیابت از پیش موجود (pre‐existing) نامشخص است. رژیمهای انسولین (برای مثال از طریق سرنگ، قلم) و انواع انسولین (مانند انسولین سریعالاثر، انسولین انسانی) مختلفی وجود دارند.
اهداف
ارزیابی تاثیرات انواع مختلف انسولین و رژیمهای متفاوت انسولین در زنان بارداری که از قبل مبتلا به دیابت نوع 1 یا نوع 2 هستند.
روشهای جستوجو
ما در پایگاه ثبت کارآزماییهای گروه بارداری و زایمان در کاکرین (30 اکتبر 2016)؛ ClinicalTrials.gov (17 اکتبر 2016)، پلتفرم بینالمللی پایگاه ثبت کارآزماییهای بالینی سازمان جهانی بهداشت (ICTRP؛ 17 اکتبر 2016) و فهرست منابع مطالعات بازیابی شده جستوجو کردیم.
معیارهای انتخاب
کارآزماییهای تصادفیسازی و کنترل شدهای (randomised controlled trials; RCTs) را وارد کردیم که انواع و رژیمهای مختلف انسولین را در زنان بارداری که از قبل مبتلا به دیابت هستند، مقایسه کرده بودند.
برای وارد کردن RCTهای خوشهای برنامهریزی کرده بودیم، اما هیچ موردی شناسایی نشد. کارآزماییهای شبه‐تصادفیسازی و کنترل شده و کارآزماییهای متقاطع (cross‐over) را از مرور خارج کردیم. مطالعات منتشر شده به شکل چکیده را وارد کردیم و در صورت امکان با نویسندگان برای دریافت جزئیات بیشتر تماس گرفتیم. چکیدههای کنفرانسها با انتشارات کامل جایگزین شدند.
گردآوری و تجزیهوتحلیل دادهها
دو نویسنده مرور بهطور مستقل از هم کارآزماییها را برای ورود ارزیابی کردند، استخراج دادهها را انجام دادند، خطر سوگیری (bias) را ارزیابی و دقت آنها را بررسی کردند. کیفیت شواهد را با استفاده از رویکرد درجهبندی توصیه، ارزیابی، توسعه و ارزشیابی (GRADE) ارزیابی کردیم.
نتایج اصلی
یافتههای این مرور، مبتنی بر شواهد با کیفیت بسیار پائین از تخمینهای یک کارآزمایی واحد با حجم نمونه کوچک و فواصل اطمینان (CI) وسیع بود که برخی از آنها خط عدم تاثیر را قطع کردند؛ بسیاری از پیامدهای از پیش تعیین شده گزارش نشده بودند. بنابراین، باید با احتیاط تفسیر میشدند. ما پنج کارآزمایی را وارد کردیم که شامل 554 زن و کودک بودند (چهار کارآزمایی برچسب‐باز (open‐label)؛ چند‐مرکزی و دو بازویی؛ یک RCT تکمرکزی و چهار بازویی). هر پنج کارآزمایی به دلیل فقدان کورسازی، روشهای نامشخص تصادفیسازی و گزارشدهی انتخابی پیامدها، دارای خطر سوگیری (bias) بالا یا نامشخص بودند. تجمیع دادههای حاصل از این کارآزماییها امکانپذیر نبود، چراکه هر کارآزمایی، مقایسه متفاوتی را بررسی کرده بود.
1. یک کارآزمایی (N = 33 زن)، انسولین لیسپرو (Lispro) را با انسولین رگولار (regular) مقایسه و شواهد با کیفیت بسیار پائین برای این پیامدها ارائه کرده بود. هفت اپیزود از پره‐اکلامپسی (pre‐eclampsia) در گروه لیسپرو و نه مورد در گروه رگولار، بدون تفاوت آشکار بین این دو گروه، وجود داشت (خطر نسبی (RR): 0.68؛ 95% CI؛ 0.35 تا 1.30). پنج مورد زایمان سزارین در گروه لیسپرو و نه مورد در گروه انسولین رگولار بدون تفاوت آشکار بین این دو گروه گزارش شد (RR: 0.59؛ 95% CI؛ 0.25 تا 1.39). موردی از ناهنجاریهای جنینی در گروه لیسپرو نبود و یک مورد در گروه انسولین رگولار وجود داشت، بدون تفاوت واضح بین این گروهها (RR: 0.35؛ 95% CI؛ 0.02 تا 8.08). ماکروزومی (macrosomia)، مرگومیرهای پریناتال (perinatal)، اپیزودهایی از ترومای زایمان شامل دیستوشی شانه (shoulder dystocia)، فلج اعصاب (nerve palsy) و شکستگی، و معیارهای پیامد ترکیبی از موربیدیتی نوزادی گزارش نشده بود.
2. یک کارآزمایی (N = 42 زن)، انسولین انسانی را با انسولین حیوانی مقایسه و شواهد با کیفیت بسیار پائین برای این پیامدها ارائه کرده بود. موردی از ماکروزومی در گروه انسولین انسانی نبود و دو مورد در گروه انسولین حیوانی وجود داشت، بدون تفاوت مشخص میان این گروهها (RR: 0.22؛ 95% CI؛ 0.01 تا 4.30). مرگومیر پریناتال، پره‐اکلامپسی، زایمان سزارین، ناهنجاری جنینی، ترومای زایمان شامل دیستوشی شانه، فلج اعصاب و شکستگی و معیارهای پیامد ترکیبی از موربیدیتی نوزادی گزارش نشده بود.
3. یک کارآزمایی (N = 93 زن)، انسولین pre‐mixed؛ (70 NPH/30 REG) را با انسولین self‐mixed با دوز اسپلیت (split‐dose) مقایسه و شواهد با کیفیت بسیار پائین برای تایید این پیامدها ارائه کرده بود. دو مورد از ماکروزومی در گروه انسولین pre‐mixed و چهار مورد در گروه انسولین self‐mixed، بدون تفاوت واضح بین این دو گروه، وجود داشت (RR: 0.49؛ 95% CI؛ 0.09 تا 2.54). هفت مورد زایمان سزارین (برای عدم تناسب سر جنین با لگن مادر (cephalo‐pelvic disproportion)) در گروه انسولین pre‐mixed و 12 مورد در گروه انسولین self‐mixed، بدون تفاوت آشکار میان گروهها، وجود داشت (RR: 0.57؛ 95% CI؛ 0.25 تا 1.32). مرگومیر پریناتال، پره‐اکلامپسی، ناهنجاری جنینی، ترومای زایمان شامل دیستوشی شانه، فلج اعصاب یا شکستگی و معیارهای پیامد ترکیبی از موربیدیتی نوزادی گزارش نشده بود.
4. در یک کارآزمایی یکسان (N = 93 زن)، انسولین تزریق شده با قلم نوولین (Novolin) با انسولین تزریق شده با یک سوزن مرسوم (سرنگ) مقایسه و شواهد با کیفیت بسیار پائین برای تایید این پیامدها ارائه شده بود. یک مورد از ماکروزومی در گروه قلم و پنج مورد در گروه سوزن، بدون تفاوت واضح بین رژیمهای مختلف انسولین، وجود داشت (RR: 0.21؛ 95% CI؛ 0.03 تا 1.76). پنج زایمان از طریق زایمان سزارین در گروه قلم در مقایسه با 14 مورد در گروه سوزن وجود داشت؛ احتمال زایمان از طریق زایمان سزارین در هنگام تزریق انسولین با قلم در مقایسه با سوزن مرسوم کمتر بود (RR: 0.38؛ 95% CI؛ 0.15 تا 0.97). مرگومیر پریناتال، پره‐اکلامپسی، ناهنجاری جنینی، ترومای زایمان شامل دیستوشی شانه، فلج اعصاب یا شکستگی و معیارهای پیامد ترکیبی از موربیدیتی نوزادی گزارش نشده بود.
5. یک کارآزمایی (N = 223 زن) که انسولین آسپارت (Aspart) را با انسولین انسانی مقایسه کرده بود، هیچ کدام از پیامدهای اولیه این مرور را گزارش نکرده بود: ماکروزومی، مرگومیر پریناتال، پره‐اکلامپسی، زایمان سزارین، ناهنجاری جنینی، ترومای زایمان شامل دیستوشی شانه، فلج اعصاب یا شکستگی، یا معیارهای پیامد ترکیبی از موربیدیتی نوزادی.
6. یک کارآزمایی (N = 162 زن)، انسولین دتمیر (Detemir) را با انسولین NPH مقایسه کرد و این پیامدها را با شواهد با کیفیت بسیار پائین تایید کرد. سه مورد از ناهنجاری جنینی عمده در گروه انسولین دتمیر و یکی در گروه انسولین NPH، بدون تفاوت مشخص میان این گروهها وجود داشت (RR: 3.15؛ 95% CI؛ 0.33 تا 29.67). ماکروزومی، مرگومیر پریناتال، پره‐اکلامپسی، زایمان سزارین، ترومای زایمان شامل دیستوشی شانه، فلج اعصاب یا شکستگی و پیامد ترکیبی از موربیدیتی نوزادی گزارش نشده بود.
نتیجهگیریهای نویسندگان
با شواهد محدود و بدون متاآنالیز (meta‐analyses)، به خاطر آنکه هر کارآزمایی، مقایسه متفاوتی را بررسی کرده بود، هیچ نتیجهگیری قاطعی درباره انواع و رژیمهای مختلف انسولین در زنان بارداری که از قبل مبتلا به دیابت نوع 1 یا نوع 2 هستند، قابل انجام نبود. برای تعیین اینکه کدام یک خطر پیامد بارداری نامطلوب را افزایش میدهد، پژوهشهای بیشتری لازم است. این امر مستلزم کارآزماییهای بزرگتر، آمیختن تصادفیسازی و کورسازی کافی و پیامدهای کلیدی که شامل ماکروزومی، از دست دادن بارداری، پره‐اکلامپسی، زایمان سزارین، ناهنجاریهای جنینی و ترومای زایمان میشود، خواهد بود.
PICO
خلاصه به زبان ساده
بهترین نوع و رژیم انسولین برای زنان بارداری که از قبل مبتلا به دیابت هستند، چیست؟
موضوع چیست؟
مقدار نیاز به انسولین در زنان باردار مبتلا به دیابت نوع 1 یا 2 در طول بارداری تغییر میکند. انسولین در اشکال گوناگونی موجود است که تعداد و زمان دریافت انسولین را تحت تاثیر قرار میدهند. این اشکال در زمانی که انسولین پیش از اثر کردن نیاز دارد، میزانی که این تاثیر میتواند باقی بماند و اینکه از حیوانات یا انسانها ساخته شده که ممکن است از نظر فردی یا فرهنگی اهمیت داشته باشد، وجود دارد. این مرور، ایمنترین و موثرترین انواع و روشهای دریافت انسولین را طی بارداری بررسی کرد.
چرا این موضوع مهم است؟
زنان مبتلا به دیابت نوع 1 یا 2، در معرض افزایش خطر عوارض طی بارداری و زایمان قرار دارند. احتمال بیشتری وجود دارد که آنها از دست دادن بارداری (مردهزایی، سقط جنین)، افزایش فشار خون و پره‐اکلامپسی (pre‐eclampsia) (افزایش فشار خون مرتبط با ورم و پروتئین در ادرار) را تجربه کرده و کودکان درشتی داشته باشند (زمانی که کودک در موقع تولد 4 کیلوگرم یا بیشتر داشته باشد، ماکروزومی (macrosomia) خوانده میشود) که منجر به آسیب به مادر یا کودک میشود. احتمال انجام زایمان سزارین بالا میرود. ممکن است مادران و کودکان دچار عوارضی مربوط به مدیریت میزان گلوکز خون شوند. این کودکان با احتمال بیشتری دچار اضافه وزن و ابتلا به دیابت نوع 2 میشوند. ما میخواستیم بهترین نوع و رژیم انسولین را برای استفاده در طول بارداری بیابیم.
ما چه شواهدی به دست آوردیم؟
پنج کارآزمایی تصادفیسازی شده (N = 554 زن و 554 کودک) را در اکتبر 2016 یافتیم. هر کارآزمایی، انواع انسولین و روشهای دریافت انسولین متفاوتی را بررسی کرده بود. پیامدهای مختلفی در هر کارآزمایی بررسی شده بود. یک کارآزمایی، هیچ یک از پیامدهای اصلی این مرور را انتخاب نکرده بود. هر پنج کارآزمایی، کوچک و دارای خطر سوگیری (bias) بالا یا نامشخص به علت محدودیتها در نحوه اجرای کارآزماییها بودند. کیفیت شواهد، بسیار پائین بود.
هنگامی که انسولین سریعالاثر انسانی (لیسپرو (Lispro)) با انسولین رگولار (regular) مقایسه شد (N = 33)، محققان هیچ تفاوت روشنی را بین این گروهها از لحاظ پره‐اکلامپسی، ناهنجاریها در کودک یا نیاز به زایمان سزارین نیافتند. ماکروزومی، مرگومیر پریناتال، ترومای زایمان شامل دیستوشی شانه، فلج اعصاب و شکستگی، و معیار ترکیبی از موربیدیتی نوزادی گزارش نشده بود.
یک کارآزمایی (N = 43) که انسولین انسانی را با انسولین حیوانی مقایسه کرده بود، هیچ تفاوت مشخصی در تعداد کودکان مبتلا به ماکروزومی نشان نداد. مرگومیر پریناتال، پره‐اکلامپسی، زایمان سزارین، ناهنجاری جنینی، ترومای زایمان شامل دیستوشی شانه، فلج اعصاب و شکستگی، و معیار ترکیبی از موربیدیتی نوزادی گزارش نشده بود.
یک کارآزمایی (N = 93)، تفاوت آشکاری بین گروههای انسولین pre‐mixed و انسولین self‐mixed در تعداد کودکان مبتلا به ماکروزومی و تعداد زنانی که متحمل زایمان سزارین شده بودند، نیافته بود. همچنین این کارآزمایی، انسولین تزریق شده با قلم و سوزن (سرنگ) را مقایسه کرده بود. احتمال انجام زایمان سزارین در زنان در گروه انسولین قلمی کمتر بود، اگرچه تعداد کودکان دچار ماکروزومی تفاوت واضحی نداشت. مرگومیر پریناتال، پره‐اکلامپسی، ناهنجاری جنینی، ترومای زایمان شامل دیستوشی شانه، فلج اعصاب و شکستگی، و معیار ترکیبی از موربیدیتی نوزادی گزارش نشده بودند.
یک کارآزمایی (N = 223) که انسولین آسپارت را با انسولین انسانی مقایسه کرده بود، شامل هیچ یک از پیامدهای اولیه این مرور نبود (ماکروزومی، مرگومیر پریناتال، پره‐اکلامپسی، زایمان سزارین، ناهنجاری جنینی، ترومای زایمان شامل دیستوشی شانه، فلج اعصاب و شکستگی، یا معیار ترکیبی از موربیدیتی نوزادی).
یک کارآزمایی (N = 162) که انسولین طولانی‐اثر دتمیر (Detemir) را با انسولین متوسط‐الاثر پروتامین هاگدورن خنثی (neutral protamine Hagedorn) مقایسه کرده بود، بیانگر تفاوت روشنی در تعداد ناهنجاریهای جنینی بین گروهها نبود. این کارآزمایی، ماکروزومی، مرگومیر پریناتال، پره‐اکلامپسی، زایمان سزارین، ترومای زایمان شامل دیستوشی شانه، فلج اعصاب و شکستگی، یا معیار پیامد ترکیبی از موربیدیتی نوزادی را اندازهگیری نکرده بود.
این یافتهها چه معنایی دارند؟
این کارآزماییها، شواهد کافی را برای شناسایی تفاوتهای آشکار میان انواع و رژیمهای مختلف انسولین ارائه نکرده بودند. هر مطالعه، نوع گوناگونی از انسولین یا رژیم را بررسی کرده بود، بنابراین ما نتوانستیم نتایج را ترکیب کنیم. این مطالعات کوچک و دارای خطر سوگیری بالا بودند. بنابراین ما نتوانستیم نتیجهگیری کنیم که کدام نوع یا رژیم انسولین برای زنان بارداری که از قبل مبتلا به دیابت هستند، بهترین است. انجام پژوهشهای بیشتر با گروههای بزرگتری از زنان، گزارشدهی بهتر نحوه انجام کارآزماییها و پیامدهای گزارش شده بیشتر لازم است.
Authors' conclusions
Summary of findings
| Lispro versus regular insulin (Different insulin types within similar insulin regimens) | ||||||
| Patient or population: pregnant women with pre‐existing diabetes | ||||||
| Outcomes | Anticipated absolute effects* (95% CI) | Relative effect | № of participants | Quality of the evidence | Comments | |
| Risk with regular insulin | Risk with Lispro | |||||
| Macrosomia | (0 studies) | Not reported | ||||
| Perinatal death | Study population | not estimable | 33 | ⊕⊝⊝⊝ | ||
| 0 per 1000 | 0 per 1000 | |||||
| Pre‐eclampsia | Study population | RR 0.68 | 33 | ⊕⊝⊝⊝ | ||
| 647 per 1000 | 440 per 1000 | |||||
| Caesarean section | Study population | RR 0.59 | 33 | ⊕⊝⊝⊝ | ||
| 529 per 1000 | 312 per 1000 | |||||
| Fetal anomaly | Study population | RR 0.35 | 33 | ⊕⊝⊝⊝ | ||
| 59 per 1000 | 21 per 1000 | |||||
| Birth trauma, including shoulder dystocia, nerve palsy, and fracture | Study population | Not estimable | 33 | ⊕⊝⊝⊝ | ||
| 0 per 1000 | 0 per 1000 | |||||
| Composite outcome measure of neonatal morbidity | (0 studies) | Not reported | ||||
| *The risk in the intervention group (and its 95% confidence interval) is based on the assumed risk in the comparison group and the relative effect of the intervention (and its 95% CI). | ||||||
| GRADE Working Group grades of evidence | ||||||
| 1 High or unclear risk of bias for allocation concealment, blinding of participants and personnel, blinding of outcome assessment, incomplete outcome data, selective outcome reporting, and other biases 2 Small sample size and no events 3 One study with design limitations 4 Very wide 95% confidence intervals crossing the line of no effect 5 Small sample size with few events | ||||||
| Human insulin versus animal insulin (Different insulin types within similar insulin regimens) | ||||||
| Patient or population: pregnant women with pre‐existing diabetes | ||||||
| Outcomes | Anticipated absolute effects* (95% CI) | Relative effect | № of participants | Quality of the evidence | Comments | |
| Risk with animal insulin | Risk with human insulin (Humulin) | |||||
| Macrosomia | Study population | RR 0.22 | 42 | ⊕⊝⊝⊝ | ||
| 91 per 1000 | 20 per 1000 | |||||
| Perinatal death | (0 studies) | Not reported | ||||
| Pre‐eclampsia | (0 studies) | Not reported | ||||
| Caesarean section | (0 studies) | Not reported | ||||
| Fetal anomaly | (0 studies) | Not reported | ||||
| Birth trauma including shoulder dystocia, nerve palsy, and fracture | (0 studies) | Not reported | ||||
| Composite outcome measure of neonatal morbidity | (0 studies) | Not reported | ||||
| *The risk in the intervention group (and its 95% confidence interval) is based on the assumed risk in the comparison group and the relative effect of the intervention (and its 95% CI). | ||||||
| GRADE Working Group grades of evidence | ||||||
| 1 Risk of bias was high or unclear for random sequence generation, allocation concealment, blinding of participants and personnel, blinding of outcome assessment, incomplete outcome data, and selective outcome reporting 2 One study with serious design limitations including lack of blinding for allocation concealment 3 Very wide 95% confidence intervals crossing the line of no effect 4 Small sample size and few events | ||||||
| Pre‐mixed insulin (70 NPH/30 REG) versus self‐mixed split dose insulin (Different insulin regimens with similar insulin types used within the regimen) | ||||||
| Patient or population: pregnant women with pre‐existing diabetes | ||||||
| Outcomes | Anticipated absolute effects* (95% CI) | Relative effect | № of participants | Quality of the evidence | Comments | |
| Risk with self‐mixed split dose insulin | Risk with pre‐mixed insulin (70 NPH/30 REG) | |||||
| Macrosomia | Study population | RR 0.49 | 93 | ⊕⊝⊝⊝ | ||
| 87 per 1000 | 43 per 1000 | |||||
| Perinatal death | (0 studies) | Not reported | ||||
| Pre‐eclampsia | (0 studies) | Not reported | ||||
| Caesarean section 4 | Study population | RR 0.57 | 93 | ⊕⊝⊝⊝ | ||
| 261 per 1000 | 149 per 1000 | |||||
| Fetal anomaly | (0 studies) | Not reported | ||||
| Birth trauma including shoulder dystocia, nerve palsy, or fracture | (0 studies) | Not reported | ||||
| Composite outcome measure of neonatal morbidity | (0 studies) | Not reported | ||||
| *The risk in the intervention group (and its 95% confidence interval) is based on the assumed risk in the comparison group and the relative effect of the intervention (and its 95% CI). | ||||||
| GRADE Working Group grades of evidence | ||||||
| 1 Very wide 95% confidence intervals crossing the line of no effect 2 Small sample size and few events 3 One study with serious design limitations 4 Caesarean section for cephalo‐pelvic disproportion | ||||||
| Insulin injected with a Novolin pen versus insulin injected with a needle or syringe (Different insulin regimens with similar insulin types used within the regimen) | ||||||
| Patient or population: pregnant women with pre‐existing diabetes | ||||||
| Outcomes | Anticipated absolute effects* (95% CI) | Relative effect | № of participants | Quality of the evidence | Comments | |
| Risk with insulin injected with a needle or syringe | Risk with insulin injected with a Novolin pen | |||||
| Macrosomia | Study population | RR 0.21 | 93 | ⊕⊝⊝⊝ | ||
| 104 per 1000 | 22 per 1000 | |||||
| Perinatal death | (0 studies) | Not reported | ||||
| Pre‐eclampsia | (0 studies) | Not reported | ||||
| Caesarean section 4 | Study population | RR 0.38 | 93 | ⊕⊝⊝⊝ | ||
| 292 per 1000 | 111 per 1000 | |||||
| Fetal anomaly | (0 studies) | Not reported | ||||
| Birth trauma including shoulder dystocia, nerve palsy, or fracture | (0 studies) | Not reported | ||||
| Composite outcome measure of neonatal morbidity | (0 studies) | Not reported | ||||
| *The risk in the intervention group (and its 95% confidence interval) is based on the assumed risk in the comparison group and the relative effect of the intervention (and its 95% CI). | ||||||
| GRADE Working Group grades of evidence | ||||||
| 1 Very wide 95% confidence intervals crossing the line of no effect 2 Small sample size with few events 3 One study with serious design limitations 4 Caesarean section for cephalo‐pelvic disproportion | ||||||
| Insulin Aspart (+ NPH) compared to human insulin (+ NPH) for pregnant women with pre‐existing diabetes (Different insulin types within similar insulin regimens) | ||||||
| Patient or population: pregnant women with pre‐existing diabetes | ||||||
| Outcomes | Anticipated absolute effects* (95% CI) | Relative effect | № of participants | Quality of the evidence | Comments | |
| Risk with human insulin (+ NPH) | Risk with insulin Aspart (+ NPH) | |||||
| Macrosomia | ‐ | ‐ | ‐ | ‐ | ‐ | Not reported |
| Perinatal death | ‐ | ‐ | ‐ | ‐ | ‐ | Not reported |
| Pre‐eclampsia | ‐ | ‐ | ‐ | ‐ | ‐ | Not reported |
| Caesarean section | ‐ | ‐ | ‐ | ‐ | ‐ | Not reported |
| Fetal anomaly | ‐ | ‐ | ‐ | ‐ | ‐ | Not reported |
| Birth trauma including shoulder dystocia, nerve palsy and fracture | ‐ | ‐ | ‐ | ‐ | ‐ | Not reported |
| Composite outcome measure of neonatal morbidity | ‐ | ‐ | ‐ | ‐ | ‐ | Not reported |
| *The risk in the intervention group (and its 95% confidence interval) is based on the assumed risk in the comparison group and the relative effect of the intervention (and its 95% CI). | ||||||
| GRADE Working Group grades of evidence | ||||||
| Insulin Detemir + prandial insulin Aspart versus NPH insulin + prandial insulin Aspart (Different insulin types within similar insulin regimens) | ||||||
| Patient or population: pregnant women with pre‐existing diabetes | ||||||
| Outcomes | Anticipated absolute effects* (95% CI) | Relative effect | № of participants | Quality of the evidence | Comments | |
| Risk with NPH (+ Aspart) | Risk with insulin Detemir (+ Aspart) | |||||
| Macrosomia | (0 studies) | Not reported | ||||
| Perinatal death | (0 studies) | Not reported | ||||
| Pre‐eclampsia | (0 studies) | Not reported | ||||
| Caesarean section | (0 studies) | Not reported | ||||
| Fetal anomaly (major) 1 | Study population | RR 3.15 | 162 | ⊕⊝⊝⊝ | ||
| 12 per 1000 | 38 per 1000 | |||||
| Birth trauma including shoulder dystocia, nerve palsy, or fracture | (0 studies) | Not reported | ||||
| Composite outcome measure of neonatal morbidity | (0 studies) | Not reported | ||||
| *The risk in the intervention group (and its 95% confidence interval) is based on the assumed risk in the comparison group and the relative effect of the intervention (and its 95% CI). | ||||||
| GRADE Working Group grades of evidence | ||||||
| 1 Assessed by an expert who was blinded to the outcome 2 One study with design limitations 3 Very wide 95% confidence intervals crossing the line of no effect 4 Large effect estimate 5 Small sample size with few events | ||||||
Background
Description of the condition
Diabetes mellitus
The term (DM) describes a metabolic disorder of multiple aetiology, characterised by chronic hyperglycaemia with disturbances of carbohydrate, fat, and protein metabolism that results from defects in insulin secretion, insulin action, or both (WHO 1999). Diabetes mellitus can occur during pregnancy in two forms, pre‐gestational diabetes mellitus and gestational diabetes mellitus (GDM; Daflapurkar 2014). Pre‐gestational diabetes refers to type 1 or type 2 diabetes and is diagnosed before conception. Historically, type 1 diabetes was considered a disorder of children and adolescents, generally occurring early in life, with a sudden onset of insulin deficiency. Age at onset of diagnosis is no longer a restricting factor (Atkinson 2014). Type 2 diabetes has been largely attributed to increasing obesity and socioeconomic status (Kothari 2014; Morton 2014). Gestational diabetes mellitus is a carbohydrate intolerance that results in hyperglycaemia (an excess of sugar in the blood) of variable severity, with onset or first recognition during pregnancy. It does not exclude the possibility that the glucose intolerance may antedate pregnancy but has been previously unrecognised. The definition applies regardless of whether or not insulin is used for treatment, or the condition persists after pregnancy (WHO 1999). This review will only include women with pre‐existing DM (type 1 or 2).
Pathophysiology
Diabetes mellitus can be defined as abnormal glucose metabolism due to lack of, or relatively low, insulin production. It results in elevation of blood glucose levels with effects on all the vital organs. Type 1 DM describes a condition in which the pancreas is no longer able to produce sufficient insulin due to the destruction of the beta cells by an autoimmune process. According to the World Health Organization (WHO) definition, type 1 DM "includes those cases attributable to an autoimmune process, as well as those with beta‐cell destruction, which are prone to ketoacidosis for which neither an aetiology nor a pathogenesis is known (idiopathic). It does not include those forms of beta‐cell destruction or failure to which specific causes can be assigned (e.g. cystic fibrosis, mitochondrial defects, etc.)" (WHO 1999). Type 2 DM includes the common major form of diabetes that results from defects in insulin secretion, almost always with a major contribution from insulin resistance (Nolan 2011; WHO 1999).
Epidemiology
Diabetes mellitus is increasing globally and the number of adults with diabetes has more than doubled over nearly three decades, driven by both population growth and ageing, as well as the increasing levels of overweight and obesity (Danaei 2011). In Canada, the percentage of pregnant women with pre‐existing DM rose from 0.7% to 1.5% between 1996 and 2010 (Feig 2014). Similar increasing trends of DM in pregnant women have been reported in the United States (Albrecht 2010; Lawrence 2008), and the United Kingdom (Bell 2008). Type 2 diabetes accounts for approximately 85% to 90% of all cases of diabetes in European countries, and is the driving force behind increasing diabetes rates (Wass 2011). Furthermore, DM is the most common pre‐existing medical condition complicating pregnancy; the outcome for diabetic pregnancy remains poor, despite improvements in care (Kumareswaran 2013). Pre‐existing DM complicates approximately 1.3% of pregnancies, one‐third of these are type 1 DM, the remaining two thirds are type 2 DM (Bell 2008; Feghali 2012).
Risk factors associated with DM
Although the exact causes of type 1 DM are unknown, factors that may signal an increased risk include the following (Daneman 2006).
-
Family history (risk increases if a parent or sibling has type 1 DM).
-
Environmental factors (circumstances such as exposure to a viral illness likely play some role in type 1 DM).
-
The presence of damaging immune system cells (autoantibodies). Sometimes family members of people with type 1 DM are tested for the presence of diabetes autoantibodies. The presence of these antibodies is associated with an increased risk of developing type 1 DM, but not everyone who has these autoantibodies develops DM.
-
Dietary factors (including low vitamin D consumption, early exposure to cow's milk or cow's milk formula, and exposure to cereals before four months of age. None of these factors has been shown to directly cause type 1 DM).
-
Geography. Certain countries, such as Finland and Sweden, have higher rates of type 1 DM.
It is not fully understood why some people develop type 2 DM and others do not. However, certain factors increase the risk, including the following (Kim 2002).
-
Weight (the more fatty tissue present, the more resistant cells become to insulin).
-
Inactivity (the less active a person is, the greater the risk. Physical activity helps control weight, uses up glucose as energy and makes cells more sensitive to insulin).
-
Family history (risk increases if a parent or sibling has type 2 DM).
-
Race (certain races — including blacks, Hispanics, American Indians, and Asian‐Americans are at higher risk, although it is not clear why).
-
Age (risk increases as you get older, perhaps due to less exercise, lost muscle mass, and weight gain as you age, however, type 2 DM is also increasing dramatically among children, adolescents, and younger adults).
-
GDM (if a woman developed gestational diabetes when pregnant, her risk of developing prediabetes and type 2 DM later increases. If a woman gave birth to a baby weighing more than nine pounds (four kilograms), the risk of type 2 DM also increases).
-
Polycystic ovary syndrome (a common condition characterised by irregular menstrual periods, excess hair growth, and obesity) increases the risk of DM).
-
High blood pressure, over 140/90 millimetres of mercury (mmHg), is linked to an increased risk of type 2 DM.
-
Abnormal cholesterol and triglyceride levels (low levels of high‐density lipoprotein (HDL), or 'good' cholesterol, result in an increased risk of type 2 DM, as does a high level of triglycerides).
-
Gender (higher prevalence of diabetes among men, and men develop diabetes at lower body mass index (BMI) levels than women).
Possible complications in pregnant women with DM and their offspring
Diabetes in pregnancy is associated with risks to the woman and the developing fetus (Adam 2014; Ali 2011; Bartz 2012; Billionnet 2014; Carter 2012; Feig 2014; Fraser 2014; Holman 2014; Kapoor 2007; Krane 2014; Morken 2014; Øverland 2014; Ryu 2014; Tennant 2014; Yessoufou 2011).
-
Increased risk of complications of DM, including ketoacidosis, hypoglycaemia, retinopathy, and nephropathy.
-
Increased risk of obstetric complications, including pregnancy‐induced hypertension, thromboembolism, obstructed labour, polyhydramnios, maternal infection, caesarean section, pre‐eclampsia, and preterm labour.
-
Increased risk of fetal and neonatal complications, including miscarriage, stillbirth, congenital malformations, macrosomia, birth injury, perinatal mortality, postnatal adaptation problems (e.g. hypoglycaemia (reduced levels of blood sugar)), fetal distress, respiratory distress syndrome, and jaundice.
-
Long‐term outcomes of offspring born to diabetic mothers include an increased risk of obesity, impaired cognitive ability, and type 2 diabetes.
Management of DM in pregnancy
The management of pregnant women with type 1 diabetes involves the use of insulin to control blood glucose levels. During pregnancy, a woman's insulin requirements may increase by up to three to four times her pre‐pregnancy dose; insulin management is tailored to the individual (McCance 2010). In type 2 diabetes, lifestyle changes, including a healthy diet and regular exercise, are the first line of treatment, with the use of oral hypoglycaemic agents or insulin to lower blood glucose, if necessary. Therefore, the management of diabetes in pregnancy is complex, and includes a combination of preconception care, glycaemic control and monitoring, obtaining target blood glucose levels, monitoring glycated haemoglobin (HbA1c) levels, retinal assessment, carefully tailored insulin treatment, ketone testing, renal assessment, monitoring fetal growth and well‐being, and postnatal care (Balaji 2011; Ballas 2012; NICE 2015).
Description of the intervention
Insulin is a hormone made naturally in the body by pancreatic beta cells. This hormone controls the level of glucose in the blood. There are different types of insulin available, which are classified according to how quickly and for how long they work on various parts of the body. There are also many different methods of administering insulin, referred to as 'regimens'. This review focuses on the efficacy and safety of different insulin types and the various regimens of insulin delivery during pregnancy. The appropriate insulin type and regimen for each woman will depend on a number of factors, including the type of diabetes, previous control, age, dexterity, eyesight, and personal and cultural preferences (Greuter 2012).
Types of insulin
Insulins can be classified into various types, according to their duration of action (Mooradian 2006; NICE 2015).
-
Short‐acting insulin (e.g. Humulin, Novolin): should be injected 15 to 30 minutes before a meal, to cover the rise in blood glucose levels that occurs after eating. This insulin has a peak action of two to six hours, and can last for up to eight hours.
-
Rapid‐acting insulin analogues (e.g. Aspart, Lispro): genetically engineered analogues of human insulin, which work like insulin that is normally produced with a meal. Onset of action is approximately 15 minutes, peaking at one hour, and lasting three to four hours. They can be injected shortly before, during, or immediately after meals.
-
Long‐acting insulin analogues (e.g. Detemir, Glargine): genetically modified analogues, with an onset of action at one to three hours; they plateau and last for 20 to 24 hours. Generally used once‐ or twice‐daily to produce a constant flow of insulin, they are physiologically similar to normal endogenous basal insulin secretion.
-
Intermediate‐acting (medium‐acting) insulins (e.g. isophane or neutral protamine Hagedorn (NPH)): these have an onset of action of two to four hours, peak at six to seven hours, and last 20 hours. Isophane insulin is ideal for twice‐daily insulin regimens, and can be mixed with soluble insulin.
-
Mixed insulin (Biphasic insulin): a combination of medium‐acting and rapid‐acting or short‐acting insulin.
-
Mixed analogue: a combination of medium‐acting insulin and rapid‐acting analogue.
Insulin regimens
In this review, the term 'insulin regimen' refers to an overall strategy for insulin delivery that typically specifies:
-
the frequency of insulin injections (e.g. once, twice daily);
-
the type of insulin administered (e.g. intermediate‐, long‐acting); and
-
the timing of insulin injections (e.g. bedtime, before breakfast).
The main insulin regimens are as follows.
Once‐daily regimen
-
Long‐ or intermediate‐acting insulin administered at bedtime in people with type 2 diabetes only.
-
It may be used in addition to oral hypoglycaemic agents.
-
This regimen is generally used when starting insulin in type 2 diabetes and when it is necessary for others to administer the injections.
Twice‐daily regimen
-
A biphasic insulin is injected twice a day (before breakfast and before the evening meal).
-
Assumes three meals a day are consumed, and peak action varies according to the amount of soluble insulin in the mixture.
-
Optimal glycaemic control can be difficult to maintain, resulting in hypoglycaemic episodes.
-
Additional snacks are often required between meals, given the overlap between short‐acting and long‐acting insulin.
Basal‐bolus regimen
-
Intermediate‐ or long‐acting insulin is administered at bedtime to cover overnight insulin requirements, and is combined with rapid‐ or short‐acting insulin injections to cover mealtimes.
When intensified insulin therapy is used to provide optimal glycaemic control, this is the most commonly used insulin regimen, and is also known as multiple daily injections (MDI).
Continuous subcutaneous insulin infusion, or insulin pump therapy
-
Continuous subcutaneous insulin infusion (CSII) or insulin pump therapy is when basal insulin is given via a catheter, supplied from a syringe reservoir worn under clothing.
-
The woman can activate pre‐meal boluses, and the pump can be deactivated for up to one hour to facilitate activities, such as swimming.
-
The pump can be pre‐programmed, and as a result, the insulin absorption is more predictable than multiple daily injections.
-
CSII provides some advantages over multiple daily injections in type 1 diabetes for children and adults who have recurrent hypoglycaemia, delayed meals, or pre‐breakfast hyperglycaemia.
Continuous subcutaneous insulin infusion regimens have been covered extensively in two previous Cochrane reviews, and will not be included in the current review (Farrar 2016; Misso 2010).
Insulin dosage
Insulin dosage should be individualised to achieve and maintain a target blood glucose level, and is determined by various factors, including body weight, body fat, physical activity, insulin sensitivity, blood glucose levels, and target blood glucose. Insulin dosage is usually based on body weight (insulin unit per kilogram of body weight). One international unit of insulin (1 IU) is defined as the 'biological equivalent' of 34.7 µg of pure crystalline insulin (Beals 2013). Daily insulin requirements may be higher during illness, stress, pregnancy, in obese people, trauma, during concurrent use with medications having hyperglycaemic effects, or after surgery, and may be lower with exercise, weight loss, calorie restricted diets, or during concurrent use of medications having hypoglycaemic effects. Total daily doses should not be adjusted by more than 10% increments. Supplemental doses may be prescribed during illness, or to correct high preprandial blood glucose. In addition, dosage adjustments may be required when the brand, type, or species of insulin is changed (Teuscher 2007).
How the intervention might work
Insulin, a hormone made by beta cells of the pancreas, works on various parts of the body when it is chemically released into the bloodstream. This process results in the control of glucose (sugar) levels in the blood. Normally, after you have eaten, various foods are broken down into sugars, the main one being glucose, which pass through the gut wall into the bloodstream. To remain healthy, the blood glucose level should be neither too high nor too low. For example, if the blood glucose level rises (after eating), then the insulin level should also rise. Insulin works on the cells to make them absorb glucose from the bloodstream, some of which is used for energy, some of which is converted into glycogen or fat (energy stores). When blood glucose levels fall (between meals), insulin levels fall, and the glycogen or fat is converted back into glucose, which is released into the cells of the bloodstream. People with diabetes need to control the level of glucose in their blood; this is usually tailored to their individual needs and is dependent on the type of diabetes present. Overall, there is a lack of clear evidence regarding the benefits and risks of the various insulin types and regimens, particularly the newer insulin therapies. The evidence so far suggests that:
-
rapid‐acting insulin analogues may improve postprandial hyperglycaemia and reduce hypoglycaemia (Siebenhofer 2006);
-
long‐acting insulin analogues may reduce nocturnal hypoglycaemia and weight gain (Gough 2007), but some studies found them no better than conventional NPH insulin (Home 2005; Horvath 2007);
-
the newer treatments seem to be safe so far (Siebenhofer 2004);
-
the rapid‐acting insulin analogues (Aspart and Lispro) do not seem to adversely affect pregnancy or the health of the fetus or newborn baby (Negrato 2012);
-
use of isophane insulin (NPH insulin) as the first choice for long‐acting insulin during pregnancy is recommended, and insulin Detemir or Glargine in women with diabetes who have established good blood glucose control before pregnancy (NICE 2015);
-
twice‐daily regimens using isophane insulin (NPH insulin) or long‐acting insulin analogues (insulin Glargine) may be more suitable for those who require assistance, or have a dislike of injecting (Barnett 2008);
-
multiple injection regimens using unmodified or soluble insulin or rapid‐acting insulin analogues, are suitable for well‐motivated individuals with a good understanding of disease control, or those with active or erratic lifestyles (NICE 2015).
The current review interventions may result in a better understanding of the following outcomes in pregnant women with pre‐existing diabetes.
Improved glycaemic control: Improvement in glycaemic control levels (i.e. optimum HbA1c levels, fasting plasma glucose).
Reduction of hypoglycaemic or hyperglycaemic episodes: A reduction or absence in the number of hyperglycaemic or hypoglycaemic episodes reported in the trials.
Safety and efficacy: Measurement of the safety and efficacy of various insulin types and regimens.
Other: Satisfaction and quality of life reported by women; maternal and infant outcomes.
Why it is important to do this review
Several Cochrane reviews have evaluated the effects of various interventions for managing pre‐existing diabetes in pregnancy, including: early pregnancy screening to improve maternal and child health; CSII versus MDI of insulin; glycaemic control; monitoring blood glucose during pregnancy; and oral anti‐diabetic agents for impaired glucose tolerance (Allnutt 2015; Farrar 2016; Middleton 2012; Moy 2014; Tieu 2010a). In addition, there are other Cochrane reviews that cover various aspects of diabetes management around conception, pregnancy, and birth (e.g. elective delivery, exercise, antenatal breast milk expression, preconception care, and contraceptive advice (Boulvain 2001; Ceysens 2006; East 2014; Tieu 2010b; Visser 2013)).
Our review assessed evidence related to different insulin types and regimens, and aimed to contribute to knowledge that will ultimately be used by pregnant women with pre‐existing diabetes and their clinicians, to minimise the risk of adverse birth outcomes and complications of diabetes for mothers. This review was timely, since currently, pregnant women with diabetes have significantly worse outcomes than women without diabetes. Achieving improved pregnancy outcomes for women with diabetes needs to be prioritised, particularly given that the prevalence of diabetes among women of childbearing age is increasing. Furthermore, while there have been advances in the different insulin types and regimens available that have crossed into the field of obstetrics, further research is needed to address the safety and efficacy of these new drugs on the market to improve compliance and glycaemic control, especially during pregnancy.
Objectives
To assess the effects of different insulin types and different insulin regimens in pregnant women with pre‐existing type 1 or type 2 diabetes.
Methods
Criteria for considering studies for this review
Types of studies
We included randomised controlled trials and cluster‐randomised trials, regardless of the number of trial arms that reported data that evaluated different insulin types or regimens. We excluded quasi‐randomised controlled trials and trials using a cross‐over design. We included studies published in abstract form and contacted the authors for further details where applicable. Conference abstracts were superseded by full publications.
Types of participants
Women with a singleton pregnancy who had pre‐existing diabetes (type 1 or type 2) and were randomised to receive different insulin types or regimens. Trials were excluded if women were randomised prior to pregnancy. Women who met the diagnostic criteria for GDM were not included. Diagnostic criteria for DM and GDM were based on various definitions as reported by individual trialists, according to local health authorities and professional organisations. Women were eligible regardless of gestation, age, or parity.
Types of interventions
We included randomised controlled trials that examined any of the following comparisons.
Comparisons between different insulin types used within similar insulin regimens
For example:
-
basal bolus regimen of NPH insulin given at bedtime, combined with Aspart to cover mealtimes versus basal bolus regimen of Glargine given at bedtime, combined with Aspart to cover mealtimes (i.e. a comparison of the effects of different insulin types [NPH versus Glargine] when used within a basal bolus regimen).
Comparisons between different insulin regimens with similar insulin types used within the regimens
For example:
-
twice‐daily insulin regimen versus four times daily insulin regimen:
-
twice‐daily regimen: morning dosage = one‐third human regular insulin and two‐thirds human intermediate insulin; afternoon dosage = equal parts regular and intermediate insulin;
-
four‐times daily regimen: first three dosages of regular insulin 30 minutes before a meal; final dosage: bedtime, intermediate insulin.
Comparisons between different insulin regimens with different insulin types used within the regimens
For example:
-
a biphasic insulin injected twice a day (pre‐breakfast and pre‐evening meal) versus basal bolus regimen of NPH insulin given at bedtime, combined with Aspart to cover mealtimes.
Types of outcome measures
Primary outcomes
Infant
-
Macrosomia (birthweight greater than 4000 g, birthweight greater than 90% for gestational age at delivery after correcting for neonatal sex and ethnicity).
-
Perinatal death.
Maternal
-
Caesarean section (emergency or elective).
-
Pre‐eclampsia.
Secondary outcomes
Infant
-
Fetal anomaly divided into major and minor.
-
Birth trauma including shoulder dystocia, nerve palsy, and fracture.
-
Preterm birth less than 37 weeks.
-
Small‐for‐gestational age at delivery (weight below the 10th percentile for gestational age at delivery).
-
Five‐minute Apgar score less than seven.
-
Birthweight centile corrected for gestational age at delivery, parity, ethnicity, maternal weight, and fetal sex (Z scores used where available).
-
Admission and length of stay in neonatal intensive care unit.
-
Mechanical ventilation.
-
Neonatal infection.
-
Neonatal hypoglycaemia.
-
Insulin sensitivity (cord insulin, C‐peptide).
-
Jaundice requiring therapy.
-
Respiratory distress syndrome.
-
Hyperbilirubinaemia.
-
Necrotising enterocolitis.
-
Intracranial haemorrhage.
-
Artifical tube feeding.
-
Composite outcome measure of neonatal morbidity (admission and length of stay in neonatal intensive care unit, mechanical ventilation, neonatal infection, neonatal hypoglycaemia, insulin sensitivity (cord insulin, C‐peptide), jaundice requiring therapy, respiratory distress syndrome, hyperbilirubinaemia, necrotising enterocolitis, intracranial haemorrhage, artificial (tube) feeding).
-
Neonatal anthropometry (length, head circumference, ponderal index).
-
Neonatal adiposity (fat mass, skinfold thickness, body weight percentile).
-
Measures of growth and neurodevelopment at childhood follow‐up.
Maternal
-
Vaginal delivery (spontaneous, ventouse, forceps).
-
Postpartum haemorrhage.
-
Severe perineal trauma (third‐ and fourth‐degree tear).
-
Measures of diabetic metabolic control (levels of HbA1c, daily mean self‐monitored blood glucose, postprandial and fasting, continuous glucose monitoring).
-
Maternal hypoglycaemia and hyperglycaemia episodes requiring intervention.
-
Weight gain in pregnancy.
-
Induction of labour (reasons related to diabetes).
-
Postpartum infection.
-
Breastfeeding.
-
Retinopathy.
-
Quality of life (psychological impact of management, assessed by psychometric testing with a reliable standardised questionnaire).
-
Use of healthcare resources (rate of antenatal clinic visits and admission for treatment relating to control of diabetes, ultrasound growth scans, biophysical scans, dopplers, cardiotocograph's, maternal hospital days).
-
Woman's preference and satisfaction with treatment.
-
Economic evaluation.
Outcomes not prespecified in protocol (but added to review)
Infant
-
Birthweight.
-
Infant fasting C‐peptide level at three months (pmol/mL).
-
Infant C‐peptide level one hour after glucose‐amino acid challenge at three months (pmol/mL).
-
Infant glucose fasting level at three months (pmol/mL).
-
Infant glucose level one hour after glucose‐amino acid challenge at three months (pmol/mL).
-
Gestational age at delivery.
Maternal
-
Ventouse delivery.
-
Maternal ketonuria.
-
Maternal compliance with treatment score (1 = best compliance, 5 = worst compliance).
Search methods for identification of studies
The following methods section of this protocol is based on a standard template used by Cochrane Pregnancy and Childbirth.
Electronic searches
We searched Cochrane Pregnancy and Childbirth’s Trials Register by contacting their Information Specialist (30 October 2016).
The Register is a database containing over 22,000 reports of controlled trials in the field of pregnancy and childbirth. For full search methods used to populate Pregnancy and Childbirth’s Trials Register, including the detailed search strategies for CENTRAL, MEDLINE, Embase and CINAHL, the list of handsearched journals and conference proceedings, and the list of journals reviewed via the current awareness service, please follow this link to the editorial information about the Cochrane Pregnancy and Childbirth in the Cochrane Library and select the 'Specialized Register' section from the options on the left side of the screen.
Briefly, Cochrane Pregnancy and Childbirth’s Trials Register is maintained by their Information Specialist and contains trials identified from:
-
monthly searches of the Cochrane Central Register of Controlled Trials (CENTRAL);
-
weekly searches of MEDLINE (Ovid);
-
weekly searches of Embase (Ovid);
-
monthly searches of CINAHL (EBSCO);
-
handsearches of 30 journals and the proceedings of major conferences;
-
weekly current awareness alerts for a further 44 journals plus monthly BioMed Central email alerts.
Search results are screened by two people and the full text of all relevant trial reports identified through the searching activities described above is reviewed. Based on the intervention described, each trial report is assigned a number that corresponds to a specific Pregnancy and Childbirth review topic (or topics), and is then added to the Register. The Information Specialist searches the Register for each review using this topic number rather than keywords. This results in a more specific search set, which has been fully accounted for in the relevant review sections (Included studies; Excluded studies).
In addition, we searched ClinicalTrials.gov and the WHO International Clinical Trials Registry Platform (ICTRP) for unpublished, planned, and ongoing trial reports on 17 October 2016 (see: Appendix 1 for the terms we used).
Searching other resources
We examined the reference lists of included studies and any relevant studies identified. Where studies could only be accessed as abstracts, we contacted the authors for more details.
We did not apply any language or date restrictions.
Data collection and analysis
The following methods section of this review are based on a standard template used by Cochrane Pregnancy and Childbirth.
Selection of studies
Two review authors (SON, HW) independently assessed all the potential studies identified as a result of the search strategy for inclusion. We resolved any disagreement through discussion, or if required, we consulted a third person (ASK).
We created a study flow diagram mapping out the number of records identified, included, and excluded.
Data extraction and management
We designed a form to extract data. For eligible studies, two review authors (SON, HW) independently extracted the data using the agreed form. We resolved discrepancies through discussion, or if required, we consulted a third person (LK). SON entered the data into Review Manager 5 software (RevMan 5 2014) and HW checked them for accuracy. When information regarding any of the above was unclear, we attempted to contact authors of the original reports to provide further details.
Assessment of risk of bias in included studies
Two review authors (SON, HW) independently assessed risk of bias for each study using the criteria outlined in the Cochrane Handbook for Systematic Reviews of Interventions (Higgins 2011). We resolved any disagreement by discussion, or by involving a third assessor (PK).
(1) Random sequence generation (checking for possible selection bias)
For each included study, we described the method used to generate the allocation sequence in sufficient detail to allow an assessment of whether it should produce comparable groups.
We assessed the method as:
-
low risk of bias (any truly random process, e.g. random number table; computer random number generator);
-
high risk of bias (any non‐random process, e.g. odd or even date of birth; hospital or clinic record number); or
-
unclear risk of bias.
(2) Allocation concealment (checking for possible selection bias)
For each included study, we described the method used to conceal allocation to interventions prior to assignment, and assessed whether intervention allocation could have been foreseen in advance of, or during recruitment, or changed after assignment.
We assessed the methods as:
-
low risk of bias (e.g. telephone or central randomisation; consecutively numbered sealed opaque envelopes);
-
high risk of bias (open random allocation; unsealed or non‐opaque envelopes, alternation; date of birth);
-
unclear risk of bias.
(3.1) Blinding of participants and personnel (checking for possible performance bias)
For each included study, we described the methods used, if any, to blind study participants and personnel from knowledge of which intervention a participant received. We considered that studies were at low risk of bias if they were blinded, or if we judged that the lack of blinding was unlikely to affect results. We assessed blinding separately for different outcomes or classes of outcomes.
We assessed the methods as:
-
low, high, or unclear risk of bias for participants;
-
low, high, or unclear risk of bias for personnel.
(3.2) Blinding of outcome assessment (checking for possible detection bias)
For each included study, we described the methods used, if any, to blind outcome assessors from knowledge of which intervention a participant received. We assessed blinding separately for different outcomes or classes of outcomes.
We assessed methods used to blind outcome assessment as:
-
low, high, or unclear risk of bias.
(4) Incomplete outcome data (checking for possible attrition bias due to the amount, nature and handling of incomplete outcome data)
For each included study, and for each outcome or class of outcomes, we described the completeness of data, including attrition and exclusions from the analysis. We stated whether attrition and exclusions were reported, and the numbers included in the analysis at each stage (compared with the total randomised participants), reasons for attrition or exclusion where reported, and whether missing data were balanced across groups or were related to outcomes. Where sufficient information was reported, or could be supplied by the trial authors, we included missing data in the analyses that we undertook.
We assessed methods as:
-
low risk of bias (e.g. no missing outcome data; missing outcome data balanced across groups);
-
high risk of bias (e.g. numbers or reasons for missing data imbalanced across groups; ‘as treated’ analysis done with substantial departure of intervention received from that assigned at randomisation);
-
unclear risk of bias.
(5) Selective reporting (checking for reporting bias)
For each included study, we described how we investigated the possibility of selective outcome reporting bias and what we found.
We assessed the methods as:
-
low risk of bias (where it was clear that all of the study’s pre‐specified outcomes and all expected outcomes of interest to the review had been reported);
-
high risk of bias (where not all the study’s pre‐specified outcomes had been reported; one or more reported primary outcomes were not pre‐specified; outcomes of interest were reported incompletely and so could not be used; study failed to include results of a key outcome that would have been expected to have been reported);
-
unclear risk of bias.
(6) Other bias (checking for bias due to problems not covered by (1) to (5) above)
For each included study, we described any important concerns we had about other possible sources of bias.
We assessed whether each study was free of other problems that could put it at risk of bias:
-
low risk of other bias;
-
high risk of other bias;
-
unclear whether there is risk of other bias.
(7) Overall risk of bias
We made explicit judgements about whether studies were at high risk of bias, according to the criteria given in the Cochrane Handbook of Systematic Reviews of Interventions (Higgins 2011). With reference to (1) to (6) above, we assessed the likely magnitude and direction of the bias, and whether we considered it was likely to impact the findings. We explored the impact of the level of bias by undertaking sensitivity analyses ‐ seeSensitivity analysis.
Assessing the quality of the body of evidence using the GRADE approach
We created 'Summary of findings' tables for all comparisons made in the review by importing data from Review Manager 5 (RevMan 5 2014) into the GRADEpro Guideline Development Tool. The following outcomes were included in the 'Summary of findings' tables.
-
Macrosomia.
-
Perinatal death.
-
Pre‐eclampsia.
-
Caesarean section (emergency or elective).
-
Fetal anomaly.
-
Birth trauma, including shoulder dystocia, nerve palsy, and fracture.
-
Composite outcome measure of neonatal morbidity (admission and length of stay in neonatal intensive care unit, mechanical ventilation, infection, jaundice requiring therapy, respiratory distress syndrome, necrotising enterocolitis, intracranial haemorrhage, artificial (tube) feeding).
The quality of the evidence for each outcome was assessed using the GRADE approach as outlined in the GRADE Handbook. We downgraded the evidence from high quality by one level for serious (or by two levels for very serious) limitations, depending on our assessments of the risk of bias, indirectness of evidence, serious inconsistency, imprecision of effect estimates, or potential publication bias.
Measures of treatment effect
Dichotomous data
For dichotomous data, we presented results as summary risk ratios (RR) with 95% confidence intervals (CI).
Continuous data
For continuous data, we used the mean difference (MD) if outcomes were measured in the same way between trials. We had planned to use the standardised mean difference (SMD) to combine trials that measured the same outcome, but used different methods, but there were no such trials in this review.
Unit of analysis issues
Cluster‐randomised trials
We did not include any cluster‐randomised trials in this review. In future updates, if we identify eligible cluster‐randomised trials, we will include their data in the analyses along with individually‐randomised trials. We will adjust their sample sizes using the methods described in the Cochrane Handbook of Systematic Reviews of Interventions (Sections 16.3.4 or 16.3.6), using an estimate of the intra cluster correlation co‐efficient (ICC) derived from the trial (if possible), from a similar trial, or from a study of a similar population. If we use ICCs from other sources, we will report this and conduct sensitivity analyses to investigate the effect of variation in the ICC. If we identify both cluster‐randomised trials and individually‐randomised trials, we will synthesise the relevant information. We will consider it reasonable to combine the results from both if there is little heterogeneity between the study designs, and we consider it unlikely that there will be an interaction between the effect of the intervention and the choice of randomisation unit.
We will also acknowledge heterogeneity in the randomisation unit and perform a subgroup analysis to investigate the effects of the randomisation unit.
Multi‐armed trials
We included multi‐armed trials and recorded all outcome data in the review as two‐arm comparisons. We included the data for different arms in independent two‐arm comparisons in separate meta‐analyses where possible. If we were unable to include the data in separate comparisons, we combined them to create a single pair‐wise comparison (Higgins 2011). If the control group was shared by two or more study arms, we divided the control group between relevant subgroup categories to avoid double counting the participants. For dichotomous data, we divided the events and the total population, while for continuous data, we assumed the same mean and standard deviation (SD) divided by the total population.
Cross‐over trials
Cross‐over trials were not eligible for inclusion in this review.
Dealing with missing data
We noted levels of attrition in the included studies. If more eligible studies are included In future updates, we will explore the impact of including studies with high levels of missing data in the overall assessment of the treatment effect by using sensitivity analyses.
Analyses were carried out for all outcomes, as far as possible, on an intention‐to‐treat basis, i.e. we attempted to include all participants randomised to each group in the analyses, and all participants were analysed in the group to which they were allocated, regardless of whether they received the allocated intervention. The denominator for each outcome in each trial was the number randomised minus any participants whose outcomes were known to be missing.
Assessment of heterogeneity
We assessed statistical heterogeneity in each meta‐analysis using the Tau², I², and Chi² statistics. We regarded heterogeneity as substantial if an I² was greater than 30%, and either a Tau² was greater than zero, or the P was less than 0.10 in the Chi² test for heterogeneity.
Assessment of reporting biases
In future updates, if there are 10 or more studies in the meta‐analysis, we will investigate reporting biases (such as publication bias) using funnel plots. We will first visually assess funnel plot asymmetry. If asymmetry is suggested by a visual assessment, we will perform exploratory analyses to investigate it.
Data synthesis
We carried out statistical analysis using the Review Manager 5 software (RevMan 5 2014). We did not combine the results from different trials as each trial looked at a different comparison. If we had pooled the data in a meta‐analysis, we would have used a fixed‐effect model for combining data where it was reasonable to assume that studies were estimating the same underlying treatment effect, i.e. where trials were examining the same intervention, and the trials’ populations and methods were judged to be sufficiently similar. If there was sufficient clinical heterogeneity to expect that the underlying treatment effects differed between trials, or if substantial statistical heterogeneity was detected, we had planned to use a random‐effects model to produce an overall summary, if an average treatment effect across trials was considered clinically meaningful. The random‐effects summary would have been treated as the average of the range of possible treatment effects, and we had planned to discuss the clinical implications of treatment effects differing between trials. If the average treatment effect was not clinically meaningful, we had planned not to combine trials.
If we had used random‐effects analyses, the results would have been presented as the average treatment effect with 95% confidence intervals, and the estimates of Tau² and I².
Subgroup analysis and investigation of heterogeneity
It is very unlikely that an investigation of heterogeneity will produce useful findings unless there is a substantial number of studies (at least 10 studies for each characteristic in the meta‐analysis), according to section 9.6.5.1 in the Cochrane Handbook for Systematic Reviews of Interventions (Higgins 2011). Had we identified substantial heterogeneity, we had planned to investigate it using subgroup analyses and sensitivity analyses, to consider whether an overall summary was meaningful, and if it was, to use the random‐effects model to produce it.
We had planned to carry out the following subgroup analyses on the review's primary outcomes, but there were insufficient data to do so:
-
by type of diabetes (type 1 versus type 2);
-
gestational age when women were recruited to the trial (less than 12 weeks versus more than 12 weeks);
-
maternal age (younger than 35 years versus older than 35 years);
-
body mass index (at or before trial entry), overweight (more than 25 kg/m²) versus normal weight (25 kg/m² or less), and obese (more than 30 kg/m²) versus normal weight (25 kg/m² or less);
-
by unit of randomisation (randomised by individual participant versus randomised by cluster).
In future updates, we plan to assess subgroup differences by interaction tests available in RevMan 5 (RevMan 5 2014). We will report the results of subgroup analyses quoting the Chi² statistic and P value, and the interaction test, I² value.
Sensitivity analysis
We had planned to carry out the following sensitivity analyses for the reviews primary outcomes, but there were insufficient data to do so. In future updates, we will compare trials judged as having a low risk of bias for allocation concealment with trials judged to have unclear or high risk of bias, in order to assess any substantive differences in the overall result. We will also carry out a sensitivity analysis to explore the fixed‐effect model or random‐effects model analyses for primary outcomes with statistical heterogeneity. If ICCs from other sources are used, we will conduct sensitivity analyses to investigate the effect of variation in the ICC.
As noted in Section 9.7 of the Cochrane Handbook for Systematic Reviews of Interventions, "many issues suitable for sensitivity analysis are only identified during the review process when the individual peculiarities of the studies under investigation are identified” (Higgins 2011). If it is deemed appropriate in updates of the review to conduct further sensitivity analyses (in addition to the pre‐specified analyses outlined above), we will explain the reasons for conducting these additional analyses in our review, and the analyses will be clearly labelled as 'non‐prespecified analyses'.
Results
Description of studies
See Characteristics of included studies.
Results of the search
From the search of the Cochrane Pregnancy and Childbirth Group's Trials Register (October 2016), we retrieved 34 full‐text reports. We also found two additional reports by searching ClinicalTrials.gov and the WHO International Clinical Trials Registry Platform (ICTRP; 17 October 2016). When we assessed these reports for eligibility, by applying the inclusion and exclusion criteria, we were left with five trials eligible to be included in the review (see Figure 1).
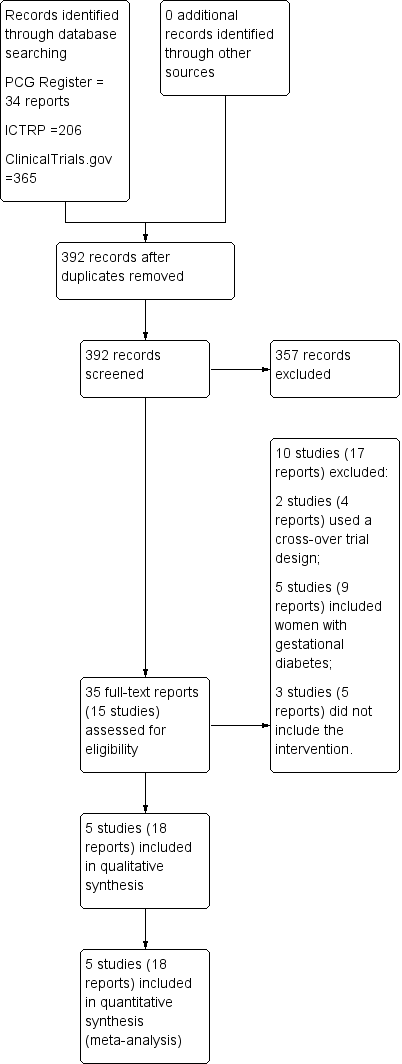
Study flow diagram.
Included studies
Design
Four trials were open‐label, multi‐centre, two‐armed RCTs (Jovanovic‐Peterson 1992; Mathiesen 2007; Mathiesen 2012; Persson 2002). One trial was a single centre, four‐armed RCT (Schuster 1998).
Sample sizes
There were 43 women included in the trial by Jovanovic‐Peterson 1992 (N = 20 intervention arm, N = 23 control arm), 33 women in the trial by Persson 2002 (N = 16 intervention arm, N = 17 control arm), 223 women in the trial by Mathiesen 2007 (N = 113 intervention arm, N = 110 control arm), 162 women in the trial by Mathiesen 2012 (N = 79 intervention arm, N = 83 control arm) and 93 women in the trial by Schuster 1998 (N = 24 intervention arm1, N = 22 intervention arm2, N = 23 intervention arm3, N = 24 control arm).
Setting
Two trials were conducted in the USA (Jovanovic‐Peterson 1992; Schuster 1998), one trial was conducted in Sweden (Persson 2002), and the remaining two trials were conducted in 63 sites in 18 countries, and 79 sites in 17 countries respectively, mainly within Europe (Mathiesen 2007, Mathiesen 2012).
Participants
Participants included pregnant women with type 1 DM (Jovanovic‐Peterson 1992; Mathiesen 2007; Mathiesen 2012; Persson 2002; Schuster 1998), or type 2 DM (Jovanovic‐Peterson 1992), recruited from hospitals in each specific region.
Interventions and comparisons
Different insulin types within similar insulin regimens
Four trials compared different insulin types within similar insulin regimens (Jovanovic‐Peterson 1992; Mathiesen 2007; Mathiesen 2012; Persson 2002).
Persson 2002 compared the rapid‐acting insulin analogue Lispro (Humalog®) plus the intermediate‐acting insulin NPH (within a MDI basal bolus regimen) to regular short‐acting insulin (Humulin Regular®/Actrapid®) plus the intermediate‐acting insulin NPH.
Jovanovic‐Peterson 1992 compared short‐acting human insulin (recombinant deoxyribonucleic acid ‐ Humulin®) to animal insulin.
Mathiesen 2007 compared rapid‐acting insulin Aspart (plus the intermediate‐acting insulin NPH) to human insulin (plus the intermediate‐acting insulin NPH).
Mathiesen 2012 compared long‐acting insulin Detemir (plus rapid‐acting insulin Aspart) to intermediate‐acting NPH insulin (plus rapid‐acting insulin Aspart).
Different insulin regimens with similar insulin types used within the regimens
One trial compared three different interventions; for the purpose of this review, we combined the data as follows (Schuster 1998).
-
We compared pre‐mixed (70 NPH/30 REG) insulin to self‐mixed split dose insulin.
-
We compared insulin injected with a Novolin pen to insulin injected with a conventional needle or syringe.
Outcomes
Primary outcomes
Infant
-
Macrosomia was reported in two trials (Jovanovic‐Peterson 1992; Schuster 1998).
-
Perinatal death was reported in one trial (Persson 2002).
Maternal
-
Caesarean section (emergency or elective) was reported in two trials (Persson 2002; Schuster 1998).
-
Pre‐eclampsia was reported in one trial (Persson 2002).
Secondary outcomes
Infant
-
Fetal anomaly divided into major and minor was reported in two trials (Mathiesen 2012; Persson 2002).
-
Birth trauma, including shoulder dystocia, nerve palsy, and fracture was reported in one trial (Persson 2002).
-
Preterm birth, at less than 37 weeks, was reported in one trial (Jovanovic‐Peterson 1992).
-
Small‐for‐gestational age at delivery (weight below the 10th percentile for gestational age at delivery) was reported in one trial (Jovanovic‐Peterson 1992).
-
Birthweight centile, corrected for gestational age at delivery, parity, ethnicity, maternal weight, and fetal sex (Z scores used where available) was reported in one trial (Jovanovic‐Peterson 1992).
-
Neonatal anthropometry (length, head circumference, ponderal index): Infant length and head circumference were reported in one trial (Jovanovic‐Peterson 1992).
-
Neonatal adiposity (fat mass, skinfold thickness, body weight percentile): skinfold thickness and body weight percentile were reported in one trial (Jovanovic‐Peterson 1992).
Maternal
-
Vaginal delivery (spontaneous, ventouse, forceps) was reported in one trial (Persson 2002).
-
Measures of diabetic metabolic control (levels of HbA1c, daily mean self‐monitored blood glucose, post‐prandial and fasting, continuous glucose monitoring): levels of HbA1c at the third trimester visit were reported in one trial (Mathiesen 2007); blood glucose at week 14 (after lunch), was reported in one trial (Persson 2002); blood glucose at weeks 21, 28, and 34 combined (after lunch), was reported in one trial (Persson 2002); postprandial increase of blood glucose before week 14 (after lunch) was reported in one trial (Persson 2002); postprandial increase of blood glucose during weeks 21, 28 and 34 combined (after lunch) was reported in one trial (Persson 2002); antepartum capillary glucose measure (mg/dL), two hours post prandial (after lunch) was reported in one trial (Schuster 1998); insulin requirement during pregnancy (U/kg/24 hour) was reported in one trial (Jovanovic‐Peterson 1992).
-
Maternal hypoglycaemia and hyperglycaemia episodes requiring intervention were reported in two trials (Mathiesen 2007; Persson 2002).
-
Postpartum infection was reported in one trial (Schuster 1998).
-
Retinopathy was reported in one trial (Persson 2002).
-
Use of healthcare resources (rate of antenatal clinic visits and admission for treatment relating to control of diabetes, ultrasound growth scans, biophysical scans, dopplers, cardiotocograph's, maternal hospital days): maternal hospital days were reported in one trial (Schuster 1998).
Outcomes not prespecified in protocol
Infant
-
Birthweight was reported in two trials (Jovanovic‐Peterson 1992; Schuster 1998).
-
Infant fasting C‐peptide level at three months (pmol/mL) was reported in one trial (Jovanovic‐Peterson 1992).
-
Infant C‐peptide level 1 hour after glucose‐amino acid challenge at three months (pmol/mL) was reported in one trial (Jovanovic‐Peterson 1992).
-
Infant glucose fasting level at three months (pmol/mL) was reported in one trial (Jovanovic‐Peterson 1992).
-
Infant glucose level 1 hour after glucose‐amino acid challenge at three months (pmol/mL) was reported in one trial (Jovanovic‐Peterson 1992).
-
Gestational age at delivery was reported in one trial (Jovanovic‐Peterson 1992).
Maternal
-
Ventouse delivery was reported in one trial (Persson 2002).
-
Maternal compliance with treatment score (1 = best compliance, 5 = worst compliance) was reported in one trial (Schuster 1998).
-
Maternal ketonuria was reported in one trial (Jovanovic‐Peterson 1992).
Prespecified outcomes not reported
Infant
-
Five‐minute Apgar score less than seven.
-
Admission and length of stay in neonatal intensive care unit.
-
Mechanical ventilation.
-
Neonatal infection.
-
Neonatal hypoglycaemia.
-
Insulin sensitivity (cord insulin, C‐peptide).
-
Jaundice requiring therapy.
-
Respiratory distress syndrome.
-
Hyperbilirubinaemia.
-
Necrotising enterocolitis.
-
Intracranial haemorrhage.
-
Artificial (tube) feeding.
-
Composite outcome measure of neonatal morbidity (admission and length of stay in neonatal intensive care unit, mechanical ventilation, neonatal infection, neonatal hypoglycaemia, insulin sensitivity (cord insulin, C‐peptide), jaundice requiring therapy, respiratory distress syndrome, hyperbilirubinaemia, necrotising enterocolitis, intracranial haemorrhage, artificial (tube) feeding).
-
Measures of growth and neurodevelopment at childhood follow‐up.
Maternal
-
Postpartum haemorrhage.
-
Severe perineal trauma (third‐ and fourth‐degree tear).
-
Weight gain in pregnancy.
-
Induction of labour (reasons related to diabetes).
-
Breastfeeding.
-
Quality of life (psychological impact of management, assessed by psychometric testing with a reliable standardised questionnaire).
-
Woman's preference and satisfaction with treatment.
-
Economic evaluation.
Excluded studies
We excluded Carr 2004 and Murphy 2011 because they used a cross‐over study design. We excluded Herrera 2015b; Kipikasa 2008; Mohd 2012; Nachum 1999; and Nor 2007 because they included women with gestational diabetes. Porta 2011;Reller 1985; and Secher 2012 did not include suitable interventions. See Characteristics of excluded studies.
Risk of bias in included studies
Overall, the five trials had a high risk of bias, due to lack of allocation concealment, lack of blinding, incomplete outcome data, and selective reporting of outcomes (Figure 2, Figure 3).

Risk of bias graph: review authors' judgements about each risk of bias item presented as percentages across all included studies.

Risk of bias summary: review authors' judgements about each risk of bias item for each included study.
Allocation
Random sequence generation
Two trials described the method of sequence generation used (computer‐generated randomisation (Persson 2002; Schuster 1998)). Three trials had an unclear risk of bias, as the method of random sequence generation was not described (Jovanovic‐Peterson 1992; Mathiesen 2007; Mathiesen 2012).
Allocation concealment
Two trials provided sufficient details on the method of allocation concealment (sealed opaque envelopes (Mathiesen 2012; Schuster 1998)). One trial had a high risk of bias for allocation concealment (open‐label (Jovanovic‐Peterson 1992)). Two trials had an unclear risk of allocation concealment, which was not reported in the trials (Mathiesen 2007; Mathiesen 2012).
Blinding
Performance bias
It was difficult to blind the women and staff to the interventions of insulin types or insulin regimens. All five trials had a high risk of performance bias, as the participants were aware of the treatment they were receiving. For personnel, one trial reported blinding personnel to the intervention, so this was deemed to have a low risk of bias (Schuster 1998), whilst the other four trials (Jovanovic‐Peterson 1992; Mathiesen 2007; Mathiesen 2012; Persson 2002) did not blind personnel, and these were deemed to have a high risk of bias.
Detection bias
Two trials had a high risk of detection bias (open‐label (Mathiesen 2007; Persson 2002)), Three trials had an unclear risk of detection bias, which was not described in two of them (Jovanovic‐Peterson 1992; Schuster 1998), and one trial reported blinding of outcome assessment for only one outcome (congenital malformations (Mathiesen 2012)).
Incomplete outcome data
Only one trial adequately described losses to follow‐up, and women were equally distributed between the four groups in this study (Schuster 1998). Details regarding attrition bias were not reported in the other four trials (Jovanovic‐Peterson 1992; Mathiesen 2007; Mathiesen 2012; Persson 2002).
Selective reporting
Two trials had an unclear risk of bias, as no protocol for either trial was available, and therefore, it was not clear whether all prespecified outcomes were reported (Jovanovic‐Peterson 1992; Schuster 1998). Three trials were deemed to have high risk of reporting bias (Mathiesen 2007; Mathiesen 2012; Persson 2002). In the trial by Persson 2002, some outcomes were described as showing no differences, but these figures are not given. For two trials, we included a subgroup of women who were pregnant at randomisation, and for these women, very few outcomes were reported (Mathiesen 2007; Mathiesen 2012). Contact with the authors to gain information on this subgroup proved unsuccessful.
Other potential sources of bias
Three trials had unclear risk of bias (Mathiesen 2007; Mathiesen 2012; Persson 2002). One trial reported that there were no significant differences between the two treatment groups with regard to baseline characteristics, however, significantly more women in the Lispro group had aneurysms (Persson 2002), and two trials were funded by the pharmaceutical company Novo Nordisk© (Mathiesen 2007; Mathiesen 2012). Two trials had a low risk of bias as it was reported that there was no difference in baseline characteristics between the two groups, which was clear from the tables (Jovanovic‐Peterson 1992; Schuster 1998).
Effects of interventions
See: Summary of findings for the main comparison Lispro versus regular insulin (Different insulin types within similar insulin regimens); Summary of findings 2 Human insulin versus animal insulin (Different insulin types within similar insulin regimens); Summary of findings 3 Pre‐mixed insulin (70 NPH/30 REG) versus self‐mixed split dose insulin (Different insulin regimens with similar insulin types used within the regimen); Summary of findings 4 Insulin injected with a Novolin pen versus insulin injected with a needle or syringe (Different insulin regimens with similar insulin types used within the regimen); Summary of findings 5 Insulin Aspart (+ NPH) compared to human insulin (+ NPH insulin) for pregnant women with pre‐existing diabetes (Different insulin types within similar insulin regimens); Summary of findings 6 Insulin Detemir + prandial insulin Aspart versus NPH insulin + prandial insulin Aspart (Different insulin types within similar insulin regimens)
See: summary of findings Table for the main comparison, Lispro versus regular insulin (Different insulin types within similar insulin regimens); summary of findings Table 2, Human insulin (recombinant deoxyribonucleic acid ‐ Humulin) versus animal insulin (Different insulin types within similar insulin regimens); summary of findings Table 3, Pre‐mixed insulin (70 NPH/30 REG) versus self‐mixed split dose insulin (Different insulin regimens with similar insulin types used within the regimen); summary of findings Table 4, Insulin injected with a Novolin pen versus insulin injected with a needle/syringe (Different insulin regimens with similar insulin types used within the regimen); summary of findings Table 5, Insulin Aspart plus NPH insulin versus Human insulin plus NPH insulin (Different insulin types within similar insulin regimens); summary of findings Table 6, Insulin Detemir plus prandial insulin Aspart versus NPH insulin plus prandial insulin Aspart (Different insulin types within similar insulin regimens).
1. Lispro versus regular insulin (Different insulin types within similar insulin regimens)
See summary of findings Table for the main comparison. We included one trial in this comparison, involving a total of 33 women (Persson 2002). The evidence was downgraded to very low‐quality for all the outcomes supported by this trial for the following reasons: study limitations (there was a high or unclear risk of bias for allocation concealment, blinding of participants and personnel, blinding of outcome assessment, incomplete outcome data, selective outcome reporting, and other biases), and sparse data (one small study, few events for the outcomes, very wide confidence intervals often crossing the line of no effect).
Primary outcomes
Infant
There were no perinatal deaths in the Lispro or regular insulin group (Analysis 1.1).
Maternal
There was very low‐quality evidence from one study (33 women) of no clear difference between insulin Lispro and regular insulin in the primary maternal outcomes of caesarean section (risk ratio (RR) 0.59, 95% confidence interval (CI) 0.25 to 1.39; 33 women; Analysis 1.2), and pregnancy‐induced hypertension or pre‐eclampsia (RR 0.68, 95% CI 0.35 to 1.30; Analysis 1.3).
Secondary outcomes
Infant
There was very low‐quality evidence from one study (33 infants) of no clear difference between insulin Lispro and regular insulin in the secondary infant outcomes of fetal anomaly (RR 0.35, 95% CI 0.02 to 8.08; Analysis 1.4). There were no cases of birth trauma, including shoulder dystocia, nerve palsy, and fracture in either group (Analysis 1.5).
Maternal
There was very low‐quality evidence from one study (33 women) of no clear differences between insulin Lispro and regular insulin in the secondary maternal outcomes of vaginal delivery (spontaneous, ventouse, forceps (RR 1.46, 95% CI 0.80 to 2.67; Analysis 1.6), and measures of diabetic metabolic control: blood glucose at week 14 after lunch (mean difference (MD) ‐1.09 mmol/L, 95% CI ‐3.60 to 1.42; Analysis 1.7); blood glucose after lunch at weeks 21, 28, and 34 combined (MD ‐0.04 mmol/L, 95% CI ‐2.10 to 2.02; Analysis 1.8); increase of blood glucose after lunch before week 14 (MD 1.00 mmol/L, 95% CI ‐1.52 to 3.52; Analysis 1.9); increase of blood glucose after lunch during weeks 21, 28, and 34 combined (MD 0.10 mmol/L, 95% CI ‐2.12 to 2.32; Analysis 1.10); maternal hypoglycaemia and hyperglycaemia episodes requiring intervention (RR 0.21, 95% CI 0.01 to 4.10; Analysis 1.11); and retinopathy (RR 1.06, 95% CI 0.17 to 6.67; Analysis 1.12). Caution is advised in interpreting the data where there are wide confidence intervals, small sample size, and low event rates in this comparison.
Outcomes not prespecified in protocol
Maternal
There was very low‐quality evidence from one study (33 women) of no clear difference between insulin Lispro and regular insulin for ventouse delivery (RR 3.19, 95% CI 0.37 to 27.58; Analysis 1.13).
Outcomes not reported
Infant
Macrosomia, preterm birth at less than 37 weeks; small‐for‐gestational age at delivery; five‐minute Apgar score less than seven; birthweight centile corrected for gestational age at delivery, parity, ethnicity, maternal weight, and fetal sex; admission and length of stay in neonatal intensive care unit; mechanical ventilation; neonatal infection; jaundice requiring therapy; respiratory distress syndrome; necrotising enterocolitis; intracranial haemorrhage; artificial (tube) feeding; and the composite outcome measure of neonatal morbidity (admission and length of stay in neonatal intensive care unit; mechanical ventilation; neonatal infection; jaundice requiring therapy; respiratory distress syndrome; necrotising enterocolitis; intracranial haemorrhage; artificial (tube) feeding); neonatal anthropometry (length, head circumference, ponderal index); neonatal adiposity (fat mass, skinfold thickness); measures of growth and neurodevelopment at childhood follow‐up; birthweight; infant fasting C‐peptide level at three months; infant C‐peptide level one hour after glucose‐amino acid challenge at three months; infant glucose fasting level at three months; infant glucose level one hour after glucose‐amino acid challenge at three months; gestational age at delivery.
Maternal
Postpartum haemorrhage; severe perineal trauma (third‐ and fourth‐degree tear); weight gain in pregnancy; induction of labour (reasons related to diabetes); postpartum infection; breastfeeding; quality of life (psychological impact of management, assessed by psychometric testing with a reliable standardised questionnaire); use of healthcare resources (rate of antenatal clinic visits and admission for treatment relating to control of diabetes, ultrasound growth scans, biophysical scans, dopplers, cardiotocograph's); women's preference and satisfaction with treatment; an economic evaluation; maternal ketonuria; maternal compliance with treatment score (1 = best compliance, 5 = worst).
2. Human insulin (recombinant deoxyribonucleic acid ‐ Humulin) versus animal insulin (Different insulin types within similar insulin regimens)
See summary of findings Table 2. We included one trial in this comparison (Jovanovic‐Peterson 1992) involving a total of 42 women. The evidence supporting outcomes was downgraded to very low for the following reasons: study limitations (high or unclear risk of bias for allocation concealment, blinding of participants and personnel, blinding of outcome assessment, incomplete outcome data, selective outcome reporting, and other biases), and sparse data (one small study, few events for the outcomes, very wide confidence intervals often crossing the line of no effect).
Primary outcomes
Infant
There was very low‐quality evidence from one study (42 infants) of no clear difference between human insulin and animal insulin in the primary infant outcome of macrosomia (RR 0.22, 95% CI 0.01 to 4.30; Analysis 2.8).
Maternal
None reported.
Secondary outcomes
Infant
There was very low‐quality evidence from one study (42 infants) of no clear differences between human insulin and animal insulin for: preterm birth less than 37 weeks (RR 7.67, 95% CI 0.42 to 139.83, Analysis 2.2), birthweight centile (MD ‐6.70%, 95% CI ‐23.64% to 10.24%; Analysis 2.3), infant length (MD ‐3.30 cm, 95% CI ‐6.74 to 0.14; Analysis 2.4), skinfold thickness (MD ‐4.10 mm, 95% CI ‐13.28 to 5.08; Analysis 2.5), or body weight percentile (MD ‐6.70%, 95% CI ‐23.64 to 10.24; Analysis 2.6). The infants of women who were in the human insulin group had a smaller mean head circumference than those in the animal insulin group (MD ‐5.10 cm, 95% CI ‐9.52 to ‐0.68; Analysis 2.7). There were no cases of babies who were small‐for‐gestational age at delivery (Analysis 2.1).
Maternal
There was very low‐quality evidence from one study (42 women) that for the measure of diabetic metabolic control, women in the human insulin group had a lower mean insulin requirement during pregnancy (MD ‐0.33 U/kg/24 hour, 95% CI ‐0.45 to ‐0.21; Analysis 2.9) compared to women in the animal insulin group.
Outcomes not prespecified in protocol
Infant
There was very low‐quality evidence from one study (42 infants) that infants in the human group had a lower mean birthweight (MD ‐591.00 g, 95% CI ‐1066.27 to ‐115.73; Analysis 2.10), a very slightly lower infant fasting C‐peptide level at three months (MD ‐0.07 pmol/mL, 95% CI ‐0.13 to ‐0.01; Analysis 2.11), and a lower infant C‐peptide level one hour after glucose amino acid challenge at three months (MD ‐0.11 pmol/mL, 95% CI ‐0.19 to ‐0.03; Analysis 2.12). No clear difference was found for infant glucose fasting level at three months (MD ‐0.20 pmol/mL, 95% CI ‐0.62 to 0.22; Analysis 2.13); infant glucose level one hour after glucose amino acid challenge at three months (MD 0.50 pmol/mL, 95% CI ‐0.04 to 1.04; Analysis 2.14), or gestational age at delivery (MD 0.50 weeks, 95% CI ‐3.70 to 4.70; Analysis 2.15).
Maternal
There was very low‐quality evidence from one study (42 women) that the human insulin group had an unclear lower risk of maternal ketonuria (RR 0.37, 95% CI 0.08 to 1.61; Analysis 2.16).
Outcomes not reported
Infant
Perinatal death; fetal anomaly; birth trauma including shoulder dystocia, nerve palsy and fracture; five‐minute Apgar score less than seven; birthweight centile corrected for gestational age at delivery, parity, ethnicity, maternal weight and fetal sex; admission and length of stay in neonatal intensive care unit; mechanical ventilation; neonatal infection; jaundice requiring therapy; respiratory distress syndrome; necrotising enterocolitis; intracranial haemorrhage; artificial (tube) feeding; a composite outcome measure of neonatal morbidity (admission and length of stay in neonatal intensive care unit, mechanical ventilation, neonatal infection, jaundice requiring therapy, respiratory distress syndrome, necrotising enterocolitis, intracranial haemorrhage, artificial (tube) feeding) and measures of growth and neurodevelopment at childhood follow‐up.
Maternal
Caesarean section; pre‐eclampsia; vaginal delivery (spontaneous, ventouse, forceps); postpartum haemorrhage; severe perineal trauma (third‐ and fourth‐degree tear); maternal hypoglycaemia and hyperglycaemia episodes requiring intervention; weight gain in pregnancy; induction of labour (reasons related to diabetes); postpartum infection; breastfeeding; retinopathy; quality of life; use of healthcare resources; women's preference and satisfaction with treatment; an economic evaluation; ventouse delivery; and maternal compliance with treatment score (1 = best, 5 = worst compliance).
3. Pre‐mixed insulin (70 NPH/30 REG) versus self‐mixed split dose insulin (Different insulin regimens with similar insulin types used within the regimen)
See summary of findings Table 3. We included one trial in this comparison (Schuster 1998) involving a total of 93 women. The evidence supporting the outcomes was downgraded to very low for the following reasons: study limitations (high or unclear risk of bias for allocation concealment, blinding of participants and personnel, blinding of outcome assessment, incomplete outcome data, selective outcome reporting, and other biases), and sparse data (one small study, few events for the outcomes, very wide confidence intervals often crossing the line of no effect).
Primary outcomes
Infant
There was very low‐quality evidence from one study (93 infants) of no clear difference between pre‐mixed insulin and self‐mixed insulin for macrosomia (RR 0.49, 95% CI 0.09 to 2.54; Analysis 3.1)
Maternal
There was very low‐quality evidence from one study (93 women) of no clear difference between pre‐mixed insulin and self‐mixed insulin for caesarean section (RR 0.57, 95% CI 0.25 to 1.32; Analysis 3.2)
Secondary outcomes
Infant
None reported.
Maternal
There was very low‐quality evidence from one study (93 women) that the pre‐mixed insulin group had significantly lower measures of diabetic metabolic control, measured by antepartum capillary glucose taken two hours after lunch (MD ‐11.25 mg/dL, 95% CI ‐12.55 to ‐9.95; 10,218 tests performed on 93 women; Analysis 3.3) compared to the self‐mixed insulin group. There was no clear difference between the pre‐mixed insulin and self‐mixed insulin groups for postpartum infection (endometritis; RR 0.52, 95% CI 0.26 to 1.04; Analysis 3.4); and use of healthcare resources (maternal hospital days; MD ‐0.50, 95% CI ‐1.40 to 0.41; Analysis 3.5)
Outcomes not prespecified in protocol
Infant
There was very low‐quality evidence from one study (93 infants) that there was no clear difference between the pre‐mixed and self‐mixed insulin groups for birthweight (MD ‐116.56 g, 95% CI ‐391.81 to 158.69; Analysis 3.6).
Maternal
There was very low‐quality evidence from one study (93 women) that there was no clear difference between the two groups in terms of the women's compliance score (ranges from 1 to 5, 1 = best, 5 = worst; MD 0.00, 95% CI ‐0.87 to 0.87; Analysis 3.7).
Outcomes not reported
Infant
Perinatal death; fetal anomaly; birth trauma including shoulder dystocia, nerve palsy and fracture; preterm birth at less than 37 weeks; small‐for‐gestational age at delivery; five‐minute Apgar score less than seven; birthweight centile corrected for gestational age at delivery, parity, ethnicity, maternal weight and fetal sex; admission and length of stay in neonatal intensive care unit; mechanical ventilation; neonatal infection; neonatal hypoglycaemia; insulin sensitivity (cord insulin, C‐peptide); jaundice requiring therapy; respiratory distress syndrome; hyperbilirubinaemia; necrotising enterocolitis; intracranial haemorrhage; artificial (tube) feeding; a composite outcome of neonatal morbidity (admission and length of stay in neonatal intensive care unit, mechanical ventilation, neonatal infection, neonatal hypoglycaemia, insulin sensitivity (cord insulin, C‐peptide), jaundice requiring therapy, respiratory distress syndrome, hyperbilirubinaemia, necrotising enterocolitis, intracranial haemorrhage, artificial (tube) feeding); neonatal anthropometry (length, head circumference, ponderal index); neonatal adiposity (fat mass, skinfold thickness) and measures of growth and neurodevelopment at childhood follow‐up; infant fasting C‐peptide level at three months; infant C‐peptide level one hour after glucose‐amino acid challenge at three months; infant glucose fasting level at three months; infant glucose level one hour after glucose‐amino acid challenge at three months; gestational age at delivery.
Maternal
Pre‐eclampsia; vaginal delivery (spontaneous, ventouse, forceps); postpartum haemorrhage; severe perineal trauma (third‐ and fourth‐degree tear), maternal hypoglycaemia and hyperglycaemic episodes requiring intervention; weight gain in pregnancy; induction of labour (reasons related to diabetes); breastfeeding; retinopathy; quality of life (psychological impact of management assessed by psychometric testing using a reliable standardised questionnaire); women's preference and satisfaction with treatment; an economic evaluation; ventouse delivery; maternal ketonuria.
4. Insulin injected with a Novolin pen versus insulin injected with a needle/syringe (Different insulin regimens with similar insulin types used within the regimen)
See summary of findings Table 4. We included one trial in this comparison (Schuster 1998) involving a total of 93 women. The evidence for the outcomes was downgraded to very low for the following reasons: study limitations (high or unclear risk of bias for allocation concealment, blinding of participants and personnel, blinding of outcome assessment, incomplete outcome data, selective outcome reporting, and other biases) and sparse data (one small study, few events for the outcomes, very wide confidence intervals often crossing the line of no effect).
Primary outcomes
Infant
There was very low‐quality evidence from one study (93 infants) of no clear difference between injecting with the Novolin pen and a conventional needle or syringe for macrosomia (RR 0.21, 95% CI 0.03 to 1.76; Analysis 4.1).
Maternal
There was very low‐quality evidence from one study (93 women) of a difference between the two groups for caesarean section (RR 0.38, 95% CI 0.15 to 0.97; Analysis 4.2).
Secondary outcomes
Infant
None reported.
Maternal
There was very low‐quality evidence from one study (93 women) that the Novolin pen group had a lower mean measure of diabetic metabolic control, measured by antepartum capillary glucose, taken two hours after lunch (MD ‐7.23 mg/dL), 95% CI ‐8.51 to ‐5.95; 10,218 tests performed on 93 women; Analysis 4.3) compared to the conventional syringe or needle group. There was no clear difference between injecting with the Novolin pen and a conventional needle or syringe for postpartum infection (endometritis; RR 0.56, 95% CI 0.28 to 1.14; Analysis 4.4) and use of healthcare resources (maternal hospital days; MD ‐0.56, 95% CI ‐1.45 to 0.33; Analysis 4.5).
Outcomes not prespecified in protocol
Infant
There was very low‐quality evidence from one study (93 infants) of no clear difference between injecting with the Novolin pen and a conventional needle or syringe for birthweight (MD ‐162.36 g, 95% CI ‐438.25 to 113.53; Analysis 4.6).
Maternal
There was very low‐quality evidence from one study (93 women) of no clear difference between the two groups in the women's compliance score (ranges from 1 to 5, 1 = best compliance, 5 = worst compliance; MD ‐0.21, 95% CI ‐0.83 to 0.41; Analysis 4.7).
Outcomes not reported
Infant
Perinatal death; fetal anomaly; birth trauma including shoulder dystocia, nerve palsy and fracture; preterm birth at less than 37 weeks; small‐for‐gestational age at delivery; five‐minute Apgar score less than seven; birthweight centile corrected for gestational age at delivery, parity, ethnicity, maternal weight and fetal sex; admission and length of stay in neonatal intensive care unit; mechanical ventilation; neonatal infection; neonatal hypoglycaemia; insulin sensitivity (cord insulin, C‐peptide); jaundice requiring therapy; respiratory distress syndrome; hyperbilirubinaemia; necrotising enterocolitis; intracranial haemorrhage; artificial (tube) feeding; a composite outcome of neonatal morbidity (admission and length of stay in neonatal intensive care unit, mechanical ventilation, neonatal infection, neonatal hypoglycaemia, insulin sensitivity (cord insulin, C‐peptide), jaundice requiring therapy, respiratory distress syndrome, hyperbilirubinaemia, necrotising enterocolitis, intracranial haemorrhage, artificial (tube) feeding); neonatal anthropometry (length, head circumference, ponderal index); neonatal adiposity (fat mass, skinfold thickness) and measures of growth and neurodevelopment at childhood follow‐up; infant fasting C‐peptide level at three months; infant C‐peptide level one hour after glucose‐amino acid challenge at three months; infant glucose fasting level at three months; infant glucose level one hour after glucose‐amino acid challenge at three months; gestational age at delivery.
Maternal
Pre‐eclampsia; vaginal delivery (spontaneous, ventouse, forceps); postpartum haemorrhage; severe perineal trauma (third‐ and fourth‐degree tear), maternal hypoglycaemia and hyperglycaemic episodes requiring intervention; weight gain in pregnancy; induction of labour (reasons related to diabetes); breastfeeding; retinopathy; quality of life (psychological impact of management, assessed by psychometric testing using a reliable standardised questionnaire); women's preference and satisfaction with treatment; an economic evaluation; ventouse delivery; maternal ketonuria.
5. Insulin Aspart + NPH insulin versus Human insulin + NPH insulin (Different insulin types within similar insulin regimens)
See summary of findings Table 5. We included one trial in this comparison (Mathiesen 2007) involving a total of 223 women. This is an empty 'summary of findings' table with no evidence or quality assessment as none of the primary outcomes were included in this trial.
Primary outcomes
Infant
None reported.
Maternal
None reported.
Secondary outcomes
Infant
None reported.
Maternal
There was very low‐quality evidence from one study (223 women) of no difference between insulin Aspart and human insulin for diabetic metabolic control, measured by A1c at third trimester visits (MD ‐0.10%, 95% CI ‐0.28 to 0.08; Analysis 5.1, average plasma glucose at third trimester visits (MD ‐0.20 mmol/L, 95% CI ‐0.53 to 0.13; Analysis 5.2); and maternal hypoglycaemic episodes (RR 1.06, 95% CI 0.99 to 1.14; Analysis 5.3);
Outcomes not prespecified in protocol
Infant
None.
Maternal
None.
Outcomes not reported
Infant
Macrosomia; perinatal death; fetal anomaly; birth trauma including shoulder dystocia, nerve palsy and fracture; preterm birth less than 37 weeks; small‐for‐gestational age at delivery; five‐minute Apgar score less than seven; birthweight centile corrected for gestational age at delivery, parity, ethnicity, maternal weight and fetal sex; admission and length of stay in neonatal intensive care unit; mechanical ventilation; neonatal infection; neonatal hypoglycaemia; insulin sensitivity (cord insulin, C‐peptide); jaundice requiring therapy; respiratory distress syndrome; hyperbilirubinaemia; necrotising enterocolitis; intracranial haemorrhage; artificial (tube) feeding; a composite outcome measure of neonatal morbidity (admission and length of stay in neonatal intensive care unit, mechanical ventilation, neonatal infection, neonatal hypoglycaemia, insulin sensitivity (cord insulin, C‐peptide), jaundice requiring therapy, respiratory distress syndrome, hyperbilirubinaemia, necrotising enterocolitis, intracranial haemorrhage, artificial (tube) feeding); neonatal anthropometry (length, head circumference, ponderal index); neonatal adiposity (fat mass, skinfold thickness) and measures of growth and neurodevelopment at childhood follow‐up; birthweight; infant fasting C‐peptide level at three months; infant C‐peptide level one hour after glucose‐amino acid challenge at three months; infant glucose fasting level at three months; infant glucose level one hour after glucose‐amino acid challenge at three months; gestational age at delivery.
Maternal
Caesarean section; pre‐eclampsia; vaginal delivery (spontaneous, ventouse, forceps); postpartum haemorrhage; severe perineal trauma (third‐ and fourth‐degree tear); weight gain in pregnancy; induction of labour (reasons related to diabetes); postpartum infection; breastfeeding; retinopathy; quality of life (psychological impact of management, assessed by psychometric testing using a reliable standardised questionnaire); use of healthcare resources (rate of antenatal clinic visits and admission for treatment relating to diabetic control, ultrasound growth scans, biophysical scans, dopplers, cardiotocograph's); women's preference and satisfaction with treatment; an economic evaluation; ventouse delivery; maternal ketonuria; maternal compliance with treatment score (1 = best, 5 = worst compliance).
6. Insulin Detemir + Aspart versus NPH insulin + Aspart (Different insulin types within similar insulin regimens)
See summary of findings Table 6. We included one trial in this comparison (Mathiesen 2012) involving a total of 162 women. The evidence for the outcomes supported by this study was downgraded to very low for study limitations (high or unclear risk of bias for allocation concealment, blinding of participants and personnel, incomplete outcome data, selective outcome reporting, and other biases) and sparse data (one small study, few events for the outcomes, very wide confidence intervals often crossing the line of no effect).
Primary outcomes
Infant
None reported.
Maternal
None reported.
Secondary outcomes
Infant
There was very low‐quality evidence from one study (162 infants) of no clear difference in the number of major fetal anomalies in the insulin Detemir group compared to the NPH insulin group (RR 3.15, 95% CI 0.33 to 29.67; Analysis 6.1), major fetal anomalies (RR 2.10, 95% CI 0.19 to 22.72; Analysis 6.2); minor fetal anomalies (RR 0.35, 95% CI 0.01 to 8.47; Analysis 6.3), and minor fetal anomalies (RR 1.05, 95% CI 0.22 to 5.05; Analysis 6.4). Outcome assessors were blinded for Analyses 6.1 and 6.3 and unblinded for Analyses 6.2 and 6.4.
Maternal
Outcomes not prespecified in protocol
Infant
None.
Maternal
None.
Outcomes not reported
Infant
Macrosomia; perinatal death; birth trauma including shoulder dystocia, nerve palsy and fracture; preterm birth less than 37 weeks; small‐for‐gestational age at delivery; five‐minute Apgar score less than seven; birthweight centile corrected for gestational age at delivery, parity, ethnicity, maternal weight and fetal sex; admission and length of stay in neonatal intensive care unit; mechanical ventilation; neonatal infection; neonatal hypoglycaemia; insulin sensitivity (cord insulin, C‐peptide); jaundice requiring therapy; respiratory distress syndrome; hyperbilirubinaemia; necrotising enterocolitis; intracranial haemorrhage; artificial (tube) feeding; a composite outcome measure of neonatal morbidity (admission and length of stay in neonatal intensive care unit, mechanical ventilation, neonatal infection, neonatal hypoglycaemia, insulin sensitivity (cord insulin, C‐peptide), jaundice requiring therapy, respiratory distress syndrome, hyperbilirubinaemia, necrotising enterocolitis, intracranial haemorrhage, artificial (tube) feeding); neonatal anthropometry (length, head circumference, ponderal index); neonatal adiposity (fat mass, skinfold thickness) and measures of growth and neurodevelopment at childhood follow‐up; birthweight; infant fasting C‐peptide level at three months; infant C‐peptide level one hour after glucose‐amino acid challenge at three months; infant glucose fasting level at three months; infant glucose level one hour after glucose‐amino acid challenge at three months; gestational age at delivery.
Maternal
Caesarean section; pre‐eclampsia; vaginal delivery (spontaneous, ventouse, forceps); postpartum haemorrhage; severe perineal trauma (third‐ and fourth‐degree tear); measures of diabetic metabolic control (levels of HbA1c, daily mean self‐monitored blood glucose, post‐prandial and fasting, continuous glucose monitoring); maternal hypoglycaemia and hyperglycaemic episodes requiring intervention; weight gain in pregnancy; induction of labour (reasons related to diabetes); postpartum infection; breastfeeding; retinopathy; quality of life (psychological impact of management, assessed by psychometric testing using a reliable standardised questionnaire); use of healthcare resources (rate of antenatal clinic visits and admission for treatment relating to diabetic control, ultrasound growth scans, biophysical scans, dopplers, cardiotocograph's); women's preference and satisfaction with treatment; an economic evaluation; ventouse delivery; maternal ketonuria; maternal compliance with treatment score (1 = best, 5 = worst compliance).
Discussion
There are many different types of insulin (e.g. human, animal), and many different insulin regimens (e.g. injection of insulin via a pen or injection of insulin with a conventional needle or syringe). This review sought to investigate whether any particular type of insulin or any particular regimen was safer or more effective for improving maternal and fetal health and well‐being in pregnant women with pre‐existing type 1 or type 2 diabetes.
Summary of main results
This review included five trials, with a total of 554 women and 554 babies. We could not determine whether there were any clear differences for the primary infant outcomes (macrosomia and perinatal death) or primary maternal outcomes (caesarean section and pregnancy‐induced hypertension or pre‐eclampsia) for each of the comparisons of different insulin types (Lispro versus regular insulin summary of findings Table for the main comparison; Human insulin versus animal insulin summary of findings Table 2; Insulin Aspart versus human insulin summary of findings Table 5; and Insulin Detemir versus NPH insulin summary of findings Table 6), or for the different insulin regimens (Pre‐mixed insulin versus self‐mixed insulin summary of findings Table 3; and Insulin injected with a Novolin pen versus insulin injected with a conventional needle or syringe summary of findings Table 4), since many were not reported in the trials, and secondly, where they were reported, the data were from a single, small trial. There were also no clear differences found for the secondary infant and maternal outcomes. In one trial, human insulin was associated with a lower mean insulin requirement during pregnancy, compared with the animal insulin group. In another trial, pre‐mixed insulin was associated with a lower antepartum capillary glucose measurement two hours postprandial (after lunch) when compared with self‐mixed insulin. The same was found when the Novolin pen was compared with the conventional needle or syringe. In addition, there were fewer caesarean sections in the Novolin pen group compared with the conventional needle or syringe group. Many important outcomes were not reported in these trials including most primary outcomes and secondary infant and maternal outcomes. There was no long‐term follow‐up of infants in these studies, and information on healthcare use and satisfaction with insulin treatments was lacking.
Overall completeness and applicability of evidence
Overall, we only included five trials in this review that included pregnant women with pre‐existing diabetes. It was difficult to draw any firm conclusions from the trials, or to say that they were generalisable to the general pregnant population for many reasons. First of all, the sample sizes in the trials were small. Second, many of the review's primary prespecified outcomes were not reported, for example, perinatal death and pre‐eclampsia were each reported in only one trial, and macrosomia and caesarean section were each reported in only two trials. Further trials in pregnant women are required that are adequately powered, and that report all outcomes suggested in this review, to evaluate the different insulin types and regimens.
Quality of the evidence
The trials included in this review were small. Overall, the quality of reporting was poor, and therefore, risk of bias in all trials was either high or unclear. All of the trials were open trials, as it is difficult to blind participants or clinicians to the intervention allocation in trials such as those included in this review. However, outcome assessors could have been blinded but were not in the majority of the trials. We do not know if the pregnant women included in these trials were representative of the general population of women with pre‐existing type 1 or type 2 diabetes, but researchers should try to ensure that their trial populations reflect the general obstetric population as much as possible.
Most primary outcomes were not reported. For those that were reported, our GRADE assessment was that the quality of the evidence was very low (caesarean section, pregnancy‐induced hypertension or pre‐eclampsia, fetal anomaly, birth trauma, and macrosomia). This was because there was only a single study for each comparison, so pooling of the data was not possible, there were design limitations in the included trials (high or unclear risk of bias for allocation concealment, blinding of participants and personnel, blinding of outcome assessment, incomplete outcome data, selective outcome reporting and other biases) and sparse data (small sample sizes, wide confidence intervals that crossed the line of no effect, and few or no events). These judgements are shown in the summary of findings Table for the main comparison, summary of findings Table 2, summary of findings Table 3, summary of findings Table 4, and summary of findings Table 6. We were unable to populate summary of findings Table 5, because our primary outcomes were not reported for this comparison. Therefore, we could not conclude whether one type of insulin or one insulin regimen was better in pregnant women with pre‐existing diabetes for improving maternal and infant outcomes.
Potential biases in the review process
Risk of bias assessment is a subjective process. This can be minimised by following the procedures outlined in the Cochrane Handbook for Systematic Reviews of Interventions (Higgins 2011), whereby two or more review authors independently assess studies and resolve any disagreement through discussion, involving a third assessor to reach consensus as required. In this review, we undertook a comprehensive and systematic search of databases to reduce the potential for publication bias, and did not apply any language, date, or publication status restrictions.
Agreements and disagreements with other studies or reviews
Our findings, that the limited number of trials that provided very low‐quality evidence, restricted us from drawing any meaningful or scientific conclusions regarding the safety and effectiveness of one type of insulin over the other, or one insulin regimen over the other, in pregnant women with pre‐existing type 1 or type 2 diabetes. This was also the case in other reviews (Farrar 2016; Horvath 2007; Siebenhofer 2006). All reported that there was no evidence of any clear benefit of one insulin type or regimen over the other, and that large, randomised trials of better methodological quality are required. One review found that long‐acting insulin preparations seemed to have a beneficial effect on nocturnal glucose levels; their overall diabetes control was described as clinically unremarkable (Vardi 2008). This review included three very large randomised controlled trials but concluded that the findings warranted further substantiation. This review was not in pregnant women.

Study flow diagram.
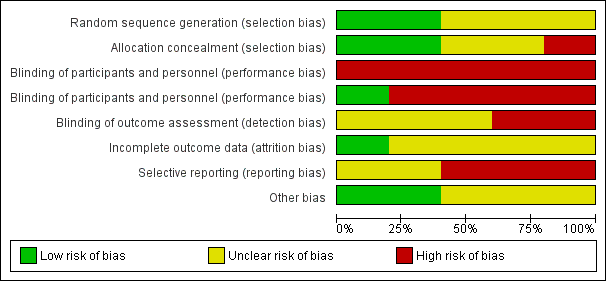
Risk of bias graph: review authors' judgements about each risk of bias item presented as percentages across all included studies.

Risk of bias summary: review authors' judgements about each risk of bias item for each included study.
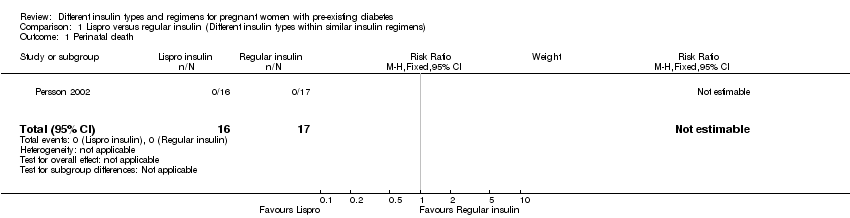
Comparison 1 Lispro versus regular insulin (Different insulin types within similar insulin regimens), Outcome 1 Perinatal death.
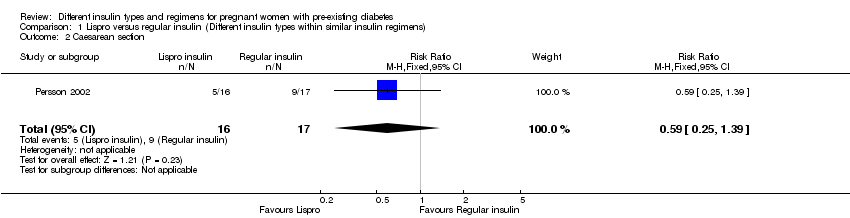
Comparison 1 Lispro versus regular insulin (Different insulin types within similar insulin regimens), Outcome 2 Caesarean section.

Comparison 1 Lispro versus regular insulin (Different insulin types within similar insulin regimens), Outcome 3 Pregnancy‐induced hypertension and pre‐eclampsia.

Comparison 1 Lispro versus regular insulin (Different insulin types within similar insulin regimens), Outcome 4 Fetal anomaly.

Comparison 1 Lispro versus regular insulin (Different insulin types within similar insulin regimens), Outcome 5 Birth trauma, including shoulder dystocia, nerve palsy, and fracture.
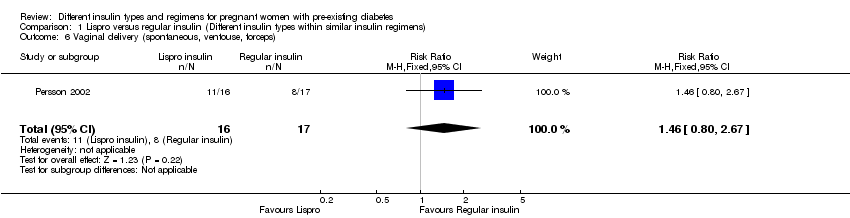
Comparison 1 Lispro versus regular insulin (Different insulin types within similar insulin regimens), Outcome 6 Vaginal delivery (spontaneous, ventouse, forceps).

Comparison 1 Lispro versus regular insulin (Different insulin types within similar insulin regimens), Outcome 7 Blood glucose (mmol/L) week 14 (after lunch).
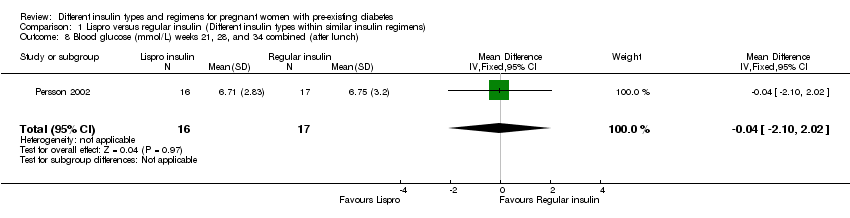
Comparison 1 Lispro versus regular insulin (Different insulin types within similar insulin regimens), Outcome 8 Blood glucose (mmol/L) weeks 21, 28, and 34 combined (after lunch).
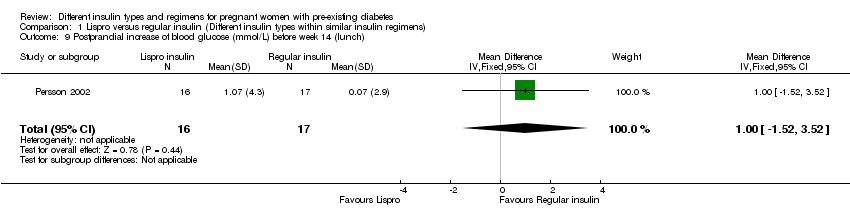
Comparison 1 Lispro versus regular insulin (Different insulin types within similar insulin regimens), Outcome 9 Postprandial increase of blood glucose (mmol/L) before week 14 (lunch).

Comparison 1 Lispro versus regular insulin (Different insulin types within similar insulin regimens), Outcome 10 Postprandial increase of blood glucose (mmol/L) during weeks 21, 28, and 34 combined (lunch).

Comparison 1 Lispro versus regular insulin (Different insulin types within similar insulin regimens), Outcome 11 Maternal hypoglycaemia and hyperglycaemia episodes requiring intervention.

Comparison 1 Lispro versus regular insulin (Different insulin types within similar insulin regimens), Outcome 12 Retinopathy.

Comparison 1 Lispro versus regular insulin (Different insulin types within similar insulin regimens), Outcome 13 Ventouse delivery.
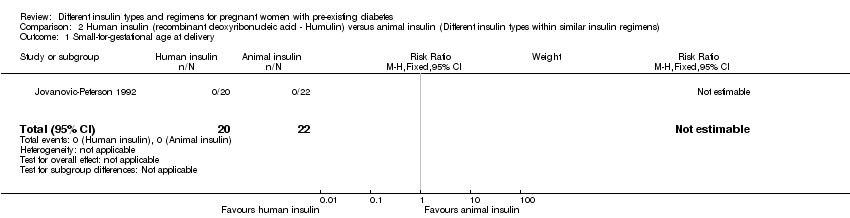
Comparison 2 Human insulin (recombinant deoxyribonucleic acid ‐ Humulin) versus animal insulin (Different insulin types within similar insulin regimens), Outcome 1 Small‐for‐gestational age at delivery.
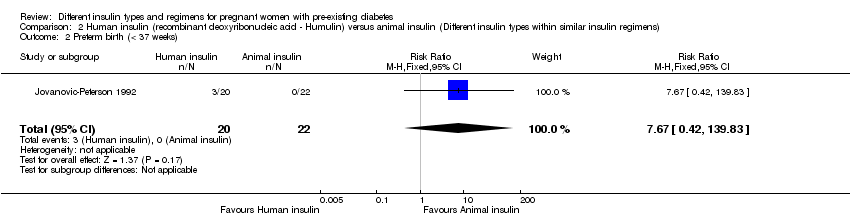
Comparison 2 Human insulin (recombinant deoxyribonucleic acid ‐ Humulin) versus animal insulin (Different insulin types within similar insulin regimens), Outcome 2 Preterm birth (< 37 weeks).

Comparison 2 Human insulin (recombinant deoxyribonucleic acid ‐ Humulin) versus animal insulin (Different insulin types within similar insulin regimens), Outcome 3 Birthweight centile (%).
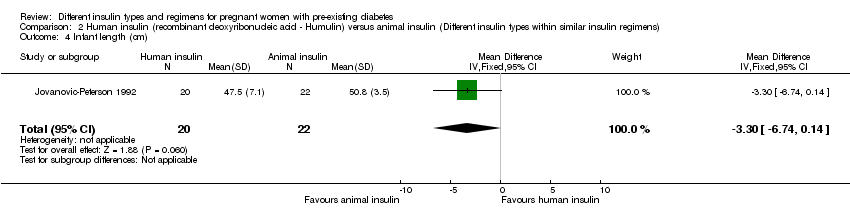
Comparison 2 Human insulin (recombinant deoxyribonucleic acid ‐ Humulin) versus animal insulin (Different insulin types within similar insulin regimens), Outcome 4 Infant length (cm).

Comparison 2 Human insulin (recombinant deoxyribonucleic acid ‐ Humulin) versus animal insulin (Different insulin types within similar insulin regimens), Outcome 5 Skinfold thickness (mm).

Comparison 2 Human insulin (recombinant deoxyribonucleic acid ‐ Humulin) versus animal insulin (Different insulin types within similar insulin regimens), Outcome 6 Body weight percentile (%).
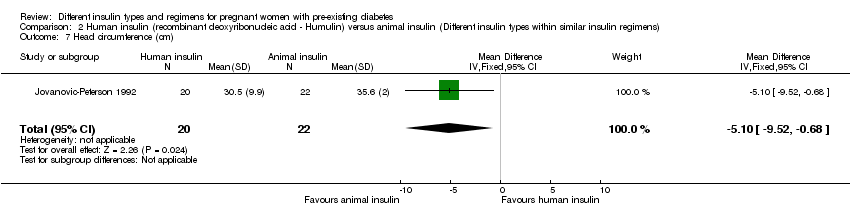
Comparison 2 Human insulin (recombinant deoxyribonucleic acid ‐ Humulin) versus animal insulin (Different insulin types within similar insulin regimens), Outcome 7 Head circumference (cm).
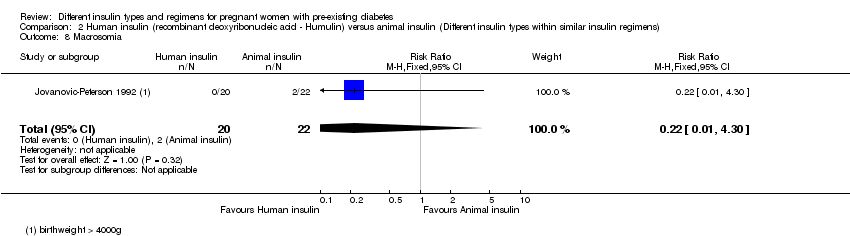
Comparison 2 Human insulin (recombinant deoxyribonucleic acid ‐ Humulin) versus animal insulin (Different insulin types within similar insulin regimens), Outcome 8 Macrosomia.

Comparison 2 Human insulin (recombinant deoxyribonucleic acid ‐ Humulin) versus animal insulin (Different insulin types within similar insulin regimens), Outcome 9 Insulin requirement during pregnancy (U/kg/24 hour).

Comparison 2 Human insulin (recombinant deoxyribonucleic acid ‐ Humulin) versus animal insulin (Different insulin types within similar insulin regimens), Outcome 10 Birthweight (g).

Comparison 2 Human insulin (recombinant deoxyribonucleic acid ‐ Humulin) versus animal insulin (Different insulin types within similar insulin regimens), Outcome 11 Infant fasting C‐peptide level at 3 months (pmol/mL).

Comparison 2 Human insulin (recombinant deoxyribonucleic acid ‐ Humulin) versus animal insulin (Different insulin types within similar insulin regimens), Outcome 12 Infant C‐peptide level 1 hour after glucose‐amino acid challenge at 3 months (pmol/mL).

Comparison 2 Human insulin (recombinant deoxyribonucleic acid ‐ Humulin) versus animal insulin (Different insulin types within similar insulin regimens), Outcome 13 Infant glucose fasting level at 3 months (pmol/mL).

Comparison 2 Human insulin (recombinant deoxyribonucleic acid ‐ Humulin) versus animal insulin (Different insulin types within similar insulin regimens), Outcome 14 Infant glucose level 1 hour after glucose‐amino acid challenge at 3 months (pmol/mL).

Comparison 2 Human insulin (recombinant deoxyribonucleic acid ‐ Humulin) versus animal insulin (Different insulin types within similar insulin regimens), Outcome 15 Gestational age at delivery (weeks).

Comparison 2 Human insulin (recombinant deoxyribonucleic acid ‐ Humulin) versus animal insulin (Different insulin types within similar insulin regimens), Outcome 16 Maternal ketonuria.
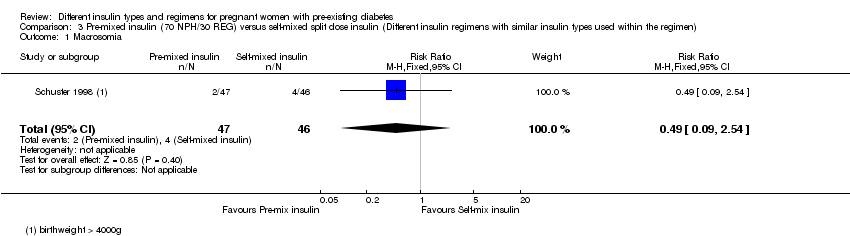
Comparison 3 Pre‐mixed insulin (70 NPH/30 REG) versus self‐mixed split dose insulin (Different insulin regimens with similar insulin types used within the regimen), Outcome 1 Macrosomia.

Comparison 3 Pre‐mixed insulin (70 NPH/30 REG) versus self‐mixed split dose insulin (Different insulin regimens with similar insulin types used within the regimen), Outcome 2 Caesarean section.

Comparison 3 Pre‐mixed insulin (70 NPH/30 REG) versus self‐mixed split dose insulin (Different insulin regimens with similar insulin types used within the regimen), Outcome 3 Antepartum capillary glucose measurement (mg/dL), 2 hours postprandial (after lunch).
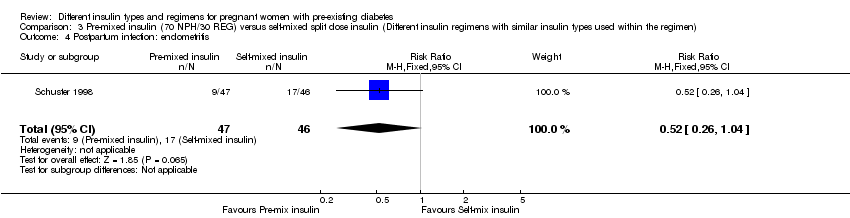
Comparison 3 Pre‐mixed insulin (70 NPH/30 REG) versus self‐mixed split dose insulin (Different insulin regimens with similar insulin types used within the regimen), Outcome 4 Postpartum infection: endometritis.

Comparison 3 Pre‐mixed insulin (70 NPH/30 REG) versus self‐mixed split dose insulin (Different insulin regimens with similar insulin types used within the regimen), Outcome 5 Use of healthcare resources (maternal hospital days).

Comparison 3 Pre‐mixed insulin (70 NPH/30 REG) versus self‐mixed split dose insulin (Different insulin regimens with similar insulin types used within the regimen), Outcome 6 Birthweight (g).

Comparison 3 Pre‐mixed insulin (70 NPH/30 REG) versus self‐mixed split dose insulin (Different insulin regimens with similar insulin types used within the regimen), Outcome 7 Compliance score.

Comparison 4 Insulin injected with a Novolin pen versus insulin injected with a needle (syringe) (Different insulin regimens with similar insulin types used within the regimen), Outcome 1 Macrosomia.
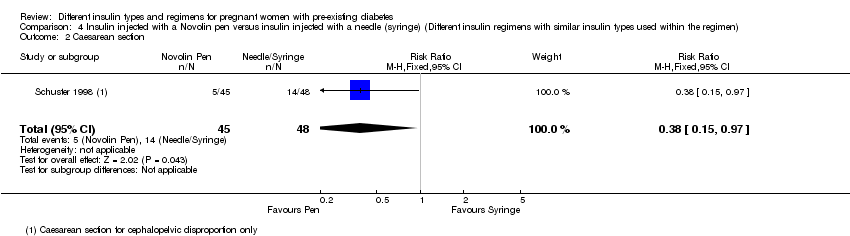
Comparison 4 Insulin injected with a Novolin pen versus insulin injected with a needle (syringe) (Different insulin regimens with similar insulin types used within the regimen), Outcome 2 Caesarean section.
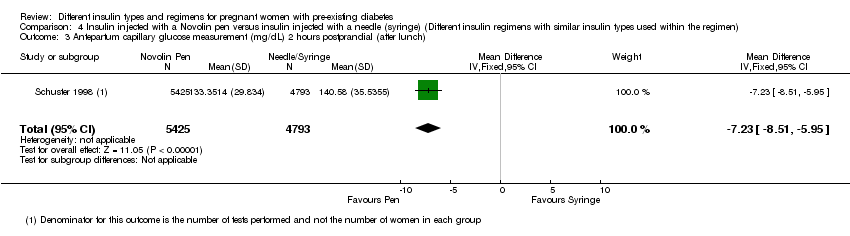
Comparison 4 Insulin injected with a Novolin pen versus insulin injected with a needle (syringe) (Different insulin regimens with similar insulin types used within the regimen), Outcome 3 Antepartum capillary glucose measurement (mg/dL) 2 hours postprandial (after lunch).

Comparison 4 Insulin injected with a Novolin pen versus insulin injected with a needle (syringe) (Different insulin regimens with similar insulin types used within the regimen), Outcome 4 Postpartum infection: endometritis.

Comparison 4 Insulin injected with a Novolin pen versus insulin injected with a needle (syringe) (Different insulin regimens with similar insulin types used within the regimen), Outcome 5 Use of healthcare resources (maternal hospital days).
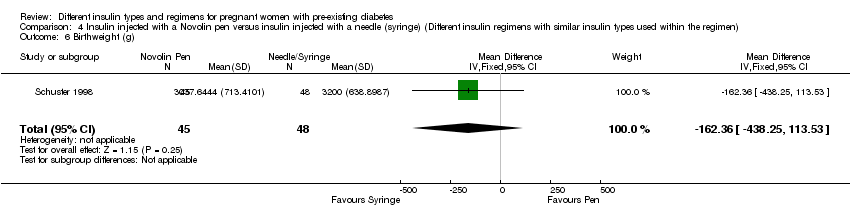
Comparison 4 Insulin injected with a Novolin pen versus insulin injected with a needle (syringe) (Different insulin regimens with similar insulin types used within the regimen), Outcome 6 Birthweight (g).

Comparison 4 Insulin injected with a Novolin pen versus insulin injected with a needle (syringe) (Different insulin regimens with similar insulin types used within the regimen), Outcome 7 Compliance score.
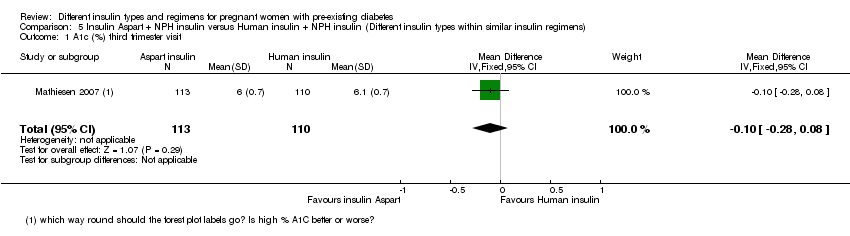
Comparison 5 Insulin Aspart + NPH insulin versus Human insulin + NPH insulin (Different insulin types within similar insulin regimens), Outcome 1 A1c (%) third trimester visit.
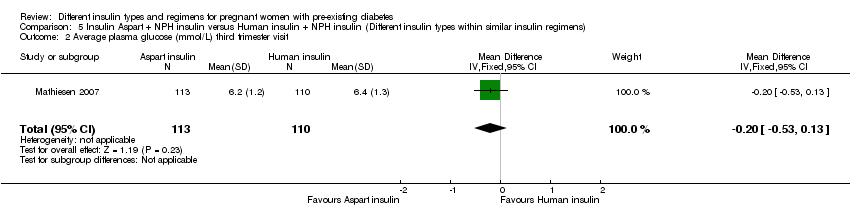
Comparison 5 Insulin Aspart + NPH insulin versus Human insulin + NPH insulin (Different insulin types within similar insulin regimens), Outcome 2 Average plasma glucose (mmol/L) third trimester visit.

Comparison 5 Insulin Aspart + NPH insulin versus Human insulin + NPH insulin (Different insulin types within similar insulin regimens), Outcome 3 Maternal hypoglycaemic episodes.

Comparison 6 Insulin Detemir + prandial insulin Aspart versus NPH insulin + prandial insulin Aspart (Different insulin types within similar insulin regimens), Outcome 1 Major congenital malformation.

Comparison 6 Insulin Detemir + prandial insulin Aspart versus NPH insulin + prandial insulin Aspart (Different insulin types within similar insulin regimens), Outcome 2 Major congenital malformation.

Comparison 6 Insulin Detemir + prandial insulin Aspart versus NPH insulin + prandial insulin Aspart (Different insulin types within similar insulin regimens), Outcome 3 Minor congenital malformation.
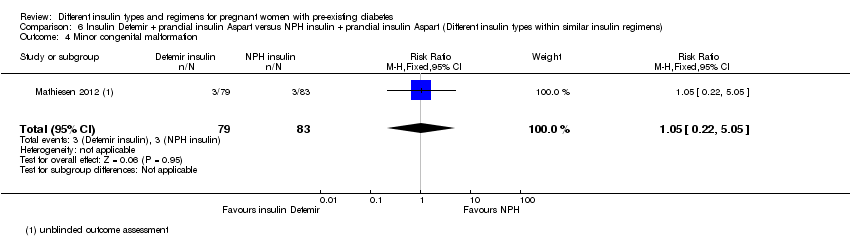
Comparison 6 Insulin Detemir + prandial insulin Aspart versus NPH insulin + prandial insulin Aspart (Different insulin types within similar insulin regimens), Outcome 4 Minor congenital malformation.
| Lispro versus regular insulin (Different insulin types within similar insulin regimens) | ||||||
| Patient or population: pregnant women with pre‐existing diabetes | ||||||
| Outcomes | Anticipated absolute effects* (95% CI) | Relative effect | № of participants | Quality of the evidence | Comments | |
| Risk with regular insulin | Risk with Lispro | |||||
| Macrosomia | (0 studies) | Not reported | ||||
| Perinatal death | Study population | not estimable | 33 | ⊕⊝⊝⊝ | ||
| 0 per 1000 | 0 per 1000 | |||||
| Pre‐eclampsia | Study population | RR 0.68 | 33 | ⊕⊝⊝⊝ | ||
| 647 per 1000 | 440 per 1000 | |||||
| Caesarean section | Study population | RR 0.59 | 33 | ⊕⊝⊝⊝ | ||
| 529 per 1000 | 312 per 1000 | |||||
| Fetal anomaly | Study population | RR 0.35 | 33 | ⊕⊝⊝⊝ | ||
| 59 per 1000 | 21 per 1000 | |||||
| Birth trauma, including shoulder dystocia, nerve palsy, and fracture | Study population | Not estimable | 33 | ⊕⊝⊝⊝ | ||
| 0 per 1000 | 0 per 1000 | |||||
| Composite outcome measure of neonatal morbidity | (0 studies) | Not reported | ||||
| *The risk in the intervention group (and its 95% confidence interval) is based on the assumed risk in the comparison group and the relative effect of the intervention (and its 95% CI). | ||||||
| GRADE Working Group grades of evidence | ||||||
| 1 High or unclear risk of bias for allocation concealment, blinding of participants and personnel, blinding of outcome assessment, incomplete outcome data, selective outcome reporting, and other biases 2 Small sample size and no events 3 One study with design limitations 4 Very wide 95% confidence intervals crossing the line of no effect 5 Small sample size with few events | ||||||
| Human insulin versus animal insulin (Different insulin types within similar insulin regimens) | ||||||
| Patient or population: pregnant women with pre‐existing diabetes | ||||||
| Outcomes | Anticipated absolute effects* (95% CI) | Relative effect | № of participants | Quality of the evidence | Comments | |
| Risk with animal insulin | Risk with human insulin (Humulin) | |||||
| Macrosomia | Study population | RR 0.22 | 42 | ⊕⊝⊝⊝ | ||
| 91 per 1000 | 20 per 1000 | |||||
| Perinatal death | (0 studies) | Not reported | ||||
| Pre‐eclampsia | (0 studies) | Not reported | ||||
| Caesarean section | (0 studies) | Not reported | ||||
| Fetal anomaly | (0 studies) | Not reported | ||||
| Birth trauma including shoulder dystocia, nerve palsy, and fracture | (0 studies) | Not reported | ||||
| Composite outcome measure of neonatal morbidity | (0 studies) | Not reported | ||||
| *The risk in the intervention group (and its 95% confidence interval) is based on the assumed risk in the comparison group and the relative effect of the intervention (and its 95% CI). | ||||||
| GRADE Working Group grades of evidence | ||||||
| 1 Risk of bias was high or unclear for random sequence generation, allocation concealment, blinding of participants and personnel, blinding of outcome assessment, incomplete outcome data, and selective outcome reporting 2 One study with serious design limitations including lack of blinding for allocation concealment 3 Very wide 95% confidence intervals crossing the line of no effect 4 Small sample size and few events | ||||||
| Pre‐mixed insulin (70 NPH/30 REG) versus self‐mixed split dose insulin (Different insulin regimens with similar insulin types used within the regimen) | ||||||
| Patient or population: pregnant women with pre‐existing diabetes | ||||||
| Outcomes | Anticipated absolute effects* (95% CI) | Relative effect | № of participants | Quality of the evidence | Comments | |
| Risk with self‐mixed split dose insulin | Risk with pre‐mixed insulin (70 NPH/30 REG) | |||||
| Macrosomia | Study population | RR 0.49 | 93 | ⊕⊝⊝⊝ | ||
| 87 per 1000 | 43 per 1000 | |||||
| Perinatal death | (0 studies) | Not reported | ||||
| Pre‐eclampsia | (0 studies) | Not reported | ||||
| Caesarean section 4 | Study population | RR 0.57 | 93 | ⊕⊝⊝⊝ | ||
| 261 per 1000 | 149 per 1000 | |||||
| Fetal anomaly | (0 studies) | Not reported | ||||
| Birth trauma including shoulder dystocia, nerve palsy, or fracture | (0 studies) | Not reported | ||||
| Composite outcome measure of neonatal morbidity | (0 studies) | Not reported | ||||
| *The risk in the intervention group (and its 95% confidence interval) is based on the assumed risk in the comparison group and the relative effect of the intervention (and its 95% CI). | ||||||
| GRADE Working Group grades of evidence | ||||||
| 1 Very wide 95% confidence intervals crossing the line of no effect 2 Small sample size and few events 3 One study with serious design limitations 4 Caesarean section for cephalo‐pelvic disproportion | ||||||
| Insulin injected with a Novolin pen versus insulin injected with a needle or syringe (Different insulin regimens with similar insulin types used within the regimen) | ||||||
| Patient or population: pregnant women with pre‐existing diabetes | ||||||
| Outcomes | Anticipated absolute effects* (95% CI) | Relative effect | № of participants | Quality of the evidence | Comments | |
| Risk with insulin injected with a needle or syringe | Risk with insulin injected with a Novolin pen | |||||
| Macrosomia | Study population | RR 0.21 | 93 | ⊕⊝⊝⊝ | ||
| 104 per 1000 | 22 per 1000 | |||||
| Perinatal death | (0 studies) | Not reported | ||||
| Pre‐eclampsia | (0 studies) | Not reported | ||||
| Caesarean section 4 | Study population | RR 0.38 | 93 | ⊕⊝⊝⊝ | ||
| 292 per 1000 | 111 per 1000 | |||||
| Fetal anomaly | (0 studies) | Not reported | ||||
| Birth trauma including shoulder dystocia, nerve palsy, or fracture | (0 studies) | Not reported | ||||
| Composite outcome measure of neonatal morbidity | (0 studies) | Not reported | ||||
| *The risk in the intervention group (and its 95% confidence interval) is based on the assumed risk in the comparison group and the relative effect of the intervention (and its 95% CI). | ||||||
| GRADE Working Group grades of evidence | ||||||
| 1 Very wide 95% confidence intervals crossing the line of no effect 2 Small sample size with few events 3 One study with serious design limitations 4 Caesarean section for cephalo‐pelvic disproportion | ||||||
| Insulin Aspart (+ NPH) compared to human insulin (+ NPH) for pregnant women with pre‐existing diabetes (Different insulin types within similar insulin regimens) | ||||||
| Patient or population: pregnant women with pre‐existing diabetes | ||||||
| Outcomes | Anticipated absolute effects* (95% CI) | Relative effect | № of participants | Quality of the evidence | Comments | |
| Risk with human insulin (+ NPH) | Risk with insulin Aspart (+ NPH) | |||||
| Macrosomia | ‐ | ‐ | ‐ | ‐ | ‐ | Not reported |
| Perinatal death | ‐ | ‐ | ‐ | ‐ | ‐ | Not reported |
| Pre‐eclampsia | ‐ | ‐ | ‐ | ‐ | ‐ | Not reported |
| Caesarean section | ‐ | ‐ | ‐ | ‐ | ‐ | Not reported |
| Fetal anomaly | ‐ | ‐ | ‐ | ‐ | ‐ | Not reported |
| Birth trauma including shoulder dystocia, nerve palsy and fracture | ‐ | ‐ | ‐ | ‐ | ‐ | Not reported |
| Composite outcome measure of neonatal morbidity | ‐ | ‐ | ‐ | ‐ | ‐ | Not reported |
| *The risk in the intervention group (and its 95% confidence interval) is based on the assumed risk in the comparison group and the relative effect of the intervention (and its 95% CI). | ||||||
| GRADE Working Group grades of evidence | ||||||
| Insulin Detemir + prandial insulin Aspart versus NPH insulin + prandial insulin Aspart (Different insulin types within similar insulin regimens) | ||||||
| Patient or population: pregnant women with pre‐existing diabetes | ||||||
| Outcomes | Anticipated absolute effects* (95% CI) | Relative effect | № of participants | Quality of the evidence | Comments | |
| Risk with NPH (+ Aspart) | Risk with insulin Detemir (+ Aspart) | |||||
| Macrosomia | (0 studies) | Not reported | ||||
| Perinatal death | (0 studies) | Not reported | ||||
| Pre‐eclampsia | (0 studies) | Not reported | ||||
| Caesarean section | (0 studies) | Not reported | ||||
| Fetal anomaly (major) 1 | Study population | RR 3.15 | 162 | ⊕⊝⊝⊝ | ||
| 12 per 1000 | 38 per 1000 | |||||
| Birth trauma including shoulder dystocia, nerve palsy, or fracture | (0 studies) | Not reported | ||||
| Composite outcome measure of neonatal morbidity | (0 studies) | Not reported | ||||
| *The risk in the intervention group (and its 95% confidence interval) is based on the assumed risk in the comparison group and the relative effect of the intervention (and its 95% CI). | ||||||
| GRADE Working Group grades of evidence | ||||||
| 1 Assessed by an expert who was blinded to the outcome 2 One study with design limitations 3 Very wide 95% confidence intervals crossing the line of no effect 4 Large effect estimate 5 Small sample size with few events | ||||||
| Outcome or subgroup title | No. of studies | No. of participants | Statistical method | Effect size |
| 1 Perinatal death Show forest plot | 1 | 33 | Risk Ratio (M‐H, Fixed, 95% CI) | 0.0 [0.0, 0.0] |
| 2 Caesarean section Show forest plot | 1 | 33 | Risk Ratio (M‐H, Fixed, 95% CI) | 0.59 [0.25, 1.39] |
| 3 Pregnancy‐induced hypertension and pre‐eclampsia Show forest plot | 1 | 33 | Risk Ratio (M‐H, Fixed, 95% CI) | 0.68 [0.35, 1.30] |
| 4 Fetal anomaly Show forest plot | 1 | 33 | Risk Ratio (M‐H, Fixed, 95% CI) | 0.35 [0.02, 8.08] |
| 5 Birth trauma, including shoulder dystocia, nerve palsy, and fracture Show forest plot | 1 | 33 | Risk Ratio (M‐H, Fixed, 95% CI) | 0.0 [0.0, 0.0] |
| 6 Vaginal delivery (spontaneous, ventouse, forceps) Show forest plot | 1 | 33 | Risk Ratio (M‐H, Fixed, 95% CI) | 1.46 [0.80, 2.67] |
| 7 Blood glucose (mmol/L) week 14 (after lunch) Show forest plot | 1 | 33 | Mean Difference (IV, Fixed, 95% CI) | ‐1.09 [‐3.60, 1.42] |
| 8 Blood glucose (mmol/L) weeks 21, 28, and 34 combined (after lunch) Show forest plot | 1 | 33 | Mean Difference (IV, Fixed, 95% CI) | ‐0.04 [‐2.10, 2.02] |
| 9 Postprandial increase of blood glucose (mmol/L) before week 14 (lunch) Show forest plot | 1 | 33 | Mean Difference (IV, Fixed, 95% CI) | 1.0 [‐1.52, 3.52] |
| 10 Postprandial increase of blood glucose (mmol/L) during weeks 21, 28, and 34 combined (lunch) Show forest plot | 1 | 33 | Mean Difference (IV, Fixed, 95% CI) | 0.10 [‐2.12, 2.32] |
| 11 Maternal hypoglycaemia and hyperglycaemia episodes requiring intervention Show forest plot | 1 | 33 | Risk Ratio (M‐H, Fixed, 95% CI) | 0.21 [0.01, 4.10] |
| 12 Retinopathy Show forest plot | 1 | 33 | Risk Ratio (M‐H, Fixed, 95% CI) | 1.06 [0.17, 6.67] |
| 13 Ventouse delivery Show forest plot | 1 | 33 | Risk Ratio (M‐H, Fixed, 95% CI) | 3.19 [0.37, 27.58] |
| Outcome or subgroup title | No. of studies | No. of participants | Statistical method | Effect size |
| 1 Small‐for‐gestational age at delivery Show forest plot | 1 | 42 | Risk Ratio (M‐H, Fixed, 95% CI) | 0.0 [0.0, 0.0] |
| 2 Preterm birth (< 37 weeks) Show forest plot | 1 | 42 | Risk Ratio (M‐H, Fixed, 95% CI) | 7.67 [0.42, 139.83] |
| 3 Birthweight centile (%) Show forest plot | 1 | 42 | Mean Difference (IV, Fixed, 95% CI) | ‐6.70 [‐23.64, 10.24] |
| 4 Infant length (cm) Show forest plot | 1 | 42 | Mean Difference (IV, Fixed, 95% CI) | ‐3.30 [‐6.74, 0.14] |
| 5 Skinfold thickness (mm) Show forest plot | 1 | 42 | Mean Difference (IV, Fixed, 95% CI) | ‐4.10 [‐13.28, 5.08] |
| 6 Body weight percentile (%) Show forest plot | 1 | 42 | Mean Difference (IV, Fixed, 95% CI) | ‐6.70 [‐23.74, 10.34] |
| 7 Head circumference (cm) Show forest plot | 1 | 42 | Mean Difference (IV, Fixed, 95% CI) | ‐5.10 [‐9.52, ‐0.68] |
| 8 Macrosomia Show forest plot | 1 | 42 | Risk Ratio (M‐H, Fixed, 95% CI) | 0.22 [0.01, 4.30] |
| 9 Insulin requirement during pregnancy (U/kg/24 hour) Show forest plot | 1 | 42 | Mean Difference (IV, Fixed, 95% CI) | ‐0.33 [‐0.45, ‐0.21] |
| 10 Birthweight (g) Show forest plot | 1 | 42 | Mean Difference (IV, Fixed, 95% CI) | ‐591.0 [‐1066.27, ‐115.73] |
| 11 Infant fasting C‐peptide level at 3 months (pmol/mL) Show forest plot | 1 | 42 | Mean Difference (IV, Fixed, 95% CI) | ‐0.07 [‐0.13, ‐0.01] |
| 12 Infant C‐peptide level 1 hour after glucose‐amino acid challenge at 3 months (pmol/mL) Show forest plot | 1 | 42 | Mean Difference (IV, Fixed, 95% CI) | ‐0.11 [‐0.19, ‐0.03] |
| 13 Infant glucose fasting level at 3 months (pmol/mL) Show forest plot | 1 | 42 | Mean Difference (IV, Fixed, 95% CI) | ‐0.20 [‐0.62, 0.22] |
| 14 Infant glucose level 1 hour after glucose‐amino acid challenge at 3 months (pmol/mL) Show forest plot | 1 | 42 | Mean Difference (IV, Fixed, 95% CI) | 0.5 [‐0.04, 1.04] |
| 15 Gestational age at delivery (weeks) Show forest plot | 1 | 42 | Mean Difference (IV, Fixed, 95% CI) | 0.5 [‐3.70, 4.70] |
| 16 Maternal ketonuria Show forest plot | 1 | 42 | Risk Ratio (M‐H, Fixed, 95% CI) | 0.37 [0.08, 1.61] |
| Outcome or subgroup title | No. of studies | No. of participants | Statistical method | Effect size |
| 1 Macrosomia Show forest plot | 1 | 93 | Risk Ratio (M‐H, Fixed, 95% CI) | 0.49 [0.09, 2.54] |
| 2 Caesarean section Show forest plot | 1 | 93 | Risk Ratio (M‐H, Fixed, 95% CI) | 0.57 [0.25, 1.32] |
| 3 Antepartum capillary glucose measurement (mg/dL), 2 hours postprandial (after lunch) Show forest plot | 1 | 10218 | Mean Difference (IV, Fixed, 95% CI) | ‐11.25 [‐12.55, ‐9.95] |
| 4 Postpartum infection: endometritis Show forest plot | 1 | 93 | Risk Ratio (M‐H, Fixed, 95% CI) | 0.52 [0.26, 1.04] |
| 5 Use of healthcare resources (maternal hospital days) Show forest plot | 1 | 94 | Mean Difference (IV, Fixed, 95% CI) | ‐0.50 [‐1.40, 0.41] |
| 6 Birthweight (g) Show forest plot | 1 | 93 | Mean Difference (IV, Fixed, 95% CI) | ‐116.56 [‐391.81, 158.69] |
| 7 Compliance score Show forest plot | 1 | 49 | Mean Difference (IV, Fixed, 95% CI) | 0.0 [‐0.87, 0.87] |
| Outcome or subgroup title | No. of studies | No. of participants | Statistical method | Effect size |
| 1 Macrosomia Show forest plot | 1 | 93 | Risk Ratio (M‐H, Fixed, 95% CI) | 0.21 [0.03, 1.76] |
| 2 Caesarean section Show forest plot | 1 | 93 | Risk Ratio (M‐H, Fixed, 95% CI) | 0.38 [0.15, 0.97] |
| 3 Antepartum capillary glucose measurement (mg/dL) 2 hours postprandial (after lunch) Show forest plot | 1 | 10218 | Mean Difference (IV, Fixed, 95% CI) | ‐7.23 [‐8.51, ‐5.95] |
| 4 Postpartum infection: endometritis Show forest plot | 1 | 93 | Risk Ratio (M‐H, Fixed, 95% CI) | 0.56 [0.28, 1.14] |
| 5 Use of healthcare resources (maternal hospital days) Show forest plot | 1 | 93 | Mean Difference (IV, Fixed, 95% CI) | ‐0.56 [‐1.45, 0.33] |
| 6 Birthweight (g) Show forest plot | 1 | 93 | Mean Difference (IV, Fixed, 95% CI) | ‐162.36 [‐438.25, 113.53] |
| 7 Compliance score Show forest plot | 1 | 93 | Mean Difference (IV, Fixed, 95% CI) | ‐0.21 [‐0.83, 0.41] |
| Outcome or subgroup title | No. of studies | No. of participants | Statistical method | Effect size |
| 1 A1c (%) third trimester visit Show forest plot | 1 | 223 | Mean Difference (IV, Fixed, 95% CI) | ‐0.10 [‐0.28, 0.08] |
| 2 Average plasma glucose (mmol/L) third trimester visit Show forest plot | 1 | 223 | Mean Difference (IV, Fixed, 95% CI) | ‐0.20 [‐0.53, 0.13] |
| 3 Maternal hypoglycaemic episodes Show forest plot | 1 | 223 | Risk Ratio (M‐H, Fixed, 95% CI) | 1.06 [0.99, 1.14] |
| Outcome or subgroup title | No. of studies | No. of participants | Statistical method | Effect size |
| 1 Major congenital malformation Show forest plot | 1 | 162 | Risk Ratio (M‐H, Fixed, 95% CI) | 3.15 [0.33, 29.67] |
| 2 Major congenital malformation Show forest plot | 1 | 162 | Risk Ratio (M‐H, Fixed, 95% CI) | 2.10 [0.19, 22.72] |
| 3 Minor congenital malformation Show forest plot | 1 | 162 | Risk Ratio (M‐H, Fixed, 95% CI) | 0.35 [0.01, 8.47] |
| 4 Minor congenital malformation Show forest plot | 1 | 162 | Risk Ratio (M‐H, Fixed, 95% CI) | 1.05 [0.22, 5.05] |