استفاده از داروی محرک الکتریکی داخل مثانهای برای سرطان مثانه غیر‐تهاجمی به عضلات
Referencias
منابع مطالعات واردشده در این مرور
منابع مطالعات خارجشده از این مرور
منابع مطالعات در انتظار ارزیابی
منابع اضافی
منابع دیگر نسخههای منتشرشده این مرور
Characteristics of studies
Characteristics of included studies [ordered by study ID]
| Methods | Design: RCT, cross‐over. Randomisation: blocked randomisation across 8 (2 × 2 × 2) strata derived from prognostic criteria. Setting: multicentre/Italy. Dates when study was conducted: June 1994 to March 2001. | |
| Participants | Inclusion criteria: people with histologically confirmed multifocal CIS of the bladder and most had concurrent pT1 papillary transitional‐cell carcinoma (all participants had adequate bone‐marrow reserve, normal renal function, normal liver function and a Karnofsky Performance Score of 50‐100). Exclusion criteria: people with a history of prior carcinoma of the bladder or upper urinary tract (or both), other malignancies within 5 years of registration and pregnancy. Total number of participants randomly assigned: 108. Group A Number of participants randomly assigned: 36. Median age (years, interquartile range): 64.5 (not reported). Number of participants according to gender (male/female): 26/10. Risk classification (number of participants):
Group B Number of participants randomly assigned: 36. Median age (years, interquartile range): 68.5 (not reported). Number of participants according to gender (male/female): 26/10. Risk classification (number of participants):
Group C Number of participants randomly assigned: 36. Median age (years, interquartile range): 66.5 (not reported). Number of participants according to gender (male/female): 27/9. Risk classification (number of participants):
| |
| Interventions | Group A MMC‐EMDA induction after TURBT: MMC 40 mg with excipient sodium chloride 960 mg dissolved in 100 mL water instilled and retained in bladder for 30 minutes with 20 mA pulsed electric current (600 mA/minute). Group B MMC‐PD induction after TURBT: MMC 40 mg with excipient sodium chloride 960 mg dissolved in 100 mL water instilled and retained in bladder for 60 minutes. Group C BCG induction after TURBT: intravesically with Pasteur BCG 81 mg wet weight (mean ± SEM: 10.2 ± 9.0 × 10⁸ cfu). Lyophilised BCG suspended in 50 mL bacteriostatic‐free sodium chloride 0.9% solution. After draining bladder, suspension instilled and retained for 120 minutes. Intervention duration: 6 intravesical treatments at weekly intervals about 3 weeks after TURBT. Adjuvant therapy for all groups 6 intravesical treatments at weekly intervals commencing approximately 3 weeks after multiple biopsy/TURBT procedures.
| |
| Outcomes |
Median duration and interquartile range of follow‐up (months): 43 (range: not reported). | |
| Funding sources | Supported by grants Progetti di Ricerca di Ateneo ex 60% 1999‐2000 and 2000‐2001 from Tor Vergata University of Rome. Electromotive equipment provided by Physion Srl, Medolla, Italy. | |
| Declarations of interest | Financial interest or other relationship with Physion Srl, or both. | |
| Notes | Language of article: English. | |
| Risk of bias | ||
| Bias | Authors' judgement | Support for judgement |
| Random sequence generation (selection bias) | Low risk | Quote: "Randomization and data collection were performed using a central computer." Judgement comment: randomisation performed by central computer. |
| Allocation concealment (selection bias) | Unclear risk | Judgement comment: no information given. |
| Blinding of participants and personnel (performance bias) | High risk | Judgement comment: no blinding reported; however, continued treatment was dependent on participant response so personnel blinding was unlikely. |
| Blinding of participants and personnel (performance bias) | Low risk | Judgement comment: blinding not reported, but unlikely to have affected outcome. |
| Blinding of outcome assessment (detection bias) | Low risk | Judgement comment: no blinding reported, but unlikely to have affected outcome. |
| Blinding of outcome assessment (detection bias) | High risk | Quote: "weeks after multiple biopsy/TUR [transurethral resection] procedures. Patients in the 3 groups who had a complete response to the initial 6 weekly treatments underwent a further 10 monthly instillations. If cancer persisted at 3 months, a second 6‐week course was given. If disease persisted at 6 months, there was a crossover to a 6‐week second line course of BCG for patients in." Judgement comment: blinding would have been broken due to additional MMC studies to MMC‐PD and MMC‐EMDA arm. |
| Incomplete outcome data (attrition bias) | Low risk | Judgement comment: all participants randomised and included in analysis across all groups at 3 months. |
| Selective reporting (reporting bias) | Unclear risk | Judgement comment: all outcomes reported well, but protocol was not published. |
| Other bias | Low risk | Quote: "A total of 53 patients underwent crossover treatments, including 40 with persistent disease who changed from passive MMC (25) and electromotive MMC (15) to a 6‐week course of BCG, while 13 in whom BCG failed changed to a course of electromotive MMC." Judgement comment: given that we only used data to a time‐point prior to cross‐over, the results of this review are not affected by this issue. |
| Methods | Design: RCT, not blinded. Randomisation: stratified‐blocked randomisation across 14 (i.e. 24‐2) strata as a results of four factors: primary versus recurrent tumours; multifocal versus unifocal tumours; grade 3 versus grade Setting: multicentre/Italy. Dates when study was conducted: 1 January 1994 to 30 June 2002. | |
| Participants | Inclusion criteria: people with histologically confirmed stage pT1 transitional‐cell carcinoma of the bladder, whether papillary or solid, regarded at high risk for tumour recurrence and at moderate‐ to high‐risk for progression because of: multifocal pT1, primary or recurrent, grade 2 transitional‐cell carcinoma; primary or recurrent pT1, multifocal or solitary, grade 3 transitional‐cell carcinoma; or pT1 with CIS, aged ≥ 18 years; adequate bone‐marrow reserve (i.e. white‐blood‐cell count ≥ 4000 × 106 cells/L and platelet count ≥ 120 × 109/L); normal renal function (i.e. serum creatinine ≤ 123.76 µmol/L); normal liver function (i.e. serum glutamic‐oxaloacetic transaminase ≤ 42 U/L, serum glutamic‐pyruvic transaminase ≤ 48 U/L and total bilirubin ≤ 22.23 µmol/L); and Karnofsky Performance Status between 50 and 100. Exclusion criteria: people with previous treatment with BCG or MMC‐EMDA; treatment with any other intravesical cytostatic agent within the past 6 months; concomitant urothelial tumours of the upper urinary tract; previous muscle‐invasive (i.e. ≥ stage T2) transitional‐cell carcinoma of the bladder; bladder capacity < 2 L; untreated urinary tract infection; severe systemic infection (i.e. sepsis); urethral strictures that would prevent endoscopic procedures and repeated catheterisation; disease of upper urinary tract (e.g. vesicoureteral reflux or urinary tract stones) that would make multiple transurethral procedures a risk; previous radiotherapy to the pelvis; other concurrent chemotherapy; treatment with radiotherapy‐response or biological‐response modifiers; history of tuberculosis; other malignant diseases within 5 years of trial registration (except for basal‐cell carcinoma); pregnancy or nursing; and psychological, familial, sociological or geographical factors that would preclude study participation. Total number of participants randomly assigned: 212. Group A Number of participants randomly assigned: 107. Median age (years, interquartile range): 66.0 (56.0‐73.0). Number of participants according to gender (male/female): 87/20. Risk classification (number of participants):
Group B Number of participants randomly assigned: 105. Median age (years, interquartile range): 67.0 (61.0‐73.0). Number of participants according to gender (male/female): 86/19. Risk classification (number of participants):
| |
| Interventions | Group A MMC‐EMDA with sequential BCG induction and maintenance after TURBT.
Group B BCG induction and maintenance after TURBT: see above. Induction therapy: about 3 weeks after TURBT. Group A BCG and sequential MMC‐EMDA: 3 cycles of treatment per week for 9 weeks for which 1 cycle consisted of 2 BCG infusions and 1 MMC infusion. Group B BCG alone: 6 intravesical treatments at weekly intervals. Maintenance therapy (disease‐free 3 months after treatment). Group A BCG and sequential MMC‐EMDA: 1 infusion per month for 9 months: 3 cycles of MMC, MMC and BCG. Group B BCG alone: monthly infusion of BCG for 10 months. | |
| Outcomes | Primary end point:
Secondary end points:
Toxic effects: local, systemic, or allergic adverse effects. Median duration and interquartile range of follow‐up (months): 88 (63‐110). | |
| Funding sources | Not reported. | |
| Declarations of interest | No conflicts of interest. | |
| Notes | Language of article: English. | |
| Risk of bias | ||
| Bias | Authors' judgement | Support for judgement |
| Random sequence generation (selection bias) | Low risk | Judgement comment: computer‐generated random sequence. |
| Allocation concealment (selection bias) | Unclear risk | Judgement comment: no information given. |
| Blinding of participants and personnel (performance bias) | High risk | Quote: "This study was not blinded because of differences in treatment schedules and drug appearance." Judgement comment: blinding was not done. |
| Blinding of participants and personnel (performance bias) | Low risk | Judgement comment: outcomes unlikely to be affected by lack of blinding. |
| Blinding of outcome assessment (detection bias) | Low risk | Judgement comment: blinding of outcome assessor may not have affected on objective outcomes. |
| Blinding of outcome assessment (detection bias) | High risk | Judgement comment: outcome assessors were not blinded. |
| Incomplete outcome data (attrition bias) | Low risk | Judgement comment: all participants randomised were included in analysis. |
| Selective reporting (reporting bias) | Low risk | Judgement comment: protocol (NCT01442519) was published and all outcomes reported well. |
| Other bias | Low risk | Judgement comment: not detected. |
| Methods | Design: RCT, parallel. Randomisation: stratified‐blocked randomisation across 6 (2 × 3) strata derived from prognostic criteria. Setting: multicentre/Italy. Dates when study was conducted: 1 January 1994 to 31 December 2003. | |
| Participants | Inclusion criteria: people aged ≥ 18 years with pTa and pT1 urothelial carcinoma of the bladder, adequate bone‐marrow reserve (i.e. white‐blood‐cell count ≥ 4000 × 106 cells/L; platelet count ≥ 120 × 109/L), normal renal function (i.e. serum creatinine ≤ 123.76 μmol/L), normal liver function (i.e. serum glutamic‐oxaloacetic aminotransferase ≤ 42 U/L, serum glutamic‐pyruvic aminotransferase ≤ 48 U/L and total bilirubin ≤ 22 μmol/L), and Eastern Cooperative Oncology Group performance status between 0 and 2. Exclusion criteria: people with non‐urothelial carcinomas of the bladder; previous bladder cancer; previous intravesical treatment with chemotherapeutic and immunotherapeutic drugs; known allergy to mitomycin; previous or concomitant urinary tract CIS, urothelial carcinoma of the upper urinary tract and urethra, or both; bladder capacity < 200 mL; untreated urinary tract infection; severe systemic infection (i.e. sepsis); treatment with immunosuppressive drugs; urethral strictures that would prevent endoscopic procedures and catheterisation; previous radiotherapy to the pelvis; other concurrent chemotherapy, radiotherapy, and treatment with biological response modifiers; other malignant diseases within 5 years of trial registration (except for adequately treated basal‐cell or squamous‐cell skin cancer, in situ cervical cancer); pregnancy; and any factors that would preclude study participation. Total number of participants randomly assigned: 374 (352: 11 with concomitant CIS and 11 with muscle invasive disease (stage pT2) were excluded on restaging TURBT. Group A Number of participants randomly assigned: 124 (117 in analysis). Median age (years, interquartile range): 67.0 (63.0‐74.0). Number of participants according to gender (male/female): 92/25. Risk classification (number of participants):
Group B Number of participants randomly assigned: 126 (119 in analysis). Median age (years, interquartile range): 67.0 (61.0‐72.0). Number of participants according to gender (male/female): 92/27. Risk classification (number of participants):
Group C Number of participants randomly assigned: 124 (116 in analysis). Median age (years, interquartile range): 66.5 (60.0‐73.0). Number of participants according to gender (male/female): 92/24. Risk classification (number of participants):
| |
| Interventions | Group A Single‐dose, MMC‐EMDA before TURBT: about 30 minutes before spinal or general anaesthesia TURBT participants received mitomycin 40 mg dissolved in 100 mL sterile water infused intravesically through the Foley catheter by gravity and retained in the bladder for 30 minutes, while 20 mA pulsed electric current for 30 minutes was given externally. The mitomycin solution was drained and TURBT was done. Group B Single‐dose, MMC‐PD immediately after TURBT: participants received mitomycin 40 mg dissolved in 50 mL sterile water within 6 hours of TURBT. After bladder draining, the mitomycin solution was infused intravesically through a Foley catheter, retained in the bladder for 60 minutes with catheter clamping, and then drained. Group C TURBT alone. Adjuvant therapy Induction therapy
Maintenance therapy (disease free at 3 months after induction treatment). Monthly intravesical instillation for 10 months, with the same dose and methods of infusion as initial assigned treatment. Total of 16 instillations were given over 12 months. | |
| Outcomes | Primary end points:
Secondary end points:
Safety: local, systemic, or allergic symptoms and adverse effects. Median duration and interquartile range of follow‐up (months): 86 (57‐125). | |
| Funding sources | None. | |
| Declarations of interest | No conflict of interest. | |
| Notes | Language of article: English. | |
| Risk of bias | ||
| Bias | Authors' judgement | Support for judgement |
| Random sequence generation (selection bias) | Low risk | Quote: "We randomly assigned patients to one of our three treatment groups by means of stratified–blocked randomisation across six (two by three) strata derived from two prognostic criteria: unifocal versus multifocal tumours, and grade 1 versus grade 2 versus grade 3 urothelial carcinoma. This method ensured prognostic parity among our three treatment groups." Judgement comment: computer‐generated sequence. |
| Allocation concealment (selection bias) | Low risk | Quote: "We concealed assignment by varying the blocking number. Variation of the block number prevented the clinician from guessing what the next treatment will be; therefore, varying the block sizes at random makes it difficult (although not impossible) to break the treatment code." Judgement comment: appropriate allocation concealment. |
| Blinding of participants and personnel (performance bias) | High risk | Quote: "Patients and the physicians giving the interventions were aware of assignment." Judgement comment: lack of blinding may have affected these outcomes. |
| Blinding of participants and personnel (performance bias) | Low risk | Quote: "Patients and physicians giving the interventions were aware of assignment." Judgement comment: not blinded but unlikely to be affected. |
| Blinding of outcome assessment (detection bias) | Low risk | Quote: "Assignment was masked from the outcome assessors and data analysts." Judgement comment: outcome assessors were blinded. |
| Blinding of outcome assessment (detection bias) | Low risk | Quote: "assignment was masked from the outcome assessors and data analysts." Judgement comment: outcome assessors were blinded. |
| Incomplete outcome data (attrition bias) | Low risk | Judgement comment: 117/124 (94.3%), 119/126 (94.4%), and 116/124 (93.5%) participants randomised in Group A, B and C were included in analysis, respectively. |
| Selective reporting (reporting bias) | Low risk | Judgement comment: protocol (NCT01149174) was published and all outcomes appeared reported. |
| Other bias | Low risk | Judgement comment: no other sources of bias detected. |
BCG: Bacillus Calmette‐Guerin; cfu: colony‐forming unit; CIS: carcinoma in situ; EAU: European Association of Urology; MMC‐EMDA: electromotive drug administration of mitomycin C; MMC‐PD: passive diffusion of mitomycin C; NMIBC: non‐muscle invasive bladder cancer; RCT: randomised controlled trial; SEM: standard error of the mean; TURBT: transurethral resection of bladder tumour.
Characteristics of excluded studies [ordered by study ID]
| Study | Reason for exclusion |
| Wrong study design (non‐randomised trial). | |
| Wrong study design (commentary). |
Characteristics of studies awaiting assessment [ordered by study ID]
| Methods | Randomised parallel open‐label trial. |
| Participants | Inclusion criteria
Exclusion criteria
|
| Interventions | Group A Transurethral resection alone: participants underwent urinary cytology, random cold‐cup biopsies of the bladder and prostatic urethra, and complete transurethral resection of all bladder tumour visible on endoscopy, ensuring muscle is included in resected samples. Group B Intravesical MMC‐PD after TURBT: mitomycin 40 mg dissolved in 50 mL sterile water is infused intravesically through a Foley catheter, retained in the bladder for 60 minutes with catheter clamping, and then drained. Participants who had a complete response to the initial 6 weekly treatments underwent a further 10 monthly instillations, with the same dose and methods of infusion as initial assigned treatment. Group C Intravesical electromotive mitomycin after TURBT: mitomycin 40 mg dissolved in 100 mL water is instilled and retained in the bladder for 30 minutes with 20 mA pulsed electric current, and then drained. Participants who had a complete response to the initial 6 weekly treatments underwent a further 10 monthly instillations with the same dose and methods of infusion as initial assigned treatment. Response to treatment will be assessed with cystoscopy, biopsy and urinary cytology at 3‐month intervals for 2 years, 6‐month intervals for 3 years and yearly thereafter. |
| Outcomes | Primary outcome Disease‐free interval (time frame: 120 months). Time from randomisation to first cystoscopy noting recurrence as recorded by pathological assessment of transurethral‐resection samples or biopsy samples. Secondary outcome Time to progression (time frame: 120 months). Time from randomisation until the onset of muscle invasive disease as recorded by pathological assessment of transurethral‐resection samples or biopsy samples. Overall survival (time frame: 120 months). Time from randomisation until death from any cause. Disease‐specific survival (time frame: 120 months). Time from randomisation until death from bladder cancer. |
| Notes | ClinicalTrials.gov Identifier: NCT01920269. This study has been completed, but the results have not published. |
EMDA: electromotive drug administration; MMC‐PD: passive diffusion of mitomycin C; TURBT: transurethral resection of bladder tumour.
Data and analyses
| Outcome or subgroup title | No. of studies | No. of participants | Statistical method | Effect size |
| 1 Time to recurrence Show forest plot | 1 | 72 | Risk Ratio (M‐H, Random, 95% CI) | 1.06 [0.64, 1.76] |
| Analysis 1.1 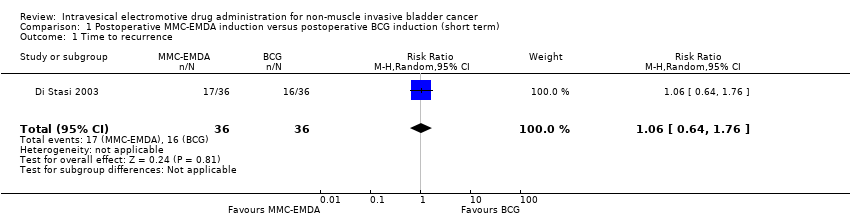 Comparison 1 Postoperative MMC‐EMDA induction versus postoperative BCG induction (short term), Outcome 1 Time to recurrence. | ||||
| 2 Time to progression Show forest plot | 1 | 72 | Risk Ratio (M‐H, Random, 95% CI) | 0.0 [0.0, 0.0] |
| Analysis 1.2  Comparison 1 Postoperative MMC‐EMDA induction versus postoperative BCG induction (short term), Outcome 2 Time to progression. | ||||
| 3 Serious adverse events Show forest plot | 1 | 72 | Risk Ratio (M‐H, Random, 95% CI) | 0.75 [0.18, 3.11] |
| Analysis 1.3  Comparison 1 Postoperative MMC‐EMDA induction versus postoperative BCG induction (short term), Outcome 3 Serious adverse events. | ||||
| 4 Disease‐specific survival Show forest plot | 1 | 72 | Risk Ratio (M‐H, Random, 95% CI) | 0.0 [0.0, 0.0] |
| Analysis 1.4  Comparison 1 Postoperative MMC‐EMDA induction versus postoperative BCG induction (short term), Outcome 4 Disease‐specific survival. | ||||
| 5 Time to death Show forest plot | 1 | 72 | Risk Ratio (M‐H, Random, 95% CI) | 0.0 [0.0, 0.0] |
| Analysis 1.5  Comparison 1 Postoperative MMC‐EMDA induction versus postoperative BCG induction (short term), Outcome 5 Time to death. | ||||
| Outcome or subgroup title | No. of studies | No. of participants | Statistical method | Effect size |
| 1 Time to recurrence Show forest plot | 1 | 72 | Risk Ratio (M‐H, Random, 95% CI) | 0.65 [0.44, 0.98] |
| Analysis 2.1  Comparison 2 Postoperative MMC‐EMDA induction versus MMC‐PD induction (short term), Outcome 1 Time to recurrence. | ||||
| 2 Time to progression Show forest plot | 1 | 72 | Risk Ratio (M‐H, Random, 95% CI) | 0.0 [0.0, 0.0] |
| Analysis 2.2  Comparison 2 Postoperative MMC‐EMDA induction versus MMC‐PD induction (short term), Outcome 2 Time to progression. | ||||
| 3 Serious adverse events Show forest plot | 1 | 72 | Risk Ratio (M‐H, Random, 95% CI) | 1.5 [0.27, 8.45] |
| Analysis 2.3  Comparison 2 Postoperative MMC‐EMDA induction versus MMC‐PD induction (short term), Outcome 3 Serious adverse events. | ||||
| 4 Disease‐specific survival Show forest plot | 1 | 72 | Risk Ratio (M‐H, Random, 95% CI) | 0.0 [0.0, 0.0] |
| Analysis 2.4  Comparison 2 Postoperative MMC‐EMDA induction versus MMC‐PD induction (short term), Outcome 4 Disease‐specific survival. | ||||
| 5 Time to death Show forest plot | 1 | 72 | Risk Ratio (M‐H, Random, 95% CI) | 0.0 [0.0, 0.0] |
| Analysis 2.5  Comparison 2 Postoperative MMC‐EMDA induction versus MMC‐PD induction (short term), Outcome 5 Time to death. | ||||
| Outcome or subgroup title | No. of studies | No. of participants | Statistical method | Effect size |
| 1 Time to recurrence Show forest plot | 1 | 212 | Hazard Ratio (Random, 95% CI) | 0.51 [0.34, 0.77] |
| Analysis 3.1  Comparison 3 Postoperative MMC‐EMDA with sequential BCG induction and maintenance versus postoperative BCG induction and maintenance (long term), Outcome 1 Time to recurrence. | ||||
| 2 Time to progression Show forest plot | 1 | 212 | Hazard Ratio (Random, 95% CI) | 0.36 [0.17, 0.75] |
| Analysis 3.2  Comparison 3 Postoperative MMC‐EMDA with sequential BCG induction and maintenance versus postoperative BCG induction and maintenance (long term), Outcome 2 Time to progression. | ||||
| 3 Serious adverse events Show forest plot | 1 | 212 | Risk Ratio (M‐H, Random, 95% CI) | 1.02 [0.21, 4.94] |
| Analysis 3.3  Comparison 3 Postoperative MMC‐EMDA with sequential BCG induction and maintenance versus postoperative BCG induction and maintenance (long term), Outcome 3 Serious adverse events. | ||||
| 4 Disease‐specific survival Show forest plot | 1 | 212 | Hazard Ratio (Random, 95% CI) | 0.31 [0.12, 0.80] |
| Analysis 3.4  Comparison 3 Postoperative MMC‐EMDA with sequential BCG induction and maintenance versus postoperative BCG induction and maintenance (long term), Outcome 4 Disease‐specific survival. | ||||
| 5 Time to death Show forest plot | 1 | 212 | Hazard Ratio (Random, 95% CI) | 0.59 [0.35, 1.00] |
| Analysis 3.5  Comparison 3 Postoperative MMC‐EMDA with sequential BCG induction and maintenance versus postoperative BCG induction and maintenance (long term), Outcome 5 Time to death. | ||||
| Outcome or subgroup title | No. of studies | No. of participants | Statistical method | Effect size |
| 1 Time to recurrence Show forest plot | 1 | 236 | Hazard Ratio (Random, 95% CI) | 0.47 [0.32, 0.69] |
| Analysis 4.1  Comparison 4 Single‐dose, preoperative MMC‐EMDA versus single‐dose, postoperative MMC‐PD (long term), Outcome 1 Time to recurrence. | ||||
| 2 Time to progression Show forest plot | 1 | 236 | Hazard Ratio (Random, 95% CI) | 0.81 [0.00, 259.93] |
| Analysis 4.2  Comparison 4 Single‐dose, preoperative MMC‐EMDA versus single‐dose, postoperative MMC‐PD (long term), Outcome 2 Time to progression. | ||||
| 3 Serious adverse events Show forest plot | 1 | 236 | Risk Ratio (M‐H, Random, 95% CI) | 0.79 [0.30, 2.05] |
| Analysis 4.3  Comparison 4 Single‐dose, preoperative MMC‐EMDA versus single‐dose, postoperative MMC‐PD (long term), Outcome 3 Serious adverse events. | ||||
| 4 Disease‐specific survival Show forest plot | 1 | 236 | Hazard Ratio (Random, 95% CI) | 0.99 [0.74, 1.32] |
| Analysis 4.4 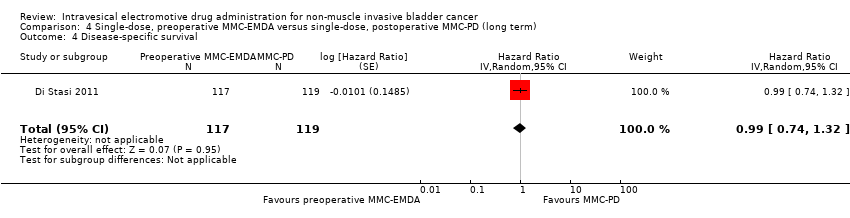 Comparison 4 Single‐dose, preoperative MMC‐EMDA versus single‐dose, postoperative MMC‐PD (long term), Outcome 4 Disease‐specific survival. | ||||
| 5 Time to death Show forest plot | 1 | 236 | Hazard Ratio (Random, 95% CI) | 0.89 [0.62, 1.28] |
| Analysis 4.5  Comparison 4 Single‐dose, preoperative MMC‐EMDA versus single‐dose, postoperative MMC‐PD (long term), Outcome 5 Time to death. | ||||
| 6 Minor adverse events Show forest plot | 1 | 236 | Risk Ratio (M‐H, Random, 95% CI) | 0.55 [0.42, 0.72] |
| Analysis 4.6 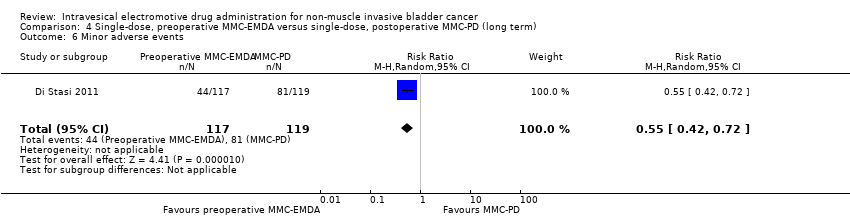 Comparison 4 Single‐dose, preoperative MMC‐EMDA versus single‐dose, postoperative MMC‐PD (long term), Outcome 6 Minor adverse events. | ||||
| Outcome or subgroup title | No. of studies | No. of participants | Statistical method | Effect size |
| 1 Time to recurrence Show forest plot | 1 | 233 | Hazard Ratio (Random, 95% CI) | 0.40 [0.28, 0.57] |
| Analysis 5.1  Comparison 5 Single‐dose, preoperative MMC‐EMDA versus TURBT alone (long term), Outcome 1 Time to recurrence. | ||||
| 2 Time to progression Show forest plot | 1 | 233 | Hazard Ratio (Random, 95% CI) | 0.74 [0.00, 247.93] |
| Analysis 5.2 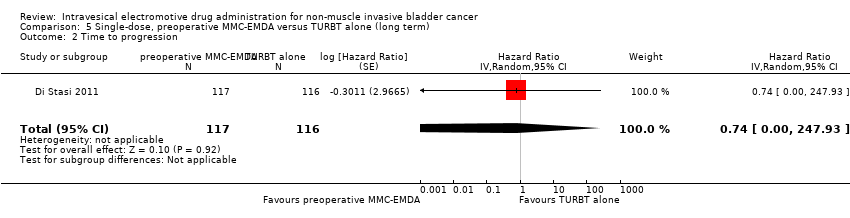 Comparison 5 Single‐dose, preoperative MMC‐EMDA versus TURBT alone (long term), Outcome 2 Time to progression. | ||||
| 3 Serious adverse events Show forest plot | 1 | 233 | Risk Ratio (M‐H, Random, 95% CI) | 1.74 [0.52, 5.77] |
| Analysis 5.3  Comparison 5 Single‐dose, preoperative MMC‐EMDA versus TURBT alone (long term), Outcome 3 Serious adverse events. | ||||
| 4 Disease‐specific survival Show forest plot | 1 | 233 | Hazard Ratio (Random, 95% CI) | 1.06 [0.80, 1.40] |
| Analysis 5.4  Comparison 5 Single‐dose, preoperative MMC‐EMDA versus TURBT alone (long term), Outcome 4 Disease‐specific survival. | ||||
| 5 Time to death Show forest plot | 1 | 233 | Hazard Ratio (Random, 95% CI) | 1.07 [0.73, 1.57] |
| Analysis 5.5  Comparison 5 Single‐dose, preoperative MMC‐EMDA versus TURBT alone (long term), Outcome 5 Time to death. | ||||
| 6 Minor adverse events Show forest plot | 1 | 233 | Risk Ratio (M‐H, Random, 95% CI) | 1.68 [1.11, 2.53] |
| Analysis 5.6 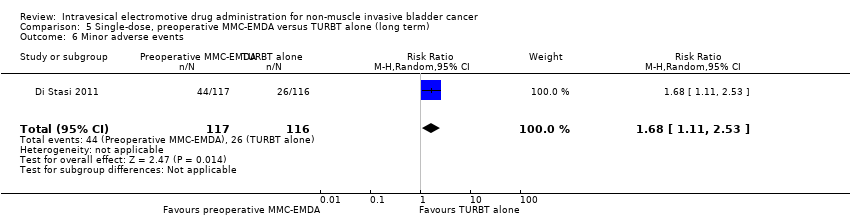 Comparison 5 Single‐dose, preoperative MMC‐EMDA versus TURBT alone (long term), Outcome 6 Minor adverse events. | ||||

Study flow diagram.

Risk of bias graph: review authors' judgements about each risk of bias item presented as percentages across all included studies.
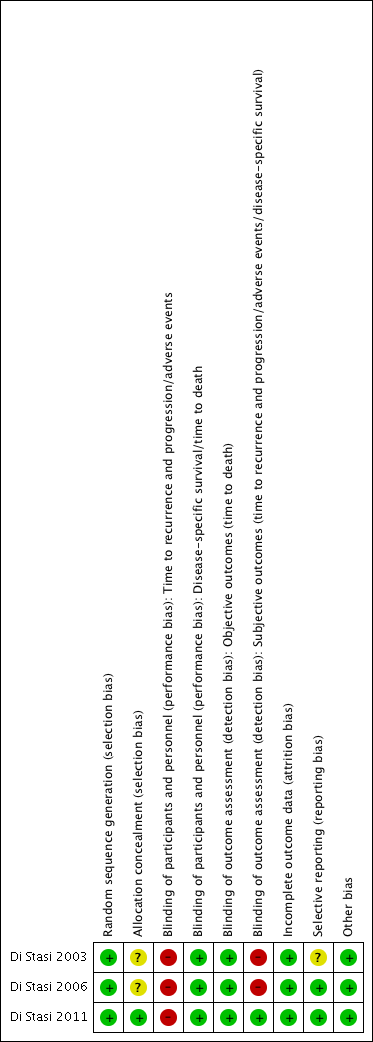
Risk of bias summary: review authors' judgements about each risk of bias item for each included study.

Comparison 1 Postoperative MMC‐EMDA induction versus postoperative BCG induction (short term), Outcome 1 Time to recurrence.

Comparison 1 Postoperative MMC‐EMDA induction versus postoperative BCG induction (short term), Outcome 2 Time to progression.
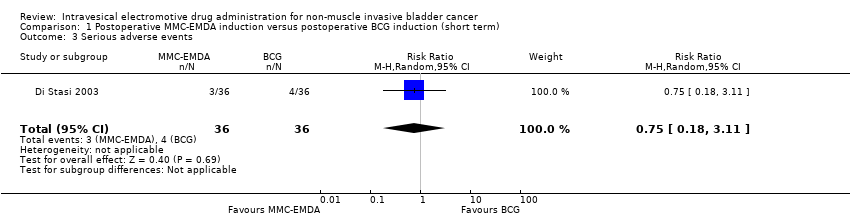
Comparison 1 Postoperative MMC‐EMDA induction versus postoperative BCG induction (short term), Outcome 3 Serious adverse events.

Comparison 1 Postoperative MMC‐EMDA induction versus postoperative BCG induction (short term), Outcome 4 Disease‐specific survival.

Comparison 1 Postoperative MMC‐EMDA induction versus postoperative BCG induction (short term), Outcome 5 Time to death.

Comparison 2 Postoperative MMC‐EMDA induction versus MMC‐PD induction (short term), Outcome 1 Time to recurrence.
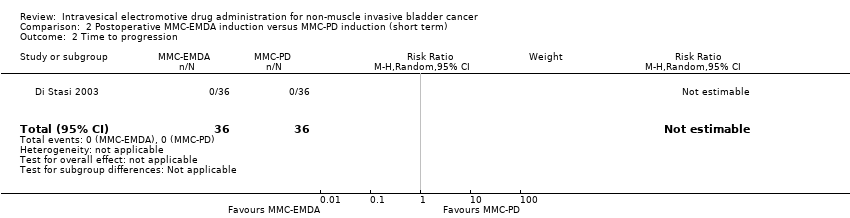
Comparison 2 Postoperative MMC‐EMDA induction versus MMC‐PD induction (short term), Outcome 2 Time to progression.
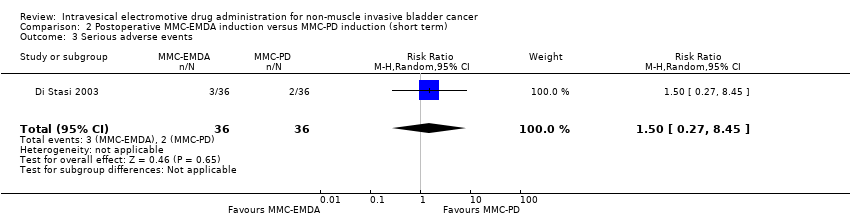
Comparison 2 Postoperative MMC‐EMDA induction versus MMC‐PD induction (short term), Outcome 3 Serious adverse events.

Comparison 2 Postoperative MMC‐EMDA induction versus MMC‐PD induction (short term), Outcome 4 Disease‐specific survival.

Comparison 2 Postoperative MMC‐EMDA induction versus MMC‐PD induction (short term), Outcome 5 Time to death.
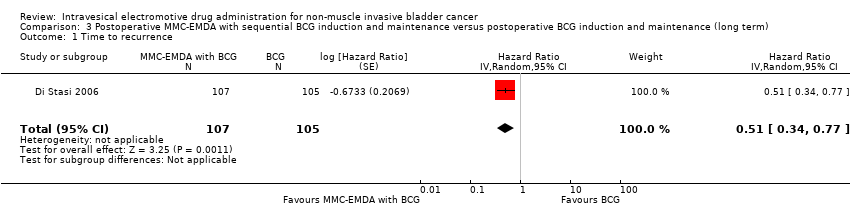
Comparison 3 Postoperative MMC‐EMDA with sequential BCG induction and maintenance versus postoperative BCG induction and maintenance (long term), Outcome 1 Time to recurrence.
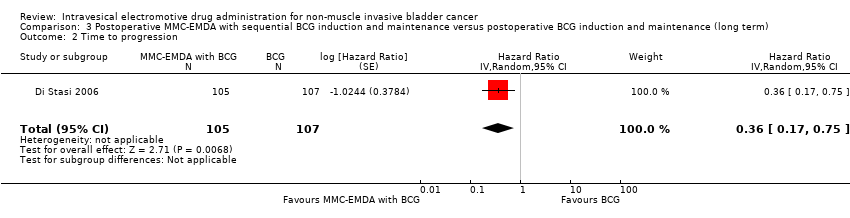
Comparison 3 Postoperative MMC‐EMDA with sequential BCG induction and maintenance versus postoperative BCG induction and maintenance (long term), Outcome 2 Time to progression.
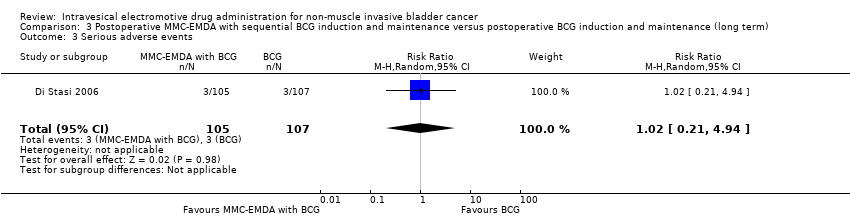
Comparison 3 Postoperative MMC‐EMDA with sequential BCG induction and maintenance versus postoperative BCG induction and maintenance (long term), Outcome 3 Serious adverse events.

Comparison 3 Postoperative MMC‐EMDA with sequential BCG induction and maintenance versus postoperative BCG induction and maintenance (long term), Outcome 4 Disease‐specific survival.
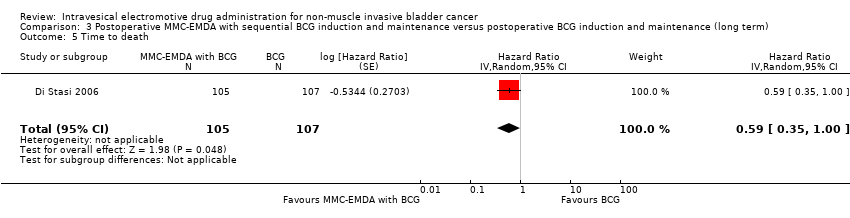
Comparison 3 Postoperative MMC‐EMDA with sequential BCG induction and maintenance versus postoperative BCG induction and maintenance (long term), Outcome 5 Time to death.
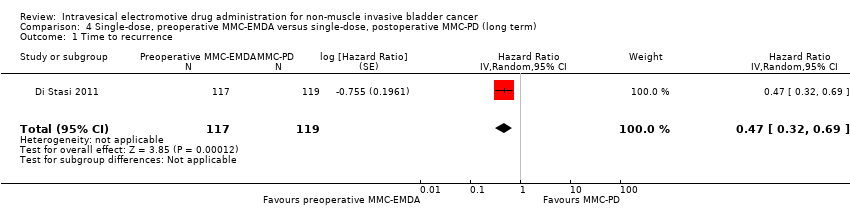
Comparison 4 Single‐dose, preoperative MMC‐EMDA versus single‐dose, postoperative MMC‐PD (long term), Outcome 1 Time to recurrence.
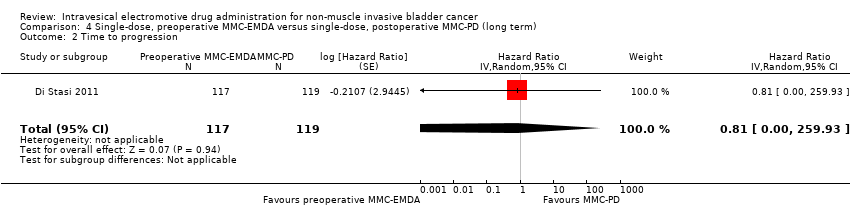
Comparison 4 Single‐dose, preoperative MMC‐EMDA versus single‐dose, postoperative MMC‐PD (long term), Outcome 2 Time to progression.
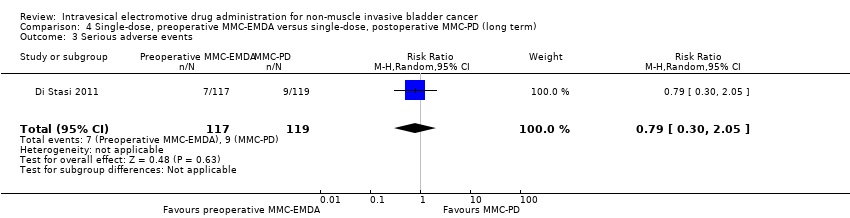
Comparison 4 Single‐dose, preoperative MMC‐EMDA versus single‐dose, postoperative MMC‐PD (long term), Outcome 3 Serious adverse events.

Comparison 4 Single‐dose, preoperative MMC‐EMDA versus single‐dose, postoperative MMC‐PD (long term), Outcome 4 Disease‐specific survival.
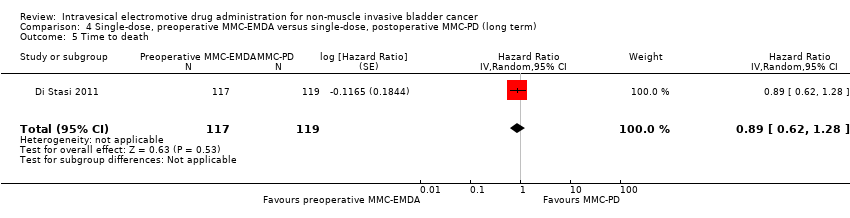
Comparison 4 Single‐dose, preoperative MMC‐EMDA versus single‐dose, postoperative MMC‐PD (long term), Outcome 5 Time to death.

Comparison 4 Single‐dose, preoperative MMC‐EMDA versus single‐dose, postoperative MMC‐PD (long term), Outcome 6 Minor adverse events.

Comparison 5 Single‐dose, preoperative MMC‐EMDA versus TURBT alone (long term), Outcome 1 Time to recurrence.

Comparison 5 Single‐dose, preoperative MMC‐EMDA versus TURBT alone (long term), Outcome 2 Time to progression.

Comparison 5 Single‐dose, preoperative MMC‐EMDA versus TURBT alone (long term), Outcome 3 Serious adverse events.
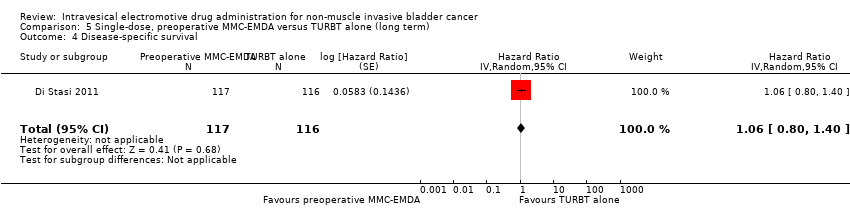
Comparison 5 Single‐dose, preoperative MMC‐EMDA versus TURBT alone (long term), Outcome 4 Disease‐specific survival.

Comparison 5 Single‐dose, preoperative MMC‐EMDA versus TURBT alone (long term), Outcome 5 Time to death.

Comparison 5 Single‐dose, preoperative MMC‐EMDA versus TURBT alone (long term), Outcome 6 Minor adverse events.
| Participants: people with non‐muscle invasive bladder cancer (multifocal carcinoma in situ or concurrent pT1, or both) Setting: multicentre study in Italy (all comparisons in the review stemmed from same study group) Intervention: initial 6 MMC‐EMDA intravesical instillations at weekly interval about 3 weeks after TURBT Control: initial 6 BCG intravesical instillations at weekly interval about 3 weeks after TURBT | |||||
| Outcomes | No of participants | Quality of the evidence | Relative effect | Anticipated absolute effects* (95% CI) | |
| Risk with BCG | Risk difference with postoperative MMC‐EMDA | ||||
| Time to recurrence Follow‐up: mean 3 months | 72 | ⊕⊝⊝⊝ | RR 1.06 | Study population | |
| 444 per 1000 | 27 more per 1000 | ||||
| Moderate | |||||
| 500 per 1000 3 | 30 more per 1000 | ||||
| Time to progression Follow‐up: mean 3 months | 72 | ⊕⊕⊝⊝ | Not estimable | Study population | |
| ‐ | ‐ | ||||
| Serious adverse events Follow‐up: mean 3 months | 72 | ⊕⊝⊝⊝ | RR 0.75 | Study population | |
| 111 per 1000 | 28 fewer per 1000 | ||||
| High | |||||
| 60 per 1000 5 | 15 fewer per 1000 | ||||
| Disease‐specific survival Follow‐up: mean 3 months | 72 | ⊕⊕⊝⊝ | Not estimable | Study population | |
| ‐ | ‐ | ||||
| Disease‐specific quality of life ‐ not reported | ‐ | ‐ | ‐ | ‐ | ‐ |
| *The risk in the intervention group (and its 95% confidence interval) is based on the assumed risk in the comparison group and the relative effect of the intervention (and its 95% CI). BCG: Bacillus Calmette‐Guérin; CI: confidence interval; MMC‐EMDA: electromotive drug administration of mitomycin C; RCT: randomised controlled trial; RR: risk ratio; TURBT: transurethral resection of bladder tumour. | |||||
| GRADE Working Group grades of evidence | |||||
| 1 Downgraded by one level for study limitations: unclear risk of selection bias and high risk of performance, detection and other bias. 2 Downgraded by two level for imprecision: confidence interval was wide and crossed assumed clinically meaningful threshold. 3Gontero 2016: recurrence rate of bladder cancer after TURBT with postoperative six induction instillations of BCG was 50.7% on median follow‐up of 5.2 years. 4 Downgraded by one level for imprecision: no event. 5Witjes 1998: incidence of systemic adverse events after TURBT with postoperative BCG instillations for 6 consecutive weeks was 6% on a long‐term median follow‐up of more than 7 years. | |||||
| Participants: people with non‐muscle invasive bladder cancer (carcinoma in situ or concurrent pT1, or both) Setting: multicentre study in Italy (all comparisons in the review stemmed from same study group) Intervention: initial 6 MMC‐EMDA intravesical instillations at weekly interval about 3 weeks after TURBT Control: initial 6 MMC‐PD intravesical instillations at weekly interval about 3 weeks after TURBT | |||||
| Outcomes | No of participants | Quality of the evidence | Relative effect | Anticipated absolute effects* (95% CI) | |
| Risk with MMC‐PD | Risk difference with postoperative MMC‐EMDA | ||||
| Time to recurrence Follow‐up: mean 3 months | 72 | ⊕⊕⊝⊝ | RR 0.65 | Study population | |
| 722 per 1000 | 253 fewer per 1000 | ||||
| Moderate | |||||
| 420 per 1000 3 | 147 fewer per 1000 | ||||
| Time to progression Follow‐up: mean 3 months | 72 | ⊕⊕⊝⊝ | Not estimable | Study population | |
| ‐ | ‐ | ||||
| Serious adverse events Follow‐up: mean 3 months | 72 | ⊕⊝⊝⊝ | RR 1.50 | Study population | |
| 56 per 1000 | 28 more per 1000 | ||||
| High | |||||
| 30 per 10003 | 15 more per 1000 | ||||
| Disease‐specific survival Follow‐up: mean 3 months | 72 | ⊕⊕⊝⊝ | Not estimable | Study population | |
| ‐ | ‐ | ||||
| Disease‐specific quality of life ‐ not reported | ‐ | ‐ | ‐ | ‐ | ‐ |
| *The risk in the intervention group (and its 95% confidence interval) is based on the assumed risk in the comparison group and the relative effect of the intervention (and its 95% CI). CI: confidence interval; MMC‐EMDA: electromotive drug administration of mitomycin C; MMC‐PD: passive diffusion of mitomycin C; RCT: randomised controlled trial; RR: risk ratio; TURBT: transurethral resection of bladder tumour. | |||||
| GRADE Working Group grades of evidence | |||||
| 1 Downgraded by one level for study limitations: unclear risk of selection bias, high risk of performance, detection and other bias. 2 Downgraded by one level for imprecision: confidence interval crossed assumed clinically meaningful threshold. 3Witjes 1998: recurrence rate of bladder cancer after TURBT with postoperative MMC‐PD instillations (total 5 instillations) was 42.8% and incidence of systemic adverse events was 3% based on a long‐term median follow‐up of more than 7 years. 4 Downgraded by one level for imprecision: no event. 5 Downgraded by two level for imprecision: confidence interval was wide and crossed assumed clinically meaningful threshold. | |||||
| Participants: people with non‐muscle invasive bladder cancer (pT1 or carcinoma in situ of the bladder, or both) Setting: multicentre study in Italy (all comparisons in the review stemmed from same study group) Intervention: initial 3 cycles of MMC‐EMDA with BCG intravesical instillation (cycle: 2 BCG followed by 1 MMC‐EMDA) at weekly interval about 3 weeks after TURBT, and 3 cycles of MMC‐EMDA with BCG intravesical instillations (monthly instillation, cycle: 2 MMC‐EMDA followed by 1 BCG) for 9 months Control: initial 6 BCG intravesical instillations at weekly interval about 3 weeks after TURBT, and BCG monthly instillation for 10 months | |||||
| Outcomes | No of participants | Quality of the evidence | Relative effect | Anticipated absolute effects* (95% CI) | |
| Risk with BCG | Risk difference with postoperative MMC‐EMDA with BCG | ||||
| Time to recurrence Follow‐up: median 88 months | 212 | ⊕⊕⊝⊝ | HR 0.51 | Study population | |
| 581 per 1000 | 223 fewer per 1000 | ||||
| Moderate | |||||
| 430 per 1000 3 | 181 fewer per 1000 | ||||
| Time to progression Follow‐up: median 88 months | 212 | ⊕⊕⊝⊝ | HR 0.36 | Study population | |
| 215 per 1000 | 132 fewer per 1000 | ||||
| Moderate | |||||
| 100 per 1000 3 | 63 fewer per 1000 | ||||
| Serious adverse events Follow‐up: median 88 months | 212 | ⊕⊝⊝⊝ | RR 1.02 | Study population | |
| 28 per 1000 | 1 more per 1000 | ||||
| High | |||||
| 70 per 1000 3 | 1 more per 1000 | ||||
| Disease‐specific survival Follow‐up: median 88 months | 212 | ⊕⊕⊝⊝ | HR 0.31 | Study population | |
| 159 per 1000 | 107 fewer per 1000 | ||||
| Moderate | |||||
| 60 per 1000 3 | 41 fewer per 1000 | ||||
| Disease‐specific quality of life ‐ not reported | ‐ | ‐ | ‐ | ‐ | ‐ |
| *The risk in the intervention group (and its 95% confidence interval) is based on the assumed risk in the comparison group and the relative effect of the intervention (and its 95% CI). BCG: Bacillus Calmette‐Guérin; CI: confidence interval; HR: hazard ratio; MMC‐EMDA: electromotive drug administration of mitomycin C; RCT: randomised controlled trial; RR: risk ratio; TURBT: transurethral resection of bladder tumour. | |||||
| GRADE Working Group grades of evidence | |||||
| 1 Downgrade by one level for study limitations: unclear risk of selection and attrition bias and high risk of performance and detection bias. 2 Downgrade by one level for imprecision: confidence interval crossed assumed clinically meaningful threshold. 3Oddens 2013: disease recurrence, progression and disease‐specific death after TURBT with BCG maintenance therapy (once a week for 6 weeks, followed by three weekly instillations at months 3, 6 and 12) were 42.8%, 9.1% and 5.9%, respectively and stopped treatment due to local or systemic adverse events was 7% based on a long‐term median follow‐up of more than 7.1 years. 4 Downgrade by one level for study limitations: unclear risk of selection bias and high risk of performance and detection bias. 5 Downgraded by two level for imprecision: confidence interval was wide and crossed assumed clinically meaningful threshold. | |||||
| Participants: people with non‐muscle invasive bladder cancer (primary pTa and pT1 urothelial carcinoma) Setting: multicentre study in Italy (all comparisons in the review stemmed from same study group) Intervention: single MMC‐EMDA intravesical instillation about 30 minutes before spinal or general anaesthesia for TURBT Control: single MMC‐PD intravesical instillation immediately after TURBT | |||||
| Outcomes | No of participants | Quality of the evidence | Relative effect | Anticipated absolute effects* (95% CI) | |
| Risk with MMC‐PD | Risk difference with preoperative MMC‐EMDA | ||||
| Time to recurrence Follow‐up: median 86 months | 236 | ⊕⊕⊕⊝ | HR 0.47 | Study population | |
| 588 per 1000 | 247 fewer per 1000 | ||||
| Low 2 | |||||
| 100 per 1000 | 52 fewer per 1000 | ||||
| High 2 | |||||
| 500 per 1000 | 222 fewer per 1000 | ||||
| Time to progression Follow‐up: median 86 months | 236 | ⊕⊝⊝⊝ | HR 0.81 | Study population | |
| 193 per 1000 | 34 fewer per 1000 | ||||
| Low 2 | |||||
| 20 per 1000 | 4 fewer per 1000 | ||||
| High 2 | |||||
| 100 per 1000 | 18 fewer per 1000 | ||||
| Serious adverse events Follow‐up: median 86 months | 236 | ⊕⊝⊝⊝ | RR 0.79 | Study population | |
| 76 per 1000 | 16 fewer per 1000 | ||||
| High 4 | |||||
| 30 per 1000 | 6 fewer per 1000 | ||||
| Disease‐specific survival Follow‐up: median 86 months | 236 | ⊕⊕⊝⊝ | HR 0.99 | Study population | |
| 126 per 1000 | 1 fewer per 1000 | ||||
| Low 2 | |||||
| 20 per 1000 | 0 fewer per 1000 | ||||
| High 2 | |||||
| 60 per 1000 | 1 fewer per 1000 | ||||
| Disease‐specific quality of life ‐ not reported | ‐ | ‐ | ‐ | ‐ | ‐ |
| *The risk in the intervention group (and its 95% confidence interval) is based on the assumed risk in the comparison group and the relative effect of the intervention (and its 95% CI). CI: confidence interval; HR: hazard ratio; MMC‐EMDA: electromotive drug administration of mitomycin C; MMC‐PD: passive diffusion of mitomycin C; RCT: randomised controlled trial; RR: risk ratio; TURBT: transurethral resection of bladder tumour. | |||||
| GRADE Working Group grades of evidence | |||||
| 1 Downgraded by one level for study limitations: high risk of performance bias. 2Sylvester 2016: baseline risks of time to recurrence and progression, and disease‐specific survival were estimated from included studies in a systematic review and meta‐analysis of RCTs comparing the efficacy of a single instillation of MMC after TURBT with TURBTs alone. 3 Downgraded by two level for imprecision: confidence interval was wide and crossed clinically meaningful threshold. 4Witjes 1998: incidence of systemic adverse events after TURBT with postoperative MMC‐PD instillations (total 5 instillations) was 3% based on a long‐term median follow‐up of more than 7 years. | |||||
| Participants: people with non‐muscle invasive bladder cancer (primary pTa and pT1 urothelial carcinoma) Setting: multicentre study in Italy (all comparisons in the review stemmed from same study group) Intervention: single MMC‐EMDA intravesical instillation about 30 minutes before spinal or general anaesthesia for TURBT Control: TURBT alone | |||||
| Outcomes | No of participants | Quality of the evidence | Relative effect | Anticipated absolute effects* (95% CI) | |
| Risk with TURBT alone | Risk difference with preoperative MMC‐EMDA | ||||
| Time to recurrence Follow‐up: median 86 months | 233 | ⊕⊕⊕⊝ | HR 0.40 | Study population | |
| 638 per 1000 | 304 fewer per 1000 | ||||
| Low 2 | |||||
| 400 per 1000 | 215 fewer per 1000 | ||||
| High 2 | |||||
| 700 per 1000 | 318 fewer per 1000 | ||||
| Time to progression Follow‐up: median 86 months | 233 | ⊕⊝⊝⊝ | HR 0.74 | Study population | |
| 207 per 1000 | 49 fewer per 1000 | ||||
| Low 2 | |||||
| 20 per 1000 | 5 fewer per 1000 | ||||
| High 2 | |||||
| 100 per 1000 | 25 fewer per 1000 | ||||
| Serious adverse events Follow‐up: median 86 months | 233 | ⊕⊝⊝⊝ | RR 1.74 | Study population | |
| 34 per 1000 | 26 more per 1000 | ||||
| Moderate 4 | |||||
| 30 per 1000 | 22 more per 1000 | ||||
| Disease‐specific survival Follow‐up: median 86 months | 233 | ⊕⊕⊕⊝ | HR 1.06 | Study population | |
| 129 per 1000 | 7 more per 1000 | ||||
| Low 2 | |||||
| 20 per 1000 | 1 more per 1000 | ||||
| High 2 | |||||
| 100 per 1000 | 6 more per 1000 | ||||
| Disease‐specific quality of life ‐ not reported | ‐ | ‐ | ‐ | ‐ | ‐ |
| *The risk in the intervention group (and its 95% confidence interval) is based on the assumed risk in the comparison group and the relative effect of the intervention (and its 95% CI). CI: confidence interval; HR: hazard ratio; MMC‐EMDA: electromotive drug administration of mitomycin C; RCT: randomised controlled trial; RR: risk ratio; TURBT: transurethral resection of bladder tumour. | |||||
| GRADE Working Group grades of evidence | |||||
| 1 Downgraded by one level for study limitations: high risk of performance bias. 2Sylvester 2016: baseline risks of time to recurrence and progression, and disease‐specific survival were estimated from included studies in a systematic review and meta‐analysis of RCTs comparing the efficacy of a single instillation of MMC after TURBT with TURBT alone. 3 Downgraded by two level for imprecision: confidence interval was wide and crossed assumed clinically meaningful threshold. 4Matulewicz 2015: rates of death and overall adverse events rate after TURBT were 2.8% and 5.8%. 5 Downgraded by one level for imprecision: confidence interval crossed assumed clinically meaningful threshold. | |||||
| Study name | Trial | Setting | Participants | Intervention(s) and comparator(s) | Description of intervention | Median age (years, interquartile range) | Disease characteristics (n) | Median follow‐up (months, interquartile range) |
| June 1994 to March 2001 | Multicentre/Italy | People with histologically confirmed multifocal CIS of the bladder and most had concurrent pT1 papillary transitional‐cell carcinoma (all primary disease). | MMC‐EMDA induction after TURBT | 6 intravesical instillation at weekly intervals. | 64.5 (not reported) | Ta/T1: 0/32 Grade: not reported CIS: 36 | 43 (not reported) | |
| MMC‐PD induction after TURBT | 68.5 (not reported) | Ta/T1: 0/33 Grade: not reported CIS: 36 | ||||||
| BCG induction after TURBT | 66.5 (not reported) | Ta/T1: 0/33 Grade: not reported CIS: 36 | ||||||
| 1 January 1994 to 30 June 2002 | Multicentre/Italy | People with histologically confirmed stage pT1 transitional‐cell carcinoma of the bladder were regarded as being at high risk for tumour recurrence and at moderate to high risk for progression because of: multifocal pT1, primary or recurrent, grade 2 transitional‐cell carcinoma; primary or recurrent pT1, multifocal or solitary, grade 3 transitional‐cell carcinoma; or pT1 with CIS. | MMC‐EMDA with sequential BCG induction and maintenance after TURBT | Induction: 3 cycles of treatment per week for 9 weeks for which 1 cycle consisted of 2 BCG infusions and 1 MMC infusion Maintenance: 1 infusion per month for 9 months: 3 cycles of MMC, MMC and BCG. | 66.0 (56.0‐73.0) | Ta/T1: all T1 disease Grade: 0/65/42 CIS: 29 | 88 (63‐110) | |
| BCG induction and maintenance after TURBT | Induction: 6 intravesical treatments at weekly intervals Maintenance: monthly infusion of BCG for 10 months. | 67.0 (61.0‐73.0) | Ta/T1: all T1 disease Grade: 0/64/41 CIS: 28 | |||||
| 1 January 1994 to 31 December 2003 | Multicentre/Italy | People with pTa and pT1 urothelial carcinoma. | Single‐dose, MMC‐EMDA before TURBT | Single intravesical instillation about 30 minutes before spinal or general anaesthesia. | 67.0 (63.0‐74.0) | Ta/T1: 63/54 Grade: 22/62/33 CIS: not reported | 86 (57‐125) | |
| Single‐dose, MMC‐PD immediately after TURBT | Single intravesical instillation within 6 hours of TURBT. | 67.0 (61.0‐72.0) | Ta/T1: 64/55 Grade: 23/64/32 CIS: not reported | |||||
| TURBT alone | No intravesical instillation. | 66.5 (60.0‐73.0) | Ta/T1: 63/53 Grade: 21/63/32 CIS: not reported | |||||
| BCG: Bacillus Calmette‐Guérin; CIS: carcinoma in situ; MMC‐EMDA: electromotive drug administration of mitomycin C; MMC‐PD: passive diffusion of mitomycin C; TURBT: transurethral resection of bladder tumour. | ||||||||
| Study name | Intervention(s) and comparator(s) | Screened/eligible (n) | Randomised (n) | Treatment completion (n (%)) | Analysed (n (%)) |
| MMC‐EMDA induction after TURBT | Not reported/117 | 36 | 36 (100) | 36 (100) | |
| MMC‐PD induction after TURBT | 36 | 36 (100) | 36 (100) | ||
| BCG induction after TURBT | 36 | 36 (100) | 36 (100) | ||
| Total | 108 | 108 (100) | 108 (100) | ||
| MMC‐EMDA with sequential BCG induction and maintenance after TURBT | 241/212 | 107 | 96 (89) | 107 (100) | |
| BCG induction and maintenance after TURBT | 105 | 94 (89) | 105 (100) | ||
| Total | 212 | 190 (89) | 212 (100) | ||
| Single‐dose, MMC‐EMDA before TURBT | 398/374 | 124 | 117 (94) | 117 (94) | |
| Single‐dose, MMC‐PD immediately after TURBT | 126 | 119 (94) | 119 (94) | ||
| TURBT alone | 124 | 116 (93) | 116 (93) | ||
| Total | 374 | 352 (94) | 352 (94) | ||
| Grand total | 694 | 650 (93) | 672 (96) | ||
| BCG: Bacillus Calmette‐Guérin; MMC‐EMDA: electromotive drug administration of mitomycin C; MMC‐PD: passive diffusion of mitomycin C; n: number of participants; TURBT: transurethral resection of bladder tumour. | |||||
| Outcome or subgroup title | No. of studies | No. of participants | Statistical method | Effect size |
| 1 Time to recurrence Show forest plot | 1 | 72 | Risk Ratio (M‐H, Random, 95% CI) | 1.06 [0.64, 1.76] |
| 2 Time to progression Show forest plot | 1 | 72 | Risk Ratio (M‐H, Random, 95% CI) | 0.0 [0.0, 0.0] |
| 3 Serious adverse events Show forest plot | 1 | 72 | Risk Ratio (M‐H, Random, 95% CI) | 0.75 [0.18, 3.11] |
| 4 Disease‐specific survival Show forest plot | 1 | 72 | Risk Ratio (M‐H, Random, 95% CI) | 0.0 [0.0, 0.0] |
| 5 Time to death Show forest plot | 1 | 72 | Risk Ratio (M‐H, Random, 95% CI) | 0.0 [0.0, 0.0] |
| Outcome or subgroup title | No. of studies | No. of participants | Statistical method | Effect size |
| 1 Time to recurrence Show forest plot | 1 | 72 | Risk Ratio (M‐H, Random, 95% CI) | 0.65 [0.44, 0.98] |
| 2 Time to progression Show forest plot | 1 | 72 | Risk Ratio (M‐H, Random, 95% CI) | 0.0 [0.0, 0.0] |
| 3 Serious adverse events Show forest plot | 1 | 72 | Risk Ratio (M‐H, Random, 95% CI) | 1.5 [0.27, 8.45] |
| 4 Disease‐specific survival Show forest plot | 1 | 72 | Risk Ratio (M‐H, Random, 95% CI) | 0.0 [0.0, 0.0] |
| 5 Time to death Show forest plot | 1 | 72 | Risk Ratio (M‐H, Random, 95% CI) | 0.0 [0.0, 0.0] |
| Outcome or subgroup title | No. of studies | No. of participants | Statistical method | Effect size |
| 1 Time to recurrence Show forest plot | 1 | 212 | Hazard Ratio (Random, 95% CI) | 0.51 [0.34, 0.77] |
| 2 Time to progression Show forest plot | 1 | 212 | Hazard Ratio (Random, 95% CI) | 0.36 [0.17, 0.75] |
| 3 Serious adverse events Show forest plot | 1 | 212 | Risk Ratio (M‐H, Random, 95% CI) | 1.02 [0.21, 4.94] |
| 4 Disease‐specific survival Show forest plot | 1 | 212 | Hazard Ratio (Random, 95% CI) | 0.31 [0.12, 0.80] |
| 5 Time to death Show forest plot | 1 | 212 | Hazard Ratio (Random, 95% CI) | 0.59 [0.35, 1.00] |
| Outcome or subgroup title | No. of studies | No. of participants | Statistical method | Effect size |
| 1 Time to recurrence Show forest plot | 1 | 236 | Hazard Ratio (Random, 95% CI) | 0.47 [0.32, 0.69] |
| 2 Time to progression Show forest plot | 1 | 236 | Hazard Ratio (Random, 95% CI) | 0.81 [0.00, 259.93] |
| 3 Serious adverse events Show forest plot | 1 | 236 | Risk Ratio (M‐H, Random, 95% CI) | 0.79 [0.30, 2.05] |
| 4 Disease‐specific survival Show forest plot | 1 | 236 | Hazard Ratio (Random, 95% CI) | 0.99 [0.74, 1.32] |
| 5 Time to death Show forest plot | 1 | 236 | Hazard Ratio (Random, 95% CI) | 0.89 [0.62, 1.28] |
| 6 Minor adverse events Show forest plot | 1 | 236 | Risk Ratio (M‐H, Random, 95% CI) | 0.55 [0.42, 0.72] |
| Outcome or subgroup title | No. of studies | No. of participants | Statistical method | Effect size |
| 1 Time to recurrence Show forest plot | 1 | 233 | Hazard Ratio (Random, 95% CI) | 0.40 [0.28, 0.57] |
| 2 Time to progression Show forest plot | 1 | 233 | Hazard Ratio (Random, 95% CI) | 0.74 [0.00, 247.93] |
| 3 Serious adverse events Show forest plot | 1 | 233 | Risk Ratio (M‐H, Random, 95% CI) | 1.74 [0.52, 5.77] |
| 4 Disease‐specific survival Show forest plot | 1 | 233 | Hazard Ratio (Random, 95% CI) | 1.06 [0.80, 1.40] |
| 5 Time to death Show forest plot | 1 | 233 | Hazard Ratio (Random, 95% CI) | 1.07 [0.73, 1.57] |
| 6 Minor adverse events Show forest plot | 1 | 233 | Risk Ratio (M‐H, Random, 95% CI) | 1.68 [1.11, 2.53] |