中心性漿液性脈絡網膜症に対する介入:ネットワークメタアナリシス
Abstract
Background
Central serous chorioretinopathy (CSC) is characterized by serous detachment of the neural retina with dysfunction of the choroid and retinal pigment epithelium (RPE). The effects on the retina are usually self limited, although some people are left with irreversible vision loss due to progressive and permanent photoreceptor damage or RPE atrophy. There have been a variety of interventions used in CSC, including, but not limited to, laser treatment, photodynamic therapy (PDT), and intravitreal injection of anti‐vascular endothelial growth factor (anti‐VEGF) agents. However, it is not known whether these or other treatments offer significant advantages over observation or other interventions. At present there is no evidence‐based consensus on the management of CSC. Due in large part to the propensity for CSC to resolve spontaneously or to follow a waxing and waning course, the most common initial approach to treatment is observation. It remains unclear whether this is the best approach with regard to safety and efficacy.
Objectives
To compare the relative effectiveness of interventions for central serous chorioretinopathy.
Search methods
We searched CENTRAL (which contains the Cochrane Eyes and Vision Trials Register) (2015, Issue 9), Ovid MEDLINE, Ovid MEDLINE In‐Process and Other Non‐Indexed Citations, Ovid MEDLINE Daily, Ovid OLDMEDLINE (January 1946 to February 2014), EMBASE (January 1980 to October 2015), the ISRCTN registry (www.isrctn.com/editAdvancedSearch), ClinicalTrials.gov (www.clinicaltrials.gov) and the World Health Organization (WHO) International Clinical Trials Registry Platform (ICTRP) (www.who.int/ictrp/search/en). We did not use any date or language restrictions in the electronic searches for trials. We last searched the electronic databases on 5 October 2015.
Selection criteria
Randomized controlled trials (RCTs) that compared any intervention for CSC with any other intervention for CSC or control.
Data collection and analysis
Two review authors independently selected studies and extracted data. We pooled data from all studies using a fixed‐effect model. For interventions applied to the eye (i.e. not systemic interventions), we synthesized direct and indirect evidence in a network meta‐analysis model.
Main results
We included 25 studies with 1098 participants (1098 eyes) and follow‐up from 16 weeks to 12 years. Studies were conducted in Europe, North and South America, Middle East, and Asia. The trials were small (most trials enrolled fewer than 50 participants) and poorly reported; often it was unclear whether key aspects of the trial, such as allocation concealment, had been done. A substantial proportion of the trials were not masked.
The studies considered a variety of treatments: anti‐VEGF (ranibizumab, bevacizumab), PDT (full‐dose, half‐dose, 30%, low‐fluence), laser treatment (argon, krypton and micropulse laser), beta‐blockers, carbonic anhydrase inhibitors, Helicobactor pylori treatment, and nutritional supplements (Icaps, lutein); there were only one or two trials contributing data for each comparison. We downgraded for risk of bias and imprecision for most analyses, reflecting study limitations and imprecise estimates. Network meta‐analysis (as planned in our protocol) did not help to resolve this uncertainty due to a lack of trials, and problems with intransitivity, particularly with respect to acute or chronic CSC.
Low quality evidence from two trials suggested little difference in the effect of anti‐VEGF (ranibizumab or bevacizumab) or observation on change in visual acuity at six months in acute CSC (mean difference (MD) 0.01 LogMAR (logarithm of the minimal angle of resolution), 95% confidence interval (CI) ‐0.02 to 0.03; 64 participants). CSC had resolved in all participants by six months. There were no significant adverse effects noted.
Low quality evidence from one study (58 participants) suggested that half‐dose PDT treatment of acute CSC probably results in a small improvement in vision (MD ‐0.10 logMAR, 95% CI ‐0.18 to ‐0.02), less recurrence (risk ratio (RR) 0.10, 95% CI 0.01 to 0.81) and less persistent CSC (RR 0.12, 95% CI 0.01 to 1.02) at 12 months compared to sham treatment. There were no significant adverse events noted.
Low quality evidence from two trials (56 participants) comparing anti‐VEGF to low‐fluence PDT in chronic CSC found little evidence for any difference in visual acuity at 12 months (MD 0.03 logMAR, 95% CI ‐0.08 to 0.15). There was some evidence that more people in the anti‐VEGF group had recurrent CSC compared to people treated with PDT but, due to inconsistency between trials, it was difficult to estimate an effect. More people in the anti‐VEGF group had persistent CSC at 12 months (RR 6.19, 95% CI 1.61 to 23.81; 34 participants).
Two small trials of micropulse laser, one in people with acute CSC and one in people with chronic CSC, provided low quality evidence that laser treatment may lead to better visual acuity (MD ‐0.20 logMAR, 95% CI ‐0.30 to ‐0.11; 45 participants). There were no significant adverse effects noted.
Other comparisons were largely inconclusive.
We identified 12 ongoing trials covering the following interventions: aflibercept and eplerenone in acute CSC; spironolactone, eplerenone, lutein, PDT, and micropulse laser in chronic CSC; and micropulse laser and oral mifepristone in two trials where type of CSC not clearly specified.
Authors' conclusions
CSC remains an enigmatic condition in large part due to a natural history of spontaneous improvement in a high proportion of people and also because no single treatment has provided overwhelming evidence of efficacy in published RCTs. While a number of interventions have been proposed as potentially efficacious, the quality of study design, execution of the study and the relatively small number of participants enrolled and followed to revealing endpoints limits the utility of existing data. It is not clear whether there is a clinically important benefit to treating acute CSC which often resolves spontaneously as part of its natural history. RCTs comparing individual treatments to the natural history would be valuable in identifying potential treatment groups for head‐to‐head comparison. Of the interventions studied to date, PDT or micropulse laser treatment appear the most promising for study in future trials.
PICO
一般語訳
中心性漿液性脈絡網膜症に対する介入
レビューの論点
中心性漿液性脈絡網膜症(central serous chorioretinopathy:CSC)に対する治療の効果は?他のどの治療法よりも優れている治療法はあるのか?
背景
CSCは、目の奥の症状 である。「網膜」(光をとらえて電気信号に変換し、脳に送る)が剥離する。CSCは、若年層や中年層、特に男性に多く見られる。視力の問題につながる可能性がある。CSCを発症しても、ほとんどの人は自然に回復するが、一部の人は問題を抱えたままで、永久に視力を失うこともある。CSCの治療法としては、レーザー治療や眼球後部の液体を減少させる生物学的薬剤の注射など、さまざまな方法が提案されている。
研究の特性
本科学的根拠(エビデンス)は2015年10月5日現在のものである。ブラジル、中国、ドイツ、インド、イラン、イタリア、日本、メキシコ、韓国、タイ、トルコ、英国、米国から合計1098例の参加者が登録された。参加者の年齢はほぼ同じで、ほとんどが男性であった。参加者の症状はさまざまで、20日以内のものから半年間のものまであった。ほとんどの研究は資金源を報告しておらず、4件は産業界からの資金提供、6件は産業界以外からの資金提供であった。
主要な結果
これらの研究では、さまざまな治療法が検討された。そのため、治療効果を示す良好なエビデンスを得るためには、どの治療法についても十分な研究が行われていなかった。一般的には、重大な副作用は認められなかった。
エビデンスの質
現在入手可能な報告済みエビデンスの全体的な質は、低いまたは非常に低いものであった。この研究結果は、今後報告される研究が、本レビューの結論に重要な影響を与える可能性が高いことを示している。
Authors' conclusions
Summary of findings
| Interventions for central serous chorioretinopathy: direct comparisons | ||||||
| Patient or population: people with central serous chorioretinopathy Settings: eye hospital | ||||||
| Comparison (intervention vs. comparator) | Anticipated absolute effects (95% CI) | Effect estimate from direct comparison | Comments | |||
| Relative effect | No of participants | Quality | ||||
| Risk with comparator | Mean difference (95% CI) Negative values are in favor of intervention; positive values in favor of comparator | |||||
| Change in visual acuity at 12 months (logMAR) | ||||||
| Anti‐VEGF vs. observation | ‐ | 0.01 LogMAR (‐0.02 to 0.03) | ‐ | 64 (2) | Low1,2 | Both studies enrolled participants with acute CSC and reported mean change in visual acuity at 6 months |
| Anti‐VEGF vs. low‐fluence PDT | ‐ | 0.03 logMAR (‐0.08 to 0.15) | ‐ | 56 (2) | Low1,2 | Both studies enrolled participants with chronic CSC |
| Anti‐VEGF and 50% PDT vs. 50% PDT | ‐ | 0.30 logMAR (0.09 to 0.51) | ‐ | 15 (1) | Low1,2 | Participants had chronic CSC |
| 6‐dose anti‐VEGF vs. 4‐dose anti‐VEGF | ‐ | ‐0.02 logMAR (‐0.31 to 0.27) | ‐ | 12 (1) | Low1,2 | Participants had chronic CSC and were followed to 6 months |
| 50% PDT vs. observation or sham treatment | ‐ | ‐0.10 logMAR (‐0.18 to ‐0.02) | ‐ | 58 (1) | Low1,2 | Participants had acute CSC |
| 30% PDT vs. PDT | ‐ | ‐0.16 logMAR (‐0.22 to ‐0.10) | ‐ | 60 (1) | Low1,2 | Type of CSC not specified |
| 30% PDT vs. 50% PDT | ‐ | ‐0.12 logMAR (‐0.15 to ‐0.08) | ‐ | 60 (1) | Low1,2 | Type of CSC not specified |
| 50% PDT vs. PDT | ‐ | 0.04 logMAR (‐0.04 to 0.12 | ‐ | 60 (1) | Low1,2 | Type of CSC not specified |
| Selective retina therapy vs. observation | ‐ | ‐0.13 logMAR (‐0.24 to ‐0.01) | ‐ | 30 (1) | Low1,2 | Participants had acute CSC, followed up to 3 months |
| Micropulse diode laser vs. sham laser | ‐ | ‐0.38 logMAR (‐0.56 to ‐0.20) | ‐ | 15 (1) | Low1,2 | Participants had chronic CSC |
| Antioxidant vs. placebo | ‐ | 0.01 logMAR (‐0.04 to 0.06) | ‐ | 14 (1) | Low1,2 | Lutein and acute CSC |
| Propranolol vs. placebo | ‐ | 0.01 logMAR (‐0.07 to 0.09) | ‐ | 60 (1) | Low1,2 | Type of CSC not specified |
| Carbonic anhydrase inhibitors vs. placebo | See comment | ‐ | ‐ | 13 (1) | ‐ | Outcome not reported |
| Helicobacter pylori treatment vs. placebo | ‐ | ‐0.04 logMAR (‐0.07 to ‐0.02) | ‐ | 103 (2) | Low1,2 | Participants had acute CSC, follow‐up 12‐16 weeks |
| Comparison (intervention vs. comparator) | Anticipated absolute effects (95% CI) | Effect estimate from direct comparison | Comments | |||
| Risk with comparator* | Risk with intervention | Relative effect (95% CI) | No of participants | Quality | ||
| Persistent CSC at 12 months | ||||||
| Anti‐VEGF vs. observation | See comment | ‐ | ‐ | 64 (2) | ‐ | Participants had acute CSC. Both trials reported that all participants in treatment and control groups were resolved by 6 months |
| Anti‐VEGF vs. low‐fluence PDT | 111 per 1000 | 688 per 1000 (179 to 1000) | RR 6.19 (1.61 to 23.81) | 34 (1) | Low1,2 | Participants had chronic CSC |
| Anti‐VEGF and 50% PDT vs. 50% PDT | 143 per 1000 | 126 (10 to 1000) | RR 0.88 (0.07 to 11.54) | 15 (1) | Very low1,2,3 | Participants had chronic CSC |
| 6‐dose anti‐VEGF vs. 4‐dose anti‐VEGF | See comment | ‐ | ‐ | 12 (1) | ‐ | Outcome not reported |
| 50% PDT vs. sham treatment | 211 per 1000 | 25 per 1000 (2 to 215) | RR 0.12 (0.01 to 1.02) | 58 (1) | Low1,2 | Participants had acute CSC |
| 30% PDT vs. PDT | See comment | ‐ | ‐ | 60 (1) | ‐ | Outcome not reported |
| 30% PDT vs. 50% PDT | See comment | ‐ | ‐ | 60 (1) | ‐ | Outcome not reported |
| 50% PDT vs. PDT | See comment | ‐ | ‐ | 60 (1) | ‐ | Outcome not reported |
| Selective retina therapy vs. observation | See comment | ‐ | ‐ | 30 (1) | ‐ | Outcome not reported |
| Micropulse diode laser | See comment | ‐ | ‐ | 15 (1) | ‐ | Outcome not reported |
| Antioxidant vs. placebo | See comment | ‐ | ‐ | 51 (1) | ‐ | People in the antioxidant group were less likely to have "complete resolution" at 3 months (RR 0.35, 95% CI 0.13 to 0.95; 51 participants) |
| Propranolol vs. placebo | See comment | ‐ | ‐ | 60 (1) | ‐ | Outcome not reported |
| Brinzolamide vs. placebo | 167 per 1000 | 48 (2 to 1000) | RR 0.29 (0.01 to 6.07) | 13 (1) | Very low2,3 | Participants had acute CSC |
| Helicobacter pylori treatment vs. placebo | 314 per 1000 | 210 (113 to 383) | RR 0.67 (0.36 to 1.22) | 103 (2) | Low1,2 | Participants had acute CSC |
| Comparison (intervention vs. comparator) | Anticipated absolute effects (95% CI) | Effect estimate from direct comparison | ||||
| Risk with comparator* | Risk with intervention | Relative effect (95% CI) | No of participants | Quality | Comment | |
| Recurrent CSC at 12 months | ||||||
| Anti‐VEGF vs. observation | See comment | ‐ | ‐ | 64 (2) | ‐ | Outcome not reported |
| Anti‐VEGF vs. low‐fluence PDT | See comment | ‐ | ‐ | 56 (2) | Very low1,2,4 | Participants had chronic CSC. The 2 studies had different results for this outcome (I2 = 71%). In Bae 2011, there was a much higher risk of recurrence in the anti‐VEGF group (ranibizumab) compared with the PDT group (RR 19.83, 95% CI 1.19 to 330.50; 21 eyes); in Semeraro 2012, there was also an increased risk of recurrence in the anti‐VEGF (bevacizumab) group but the size of the effect was much smaller and the CIs include 1 (no effect) (RR 1.46, 95% CI 0.59 to 3.58; 22 eyes) |
| Anti‐VEGF and 50% PDT vs. 50% PDT | See comment | ‐ | ‐ | 15 (1) | ‐ | Outcome not reported |
| 6‐dose anti‐VEGF vs. 4‐dose anti‐VEGF | See comment | ‐ | ‐ | 12 (1) | ‐ | Outcome not reported |
| 50% PDT vs. sham treatment | 267 per 1000 | 27 per 1000 (3 to 216) | RR 0.10 (0.01 to 0.81) | 53 (1) | Low1,2 | Participants had acute CSC |
| 30% PDT vs. PDT | See comment | ‐ | ‐ | 60 (1) | ‐ | Outcome not reported |
| 30% PDT vs. 50% PDT | See comment | ‐ | ‐ | 60 (1) | ‐ | Outcome not reported |
| 50% PDT vs. PDT | 270 per 1000 | 338 per 1000 (154 to 737) | RR 1.25 (0.57 to 2.73) | 60 (1) | ‐ | Type of CSC not specified |
| Selective retina therapy vs. observation | See comment | ‐ | ‐ | 30 (1) | ‐ | Outcome not reported |
| Micropulse diode laser | See comment | ‐ | ‐ | 15 (1) | ‐ | Outcome not reported |
| Antioxidant vs. placebo | 143 per 1000 | 46 (4 to 456) | RR 0.32 (0.03 to 3.19) | 36 (1) | Very low2,3 | Participants had acute CSC |
| Propranolol vs. placebo | 167 per 1000 | 100 (27 to 382) | RR 0.60 (0.16 to 2.29) | 60 (1) | Low1,2 | Type of CSC not reported |
| Brinzolamide vs. placebo | 314 per 1000 | 140 (20 to 953) | RR 0.21 (0.03 to 1.43 | 13 (1) | Low1,2 | Participants had acute CSC |
| Helicobacter pylori treatment vs. placebo | See comment | ‐ | ‐ | 103 (2) | ‐ | Outcome not reported |
| Adverse effects | ||||||
| All studies reported no ocular or systematic adverse effects, or did not comment on adverse effects | ||||||
| anti‐VEGF: anti‐vascular endothelial growth factor; CI: confidence interval; CSC: central serous chorioretinopathy; logMAR: logarithm of the minimal angle of resolution; PDT: photodynamic therapy; RR: risk ratio. * Risk was estimated from the comparator group in the included studies 1 Downgraded for imprecision (‐1) 2 Downgraded for risk of bias (‐1) 3 Downgraded for imprecision (‐2) 4 Downgraded for inconsistency (‐1) | ||||||
Background
Description of the condition
Central serous chorioretinopathy (CSC) has been known by many names including capillarospastic central retinitis, central angiospastic retinopathy and central serous retinopathy (CSR). The hallmark of CSC is the accumulation of subretinal fluid between the neurosensory retina and the retinal pigment epithelium (RPE). The incidence of CSC is greater in men than women; a survey conducted in Minnesota (US) reported that the annual incidence of CSC was higher among men (9.9 per 100,000; 95% confidence interval (CI) 7.4 to 12.4) compared with women (1.7 per 100,000; 95% CI 0.7 to 2.7) (Kitzmann 2008). The odds of CSC is higher among people taking corticosteroids than people not taking corticosteroids (odds ratio (OR) 37.1, 95% CI 6.2 to 221.8) (Haimovici 2004). Type A personality, body type and age are also potential factors correlated with CSC (Nicholson 2013; Yannuzzi 1987). The precise etiology of CSC remains unknown, but the pathogenesis appears to involve dysfunction of the choroid (the major blood vessel network serving the outer portion of the retina) and RPE (Prunte 1996).
The location and amount of subretinal fluid determines what symptoms are experienced. CSC is commonly associated with fluid accumulation under the macula and detachment of the retina. When the detachment occurs in the central macula, symptoms may include reduction of best‐corrected visual acuity (BCVA), distortion of vision, changes in image size, altered color vision, a decrease in contrast sensitivity, the perception of blind spots, or a combination of these symptoms (Cassin 2006; Gass 1967; Wang 2008). Symptoms typically present acutely in one eye without pain. There may be no symptoms when the fluid is located outside the macula. Cases of bilateral involvement are not uncommon, though symptoms may be present in one eye only. People seeking treatment generally have reduced vision, distorted vision, or both. The physician's goal is to improve the visual acuity and other visual symptoms and prevent permanent vision loss related to RPE and outer retinal atrophy by eliminating the fluid between the neurosensory retina and RPE.
CSC is classified as acute or chronic depending on multiple considerations. Various clinical investigators have used different cut‐off time points (e.g. persistent fluid for less than six months or longer than six months) to define acute versus chronic CSC (Nicholson 2013). Others have approached the classification differently: for example acute CSC is defined as the first attempted treatment to improve visual acuity and chronic CSC is defined as being refractory to treatment (Chan 2008; Quin 2013).
The diagnosis of CSC is made by dilated fundus exam combined with imaging of the retina and choroid with optical coherence tomography (OCT), fluorescein angiography (FA), indocyanine green angiography (ICGA), or combinations of these imaging techniques (Nicholson 2013; Quin 2013; Wang 2008). OCT is an imaging technique that allows for the identification of and quantification of subretinal fluid as well as estimation of the thickness of the choroid, which may be abnormally thickened in the setting of CSC. In some cases, OCT may reveal pathologic changes of CSC that are subtle on fundoscopy, such as shallow subretinal fluid, small pigment epithelial detachments, and retinal atrophy that can occur with chronic disease (Montero 2005). FA and ICGA are imaging techniques that allow for the identification of abnormal leakage of fluid from the choroidal and retinal vessels as well as through the RPE layer. Serial exams and strategic choices among these imaging techniques are used to follow the progress of disease and response to treatment.
Many diseases of the choroid, RPE, and retina can produce serous detachment of the neurosensory retina. Considerations for differential diagnosis in CSC include disorders that involve central vision loss associated with central neurosensory retinal detachment. These include choroidal neovascularization (CNV), pattern dystrophy, optic disc pits, polypoidal choroidal vasculopathy, choroidal melanoma, and choroidal metastasis (Yanoff 2013). Choroidal hemangioma, uveitis, Harada disease, optic neuritis, papilledema, vitreous traction, macular holes, and systemic hypertension can also produce neural retinal detachments (Gass 1967). While in its earliest stages retinal detachment due to small tears or holes may present as subretinal fluid, the peripheral location, subsequent course, and discovery of retinal defect usually removes it from the differential diagnosis. Pigment epithelial detachments most often in the setting of macular degeneration are sometimes confused with CSC.
Generally, acute CSC has an excellent prognosis including full visual recovery to premorbid levels (Klein 1974; Loo 2002; Maruko 2010). However, people with chronic CSC with long‐standing subretinal fluid accumulation may develop RPE atrophy and changes in the neurosensory retina that result in a permanent loss of visual function (Baran 2005). While recovery of visual acuity usually occurs within one to four months (Klein 1974; Mudvari 2007; Nicholson 2013), some visual abnormalities, such as alterations in night vision, contrast sensitivity, and color vision, may persist. It has also been observed that the severity of the disease is directly proportional to its duration (Castro‐Correia 1992). One‐third to one‐half of CSC cases will recur in one year (Loo 2002). A waxing and waning course is not unusual and contributes to the difficulty in attributing visual improvement to treatment benefit. A minority of cases become chronic in nature and these may progress to diffuse abnormalities in the RPE and permanently poor vision (Baran 2005). Certain features and coexistent conditions are associated with lower final visual acuity, such as recurrent foveal detachments, chronic foveal detachment, CNV, subretinal fibrosis, subfoveal RPE atrophy, and diffuse involvement.
Management of CSC usually involves careful observation with risk factor modification. Corticosteroid use is the most frequent modifiable risk factor for CSC and physicians first may reduce corticosteroid use to treat CSC (Bouzas 2002). While discontinuation of corticosteroids can benefit some people, some people do not respond and many are not taking corticosteroids at all. Persistent submacular fluid or reduced visual acuity are potential indications for next treatment, as are cases where untreated CSC has previously resulted in a poor visual outcome in the fellow eye (Nicholson 2013). Rare indication may include vocational needs in, for example, airline pilots, professional athletes, or police/military officers.
Description of the intervention
Treatments for CSC generally target the RPE, choroid, or both. The RPE is responsible for maintaining the blood‐retinal barrier between the retina and choroid as well as for removing any subretinal fluid that accumulates. In CSC, the source of the subretinal fluid is the choroidal vasculature. Treatments for CSC aim to improve the ability of the RPE to remove the subretinal fluid, to diminish leakage from the choroidal vessels, or to decrease fluid flux across the RPE barrier. Determining the effectiveness of treatments for CSC is difficult as a waxing and waning of disease activity is typical of the natural history. This natural variation and the tendency for people to present when their symptoms are worse creates uncertainty of whether disease improvement is the result of an intervention or the natural course of the disease. Further confounding the assessment of treatment response is a lack of direct correlation between the person's visual symptoms and the amount of subretinal fluid present (Maalej 2014; Nicholson 2013; Quin 2013; Shuler 2006; Wang 2008).
There have been a variety of interventions used, or proposed for use, in CSC. These interventions include laser treatments, most commonly photodynamic therapy (PDT); intravitreal injections of anti‐vascular endothelial growth factor (anti‐VEGF) agents; medications that alter steroid hormones; and others.
How the intervention might work
The interventions have various potential modes of action directed at either accelerating absorption of subretinal fluid or decreasing the production of fluid that accumulates in the subretinal space. Presently the target cells are in the choroidal vascular network and the RPE.
Laser treatments
Argon laser photocoagulation
Argon laser photocoagulation uses a low‐intensity green or yellow argon laser to coagulate tissue by heat generated from an intense beam of light focused on the RPE (Hofstetter 2000). Lower intensity laser with longer duration and moderate spot size (100 to 200 microns) is preferred to minimize the likelihood of rupture of Bruch's membrane, subsequent development of CNV, and development of progressive atrophy over time in the area of the laser treatment (Robertson 1983). This procedure is commonly used to accelerate the absorption of subretinal fluid in acute and chronic CSC. Typically, laser burns are applied to areas of focal leakage that have been identified on FA as the principal sources of subretinal fluid. The mechanism of subretinal fluid resolution after laser photocoagulation treatment is not well understood. Benefit has been hypothesized to result from the sealing of focal defects in the RPE monolayer, the recruitment of healthy RPE cells after laser injury as a healing response, or the direct stimulation of improved pumping function of RPE cells near the treated areas (Mitsui 1969).
Micropulse diode laser photocoagulation
Micropulse diode laser treatment involves a series of repetitive ultrashort laser pulses that more broadly treat the RPE (Sivaprasad 2010). Improved RPE function is proposed to result from the targeted cells' response to therapy. Direct effects on points of leakage at the level of the RPE also have been postulated. Because of the relatively small amounts of energy delivered, little adverse thermal effect on the underlying neural retina and choroid is anticipated (Chen 2008; Ricci 2004; Roisman 2013). Historically, targeting of focal leaks outside of the macula with thermal laser has been more common than with micropulse laser; however, treatment of diffuse disease with micropulse treatment is increasing in use.
Verteporfin photodynamic therapy
Verteporfin photodynamic therapy (VPDT) has been used to treat acute CSC and to prevent recurrences (Nicholson 2013). The exact mechanism of PDT in treating chronic CSC is not known, but the treatment effects are postulated to result from short‐term choriocapillaris hypoperfusion (decreased blood flow through choroid vessels) and long‐term choroidal vascular remodeling, leading to reduction in choroidal congestion, vascular hyperpermeability, and extravascular leakage (Chan 2003). At present, PDT typically is used in cases of CSC involving the macula that have not responded to other treatments or observation. Despite potential benefits of PDT, there may be dose‐dependent complications such as the development of RPE atrophy, choriocapillaris ischemia, CNV, and RPE tear (Cardillo Piccolino 2003; Kim 2009; Schlötzer‐Schrehardt 2002; Schmidt‐Erfurth 2002). Some studies have reported the treatment of CSC with modified PDT parameters, including reduced dose of verteporfin, reduced time of treatment, or reduced fluence (energy/area/second) of laser. These modifications to treatment parameters have been hypothesized to reduce the risk of complications while maintaining the potential treatment benefit (Chan 2008; Lai 2006; Reibaldi 2010).
Anti‐vascular endothelial growth factor agents
The aim of anti‐VEGF therapy is to stop neovascular vessel growth and leakage. Anti‐VEGF agents bind to, and block the effects of, vascular endothelial growth factor (VEGF) thereby slowing down the growth of new blood vessels in the eye and reducing vascular permeability. Therefore, anti‐VEGFs may have a role in eyes with CSC that are complicated by secondary CNV. Anti‐VEGF therapy is typically not expected to provide benefit in cases of CSC that are not complicated by active CNV. Increased levels of VEGF have not been found in aqueous humor of people with CSC (Lim 2010).
There are several anti‐VEGF agents used by ophthalmologists: aflibercept (Eylea®), bevacizumab (Avastin®), ranibizumab (Lucentis®), and pegaptanib (Macugen®). Currently each of these, with the exception of bevacizumab, has been approved by the US Food and Drug Administration (FDA) for use in the eye (FDA 2015). Anti‐VEGF agents often are used for, and have been shown to be effective for, a number of ocular diseases; however, none of these medications has been approved specifically for use in the treatment of CSC or for the treatment of CNV in the setting of CSC.
Medications that alter steroid hormones
The exact role of steroids in CSC pathogenesis is not well understood. Proposed mechanisms in the choroid include effects on vascular autoregulation, potentiation of vascular reactivity, or prothrombotic steroid effect (Nicholson 2013). The following medications that target steroid hormone pathways have been proposed for treatment of CSC but are not currently licensed for that indication.
Ketoconazole
Ketoconazole is an anti‐fungal agent used to treat candidiasis, chronic mucocutaneous candidiasis, oral thrush, candiduria, blastomycosis, coccidioidomycosis, histoplasmosis, chromomycosis, or paracoccidioidomycosis (FDA 2015).
Ketoconazole is an anti‐fungal agent that is thought to halt endogenous glucocorticoid production in part by inhibiting the conversion of 11‐deoxycortisol to cortisol. Because of this inhibition, ketoconazole was established as effective in the treatment of Cushing disease (Chou 2000; Winquist 1995). Thus, it is believed that, given the association of corticosteroids in the pathogenesis of CSC, lowering endogenous cortisol production by pharmacologic intervention would be a rational approach to the treatment of CSC (Jampol 2002; Meyerle 2007).
Mifepristone
Mifepristone (RU‐486) is classified as a high‐affinity, glucocorticoid receptor antagonist (Clark 2008). It is used to end an early pregnancy for women who have been pregnant for 49 days (seven weeks) or less since their last menstrual period began. The rationale for its use in CSC is similar to that for ketoconazole.
Rifampin
Rifampin, also known as rifampicin, is an antibacterial drug that is typically used to treat tuberculosis and meningococcal carriers. It is believed to suppress endogenous glucocorticoid production by inducing cytochrome P450 3A4 (Guengerich 1999); and altering reactions in steroid synthesis.
Finasteride
In addition to glucocorticoids, androgens, such as testosterone, have been implicated in the pathophysiology of CSC (Ahad 2006; Grieshaber 2007). Finasteride is a 5‐alfa‐reductase inhibitor that prevents conversion of testosterone to dihydrotestosterone, the latter of which has a higher binding affinity to androgen receptors (Forooghian 2011). Finasteride (5 mg) is used to treat benign prostatic hyperplasia (enlarged prostate gland), while finasteride (1 mg) is used to treat male pattern hair loss (androgenetic alopecia).
Eplerenone and spironolactone
It has been proposed that CSC results from over‐activation of the mineralocorticoid receptor pathway in the choroid. These receptors are bound and activated by mineralocorticoids, such as aldosterone, and by glucocorticoids. Eplerenone and spironolactone are aldosterone receptor antagonists; therefore, they inhibit binding of both aldosterone and glucocorticoids to mineralocorticoid receptors. Eplerenone is used to treat hypertension among people with stable left ventricle systolic dysfunction and congestive heart failure after an acute myocardial infarction (FDA 2015). Spironolactone is used to establish the diagnosis of primary hyperaldosteronism by therapeutic trial. The retinal and choroidal vasculature of the rat expresses glucocorticoid and mineralocorticoid receptors, and aldosterone injection causes choroidal enlargement in this animal model (Zhao 2012). Because of these findings, Bousquet 2013 treated 13 participants with chronic CSC with eplerenone and noted a decrease in mean macular thickness and subretinal fluid.
Carbonic anhydrase inhibitors
Acetazolamide is a carbonic anhydrase inhibitor used to treat chronic simple (open‐angle) glaucoma, secondary glaucoma, preoperatively in acute angle‐closure glaucoma to lower intraocular pressure, and prevention of amelioration. It is being used off‐label to treat CSC. It has been investigated on the basis that inhibition of carbonic anhydrase IV in the RPE seems to promote resorption of subretinal fluid and retinal adhesion (Cox 1988).
Helicobacter pylori treatment
Several studies indicated that people with CSC may have a higher incidence of serum anti‐Helicobacter pylori antibodies and that the treatment for H. pylori could have a positive impact on the outcome of the disease (Cotticelli 2006). It has been posited that an immune response to host proteins of the choroidal vasculature and RPE may be caused by molecular mimicry with antigens of H. pylori (Giusti 2004).
Aspirin
In some cases of CSC, increased levels of plasminogen activator inhibitor have been demonstrated compared with controls (Iijima 1999). Consequently, it has been suggested that hypercoagulability (abnormal blood coagulation that may lead to blood clots) may play a role in CSC pathogenesis (Cotticelli 2006).
Hypothalamic–pituitary–adrenal axis regulation
The hypothalamic‐pituitary‐adrenal (HPA) axis is a complex feedback system among the hypothalamus, pituitary gland, and adrenal glands. The HPA axis responds to stress by modifying hormone levels released by the glands. Increased stress levels can increase the amount of glucocorticoid in the body. Hormone level information feeds back to the HPA axis; high levels of glucocorticoids are believed to suppress HPA axis activity. Medications that may alter the HPA axis regulation include anti‐glucocorticoids and antidepressants.
Why it is important to do this review
Currently there is no consensus on the management of CSC. Due to the recurrent and chronic nature of some cases of CSC and uncertainty relating to best therapy, CSC remains a significant threat to vision and vocational stability. An evidence synthesis is needed to assess the relative effectiveness of interventions in order to determine which are the most promising and to identify any necessary future primary research.
As there are several different possible interventions, not all of which will have been compared in head‐to‐head studies, a network meta‐analysis, if possible, will provide quantitative comparisons of interventions and a treatment hierarchy useful for decision makers.
Objectives
To compare the relative effectiveness of interventions for central serous chorioretinopathy.
Methods
Criteria for considering studies for this review
Types of studies
We included only randomized controlled trials (RCTs) in this review.
Types of participants
We included studies of adults (aged 18 years or over) with CSC diagnosed using either OCT or FA, or as defined by study investigators.
Types of interventions
We included trials that compared any intervention for CSC with any other intervention for CSC or control. The control could be placebo, sham treatment, no treatment, or observation. We excluded trials of traditional Chinese medicine. This was a protocol amendment ‐ see Differences between protocol and review.
We specified the following interventions in our protocol:
-
argon laser photocoagulation;
-
micropulse diode laser photocoagulation;
-
VPDT (full‐dose, half‐dose or half‐fluence);
-
anti‐VEGF agents;
-
any other intervention (including the use of the specific medical treatments detailed above).
Figure 1 presents a theoretical treatment network based on interventions in current use and the classes of treatment as listed above. In our protocol, we planned to construct an alternative formulation of the network using specific anti‐VEGF agents (i.e. ranibizumab, bevacizumab, and aflibercept) and possibly different treatment regimens for laser and PDT); however, due to the sparse number of trials identified, this alternative formulation resulted in two disconnected networks and we felt it was unwise to proceed.

Theoretical treatment network.
A key assumption of the network is that any participant that met the inclusion criteria is, in principle, equally likely to be randomized to any of the interventions included in the network. In our protocol, we planned to exclude trials of treatment for H. pylori from the network as it is likely that these trials have only recruited participants with evidence of H. pylori infection and, therefore, the participants are unlikely to be comparable to participants enrolled in other trials. We identified a few trials of systemic treatments (e.g. antioxidant supplements, beta‐blockers). We felt that it was unlikely that participants would be randomized to a comparison of these interventions and ocular interventions (i.e. interventions applied directly to the eye), so we excluded these systemic interventions from the network. This was a protocol amendment ‐ see Differences between protocol and review.
Types of outcome measures
Primary outcomes
-
Mean change in BCVA of CSC eyes from baseline (before treatment) to 12 months, measured by a LogMAR (logarithm of the minimal angle of resolution) chart or equivalent.
Secondary outcomes
-
Proportion of CSC eyes with a recurrence of CSC between baseline and 12 months, as defined by study investigators.
-
Proportion of CSC eyes with persistent CSC, as defined by study investigators.
-
Mean change in contrast sensitivity from baseline to 12 months, measured using the Pelli‐Robson chart or equivalent.
-
Mean change in central retinal subfield thickness (CRST) from baseline and 12 months, measured using OCT.
-
Proportion of CSC eyes with BCVA 20/40 or better at 12 months.
-
Proportion of CSC eyes with BCVA 20/200 or worse at 12 months.
-
Quality of life at 12 months, measured using a validated questionnaire.
-
Adverse events (e.g. loss of vision due to treatment, retinal atrophy, CNV).
Follow‐up: we analyzed any measurement within the period of six to 18 months' follow‐up as the 12‐month measurement when a measurement at 12 months was not available.
BCVA; when logMAR score was not reported, we used the following formula to convert the number of letters read on an Early Treatment Diabetic Retinopathy Study (ETDRS) chart to logMAR score: logMAR = (total number of letters on the chart‐number of letters read correctly) x 0.02.
The total number of participant at risk of recurrence of CSC between baseline and 12 months was calculated using:
-
total number of participants at risk for each group = number randomized ‐ number lost to follow‐up ‐ number of participants with persistent CSC.
We planned to estimate the relative ranking of the competing interventions according to the following outcomes:
-
mean change in BCVA of CSC eyes from baseline and 12 months;
-
proportion with a recurrence of CSC between baseline and 12 months;
-
proportion of participants with one or more adverse events.
Search methods for identification of studies
Electronic searches
We searched CENTRAL (which contains the Cochrane Eyes and Vision Trials Register) (2015, Issue 9), Ovid MEDLINE, Ovid MEDLINE In‐Process and Other Non‐Indexed Citations, Ovid MEDLINE Daily, Ovid OLDMEDLINE (January 1946 to February 2014), EMBASE (January 1980 to October 2015), the ISRCTN registry (www.isrctn.com/editAdvancedSearch), ClinicalTrials.gov (www.clinicaltrials.gov) and the World Health Organization (WHO) International Clinical Trials Registry Platform (ICTRP) (www.who.int/ictrp/search/en). We did not use any date or language restrictions in the electronic searches for trials. We last searched the electronic databases on 5 October 2015.
See: Appendices for details of search strategies for CENTRAL (Appendix 1), MEDLINE (Appendix 2), EMBASE (Appendix 3), ISRCTN (Appendix 4), ClinicalTrials.gov (Appendix 5), and the ICTRP (Appendix 6).
Searching other resources
We searched the reference lists of all included studies and the Science Citation Index for papers that have cited included studies. We did not handsearch conference proceedings or journals specifically for the purposes of this review.
Data collection and analysis
Selection of studies
Two review authors independently screened titles and abstracts identified from searches using web‐based software (Covidence); and classified each reference as 'relevant', 'possibly relevant', or 'definitely not relevant'. We resolved any discrepancy by discussion. We retrieved full‐text reports of all records classified as 'relevant' or 'possibly relevant', and grouped citations by study. Two review authors independently assessed the eligibility for each study based on the full‐text reports. We resolved any discrepancy during full‐text assessment by discussion. We documented reasons for excluding studies after review of the full‐text reports. We contacted trial investigators for clarification of study eligibility as needed.
For potentially eligible studies identified from trial registers we did the following:
-
if the study had a completion date more than two years previously, we looked for publications of this trial and contacted the investigators as necessary to obtain published or unpublished data from the trial;
-
if an eligible study had a completion date less than two years previously, or in the future, we documented the study in the ongoing studies section of the review.
Data extraction and management
We adapted data collection forms developed and piloted by Cochrane Eyes and Vision using web‐based software (Systematic Review Data Repository). Two review authors independently extracted data from each study using all available study reports (protocols, journal publications, conference abstracts, etc.). We resolved any discrepancy by discussion. We abstracted data relevant to study design, methods, participants' characteristics, intervention, table of included studies, and outcomes (Appendix 7). We contacted trial investigators at the email address listed in their publications where we needed clarification. If we received no response after two weeks or we were unable to find current contact information, we used the data as available.
Assessment of risk of bias in included studies
We used the 'Risk of bias' tool described in Chapter 8 of the Cochrane Handbook for Systematic Reviews of Interventions (Higgins 2011). Two review authors independently assessed each trial for each of the risk of bias domains listed below. We classified each domain as 'low risk', 'high risk', or 'unclear risk' for each trial. We resolved any disagreement by discussion. We discussed the potential impact of trials with high or unclear risks of bias on the treatment effect.
Sequence generation (selection bias)
-
Low risk of bias: computer‐generated, random number table.
-
Unclear risk of bias: not clearly described or not reported.
-
High risk of bias: non‐random process (e.g. alternation) (we excluded these trials).
Allocation concealment (selection bias)
-
Low risk of bias: data co‐ordination center, opaque sealed envelope.
-
Unclear risk of bias: low risk (random) sequence generation but not described clearly how this was assigned/stored.
-
High risk of bias: investigator was involved in sequence generation or assignment, or both.
Masking (blinding) of participants and study personnel (performance bias)
-
Low risk of bias: masking reported.
-
Unclear risk of bias: masking not reported or not reported clearly (e.g. 'double blinded' without explicit description of masking) but treatments similar.
-
High risk of bias: no masking or masking not reported clearly (e.g. 'double blinded' without explicit description of masking) and treatments different (e.g. intervention versus observation).
Masking of outcome assessors (detection bias)
-
Low risk of bias: masking of outcome assessors reported.
-
Unclear risk of bias: masking of outcome assessors not reported or not reported clearly (e.g. 'double blinded' without explicit description of masking) but treatments similar.
-
High risk of bias: no masking of outcome assessors or masking not reported clearly (e.g. 'double blinded' without explicit description of masking) and treatments different (e.g. intervention versus observation).
Incomplete outcome data (attrition bias)
-
Low risk of bias: missing data less than 20% and no obvious reason why loss to follow‐up should be related to outcome.
-
Unclear risk of bias: not reported or 20% or greater loss to follow‐up but follow‐up similar in both groups.
-
High risk of bias: loss to follow‐up different in different groups or follow‐up clearly related to outcome.
Selective outcome reporting (reporting bias)
-
Low risk of bias: all outcomes reported as per protocol or trial registry entry.
-
Unclear risk of bias: protocol and trial registry not available for comparison.
-
High risk of bias: reported primary/secondary outcomes different from protocol/trial registry or outcomes mentioned in methods section not reported in results.
Other biases (e.g. funding source)
-
Low risk of bias: reported either non‐industry funding or reported no conflict of interest, or both, but did not report either industry funded or conflict of interest.
-
Unclear risk of bias: source of funding and conflict of interest not reported.
-
High risk of bias: industry funding or declared conflict of interest, or both.
Measures of treatment effect
Dichotomous data
For dichotomous outcome variables, we used risk ratios (RRs) with corresponding 95% confidence intervals (CIs) to measure the treatment effect. Dichotomous variables were BCVA 20/40 or better, BCVA 20/200 or worse, recurrence/persistence, and adverse events at one year.
Continuous data
For continuous variables, we used mean differences (MDs) and 95% CIs to measure the treatment effect. The continuous variables were change in BCVA, CRST, contrast sensitivity, and quality‐of‐life scores.
None of the included studies reported continuous outcomes using different scales. However, when future studies are included in the review, we will use the standardized mean difference (SMD) whenever a continuous outcomehas been measured on different scales, as may be the case for quality‐of‐life outcomes. The SMD expresses the size of the intervention effect in each study relative to the variability observed in that study. If one scale increases with severity while another decreases, we will ensure that all the scales point in the same direction either by multiplying the mean values of studies using one type of scale by ‐1 or by subtracting the mean from the maximum possible value for the scale.
We presented results from the network meta‐analysis as summary effect sizes (RRs or MDs) for each possible pair of treatments.
Unit of analysis issues
Eyes and people
The unit of analysis was the person as CSC generally involves one symptomatic eye at the time of presentation. As far as we could determine, all included studies only included one eye per participant and none of the included studies enrolled bilateral CSC cases.
Studies with multiple treatment groups
We treated multi‐arm studies as multiple independent two‐arm studies in the network meta‐analysis.
Dealing with missing data
We contacted all study authors, but they were unable to provide more data. Authors were given two weeks to respond to our request. When we received no response, we proceeded using the available data. We did not attempt imputation for missing data. We conducted meta‐analysis only when there was sufficient quantitative information (e.g. measures of variability, number of participants at risk). Otherwise, we described the results narratively.
Assessment of heterogeneity
Assessment of clinical and methodological heterogeneity within treatment comparisons
To evaluate the presence of clinical heterogeneity, we generated descriptive statistics for trial and study population characteristics across all eligible trials that compared each pair of interventions. We assessed the presence of clinical heterogeneity within each pairwise comparison by comparing these characteristics.
Assessment of transitivity across treatment comparisons
We planned to assess the assumption of transitivity epidemiologically by comparing the clinical and methodological characteristics of sets of studies grouped by treatment comparisons. We expected the transitivity assumption will hold as long as treatment comparisons were not related to:
-
study design (parallel group or within‐person);
-
acute or chronic CSC;
-
date the study was conducted;
-
whether the trial was industry sponsored.
In the event, all trials were parallel group, so we did not consider this factor.
Assessment of reporting biases
None of the meta‐analyses included 10 or more studies, so we did not prepare a funnel plot as planned in our protocol. We assessed selective outcome reporting bias using the 'Risk of bias' tool.
Data synthesis
Methods for direct treatment comparisons
We performed standard pairwise meta‐analyses using a random‐effects model in Review Manager 5 (RevMan 2014). We used a fixed‐effect model when there were fewer than three studies.
Methods for indirect and mixed comparisons
We performed network meta‐analysis using the methodology of multivariate meta‐analysis model where different treatment comparisons are treated as different outcomes (White 2012). For this analysis, we used the 'mvmeta' command in STATA (StataCorp, 2011; Stata Statistical Software: Release 13. College Station, TX) (White 2009; White 2011).
We planned to estimate the ranking probabilities for all treatments of being at each possible rank of intervention effectiveness (e.g. best to worst) and then to calculate the surface under the cumulative ranking curve (SUCRA) and mean ranks, but did not do so due to a lack of data in the network.
Assessment of statistical heterogeneity
Assumptions when estimating the heterogeneity
In standard pairwise meta‐analyses, we estimated heterogeneity variances for each pairwise comparison. In network meta‐analysis, we assumed a common estimate for the heterogeneity variance across the different comparisons.
Measures and tests for heterogeneity
We assessed statistically the presence of heterogeneity within each pairwise comparison using the I2 statistic (Higgins 2003). The I2 statistic measures the percentage of variability that cannot be attributed to random error.
The assessment of statistical heterogeneity in the entire network was based on the magnitude of the heterogeneity variance parameter (τ2) estimated from the network meta‐analysis models.
Assessment of statistical inconsistency
Local approaches for evaluating inconsistency
To evaluate the presence of inconsistency locally, we used the loop‐specific approach (Bucher 1997). This method evaluates the consistency assumption in each closed loop of the network separately as the difference between direct and indirect estimates for a specific comparison in the loop (inconsistency factor). Then, the magnitude of the inconsistency factors and their 95% CIs can be used to infer the presence of inconsistency in each loop. We assumed a common heterogeneity estimate within each loop. We planned to present the results of this approach graphically in a forest plot using the 'ifplot' command in STATA (Chaimani 2013), but in the event, there were not enough loops to make this necessary.
Global approaches for evaluating inconsistency
To check the assumption of consistency in the entire network, we used the 'design‐by‐treatment' model using the 'mvmeta' command in STATA (Higgins 2012). This method accounts for different sources of inconsistency that can occur when studies with different designs (two‐arm trials versus three‐arm trials) give different results as well as disagreement between direct and indirect evidence. Using this approach, we judged the presence of inconsistency from any source in the entire network based on a Chi2 test.
Subgroup analysis and investigation of heterogeneity
There were insufficient data available to perform subgroup analyses by type of CSC (acute versus chronic).
Sensitivity analysis
We planned the following sensitivity analyses but there were not enough studies contributing to each analysis to enable this.
In standard pairwise comparisons or meta‐analyses, we planned to exclude the following studies to determine their impact on effect size for the primary outcome:
-
studies with high risk of bias on any domain;
-
studies with unpublished data only; and
-
industry‐funded studies.
'Summary of findings' table
We prepared a 'Summary of findings' table for all comparisons including relative and absolute effects for the following outcomes: mean change in BCVA, persistent CSC, recurrence of CSC and adverse effects. We used GRADE (Guyatt 2011) to assess the overall quality of the evidence for each outcome in pairwise and network meta‐analyses (Puhan 2014).
Results
Description of studies
Results of the search
The electronic searches yielded 1168 references (Figure 2). The Trials Search Co‐ordinator scanned the search results, removed 299 duplicates and then removed 229 references that were not relevant to the scope of the review. We screened the remaining 640 reports and discarded 554 records as not relevant. We obtained 86 full‐text reports for potential inclusion in the review and we included 25 studies (see Characteristics of included studies table) and excluded 49 studies (see Characteristics of excluded studies table). We also included 12 reports of ongoing studies and will assess the data for these studies when the results become available (see Characteristics of ongoing studies table).
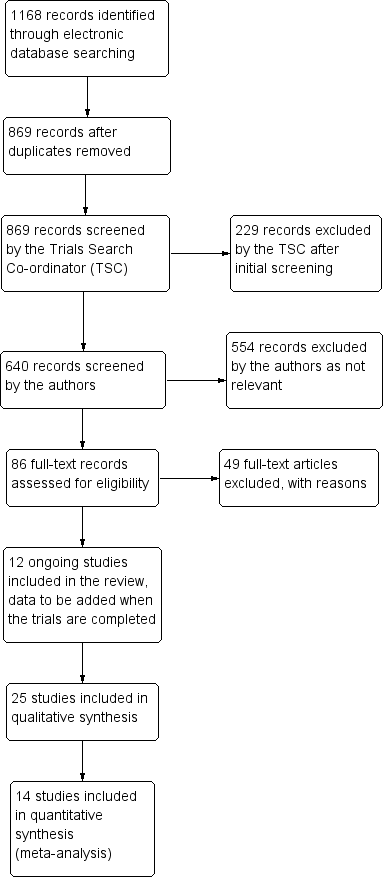
Study flow diagram.
Included studies
We included 25 studies of 30 full‐text articles, of which four studies only had abstracts available (Boscia 2008; Brancato 1994; Chan 2006; Coskun 2014). We contacted the authors of studies with abstracts only; authors of Boscia 2008 and Brancato 1994 did not respond, authors of Coskun 2014 reported not publishing the abstract as a full‐text article, and authors of Chan 2006 were not able to provide the corresponding full‐text. We provided a summary describing each of the included studies in the Characteristics of included studies table. Thirteen of 25 included studies did not report either the number of eyes or number of participants enrolled; we assumed that all included studies were parallel RCTs, where only one eye per participant was enrolled (Bae 2011; Boscia 2008; Brancato 1994; Browning 1993; Chan 2006; Klatt 2011; Leaver 1979; Ontiveros‐Orozco 2004; Rahbani‐Nobar 2011; Sawa 2014; Shang 1999; Verma 2004; Zhang 2012).
Types of participants
A total of 1098 participants from 25 included studies were enrolled from Brazil, China, Germany, India, Iran, Italy, Japan, Mexico, South Korea, Thailand, Turkey, the UK, and the US. The baseline characteristics of participants in all trials were similar with respect to age (mean age ranged from 35.0 to 50.8 years). However, 79% (685 of 872 participants) of participants were men; three studies did not report the number of men and women enrolled (Boscia 2008; Coskun 2014; Shang 1999). One study enrolled men only (Pitcher 2015).
Nine studies enrolled participants with acute CSC alone, six studies enrolled participants with chronic CSC alone, and two studies enrolled participants with both acute and chronic CSC. Seven studies did not specify type of CSC. The definition of acute CSC varied between studies; the duration of onset ranged from less than 20 days to six months. Likewise, the definition of chronic CSC varied; the duration of onset ranged from greater than 12 weeks to six months.
Types of interventions
Five classes of interventions were investigated: laser treatments (argon laser photocoagulation, micropulse diode laser photocoagulation, PDT), anti‐VEGF, medications that alter steroid hormones (carbonic anhydrase inhibitors), H. pylori treatment, and other treatments (antioxidant, calcium antagonist, beta‐blocker). In the studies of PDT, where it was specified, treatment was applied to areas of choroidal hyperpermeability, usually identified using ICGA.
The 25 included studies alluded to 19 pair‐wise comparisons:
-
anti‐VEGF versus observation;
-
anti‐VEGF versus PDT;
-
50% PDT plus anti‐VEGF versus 50% PDT;
-
different dose regimens of anti‐VEGF (six‐dose versus four‐dose aflibercept);
-
50% PDT versus observation or sham treatment;
-
50% PDT versus PDT;
-
30% PDT versus PDT;
-
30% PDT versus 50% PDT;
-
laser versus observation or sham treatment;
-
micropulse diode laser versus argon laser;
-
indirect argon laser versus direct argon laser;
-
antioxidant supplements versus placebo;
-
beta‐blocker versus placebo;
-
beta‐blocker versus calcium antagonist;
-
H. pylori treatment versus placebo or observation;
-
carbonic anhydrase inhibitors versus placebo;
-
yellow versus red wavelength laser;
-
yellow versus green wavelength laser;
-
red versus green wavelength laser.
Types of outcomes
Fourteen studies were include in the quantitative analysis. Studies reported BCVA was measured using Snellen chart and LogMAR. When authors reported the number of letters read on a logMAR chart, we converted it to a LogMAR score (Types of outcome measures). Many included studies did not clearly describe the adverse events reported, often not reporting which adverse events were collected.
Follow‐up duration ranged from 16 weeks to 12 years. None of the studies reported the proportion of CSC with BCVA 20/40 or better at 12 months, proportion of CSC with BCVA 20/200 or better at 12 months, or quality of life at 12 months.
Excluded studies
We excluded 49 studies of 47 full‐text articles and two trial registries. We documented our reasons for exclusion in the Characteristics of excluded studies table. The reasons for exclusion were: 37 studies were not RCTs, 10 studies were of traditional Chinese medication, one study (a trial registry) was terminated early due to lack of enrollment, and one study (a trial registry) enrolled participants with age‐related macular degeneration.
Ongoing studies
We identified 12 ongoing studies from the trials registers. These studies are evaluating the following interventions and comparators.
In acute CSC:
-
PDT versus observation (EUCTR2009‐017959‐98‐NL);
-
aflibercept versus sham injection (NCT01971190);
-
eplerenone versus placebo (NCT01990677; NCT02215330).
In chronic CSC;
-
lutein versus placebo (JPRN‐UMIN000005372);
-
spironolactone versus placebo (NCT01552044);
-
eplerenone versus placebo (NCT01990677; NCT02153125);
-
three doses of PDT (50%, 40%, 30%) (NCT01630863);
-
half‐dose versus half‐fluence PDT (NCT01019668);
-
half dose PDT versus micropulse diode laser (NCT01797861).
Note: trial NCT01990677 includes both acute and chronic CSC separately.
Type of CSC not clearly specified:
-
micropulse diode laser versus observation (NCT01982383);
-
short‐term oral mifepristone versus placebo (NCT02354170).
Risk of bias in included studies
Figure 3 provides a summary of our judgments for each risk of bias domain for the included studies.
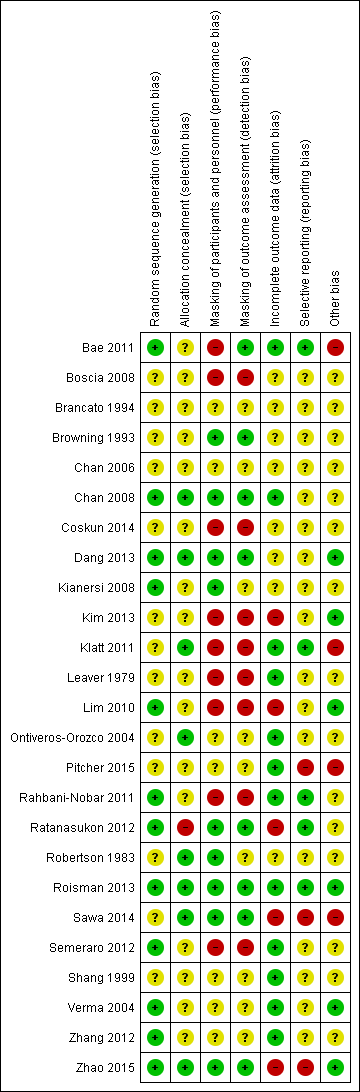
Risk of bias summary: review authors' judgments about each risk of bias item for each included study.
Allocation
We judged 12 of 25 included studies at low risk of bias as the authors explicitly reported the method used to generate a random sequence (e.g. computer‐generated, randomization software, random table, random block size design). We judged the remaining 13 studies at unclear risk of bias as the authors did not clearly describe or report the method of randomization. None of the included studies were judged at high risk of bias.
We judged eight of 25 included studies at low risk of bias as the authors explicitly reported appropriate methods to conceal the assignment sequence (e.g. data coordination center, opaque sealed envelope). We judged 16 of 24 included studies at unclear risk of bias as they had an appropriate method of random sequence generation, but did not clearly describe how the random sequence was assigned or stored, or they did not clearly describe how the random sequence was generated or stored. We judged one included study at high risk of bias as one of the investigators was involved in the sequence generation and assignment (Ratanasukon 2012).
Masking of participants and personnel (performance bias)
We judged each study based on the interventions administered to each group; studies had different treatments (e.g. laser versus observation) and studies with similar treatments (e.g. 50% PDT versus 30% PDT). Nine studies compared different treatments (Bae 2011; Boscia 2008; Coskun 2014; Kim 2013; Klatt 2011; Leaver 1979; Lim 2010; Rahbani‐Nobar 2011; Semeraro 2012). None of these studies explicitly reported masking and so we judged them at high risk of performance bias.
The remaining 16 studies had similar treatments. Nine of these 16 studies were judged at low risk of bias as the authors had explicitly stated that participants were masked. We judged seven of these 15 studies at unclear risk of bias as there was no information on masking or reported 'double blinded' without explicit description of how they were masked.
Masking of outcome assessors (detection bias)
Eight studies reported that outcome assessors were masked to treatment group and we judged them at low risk of detection bias (Bae 2011; Browning 1993; Chan 2008; Dang 2013; Ratanasukon 2012; Roisman 2013; Sawa 2014; Zhao 2015). Eight studies did not report any masking and the treatments were different and so we judged them at high risk of detection bias (Boscia 2008; Coskun 2014; Kim 2013; Klatt 2011; Leaver 1979; Lim 2010; Rahbani‐Nobar 2011; Semeraro 2012). In the remainder, it was unclear in general because the groups were similar but masking was not explicitly reported.
Incomplete outcome data
We judged five studies at high risk of attrition bias. Kim 2013 did not report the number of people randomized and loss to follow‐up by group and the final numbers analyzed were identical between treatment and observation group (20/20). Lim 2010 did not follow up 25% of participants and did not report which group they were in. Sawa 2014 excluded 5/39 participants after randomization but did not report which group they were in. Ratanasukon 2012 lost 3/29 participants to follow‐up at three months in intervention group and 4/29 in the control group (4/29) but at 12 months, only assessed seven participants in each group. So there was a low risk at three months and high risk for 12 months outcomes. In Zhao 2015, there were different losses to follow‐up in each group (13% compared with 6%).
We judged 12 studies at low risk of attrition bias because loss to follow‐up was less than 20% and there was no obvious reason why loss to follow‐up should be related to outcome (Bae 2011; Chan 2008; Klatt 2011; Leaver 1979; Ontiveros‐Orozco 2004; Pitcher 2015; Rahbani‐Nobar 2011; Roisman 2013; Semeraro 2012; Shang 1999; Verma 2004; Zhang 2012).
In the remaining studies, it was unclear whether attrition bias was a problem, usually because of a lack of information.
Selective reporting
Only five studies were at low risk of selective reporting, that is, outcomes reported a priori (usually on a trials registry entry) were reported in the published paper (Bae 2011; Klatt 2011; Rahbani‐Nobar 2011; Ratanasukon 2012; Roisman 2013). In most cases it was unclear because we did not have access to the trial protocol and the trial was not registered with a publicly available database. For Pitcher 2015, Sawa 2014, and Zhao 2015, there was some evidence of selective reporting. Sawa 2014 measured, but did not report, BCVA and only reported resolution of CSC for the intervention (lutein) group. Pitcher 2015 included additional outcomes that were not specified in the trial registry entry. Zhao 2015 specified the primary outcome at clinicaltrials.gov (NCT01574430) was "change from baseline in BCVA", but primary outcomes specified in the published report were OCT‐based improvement rate and FA‐based improvement rate at six and 12 months. They did report BCVA, but it was not defined as primary outcome (Zhao 2015).
Other potential sources of bias
We judged four studies at risk of bias either because they were industry funded or there was a declared conflict of interest (Bae 2011; Klatt 2011; Pitcher 2015; Sawa 2014). Six studies were at low risk of bias because they were non‐industry funded or the authors declared they had no conflicts of interest, or both (Dang 2013; Kim 2013; Lim 2010; Roisman 2013; Verma 2004; Zhao 2015). For the remainder of the studies, it was unclear, usually because the studies did not report funding sources and conflicts of interest.
Effects of interventions
Pairwise meta‐analysis (direct comparisons)
Anti‐vascular endothelial growth factor versus observation
Two trials compared anti‐VEGF therapy to observation; both studies were conducted in South Korea (Kim 2013; Lim 2010). Both studies enrolled participants with acute CSC, which was defined as CSC of less than three months' duration. A total of 82 people (82 eyes) were randomized in these two trials and 64 people were followed up to six months. Both trials were at high risk of performance, detection, and attrition bias.
In Kim 2013, a single dose of ranibizumab (0.5 mg/0.05 mL) was given at baseline and participants followed up for six months. In Lim 2010, a single dose of bevacizumab (1.25 mg/0.05 mL) was given within one week of diagnosis and participants were followed up for six months.
Mean change in best‐corrected visual acuity between baseline and 12 months
Both trials reported visual acuity at six months, which was similar in the anti‐VEGF and observation groups (MD 0.01 LogMAR, 95% CI ‐0.02 to 0.03; 64 eyes; I2 = 0%; Analysis 1.1). We judged this to be low quality evidence downgrading for risk of bias (‐1) and indirectness (‐1) as the outcome was only measured at six and not 12 months.
Recurrence of central serous chorioretinopathy at 12 months
Neither trial reported recurrence of CSC at 12 months.
Persistent central serous chorioretinopathy at 12 months
Both trials reported that all participants in treatment and control groups (total of 64 eyes) were resolved by six months (i.e. did not have persistent CSC).
Mean change in contrast sensitivity between baseline and 12 months
Neither trial reported mean change in contrast sensitivity between baseline and 12 months.
Mean change in central retinal thickness between baseline and 12 months
Both studies measured central retinal thickness using an OCT. There was no evidence for a difference between the two groups (MD 8.73 µm, 95% CI ‐18.08 to 35.54; 64 participants; I2 = 20%; Analysis 1.2) We judged this to be low quality evidence downgrading for risk of bias (‐1) and indirectness (‐1).
Best‐corrected visual acuity 20/40 or better at 12 months
Neither trial reported BCVA 20/40 or better at 12 months.
Best‐corrected visual acuity 20/200 or worse at 12 months
Neither trial reported BCVA 20/200 or worse at 12 months.
Quality of life at 12 months
Neither trial reported quality of life at 12 months.
Adverse events
Both studies reported that there were no adverse effects of anti‐VEGF treatment. Kim 2013 specified that they looked for systemic and ocular adverse events.
Anti‐vascular endothelial growth factor versus photodynamic therapy
Two studies compared anti‐VEGF to PDT and were conducted in South Korea (Bae 2011) and Italy (Semeraro 2012). Both studies enrolled participants with chronic CSC: in Bae 2011 this was defined as "chronic CSC with visual disturbance persisting for >6 months or recurrent CSC"; in Semeraro 2012 this was defined as "either persistence of subretinal fluid detected on optical coherence topography (OCT) for at least 3 months after diagnosis or more than 3 recurrences in at least 3 months with gravitational RPE atrophy". A total of 54 participants (56 eyes) were randomized in these trials and all were followed up to nine months (Semeraro 2012) and 12 months (Bae 2011). We judged both studies at high risk of performance bias; Semeraro 2012 was also at high risk of detection bias; Bae 2011 was industry funded.
In both studies, PDT was "low fluence", which means that they used a light dose of 25 J/cm2. In Bae 2011, ranibizumab (0.5 mg/0.05 mL) was given at baseline, one month, and two months; in Semeraro 2012, bevacizumab (1.25 mg) was given at baseline and then as needed after four weeks.
Mean change in best‐corrected visual acuity between baseline and 12 months
Visual acuity was similar between the two groups (MD 0.03 logMAR, 95% CI ‐0.08 to 0.15; 56 eyes; I2 = 0%; Analysis 2.1). We judged this to be low quality evidence downgrading for risk of bias (‐1) and imprecision (‐1) as we cannot exclude a clinically important effect.
Recurrence of central serous chorioretinopathy at 12 months
The two studies had different results for this outcome (I2 = 71%; Analysis 2.2). In Bae 2011, there was a much higher risk of recurrence in the anti‐VEGF group (ranibizumab) compared with the PDT group (RR 19.83, 95% CI 1.19 to 330.50; 21 eyes); in Semeraro 2012 there was also an increased risk of recurrence in the anti‐VEGF (bevacizumab) group but the size of the effect was much smaller and the CIs included 1 (i.e. no effect) (RR 1.46, 95% CI 0.59 to 3.58; 22 eyes). Note the denominator in these studies is smaller as only the eyes where CSC had resolved were at risk of recurrence. We judged this to be very low quality of evidence downgrading for risk of bias (‐1), imprecision (‐1), and inconsistency (‐1); we are very uncertain as to the size of the effect.
Persistent central serous chorioretinopathy at 12 months
Only Bae 2011 reported persistent CSC at 12 months. People in the anti‐VEGF group (ranibizumab) were more likely to have persistent CSC at 12 months (RR 6.19, 95% CI 1.61 to 23.81; 34 eyes; Analysis 2.3). We judged this to be low quality evidence and downgraded for risk of bias (‐1) and imprecision (‐1).
Mean change in contrast sensitivity between baseline and 12 months
Neither trial reported mean change in contrast sensitivity between baseline and 12 months.
Mean change in central retinal thickness between baseline and 12 months
The two studies found different results for central retinal thickness (I2 = 69%; Analysis 2.4). In Bae 2011, there was a greater reduction in thickness in the PDT group (MD 31.30 µm, 95% CI ‐3.46 to 66.06); in Semeraro 2012, there was a greater reduction in the anti‐VEGF group (bevacizumab) (MD ‐13.00, 95% CI ‐46.05 to 20.05). We judged this to be very low quality of evidence downgrading for risk of bias (‐1), imprecision (‐1), and inconsistency (‐1); we are very uncertain as to the size of the effect.
Best‐corrected visual acuity 20/40 or better at 12 months
Neither trial reported BCVA 20/40 or better at 12 months.
Central serous chorioretinopathy eyes with best‐corrected visual acuity 20/200 or worse at 12 months
Neither trial reported CSC eyes with BCVA 20/200 or worse at 12 months.
Quality of life at 12 months
Neither trial reported quality of life at 12 months.
Adverse events
Both studies reported that no systemic or ocular adverse events related to the drugs or procedures were observed.
Anti‐vascular endothelial growth factor plus 50% photodynamic therapy versus 50% photodynamic therapy alone
One study conducted in Turkey compared anti‐VEGF (bevacizumab 1.25 mg single dose three days after PDT) plus PDT to PDT alone (Coskun 2014). The PDT was "half dose" (i.e. the dose of verteporfin used was half that usually delivered (3 mg/m2)). The study enrolled 15 participants with chronic CSC (duration six months) and followed them up for a mean of 12 months in the anti‐VEGF plus PDT group and nine months in the PDT alone group. This study was reported in an abstract only and was largely judged at unclear risk of bias apart from performance and detection bias where we judged them at high risk of bias because masking was not mentioned and the treatments were obviously different.
Mean change in best‐corrected visual acuity between baseline and 12 months
At follow‐up, the mean logMAR visual acuity in the anti‐VEGF plus PDT group was 0.36 (standard deviation (SD) 0.25) and in the PDT alone group was 0.06 (SD 0.15). This gives an MD in favor of PDT alone of 0.30 logMAR (95% CI 0.09 to 0.51; Analysis 3.1). We judged this to be low quality evidence downgrading for risk of bias (‐1) and imprecision (‐1) as the CIs include clinically unimportant effects.
Recurrence of central serous chorioretinopathy at 12 months
The trial did not report recurrence of CSC at 12 months.
Persistent central serous chorioretinopathy at 12 months
CSC resolved in 7/8 eyes in the anti‐VEGF plus PDT group and 6/7 eyes in the PDT alone group (RR 0.88, 95% CI 0.07 to 11.54; Analysis 3.2). We judged this to be very low quality evidence and downgraded for risk of bias (‐1) and imprecision (‐2) due to very wide CIs. We are very uncertain as to the size of the effect.
Mean change in contrast sensitivity between baseline and 12 months
The trial did not report mean change in contrast sensitivity between baseline and 12 months.
Mean change in central retinal thickness between baseline and 12 months
In the anti‐VEGF plus PDT group, the central macular thickness was 203 µm (SD 45) and in the PDT alone group it was 187 µm (SD 15) (MD 16.00 µm, 95% CI ‐17.10 to 49.10; Analysis 3.3). We judged this to be low quality evidence; we downgraded for risk of bias (‐1) and imprecision (‐1).
Best‐corrected visual acuity 20/40 or better at 12 months
The trial did not report BCVA 20/40 or better at 12 months.
Best‐corrected visual acuity 20/200 or worse at 12 months
The trial did not report BCVA 20/200 or worse at 12 months.
Quality of life at 12 months
The trial did not report quality of life at 12 months.
Adverse events
The trial did not report adverse events.
Six‐dose anti‐vascular endothelial growth factor versus four‐dose anti‐vascular endothelial growth factor
One study from the US compared two treatment regimens: aflibercept 2.0 mg/0.05 mL administered six times (at baseline, one, two, three, four, and five weeks) versus four times (at baseline, one, two, and four weeks) (Pitcher 2015). The study enrolled 12 participants and followed them for six months. This study was poorly reported with mostly unclear risk of bias and high risk of reporting bias. The study received industry funding.
Mean change in best‐corrected visual acuity between baseline and 12 months
There was a similar change in logMAR acuity over six months in the two groups. In the group given six doses, on average visual acuity improved by 0.1 logMAR (SD 0.32) and in the group given four doses it improved by 0.08 logMAR (SD 0.16). This was an MD of 0.02 logMAR units greater improvement (95% CI ‐0.31 to 0.27) in the six‐doses group but with wide CIs (Analysis 4.1). We judged this to be low quality evidence downgrading for risk of bias (‐1) and imprecision (‐1).
Recurrence of central serous chorioretinopathy at 12 months
The trial did not report recurrence of CSC at 12 months.
Persistent central serous chorioretinopathy at 12 months
The trial did not report persistent CSC at 12 months.
Mean change in contrast sensitivity between baseline and 12 months
The trial did not report mean change in contrast sensitivity between baseline and 12 months.
Mean change in central retinal thickness between baseline and 12 months
The two groups had similar change in central macular thickness over six months with an MD of 26.50 µm (95% CI ‐123.41 to 176.41; 12 participants). Both groups experienced a decrease: in the six‐dose group of ‐80 µm (SD 103.7) and in the four‐dose group of ‐103 µm (SD 156). We judged this to be low quality evidence downgrading for risk of bias (‐1) and imprecision (‐1).
Best‐corrected visual acuity 20/40 or better at 12 months
The trial did not report BCVA 20/40 or better at 12 months.
Best‐corrected visual acuity 20/200 or worse at 12 months
The trial did not report BCVA 20/200 or worse at 12 months.
Quality of life at 12 months
The trial did not report quality of life at 12 months.
Adverse events
The trial reported there were no adverse events.
Photodynamic therapy versus observation or sham treatment
Two studies compared PDT to no PDT and were conducted in Italy (Boscia 2008) and China (Hong Kong) (Chan 2008).
Boscia 2008 was reported in an abstract only and there was no information on our review outcomes. We contacted the investigators (twice) for more information but did not receive a reply. In the abstract report of Boscia 2008 no actual data were reported. In the results section, the following statement was made "No significant changes in all parameters were seen in untreated group. An improvement of far and near BCVA were seen in comparison with both baseline (ANOVA, p=0,008 and 0,000), and control group (t‐TEST, p=0,010 at p=0,000), with the greatest effect at week 24. In all treated eyes a complete resolution of subretinal fluid was observed, with significant reduction of central macular thickness. On week 24, in treated eyes, a significant improvement in mean fixation stability was also observed (ANOVA, p=0,011). No recurrence and/or adverse event occurred in any of the treated patients during the follow‐up".
Therefore, the following review outcomes were only available for Chan 2008.
Chan 2008 enrolled people with acute CSC, which was defined as less than three months' duration. The study enrolled 63 people (63 eyes) and followed up 58 people to 12 months. The study was low risk of bias in most domains and unclear for two domains: selective outcome reporting (where we did not have access to protocol or trials register entry to check this) and other bias (one of the authors declared a conflict of interest but this was only one of five authors and not the first author). Chan 2008 compared 'half dose' PDT (verteporfin 3 mg/m2) to sham PDT treatment (saline infusion and laser application as for PDT).
Mean change in best‐corrected visual acuity between baseline and 12 months
At 12 months, the visual acuity in the PDT group was better than the visual acuity in the sham PDT group (MD ‐0.10, 95% CI ‐0.18 to ‐0.02). We judged this to be low quality evidence, downgrading for imprecision (‐1) (as the CIs included a clinically unimportant effect) and risk of bias (‐1) (Analysis 5.1).
Recurrence of central serous chorioretinopathy at 12 months
CSC resolved in 38 eyes in the PDT group and one of these 38 eyes had a recurrence by 12 months. In the control group, 15/19 resolved and four of these 15 had a recurrence (RR 0.10, 95% CI 0.01 to 0.81; Analysis 5.2). We judged this to be low quality evidence downgrading for risk of bias (‐1) and imprecision (‐1), as there were very few events.
Persistent central serous chorioretinopathy at 12 months
One of 29 eyes had persistent CSC in the PDT group compared with 4/39 eyes in the control group (RR 0.12, 95% CI 0.01 to 1.02; Analysis 5.2). We judged this to be low quality evidence; downgrading for risk of bias (‐1) and imprecision (‐1).
Mean change in contrast sensitivity between baseline and 12 months
The trial did not report mean change in contrast sensitivity between baseline and 12 months
Mean change in central retinal thickness between baseline and 12 months
The CRT was thinner in the PDT group compared with the sham PDT group at 12 months (MD ‐117.00 μm, 95% CI ‐205.71 to ‐28.29; Analysis 5.3). We judged this to be low quality evidence, downgrading for risk of bias (‐1) and imprecision (‐1), as the CIs included a clinically unimportant effect.
Best‐corrected visual acuity 20/40 or better at 12 months
The trial did not report BCVA 20/40 or better at 12 months.
Best‐corrected visual acuity 20/200 or worse at 12 months
The trial did not report BCVA 20/200 or worse at 12 months.
Quality of life at 12 months
The trial did not report quality of life at 12 months.
Adverse events
Chan 2008 reported that no systemic or ocular adverse events related to the PDT procedure were observed.
30% photodynamic therapy compared with 50% photodynamic therapy compared with photodynamic therapy
One study compared 30% PDT, 50% PDT, and PDT (Zhang 2012). This study was conducted in China and enrolled 90 eyes of 90 participants with 30 participants in each group and followed them up to 12 months. The type of CSC was not specified. We largely judged this study to be at unclear risk of bias because of problems with reporting.
One additional study, also conducted in China, compared 30% PDT with 50% PDT (Zhao 2015). This study enrolled 129 participants (129 eyes) and followed 117 participants to 12 months. We judged this study to be at low risk of bias in most domains with the exception of attrition bias (6% of the 30% PDT group were lost to follow‐up compared to 13% of the 50% PDT group) and selective outcome reporting (primary and secondary outcomes were designated differently on the trial register entry and the published report).
Both studies applied 50 J/cm2 light energy for 83 seconds but varied the dose of verteporfin: full dose (6 mg/m2), 50% dose (3 mg/m2), and 30% dose (2 mg/m2) (Zhang 2012), and 1.8 mg/m2 (Zhao 2015).
Mean change in best‐corrected visual acuity between baseline and 12 months
30% photodynamic therapy compared with photodynamic therapy
The mean change in visual acuity for the 30% PDT group was 0.03 logMAR (SD 0.02) and the mean change in the PDT group was 0.19 logMAR (SD 0.16). This gives an MD in favor of 30% PDT group (MD ‐0.16 logMAR, 95% CI ‐0.22 to ‐0.10; Analysis 6.1). We judged this to be moderate quality evidence downgrading for risk of bias (‐1).
50% photodynamic therapy compared with photodynamic therapy
The mean change in visual acuity for the 50% PDT group was 0.23 logMAR (SD 0.15) and the mean change in the PDT group was 0.19 logMAR (SD 0.16). We judged this to be low quality evidence downgrading for risk of bias (‐1) and imprecision (‐1) due to wide CIs. We are uncertain as to the size of the effect (MD 0.04, 95% CI ‐0.04 to 0.12; Analysis 7.1).
30% photodynamic therapy compared with 50% photodynamic therapy
The MD was favor of 30% PDT group over 50% PDT (MD ‐0.12, 95% CI ‐0.15 to ‐0.08; 177 participants; 2 studies; Analysis 8.1). We judged this to be moderate quality evidence downgrading for risk of bias (‐1).
Recurrence of central serous chorioretinopathy at 12 months
30% photodynamic therapy compared with photodynamic therapy
CSC resolved in 30 eyes in the 30% PDT group and 22 of these 30 eyes had a recurrence by 12 months. In the control group, 30 eyes resolved and eight of these 30 had a recurrence (RR 2.75, 95% CI 1.46 to 5.17; Analysis 6.2). We judged this to be moderate quality evidence downgrading for risk of bias (‐1).
50% photodynamic therapy compared with photodynamic therapy
CSC resolved in 30 eyes in the 50% PDT group and 10 of these 30 eyes had a recurrence by 12 months. In the PDT group, 30 eyes resolved and eight of these 30 had a recurrence (RR 1.25, 95% CI 0.57 to 2.73; 60 participants; 1 study; Analysis 7.2). We judged this low quality evidence, downgrading for risk of bias (‐1) and imprecision (‐1).
30% photodynamic therapy compared with 50% photodynamic therapy
The risk of recurrence of CSC for 30% PDT at 12 months was 2.5 times higher than that of 50% PDT group (RR 2.50, 95% CI 1.54 to 4.06; 153 participants; Analysis 8.2). We judged this to be moderate quality evidence downgrading for risk of bias (‐1).
Persistent central serous chorioretinopathy at 12 months
30% photodynamic therapy compared with photodynamic therapy
Zhang 2012 did not report 30% PDT compared with PDT.
50% photodynamic therapy compared with photodynamic therapy
Zhang 2012 did not report 50% PDT compared with PDT.
30% photodynamic therapy compared with 50% photodynamic therapy
Data from Zhao 2015 showed that CSC was persistent in 19 of 61 eyes in the 30% PDT group and in four of 56 eyes in the 50% PDT group (RR 4.36, 95% CI 1.58 to 12.04; Analysis 8.3). We judged this to be moderate quality evidence downgrading for risk of bias (‐1).
Mean change in contrast sensitivity between baseline and 12 months
Neither study reported mean change in contrast sensitivity between baseline and 12 months.
Mean change in central retinal thickness between baseline and 12 months
30% photodynamic therapy compared with photodynamic therapy
The mean change in central retinal thickness was reduced by 10.8 μm (SD 6.52) in the 30% PDT group and reduced by 52.13 µm (SD 9.06) in the PDT group. This means that on average there was a greater reduction in central retinal thickness in the PDT group (MD 41.33 µm, 95% CI 37.34 to 45.32; 60 participants; Analysis 6.3). We judged this to be moderate quality evidence downgrading for risk of bias (‐1).
50% photodynamic therapy compared with photodynamic therapy
The mean change in central retinal thickness was reduced 55.66 μm (SD 0.21) in the 50% PDT group and reduced by 52.13 μm (SD 9.06) in the PDT group. This means that there was a small greater reduction in central retinal thickness in the 50% PDT group (MD ‐3.53, 95% CI ‐6.77 to ‐0.29; Analysis 7.3). We judged this to be low quality evidence downgrading for risk of bias (‐1) and imprecision (‐1).
30% photodynamic therapy compared with 50% photodynamic therapy
There was a greater mean reduction in central retinal thickness in the 50% PDT group (MD 44.90, 95% CI 42.57 to 47.23; 177 participants; Analysis 8.4). We judged this to be moderate quality evidence downgrading for risk of bias (‐1).
Best‐corrected visual acuity 20/40 or better at 12 months
Neither study reported BCVA 20/40 or better at 12 months.
Best‐corrected visual acuity 20/200 or worse at 12 months
Neither study reported BCVA 20/200 or worse at 12 months.
Quality of life at 12 months
Neither study reported quality of life at 12 months.
Adverse events
Zhang 2012 did not report on adverse events.
Zhao 2015 reported that no ocular adverse event occurred; one participant developed nausea because of an allergic reaction to verteporfin.
Laser versus observation or sham treatment
Four studies compared laser to observation or sham laser treatment.
Klatt 2011 was conducted in Germany and enrolled 30 eyes with acute CSC (30 participants) in a trial of micropulse laser ("selective retina therapy") compared with observation with follow‐up of three months. Selective retina therapy was Q‐switched neodymium‐doped yttrium lithium fluoride (Nd:YLF) laser with a wavelength of 527 nm. They used a spot diameter of 200 µm and pulse repetition rate of 100 Hz. We judged this study at high risk of performance and detection bias and the authors reported conflict of interest.
Leaver 1979 was conducted in the UK and compared direct argon laser photocoagulation to observation in 67 people with acute CSC. Four participants were lost to follow‐up at 12 months. With the exception of two subfoveal leaks, direct treatment was applied using the "Coherent Radiation 800" argon laser to the leaking spot using burns of 50 to 200 µm in diameter. The study was at high risk of performance and detection bias and otherwise was not clearly reported (being quite an old study) and was largely at unclear risk of bias for the other domains.
Robertson 1983 was conducted in the US and enrolled 41 participants (42 eyes) with acute CSC. The study sample was stratified according to the site of leakage. In eyes where the leakage site was in the papillomacular bundle, or within 500 µm of the capillary‐free zone of the macula, eyes were randomly assigned either to indirect argon laser photocoagulation or sham treatment. In eyes where the leakage site was outside the papillomacular bundle, and more than 500 µm from the capillary‐free zone, eyes were randomly allocated to direct or indirect laser photocoagulation ‐ this comparison is discussed below. Participants receiving indirect laser photocoagulation received three argon laser burns directed to the pigment epithelium in an area remote from the fovea, the papillomacular bundle, and the fluorescein leakage site. The laser beam diameter was 200 µm and the burn duration was 0.2 seconds at a power setting of 80 to 120 mW. In the sham technique, the laser beam was switched in the "off" position. We judged the study at low risk of performance and detection bias but unclear risk for other domains (being an older study relevant aspects were not reported).
Roisman 2013 was conducted in Brazil and compared micropulse diode laser to sham photocoagulation in 15 people with chronic CSC. The laser treatment consisted of subthreshold 810‐nm diode micropulse laser. We judged the study to be largely at low risk of bias.
Mean change in best‐corrected visual acuity between baseline and 12 months
This outcome was available for only two of the four studies (Klatt 2011; Roisman 2013). In Leaver 1979, Snellen acuities were converted to a numerical scale from 1 (6/4) to 5 (6/12). The mean acuity at six months was 3.1 in the laser group and 2.9 in the control group. In Robertson 1983, mean visual acuity was not reported.
The two studies that reported mean change in BCVA between baseline and 12 months had high statistical heterogeneity (I2 = 82%) but both were in favor of laser treatment (Analysis 9.1). In Klatt 2011, the difference between treatment and control at three months in improvement in vision was ‐0.13 logMAR (95% CI ‐0.24 to ‐0.01) in favor of selective retina therapy. In Roisman 2013, the difference between final visual acuity at six months was ‐0.38 logMAR (95% CI ‐0.56 to ‐0.20) in favor of micropulse diode laser treatment.
Recurrence of central serous chorioretinopathy at 12 months
One study reported on recurrence of CSC at 12 months (Robertson 1983). Similar numbers of the indirect laser group (5/15) compared with the sham laser group had a recurrence during the study (RR 1.25, 95% CI 0.41 to 3.77; Analysis 9.2). We judged this to be very low quality evidence downgrading for risk of bias (‐1) and imprecision (‐2).
Persistent central serous chorioretinopathy at 12 months
None of the studies clearly reported persistent CSC at 12 months.
Mean change in contrast sensitivity between baseline and 12 months
None of the studies reported mean change in contrast sensitivity between baseline and 12 months
Mean change in central retinal thickness between baseline and 12 months
None of the studies reported mean change in central retinal thickness between baseline and 12 months.
Best‐corrected visual acuity 20/40 or better at 12 months
None of the studies reported BCVA 20/40 or better at 12 months.
Best‐corrected visual acuity 20/200 or worse at 12 months
None of the studies reported BCVA 20/200 or worse at 12 months.
Quality of life at 12 months
None of the studies reported quality of life at 12 months.
Adverse events
Klatt 2011 reported that no adverse effects related to micropulse laser were observed.
Roisman 2013 did not specifically report on adverse events but did note "no evidence of retinal damage induced by the treatment".
Leaver 1979 and Robertson 1983 did not provide any information on adverse effects.
Micropulse diode laser versus argon laser
One trial conducted in India compared micropulse diode laser to argon laser (Verma 2004). The study enrolled 30 people with CSC (not specified whether acute or chronic) and allocated them to 810‐nm diode laser or 514‐nm argon laser and followed them up for 12 weeks. We judged the trial to be at low/unclear risk of bias.
Mean change in best‐corrected visual acuity between baseline and 12 months
This was reported in Snellen decimal acuity.
| Mean (SD) Snellen decimal acuity | ||
| Micropulse diode laser (15 participants) | Argon laser (15 participants) | |
| Baseline | 0.29 (0.14) | 0.32 (0.16) |
| 12 weeks | 1.06 (0.09) | 0.98 (0.14) |
Recurrence of central serous chorioretinopathy at 12 months
None of the 30 participants had a recurrence before 12 weeks.
Persistent central serous chorioretinopathy at 12 months
None of the 30 participants had persistent CSC at 12 weeks.
Mean change in contrast sensitivity between baseline and 12 months
| Mean absolute value of contrast sensitivity (Cambridge low contrast gratings) | ||
| Micropulse diode laser (15 participants) | Argon laser (15 participants) | |
| Baseline | 98.4 (24.77) | 130.66 (31.95) |
| 12 weeks | 306.0 (46.57) | 215.33 (23.25) |
Mean change in central retinal thickness between baseline and 12 months
The study did not report mean change in central retinal thickness between baseline and 12 months.
Best‐corrected visual acuity 20/40 or better at 12 months
The study did not report BCVA 20/40 or better at 12 months
Best‐corrected visual acuity 20/200 or worse at 12 months
The study did not report BCVA 20/200 or worse at 12 months
Quality of life at 12 months
The study did not report quality of life at 12 month.
Adverse events
None of the participants developed subretinal neovascularization. No other complications or adverse effects were mentioned.
Indirect argon laser versus direct argon laser
One study compared indirect and direct argon laser (Robertson 1983). This study was conducted in the US and enrolled 41 participants (42 eyes) with acute CSC. In eyes where the leakage site was outside the papillomacular bundle, and more than 500 µm from the capillary‐free zone, eyes were randomly allocated to direct or indirect laser photocoagulation. Participants receiving indirect laser photocoagulation received three argon laser burns directed to the pigment epithelium. The laser beam diameter was 200 µm and the burn duration was 0.2 seconds at a power setting of 80 to 120 mW. We judged the study at low risk of performance and detection bias but unclear risk for other domains (being an older study relevant aspects were not reported).
Mean change in best‐corrected visual acuity between baseline and 12 months
The study did not report mean change in BCVA between baseline and 12 months.
Recurrence of central serous chorioretinopathy at 12 months
Three of five participants in the indirect group experienced a recurrence by 24 weeks compared with 0/7 in the direct laser group (RR 9.33, 95% CI 0.59 to 148.60; Analysis 10.1). We judged this to be very low quality evidence downgrading for risk of bias (‐1) and imprecision (‐2); we are very uncertain as to the size of the effect.
Persistent central serous chorioretinopathy at 12 months
The study did not report persistent CSC at 12 months.
Mean change in contrast sensitivity between baseline and 12 months
The study did not report mean change in contrast sensitivity between baseline and 12 months.
Mean change in central retinal thickness between baseline and 12 months
The study did not report mean change in central retinal thickness between baseline and 12 months.
Best‐corrected visual acuity 20/40 or better at 12 months
The study did not report BCVA 20/40 or better at 12 months.
Best‐corrected visual acuity 20/200 or worse at 12 months
The study did not report BCVA 20/200 or worse at 12 months.
Quality of life at 12 months
The study did not report quality of life at 12 months.
Adverse events
The study did not report adverse events.
Yellow versus red versus green wavelength laser
One study conducted in China compared yellow, red, and green wavelength laser in 90 participants with CSC of duration longer than eight weeks (Shang 1999). We largely judged the trial to be at unclear risk of bias.
Mean change in best‐corrected visual acuity between baseline and 12 months
The study did not report mean change in BCVA between baseline and 12 months.
Recurrence of central serous chorioretinopathy at 12 months
The relative effects of these wavelengths on this outcome were uncertain (Analysis 11.1). We graded these estimates as low quality evidence downgrading for risk of bias (‐1) and imprecision (‐1).
Yellow compared with red
RR 0.60, 95% CI 0.16 to 2.29; 60 eyes.
Yellow compared with green
RR 0.72, 95% CI 0.18 to 2.96; 59 eyes.
Red compared with green
RR 1.21, 95% CI 0.36 to 4.06; 59 eyes.
Persistent central serous chorioretinopathy at 12 months
The study did not report persistent CSC at 12 months.
Mean change in contrast sensitivity between baseline and 12 months
The study did not report mean change in contrast sensitivity between baseline and 12 months.
Mean change in central retinal thickness between baseline and 12 months
The study did not report mean change in central retinal thickness between baseline and 12 months.
Best‐corrected visual acuity 20/40 or better at 12 months
The study did not report BCVA 20/40 or better at 12 months.
Best‐corrected visual acuity 20/200 or worse at 12 months
The study did not report BCVA 20/200 or worse at 12 months.
Quality of life at 12 months
The study did not report quality of life at 12 months.
Adverse events
The study did not report adverse events.
Antioxidant supplements versus placebo
Two studies compared antioxidant supplements to placebo.
Ratanasukon 2012 was conducted in Thailand and enrolled 58 participants (58 eyes) with acute CSC (onset within six weeks). These participants were randomly allocated to antioxidants or placebo and followed up at three and 12 months. There was high attrition at 12 months with only 14 people seen at that time point. The antioxidants were supplied as ICaps (Alcon Laboratories) in a version that contained vitamin A (6600 IU), vitamin C (400 mg), vitamin E (150 IU), riboflavin (10 mg), zinc (60 mg), copper (4 mg), selenium (40 mg), manganese (4 mg), and lutein/zeaxanthin (4000 μg). We judged the study at high risk of selection bias and attrition bias.
Sawa 2014 was conducted in Japan and investigated the effects of a lutein supplement (20 mg/day) with follow‐up of four months. The type of CSC and the total number of people randomized was not specified. The total number analyzed was 39. We judged the study at high risk of attrition bias and selective outcome reporting bias and it was funded by the manufacturer of the supplement.
The main aim of Sawa 2014 was to examine at changes in macular pigment optical density; none of our review outcomes were reported. The following outcomes are discuss for Ratanasukon 2012.
Mean change in best‐corrected visual acuity between baseline and 12 months
Visual acuity at 12 months was similar in the antioxidant and placebo groups (MD 0.01, 95% CI ‐0.04 to 0.06; 14 participants; Analysis 12.1). We judged this to be low quality evidence downgrading for risk of bias (‐2).
Recurrence of central serous chorioretinopathy at 12 months
Only three participants had a recurrence, one in the antioxidant group and two in the control group (RR 0.32, 95% CI 0.03 to 3.19; 36 participants; Analysis 12.2). With so few events, we are very uncertain as to the effect and judged this to be very low quality evidence downgrading for risk of bias (‐1) and imprecision (‐2).
Persistent central serous chorioretinopathy at 12 months
The paper did not report persistent CSC at 12 months clearly but the number of people with complete resolution was reported. People in the antioxidant group were less likely to have complete resolution (RR 0.35, 95% CI 0.13 to 0.95; 51 participants; Analysis 12.3). We judged this to be low quality evidence downgrading for risk of bias (‐1) and indirectness (‐1), as it was not precisely the outcome required.
Mean change in contrast sensitivity between baseline and 12 months
The study did not report mean change in contrast sensitivity between baseline and 12 months.
Mean change in central retinal thickness between baseline and 12 months
There was a mean reduction of 180 µm (SD 15.05) in the antioxidant group compared to 186.22 µm reduction in the placebo group (MD ‐6.22, 95% CI ‐25.13 to 12.69; 14 participants; Analysis 12.4).
Best‐corrected visual acuity 20/40 or better at 12 months
The study did not report BCVA 20/40 or better at 12 months.
Best‐corrected visual acuity 20/200 or worse at 12 months
The study did not report BCVA 20/200 or worse at 12 months.
Quality of life at 12 months
The study did not report quality of life at 12 months.
Adverse events
The study reported "no significant side effects" at three months.
Beta‐blocker versus placebo
Two studies compared beta‐blocker to placebo. They were conducted in US (Browning 1993) and Iran (Kianersi 2008). The studies enrolled a total of 76 eyes (possibly 76 people) and followed them up to four months (Browning 1993) and 12 months (Kianersi 2008).
Browning 1993 looked at the effect of nadolol 40 mg/day in 16 participants and Kianersi 2008 investigated propranolol 40 mg/day delivered as 20 mg twice a day in 60 participants.
We judged both studies at low risk of detection bias because they were placebo controlled, but were largely judged at unclear risk of bias for the other domains because of poor reporting.
Browning 1993 was a short report and did not report any of the review outcomes. The following outcomes are discussed for Kianersi 2008 only (60 eyes).
Mean change in best‐corrected visual acuity between baseline and 12 months
Mean visual acuity in the propranolol group at 12 months was 0.98 logMAR (SD 0.13) and in the placebo group was 0.97 logMAR (SD 0.18) (MD 0.01 logMAR, 95% CI ‐0.07 to 0.09; 60 eyes; Analysis 13.1). We judged this to be moderate quality evidence downgrading for risk of bias (‐1).
Recurrence of central serous chorioretinopathy at 12 months
The effect of beta‐blocker on recurrence was uncertain (RR 0.60, 95% CI 0.16 to 2.29; 60 eyes; Analysis 13.2). We judged this to be low quality evidence, downgrading for risk of bias (‐1) and imprecision (‐1).
Persistent central serous chorioretinopathy at 12 months
The study did not report persistent CSC at 12 months.
Mean change in contrast sensitivity between baseline and 12 months
The study did not report mean change in contrast sensitivity between baseline and 12 months.
Mean change in central retinal thickness between baseline and 12 months
The study did not report mean change in central retinal thickness between baseline and 12 months.
Best‐corrected visual acuity 20/40 or better at 12 months
Similar numbers of people in the beta‐blocker and placebo groups had visual acuity 20/40 or better at 12 months (RR 1.10, 95% CI 0.81 to 1.49; 60 participants; Analysis 13.3). We judged this to be low quality evidence, downgrading for risk of bias (‐1) and imprecision (‐1).
Best‐corrected visual acuity 20/200 or worse at 12 months
The study did not report BCVA 20/200 or worse at 12 months.
Quality of life at 12 months
The study did not report quality of life at 12 months.
Adverse events
The study reported that no adverse events occurred.
Beta‐blocker versus calcium antagonist
One study compared beta‐blocker (propranolol) to a calcium antagonist in 25 participants affected with acute and chronic CSC (Brancato 1994). The study was reported in abstract form only and the abstract did not include any results. We contacted the trialists twice but received no reply.
Topical carbonic anhydrase inhibitors versus placebo
One study conducted in Mexico enrolled 13 participants with acute CSC (less than 20 days' duration) and randomly allocated them to brinzolamide (2%, twice a day) or placebo (polyvinyl alcohol) with follow‐up of six months (Ontiveros‐Orozco 2004). We largely judged the trial to be at unclear risk of bias.
Mean change in best‐corrected visual acuity between baseline and 12 months
The study did not report mean change in BCVA between baseline and 12 months.
Recurrence of central serous chorioretinopathy at 12 months
One of seven participants in the brinzolamide group had a recurrence compared with 4/6 participants in the placebo group (RR 0.21, 95% CI 0.03 to 1.43; Analysis 14.1). We judged this to be low quality evidence downgrading for risk of bias (‐1) and imprecision (‐1).
Persistent central serous chorioretinopathy at 12 months
None of seven participants in the brinzolamide group had persistent CSC compared with 1/6 participants in the placebo group (RR 0.29, 95% CI 0.01 to 6.07; Analysis 14.1). We judged this to be very low quality evidence downgrading for risk of bias (‐1) and imprecision (‐2).
Mean change in contrast sensitivity between baseline and 12 months
The study did not report mean change in contrast sensitivity between baseline and 12 months.
Mean change in central retinal thickness between baseline and 12 months
The study did not report mean change in central retinal thickness between baseline and 12 months.
Best‐corrected visual acuity 20/40 or better at 12 months
The study did not report BCVA 20/40 or better at 12 months.
Best‐corrected visual acuity 20/200 or worse at 12 months
The study did not report BCVA 20/200 or worse at 12 months.
Quality of life at 12 months
The study did not report quality of life at 12 months.
Adverse events
The study noted no adverse effects of brinzolamide.
Helicobacter pylori treatment versus placebo or observation
Two studies compared H. pylori treatment to no treatment in people with acute CSC who also had H. pylori infection. Dang 2013 was conducted in China and compared H. pylori therapy to placebo in 53 participants with follow‐up of 12 weeks. Rahbani‐Nobar 2011 was conducted in Iran and compared H. pylori treatment with no treatment in 50 participants with follow‐up of 16 weeks. We judged Dang 2013 at low risk of bias in most domains; and Rahbani‐Nobar 2011 at high risk of performance and detection bias.
Mean change in best‐corrected visual acuity between baseline and 12 months
Visual acuity was slightly better in the H. pylori‐treated group (MD ‐0.04 logMAR, 95% CI ‐0.07 to ‐0.02; 103 participants; Analysis 15.1) Heterogeneity was high (I2 = 82%) but the two studies showed similar direction and order of effect. We judged this to be low quality evidence downgrading for risk of bias (‐1) and imprecision (‐1) as the CIs included a clinically unimportant effect.
Recurrence of central serous chorioretinopathy at 12 months
The studies did not report recurrence of CSC at 12 months.
Persistent central serous chorioretinopathy at 12 months
Fewer people in the H. pylori‐treated group had persistent CSC at 12 weeks (Dang 2013) or 16 weeks (Rahbani‐Nobar 2011) of follow‐up (RR 0.67, 95% CI 0.36 to 1.22; 103 participants; Analysis 15.2). We judged this to be low quality evidence, downgrading for risk of bias (‐1) and imprecision (‐1).
Mean change in contrast sensitivity between baseline and 12 months
The studies did not report mean change in contrast sensitivity between baseline and 12 months.
Mean change in central retinal thickness between baseline and 12 months
The studies did not report mean change in central retinal thickness between baseline and 12 months.
Best‐corrected visual acuity 20/40 or better at 12 months
The studies did not report BCVA 20/40 or better at 12 months.
Best‐corrected visual acuity 20/200 or worse at 12 months
The studies did not report BCVA 20/200 or worse at 12 months.
Quality of life at 12 months
The studies did not report quality of life at 12 months.
Adverse events
Dang 2013 noted that no systemic or ocular adverse events occurred during follow‐up.
Rahbani‐Nobar 2011 noted that no systemic adverse effects of medication were observed.
Network meta‐analyses (direct and indirect comparisons)
As specified in Types of interventions section, we restricted our network to interventions applied directly to the eye.
We planned to look at three outcomes: visual acuity, recurrence, and adverse events. Almost all studies reported no adverse events, so we are unable to do this analysis.
Visual acuity
Description of network
Figure 4 shows the network plots. With so few trials included in the network it was difficult to assess transitivity (Table 1). It is possible that the inclusion of people with acute or chronic CSC may be different in the different comparisons. This would affect the validity of the network. Overall, there was no evidence for statistical inconsistency (P value = 0.3208). There was only one closed loop (anti‐VEGF, PDT, control) and again no evidence for inconsistency (inconsistency factor = 0.073, P value = 0.321). However, the power of these tests will be low and we cannot exclude the possibility of important inconsistency in the network.

Visual acuity network: network plot, interval plot, contribution matrix and risk of bias.
AVG: Anti‐VEGF PDT: photodynamic therapy LAS: laser AVPDT: anti‐VEGF plus PDT.
1 = control; 2 = anti‐VEGF; 3 = PDT; 4 = laser; 5 = anti‐VEGF plus PDT.
| Treatment comparison | Study | Type of CSC | Date study conducted | Industry sponsored |
| Anti‐VEGF vs. PDT | Chronic Chronic | 2009‐2012 2009‐2010 | Yes NR | |
| PDT vs. no treatment | Acute | 2004‐2005 | NR | |
| Laser vs. no treatment | Acute | 1977‐1981 | No |
One additional study for the comparison PDT vs. no treatment was reported in abstract form only and no data on outcome so was not included in the network meta‐analysis (Boscia 2008).
anti‐VEGF: anti‐vascular endothelial growth factor; CSC: central serous chorioretinopathy; NR: not reported; PDT: photodynamic therapy.
Comparative effects
Table 2 summarizes the comparative effects. These are plotted in Figure 4.
| Anti‐VEGF | ‐0.08 (‐0.14 to ‐0.01) | ‐0.20 (‐0.30 to ‐0.11) | 0.00 (‐0.02 to 0.03) | 0.22 (0.01 to 0.44) |
| 0.08 (0.01 to 0.14) | PDT | ‐0.13 (‐0.24 to ‐0.01) | 0.08 (0.01 to 0.15) | 0.30 (0.09 to 0.51) |
| 0.20 (0.11 to 0.30) | 0.13 (0.01 to 0.24) | Laser | 0.21 (0.11 to 0.31) | 0.43 (0.19 to 0.66) |
| ‐0.00 (‐0.03 to 0.02) | ‐0.08 (‐0.15 to ‐0.01) | ‐0.21 (‐0.31 to ‐0.11) | Anti‐VEGF and PDT | 0.22 (0.00 to 0.44) |
| ‐0.22 (‐0.44 to ‐0.01) | ‐0.30 (‐0.51 to ‐0.09) | ‐0.43 (‐0.66 to ‐0.19) | ‐0.22 (‐0.44 to ‐0.00) | Control (no treatment or sham treatment) |
Effect estimate is the mean difference (95% confidence interval). Negative values favor the first intervention. In the lower left hand triangle, the first intervention is anti‐VEGF, PDT, laser etc. In the upper right hand triangle, the first intervention is control, anti‐VEGF and PDT, laser etc. So, for example, visual acuity with anti‐VEGF was 0.22 logMAR units better than control 95% CI 0.44 better to 0.01 better.
anti‐VEGF: anti‐vascular endothelial growth factor; logMAR: logarithm of the minimal angle of resolution; PDT: photodynamic therapy.
An alternative formulation of the network based on the specific type of intervention resulted in two disconnected networks and we considered it unwise to proceed further.
Recurrence of central serous chorioretinopathy
Description of network
Figure 5 shows the network plot. There were no closed loops and, therefore, it was not possible to assess consistency. Table 3 shows the assessment of transitivity. Again with few trials it was difficult to assess but type of CSC was a concern.
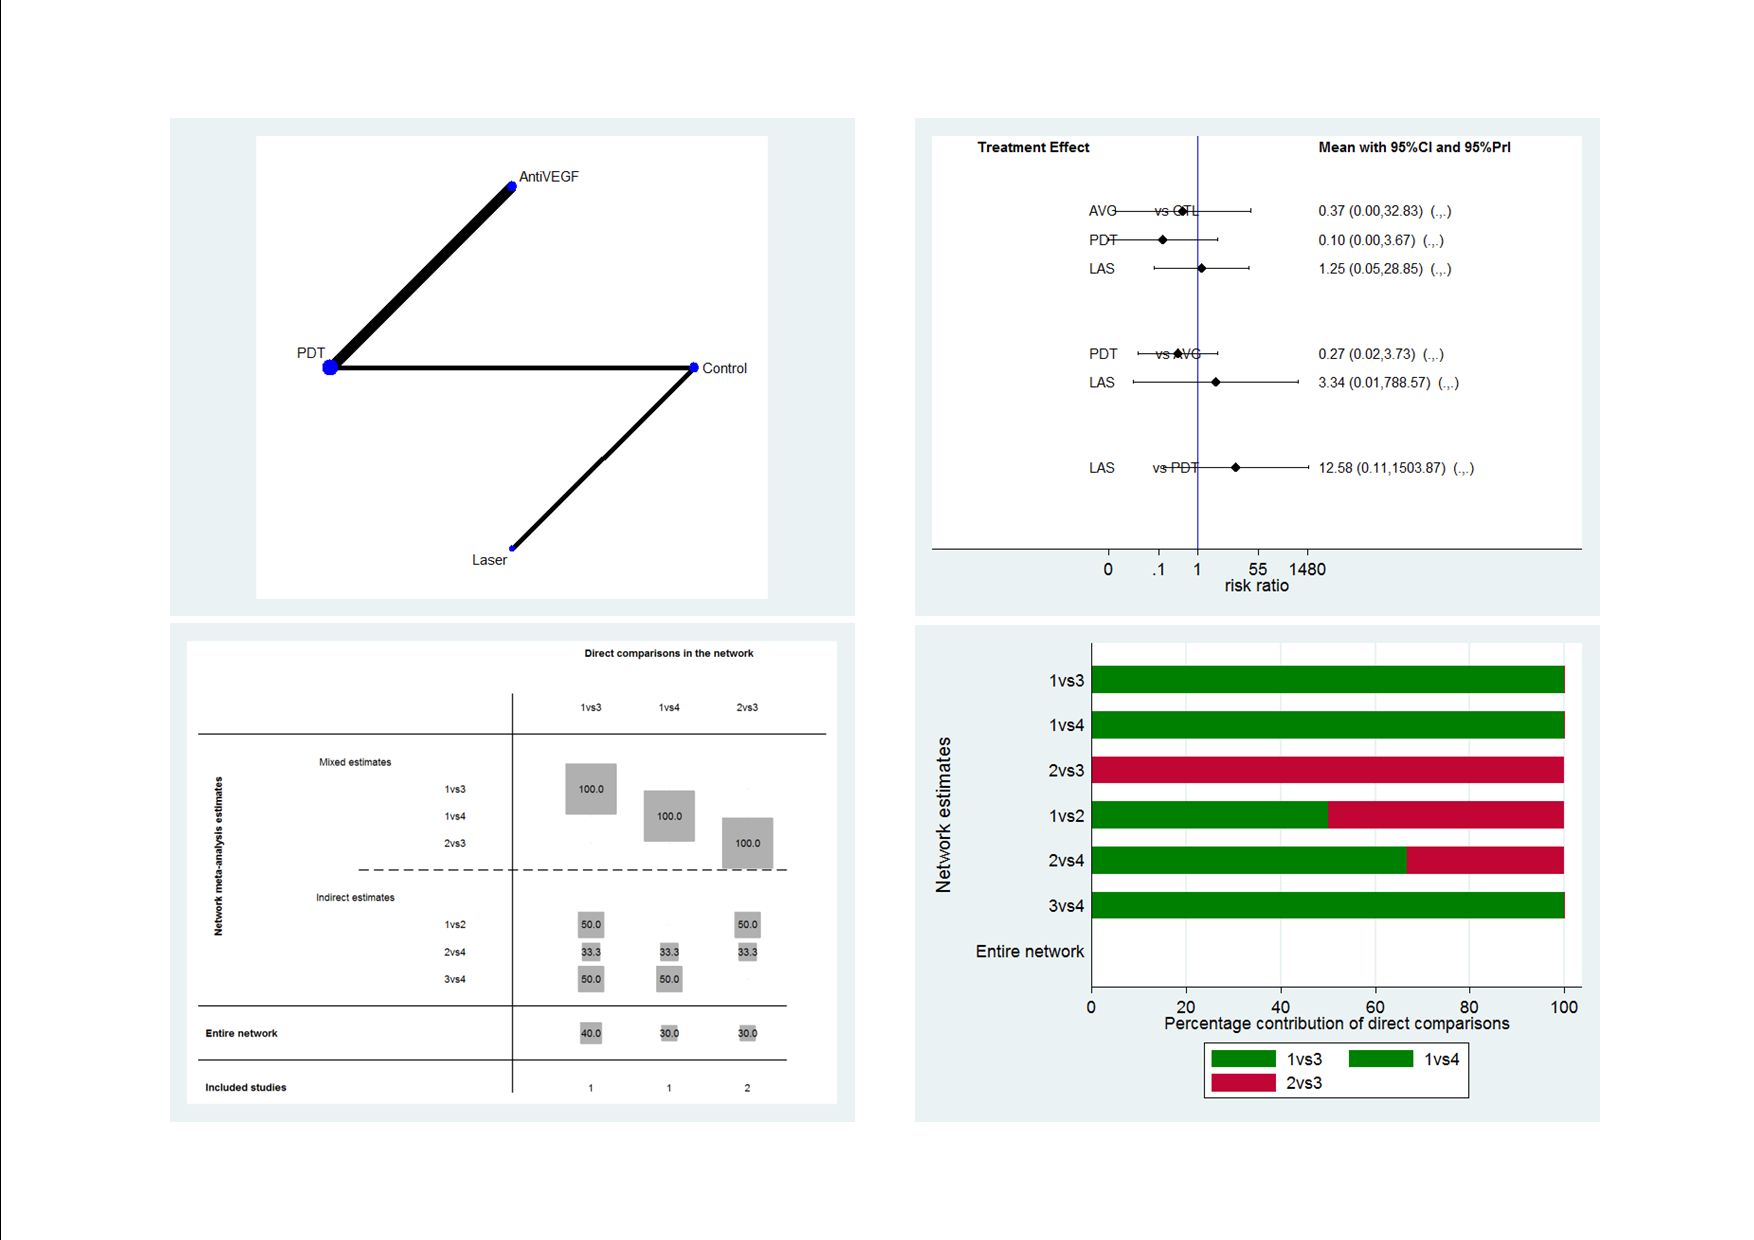
Recurrence CSC network: network plot, interval plot, contribution matrix and risk of bias.
AVG: Anti‐VEGF; PDT: photodynamic therapy; LAS: laser: CTL: control.
1 = control; 2 = anti‐VEGF; 3 = PDT; 4 = laser.
| Treatment comparison | Study | Type of CSC | Date study conducted | Industry sponsored |
| Anti‐VEGF vs. no treatment | Acute Acute | 2010‐2011 2008 | No No | |
| Anti‐VEGF vs. PDT | Chronic Chronic | 2009‐2012 2009‐2010 | Yes NR | |
| Anti‐VEGF + PDT vs. PDT alone | Chronic | NR (published 2014) | NR | |
| PDT vs. no treatment | Acute | 2004‐2005 | NR | |
| Laser vs. no treatment | Acute Acute Chronic | 2007‐2008 1977‐1981 NR (published 2013) | NR No NR |
One additional study for the comparison PDT vs no treatment was reported in abstract form only and no data on outcome so was not included in the network meta‐analysis (Boscia 2008).
anti‐VEGF: anti‐vascular endothelial growth factor; CSC: central serous chorioretinopathy; NR: not reported; PDT: photodynamic therapy.
Comparative effects
Table 4 summarizes the comparative effects. These are plotted in Figure 5. All estimates were very uncertain. The contribution matrix shows that all the evidence either came from direct or indirect estimates, reflecting the lack of closed loops in the network (Figure 5).
| Anti‐VEGF | 0.27 (0.02 to 3.73) | 3.34 (0.01 to 788.57) | 2.67 (0.03 to 234.08) |
| 3.77 (0.27 to 52.94) | PDT | 12.58 (0.11 to 1503.87) | 10.07 (0.27 to 371.91) |
| 0.30 (0.00 to 70.79) | 0.08 (0.00 to 9.50) | Laser | 0.80 (0.03 to 18.46) |
| 0.37 (0.00 to 32.83) | 0.10 (0.00 to 3.67) | 1.25 (0.05 to 28.85) | Control |
Effect estimate is the risk ratio (95% CI).
anti‐VEGF: anti‐vascular endothelial growth factor; logMAR: logarithm of the minimal angle of resolution; PDT: photodynamic therapy.
Discussion
Summary of main results
Given that there were fewer than three studies per treatment comparison, that the available studies generally contained small numbers of participants, and given the methodological limits identified by this method of review, there are at the present time, insufficient data to make robust treatment recommendations. Of note, the present review did not identify a contraindication to observation as an initial management strategy in acute CSC.
Reporting of systemic or ocular adverse events were vague for most included studies. Studies would report "no systemic or ocular adverse events occurred" without reporting which systemic or ocular adverse events were being monitored. Thus, we were unable to make robust conclusions on potential adverse events for each intervention.
A brief summary of the mains results can be found in the summary of findings Table for the main comparison.
We also identified 12 ongoing trials. In separate trials of acute CSC, PDT, aflibercept, and eplerenone are being compared to control (observation versus PDT, sham injection versus aflibercept, or placebo versus eplerenone). In separate trials of chronic CSC, spironolactone, eplerenone, and lutein are being compared to placebo, PDT is being compared to micropulse diode laser, and there are several head‐to‐head comparisons of PDT dose. In two trials, the type of CSC is not clearly specified on the trials register ‐ in these trials, micropulse diode laser is compared to observation and oral mifepristone to placebo.
Overall completeness and applicability of evidence
The present review did not identify a contraindication to current practice, which is observation as an initial management strategy in acute CSC. However, the identified studies do not sufficiently address all of the review objectives as there were too few included studies for each comparison to make robust conclusions. Furthermore, each study identified in this review had varying definitions of acute and chronic CSC, therefore, the review conclusions cannot be isolated to people with either acute or chronic CSC.
One further difficulty with the applicability of the evidence is that different treatments are indicated for different types of CSC: conventional laser may be directed to extrafoveal well‐defined leaks, micropulse laser to juxtafoveal leaks, PDT to subfoveal leaks (but may be less applicable to very large and ill‐defined leaking areas). Oral drugs are often used in any long‐standing fluid.
Quality of the evidence
Overall, with one or two exceptions, we judged the quality of the evidence to be low or very low. This means that further research is very likely to have an important impact on our confidence in the estimates of effect and is likely to change the estimates.
We included 25 studies that enrolled 1098 participants. In general, these trials were small, with fewer than 50 participants. These studies considered a variety of treatments and, in general, there was only one or two trials contributing data for each comparison. The studies were poorly reported and often it was unclear whether key aspects of the trial, such as allocation concealment, had been done. A substantial proportion of the trials were not masked (nine trials), which may put them at risk of performance and detection bias. Problems with follow‐up that may lead to attrition bias was also a potential problem in five trials.
We downgraded for risk of bias and imprecision for most analyses, reflecting the study limitations and imprecise estimates because of the small size of the included studies and few number of trials contributing to the analyses. Network meta‐analysis did not help to resolve this uncertainty due to a lack of trials to construct a reliable network and potential problems with intransivity with respect to acute or chronic CSC.
Potential biases in the review process
This review followed standard Cochrane methods and limited any potential biases in the review process.
Agreements and disagreements with other studies or reviews
To our knowledge, there is no systematic review that has included all interventions of CSC. We identified two reviews evaluating isolated comparisons. Specifically, authors of Chung 2013 evaluated the effects of intravitreal bevacizumab injection and reported that their results were inconclusive. The authors of Ma 2014 compared PDT with other therapy or compared different parameters of PDT. Overall, they concluded that "PDT is a promising therapy for CSC patients". They included case series and observational studies, which are at higher risk of bias and uncontrolled confounding, and they did not distinguish trials and citations, leading to some double counting of results.
For outcomes such as adverse effects that may occur infrequently, trial evidence may not be the best source of information. One review of over 200 participants with chronic CSC treated with PDT concluded that adverse effects were rare. RPE atrophy occurred in 4% of participants and acute severe visual decrease occurred in 1.5% (Lim 2014).

Theoretical treatment network.

Study flow diagram.

Risk of bias summary: review authors' judgments about each risk of bias item for each included study.
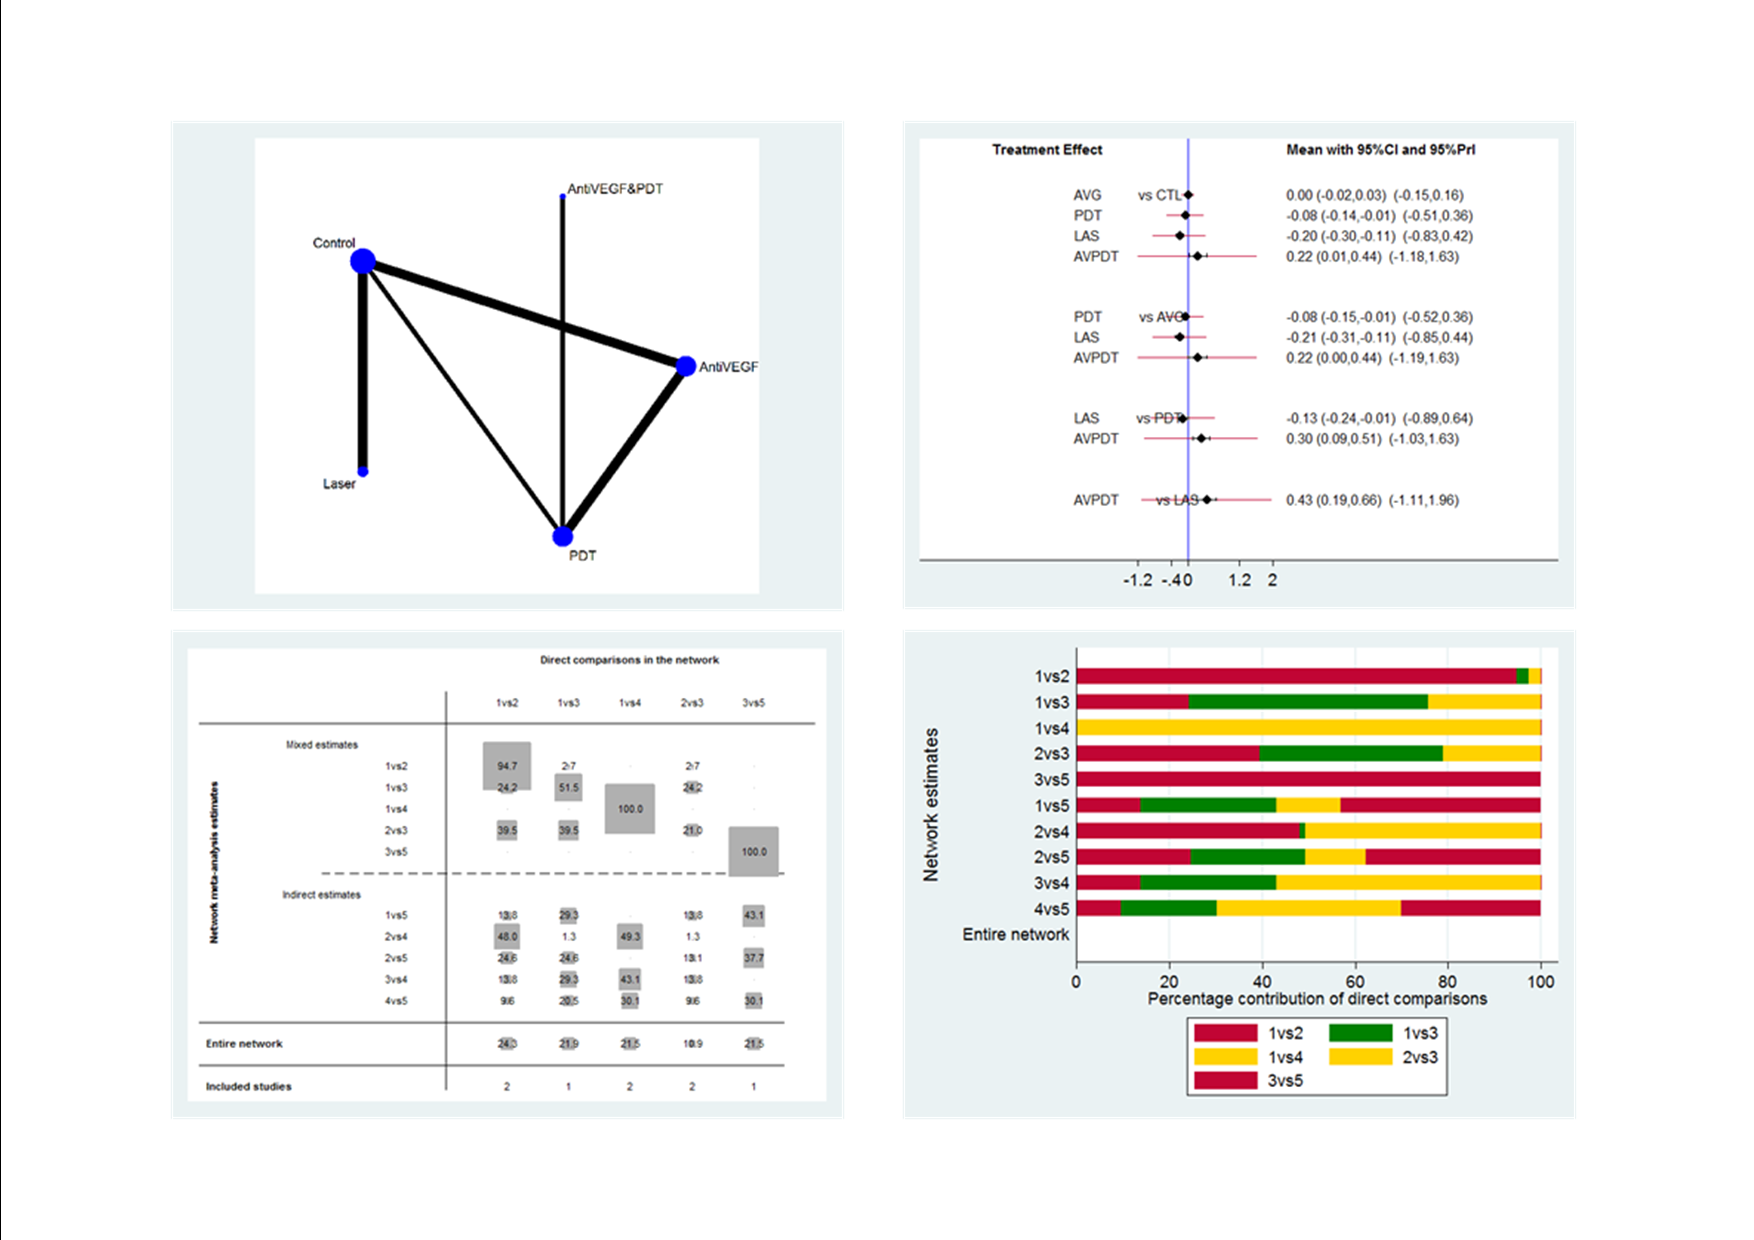
Visual acuity network: network plot, interval plot, contribution matrix and risk of bias.
AVG: Anti‐VEGF PDT: photodynamic therapy LAS: laser AVPDT: anti‐VEGF plus PDT.
1 = control; 2 = anti‐VEGF; 3 = PDT; 4 = laser; 5 = anti‐VEGF plus PDT.

Recurrence CSC network: network plot, interval plot, contribution matrix and risk of bias.
AVG: Anti‐VEGF; PDT: photodynamic therapy; LAS: laser: CTL: control.
1 = control; 2 = anti‐VEGF; 3 = PDT; 4 = laser.
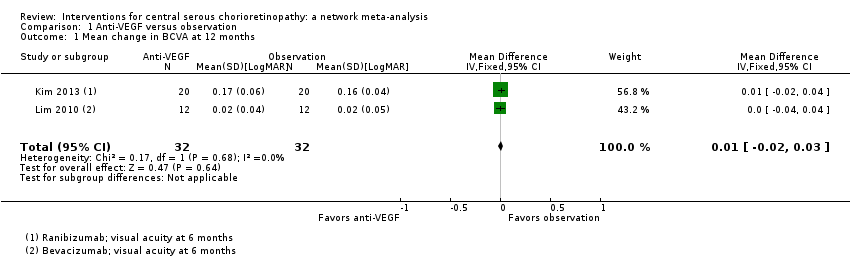
Comparison 1 Anti‐VEGF versus observation, Outcome 1 Mean change in BCVA at 12 months.

Comparison 1 Anti‐VEGF versus observation, Outcome 2 Mean change in CRT at 12 months.
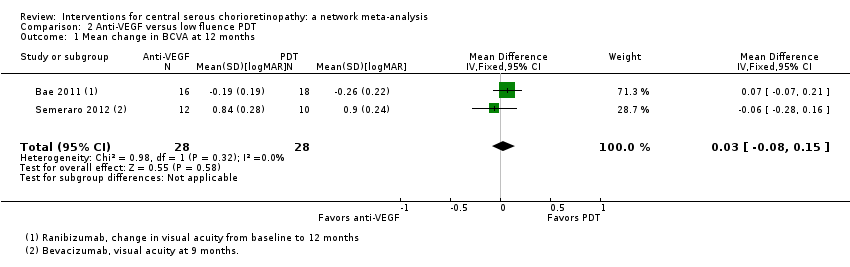
Comparison 2 Anti‐VEGF versus low fluence PDT, Outcome 1 Mean change in BCVA at 12 months.
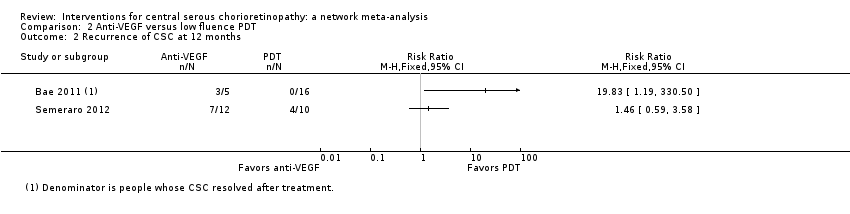
Comparison 2 Anti‐VEGF versus low fluence PDT, Outcome 2 Recurrence of CSC at 12 months.

Comparison 2 Anti‐VEGF versus low fluence PDT, Outcome 3 Persistent CSC at 12 months.
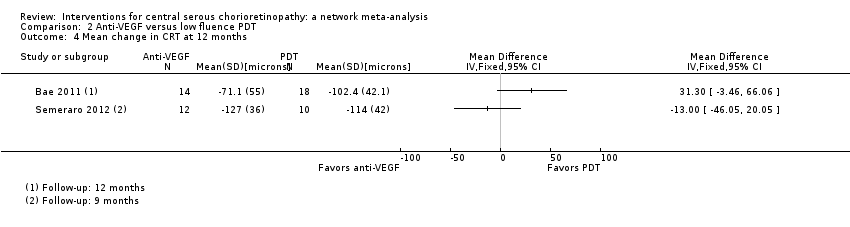
Comparison 2 Anti‐VEGF versus low fluence PDT, Outcome 4 Mean change in CRT at 12 months.
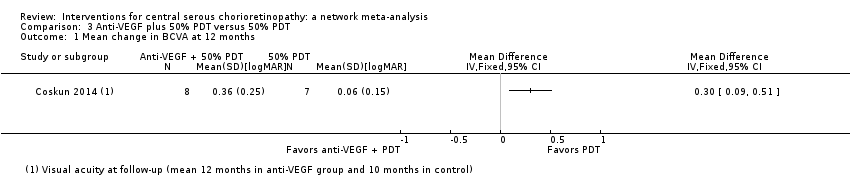
Comparison 3 Anti‐VEGF plus 50% PDT versus 50% PDT, Outcome 1 Mean change in BCVA at 12 months.

Comparison 3 Anti‐VEGF plus 50% PDT versus 50% PDT, Outcome 2 Persistent CSC at 12 months.

Comparison 3 Anti‐VEGF plus 50% PDT versus 50% PDT, Outcome 3 Mean change in CRT at 12 months.
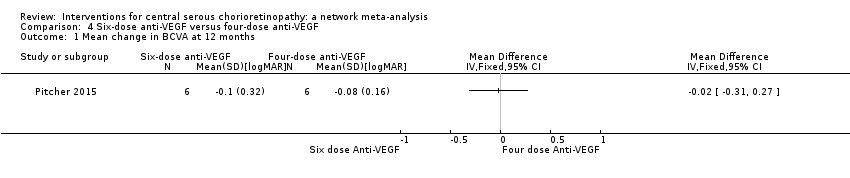
Comparison 4 Six‐dose anti‐VEGF versus four‐dose anti‐VEGF, Outcome 1 Mean change in BCVA at 12 months.
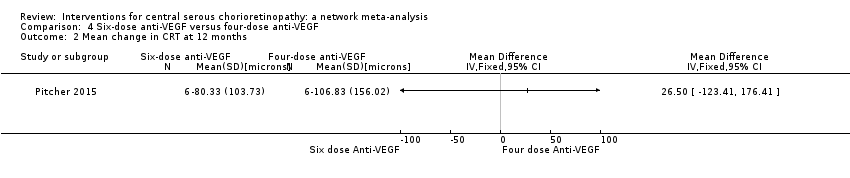
Comparison 4 Six‐dose anti‐VEGF versus four‐dose anti‐VEGF, Outcome 2 Mean change in CRT at 12 months.

Comparison 5 50% PDT versus sham treatment, Outcome 1 Mean BCVA at 12 months.
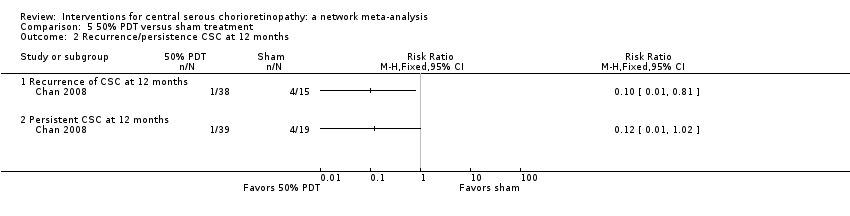
Comparison 5 50% PDT versus sham treatment, Outcome 2 Recurrence/persistence CSC at 12 months.
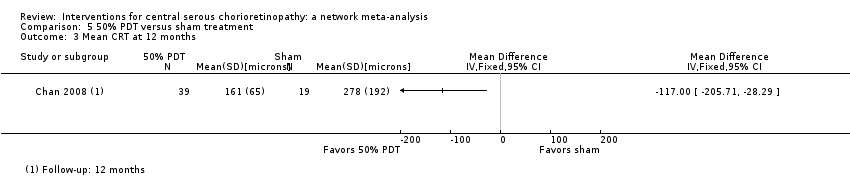
Comparison 5 50% PDT versus sham treatment, Outcome 3 Mean CRT at 12 months.

Comparison 6 30% PDT versus PDT, Outcome 1 Mean BCVA at 12 months.
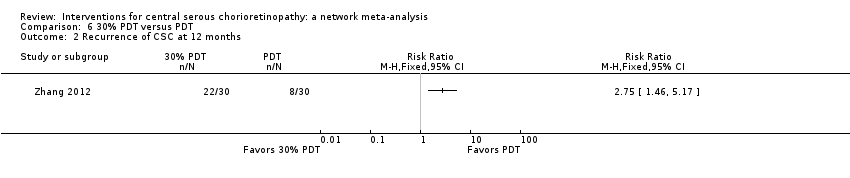
Comparison 6 30% PDT versus PDT, Outcome 2 Recurrence of CSC at 12 months.
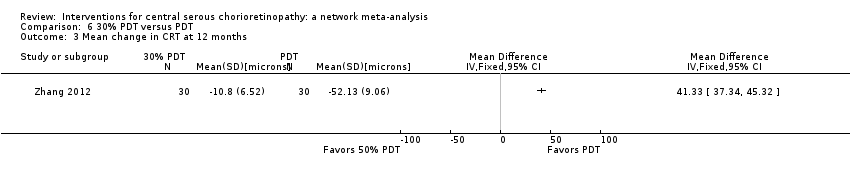
Comparison 6 30% PDT versus PDT, Outcome 3 Mean change in CRT at 12 months.
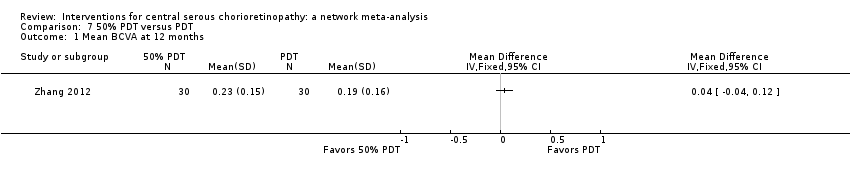
Comparison 7 50% PDT versus PDT, Outcome 1 Mean BCVA at 12 months.

Comparison 7 50% PDT versus PDT, Outcome 2 Recurrence of CSC at 12 months.
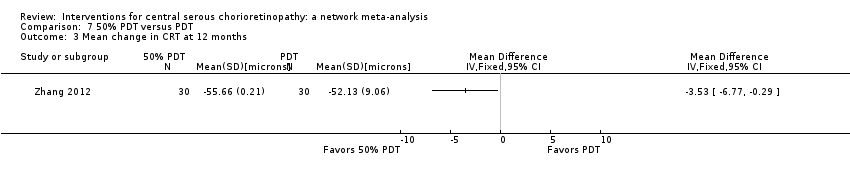
Comparison 7 50% PDT versus PDT, Outcome 3 Mean change in CRT at 12 months.

Comparison 8 30% PDT versus 50% PDT, Outcome 1 Mean change in BCVA at 12 months.
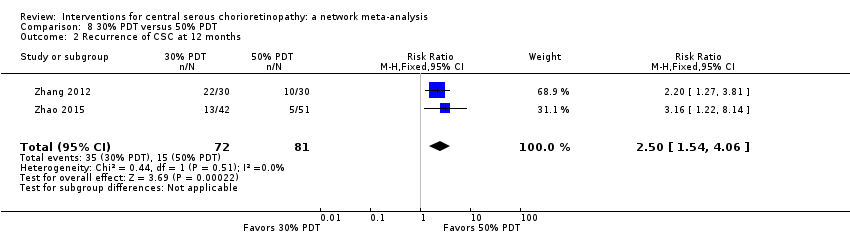
Comparison 8 30% PDT versus 50% PDT, Outcome 2 Recurrence of CSC at 12 months.

Comparison 8 30% PDT versus 50% PDT, Outcome 3 Persistent CSC at 12 months.

Comparison 8 30% PDT versus 50% PDT, Outcome 4 Mean change in CRT at 12 months.
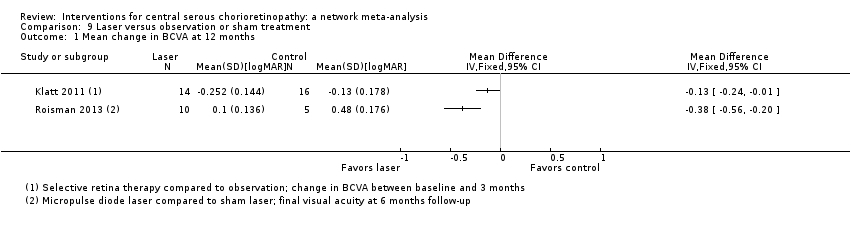
Comparison 9 Laser versus observation or sham treatment, Outcome 1 Mean change in BCVA at 12 months.

Comparison 9 Laser versus observation or sham treatment, Outcome 2 Recurrence of CSC at 12 months.

Comparison 9 Laser versus observation or sham treatment, Outcome 3 Mean change in CRT at 12 months.
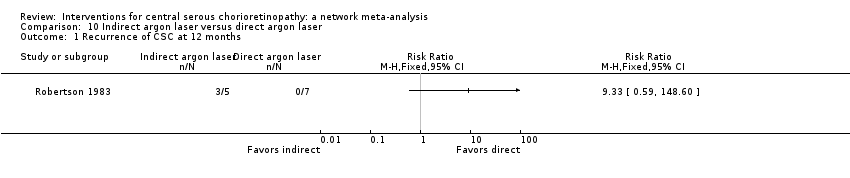
Comparison 10 Indirect argon laser versus direct argon laser, Outcome 1 Recurrence of CSC at 12 months.
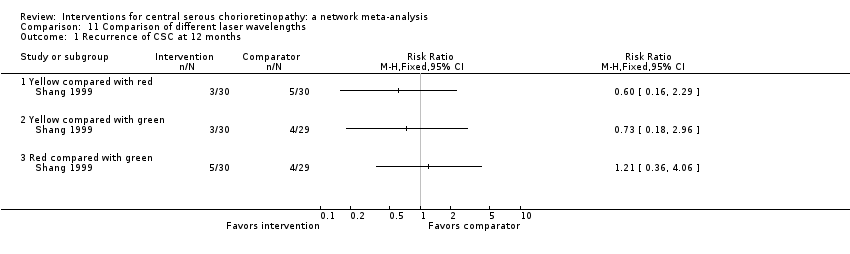
Comparison 11 Comparison of different laser wavelengths, Outcome 1 Recurrence of CSC at 12 months.
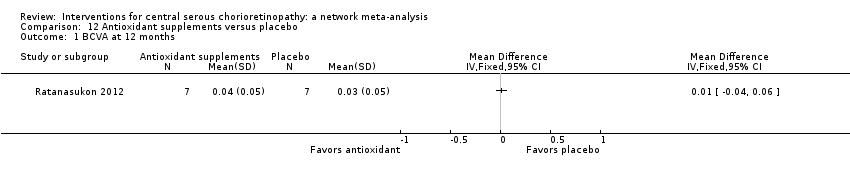
Comparison 12 Antioxidant supplements versus placebo, Outcome 1 BCVA at 12 months.
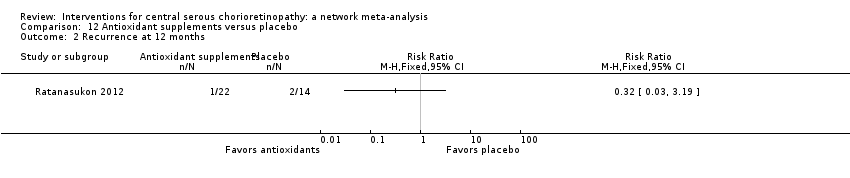
Comparison 12 Antioxidant supplements versus placebo, Outcome 2 Recurrence at 12 months.

Comparison 12 Antioxidant supplements versus placebo, Outcome 3 Persistence at 12 months.

Comparison 12 Antioxidant supplements versus placebo, Outcome 4 CRT at 12 months.

Comparison 13 Beta‐blocker versus placebo, Outcome 1 Mean BCVA at 12 months.

Comparison 13 Beta‐blocker versus placebo, Outcome 2 Recurrence of CSC at 12 months.

Comparison 13 Beta‐blocker versus placebo, Outcome 3 BCVA ≥ 20/40 at 12 months.
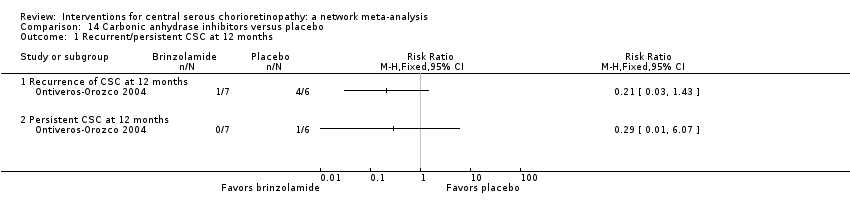
Comparison 14 Carbonic anhydrase inhibitors versus placebo, Outcome 1 Recurrent/persistent CSC at 12 months.

Comparison 15 Helicobacter pylori treatment versus placebo or observation, Outcome 1 Mean BCVA at 12 months.
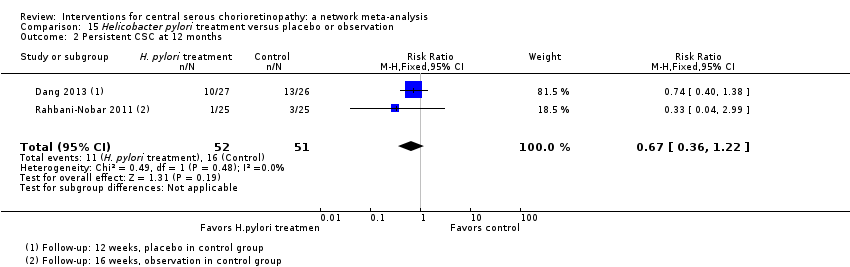
Comparison 15 Helicobacter pylori treatment versus placebo or observation, Outcome 2 Persistent CSC at 12 months.
| Interventions for central serous chorioretinopathy: direct comparisons | ||||||
| Patient or population: people with central serous chorioretinopathy Settings: eye hospital | ||||||
| Comparison (intervention vs. comparator) | Anticipated absolute effects (95% CI) | Effect estimate from direct comparison | Comments | |||
| Relative effect | No of participants | Quality | ||||
| Risk with comparator | Mean difference (95% CI) Negative values are in favor of intervention; positive values in favor of comparator | |||||
| Change in visual acuity at 12 months (logMAR) | ||||||
| Anti‐VEGF vs. observation | ‐ | 0.01 LogMAR (‐0.02 to 0.03) | ‐ | 64 (2) | Low1,2 | Both studies enrolled participants with acute CSC and reported mean change in visual acuity at 6 months |
| Anti‐VEGF vs. low‐fluence PDT | ‐ | 0.03 logMAR (‐0.08 to 0.15) | ‐ | 56 (2) | Low1,2 | Both studies enrolled participants with chronic CSC |
| Anti‐VEGF and 50% PDT vs. 50% PDT | ‐ | 0.30 logMAR (0.09 to 0.51) | ‐ | 15 (1) | Low1,2 | Participants had chronic CSC |
| 6‐dose anti‐VEGF vs. 4‐dose anti‐VEGF | ‐ | ‐0.02 logMAR (‐0.31 to 0.27) | ‐ | 12 (1) | Low1,2 | Participants had chronic CSC and were followed to 6 months |
| 50% PDT vs. observation or sham treatment | ‐ | ‐0.10 logMAR (‐0.18 to ‐0.02) | ‐ | 58 (1) | Low1,2 | Participants had acute CSC |
| 30% PDT vs. PDT | ‐ | ‐0.16 logMAR (‐0.22 to ‐0.10) | ‐ | 60 (1) | Low1,2 | Type of CSC not specified |
| 30% PDT vs. 50% PDT | ‐ | ‐0.12 logMAR (‐0.15 to ‐0.08) | ‐ | 60 (1) | Low1,2 | Type of CSC not specified |
| 50% PDT vs. PDT | ‐ | 0.04 logMAR (‐0.04 to 0.12 | ‐ | 60 (1) | Low1,2 | Type of CSC not specified |
| Selective retina therapy vs. observation | ‐ | ‐0.13 logMAR (‐0.24 to ‐0.01) | ‐ | 30 (1) | Low1,2 | Participants had acute CSC, followed up to 3 months |
| Micropulse diode laser vs. sham laser | ‐ | ‐0.38 logMAR (‐0.56 to ‐0.20) | ‐ | 15 (1) | Low1,2 | Participants had chronic CSC |
| Antioxidant vs. placebo | ‐ | 0.01 logMAR (‐0.04 to 0.06) | ‐ | 14 (1) | Low1,2 | Lutein and acute CSC |
| Propranolol vs. placebo | ‐ | 0.01 logMAR (‐0.07 to 0.09) | ‐ | 60 (1) | Low1,2 | Type of CSC not specified |
| Carbonic anhydrase inhibitors vs. placebo | See comment | ‐ | ‐ | 13 (1) | ‐ | Outcome not reported |
| Helicobacter pylori treatment vs. placebo | ‐ | ‐0.04 logMAR (‐0.07 to ‐0.02) | ‐ | 103 (2) | Low1,2 | Participants had acute CSC, follow‐up 12‐16 weeks |
| Comparison (intervention vs. comparator) | Anticipated absolute effects (95% CI) | Effect estimate from direct comparison | Comments | |||
| Risk with comparator* | Risk with intervention | Relative effect (95% CI) | No of participants | Quality | ||
| Persistent CSC at 12 months | ||||||
| Anti‐VEGF vs. observation | See comment | ‐ | ‐ | 64 (2) | ‐ | Participants had acute CSC. Both trials reported that all participants in treatment and control groups were resolved by 6 months |
| Anti‐VEGF vs. low‐fluence PDT | 111 per 1000 | 688 per 1000 (179 to 1000) | RR 6.19 (1.61 to 23.81) | 34 (1) | Low1,2 | Participants had chronic CSC |
| Anti‐VEGF and 50% PDT vs. 50% PDT | 143 per 1000 | 126 (10 to 1000) | RR 0.88 (0.07 to 11.54) | 15 (1) | Very low1,2,3 | Participants had chronic CSC |
| 6‐dose anti‐VEGF vs. 4‐dose anti‐VEGF | See comment | ‐ | ‐ | 12 (1) | ‐ | Outcome not reported |
| 50% PDT vs. sham treatment | 211 per 1000 | 25 per 1000 (2 to 215) | RR 0.12 (0.01 to 1.02) | 58 (1) | Low1,2 | Participants had acute CSC |
| 30% PDT vs. PDT | See comment | ‐ | ‐ | 60 (1) | ‐ | Outcome not reported |
| 30% PDT vs. 50% PDT | See comment | ‐ | ‐ | 60 (1) | ‐ | Outcome not reported |
| 50% PDT vs. PDT | See comment | ‐ | ‐ | 60 (1) | ‐ | Outcome not reported |
| Selective retina therapy vs. observation | See comment | ‐ | ‐ | 30 (1) | ‐ | Outcome not reported |
| Micropulse diode laser | See comment | ‐ | ‐ | 15 (1) | ‐ | Outcome not reported |
| Antioxidant vs. placebo | See comment | ‐ | ‐ | 51 (1) | ‐ | People in the antioxidant group were less likely to have "complete resolution" at 3 months (RR 0.35, 95% CI 0.13 to 0.95; 51 participants) |
| Propranolol vs. placebo | See comment | ‐ | ‐ | 60 (1) | ‐ | Outcome not reported |
| Brinzolamide vs. placebo | 167 per 1000 | 48 (2 to 1000) | RR 0.29 (0.01 to 6.07) | 13 (1) | Very low2,3 | Participants had acute CSC |
| Helicobacter pylori treatment vs. placebo | 314 per 1000 | 210 (113 to 383) | RR 0.67 (0.36 to 1.22) | 103 (2) | Low1,2 | Participants had acute CSC |
| Comparison (intervention vs. comparator) | Anticipated absolute effects (95% CI) | Effect estimate from direct comparison | ||||
| Risk with comparator* | Risk with intervention | Relative effect (95% CI) | No of participants | Quality | Comment | |
| Recurrent CSC at 12 months | ||||||
| Anti‐VEGF vs. observation | See comment | ‐ | ‐ | 64 (2) | ‐ | Outcome not reported |
| Anti‐VEGF vs. low‐fluence PDT | See comment | ‐ | ‐ | 56 (2) | Very low1,2,4 | Participants had chronic CSC. The 2 studies had different results for this outcome (I2 = 71%). In Bae 2011, there was a much higher risk of recurrence in the anti‐VEGF group (ranibizumab) compared with the PDT group (RR 19.83, 95% CI 1.19 to 330.50; 21 eyes); in Semeraro 2012, there was also an increased risk of recurrence in the anti‐VEGF (bevacizumab) group but the size of the effect was much smaller and the CIs include 1 (no effect) (RR 1.46, 95% CI 0.59 to 3.58; 22 eyes) |
| Anti‐VEGF and 50% PDT vs. 50% PDT | See comment | ‐ | ‐ | 15 (1) | ‐ | Outcome not reported |
| 6‐dose anti‐VEGF vs. 4‐dose anti‐VEGF | See comment | ‐ | ‐ | 12 (1) | ‐ | Outcome not reported |
| 50% PDT vs. sham treatment | 267 per 1000 | 27 per 1000 (3 to 216) | RR 0.10 (0.01 to 0.81) | 53 (1) | Low1,2 | Participants had acute CSC |
| 30% PDT vs. PDT | See comment | ‐ | ‐ | 60 (1) | ‐ | Outcome not reported |
| 30% PDT vs. 50% PDT | See comment | ‐ | ‐ | 60 (1) | ‐ | Outcome not reported |
| 50% PDT vs. PDT | 270 per 1000 | 338 per 1000 (154 to 737) | RR 1.25 (0.57 to 2.73) | 60 (1) | ‐ | Type of CSC not specified |
| Selective retina therapy vs. observation | See comment | ‐ | ‐ | 30 (1) | ‐ | Outcome not reported |
| Micropulse diode laser | See comment | ‐ | ‐ | 15 (1) | ‐ | Outcome not reported |
| Antioxidant vs. placebo | 143 per 1000 | 46 (4 to 456) | RR 0.32 (0.03 to 3.19) | 36 (1) | Very low2,3 | Participants had acute CSC |
| Propranolol vs. placebo | 167 per 1000 | 100 (27 to 382) | RR 0.60 (0.16 to 2.29) | 60 (1) | Low1,2 | Type of CSC not reported |
| Brinzolamide vs. placebo | 314 per 1000 | 140 (20 to 953) | RR 0.21 (0.03 to 1.43 | 13 (1) | Low1,2 | Participants had acute CSC |
| Helicobacter pylori treatment vs. placebo | See comment | ‐ | ‐ | 103 (2) | ‐ | Outcome not reported |
| Adverse effects | ||||||
| All studies reported no ocular or systematic adverse effects, or did not comment on adverse effects | ||||||
| anti‐VEGF: anti‐vascular endothelial growth factor; CI: confidence interval; CSC: central serous chorioretinopathy; logMAR: logarithm of the minimal angle of resolution; PDT: photodynamic therapy; RR: risk ratio. * Risk was estimated from the comparator group in the included studies 1 Downgraded for imprecision (‐1) 2 Downgraded for risk of bias (‐1) 3 Downgraded for imprecision (‐2) 4 Downgraded for inconsistency (‐1) | ||||||
| Treatment comparison | Study | Type of CSC | Date study conducted | Industry sponsored |
| Anti‐VEGF vs. PDT | Chronic Chronic | 2009‐2012 2009‐2010 | Yes NR | |
| PDT vs. no treatment | Acute | 2004‐2005 | NR | |
| Laser vs. no treatment | Acute | 1977‐1981 | No | |
| One additional study for the comparison PDT vs. no treatment was reported in abstract form only and no data on outcome so was not included in the network meta‐analysis (Boscia 2008). anti‐VEGF: anti‐vascular endothelial growth factor; CSC: central serous chorioretinopathy; NR: not reported; PDT: photodynamic therapy. | ||||
| Anti‐VEGF | ‐0.08 (‐0.14 to ‐0.01) | ‐0.20 (‐0.30 to ‐0.11) | 0.00 (‐0.02 to 0.03) | 0.22 (0.01 to 0.44) |
| 0.08 (0.01 to 0.14) | PDT | ‐0.13 (‐0.24 to ‐0.01) | 0.08 (0.01 to 0.15) | 0.30 (0.09 to 0.51) |
| 0.20 (0.11 to 0.30) | 0.13 (0.01 to 0.24) | Laser | 0.21 (0.11 to 0.31) | 0.43 (0.19 to 0.66) |
| ‐0.00 (‐0.03 to 0.02) | ‐0.08 (‐0.15 to ‐0.01) | ‐0.21 (‐0.31 to ‐0.11) | Anti‐VEGF and PDT | 0.22 (0.00 to 0.44) |
| ‐0.22 (‐0.44 to ‐0.01) | ‐0.30 (‐0.51 to ‐0.09) | ‐0.43 (‐0.66 to ‐0.19) | ‐0.22 (‐0.44 to ‐0.00) | Control (no treatment or sham treatment) |
| Effect estimate is the mean difference (95% confidence interval). Negative values favor the first intervention. In the lower left hand triangle, the first intervention is anti‐VEGF, PDT, laser etc. In the upper right hand triangle, the first intervention is control, anti‐VEGF and PDT, laser etc. So, for example, visual acuity with anti‐VEGF was 0.22 logMAR units better than control 95% CI 0.44 better to 0.01 better. anti‐VEGF: anti‐vascular endothelial growth factor; logMAR: logarithm of the minimal angle of resolution; PDT: photodynamic therapy. | ||||
| Treatment comparison | Study | Type of CSC | Date study conducted | Industry sponsored |
| Anti‐VEGF vs. no treatment | Acute Acute | 2010‐2011 2008 | No No | |
| Anti‐VEGF vs. PDT | Chronic Chronic | 2009‐2012 2009‐2010 | Yes NR | |
| Anti‐VEGF + PDT vs. PDT alone | Chronic | NR (published 2014) | NR | |
| PDT vs. no treatment | Acute | 2004‐2005 | NR | |
| Laser vs. no treatment | Acute Acute Chronic | 2007‐2008 1977‐1981 NR (published 2013) | NR No NR | |
| One additional study for the comparison PDT vs no treatment was reported in abstract form only and no data on outcome so was not included in the network meta‐analysis (Boscia 2008). anti‐VEGF: anti‐vascular endothelial growth factor; CSC: central serous chorioretinopathy; NR: not reported; PDT: photodynamic therapy. | ||||
| Anti‐VEGF | 0.27 (0.02 to 3.73) | 3.34 (0.01 to 788.57) | 2.67 (0.03 to 234.08) |
| 3.77 (0.27 to 52.94) | PDT | 12.58 (0.11 to 1503.87) | 10.07 (0.27 to 371.91) |
| 0.30 (0.00 to 70.79) | 0.08 (0.00 to 9.50) | Laser | 0.80 (0.03 to 18.46) |
| 0.37 (0.00 to 32.83) | 0.10 (0.00 to 3.67) | 1.25 (0.05 to 28.85) | Control |
| Effect estimate is the risk ratio (95% CI). anti‐VEGF: anti‐vascular endothelial growth factor; logMAR: logarithm of the minimal angle of resolution; PDT: photodynamic therapy. | |||
| Outcome or subgroup title | No. of studies | No. of participants | Statistical method | Effect size |
| 1 Mean change in BCVA at 12 months Show forest plot | 2 | 64 | Mean Difference (IV, Fixed, 95% CI) | 0.01 [‐0.02, 0.03] |
| 2 Mean change in CRT at 12 months Show forest plot | 2 | 64 | Mean Difference (IV, Fixed, 95% CI) | 8.73 [‐18.08, 35.54] |
| Outcome or subgroup title | No. of studies | No. of participants | Statistical method | Effect size |
| 1 Mean change in BCVA at 12 months Show forest plot | 2 | 56 | Mean Difference (IV, Fixed, 95% CI) | 0.03 [‐0.08, 0.15] |
| 2 Recurrence of CSC at 12 months Show forest plot | 2 | Risk Ratio (M‐H, Fixed, 95% CI) | Totals not selected | |
| 3 Persistent CSC at 12 months Show forest plot | 1 | Risk Ratio (M‐H, Fixed, 95% CI) | Totals not selected | |
| 4 Mean change in CRT at 12 months Show forest plot | 2 | Mean Difference (IV, Fixed, 95% CI) | Totals not selected | |
| Outcome or subgroup title | No. of studies | No. of participants | Statistical method | Effect size |
| 1 Mean change in BCVA at 12 months Show forest plot | 1 | Mean Difference (IV, Fixed, 95% CI) | Totals not selected | |
| 2 Persistent CSC at 12 months Show forest plot | 1 | Risk Ratio (M‐H, Fixed, 95% CI) | Totals not selected | |
| 3 Mean change in CRT at 12 months Show forest plot | 1 | Mean Difference (IV, Fixed, 95% CI) | Totals not selected | |
| Outcome or subgroup title | No. of studies | No. of participants | Statistical method | Effect size |
| 1 Mean change in BCVA at 12 months Show forest plot | 1 | Mean Difference (IV, Fixed, 95% CI) | Totals not selected | |
| 2 Mean change in CRT at 12 months Show forest plot | 1 | Mean Difference (IV, Fixed, 95% CI) | Totals not selected | |
| Outcome or subgroup title | No. of studies | No. of participants | Statistical method | Effect size |
| 1 Mean BCVA at 12 months Show forest plot | 1 | Mean Difference (IV, Fixed, 95% CI) | Totals not selected | |
| 2 Recurrence/persistence CSC at 12 months Show forest plot | 1 | Risk Ratio (M‐H, Fixed, 95% CI) | Totals not selected | |
| 2.1 Recurrence of CSC at 12 months | 1 | Risk Ratio (M‐H, Fixed, 95% CI) | 0.0 [0.0, 0.0] | |
| 2.2 Persistent CSC at 12 months | 1 | Risk Ratio (M‐H, Fixed, 95% CI) | 0.0 [0.0, 0.0] | |
| 3 Mean CRT at 12 months Show forest plot | 1 | Mean Difference (IV, Fixed, 95% CI) | Totals not selected | |
| Outcome or subgroup title | No. of studies | No. of participants | Statistical method | Effect size |
| 1 Mean BCVA at 12 months Show forest plot | 1 | Mean Difference (IV, Fixed, 95% CI) | Totals not selected | |
| 2 Recurrence of CSC at 12 months Show forest plot | 1 | Risk Ratio (M‐H, Fixed, 95% CI) | Totals not selected | |
| 3 Mean change in CRT at 12 months Show forest plot | 1 | Mean Difference (IV, Fixed, 95% CI) | Totals not selected | |
| Outcome or subgroup title | No. of studies | No. of participants | Statistical method | Effect size |
| 1 Mean change in BCVA at 12 months Show forest plot | 2 | 177 | Mean Difference (IV, Fixed, 95% CI) | ‐0.12 [‐0.15, ‐0.08] |
| 2 Recurrence of CSC at 12 months Show forest plot | 2 | 153 | Risk Ratio (M‐H, Fixed, 95% CI) | 2.50 [1.54, 4.06] |
| 3 Persistent CSC at 12 months Show forest plot | 1 | Risk Ratio (M‐H, Fixed, 95% CI) | Totals not selected | |
| 4 Mean change in CRT at 12 months Show forest plot | 2 | 177 | Mean Difference (IV, Fixed, 95% CI) | 44.90 [42.57, 47.23] |
| Outcome or subgroup title | No. of studies | No. of participants | Statistical method | Effect size |
| 1 Mean change in BCVA at 12 months Show forest plot | 2 | Mean Difference (IV, Fixed, 95% CI) | Totals not selected | |
| 2 Recurrence of CSC at 12 months Show forest plot | 1 | Risk Ratio (M‐H, Fixed, 95% CI) | Totals not selected | |
| 3 Mean change in CRT at 12 months Show forest plot | 1 | Mean Difference (IV, Fixed, 95% CI) | Totals not selected | |
| Outcome or subgroup title | No. of studies | No. of participants | Statistical method | Effect size |
| 1 Recurrence of CSC at 12 months Show forest plot | 1 | Risk Ratio (M‐H, Fixed, 95% CI) | Totals not selected | |
| Outcome or subgroup title | No. of studies | No. of participants | Statistical method | Effect size |
| 1 Recurrence of CSC at 12 months Show forest plot | 1 | Risk Ratio (M‐H, Fixed, 95% CI) | Totals not selected | |
| 1.1 Yellow compared with red | 1 | Risk Ratio (M‐H, Fixed, 95% CI) | 0.0 [0.0, 0.0] | |
| 1.2 Yellow compared with green | 1 | Risk Ratio (M‐H, Fixed, 95% CI) | 0.0 [0.0, 0.0] | |
| 1.3 Red compared with green | 1 | Risk Ratio (M‐H, Fixed, 95% CI) | 0.0 [0.0, 0.0] | |
| Outcome or subgroup title | No. of studies | No. of participants | Statistical method | Effect size |
| 1 BCVA at 12 months Show forest plot | 1 | Mean Difference (IV, Fixed, 95% CI) | Totals not selected | |
| 2 Recurrence at 12 months Show forest plot | 1 | Risk Ratio (M‐H, Fixed, 95% CI) | Totals not selected | |
| 3 Persistence at 12 months Show forest plot | 1 | Risk Ratio (M‐H, Fixed, 95% CI) | Totals not selected | |
| 4 CRT at 12 months Show forest plot | 1 | Mean Difference (IV, Fixed, 95% CI) | Totals not selected | |
| Outcome or subgroup title | No. of studies | No. of participants | Statistical method | Effect size |
| 1 Mean BCVA at 12 months Show forest plot | 1 | Mean Difference (IV, Fixed, 95% CI) | Totals not selected | |
| 2 Recurrence of CSC at 12 months Show forest plot | 1 | Risk Ratio (M‐H, Fixed, 95% CI) | Totals not selected | |
| 3 BCVA ≥ 20/40 at 12 months Show forest plot | 1 | Risk Ratio (M‐H, Fixed, 95% CI) | Totals not selected | |
| Outcome or subgroup title | No. of studies | No. of participants | Statistical method | Effect size |
| 1 Recurrent/persistent CSC at 12 months Show forest plot | 1 | Risk Ratio (M‐H, Fixed, 95% CI) | Totals not selected | |
| 1.1 Recurrence of CSC at 12 months | 1 | Risk Ratio (M‐H, Fixed, 95% CI) | 0.0 [0.0, 0.0] | |
| 1.2 Persistent CSC at 12 months | 1 | Risk Ratio (M‐H, Fixed, 95% CI) | 0.0 [0.0, 0.0] | |
| Outcome or subgroup title | No. of studies | No. of participants | Statistical method | Effect size |
| 1 Mean BCVA at 12 months Show forest plot | 2 | 103 | Mean Difference (IV, Fixed, 95% CI) | ‐0.04 [‐0.07, ‐0.02] |
| 2 Persistent CSC at 12 months Show forest plot | 2 | 103 | Risk Ratio (M‐H, Fixed, 95% CI) | 0.67 [0.36, 1.22] |