Влияние общего потребления жиров на массу тела
Abstract
Background
In order to prevent overweight and obesity in the general population we need to understand the relationship between the proportion of energy from fat and resulting weight and body fatness in the general population.
Objectives
To assess the effects of proportion of energy intake from fat on measures of weight and body fatness (including obesity, waist circumference and body mass index) in people not aiming to lose weight, using all appropriate randomised controlled trials (RCTs) and cohort studies in adults, children and young people
Search methods
We searched CENTRAL to March 2014 and MEDLINE, EMBASE and CINAHL to November 2014. We did not limit the search by language. We also checked the references of relevant reviews.
Selection criteria
Trials fulfilled the following criteria: 1) randomised intervention trial, 2) included children (aged ≥ 24 months), young people or adults, 3) randomised to a lower fat versus usual or moderate fat diet, without the intention to reduce weight in any participants, 4) not multifactorial and 5) assessed a measure of weight or body fatness after at least six months. We also included cohort studies in children, young people and adults that assessed the proportion of energy from fat at baseline and assessed the relationship with body weight or fatness after at least one year. We duplicated inclusion decisions and resolved disagreement by discussion or referral to a third party.
Data collection and analysis
We extracted data on the population, intervention, control and outcome measures in duplicate. We extracted measures of weight and body fatness independently in duplicate at all available time points. We performed random‐effects meta‐analyses, meta‐regression, subgrouping, sensitivity and funnel plot analyses.
Main results
We included 32 RCTs (approximately 54,000 participants) and data from 25 cohorts. There is consistent evidence from RCTs in adults of a small weight‐reducing effect of eating a smaller proportion of energy from fat; this was seen in almost all included studies and was highly resistant to sensitivity analyses. The effect of eating less fat (compared with usual diet) is a mean weight reduction of 1.5 kg (95% confidence interval (CI) ‐2.0 to ‐1.1 kg), but greater weight loss results from greater fat reductions. The size of the effect on weight does not alter over time and is mirrored by reductions in body mass index (BMI) (‐0.5 kg/m2, 95% CI ‐0.7 to ‐0.3) and waist circumference (‐0.3 cm, 95% CI ‐0.6 to ‐0.02). Included cohort studies in children and adults most often do not suggest any relationship between total fat intake and later measures of weight, body fatness or change in body fatness. However, there was a suggestion that lower fat intake was associated with smaller increases in weight in middle‐aged but not elderly adults, and in change in BMI in the highest validity child cohort.
Authors' conclusions
Trials where participants were randomised to a lower fat intake versus usual or moderate fat intake, but with no intention to reduce weight, showed a consistent, stable but small effect of low fat intake on body fatness: slightly lower weight, BMI and waist circumference compared with controls. Greater fat reduction and lower baseline fat intake were both associated with greater reductions in weight. This effect of reducing total fat was not consistently reflected in cohort studies assessing the relationship between total fat intake and later measures of body fatness or change in body fatness in studies of children, young people or adults.
PICO
Резюме на простом языке
Эффект снижения потребления жиров на массу тела
Не совсем ясно, какова идеальная доля энергии, получаемая из пищевых жиров, и как она влияет на массу тела. В этом обзоре рассмотрено влияние снижения доли энергии, получаемой из пищевых жиров, на массу тела и полноту у взрослых и детей, не ставивших целью снижение массы тела. Обзор показал, что снижение доли жиров в пище приводит к небольшому, но заметному уменьшению массы тела, индекса массы тела и окружности талии. Этот эффект был обнаружен и у взрослых, и у детей. С течением времени этот эффект не изменялся.
Authors' conclusions
Summary of findings
| Low dietary fat compared with usual fat for body fatness | ||||||
| Patient or population: children, young people and adults from the general population Methods: randomised controlled trials | ||||||
| Outcomes | Illustrative comparative risks* (95% CI) | Relative effect | No of participants | Quality of the evidence | Comments | |
| Assumed risk | Corresponding risk | |||||
| Usual fat | Low dietary fat | |||||
| Weight, kg (adults) | Median weight change ‐0.04kg1 | The mean weight, kg (adults) in the low fat groups was | — | 53,647 | ⊕⊕⊕⊕ | — |
| *The basis for the assumed risk (e.g. the median control group risk across studies) is provided in footnotes. The corresponding risk (and its 95% confidence interval) is based on the assumed risk in the comparison group and the relative effect of the intervention (and its 95% CI). | ||||||
| GRADE Working Group grades of evidence | ||||||
| 1The median weight change in the control groups over the course of each study was ‐0.04kg, ranging from ‐1.91kg to 2.13kg. 2While most studies were unblinded for participants and allocation concealment was often unclear (as randomisation was described poorly), RCT results in adults were remarkably consistent in their direction. Sensitivity analyses removing studies without clear allocation concealment did not lose the statistically significant relative weight reduction in the low fat arm, and neither did running fixed‐effect (rather than random‐effects) meta‐analysis or removing studies with attention bias favouring those in the low fat arm, or those with other interventions alongside the fat reduction. The consistent weight loss was despite the fact that none of the studies included intended to alter weight in either arm, so that publication bias on this outcome is unlikely. Together this suggests that the risk of bias was low. | ||||||
Background
The Joint Food and Agriculture Organization of the United Nations (FAO)/World Health Organization (WHO) expert consultation on fats and fatty acids in human nutrition debated optimal intakes of total fat in 2008. In light of the rising levels of overweight and obesity, particularly in low‐ and middle‐income countries undergoing rapid nutrition transition, this consultation agreed that any effect of total fat intake on body weight was pivotal in making global recommendations on total fat intake. Overweight and obesity are associated with increased risk of many cancers, coronary heart disease and stroke (Manson 1990; Song 2004; WCRF/AICR 2009).
A previous systematic review found no randomised controlled trials (RCTs) of lower total fat intake that aimed to assess effects on body weight (Kelly 2006), but we were aware of RCTs that had randomised participants to low fat versus usual fat diets, and measured weight or BMI as a process measure (Hooper 2012a). Additionally, meta‐regression within a systematic review assessing RCTs on the effects of step I and II diets (diets designed by the National Heart, Lung and Blood Institute national cholesterol education programme to reduce the risk of cardiovascular disease in the general population and those at increased cardiovascular risk, respectively), found a strong relation between total fat intake and body weight (Yu‐Poth 1999). This review, however, included studies that were as short as three weeks in duration and studies in which weight loss was a goal of the intervention, which may have overstated any relation because the advice was to lower both fat and energy intake. It also excluded many trials of reduction in total fat intake that did not fit the step I or II criteria.
More recent reviews that have explored the long‐term effects of low fat diets either did not explore weight or body fatness as an outcome (Schwingshackl 2013), or looked at low fat intake as part of a wider health promotion intervention (Ni 2010). Other systematic reviews have explored the relationship between fat intake and body fatness but were either limited to the effect low fat dairy versus high fat dairy consumption (Benatar 2013), or investigated it as part of looking at the overall dietary patterns (Ambrosini 2014), or diet quality (Aljadani 2015).
In order to aid the WHO's understanding of the relation between total fat intake and body weight with a view to updating their guidelines on total fat intake, the WHO Nutrition Guidance Expert Advisory Group (NUGAG) subgroup on diet and health (http://www.who.int/nutrition/topics/advisory_group/nugag_dietandhealth_topics/en/) was requested to assess the relationship. The expert advisory group aimed to generate a recommendation on the population impact of total fat intake in the development of obesity. The NUGAG group agreed to exclude studies of populations recruited specifically for weight loss and interventions intended to result in weight loss. These studies were potentially confounded by the implicit objective of reducing calorie intake to produce weight loss and might therefore lead to an overemphasis on studies carried out in highly selected obese populations in North America and Europe, which may have limited transferability to non‐obese populations or those in developing countries or in countries in transition.
To fulfil the requirements for the new guideline, a systematic review was needed of all available evidence of the longer‐term effects of total fat intake on body fatness, in studies not intending to cause weight loss. The WHO therefore commissioned a systematic review and meta‐analysis to assess the relationship between total fat intake and indicators of body fatness (including obesity, waist circumference and body mass index) using all appropriate RCTs and cohort studies in adults and children (Hooper 2012b), which has been updated in 2015.
Objectives
To assess the effects of proportion of energy intake from fat on measures of weight and body fatness (including obesity, waist circumference and body mass index) in people not aiming to lose weight, using all appropriate RCTs and cohort studies in adults, children and young people.
Methods
Criteria for considering studies for this review
Types of studies
Randomised controlled trials ( RCTs) of adults and children: trials of reduced fat intake compared with usual diet or modified fat intake with no intention to reduce weight (in any participants in either or both arms), continued for at least six months, unconfounded by non‐nutritional interventions and assessing a measure of body fatness at least six months after the intervention was initiated.
Randomisation of individuals was accepted, or of larger groups where there were at least six of these groups (clusters) randomised. We excluded studies where allocation was not truly randomised (e.g. divisions based on days of the week or first letter of the family name were excluded) or where allocation was not stated as randomised (and no further information was available from the authors). We excluded cross‐over studies (as previous weight gain or weight loss is likely to affect future weight trends) unless the first half of the cross‐over could be used independently.
Cohort studies of adults and children: prospective cohort studies that followed participants for (and assessed final or change in body fatness) at least 12 months after assessment of total fat, and related baseline total fat intake to absolute or change in body fatness at least 12 months later.
Types of participants
We accepted studies of adults (≥ 18 years, no upper age limit) or children and young people (aged ≥ 24 months) at any risk of cardiovascular disease (with or without existing cardiovascular disease). Participants could be of either sex, but we excluded those who were acutely ill, pregnant or lactating. We excluded intervention studies where participants were chosen for raised weight or body mass index (as most appeared to aim to reduce body weight within interventions, even when this was not explicitly stated in the intervention goals).
Types of interventions
Interventions
We considered all randomised controlled trials (RCTs) of interventions stating an intention to reduce dietary fat, when compared with a usual or modified fat intake.
We considered a low fat intake to be one that aimed to reduce fat intake to ≤ 30% energy (≤ 30%E) from fat, and at least partially replace the energy lost with carbohydrates (simple or complex), protein or fruit and vegetables. We considered a modified fat diet to be one that aimed to include > 30% energy from total fats, and included higher levels of mono‐unsaturated or poly‐unsaturated fats than a 'usual' diet.
As we were interested in the effects of fat intake on body weight and fatness in everyday dietary intake (rather than in people aiming to reduce their body weight in weight‐reducing diets) we excluded studies aiming to reduce the weight of some or all participants, as well as those that included only participants who had recently lost weight, or recruited participants according to a raised body weight or BMI. We excluded multifactorial interventions other than diet or supplementation (unless the effects of diet or supplementation could be separated, so the additional intervention was consistent between the intervention and control groups). We excluded Atkins‐type diets aiming to increase protein and fat intake, as well as studies where fat was reduced by means of a fat substitute (like Olestra). We excluded enteral and parenteral feeds, as well as formula weight‐reducing diets.
Examples
We included studies that reduced fats and encouraged physical activity in one arm and compared this with encouraging physical activity in the control. We excluded studies that reduced fats and encouraged physical activity in one arm and compared this with no intervention in the control. We included studies that reduced fats and encouraged fruit and vegetables in one arm and compared this with no intervention in the control.
We included all trials that intended to reduce dietary fat to ≤ 30%E in one arm compared to usual or modified fat intake (> 30%E from fat) in another arm regardless of the degree of difference between fat intake in the two arms (dose). We explored the effects of the difference in %E from fat between control and intervention groups, as well as the effects of fat intake in the control groups and dietary fat goals in the intervention groups, in subgrouping.
Exposures
For cohort studies total fat intake, in grams or as a percentage of dietary energy intake, had to be assessed at baseline and related to a measure of body fatness, or change in body fatness, at least a year later. For cohorts that used multiple dietary assessments to model later body fatness or change in body fatness more than half of the assessments included in the model had to be at least a year before the assessment of body fatness (or the final assessment for a change measure) used in the model.
Types of outcome measures
Primary outcomes
The main outcomes were measures of body fatness, including body weight, body mass index, waist circumference, skinfold thickness or percentage fat. Studies had to report at least one of these measures, or a change in these measures, to be included in the review.
Secondary outcomes
Secondary outcomes included other classic cardiovascular risk factors (systolic or diastolic blood pressure, serum total, low density lipoprotein (LDL) or high density lipoprotein (HDL) cholesterol and triglyceride) and quality of life measures (including informal outcomes such as feelings of health and time off work).
Tertiary outcomes
Tertiary outcomes were process outcomes and included changes in saturated and total fat intakes, as well as other macronutrients, sugars and alcohol.
This is not a systematic review of the effects of reduced fat on these secondary or tertiary outcomes, but we collated the outcomes from included studies in order to understand whether any effects on weight might be compromised by negative effects on secondary or tertiary outcomes.
Search methods for identification of studies
Electronic searches
The search to June 2010 is described in Hooper 2012b. We updated the searches to November 2014 and ran these in MEDLINE (Ovid, see Appendix 1). EMBASE (Ovid) and CINAHL (EBSCO host) searches were based on the MEDLINE search (Appendix 2; Appendix 3). The Cochrane Heart Group ran the update search for adult RCTs on 5 March 2014 in CENTRAL (2014, Issue 1) for a sister review, Hooper 2015 (Appendix 4), and we checked the references for this review.
Searching other resources
We searched the bibliographies of all related identified systematic reviews for further trials and cohort studies for the update, including Aljadani 2015, Ajala 2013, Aljadani 2013, Ambrosini 2014, Benatar 2013, Chaput 2014, Gow 2014, Havranek 2011, Hu 2012, Kratz 2013, Ni 2010, Schwingshackl 2013, Schwingshackl 2013a and Yang 2013.
Data collection and analysis
Selection of studies
We only rejected articles on the initial screen if the review author could determine from the title and abstract that the article was not a relevant RCT or cohort study. We rejected articles if they were not the report of a RCT; the trial did not address a low fat intake; the trial was exclusively in infants (less than 24 months old), pregnant women or the critically ill; participants were chosen for being overweight or obese; there was an intention to reduce weight in some or all participants; the trial was of less than six months duration; or the intervention was multifactorial. We rejected cohort studies where they were not prospective; where participants' total fat intake was not assessed; where they did not follow participants for at least 12 months after assessment of total fat; or where the relationship between total fat at baseline and a measure of absolute or change in body fatness at least 12 months later was not assessed.
When a title/abstract could not be rejected with certainty, we obtained the full text of the article for further evaluation. LH and AA assessed the inclusion of studies independently in duplicate, and we collected studies identified by either review author. LH and AA assessed the full texts collected for inclusion independently in duplicate, and discussed disagreements until agreement was reached.
Data extraction and management
We extracted data concerning participants, interventions or exposures and outcomes, and trial or cohort quality characteristics onto a form designed for the review. We extracted data on potential effect modifiers from RCTs (including duration of intervention, control group fat intake, sex, year of first publication, difference in % energy from fat between the intervention and control groups, type of intervention (food or advice provided), the dietary fat goals set for each arm, baseline BMI and health at baseline). Where provided, we collected data on risk factors for cardiovascular disease (secondary and tertiary outcomes).
All trial outcomes were continuous and where possible we extracted change data (change in the outcome from baseline to outcome assessment) with relevant data on variance for intervention and control arms (along with numbers of participants at that time point). Where change data were not available, we extracted data at study end (or other relevant time point) along with variance and numbers of participants for each arm. LH and AA extracted all data independently in duplicate.
Assessment of risk of bias in included studies
We carried out 'Risk of bias' assessment independently in duplicate. We assessed trial risk of bias using the Cochrane tool for assessment of risk of bias (Higgins 2011b). For included RCTs we also assessed whether trials were free of differences in diet (between intervention and control arms) other than dietary fat intake, and whether there was any systematic difference in attention or care or time given between the intervention and control groups, as we felt that these factors may also cause differences in weight. We used the category 'other bias' to note any further issues of methodological concern. Funding was not formally a part of our assessment of bias in RCTs as it is not a core part of the Cochrane 'Risk of bias' tool.
For cohort studies we assessed the number of participants lost to follow‐up (with reasons), baseline similarity by total fat intake, funding, type of control group (internal or external), method of assessment of total fat intake, number of total fat assessments and factors adjusted for. We also noted factors not adjusted for (age, sex, energy intake, ethnicity, physical activity (and/or TV watching) and socioeconomic (including educational) status for adults and age, sex, energy intake, ethnicity, parental BMI, physical activity (and/or TV watching) and socioeconomic (including educational) status in children).
Measures of treatment effect
The effect measure of choice for continuous outcomes (all review outcomes were continuous outcomes) was the mean difference (MD).
Unit of analysis issues
We did not include any cluster‐randomised or cross‐over trials in this review.
Where there was more than one relevant intervention arm but only one control arm we pooled the relevant intervention arms to create a single pair‐wise comparison (where the intervention arms were equivalently appropriate for this review) as described in Higgins 2011a. We excluded intervention arms that were not appropriate for this review, or less appropriate than another arm. When two arms were appropriate for different subgroups then we used the control group once with each intervention arm, but we did not pool the subgroups overall.
When weight or BMI were assessed at more than one time point we used the data from the latest time point available in general analyses, but we extracted data for all time points for use in subgrouping by study duration.
Dealing with missing data
Where included studies used methods to infer missing data (such as carrying the latest weight data forward) then we used these data in analyses. Where this was not done we used the data as presented.
Assessment of heterogeneity
We examined heterogeneity using the I2 statistic and considered heterogeneity important where the I2 was above 50% (Higgins 2003; Higgins 2011a).
Assessment of reporting biases
We drew funnel plots to examine the possibility of publication bias for measures of body fatness with at least 10 included comparisons (Egger 1997).
Data synthesis
All trial outcomes were continuous and where possible we extracted change data (change in the outcome from baseline to outcome assessment) with relevant data on variance for intervention and control arms (along with numbers of participants at that time point). Where change data were not available, we extracted data at study end (or other relevant time point) along with variance and numbers of participants for each arm. We did not use end data where the difference between the intervention and control groups at baseline was greater than the change in that measure between baseline and endpoint in both arms (instead we used change data in forest plots, but without standard deviations (SDs), so the data did not add to the meta‐analyses but provided comparative information).
We combined data by the inverse variance method in random‐effects meta‐analysis to assess mean differences between lower and higher fat intake arms.
We planned to conduct separate meta‐analyses of data from adult RCTs, data from child RCTs, data from adult cohort studies and data from child cohort studies, where data from separate studies were similar enough to be combined.
We created a 'Summary of findings' table assessing the effects of low dietary fat compared with usual fat for body weight in adults using RCT data.
Subgroup analysis and investigation of heterogeneity
For this update we classified all dietary interventions as low fat versus usual or modified fat. Pre‐specified subgroups for body fat outcomes, to explore the stability of findings in different study subgroups, included:
-
duration of intervention (6 to < 12 months, 12 to < 24 months, 24 to < 60 months, and 60+ months);
-
control group total fat intake (> 35%E from fat, > 30%E to 35%E from fat, > 25%E to 30%E from fat);
-
year of first publication of results (1960s, 1970s, 1980s, 1990s, 2000s, 2010s);
-
sex (studies of women only, of men only, of men and women mixed);
-
difference in %E from fat between control and reduced fat groups (up to 5%E from fat, 5%E to < 10%E from fat, 10%E to < 15%E from fat, 15+%E from fat, or unknown difference);
-
type of intervention (dietary advice, advice plus supplements and diet provided);
-
by total fat goal in the intervention arm (10%E to < 15%E from fat, 15%E to < 20%E from fat, 20%E to < 25%E from fat, 25%E to < 30%E from fat, 30%E from fat, and no specific goal stated);
-
achieving fat goals (achieved 30%E from fat or less, did not achieve this);
-
mean BMI at baseline (< 25, 25 to < 30, 30+);
-
state of health at baseline (not recruited on the basis of risk factors or disease, recruited on the basis of risk factors such as lipids, hormonal levels etc., recruited on the basis of having or having had diseases such as diabetes, myocardial infarction, cancer, polyps);
-
assessed energy reduction in the intervention compared with the control group during the intervention period (E intake the same or greater in the low fat group, E intake 1 to 100 kcal/d lower in the low fat group, 101 to 200 kcal/d lower in the low fat group, > 200 Kcal/d lower in the low fat group).
For subgrouping factors that appeared to suggest significant differences in effect size between subgroups we explored the effects using meta‐regression on weight (we also intended to explore the effects on other outcomes, but no other outcome had more than 10 relevant comparisons). We performed random‐effects meta‐regression (Berkley 1995) using the STATA command metareg (Sharp 1998; Sterne 2001; Sterne 2009).
Sensitivity analysis
We carried out sensitivity analyses for primary outcomes, assessing the effect of:
-
running fixed‐effect meta‐analyses (rather than random‐effects) (Higgins 2011a);
-
excluding the largest study (WHI with CVD 2006, WHI 2006);
-
excluding studies that were not free of systematic differences in care (or unclear);
-
excluding studies that were not free of dietary differences other than fat (or unclear);
-
excluding studies with unclear or inadequate allocation concealment.
Results
Description of studies
The study flow is shown in Figure 1. The perceived importance of obesity and overweight has increased over the past few years, therefore many trials of reduced fat diets now explicitly or implicitly aim at weight loss. To guard against inclusion of studies that intended weight loss without stating this clearly we decided to exclude RCTs that only included people based according to their BMI or weight classification (i.e. specifically including only people with a BMI > 25). For this reason (and to ensure consistency) we have excluded three RCTs included in the previous version of this review, Hooper 2012b, from this current review (CARMEN 2000; CARMEN MS sub‐study; German Fat Reduced), while we have included an additional adult RCT (Diet and Hormone Study 2003).
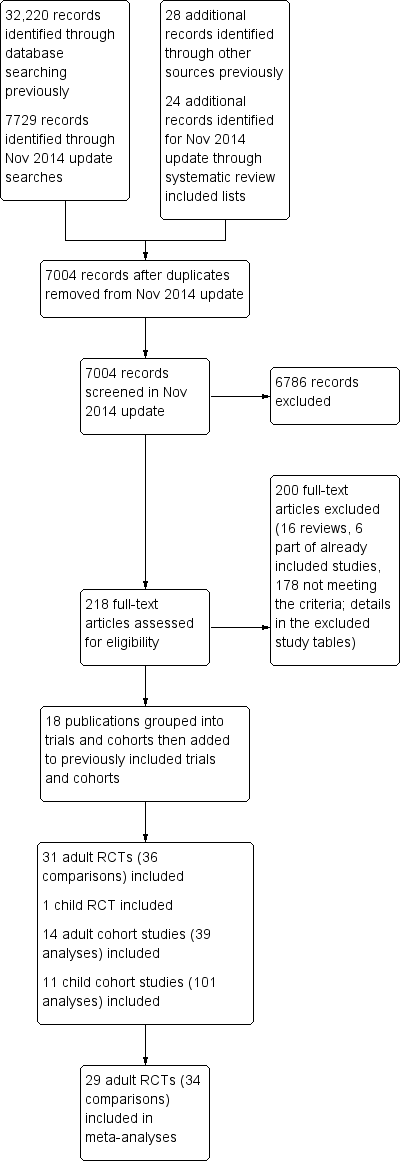
Study flow diagram for this systematic review (update searches run November 2014).
Results of the search
The search for RCTs and cohort studies in the original version of this review identified 32,220 titles and abstracts from the electronic searches plus 28 further potential studies from other sources. For this update the electronic searches identified 7729 possible titles and abstracts, plus we assessed a further 24 potential studies following our check of potentially relevant trials and cohort studies included in other systematic reviews. Of these 7753 potential update titles and abstracts, we assessed 218 full‐text articles for eligibility (additional to the 465 assessed for the original review). We included a total of 32 RCTs (31 in adults, one in children) and 25 prospective cohort studies (17 sets of analyses of 14 cohorts in adults and 13 sets of analyses of 11 cohorts in children) (Figure 1). We included 29 adult RCTs (including 34 comparisons) in meta‐analyses.
Included studies
Of the 31 RCTs in adults (36 comparisons, including roughly 53,626 participants ‐ exact numbers depending on time point in study and endpoint used), 21 were from North America, nine from Europe and one from New Zealand, with none from developing or transitional countries. The duration of the trials varied from six months to more than eight years. In four trials the participants were all men, in 15 all women and in 12 both sexes (one of which reported outcomes by sex). Mean ages and states of health (low, moderate or high risk of cardiovascular disease or breast cancer) varied. The single trial in children analysed 191 Greek 12‐ to 13 ‐year old boys and girls, followed up for 17 months (VYRONAS 2009). See Characteristics of included studies for detailed characteristics of the RCTs in adults and young people.
When discussing the 31 RCTs, the de Bont study (de Bont 1981 non‐obese; de Bont 1981 obese), DEER study (DEER 1998 exercise men; DEER 1998 exercise women; DEER 1998 no exercise men; DEER 1998 no exercise wom), and Kuopio study (Kuopio Reduced & Mod 1993; Kuopio Reduced Fat 1993) are each referred to and counted as a single study, although they appear as individual arms in analyses and in the validity table (suggesting 36 intervention arms).
We included 14 adult cohorts (20 published papers, cohorts presented their results in from one to eight main analyses, 39 analyses in total) which reported on baseline total fat intake and reported on a measure of body fatness at least one year later. Eleven cohorts reported change in weight, BMI and/or waist circumference over the course of the follow‐up, while three cohorts reported absolute weight or BMI at follow‐up. Follow‐up was from one year to over 16 years (median five years). Most cohorts were of mixed sex, though one was men only and two women only. Recruitment included young people (13 years and over in one mixed cohort although most participants recruited were adults, 18 years and over in fully adult cohorts), middle aged and elderly adults (up to 75 years at baseline). Cohorts were recruited in North America (eight cohorts), Europe (five cohorts) and Australia (one).
The 11 included cohorts that recruited children and young people were followed for one to 23 years (median four years). They were reported in 13 published papers, and provided 101 separate analyses. The cohorts recruited children aged from two years to 14 years (although one study, Viva La Familia, may have recruited four‐ to 19‐year olds, so included a few young people older than 14 at baseline), and followed up until later in childhood or early adulthood. Five were based in North America, three in Europe, two in Australia and one in Korea.
The table of characteristics of the adult cohort studies, along with their references, is found in Table 1, and of cohorts of children and young people in Table 2.
| Study | Participants at baseline | + / 0 / ‐ | Results and/or estimate of effect? |
| CARDIA Ludwig 1999 (1) USA | 2909 healthy black and white young adults Baseline age: 18 to 30 yrs Follow‐up: 10 yrs %E from fat: unclear (lower quintile < 30, upper > 41.7) BMI: unclear | + (weight) in black men and women 0 (weight) in white men and women | Adjusted means of 10‐year body weight according to quintiles of total fat as a percentage of total energy. P for trend 0.32 in white men and women (quintile 1 weight 168.6 lb, quintile 5 weight 169.4 lb), 0.03 for black men and women (quintile 1 weight 182.1 lb, quintile 5 weight 185.7 lb) |
| Danish Diet Cancer & Health Study Halkjaer 2009 (2‐4) Denmark | 22,570 women and 20,126 men Baseline age: 50 to 64 yrs Follow‐up: 5 yrs %E from fat: unclear (approx 32% in women, 33% in men) BMI: median 24.7 women, 26.1 men | 0 (Δ waist) women 0 (Δ waist) men | Association between total fat intake at baseline and change in waist circumference over 5 years suggested no statistically significant effects in women (mean change in waist circumference ‐0.03 cm/MJ/d total fat, 95% CI ‐0.20 to 0.14) or men (mean change in waist circumference 0.06 cm/MJ/d total fat, 95% CI ‐0.05 to 0.17) |
| 12,353 women and 10,080 men Baseline age: 50 to 60 yrs Follow‐up: 5 yrs %E from fat: median 33.8% women, 35.2% in men BMI: median 24.4 women, 25.8 men | 0 (Δ waist circumference) 0 (Δ body weight) | Macronutrient energy substitution where energy from protein was replaced by fat or carbohydrate. Multiple linear regression investigated the association between dietary protein in relation to change in body weight or waist circumference over 5 years. No statistically significant effect of replacing 5%E from fat with protein on change in body weight (8.0 g/year, 95% CI ‐16.6 to 32.5, P value = 0.525) or waist circumference (0.1 mm/year, 95% CI ‐0.3 to 0.4, P value = 0.799) | |
| Danish MONICA Iqbal 2006 (5) Denmark | 900 women and 862 men Baseline age: 30 to 60 yrs Follow‐up: 5 yrs %E from fat: 43.8% (SD 6.5 women, 42.7 (SD 6.3) men BMI: 23.4 (SD 3.7 women, 25.1 (SD 3.3) men | 0 (Δ weight) women 0 (Δ weight) men | Regression assessment of total fat as %E and other dietary factors as a function of change in body weight suggested no significant effects of %E from fat on 5‐year change in body weight in women (unadjusted beta 0.47, SE 0.89, P value = 0.60, adjusted beta 0.86, SE 0.92, P value = 0.35) or men (unadjusted beta ‐0.14, SE 0.69, P value = 0.84, adjusted beta 0.11, SE 0.69, P value = 0.87) |
| Diabetes Control & Complications Trial (DCCT) & EDIC Cundiff 2012 (6) USA | 1055 women and men with diabetes, HbA1c ≤ 9.5 Baseline age: 13 to 39 yrs (mean 27.4) Follow‐up: 14 to 19 yrs (mean 16.4 yrs) %E from fat: 36.2% (90% CI 26.6 to 45.1) BMI: 23.4 (90% CI 19.4 to 27.9) | 0 (Δ BMI/year) | Multiple regression analyses generated the formula linking macronutrient intake and exercise at baseline with change in BMI per year. Univariate analyses suggested no relationship between total fat (as %E) and change in BMI per year (β 0.04 kg/m2/year, P value = 0.22), and only total fat minus polyunsaturated fat (%E, not total fat) was included in the formula predicting BMI change per year |
| EPIC‐PANACEA Vergnaud 2013 (7) Europe (10 countries) EPIC Beulens 2014 (8) Europe (15 cohorts) | 373,803 men and women from the general European population Baseline age: 25 to 70 yrs Follow‐up: 5 yrs (2 to 11) %E from fat: mean 35.4 (SD unclear) BMI: mean 25.6 women, 26.7 men (SDs unclear) | 0 (Δ weight) when replacing fat with CHO in women or men ‐ (Δ weight) when replacing fat with protein in women or men | Multivariate substitution models were performed to estimate weight change associated with replacement of 5%E of one macronutrient with another. 5% greater proportion of E from fat at the expense of carbohydrate was not associated with weight change in women or men (P value = 0.36, P value = 0.73). Replacing 5%E from protein with fat was associated with weight reduction in women (β 0.4 kg/5 years, P value < 0.0001) and men (β 0.3 kg/5 years, P value = 0.003) |
| 6192 people with type 2 diabetes Baseline age: unclear Follow‐up: 5 yrs %E from fat: unclear BMI: unclear | ‐ (Δ weight) when replacing CHO with total fat | Linear regression was used to explore the relationship between replacement of CHO with total fat (and also MUFA and PUFA) and 5‐year weight change. This is an abstract so results reported as "5‐year weight change decreased when carbohydrates were substituted with total fat" (no further details) | |
| Health Professionals Follow‐Up Study (HPFUS) Coakley 1998 (9) USA | 19,478 male health professionals Baseline age: 45 to 75 yrs Follow‐up: 4 yrs %E from fat: unclear, energy adjusted fat intake mean 69.6 g/d (SD 13.8) BMI: unclear | + (Δ weight) 45 to 54 yrs men + (Δ weight) 55 to 64 yrs men 0 (Δ weight) 65+ yrs men | Multivariate regression analyses determined whether total fat intake and other habits were predictive of 4‐year weight change, and found that a change of adjusted fat intake of 10 g/d predicted 0.10 kg of weight change over 4 years (P value < 0.001 for ages 45 to 54 and 55 to 64 years, P value > 0.05 for age 65+) |
| Melbourne Collaborative Cohort Study (MCCS) MacInnis 2013 (10) Australia | 5879 healthy Australian‐born non‐smokers Baseline age: 40 to 69 yrs Follow‐up: 11.7 yrs %E from fat: 33% (SD 6) women, 33 (SD 5) men BMI: unclear | + (weight) overall + (waist circumference) overall + (weight) 40 to 49 yrs 0 (weight) 50 to 59 yrs 0 (weight) 60 to 69 yrs + (waist) 40 to 49 yrs + (waist) 50 to 59 yrs 0 (waist) 60 to 69 yrs | Multivariable linear regression was used to predict waist circumference and weight at 12‐year follow‐up. Higher percentage of energy from fat at baseline was associated with weight (0.26 kg per 10%E from fat, P value = 0.03) and waist circumference (0.85 cm per 10%E from fat, P value < 0.001) in the whole sample. When assessed in age bands, total fat was associated with weight in those aged 40 to 49 years at baseline (P value = 0.002), but not in those aged 50 to 59 (P value = 0.94) or 60 to 69 years (P value = 0.79), and with waist circumference in those aged 40 to 49 (P value < 0.001) and 50 to 59 (P value = 0.01), but not in those aged 60 to 69 (P value = 0.14) |
| Memphis Klesges 1992 (11‐13) USA | 152 women and 142 men (Caucasian health professionals) Baseline age: 24 to 52 yrs Follow‐up: 2 yrs %E from fat: mean 36.8 (SD 6.1) women, 36.0 (SD 5.4) men BMI: mean 24.8 (SD 5.0) women, 27.8 (SD 4.3) men | + (Δ weight) women 0 (Δ weight) men 0 (Δ waist) women ‐ (Δ waist) men | Stepwise multivariate regression analyses assessed whether various lifestyle factors were predictive of weight change over 2 years. Percentage of energy as fat was predictive of weight change in women (coefficient 0.53, SE 0.16, P value = 0.0010) but not in men (exact data not provided) Hierarchical linear regression assessed the effects of lifestyle factors on change in waist circumference over 2 years, and found no significant effect in women (coefficient ‐0.04, P value = 0.50) but a statistically significant negative relationship in men (coefficient ‐0.05, P value = 0.04) |
| NHANES Follow‐up Kant 1995 (14) USA | 4567 women and 2580 men Baseline age: 25 to 74 yrs Follow‐up: mean 10.6 (SD 5) yrs %E from fat: mean 36.4 (SD 5.0) women, 37.0 (SD 10.1) men BMI: mean 25.2 (SD 5.0) women, 25.9 (SD 5.0) men | + (Δ weight) < 50 yrs women 0 (Δ weight) 50+ yrs women 0 (Δ weight) < 50 yrs men 0 (Δ weight) 50+ yrs men | Univariate regression analyses assessed whether fat as %E is predictive of 10‐year weight change and found no significant effects in women (Beta ‐0.011, SE 0.017, P value = 0.51) or men (Beta 0.043, SE 0.022, P value = 0.06). Effects were similar in multivariate regression in women (Beta ‐0.033, SE 0.019, P value = 0.08 for women overall, Beta ‐0.053, SE 0.025, P value = 0.04 for women aged < 50 yrs, Beta ‐0.019, SE 0.030, P value = 0.55 for women aged 50+) or men (Beta 0.021, SE 0.022, P value = 0.33 for men overall, Beta ‐0.004, SE 0.028, P value = 0.88 for men aged < 50 yrs, Beta ‐0.058, SE 0.035, P value = 0.10 for men aged 50+) |
| Nurses' Health Study Colditz 1990 (15) Field 2007 (16) USA | 31,940 women (nurses) Baseline age: 30 to 55+ Follow‐up: 8 yrs %E from fat: unclear BMI: unclear | 0 (Δ weight) women | Correlation between total fat (g/d) and weight gain over subsequent 4 years (beta ‐0.0007, t ‐0.4), not statistically significant |
| 41,518 women (nurses) Baseline age: 41 to 68 yrs (mean 53.7, SD 7.1 yrs) Follow‐up: 8 yrs %E from fat: 32.8 (SD 5.6) BMI: 25.0 (SD 4.5) | ? unclear (Δ weight) women | Association between a 1% difference in total fat as %E and weight change (in pounds over 8 years) was modelled using linear regression. There was a weak relationship between total fat and weight change (β 0.11 lb/1% total fat difference, P value < 0.0001 stated in text, but no statistical significance indicated in table) | |
| Pawtucket HHP Parker 1997 (17) USA | 289 women and 176 men Baseline age: 18 to 64 yrs Follow‐up: 4 yrs %E from fat: unclear BMI: mean 26.5 (SD 5.0) | 0 (Δ weight) women and men | Multiple regression assessed association of weight change with different nutrients at baseline. Found no effect of total fat in grams on weight change over 4 years (coefficient 2.30, P value = 0.71) |
| San Luis Valley Diabetes Study (SLVDS) Mosca 2004 (18) USA | 433 women and 349 men ‐ non‐diabetic, Hispanic and non‐Hispanic white Baseline age: 20 to 74 yrs Follow‐up: 14 yrs %E from fat: mean 38.3 (SD 8.9) white women, 37.2 (8.9) Hispanic women, 38.9 (8.7) white men, 37.8 (9.8) Hispanic men BMI: mean 24.3 (SD 4.4) white women, 25.0 (4.6) Hispanic women, 25.7 (3.3) white men, 24.7 (3.8) Hispanic men | + (Δ weight) overall (includes women and men, Hispanic and non‐Hispanic white) | Linear mixed model (random‐effects, PROC MIXED in SAS) was used to assess whether those who generally consume a relatively high fat diet gain more weight over time. They found a significant association between %E from total fat and weight change between participants (β 0.012, P value = 0.0178) after adjusting for potential confounders |
| SEASONS Ma 2005 (19) USA | 275 healthy women and 297 healthy men Baseline age: 20 to 70 yrs Follow‐up: 1 yr %E from fat: mean 36.7 (SD 9.0) BMI: mean 27.4 (SD 5.5) | 0 (BMI) women and men – with no energy adjustment | Regression analyses to assess effects of total fat %E on BMI. Longitudinal effect was not statistically significant (coefficient 0.005, P value = 0.07) |
| Women’s Gothenburg Lissner 1997 (20) Sweden | 361 women Baseline age: 38 to 60 yrs Follow‐up: 6 yrs %E from fat: mean 34.1 (SD 4.0) lower fat group, 42.3 (SD 3.0) higher fat group BMI: mean 24.6 (SD 4.1) lower fat group, 24.1 (SD 4.1) higher fat group | + (Δ weight) sedentary 0 (Δ weight) moderate 0 (Δ weight) active | Multivariate regression used to test for interactive effects of dietary fat intake on weight change over 6 years. A significant effect of high vs low %E from fat was found in sedentary women (high fat women gained 2.64 kg while low fat women lost 0.64 kg over 6 years, P value = 0.03) but this was lost with further energy adjustment. No effects were seen in more active women (2 categories), where those with low and high fat intakes all gained 1 to 2 kg on average |
Key:
+ = positive relationship found between fat intake and weight outcome.
0 = no relationship found between fat intake and weight outcome.
‐ = negative (inverse) relationship found between fat intake and weight outcome.
Abbreviations: BMI: body mass index; CHO: carbohydrates; CI: confidence interval; MUFA: monounsaturated fatty acid; PUFA: polyunsaturated fatty acid; SD: standard deviation; SE: standard error.
References for this table:
(1) Ludwig DS, Pereira MA, Kroenke CH, Hilner JE, Van Horn L, Slattery MI, et al. Dietary fiber, weight gain, and cardiovascular disease risk factors in young adults. JAMA 2006;282:1539‐46.
(2) Halkjaer J, Tjonneland A, Thomsen BL, Overvad K, Sorensen TIA. Intake of macronutrients as predictors of 5‐y changes in waist circumference. American Journal of Clinical Nutrition 2006;84:789‐97.
(3) Halkjaer J, Tjonneland A, Overvad K, Sorensen TIA. Dietary predictors of 5‐year changes in waist circumference. Journal of the American Dietetic Association 2009;109(8):1356‐66.
(4) Ankarfeldt MZA. Interactions of dietary protein and adiposity measures in relation to subsequent changes in body weight and waist circumference. Obesity 2014;22(9):2097‐103.
(5) Iqbal SI, Helge JW, Heitmann BL. Do energy density and dietary fiber influence subsequent 5‐year weight changes in adult men and women? Obesity (Silver Spring) 2006;14:106‐14.
(6) Cundiff DK, Raghuvanshi N. Future body mass index modelling based on macronutrient profiles and physical activity. Theoretical Biology & Medical Modelling 2012;9:43.
(7) Vergnaud A‐CN. Macronutrient composition of the diet and prospective weight change in participants of the EPIC‐PANACEA Study. PLoS One 2013;8(3).
(8) Beulens JWJ. Dietary fat intake in low‐carbohydrate diets and subsequent mortality and weight change in type 2 diabetes. Diabetologia 2014;57(Suppl 1):S311.
(9) Coakley EH, Rimm EB, Colditz GA, Kawachi I, Willett WC. Predictors of weight change in men: results from the health professionals follow‐up study. International Journal of Obesity (Lond) 1998;22:89‐96.
(10) MacInnes RJ, Hodge AM, Dixon HG, Peeters A, Johnson LEA, English DR, et al. Predictors of increased body weight and waist circumference for middle‐aged adults. Public Health Nutrition 2013;17(5):1087‐97.
(11) Eck LH, Pascale RW, Klesges RC, White Ray JA, Klesges LM. Predictors of waist circumference change in healthy young adults. International Journal of Obesity (Lond) 1995;19:765‐9.
(12) Klesges RC, Isbell TR, Klesges LM. Relationship between dietary restraint, energy intake, physical activity, and body weight: a prospective analysis. Journal of Abnormal Psychology 1992;101:668‐74.
(13) Klesges RC, Klesges LM, Haddock CK, Eck LH. A longitudinal analysis of the impact of dietary intake and physical activity on weight change in adults. American Journal of Clinical Nutrition 1992;55:818‐22.
(14) Kant AK, Graubard BI, Schatzkin A, Ballard‐Barbash R. Proportion of energy intake from fat and subsequent weight change in the NHANES I Epidemiologic Followup Study. American Journal of Clinical Nutrition 1995;61:11‐7.
(15) Colditz GA, Willett WC, Stampfer MJ, London SJ, Segal MR, Speizer FE. Patterns of weight change and their relation to diet in a cohort of healthy women. American Journal of Clinical Nutrition 1990;51:1100‐5.
(16) Field AE, Willett WC, Lissner L, Colditz GA. Dietary fat and weight gain among women in the Nurses' Health Study. Obesity (Silver Spring) 2007;15(4):967‐76.
(17) Parker DR, Gonzalez S, Derby CA, Gans KM, Lasater TM, Carleton RA. Dietary factors in relation to weight change among men and women from two southeastern New England communities. International Journal of Obesity (Lond) 1997;21:103‐9.
(18) Mosca CL, Marshall JA, Grunwald GK, Cornier MA, Baxter J. Insulin resistance as a modifier of the relationship between dietary fat intake and weight gain. International Journal of Obesity (Lond) 2004;28:803‐12.
(19) Ma Y, Olendzki BC, Chiriboga D, Hebert JR, Li Y, Li W, et al. Association between dietary carbohydrates and body weight. American Journal of Epidemiology 2005;161:359‐67.
(20) Lissner L, Heitmann BL, Bengtsson C. Low‐fat diets may prevent weight gain in sedentary women. Obesity Research 1997;5(1):43‐8.
| Study | Participants at baseline | + / 0 / ‐ | Results and/or estimate of effect |
| Adelaide Nutrition Study Magarey 2001 (1) Australia | 243 boys and girls Age: diet analysed at 2, 4, 6, 8, 11, 13 and 15 years old Follow‐up: assessed for each gap (e.g. 2 to 4 years, 2 to 6 years, 2 to 8 years, 4 to 6 years etc), 2 to 13 years %E from fat: boys aged 2 yrs 38.4 (SD 5.8), girls aged 2 38.1 (SD 13.4), boys aged 15 33.2 (SD 5.6), girls aged 15 yrs 34.4 (SD 5.6) BMI: boys aged 2 yrs 16.8 (SD 1.7), girls aged 2 16.5 (SD 1.4), boys aged 15 20.2 (SD 2.6), girls aged 15 yrs 21.4 (SD 4.1) | 0 (BMI) for 20 of 21 possible age gaps 0 (triceps skinfold) for 21 of 21 possible age gaps 0 (sub‐scapular skinfold) for 20 of 21 possible age gaps | Single dietary assessment for each of 21 analyses Analysis: multiple regression analysis was used to predict whether body fatness at a specific age was predicted by macronutrient intake at previous ages. For BMI only one of 21 possible gaps showed a statistically significant relationship between total fat intake as a percentage of energy and later BMI (a significant relationship, P value < 0.01, was only seen between fat at age 6 and BMI at age 8). For triceps skinfold none of 21 possible gaps showed a statistically significant relationship between total fat intake as a percentage of energy and later triceps skinfold. For subscapular skinfold only one of 21 possible gaps showed a statistically significant relationship between total fat intake as a percentage of energy and later sub‐scapular skinfold (a significant relationship, P value < 0.01, was only seen between fat at age 2 and skinfold at age 15) |
| Amsterdam Growth & Health Long. Study (AGAHLS) Twisk 1998, Koppes 2009 (2;3) Netherlands | 83 boys (then men) and 98 girls (then women) Age: recruited aged 13, diet analysed at ages 13, 14, 15, 16, 21, 27 Follow‐up: 14 yrs (age 27) %E from fat: not reported BMI: boys aged 13 yrs 17.3 (SD 1.6), girls 18.1 (SD 2.1), men aged 27 yrs 22.6 (SD 2.2), women 21.9 (SD 2.5) | 0 (sum of 4 skinfolds) 0 (BMI) Both for absolute fat intake and %E from fat | Multiple dietary assessments Analysis: first order auto‐regressive model (fatness at each time point related to exposure at the previous time point) estimated by generalised estimating equations. There was no relationship between total fat intake (absolute, g/d) and later fatness as assessed by sum of four skinfolds (P value = 0.41) or BMI (P value = 0.23), or between fat intake as %E and later fatness as assessed by sum of four skinfolds (P value = 0.92) or BMI (P value = 0.69) |
| 168 boys (then men) and 182 girls (then women) Age: recruited aged 13 (SD 0.7), diet analysed at ages 13, 14, 15, 16, 21, 27, 32, 36 Follow‐up: 23 yrs (age 36) %E from fat: not reported BMI: as above | 0 (high %body fat at age 36), 0 of 14 analyses 0 (% body fatness) in men or women | Multiple dietary assessments Analysis: generalised estimating equation regression analyses found that dietary fat intake (%E) at ages 13, 14, 15, 16, 21, 27 or 32 did not predict high body fatness (> 25% for men, > 35% for women, assessed by DEXA at 36 years) in either men or women (in any of 7 analyses in men or 7 in women). Regression coefficients using all available data gathered between ages 13 and 36 found no relationship between %E from fat and sum of skinfolds in either men (P value = 0.42) or women (P value = 0.89) | |
| Bogaert 2003 (4) Australia | 29 boys and 30 girls Age: recruited aged 6 to 9 yrs, mean 8.6 (SE 0.2) yrs Follow‐up: at 6 and 12 mo %E from fat: 33.5 (SD 0.8) in boys aged < 8 yrs, 31.7 (SD 2.7) girls < 8 yrs, 37.5 (SD 1.2) boys aged 8+ yrs, 33.6 (SD 1.7) girls aged 8+ yrs BMI: z scores boys mean 0.3 (SE 0.1), girls mean 0.5 (SE 0.3) | 0 (Δ BMI) | Single dietary assessment Analysis: correlations were calculated to assess the relation between %E from fat at baseline and BMI z‐score change from baseline to 12 months. No "positive relation" was found |
| Carruth and Skinner 2001 (5;6) USA | 29 white boys and 24 girls Age: recruited at 24 months, diet assessed at 24 to 32, 28 to 36, 42, 48, 54, 60 months old Follow‐up: body fat assessed at 70 months %E from fat: 31% boys, 32% girls at 27 months, 31% boys, 33% girls at 60 months BMI: 15.7 (SD 1.2) in boys and 15.4 (SD 1.0) in girls at 60 months | + (%body fat) + (g body fat) | Multiple dietary assessments Analysis: regression analyses (general linear models) of total fat intake (averaging over 6 dietary assessments aged 27 to 60 months) predicted body fat at 70 months (assessed as %body fat, P value = 0.02 and grams of body fat, P value = 0.01, both assessed by DEXA) |
| 37 white boys and 33 girls Age: recruited at 24 months (except 2 joined at 1 year, 6 joined at 2 years from similar study), diet assessed at 2.0, 2.3, 2.7, 3.0, 3.5, 4.0, 4.5, 5.0, 6.0, 7.0, 8.0 yrs old Follow‐up: BMI assessed at 8 yrs %E from fat: mean 32% (SD not stated) BMI: 16.5 in boys and 16.2 in girls at 2 yrs, 16.8 in boys and 17.1 in girls at 8 yrs | + (BMI) by g/d of fat + (BMI) by %E from fat | Multiple dietary assessments Analysis: forward stepwise regression was used to assess the relationship between dietary fat (averaged from 9 sets of 3‐day dietary data from ages 2 to 8) and BMI at age 8 years. Whether assessing fat as g/d (P value = 0.004) or %E from fat (P value = 0.010) there was a significant relationship (adjusted for BMI at 2 years and adiposity rebound age) | |
| Davison 2001 (7) USA | 197 non‐Hispanic white girls Age: 5.4 (0.4) yrs Follow‐up: 2 yrs (age 7.3 ±0.3) %E from fat: 31 (SD unclear) BMI: 15.8 (1.4) | + (Δ BMI) | Single dietary assessment Analysis: in hierarchical regression models, girls' fat intake (as %E) at 5 yrs had a significant relationship with change in BMI from 5 to 7 years, P value = 0.02 |
| Etude Longitud. Alimentation Nutrition Croissance des Enfants (ELANCE) Rolland‐Cachera 2013 (8) France | 40 boys and 33 girls whose diets were assessed at 2 yrs Age: 2 yrs Follow‐up: 18 years (age 20) %E from fat: 31.9 (SD 5.7) boys, 32.8 (SD 4.5) girls BMI: unclear | 0 (BMI) 0 (% triceps skinfold) ‐ (% sub‐scapular skinfold) ‐ (fat mass) | Single dietary assessment (for this analysis) Analysis: association between dietary intake at 2 years and adult body composition was analysed using linear regression models. No statistically significant relationships were found between %E from fat at 2 years and BMI (P value = 0.23), % triceps skinfold (P value = 0.19), or fat‐free mass (P value = 0.98) at age 20. Greater total fat intake predicted lower % subscapular skinfold (P value = 0.03) and fat mass (P value = 0.04). All data presented from the adjusted models |
| European Youth Heart Study Brixval 2009 (9) Denmark | 171 girls and 137 boys (but total of 384 stated also, numbers vary between tables) Age: boys 9.7 (SD 0.4) yrs, girls 9.6 (SD0.4) yrs Follow‐up: 6 years (age 15 to 16) %E from fat: 32.1 (SD 6.6) boys, 33.3 (SD 6.7) girls BMI: 17.1 (SD 2.0) boys, 17.2 (SD 2.4) girls | 0 (Δ BMI z‐score) boys 0 (Δ BMI z‐score) girls | Single dietary assessment. Analysis: examined the associations between dietary fat intake at 9 years and subsequent 6‐year weight development using regression analysis. None of the regression models (various levels of adjustment) suggested that fat %E was associated with change in BMI over 6 years (in boys P value = 0.27, girls P value = 0.75 in the most adjusted model) |
| Klesges 1995 (10) USA | 110 boys and 93 girls Age: 3 to 5 yrs (boys 4.4 (0.5), girls 4.3 (0.5) Follow‐up: 2 yrs %E from fat: boys and girls 33.0 (5.0) BMI: boys 16.1 (1.4), girls 16.1 (1.2) | 0 /+ /0/0 (Δ BMI) | Multiple dietary assessments Analysis: assessed whether baseline %E from fat, change from baseline to 1 year, 1 yr to 2 yrs, or baseline to 2 yrs (along with other variables) predicted change in BMI over 2 yrs Multiple regression analysis suggested lower baseline %E from fat correlated to lower BMI change (regression coefficient = 0.034, P value = 0.05 – marginal significance) at 2 yrs, 0.17 k/m2per 5% more E from fat Change in %E from fat over the last year was correlated with BMI change (regression numbers not legible, probably P value = 0.01), 0.20 kg/m2 per 5%E from fat change. Change in %E from fat from baseline to 1 yr, and baseline to 2 yrs did not predict change in BMI |
| Obesity & Metabolic Disorders Cohort in Children (OMDCC) Lee 2012 (11) Korea | 1504 1st and 4th grade children Age: 7.3 (SD 0.3) in 1st graders, 10.0 (SD 0.4) years in 4th graders Follow‐up: 2 years %E from fat: 26.6 (SD 4.9) in 1st graders, 25.2 (SD 5.1) in 4th graders BMI: 16.0 (SD 2.3) in 1st graders, 18.1 (SD 3.0) in 4th graders | 0 (Δ BMI) | Single dietary assessment Multiple linear regression modelling assessed relationships between baseline environmental factors, parental and lifestyle habits and change in BMI over 2 years. They found no statistically significant relationship between fat intake and change in BMI over 2 years (P value = 0.104) |
| Trial of Activity for Adolescent Girls (TAAG) Cohen 2014 (12) USA | 265 girls in 8th grade Age: mean 13.9 (SD 0.4) yrs Follow‐up: 2 and 3 yrs %E from fat: unclear BMI: mean 22.1 (SD 5.2) | 0 (BMI percentile) ‐ (% body fat) | Single dietary assessment Multivariable random coefficients model designed to examine whether habitual physical activity, diet and environmental exposure were predictive of future weight gain or percentage body fat. The multivariate model found no relationship between fat calories at baseline and BMI percentile (P value = 0.16), but suggested a reduction in % body fat associated with increased fat calories (P value = 0.03) |
| Viva la Familia Study Butte 2007 (13) USA | 1030 Hispanic boys and girls (unclear how many of each) Age: unclear, 4 to 19 yrs? Follow‐up: 1 yr %E from fat: 34.0 (6.0) BMI: not stated | + (Δ weight) | Single dietary assessment Analysis: %E from fat was positively correlated with 1 yr weight gain (kg/y). For 798 participants generalised estimating equations (GEE) suggested coefficient 0.044, SD 0.018, P value = 0.014 |
Key:
+ = positive ss relationship found between fat intake and weight outcome.
0 = no ss relationship found between fat intake and weight outcome.
‐ = negative (inverse) ss relationship found between fat intake and weight outcome.
Abbreviations: BMI: body mass index; DEXA: dual energy X‐ray absorptiometry; SD: standard deviation; SE: standard error; ss: statistically significant
References for this table:
(1) Magarey AM, Daniels LA, Boulton TJC, Cockington RA. Does fat intake predict adiposity in healthy children and adolescents aged 2‐15 y? A longitudinal analysis. European Journal of Clinical Nutrition 2001;55:471‐81.
(2) Twisk JWR, Kempner HCG, van Mechelen W, Post GB, van Lenthe FJ. Body fatness: longitudinal relationship of body mass index and the sum of skinfolds with other risk factors for coronary heart disease. International Journal of Obesity (Lond) 1998;22:915‐22.
(3) Koppes LLJ, Boon N, Nooyens ACJ, van Mechelen W, Saris WHM. Macronutrient distribution over a period of 23 years in relation to energy intake and body fatness. British Journal of Nutrition 2009;101:108‐15.
(4) Bogaert N, Steinbeck KS, Baur LA, Brock K, Bermingham MA. Food, activity and family ‐ environmental vs biochemical predictors of weight gain in children. European Journal of Clinical Nutrition 2003;57:1242‐9.
(5) Carruth BR, Skinner JD. The role of dietary calcium and other nutrients in moderating body fat in preschool children. International Journal of Obesity (Lond) 2001;25:559‐66.
(6) Skinner JD, Bounds W, Carruth BR, Morris M, Ziegler P. Predictors of children's body mass index: a longitudinal study of diet and growth in children aged 2‐8 years. International Journal of Obesity (Lond) 2004;28:476‐82.
(7) Davison KK, Birch LL. Child and parent characteristics as predictors of change in girls' body mass index. International Journal of Obesity (Lond) 2001;25:1834‐42.
(8) Rolland‐Cachera MF, Maillot M, Deheeger M, Souberbielle JC, Peneau S, Hercberg S, et al. Association of nutrition in early life with body fat and serum leptin at adult age. International Journal of Obesity 2013 Aug;37(8):1116‐22.
(9) Brixval CS, Anderson LB, Heitmann BL. Fat intake and weight development from 9 to 16 years of age: the European Youth Heart Study ‐ a Longitudinal Study. Obesity Facts 2009;3:166‐70.
(10) Klesges RC, Klesges LM, Eck LH, Shelton ML. A longitudinal analysis of accelerated weight gain in preschool children. Pediatrics 1995;95:126‐30.
(11) Lee HH, Park HA, Kang JH, Cho YG, Park JK, Lee R, et al. Factors related to body mass index and body mass index change in Korean children: preliminary results from the obesity and metabolic disorders cohort in childhood. Korean Journal of Family Medicine 2012 May;33(3):134‐43.
(12) Cohen DAG. Energy balance in adolescent girls: The trial of activity for adolescent girls cohort. Obesity (Silver Spring) 2014;22(3):772‐80.
(13) Butte NF, Cai G, Cole SA, Wilson TA, Fisher JO, Zakeri IF, et al. Metabolic and behavioral predictors of weight gain in Hispanic children: The Viva la Familia Study. American Journal of Clinical Nutrition 2007;85:1478‐85.
Excluded studies
Reasons for exclusion of the 345 adult RCTs that we read in full text but excluded from this review are found in Characteristics of excluded studies. Reasons for exclusion of child RCTs are found in Table 3, adult cohort studies in Table 4, and child cohort studies in Table 5, along with their references.
| Study | Reason for exclusion |
| Alexy U, Reinehr T, et al. (2006). Positive changes of dietary habits after an outpatient training program for overweight children. Nutrition Research 26(5): 202‐8 | Weight loss intention |
| Amesz EMS. Optimal growth and lower fat mass in preterm infants fed a protein‐enriched postdischarge formula. Journal of Pediatric Gastroenterology and Nutrition. 2010;50(2):200‐7 | Includes infants |
| Anand SS, Davis AD, et al. (2007). A family‐based intervention to promote healthy lifestyles in an aboriginal community in Canada. Canadian Journal of Public Health Revue Canadienne de Sante Publique. 98(6): 447‐52 | Weight loss intention |
| Angelopoulos PD, Milionis HJ, et al. (2009). Changes in BMI and blood pressure after a school based intervention: the CHILDREN study. European Journal of Public Health 19(3): 319‐25 | Multifactorial intervention |
| Burrows TJ. Long‐term changes in food consumption trends in overweight children in the HIKCUPS intervention. Journal of Pediatric Gastroenterology and Nutrition. 2011;53(5):543‐7 | All obese or overweight at baseline |
| Dal Molin Netto B, Landi Masquio DC, Da Silveira Campos RM, De Lima Sanches P, Campos Corgosinho F, Tock L, et al. The high glycemic index diet was an independent predictor to explain changes in agouti‐related protein in obese adolescents. Nutricion Hospitalaria. 2014;29(2):305‐14 | Obese adolescents |
| Evans RK, Franco RL, et al. (2009). Evaluation of a 6‐month multi‐disciplinary healthy weight management program targeting urban, overweight adolescents: effects on physical fitness, physical activity, and blood lipid profiles. International Journal of Pediatric Obesity 4(3): 130‐3 | Multifactorial intervention, weight loss goal |
| Forneris T, Fries E, et al. (2010). Results of a rural school‐based peer‐led intervention for youth: goals for health. Journal of School Health 80(2): 57‐65 | No relevant outcomes |
| Garnett SPB. Researching Effective Strategies to Improve Insulin Sensitivity in Children and Teenagers ‐ RESIST. A randomised control trial investigating the effects of two different diets on insulin sensitivity in young people with insulin resistance and/or pre‐diabetes. BMC Public Health. 2010;10(pp 575):2010. 2. Garnett SPD. Optimum macronutrient content of the diet for adolescents with pre‐diabetes; RESIST a randomised control trial ACTRN12608000416392. Endocrine Reviews. 2012;Conference(var.pagings) | All obese or overweight at baseline |
| Hernandez TLA. Women with gestational diabetes randomised to a low‐carbohydrate/higher fat diet demonstrate greater insulin resistance and infant adiposity. Diabetes. 2013;Conference(var.pagings):July | Effect on infants |
| Horan MKM. The association of maternal characteristics and macronutrient intake in pregnancy with neonatal body composition. Archives of Disease in Childhood: Fetal and Neonatal Edition. 2014;Conference(var.pagings):June | Infants |
| Jebb SA, Frost G, et al. (2007). The RISCK study: Testing the impact of the amount and type of dietary fat and carbohydrate on metabolic risk. Nutrition Bulletin 32(2): 154‐6 | Design paper |
| Kaitosaari T, Ronnemaa T, et al. (2006). Low‐saturated fat dietary counselling starting in infancy improves insulin sensitivity in 9‐year‐old healthy children: the Special Turku Coronary Risk Factor Intervention Project for Children (STRIP) study. Diabetes Care 29(4): 781‐5 | No relevant outcomes |
| Lagstrom H, Hakanen M, et al. (2008) Growth patterns and obesity development in overweight or normal‐weight 13‐year‐old adolescents: the STRIP study. Pediatrics 122(4): e876‐83 | No relevant exposures |
| Mirza NM, Palmer MG, Sinclair KB, McCarter R, He J, Ebbeling CB, et al. Effects of a low glycemic load or a low‐fat dietary intervention on body weight in obese Hispanic American children and adolescents: a randomised controlled trial. American Journal of Clinical Nutrition. 2013;97(2):276‐85 | All obese at baseline |
| Mobley CCS. Effect of nutrition changes on foods selected by students in a middle school‐based diabetes prevention intervention program: The HEALTHY experience. Journal of School Health. 2012;82(2):82‐90 | No total fat intake assessment |
| Niinikoski H, Lagstrom H, Jokinen E, Siltala M, Ronnemaa T, Viikari J, et al. Impact of repeated dietary counselling between infancy and 14 years of age on dietary intakes and serum lipids and lipoproteins: the STRIP study. Circulation. 2007;116(9):1032‐40 | Aim to reduce saturated fat not total fat |
| Ramon‐Krauel MS. A low‐glycemic‐load versus low‐fat diet in the treatment of fatty liver in obese children. Childhood Obesity. 2013;9(3):252‐60 | All obese at baseline |
| Shalitin S, Ashkenazi‐Hoffnung L, et al. (2010). Effects of a twelve‐week randomised intervention of exercise and/or diet on weight loss and weight maintenance, and other metabolic parameters in obese preadolescent children. Hormone Research 72(5): 287‐301 | Weight loss/unsuitable exposures |
| Sharma SF. One‐year change in energy and macronutrient intakes of overweight and obese inner‐city African American children: Effect of community‐based Taking Action Together type 2 diabetes prevention program. Eating Behaviors. 2012;13(3):271‐4 | All obese or overweight at baseline |
| Singhal A, Kennedy K, Lanigan J, Fewtrell M, Cole TJ, Stephenson T, et al. Nutrition in infancy and long‐term risk of obesity: evidence from 2 randomised controlled trials. American Journal of Clinical Nutrition. 2010;92(5):1133‐44 | Infants |
| Thakwalakwa C, Ashorn P, Phuka J, Cheung YB, Briend A, Puumalainen T, et al. A lipid‐based nutrient supplement but not corn‐soy blend modestly increases weight gain among 6‐ to 18‐month‐old moderately underweight children in rural Malawi. Journal of Nutrition 2010;140(11):2008‐13 | Duration < 26 weeks |
| Williamson DA, Han H, Johnson WD, Martin CK, Newton RL, Jr. Modification of the school cafeteria environment can impact childhood nutrition. Results from the Wise Mind and LA Health studies. Appetite. 2013;61(1):77‐84 | Weight loss aimed |
| Williamson DA, Copeland AL, et al. (2007). Wise Mind project: a school‐based environmental approach for preventing weight gain in children. Obesity 15(4): 906‐17 | Multifactorial intervention |
| Study | Reason for exclusion |
| Adams T, Rini A (2007). Predicting 1‐year change in body mass index among college students. Journal of American College Health 55(6): 361‐5 | No relevant exposures |
| Aerenhouts D, Deriemaeker P, Hebbelinck M, Clarys P, Aerenhouts D, Deriemaeker P, et al. Energy and macronutrient intake in adolescent sprint athletes: a follow‐up study. Journal of Sports Sciences. 2011;29(1):73‐82 | No relationship between total fat and body fatness |
| Ahluwalia N, Ferrieres J, et al. (2009). Association of macronutrient intake patterns with being overweight in a population‐based random sample of men in France. Diabetes & Metabolism 35(2): 129‐36 | Invalid study design |
| Aljadani HM, Patterson A, Sibbritt D, Hutchesson MJ, Jensen ME, Collins CE. Diet quality, measured by fruit and vegetable intake, predicts weight change in young women. Journal of Obesity. 2013;2013:525161 | No relevant outcomes |
| Almoosawi S, Prynne CJ, Hardy R, Stephen AM. Time‐of‐day and nutrient composition of eating occasions: prospective association with the metabolic syndrome in the 1946 British birth cohort. International Journal of Obesity. 2013;37(5):725‐31 | No total fat assessment |
| Al‐Sarraj T, Saadi H, et al. (2010). Metabolic syndrome prevalence, dietary intake, and cardiovascular risk profile among overweight and obese adults 18‐50 years old from the United Arab Emirates. Metabolic Syndrome & Related Disorders 8(1): 39‐46 | Cross‐sectional study |
| Althuizen E, van Poppel MN, de Vries JH, Seidell JC, van MW, Althuizen E, et al. Postpartum behaviour as predictor of weight change from before pregnancy to one year postpartum. BMC Public Health. 2011;11:165 | Total fat assessment is not baseline |
| Bailey BWS. Dietary predictors of visceral adiposity in overweight young adults. British Journal of Nutrition. 2010;103(12):1702‐5 | Cross‐sectional |
| Berg CM, Lappas G, et al. (2008). Food patterns and cardiovascular disease risk factors: the Swedish INTERGENE research program. American Journal of Clinical Nutrition 88(2): 289‐97 | Invalid study design |
| Bes‐Rastrollo M, van Dam RM, et al. (2008) Prospective study of dietary energy density and weight gain in women. American Journal of Clinical Nutrition 88(3): 769‐77 | Not total fat to body fatness |
| Black MHW. High‐fat diet is associated with obesity‐mediated insulin resistance and beta‐cell dysfunction in Mexican Americans. Journal of Nutrition. 2013;143(4):479‐85. 2. Black MHW. Variants in PPARG interact with high‐fat diet to influence longitudinal decline in beta‐cell function in Mexican Americans at risk for type 2 diabetes (T2D). Diabetes. 2014;Conference(var.pagings):June | Not prospective |
| Bujnowski D, Xun P, Daviglus ML, Van HL, He K, Stamler J, et al. Longitudinal association between animal and vegetable protein intake and obesity among men in the United States: the Chicago Western Electric Study. Journal of the American Dietetic Association. 2011;111(8):1150‐5 | No total fat intake assessment |
| Carvalho LKB. Annual variation in body fat is associated with systemic inflammation in chronic kidney disease patients Stages 3 and 4: A longitudinal study. Nephrology Dialysis Transplantation. 2012;27(4):1423‐8 | No total fat assessment and chronic kidney disease |
| Castellanos DC, Connell C, Lee J. Factors affecting weight gain and dietary intake in Latino males residing in Mississippi: a preliminary study. Hispanic Health Care International. 2011;9(2):91‐8 | Cross‐sectional |
| Chang A, Van Horn L, Jacobs Jr DR, Liu K, Muntner P, Newsome B, et al. Lifestyle‐related factors, obesity, and incident microalbuminuria: the CARDIA (Coronary Artery Risk Development in Young Adults) Study. American Journal of Kidney Diseases. 2013;62(2):267‐75 | Assesses dietary patterns |
| Chopra VP. Dietary factors affecting weight gain in midlife women. FASEB Journal. 2013;Conference(var.pagings):April | All overweight or obese at baseline |
| de Groot S, Post MW, Snoek GJ, Schuitemaker M, van der Woude LH. Longitudinal association between lifestyle and coronary heart disease risk factors among individuals with spinal cord injury. Spinal Cord. 2013;51(4):314‐8 | No total fat assessment |
| de Koning L, Malik VS, Kellogg MD, Rimm EB, Willett WC, Hu FB. Sweetened beverage consumption, incident coronary heart disease, and biomarkers of risk in men. Circulation. 2012;125(14):1735‐41 | No body fatness outcomes |
| Dujmovic M, Kresic G, Mandic ML, Kenjeric D, Cvijanovic O, Dujmovic M, et al. Changes in dietary intake and body weight in lactating and non‐lactating women: prospective study in northern coastal Croatia. Collegium Antropologicum. 2014;38(1):179‐87 | Follow‐up < 1 year |
| Eghtesadi SS‐K. Dietary patterns predicting changes in obesity indices (BMI,WC,WHR) in longitudinal Tehran lipid and glucose study. Annals of Nutrition and Metabolism. 2013;Conference(var.pagings):2013 | No total fat intake assessment |
| Erber E, Hopping BN, Grandinetti A, Park SY, Kolonel LN, Maskarinec G. Dietary patterns and risk for diabetes: the multiethnic cohort. Diabetes Care. 2010;33(3):532‐8 | No total fat intake assessment and no body fatness outcomes |
| Ericson U, Rukh G, Stojkovic I, Sonestedt E, Gullberg B, Wirfalt E, et al. Sex‐specific interactions between the IRS1 polymorphism and intakes of carbohydrates and fat on incident type 2 diabetes. American Journal of Clinical Nutrition. 2013;97(1):208‐16 | Cross‐sectional |
| Hairston KGV. Lifestyle factors and 5‐year abdominal fat accumulation in a minority cohort: The IRAS family study. Obesity. 2012;20(2):421‐7 | No total fat intake assessment |
| Heppe DHMV. Maternal milk consumption, fetal growth, and the risks of neonatal complications: The Generation R Study. American Journal of Clinical Nutrition. 2011;94(2):501‐9 | Fetal growth assessment |
| Holmberg S, Thelin A, Holmberg S, Thelin A. High dairy fat intake related to less central obesity: a male cohort study with 12 years' follow‐up. Scandinavian Journal of Primary Health Care. 2013;31(2):89‐94 | No total fat intake assessment |
| Ibe YT. Food groups and weight gain in Japanese men. Clinical Obesity. 2014;4(3):157‐64 | No relationship between total fat and body fatness assessed |
| Jaacks LMG. Age, period and cohort effects on adult body mass index and overweight from 1991 to 2009 in China: The China Health And Nutrition Survey. International Journal of Epidemiology. 2013;42(3):828‐37 | No total fat intake assessment |
| Jaakkola JH. Eating behavior influences diet, weight, and central obesity in women after pregnancy. Nutrition. 2013;29(10):1209‐13 | No total fat intake assessment |
| Jarvandi S, Gougeon R, Bader A, Dasgupta K, Jarvandi S, Gougeon R, et al. Differences in food intake among obese and non‐obese women and men with type 2 diabetes. Journal of the American College of Nutrition. 2011;30(4):225‐32 | Cross‐sectional |
| Johns DJ, Ambrosini GL, Jebb SA, Sjöström L, Carlsson LMS, Lindroos AK. Tracking of an energy‐dense, high saturated fat, low‐fibre dietary pattern, foods and nutrient composition over 10 years in the severely obese. Journal of Human Nutrition & Dietetics. 2011;24(4):391‐2. 2. Johns DJ, Lindroos AK, Jebb SA, Sjostrom L, Carlsson LM, Ambrosini GL, et al. Tracking of a dietary pattern and its components over 10‐years in the severely obese. PLoS One [Electronic Resource]. 2014;9(5):e97457 | No relevant outcomes |
| Kimokoti RWG. Dietary patterns of women are associated with incident abdominal obesity but not metabolic syndrome. Journal of Nutrition. 2012;142(9):1720‐7. 2. Kimokoti RWN. Diet quality, physical activity, smoking status, and weight fluctuation are associated with weight change in women and men. Journal of Nutrition. 2010;140(7):1287‐93 | No total fat intake assessment |
| Kirk JK, Craven T, Lipkin EW, Katula J, Pedley C, O'Connor PJ, et al. Longitudinal changes in dietary fat intake and associated changes in cardiovascular risk factors in adults with type 2 diabetes: the ACCORD trial. Diabetes Research & Clinical Practice. 2013;100(1):61‐8 | Compares PEP score, not total fat |
| Ko GTC, Chan JCN, et al. (2007). Associations between dietary habits and risk factors for cardiovascular diseases in a Hong Kong Chinese working population‐‐the "Better Health for Better Hong Kong" (BHBHK) health promotion campaign. Asia Pacific Journal of Clinical Nutrition 16(4): 757‐65 | No relevant exposures |
| Laatikainen T, Philpot B, Hankonen N, Sippola R, Dunbar JA, Absetz P, et al. Predicting changes in lifestyle and clinical outcomes in preventing diabetes: The Greater Green Triangle Diabetes Prevention Project. Preventive Medicine. 2012;54(2):157‐61 | No relevant outcomes |
| Manios Y, Kourlaba G, Grammatikaki E, Androutsos O, Ioannou E, Roma‐Giannikou E, et al. Comparison of two methods for identifying dietary patterns associated with obesity in preschool children: the GENESIS study. European Journal of Clinical Nutrition. 2010;64(12):1407‐14 | Cross‐sectional |
| Meidtner KF. Variation in genes related to hepatic lipid metabolism and changes in waist circumference and body weight. Genes and Nutrition. 2014;9(2) | No total fat intake assessment |
| Mejean C, Macouillard P, Castetbon K, Kesse‐Guyot E, Hercberg S, Mejean C, et al. Socio‐economic, demographic, lifestyle and health characteristics associated with consumption of fatty‐sweetened and fatty‐salted foods in middle‐aged French adults. British Journal of Nutrition. 2011;105(5):776‐86 | No total fat intake assessment |
| Mirmiran PB. Association between dietary phytochemical index and 3‐year changes in weight, waist circumference and body adiposity index in adults: Tehran Lipid and Glucose study. Nutrition and Metabolism. 2012(9):108 | No assessment of total fat on body fatness |
| Moran LJ, Ranasinha S, Zoungas S, McNaughton SA, Brown WJ, Teede HJ, et al. The contribution of diet, physical activity and sedentary behaviour to body mass index in women with and without polycystic ovary syndrome. Human Reproduction. 2013;28(8):2276‐83 | Cross‐sectional |
| Mozaffarian D, Cao H, King IB, Lemaitre RN, Song X, Siscovick DS, et al. Circulating palmitoleic acid and risk of metabolic abnormalities and new‐onset diabetes. American Journal of Clinical Nutrition. 2010;92(6):1350‐8 | No body fatness outcomes |
| Naniwadekar AS. Nutritional assessment of patients with chronic pancreatitis and impact of dietary advice. Gastroenterology. 2010;Conference(var.pagings):S393 | Pancreatitis patients |
| Neeland IJT. Dysfunctional adiposity and the risk of prediabetes and type 2 diabetes in obese adults. JAMA ‐ Journal of the American Medical Association. 2012;308(11):1150‐9 | No total fat intake assessment |
| Niu J, Seo DC, Niu J, Seo DC. Central obesity and hypertension in Chinese adults: a 12‐year longitudinal examination. Preventive Medicine. 2014;62:113‐8 | No relevant outcomes |
| Noori N, Dukkipati R, Kovesdy CP, Sim JJ, Feroze U, Murali SB, et al. Dietary omega‐3 fatty acid, ratio of omega‐6 to omega‐3 intake, inflammation, and survival in long‐term hemodialysis patients. American Journal of Kidney Diseases. 2011;58(2):248‐56 | No total fat assessment and haemodialysis patients |
| Plotnikoff RC, Karunamuni N, et al. (2009) An examination of the relationship between dietary behaviours and physical activity and obesity in adults with type 2 diabetes. Canadian Journal of Diabetes 33(1): 27‐34 | No relevant exposures |
| Qi QR. Consumption of branched chain amino acids and risk of coronary heart disease in us men and women. Circulation. 2013;Conference(var.pagings) | No total fat intake on weight assessment |
| Quatromoni PA, Pencina M, Cobain MR, Jacques PF, D'Agostino RB. Dietary quality predicts adult weight gain: findings from the Framingham Offspring Study. Obesity (Silver Spring, Md). 2006;14(8):1383‐91 | No relevant outcomes |
| Rautiainen SW. Dairy consumption and risk of becoming overweight or obese in middle‐aged and older women. Circulation. 2014;Conference(var.pagings):25 | No total fat intake assessment |
| Rukh G, Sonestedt E, Melander O, Hedblad B, Wirfalt E, Ericson U, et al. Genetic susceptibility to obesity and diet intakes: association and interaction analyses in the Malmo Diet and Cancer Study. Genes & Nutrition. 2013;8(6):535‐47 | Not prospective |
| Sammel MD, Grisson JA, Freeman EW, Hollander L, Liu L, Liu S, et al. Weight gain among women in the late reproductive years. Family Practice 2003; 20: 401–9 | No total fat assessment |
| Sanchez‐Villegas A, Bes‐Rastrollo M, Martinez‐Gonzalez MA, Serra‐Majem L. Adherence to a Mediterranean dietary pattern and weight gain in a follow‐up study: the SUN cohort. International Journal of Obesity 2006; 30: 350–8 | No relevant outcomes |
| Sayon‐Orea CB‐R. Longitudinal association between yogurt consumption and weight gain, and the risk of overweight/obesity: The SUN cohort study. Obesity Facts. 2014;Conference(var.pagings):May | No total fat intake assessment |
| Scholz U, Ochsner S, Hornung R, Knoll N, Scholz U, Ochsner S, et al. Does social support really help to eat a low‐fat diet? Main effects and sex differences of received social support within the Health Action Process Approach. Applied Psychology. 2013;Health and Well‐being. 5(2):270‐90 | All obese or overweight at baseline |
| Schulz M, Kroke A, Liese AD, Hoffmann K, Bergmann MM, Boeing H. Food groups as predictors for short‐term weight changes in men and women of the EPIC Potsdam cohort. Journal of Nutrition 2002; 132: 1335–40 | No total fat assessment |
| Sherafat‐Kazemzadeh R, Egtesadi S, Mirmiran P, Gohari M, Farahani SJ, Esfahani FH, et al. Dietary patterns by reduced rank regression predicting changes in obesity indices in a cohort study: Tehran Lipid and Glucose Study. Asia Pacific Journal of Clinical Nutrition. 2010;19(1):22‐32.2. Sherafat‐Kazemzadeh R, Egtesadi S, Mirmiran P, Hedayati M, Gohari M, Vafa M, et al. Predicting of changes in obesity indices regarding to dietary patterns in longitudinal Tehran lipid and glucose study. Iranian Journal of Endocrinology & Metabolism. 2010;12(2):197 | No assessment of total fat on body fatness |
| Simpson A, Maynard V, Simpson A, Maynard V. A longitudinal study of the effect of Antarctic residence on energy dynamics and aerobic fitness. International Journal of Circumpolar Health. 2012;71:17227 | No total fat intake assessment |
| Tanisawa KI. Strong influence of dietary intake and physical activity on body fatness in elderly Japanese men: age‐associated loss of polygenic resistance against obesity. Genes and Nutrition. 2014;9(5) | Cross‐sectional |
| Threapleton DE, Greenwood DC, Burley VJ, Aldwairji M, Cade JE, Threapleton DE, et al. Dietary fibre and cardiovascular disease mortality in the UK Women's Cohort Study. European Journal of Epidemiology. 2013;28(4):335‐46 | No total fat intake assessment |
| Vadiveloo M, Scott M, Quatromoni P, Jacques P, Parekh N, Vadiveloo M, et al. Trends in dietary fat and high‐fat food intakes from 1991 to 2008 in the Framingham Heart Study participants. British Journal of Nutrition. 2014;111(4):724‐34. 2. Vadiveloo MS. Increases in dietary fat intake among the Framingham heart study participants: Trends from 1991‐2008. Circulation. 2012;Conference(var.pagings) | No assessment of total fat on body fatness |
| Verheijden MW, van der Veen JE, van Zadelhoff WM, Bakx C, Koelen MA, van den Hoogen HJ, et al. Nutrition guidance in Dutch family practice: behavioral determinants of reduction of fat consumption. American Journal of Clinical Nutrition. 2003;77(4 Suppl):1058s‐64s | No relevant outcomes |
| Wang HT. Longitudinal association between dairy consumption and changes of body weight and waist circumference: The Framingham Heart Study.International Journal of Obesity. 2014;38(2):299‐305 | No total fat intake assessment |
| Wolongevicz DM, Zhu L, Pencina MJ, Kimokoti RW, Newby PK, D'Agostino RB, et al. Diet quality and obesity in women: the Framingham Nutrition Studies. British Journal of Nutrition. 2010;103(8):1223‐9 | No relevant outcomes |
| Yadav VM. Effects of a low fat plant based diet in multiple sclerosis (MS): results of a 1‐year long randomised controlled (RC) study. Neurology. 2014;Conference(var.pagings) | Multiple sclerosis patients |
| Yin JQ. Maternal diet, breastfeeding and adolescent body composition: A 16‐year prospective study. European Journal of Clinical Nutrition. 2012;66(12):1329‐34 | No total fat intake assessment |
| Yoshimura YK. Relations of nutritional intake to age, sex and body mass index in Japanese elderly patients with type2 diabetes: The Japanese Elderly Diabetes Intervention Trial. Geriatrics and Gerontology International. 2012;12(SUPPL.1):29‐40 | Cross‐sectional |
| Younossi ZMS. Prevalence and independent predictors of non‐alcoholic fatty liver disease (NAFLD) in lean U.S population. Hepatology. 2011;Conference(var.pagings):October | NAFLD |
| Yuan BD. Study on transition of dietary patterns in Jiangsu province, 1989‐2009, China. FASEB Journal. 2011;Conference(var.pagings):April. 2. Yuan BD. Nutrition transition in Jiangsu, China, 1989‐2009. Annals of Nutrition and Metabolism. 2013;Conference(var.pagings):2013 | No total fat intake assessment |
| Zamora D, Gordon‐Larsen P, Jacobs DR, Jr., Popkin BM, Zamora D, Gordon‐Larsen P, et al. Diet quality and weight gain among black and white young adults: the Coronary Artery Risk Development in Young Adults (CARDIA) Study (1985‐2005). American Journal of Clinical Nutrition. 2010;92(4):784‐93 | No assessment of total fat on body fatness |
| Zelber‐Sagi SL. Non‐alcoholic fatty liver disease (NAFLD) independently predicts type‐2 diabetes and pre‐diabetes during a seven‐year prospective follow‐up. Journal of Hepatology. 2012;Conference(var.pagings):April | No relevant outcomes |
| Study | Reason for exclusion |
| Alexy U, Libuda L, Mersmann S, Kersting M, Alexy U, Libuda L, et al. Convenience foods in children's diet and association with dietary quality and body weight status. European Journal of Clinical Nutrition. 2011;65(2):160‐6 | Not longitudinal |
| Ambrosini GLE. Identification of a dietary pattern prospectively associated with increased adiposity during childhood and adolescence. International Journal of Obesity (2005). 2012;36(10):1299‐305. 2.Ambrosini GLE. Tracking a dietary pattern associated with increased adiposity in childhood and adolescence. Obesity. 2014;22(2):458‐65. 3. Ambrosini GLL. An energy‐dense, high fat, low fibre dietary pattern is prospectively associated with greater adiposity in adolescent girls in the Avon longitudinal study of parents and children. Obesity Reviews. 2010;Conference(var.pagings):July | No total fat intake assessment |
| Barton AJ, Gilbert L, et al. (2006). Cardiovascular risk in Hispanic and non‐Hispanic preschoolers. Nursing Research 55(3): 172‐9 | Cross‐sectional study |
| Berz JP, Singer MR, Guo X, Daniels SR, Moore LL, Berz JPB, et al. Use of a DASH food group score to predict excess weight gain in adolescent girls in the National Growth and Health Study. Archives of Pediatrics & Adolescent Medicine. 2011;165(6):540‐6 | No total fat assessment |
| Bigornia SJL. Dairy intakes at age 10 years do not adversely affect risk of excess adiposity at 13 years. Journal of Nutrition. 2014;144(7):1081‐90 | No total fat assessment |
| Boreham C, Twisk J, van Mechelen W, Savage M, Strain J, Cran G. Relationships between the development of biological risk factors for coronary heart disease and lifestyle parameters during adolescence: The Northern Ireland Young Hearts Project. Public Health. 1999;113(1):7‐12 | No relevant outcomes |
| Burke V, Beilin LJ, Simmer K, Oddy WH, Blake KV, Doherty D, et al. Predictors of body mass index and associations with cardiovascular risk factors in Australian children: a prospective cohort study.International Journal of Obesity (Lond). 2005;29(1):15‐23 | No baseline fat intake |
| Burke V, Beilin LJ, et al. (2006). Television, computer use, physical activity, diet and fatness in Australian adolescents. International Journal of Pediatric Obesity 1(4): 248‐55 | Cross‐sectional study |
| Chaput J‐P, Tremblay A, et al. (2008). A novel interaction between dietary composition and insulin secretion: effects on weight gain in the Quebec Family Study. American Journal of Clinical Nutrition 87(2): 303‐9 | No relevant exposures |
| Davis JN, Alexander KE, et al. Inverse relation between dietary fiber intake and visceral adiposity in overweight Latino youth. American Journal of Clinical Nutrition 2009; 90(5): 1160‐6 | Unsuitable analyses |
| Deshmukh UJ. Growth and body composition changes in Indian undernourished children. Annals of Nutrition and Metabolism. 2013;Conference(var.pagings):2013 | No relevant outcomes |
| Dubois L, Farmer A, et al. (2007). Regular sugar‐sweetened beverage consumption between meals increases risk of overweight among preschool‐aged children. Journal of the American Dietetic Association 107(6): 924‐34 | Invalid study design |
| Elliott SAT. Associations of body mass index and waist circumference with: energy intake and percentage energy from macronutrients, in a cohort of Australian children. Nutrition Journal. 2011;10(1) | Cross‐sectional |
| Enes CC, Slater B, Enes CC, Slater B. Variation in dietary intake and physical activity pattern as predictors of change in body mass index (BMI) Z‐score among Brazilian adolescents. Revista Brasileira de Epidemiologia. 2013;16(2):493‐501 | Not prospective |
| Faith MS, Dennison BA, et al. (2006). Fruit juice intake predicts increased adiposity gain in children from low‐income families: weight status‐by‐environment interaction. Pediatrics 118(5): 2066‐75 | No relevant exposures |
| Frohnert BIJ. Relation between serum free fatty acids and adiposity, insulin resistance, and cardiovascular risk factors from adolescence to adulthood. Diabetes. 2013;62(9):3163‐9 | No total fat assessment |
| Heppe DH, Kiefte‐de Jong JC, Durmus B, Moll HA, Raat H, Hofman A, et al. Parental, fetal, and infant risk factors for preschool overweight: the Generation R Study. Pediatric Research. 2013;73(1):120‐7 | No total fat intake assessment |
| Hooley M, Skouteris H, Millar L, Hooley M, Skouteris H, Millar L. The relationship between childhood weight, dental caries and eating practices in children aged 4‐8 years in Australia, 2004‐2008. Pediatric Obesity. 2012;7(6):461‐70 | No total fat intake assessment |
| Hopkins DS. The effect on growth of using cows milk as the main drink for infants. Annals of Nutrition and Metabolism. 2011;Conference(var.pagings):October | Infants |
| Huh SYR. Prospective association between milk intake and adiposity in preschool‐aged children. Journal of the American Dietetic Association. 2010;110(4):563‐70 | No total fat intake assessment |
| Humenikova L, Gates GE (2007). Dietary intakes, physical activity, and predictors of child obesity among 4‐6th graders in the Czech Republic. Central European Journal of Public Health 15(1): 23‐8 | Cross‐sectional |
| Isharwal S, Arya S, et al. (2008). Dietary nutrients and insulin resistance in urban Asian Indian adolescents and young adults. Annals of Nutrition & Metabolism 52(2): 145‐51 | Invalid study design |
| Kagura J, Feeley AB, Micklesfield LK, Pettifor JM, Norris SA, Kagura J, et al. Association between infant nutrition and anthropometry, and pre‐pubertal body composition in urban South African children. Journal of Developmental Origins of Health and Disease. 2012;3(6):415‐23 | No total fat intake assessment |
| Khalil HM. Developmental trajectories of body mass index (BMI) from birth to late childhood and their relation with paternal and child nutrients intake. Obesity Facts. 2014;Conference(var.pagings):May | No relevant outcomes |
| Labayen I, Ruiz JR, Ortega FB, Huybrechts I, Rodríguez G, Jiménez‐Pavón D, et al. High fat diets are associated with higher abdominal adiposity regardless of physical activity in adolescents; the HELENA study. Clinical Nutrition. 2014;33(5):859‐66 | Cross‐sectional |
| Li SF. Dairy consumption with onset of overweight and obesity among U.S. adolescents.FASEB Journal. 2014;Conference(var.pagings) | No total fat intake assessment |
| Magnussen CG, Thomson R, Cleland VJ, Ukoumunne OC, Dwyer T, Venn A, et al. Factors affecting the stability of blood lipid and lipoprotein levels from youth to adulthood: evidence from the Childhood Determinants of Adult Health Study. Archives of Pediatrics & Adolescent Medicine. 2011;165(1):68‐76 | No relevant outcomes |
| Manios Y. (2006). Design and descriptive results of the "Growth, Exercise and Nutrition Epidemiological Study in preSchoolers": The GENESIS Study. BMC Public Health 6(32) | No fat to weight relationship |
| Mete MS. Dietary patterns and depression in a population with high prevalence of obesity: The strong heart family study. Circulation. 2012;Conference(var.pagings) | No total fat intake assessment |
| Millar L, Rowland B, Nichols M, Swinburn B, Bennett C, Skouteris H, et al. Relationship between raised BMI and sugar sweetened beverage and high fat food consumption among children. Obesity. 2014;22(5):E96‐103. 2. Millar LMR. Sugar sweetened beverage and high fat food consumption are related to raised BMI z‐scores among a cohort of Australian children from 4 to 10 years of age. Obesity Facts. 2013;Conference(var.pagings):May. | No total fat assessment |
| Oldewage‐Theron W, Napier C, Egal A. Dietary fat intake and nutritional status indicators of primary school children in a low‐income informal settlement in the Vaal region... [corrected] [published erratum appears in S AFR J CLIN NUTR 2011; 24(3):164]. South African Journal of Clinical Nutrition. 2011;24(2):99‐104 | Cross‐sectional |
| Pala VL. Dietary patterns and longitudinal change in body mass in European children: a follow‐up study on the IDEFICS multicenter cohort. European Journal of Clinical Nutrition. 2013;67(10):1042‐9 | No total fat intake assessment |
| Pan A, Malik VS, Hao T, Willett WC, Mozaffarian D, Hu FB, et al. Changes in water and beverage intake and long‐term weight changes: results from three prospective cohort studies. International Journal of Obesity. 2013;37(10):1378‐85 | No total fat intake assessment |
| Puengputtho WL. Salt intake and salt reduction in secondary school‐age students of Princess Chulabhorn's College Chiangrai (Regional science school). Annals of Nutrition and Metabolism. 2013;Conference(var.pagings):2013 | No total fat intake on weight assessment |
| Riedel CV. Interactions of genetic and environmental risk factors with respect to body fat mass in children: Results from the ALSPAC study. Obesity. 2013;21(6):1238‐42 | No total fat intake assessment |
| Scharf RJ, Demmer RT, Deboer MD. Longitudinal evaluation of milk type consumed and weight status in preschoolers. Archives of Disease in Childhood. 2013;98(5):335‐40 | No total fat intake assessment |
| Serra‐Majem L, Aranceta‐Bartrina J, et al. Prevalence and determinants of obesity in Spanish children and young people. British Journal of Nutrition. 2006;96 Suppl 1: S67‐72 | Cross‐sectional |
| Vazaiou AP. Protein intake of toddlers in Greece and its nutritional consequences. Hormone Research in Paediatrics. 2011;Conference(var.pagings):October | No assessment of total fat on body fatness |
| Weijs PJM. High beverage sugar as well as high animal protein intake at infancy may increase overweight risk at 8 years: a prospective longitudinal pilot study. Nutrition Journal. 2011;10(1) | Infants |
| Williams CL, Strobino BA. Childhood diet, overweight, and CVD risk factors: the Healthy Start project. Preventive Cardiology. 2008;11(1):11‐20 | No relevant outcomes |
| Wosje KS, Khoury PR, Claytor RP, Copeland KA, Hornung RW, Daniels SR, et al. Dietary patterns associated with fat and bone mass in young children. American Journal of Clinical Nutrition. 2010;92(2):294‐303 | No total fat intake assessment |
| Yin JQ. Maternal diet, breastfeeding and adolescent body composition: A 16‐year prospective study. European Journal of Clinical Nutrition. 2012;66(12):1329‐34 | No total fat intake assessment |
| Zaki MH. Identifying obesogenic dietary factors among Egyptian obese adolescents. Annals of Nutrition and Metabolism. 2013;Conference(var.pagings):2013 | No relevant outcomes |
| Zhang ZG. Added sugar intake and lipids profile among us adolescents: Nhanes 2005‐2010. Circulation. 2014;Conference(var.pagings):25 | Cross‐sectional |
Risk of bias in included studies
To understand the risk of bias in the individual included RCTs in a visual way, see Figure 2. 'Risk of bias' assessments of included adult cohort analyses are found in Table 6, and of child and young people's cohort analyses in Table 7.

'Risk of bias' summary: review authors' judgements about each methodological quality item for each included adult and child RCT comparison.
| Study | Number lost to follow‐up | Baseline similarity by total fat intake, funding, control groups | Adjustments (where stratified not counted as not being adjusted)* | Method of assessment | Risk of bias** |
| CARDIA Ludwig 1999 (1) USA | 5111 attended original screening, 3609 attended at years 1, 7 and 10, 2909 included in analysis 43% lost or not analysed Reasons: exclusion of those who were pregnant or lactating, with diabetes, on lipid or BP medication or with extreme dietary factors | Different. Those with lower total fat intake were more likely to be women, non‐smokers, more physically active, with higher alcohol and vitamin supplement intake Funded by: NHLBI, NIDDKD Control group: internal | Weight was adjusted for baseline weight. Analysis adjusted for energy, sex, age, field centre, education, energy intake, physical activity, cigarette smoking, alcohol intake, vitamin supplement use. All adjusted for | Interviewer‐ administered FFQ (700 foods) Single (multiple dietary assessments – but appear to use baseline data only in analysis) | High |
| Danish Diet Cancer & Health Study Halkjaer 2009 (2‐4) Denmark | 57,043 at baseline, 44,897 re‐assessed 5 years later 21% lost or not analysed Reasons: 1781 had died, 435 emigrated, remainder did not want to participate or did not reply | Data not reported Unclear Funded by: National Danish Research Foundation, DiOGenes (EU funding) Control group: internal | BMI, energy, age, smoking, alcohol, wine, beer, spirits, sporting activity Not adjusted for ethnicity, or socioeconomic status | 192‐item semi‐quantitative FFQ checked by dietitian Single dietary assessment used | High |
| 57,053 at baseline, 22,433 included in 5‐year analysis. 61% lost or not analysed Reasons: excluded aged ≥ 60 years (baseline) or ≥ 65 years (follow‐up), did not attend follow‐up, illness at baseline or during follow‐up, average weight gain or loss > 5 kg/year or waist circumference > 7 cm/year, lack of blood sample or other baseline data | Data not reported. Unclear Funded by: National Danish Research Foundation, DiOGenes (EU funding) Control group: internal | Age, sex, physical activity, smoking, education, follow‐up time, fibre intake, glycaemic index, hormone treatment and baseline body weight or waist circumference (analysed as %E from fat, so adjusted for E) Not adjusted for ethnicity | 192‐item semi‐quantitative FFQ checked by dietitian Single dietary assessment used | High | |
| Danish MONICA Iqbal 2006 (5) Denmark | 2025 at baseline, 1762 re‐assessed 5 years later 13% lost or not analysed Reasons: missing or very high energy or unknown history of family obesity | Data not reported Unclear Funded by: Apotekerfonden & Danish Ministry for Health Control group: internal | Baseline BMI, age, physical activity, smoking, education level, cohort, volume, energy intake Not adjusted for ethnicity | Weighed 7‐day food record Single dietary assessment used | Moderate |
| Diabetes Control & Complications Trial (DCCT) & EDIC Cundiff 2012 (6) | 1441 at baseline, 1055 analysed at 14 to 19 years 27% lost or not analysed Reasons: omitted 137 with HbA1c > 9.5, otherwise losses not described in this publication Note: also analysed FAO/WHO data from 167 countries, but these appear cross‐sectional | Data not reported Unclear Funded by: Data collection by NIH, General Clinical Research Center Program (NCRR), analysis not funded Control group: internal | Energy, fibre, saturated, mono‐ and poly‐unsaturated fat, alcohol, exercise (probably) Not adjusted for age, sex, ethnicity or SES | 1 week food record (unclear whether recall or diary based) Multiple dietary assessments (baseline, 2, 5 yrs and completion averaged) | High |
| EPIC‐PANACEA Vergnaud 2013 (7) EPIC Beulens 2014 (8) | 521,448 recruited, 373,803 included in analysis 28% lost or not analysed Reasons: omitted 23,713 with missing or implausible baseline data, 121,866 with missing follow‐up weight, 2066 with implausible weight changes | Those with lower fat intake tended to be older, more physically active and less likely to smoke Dissimilar Funded by: EU and a wide range of charities and government funders Control group: internal | Adjusted for age, baseline BMI, study centre, weekday, season, total E (from non‐alcohol sources, and from alcohol sources), smoking, education, physical activity Not adjusted for ethnicity | Quant. dietary questionnaire of 88‐266 items (country‐specific) Single dietary assessment used | High |
| Unclear how many were included compared with recruited unclear% lost or not analysed Reasons: unclear | Data not reported Unclear Funded by: unclear Control group: internal | Adjustments unclear Not adjusted for … unclear | Country‐specific FFQs | High | |
| Health Professionals Follow‐Up Study (HPFUS) Coakley 1998 (9) USA | 36,353 returned 1992 questionnaires, of whom 19,478 were included in this analysis 46% lost or not analysed Reasons: 9345 had cancer, heart disease, diabetes or stroke, 7530 were missing key information | Data not reported Unclear Funded by: NIH and Centres for Disease Control Control group: internal | Baseline weight, energy, height, activity, TV viewing, high BP, high cholesterol Not adjusted for ethnicity, socioeconomic status | FFQ Single dietary assessment used | High |
| Melbourne Collaborative Cohort Study (MCCS) MacInnis 2013 (10) Australia | Of 9066 at baseline, 5879 included in analyses. 35% lost or not analysed Reasons: 656 died, 1894 declined, 21 did not have waist circumference or weight at follow‐up, and 616 lost ≥ 5 kg weight so excluded | Data not reported Unclear Funded by: Cancer Council Victoria, VicHealth, National Health and Medical Research Council Control group: internal | Weight adjusted for baseline weight, waist for baseline waist circumference. All adjusted for sex, age, physical activity, alcohol, education, smoking, marital status, SES, total energy intake. Not adjusted for ethnicity (all described as "Australian‐born" but > 20% born in Europe) | Self administered 121‐item FFQ developed for study Single dietary assessment used | High |
| Memphis Klesges 1992 (11‐13) USA | 417 were enrolled, 294 were included in weight change analysis, and 230 in the waist circumference change analysis 29% lost or not analysed (weight), 45% (waist) Reasons: "attrition" for weight change, no explanation of further losses for waist circumference data | Data not reported Unclear Funded by: NHLBI and Tennessee Centres of Excellence Control group: internal | Sex, age, pregnancy status, smoking, alcohol, family risk of obesity, energy intake, sports activity, work activity, leisure activity, change from baseline of energy, fat intake, activity, cigarettes Not adjusted for socioeconomic status | Willett's FFQ Single (multiple dietary assessments – but appear to be using baseline data in analysis) | High |
| NHANES Follow‐up Kant 1995 (14) USA | 14,407 were enrolled and eligible, 7147 were included in analysis. 50% lost or not analysed Reasons: no dietary info, unsatisfactory 24‐hour recalls, atypical intake, proxies, mistakes, pregnant or lactating participants, lack of weight data, death | Higher fat as %E associated with younger age, more smoking, higher levels of morbidity Funded by: unclear Control group: internal | Baseline age, race, education, BMI, energy intake, smoking, physical activity, duration of follow‐up, alcohol, morbidity, special diet, parity All adjusted for | 24‐hour dietary recall Single dietary assessment used | High |
| Nurses' Health Study Colditz 1990 (15) Field 2007 (16) USA | Of 121,700 women enrolled, 38,724 were eligible for this study, 31,940 women included in analyses 17% lost or not analysed Reasons: non‐respondent or invalid FFQ | Data not reported Unclear Funded by: NIH Control group: internal | Age, BMI, energy intake Not adjusted for ethnicity, physical activity, socioeconomic status | 61‐item FFQ Single dietary assessment used | High |
| Of 121,700 women enrolled, 41,518 included in analyses 66% lost or not analysed Reasons: of 121,700, 41,518 assessed in 1986 and at 8 years, were free of cancer, hypertension and diabetes, and eligible for this study | Greater fat intake associated with greater baseline weight Unclear Funded by: Boston Obesity Nutrition Research Center and National Cancer Institute Control group: internal | Age, baseline BMI, activity, menopausal status, smoking, protein intake, change in protein intake Not adjusted for ethnicity or SES | 136‐item FFQ in 1986 Single dietary assessment used | High | |
| Pawtucket HHP Parker 1997 (17) USA | Of 1081 enrolled, FFQ administered to random sub‐sample of 556, 465 included in analysis 16% lost or not analysed Reasons: those excluded were those who did not attend both relevant appointments, and were more male, less educated, less active, greater BMI | Data not reported Unclear Funded by: NHLBI Control group: internal | Age, BMI, energy, smoking, activity Not adjusted for sex, ethnicity or socioeconomic status | Willett's FFQ with categories added for fats, oils, sweets, snacks and dairy products Single dietary assessment used | High |
| San Luis Valley Diabetes Study (SLVDS) Mosca 2004 (18) USA | Of 1351 enrolled, 782 "included in analysis", unclear how many in prospective analysis unclear% lost or not analysed Reasons: unclear how many lost and how many excluded. Of 1351, 1027 had and 782 continued to have normal glucose tolerance tests, 140 altered smoking status or became pregnant and were excluded. 782 completed visit 1, 536 visit 2 and 375 visit 3 | Data not reported Unclear Funded by: not stated Control group: internal | Sex, ethnicity, physical activity, baseline BMI, age, smoking status, energy intake Not adjusted for SES | 24‐hour diet recall (bilingual interviewers) with visual aids for food portions | High |
| SEASONS Ma 2005 (19) USA | Of 1257 in original cohort, 641 completed baseline questionnaire and one blood draw, 572 included in analyses 11% lost or not analysed Reasons: unclear, did not attend further appointments | Data not reported Unclear Funded by: NHLBI Control group: internal | None (but analysed as %E from fat, so energy adjusted for indirectly) Not adjusted for age, sex, ethnicity, physical activity or socioeconomic status | 7‐day dietary recall Single (Multiple dietary assessments – but appear to be using baseline data in analysis) | High |
| Women's Gothenburg Lissner 1997 (20) Sweden | Of 1462 in main cohort, 437 randomly selected and asked for dietary information, 361 included in analysis. 17% lost or not analysed Reasons: 64 did not return for weight assessment, 12 had chronic illness so excluded | Higher fat as %E associated with younger age, higher energy intake, more walking and lifting at work, greater likelihood of being a smoker Funded by: Swedish Medical Research Council Control group: internal | Baseline body weight, activity, smoking, age, energy Not adjusted for ethnicity or socioeconomic status | Dietary interview including frequency of 69 food items Single dietary assessment used | High |
*Of age, sex, energy intake, ethnicity, physical activity (and/or TV watching) and socioeconomic (which includes educational) status.
**Moderate risk of bias was suggested where < 20% were lost to follow‐up, up to two factors were unadjusted for in the design or analysis, and diet was assessed using a 24‐hour recall or diet diary. All other studies were at high risk of bias.
Reference numbers relate to references below Table 1.
Abbreviations: BMI: body mass index; BP: blood pressure; FAO: Food and Agriculture Organization; FFQ: food frequency questionnaire; NIH: National Institutes of Health; NHLBI: National Heart, Lung and Blood Institute; NIDDKD: National Institute of Diabetes and Digestive and Kidney Diseases; SES: socioeconomic status; WHO: World Health Organization
| Study | Number lost to follow‐up | Baseline similarity, funding, control group | Adjustments* | Method of dietary assessment | Risk of bias** |
| Adelaide Nutrition Study Magarey 2001 (1) Australia | Of 500 recruited to ANS at birth only 130 were seen at age 11, so a further 113 from a separate cohort were added at age 11 ˜74% lost (varied for different follow‐ups) Reason: did not attend Lost characteristics: not stated | Data not reported Unclear Funded by: National Heart Foundation of Australia, Adelaide Children's Hospital Research Foundation, National Health and Medical Research Council of Australia Control group: internal | Adjusted for energy intake, previous adiposity, adiposity of parent at a specific age Not adjusted for sex, ethnicity, physical activity or SES (4) | 3‐day weighed food record | High |
| Amsterdam Growth & Health Long. Study (AGAHLS) Twisk 1998, Koppes 2009 (2;3) Netherlands | Of 307 13‐year olds recruited 181 were reassessed at age 27 41% lost Reason: unclear Lost characteristics: "for the variables of interest no drop‐out effects were observed" | Data not reported Unclear Funded by: Dutch Heart Foundation, Dutch Prevention Fund, Dutch Ministry of Wellbeing and Public Health, Dairy Foundation on Nutrition and Health, Netherlands Olympic Committee, Netherlands Sports Fed., no additional funding was stated for the 36‐year old analysis Control group: internal | Adjusted for physical activity, smoking, alcohol, dietary energy and macronutrient intake. Did not adjust for sex, would have if appropriate. Not adjusted for ethnicity, parental BMI, or SES (3) | Modified cross‐check dietary history interview relating to previous month | High |
| Of 698 13‐year olds recruited (those above plus another school with fewer assessments) 350 had complete data at age 36 50% lost Reason: unclear Lost characteristics: girls who completed follow‐up had slightly lower body fat %age, and boys who completed had lower tobacco and alcohol use at baseline | Carried out for boys and girls separately, at each age. Skinfold data (not % body fat) additionally adjusted for physical activity Not adjusted for ethnicity, parental BMI, physical activity or SES (4) | As above | High | ||
| Bogaert 2003 (4) Australia | Of 59 recruited, 41 were re‐assessed at 12 months 31% lost Reason: unclear Lost characteristics: unclear | Data not reported Unclear Funded by: Australian Rotary Health Found., Financial Markets Found. for Children, National Health & Medical Research Council Control group: internal | Adjustment not described (or not done) – unclear Assume not adjusted for age, sex, ethnicity, parental BMI, physical activity or SES (6) | 2 food records and 1 24‐hour recall from | High |
| Carruth & Skinner 2001 (5;6) USA | Of 72 recruited 53 took part at 70 months 26% lost Reason: 7 parents declined, 7 not in area, 5 could not be scheduled in timeframe Lost characteristics: unclear | Data not reported Unclear Funded by: Gerber products, Tennessee Agricultural Experiment Station Control group: internal | Adjusted for BMI (all children white and of same age) Not adjusted for sex, energy intake, parental BMI, physical activity or SES (5) | 3‐day dietary intake interviews by dietitian | High |
| 62 of 72 recruited (98 recruited at 2 mo of age), plus 2 added at 1 year and 6 added at 2 years took part unclear % lost Reason: as above? Lost characteristics: unclear | Adjusted for BMI at 2 years and adiposity rebound age, assessed across ages 2 to 8, all children white and "predominantly middle or upper socioeconomic status" Factors assessed but found non‐significant so not adjusted for included sex, TV‐watching, parental BMI All adjusted for (0) | 3‐day dietary intake interviews | High | ||
| Davison 2001 (7) | 197 participants at study entry, 192 re‐assessed 2 years later 3% lost Reason: unclear Lost characteristics: none stated | Data not reported Unclear Funded by: NIH Control group: internal | BMI, levels of activity, familial risk of overweight, change in BMI (mother), enjoyment of activity (father), total energy intake (father), and girls' percentage fat intake (girls). Not adjusted for SES (1) | 24‐hour dietary recall | Moderate |
| ELANCE Rolland‐Cachera 2013 (8) France | Unclear how many 10‐month olds, but 222 attended at 10 months and either 2 or 4 years, 73 attended at 20 years, 68 included in analyses. > 67% lost Reason: unclear Lost characteristics: "similar" between those lost to follow‐up and those included | Data not reported Unclear Funded by: Institut Benjamin Delessert Control group: internal | Total energy intake, sex, breast feeding, mother's BMI, father’s occupation Not adjusted for ethnicity or physical activity (2) | Dietary history (dietitian discussion of diet with parent over past month) | High |
| European Youth Heart Study Brixval 2009 (9) Denmark | 384 of 589 baseline children attended follow‐up, 308 in regression model 48% lost Reason: "due to ethical consideration it was not permitted to contact subjects who decided not to participate at follow‐up" Lost characteristics: not stated | Data not reported Unclear Funded by: not stated Control group: internal | Age, puberty status, total energy intake, parental income, activity, overweight parents, protein intake, birth weight. Presented by sex Not adjusted for ethnicity (1) | Interview and questionnaire of children and parents relating to past 24 hours | High |
| Klesges 1995 (10) USA | 203 children at baseline, 146 at follow‐up 28% lost Reason: unclear Lost characteristics: "no significant differences" (P value > 0.15) in BMI, energy intake, fat as %E, physical activity, sex or familial obesity risk between those attending at 2 years and those not attending | Data not reported Unclear Funded by: National Heart Lung and Blood Institute Control group: internal | Age, sex, BMI, physical activity Not adjusted for ethnicity, SES (2) | Dietary FFQ | High |
| OMDCC Lee 2012 (11) Korea | 2740+ baseline children (unclear), 1504 followed up 45% lost Reasons: "analytic sample" – no reasons given Lost characteristics: unclear | Data not reported Unclear Funded by: unclear Control group: internal | Age, sex, sexual maturation, baseline BMI, exercise, TV time, sleep, parental BMI and education, energy intake, food habits and household income Not adjusted for ethnicity (1) | 24‐hour recall for 2 weekdays and 1 weekend day | High |
| TAAG Cohen 2014 (12) | Of 303 randomly selected at baseline, 265 analysed 13% lost Reasons: 38 did not have complete data Lost characteristics: no difference in race, age, mother's education | Data not reported Unclear Funded by: National Heart Lung and Blood Institute Control group: internal | Age, ethnicity, physical activity Not adjusted for energy intake, parental BMI or SES (3) | FFQ | High |
| Viva la Familia Study Butte 2007 (13) USA | 1030 at baseline, with 879 returning after 1 year 15% lost Reasons: unclear Lost characteristics: none stated | Data not reported Unclear Funded by: NIH, USDA/ARS Control group: internal | Adjusted for sex, age, age squared, and Tanner stage and BMI status in Generalised Estimating Equations Not adjusted for parental BMI, physical activity and SES (3) | 24‐hour recall, measured by a registered dietitian | High |
* Of age, sex, energy intake, ethnicity, parental BMI, physical activity (and/or TV watching) and socioeconomic (which includes educational) status
** Moderate risk of bias was suggested where < 20% were lost to follow‐up, up to three factors were unadjusted for in the design or analysis, and diet was assessed using a 24‐hour recall or diet diary. All other studies were at high risk of bias.
References are the same as those following Table 2.
Abbreviations: ANS: Adelaide Nutrition Study; BMI: body mass index; FFQ: food frequency questionnaire; NIH: National Institutes of Health; SES: socioeconomic status; USDA/ARS: US Department of Agriculture/ Agricultural Research Service.
Validity of RCTs
Allocation
Twenty‐two RCTs and the single child RCT, VYRONAS 2009, had low risk of bias from random sequence generation; the remainder were at unclear risk. Eleven adult RCTs and the single child RCT were at low risk of selection bias arising from poor or unclear allocation concealment or randomisation, one was at high risk (Sondergaard 2003), and the remaining RCTs were at unclear risk.
Blinding
There was a high risk of performance and detection bias due to lack of blinding (which is usual in dietary trials) in all included RCTs except the National Diet and Heart Studies (NDHS Open 1st L&M 1968; NDHS Open 2nd L&M 1968), which provided trial shops that blinded purchases of usual or low fat products.
Incomplete outcome data
For RCTs we assessed those studies that lost more than 5% of participants per year as at high risk of attrition bias; others were at low risk of attrition bias. Eight RCTs were at low risk of attrition bias, two were unclear and the remainder (including the one child RCT) at high risk.
Selective reporting
Most RCTs were at unclear risk of reporting bias (due to the paucity of accessible protocols, so that we could not assess reporting bias), but three adult RCTs were at low risk and one at high risk of bias. We examined the possible presence of reporting bias by using the list of included studies from a recent review of RCTs of the effects of reduced and modified fat on cardiovascular events (Hooper 2012b). Of 48 included RCTs in the other review, we included 21 in the current review. Of the remaining 27 RCTs, 10 did not compare reduced fat intake with usual fat intake (they were included as they modified fat compared with usual fat intake), 13 aimed to reduce weight in some or all participants and three included only participants with a high BMI. Only one trial was eligible for this review but was not included as no data were provided on any measure of body fatness (Toronto Polyp Prev 1994). The risk of reporting bias, related to the proportion of studies not included in a meta‐analysis, seems minimal here (Furukawa 2007).
Other potential sources of bias
We considered all the adult RCTs to be at low risk of other types of bias, but the child RCT, VYRONAS 2009, was felt to be at high risk due to individual randomisation in a school setting, which raised the issue of contamination of the intervention between intervention and control children. Eight adult RCTs had low risk of systematic differences in level of care between the intervention and control groups, while 24 had high risk of such differences in care, as did the child RCT. Differences in attention, training, time from health professionals, number of health checks and/or group support could potentially alter feelings of self efficacy and increase contact with healthcare professionals offering various types of support, and alter participants' ability to look after themselves and maintain a healthy weight. Some dietary interventions to reduce fat also had specific goals around fruit, vegetables, fibre, alcohol etc., which raises the possibility that any changes in weight may result from these alterations, not from change in fat intake. Ten adult RCTs and the child RCT were at high risk of effects from dietary differences other than fat; the remaining 22 RCTs were at low risk of effects from other dietary advice.
Validity of cohort studies
We considered the cohort studies to be at either moderate or high risk of bias. Moderate risk of bias was suggested where less than 20% were lost to follow‐up, two factors or fewer were unadjusted for in the design or analysis (of age, sex, energy intake, ethnicity, physical activity and/or TV watching and socioeconomic status (which includes educational status for adult cohorts), and diet was assessed using a 24‐hour recall or diet diary. For child cohorts factors assessed for adjustment included age, sex, energy intake, ethnicity, parental BMI, physical activity and/or TV watching) and socioeconomic factors, including educational status. We considered all other studies to be at high risk of bias.
We considered all adult cohort analyses to be at high risk of bias, apart from the MONICA study analysis. We likewise considered all cohort studies of children and young people to be at high risk of bias, except for Davison 2001, which was at moderate risk of bias. Cohort studies overall suffered from high dropout rates, lack of complete adjustment for relevant potential confounders and poor assessment of total fat intake.
Effects of interventions
A 'Summary of findings' table assessing the effects of low dietary fat compared with usual fat for body weight in adults using randomised controlled trial (RCT) data is presented (summary of findings Table for the main comparison).
Effects of reducing dietary fat on weight and body fatness in adults (as seen in RCTs)
Weight
Eating a lower proportion of energy as fat results in lower weight (or lower weight gain, or greater weight reductions) than eating the usual proportion of fat (‐1.5 kg, 95% confidence interval (CI) ‐2.0 to ‐1.1, 53,647 participants, 24 estimable comparisons, I2 = 77%, Analysis 1.1; Figure 3). The effect was small but statistically significant, and the best estimate of effect being a reduction in weight was consistent across 21 of the 24 comparisons with numerical data. Additionally, all of the six comparisons that did not have an estimable effect size, due to lack of variance data or large baseline differences, were consistent with greater weight reduction in the reduced fat arms (Figure 3). The same effect was reported in two of the three comparisons that were not included in the forest plot (as they provided insufficient information). The exception was Sondergaard 2003, which reported "in both groups, body weight remained unchanged after 12 months".

Forest plot of comparison: 1 Fat reduction versus usual fat diet, adult RCTs, outcome: 1.1 Weight, kg.
The statistical significance of this relative weight reduction was not lost when we removed studies providing greater time or resources to the reduced fat group (‐1.3 kg, 95% CI ‐2.1 to ‐0.4), when we removed studies with additional dietary interventions (‐1.9 kg, 95% CI ‐2.6 to ‐1.3), when we used fixed‐effect meta‐analysis (rather than random‐effects analysis) (‐1.0 kg, 95% CI ‐1.2 to ‐0.9), when we removed the largest RCT (WHI 2006) (‐1.6 kg, 95% CI ‐2.1 to ‐1.2), or when we removed studies with high or unclear risk of selection bias (‐1.0 kg, 95% CI ‐1.4 to ‐0.5).
We examined the influence of potential effect modifiers through subgrouping (Table 8). There was a suggestion of a dose effect, with studies that reduced total fat in the intervention group by a greater amount compared with the control group showing greater reductions in weight (test for subgroup differences: P value = 0.003). Where the reduction in total fat was less than 5%E compared with control, weight loss was not statistically significant (mean difference (MD) ‐0.2 kg, 95% CI ‐0.9 to 0.6), but as the difference in total fat increased, weight reductions were seen (5%E to < 10%E from fat difference between intervention and control groups, MD ‐2.1 kg, 95% CI ‐2.9 to ‐1.4, and 10%E to < 15%E from fat difference, MD ‐1.3 kg, 95% CI ‐1.7 to ‐1.0). As few studies altered the %E from fat by 15% or more, power was limited so the suggested effect size was large but non‐significant (MD ‐3.9 kg, 95% CI ‐8.8 to 1.0). Similarly there was a suggestion that in low fat arms with greater reductions in energy intake there were greater relative falls in weight (test for subgroup differences: P value = 0.04).
| Factor assessed | Subgroup | Effect on weight, kg (95% CI) | Number of comparisons | Number of participants | I2 for subgroup | Chi2 test for subgroup differences |
| Duration of dietary advice | 6 to < 12 months | ‐1.7 (‐2.3 to ‐1.1) | 10 | 5305 | 71% | P value = 0.04 |
| 12 to < 24 months | ‐2.0 (‐2.5 to ‐1.5) | 17 | 51367 | 71% | ||
| 24 to < 60 months | ‐1.2 (‐1.7 to ‐0.7) | 9 | 49,286 | 56% | ||
| 60+ months | ‐0.7 (‐1.7 to 0.3) | 4 | 40,838 | 58% | ||
| Fat intake in the control group assessed during trial (equivalent to baseline fat intake) | > 35%E from fat | ‐0.9 (‐1.1 to ‐0.8) | 9 | 45,103 | 64% | P value < 0.00001 |
| > 30% to 35%E from fat | ‐0.8 (‐1.2 to ‐0.5) | 9 | 7123 | 73% | ||
| > 25% to 30%E from fat | ‐3.0 (‐3.6 to ‐2.3) | 5 | 2109 | 1% | ||
| Sex | Women only | ‐1.4 (‐1.9 to ‐0.9) | 15 | 50,154 | 72% | P value = 0.20 |
| Men only | ‐2.7 (‐4.3 to ‐1.2) | 4 | 1719 | 76% | ||
| Mixed men and women | ‐1.1 (‐2.0 to ‐0.2) | 5 | 2492 | 79% | ||
| Year of first publication of the trial | 1960s | ‐4.1 (‐8.1 to ‐0.1) | 1 | 1450 | ‐ | P value = 0.07 |
| 1970s | ‐ | 0 | 0 | ‐ | ||
| 1980s | ‐0.9 (‐1.8 to ‐0.01) | 3 | 288 | 0% | ||
| 1990s | ‐1.9 (‐2.6 to ‐1.3) | 14 | 5941 | 80% | ||
| 2000s | ‐0.9 (‐1.6 to ‐0.3) | 6 | 46,686 | 77% | ||
| 2010s | ‐ | 0 | 0 | ‐ | ||
| Difference in %E from fat between intervention and control groups | Up to 5%E from fat | ‐0.2 (‐0.9 to 0.6) | 5 | 4567 | 30% | P value = 0.003 |
| 5 to < 10%E from fat | ‐2.1 (‐2.9 to ‐1.4) | 11 | 44,356 | 84% | ||
| 10 to < 15%E from fat | ‐1.3 (‐1.7 to ‐1.0) | 4 | 8311 | 26% | ||
| 15+%E from fat | ‐3.9 (‐8.8 to 1.0) | 3 | 319 | 68% | ||
| Dietary advice or diet provided | Dietary advice | ‐1.6 (‐2.0 to ‐1.1) | 22 | 52,594 | 78% | P value = 0.04 |
| Diet provided | ‐0.7 (‐1.3 to ‐0.1) | 1 | 1741 | ‐ | ||
| Dietary fat goals for intervention (these were not necessarily achieved) | 30%E from fat | ‐1.0 (‐1.7 to ‐0.3) | 3 | 1628 | 0% | P value = 0.34 |
| 25 to < 30%E from fat | ‐2.5 (‐4.3 to ‐0.6) | 5 | 509 | 90% | ||
| 20 to < 25%E from fat | ‐0.9 (‐1.2 to ‐0.6) | 5 | 43,878 | 31% | ||
| 15 to < 20%E from fat | ‐1.3 (‐2.2 to ‐0.4) | 7 | 7860 | 58% | ||
| Total fat achieved in intervention group | > 30%E from fat | ‐0.8 (‐1.3 to ‐0.4) | 5 | 1767 | 0% | P value = 0.42 |
| ≤ 30%E from fat | ‐1.1 (‐1.6 to ‐0.6) | 13 | 50,099 | 76% | ||
| BMI at baseline (body mass index, kg/m2) | < 25 | ‐1.0 (‐1.7 to ‐0.2) | 8 | 1781 | 56% | P value = 0.17 |
| 25 to < 30 | ‐1.8 (‐2.4 to ‐1.3) | 15 | 51,297 | 83% | ||
| 30+ | ‐1.8 (‐3.5 to ‐0.1) | 1 | 69 | ‐ | ||
| Baseline health of participants | Healthy | ‐1.0 (‐1.6 to ‐0.4) | 3 | 45,032 | 87% | P value = 0.12 |
| With risk factors | ‐2.2 (‐3.2 to ‐1.2) | 12 | 2166 | 79% | ||
| With disease | ‐1.2 (‐1.9 to ‐0.6) | 9 | 6449 | 44% | ||
| Amount of energy reduction in the low fat arm | E intake the same or greater in low fat group | ‐0.5 (‐1.5 to 0.5) | 4 | 3352 | 25% | P value = 0.04 |
| 1 to 100 kcal/d less in low fat arm | ‐1.5 (‐2.9 to ‐0.1) | 4 | 2398 | 66% | ||
| 101 to 200 kcal/d less in low fat arm | ‐1.1 (‐2.2 to ‐0.04) | 5 | 43,755 | 80% | ||
| 201+ kcal/d less in low fat arm | ‐2.2 (‐3.0 to ‐1.5) | 8 | 3954 | 78% |
Note: studies that provide data at different time points or that fit into different categories have all been included, so studies may appear more than once in any series of subgroups.
The time point at which weight is assessed following the onset of a reduced compared with a moderate fat diet may be important. The effect in studies that assessed weight from six to up to 12 months, 12 to up to 24 months and 24 to up to 60 months was statistically significant, but at 60+ months (MD ‐0.7 kg, 95% CI ‐1.7 to 0.3) statistical significance was lost (test for subgroup differences: P value = 0.04).
The level of fat in the control group may also be important. Weight loss was statistically significant where the control group intake was over 35% of energy from fat, over 30% to 35% of energy or over 25% to 30% of energy, with a suggestion of greater weight loss in groups with lower baseline fat intake (test for subgroup differences: P value < 0.00001) (see Table 8).
There was a suggestion that dietary advice was more effective in weight reduction with low fat eating than provision of low fat foods, however the power of the analysis was limited (only one study that provided foods also supplied numerical data for meta‐analysis (test for subgroup differences: P value = 0.04).
There were no clear effects of: sex on weight (studies in men, in women and in mixed sexes all showed significant weight loss; test for subgroup differences: P value = 0.20), year of first publication (studies published in the 1960s, 1980s, 1990s and 2000s were all statistically significant; test for subgroup differences: P value = 0.07), the total fat intake goal in the intervention group (test for subgroup differences: P value = 0.34), whether the low fat arm achieved a fat intake of ≤ 30%E or not (test for subgroup differences: P value = 0.42), body mass index at baseline (test for subgroup differences: P value = 0.17), or whether participants were recruited as healthy, with risk factors (such as lipids, hormone levels or breast cancer risk factors), or with existing disease (such as diabetes, previous myocardial infarction or polyps) (test for subgroup differences: P value = 0.12). For all of these subgroupings all of the subgroups examined showed statistically significant weight loss in the low fat arms compared with the control arms.
Meta‐regression (multiple regression model on dose, duration and control group fat intake, all at once) suggested that the degree of fat reduction was significantly associated with the degree of weight loss in the intervention arm compared with the control arm (coefficient ‐0.20 kg/1% energy from total fat reduction, 95% CI ‐0.34 to ‐0.05, P value = 0.010), suggesting that greater reduction in fat intake was associated with greater weight loss. Fat intake in the control group (equivalent to baseline fat intake) was also significantly associated with the degree of weight loss in the intervention group (coefficient 0.17 kg/1% energy from fat in the control group, 95% CI 0.04 to 0.29, P value = 0.010), suggesting that a reduction in fat intake was more effective at reducing weight in those with a lower baseline fat intake. There was no clear association between trial duration and degree of weight loss (coefficient 0.01 kg/month, 95% CI ‐0.006 to 0.030, P value = 0.19). Together these factors explained 56% of variance between studies, using the equation: weight change (kg) = ‐5.97 kg + 0.17 kg/1% energy from total fat in control group ‐0.20 kg/1% decrease in energy from total fat in intervention group + 0.01 kg/months' duration.
Body mass index (BMI), waist circumference and other measures of body fatness
Fewer studies reported BMI than weight, but the effect of a lower proportion of energy from fat on BMI appeared similar to that on weight (‐0.5 kg, 95% CI ‐0.7 to ‐0.3, 45,703 participants, 10 comparisons, I2 = 74%) (Analysis 1.2; Figure 4). As there were fewer studies than for weight, we did not attempt sensitivity analyses and subgrouping for BMI.

Forest plot of comparison: 1 Fat reduction versus usual fat diet, adult RCTs, outcome: 1.2 BMI, kg/m2.
Only one RCT reported waist circumference, finding that waist circumference in those on low fat diets was significantly lower than in those on usual fat diets at five and seven years (by 0.3 cm, 95% CI ‐0.6 to ‐0.02, 15,671 women) (WHI 2006). No adult RCTs reported other measures of body fatness.
Secondary outcomes ‐ lipids and blood pressure
There was no suggestion of harms associated with low fat diets that might mitigate any benefits on weight.
Effects of reduced fat compared with usual or modified fat diets suggested that the lower fat diets were associated with lower total and low‐density lipoprotein (LDL) cholesterol, without important effects on high‐density lipoprotein (HDL) or triglycerides. Effects on LDL (‐0.1 mmol/L, 95% CI ‐0.2 to ‐0.03, 7285 participants, 18 comparisons, I2 = 65%) were similar to those on total cholesterol (‐0.2 mmol/L, 95% CI ‐0.3 to ‐0.1, 7715 participants, 20 comparisons, I2 = 54%). The effect on HDL suggested slight harm from lower fat diets (‐0.01 mmol/L, 95% CI ‐0.03 to 0.00, P value = 0.11, 7166 participants, 19 comparisons, I2 = 0%). Given the weight loss, there was little evidence of a benefit on triglycerides (‐0.02 mmol/L, 95% CI ‐0.12 to 0.08, 6976 participants, 17 comparisons, I2 = 56%). There was a reduction in total cholesterol/HDL ratio over the seven comparisons that reported it (‐0.10, 95% CI ‐0.16 to ‐0.04, 3332 participants, I2 = 0%).
There were small and statistically significant beneficial effects of a lower fat diet on systolic and diastolic blood pressure (although these were reported in relatively few studies). The effect on systolic blood pressure (‐1.2 mmHg, 95% CI ‐2.0 to ‐0.4, 5159 participants, nine comparisons, I2 = 0%) was greater than that on diastolic blood pressure (‐0.7 mmHg, 95% CI ‐1.4 to ‐0.1, 5159 participants, nine comparisons, I2 = 23%).
Secondary outcomes ‐ effects of reducing fat intake on intakes of energy, protein, carbohydrate, sugars and alcohol
Indications were that during the studies energy intake was usually lower in the low fat group than in the control or usual fat groups. Sugar intake was not measured often but where reported sugar intake appeared higher in low fat arms (except in MeDiet 2006, see Table 9). Carbohydrate intakes appeared almost universally higher in low fat arms than in usual fat arms, and protein intakes were sometimes higher and sometimes similar. There was no consistent pattern in alcohol intake.
| Trial | Energy intake (SD), kcal | Sugars intake, %E | CHO intake, %E | Protein intake, %E | Alcohol intake, %E | No. of participants | ||||||
| Int. | Cont | Int. | Cont | Int. | Cont | Int. | Cont | Int. | Cont | Int. | Cont | |
| Auckland reduced fat, 1 yr | 1887 (672) | 2269 (750) | — | — | 54.2 (10.5) | 45.8 (10.9) | 18.4 (3.5) | 16.6 (3.9) | 3.6 (7.0) | 5.7 (7.0) | 49 | 61 |
| BDIT pilot studies, 9 yrs | 1460 (376) | 1578 (365) | — | — | 49.6 (7.5) | 46.9 (6.2) | 15.5 (2.4) | 15.3 (2.6) | 2.3 (3.3) | 1.7 (2.4) | 76 | 81 |
| BeFIT | (data not reported in control groups) | |||||||||||
| Bloemberg, Δ to 6 mo | — | — | — | — | 4.4 (6.5) | 1.2 (6.1) | 0.33 (2.9) | 0.57 (1.7) | — | — | 39 | 41 |
| BRIDGES, 6 mo | ‐34 (79) | + 22 (79) | — | — | — | — | — | — | — | — | 48 | 46 |
| Canadian DBCP, 2 yrs | 1540 (317) | 1759 (437) | — | — | 60.3 (8.3) | 48.8 (8.1) | 18.0 (3.2) | 16.9 (2.8) | — | — | 104 | 100 |
| De Bont, Δ to 6 mo | ‐98 (369) | ‐120 (485) | — | — | 7.9 (9.5) | ‐0.1 (10.9) | 2.4 (7.0) | 1.7 (5.9) | ‐0.2 (1.6) | ‐0.4 (2.6) | 71 | 65 |
| DEER (diet alone), Δ to 1 yr | Women: ‐220 (356) Men: ‐285 (541) | Women: ‐19 (367) Men: ‐25 (482) | — | — | Women: +5.5 (8.0) Men: +8.0 (9.3) | Women: ‐0.2 (7.3) Men: +1.1 (6.6) | — | — | — | — | 46, 49 | 45, 46 |
| DEER (diet and ex), Δ to 1 yr | Women: ‐191 (343) Men: ‐167 (516) | Women: ‐54 (410) Men: +141 (437) | — | — | Women: +7.8 (6.2) Men: +9.3 (8.3) | Women: ‐0.3 (7.9) Men: +1.4 (6.3) | — | — | — | — | 43, 48 | 43, 47 |
| Diet and hormone study, 1 yr | 1921 (386) | 2063 (610) | — | — | 64.3 (9.0) | 54.6 (9.2) | 14.5 (2.9) | 14.1 (3.8) | est: 1 (2) | est: 1 (2) | 81 | 96 |
| Kentucky low fat, 1 yr | 1882 (521) | 2010 (528) | — | — | 53 (8.9) | 50 (7.9) | 17 (3.4) | 18 (4.3) | — | — | 47 | 51 |
| Kuopio, wks 14 to 28 | AHA 1791 (382) Mono 1887 (478) Low fat 1648 (430) | 1982 (406) | — | — | AHA 48 (5) Mono 47 (6) Low fat 51 (5) | 46 (6) | AHA 17 (2) Mono 17 (20) Low fat 19 (3) | 16 (2) | — | — | AHA 41 Mono 41 Low fat 40 | 37 |
| Mastopathy diet, 6 mo | 1491 (NR) | 1676 (NR) | — | — | 56.3 (NR) | 48.1 (NR) | 17.9 (NR) | 15.8 (NR) | 4.8 (NR) | 4.2 (NR) | 10 | 9 |
| MeDiet, 6 mo | 1676 (639) | 1654 (498) | 18.7 (6.9) | 21.9 (9.2) | 27.2 (17.0) | 25.8 (11.0) | 14.9 (4.7) | 16.2 (5.1) | 5.6 (11.1) | 1.6 (2.2) | 51? | 55? |
| Moy, 2 yrs | 1825 (NR) | 2092 (NR) | — | — | — | — | — | — | — | — | 117 | 118 |
| MSFAT, 6 mo | 2460 (NR) | 2699 (NR) | — | — | 47 (NR) | 41 (NR) | 16 (NR) | 14 (NR) | 3 (NR) | 3 (NR) | 117 | 103 |
| NDHS open 1st 6 mo (for definitions of groups B, C and D see Characteristics of Included Studies) | B: 2154 (432) | C: 2262 (435) D: 2228 (456) | — | — | B: 48.7 (12.3) | C: 45.3 (12.1) D: 44.7 (11.7) | B: 18.6 (3.4) | C: 17.6 (3.1) D: 17.4 (3.1) | B: 3.7 (3.7) | C: 3.6 (4.0) D: 3.8 (4.0) | B: 339 | C: 355 D: 346 |
| NDHS open 2nd 6 mo (for definitions of groups BC, F and G see Characteristics of Included Studies) | BC: 2249 (492) | F: 2196 (427) G: 2169 (420) | — | — | BC: 45.7 (12.7) | F: 44.1 (11.1) G: 43.3 (11.4) | BC: 17.3 (3.5) | F: 7.3 (3.0) G: 17.7 (2.9) | BC: 3.5 (4.2) | F: 4.2 (4.0) G: 4.0 (4.5) | BC: 491 | F: 214 G: 194 |
| Nutrition and breast health, 1 yr | 1780 and 1960 | 1571 and 1687 | — | — | — | — | — | — | — | — | 23 and 25 | 24 and 23 |
| Nutrition education study, 6 to 9 mo | 1534 (448) | 1721 (620) | — | — | 43.4 (9.5) | 41.5 (8.9) | 19.9 (3.7) | 18.7 (4.4) | 4.5 (7.2) | 4.8 (9.3) | 224 | 69 |
| Pilkington, 1 yr | NR | NR | — | — | — | — | — | — | — | — | 12 | 23 |
| Polyp prevention trial, yr 4 | 1978 (471) | 2030 (518) | — | — | 58.3 (7.4) | 47.1 (7.2) | 17.3 (2.5) | 16.5 (2.4) | — | — | 605 | 581 |
| Rivellese, 6 mo | NR | NR | 14 | 10 | 55 | 48 | 18 | 16 | — | — | 27 | 17 |
| Simon low fat, 1 yr | 1570 (NR) | 1594 (NR) | — | — | — | — | — | — | — | — | 65 | 68 |
| Sondergaard, 12 mo | — | — | — | — | 52.3 (6.4) | 48.5 (8.7) | 17.0 (2.9) | 16.6 (3.1) | 4.5 (5.3) | 6.4 (7.4) | 62 | 51 |
| Strychar, 6 mo | NR | NR | — | — | — | — | — | — | — | — | 15 | 15 |
| Swedish breast CA, Δ to 2 yrs | ‐215 (P value < 0.01) | ‐143 (P value < 0.01) | +4.8 (P value < 0.01) | +1.4 (P value < 0.01) | +11.0 (P value < 0.01) | +2.7 (P value < 0.01) | +1.7 (P value < 0.01) | +0.3 (P value > 0.05) | +0.2 (P value > 0.05) | +0.4 (P value > 0.05) | 63 | 106 |
| Veteran's dermatology, during trial | 1995 (564) | 2196 (615) | — | — | 60.3 (6.3) | 44.6 (6.9) | 17.7 (2.2) | 15.7 (2.4) | 3.2 (3.4) | 3.2 (3.9) | 57? | 58? |
| WHEL, 1 yr | 1664 (345) | 1635 (384) | — | — | 65.3 (8.5) | 57.1 (9.3) | — | — | — | — | 197 | 196 |
| WHI, 7.5 yrs | 1446 (510) | 1564 (595) | — | — | 52.7 (9.8) | 44.7 (8.5) | — | — | — | — | 14246 | 22083 |
| WHT: feasibility, 2 yrs | 1356 (358) | 1617 (391) | — | — | 59.0 (8.8) | 46.9 (8.9) | 19.2 (3.9) | 16.8 (3.8) | — | — | 163 | 101 |
| WHT: FSMP, Δ to 18 mo | ‐488 (NR) | ‐255 (NR) | — | — | — | — | — | — | — | — | 285 | 194 |
| WINS, 5 yrs | ‐167 (p value < 0.0001 vs cont) | 0 | — | — | — | — | — | — | — | — | 380 | 648 |
est: estimated by review authors from data on g/d and mean energy intakes
Abbreviations: AHA: American Heart Association; CHO: carbohydrates; DBCP: Diet and Breast Cancer Prevention; SD: standard deviation
Secondary outcomes ‐ effects of reducing fat intake on quality of life measures
Quality of life outcomes were rarely measured or reported. It appears that quality of life was assessed in WHI 2006 but we were unable to find any reference to this outcome by dietary intervention group. No other relevant data were located.
Publication bias
The funnel plot of studies assessing effects on weight did not suggest any serious publication bias (Figure 5), and neither did the funnel plot of effects on BMI (not shown). The studies that assessed weight, but where we could not include the data provided in meta‐analysis, did not appear to differ importantly in their results from the studies that provided variance data and were included in the analyses.

Funnel plot of comparison: 1 Fat reduction versus usual fat diet, outcome: 1.1 Weight, kg.
Effects of reducing dietary fat on weight and body fatness in children (as seen in RCTs)
As part of the single RCT in children, VYRONAS 2009 randomised 213 students aged 12 to 13 years at baseline to intervention or usual diet, of whom 191 were analysed at 17 months. The validity of this RCT was discussed with the adult RCTs and is shown in Figure 2). The intervention group (n = 98) had a 12‐week school‐based health and nutrition interventional programme with a 17‐month follow‐up period. After 17 months, total fat intake (as %E) showed a significant reduction 31.3% (standard deviation (SD) 4.4) compared with baseline intake of 35.4% (SD 4.7) in the intervention group (P value < 0.001). In the control group fat intake at 17 months was 36.2% (SD 5.2) compared with 36.9% (SD 4.8) at baseline (P value = 0.343). Mean BMI (kg/m2) also decreased significantly (adjusting for age and sex) to 23.3 kg/m2 (SD 2.8) compared with 24.0 kg/m2 (SD 3.1) at baseline in the intervention group (P value < 0.001), but was more similar in the control group (24.8 (SD 3.8) versus 24.3 (SD 3.3), P value = 0.355). The difference in weight between intervention and control arms was not reported, and as the difference between intervention and control groups for baseline BMI was greater than the changes in BMI in either arm a direct comparison of BMI is probably inappropriate statistically. Mean change in BMI was a fall of 0.7 kg/m2 in the intervention group and an increase of 0.5 kg/m2 in the control group, a difference of 1.2 kg/m2 (but we do not have variance data for these changes, so cannot comment on statistical significance). Analysis of 17‐month BMI data by the review authors in RevMan (RevMan 2014) suggested that the effect of a low fat diet compared with a usual fat diet in children was ‐1.50 kg/m2 (95% CI ‐2.45 to ‐0.55), however this was assessed on adjusted data, with a large baseline difference in BMI between groups. Without analysis of the original data set this should therefore be considered with caution.
Associations between total dietary fat and measures of body fatness in adults (as seen in cohorts)
We included 14 adult cohorts (20 published papers, cohorts presented their results in from one to eight main analyses, 39 analyses in total) which reported on baseline total fat intake and reported on a measure of body fatness at least one year later. Eleven cohorts reported change in weight, BMI and/or waist circumference over the course of the follow‐up, while three cohorts reported absolute weight or BMI at follow‐up (for characteristics of these studies see Table 1). We considered meta‐analysis of beta values, but the different methodologies, methods of modelling, numbers of baseline dietary assessments, numbers of relevant statistical analyses per single cohort, time periods between dietary assessment and body fatness assessment, ages at baseline and outcome measures (weight, change in weight, BMI, change in BMI, change in waist circumference) were so varied that we felt combining studies in meta‐analysis was inappropriate.
The single study at moderate risk of bias (Danish MONICA, Iqbal 2006, Table 1) found no relationship between fat intake and change in weight five years later. Four further cohorts reported no relationship between fat intake and measures of body fatness in the whole cohort or in any reported subgroup (Cundiff 2012; Ma 2005; Parker 1997; Halkjaer 2009). Eight cohorts reported relationships in some subgroups but not others (CARDIA found a relationship for black men and women, but not white men and women; EPIC negative relationships when replacing fat with protein, and when replacing carbohydrates with total fat, but not when replacing fat with carbohydrates; Coakley 1998 a relationship between total fat and change in weight in 45 to 54 year old men and 55 to 64 year old men, but not in men aged 65 or more; MacInnis 2013 found associations between baseline fat intake with final weight and waist circumference overall, but this was only significant in some age subgroupings; Klesges 1992 found a positive relationship with change in weight in women, but not in men, and a negative relationship with change in waist circumference in men, but not in women; Kant 1995 found a relationship with change in weight in younger women, but not in older women or men of either age group; Nurses Health Study found no relationship with change in weight in one paper, and the relationship was unclear in another paper; Lissner 1997 found a relationship between fat intake and change in weight in sedentary participants, but not in moderate or active participants). One cohort reported a positive association between total fat intake and change in weight in a mixed group of Hispanic and non‐Hispanic men and women (Mosca 2004).
Overall, of the 39 reported analyses of the relationship between total fat intake and measures of body fatness in adults, 12 suggested a positive relationship, three a negative relationship and one was unclear. The remainder (23 analyses) were neutral (no statistically significant relationship).
Associations between total dietary fat in youth and measures of body fatness in children, young people and adults (as seen in cohorts)
The 11 included cohorts that recruited children and young people were reported in 13 published papers, and provided 101 separate analyses. Two cohorts assessed outcomes in adulthood, the remainder later in childhood.
Of the nine child or young person cohorts that assessed effects on body fatness in childhood or adolescence, three cohorts, including the study at moderate risk of bias, Davison 2001) suggested that higher dietary fat intakes predicted greater body fatness (assessed as % body fat and BMI in Carruth & Skinner 2001, change in BMI in Davison 2001, and change in weight in Viva la Familia). Four cohorts suggested no clear relationship between fat intake and fatness (assessed as BMI, triceps skinfold and subscapular skinfold in the Adelaide Nutrition Study, change in BMI in Bogaert 2003 and Obesity and Metabolic Disorders Cohort in Children, and change in BMI z‐score in the European Youth Heart Study). Two cohorts reported effects in some measures of body fatness or some analysed age groups but not others (Trial of Activity for Adolescent Girls found no relationship of fat with BMI percentile, but a negative relationship with % body fat, while Klesges 1995 found no relationship in 3 of four assessments of change in BMI). For details of these cohort studies see Table 2.
We considered meta‐analysis, but the different methodologies, methods of modelling, numbers of baseline dietary assessments, numbers of relevant statistical analyses per single cohort (from 1 to 63), time periods between dietary assessment and body fatness assessment, ages at baseline and outcome measures (weight, change in weight, BMI, change in BMI z‐score, change in BMI, body fat percentage, various skinfold measures) were so varied that we felt combining studies in meta‐analysis was inappropriate.
The two cohorts (two analyses of the Amsterdam Growth and Health Longitudinal Study, and one of ELANCE, Table 2), which assessed the relationship between fat intake in childhood and body fatness in early adulthood (ages 20, 27 and 36), found no clear relationships between baseline fat intake and BMI, percentage body fat, sum of skinfolds or % triceps skinfold. The exception was ELANCE, which found that greater total fat intake in youth was related to lower percentage sub‐scapular skinfold and fat mass (though not to BMI or % triceps skinfold).
Overall, the included cohorts reported a total of 101 analyses of the relationship between total fat intake and body fatness in cohorts recruiting children and young people. Nine suggested positive relationships and three suggested negative relationships. The vast majority were neutral.
Discussion
Summary of main results
Randomised controlled trials (RCTs) of the effects on body fatness of reducing total fat intake (without any intention to reduce body weight) show a small but consistent reduction in weight in the low fat arm compared with the usual fat arm. There is some heterogeneity between studies in the size of this effect, but not in its presence, and the effect was highly resistant to sensitivity analyses. The heterogeneity was explained by the degree of total fat reduction and baseline total fat intake (in meta‐regression and in subgrouping). The small reduction in weight (1.5 kg, 95% confidence interval (CI) ‐2.0 to ‐1.1 kg) was also reflected in a reduction in body mass index (BMI) (‐0.50 kg/m2, 95% CI ‐0.74 to ‐0.26) and waist circumference (0.3 cm, 95% CI ‐0.6 to ‐0.02) in the adult studies that reported these data, and in a suggested reduction in BMI in the one child study (VYRONAS 2009): a fall of 0.7 kg/m2 in the intervention arm and a rise of 0.5 kg/m2 in the control arm). Additionally, there was no suggestion of harms that might mitigate any benefits on weight, and some suggestion of benefit to serum lipids and blood pressure resulting from low fat diets.
Cohort studies in adults and children generally found no clear relationship between total fat intake and measures of body fatness later in life, but a few did see positive relationships (higher total fat intake was associated with higher later body fatness), and fewer suggested negative relationships.
Overall completeness and applicability of evidence
We have searched very carefully and used a set of comprehensive search strategies to find the full set of RCTs and cohort studies assessing the relationship between total fat intake and measures of body fatness. We did this by searching for trials that reduced total fat in one arm and not in the other, regardless of the primary aims or outcomes mentioned in the title or abstracts. Indeed, the included RCTs rarely had weight as a key outcome. Reflecting this, there was little suggestion (from the funnel plot of adult RCTs assessing effects on weight and BMI) that we have missed a sample of RCTs. However, we are limited in how well we are able to assess this for cohort studies, where the risk of missing studies is keener (where sometimes the relevant analysis is added into the text as an afterthought (e.g. Working Well 1996) and does not appear in the title or abstract).
The studies are highly applicable to the question, allowing us to draw conclusions on the effect of altering the percentage of energy from total fat on body fatness.
Quality of the evidence
The included RCTs were often at unclear risk of selection bias due to unclear allocation concealment, but this did not appear to affect the results of the review as omitting all RCTs with unclear or poor allocation concealment still resulted in a statistically significant weight reduction in the intervention arms. Lack of blinding was a validity issue in most included RCTs, reflecting the difficulties of blinding dietary intervention studies. We assessed the effects of attention bias in sensitivity analyses, removing studies that provided more time or review or education to the intervention group compared with the control group, and also the effect of removing studies that provided dietary advice other than on dietary fat (in case effects were being driven by other dietary interventions) and in neither case did we lose the significant weight reduction seen in the low fat arms. In each case the higher validity trials reflect the main message, that eating a lower proportion of energy from fat results in slightly lower body fatness.
The included cohort studies were generally at high risk of bias due to the high proportion of participants lost to follow‐up or lack of adjustment for potential confounders. Although the included cohorts reported on a large number of participants, they did not add significantly to the conclusions of the review as their findings were not conclusive.
Potential biases in the review process
When compiling the included studies we tried to locate RCTs that investigated the effects of reducing total dietary fat for at least six months. There was a high degree of heterogeneity among trials from different sources, including the type and number of participants, the duration and nature of interventions, control methods and follow‐up. However, our sensitivity analyses and subgrouping to examine the effect of the potential effect modifiers mentioned above did not affect the statistical significance of the suggested effect, finding it remarkably robust to subgroup and sensitivity analyses.
Our review included only published studies (we did not seek unpublished data), which could bias the results due to the lack of publication of negative or inconclusive studies. However, our funnel plots did not suggest serious publication bias (Figure 5).
Our decision to exclude trials that explicitly or implicitly aimed to reduce weight may have led to missing some trials or restricting the number of included studies, especially excluding studies where there was no energy restriction, no explicit aim of weight loss, or encouraging of weight loss for some and not all participants. However, this decision makes the effect we found on weight and other measures of body fatness more reliable and avoids the potential confounding effects of dieting and unconscious energy restriction or other diet changes.
The restriction of inclusion to studies with a minimum of six months duration for RCTs or one year for cohorts led to missing some potentially relevant studies (for example, studies of 24 weeks duration, which just missed the 26‐week limit). However, it is essential to draw the line at some point, and longer trials and follow‐up ensure that the data are relevant to long‐term fatness, which affects long‐term health.
A limitation of the review was that we did not assess the causal pathway between restriction of energy from fat and weight and so the mechanism of the effect is not clear. It is likely that restricting energy from fat also reduces energy intake (see Table 9), which leads to lower body weight. Further evidence that energy intake is important in mediating the effect of lowering fat intake on body weight is suggested by a higher relative weight loss in the low fat arms with greater energy reduction.
Most (22 of 32) included RCTs were published before the year 2000 ‐ this is primarily because most recent studies have focused on weight reduction so were ineligible for this review. However, there was no suggestion when subgrouping by decade of publication that effects have altered over time.
Agreements and disagreements with other studies or reviews
The conclusions of this updated review have not altered in overall import from the original review (Hooper 2012b). Yu‐Poth 1999 found that dietary trials (excluding trials that also assessed exercise interventions) of the National Cholesterol Education Program's Step I and Step II dietary intervention programmes resulted in weight reductions (compared with control groups) of just under 3 kg, and that this was related to the degree of total fat reduction. Their regression suggested that for every 1% decrease in energy as total fat, there was a 0.28 kg decrease in body weight, while our meta‐regression found that for every 1% decrease in energy as total fat there was a slightly smaller 0.20 kg decrease in weight (95% CI ‐0.34 to ‐0.05, P value = 0.010). The slightly smaller effect size in this review may be due to our excluding shorter duration studies and studies that aimed to reduce weight in the intervention arm.
However, some recent cardiovascular disease prevention guidelines have not mentioned total fat intake as regards to either weight control or prevention of cardiovascular disease (Joint ESC guidelines 2012).

Study flow diagram for this systematic review (update searches run November 2014).

'Risk of bias' summary: review authors' judgements about each methodological quality item for each included adult and child RCT comparison.

Forest plot of comparison: 1 Fat reduction versus usual fat diet, adult RCTs, outcome: 1.1 Weight, kg.

Forest plot of comparison: 1 Fat reduction versus usual fat diet, adult RCTs, outcome: 1.2 BMI, kg/m2.

Funnel plot of comparison: 1 Fat reduction versus usual fat diet, outcome: 1.1 Weight, kg.

Comparison 1 Fat reduction versus usual fat diet, adult RCTs, Outcome 1 Weight, kg.
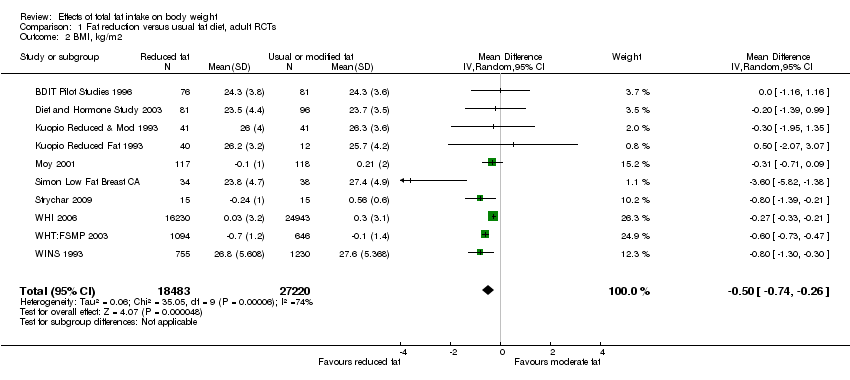
Comparison 1 Fat reduction versus usual fat diet, adult RCTs, Outcome 2 BMI, kg/m2.

Comparison 1 Fat reduction versus usual fat diet, adult RCTs, Outcome 3 Waist circumference, cm.
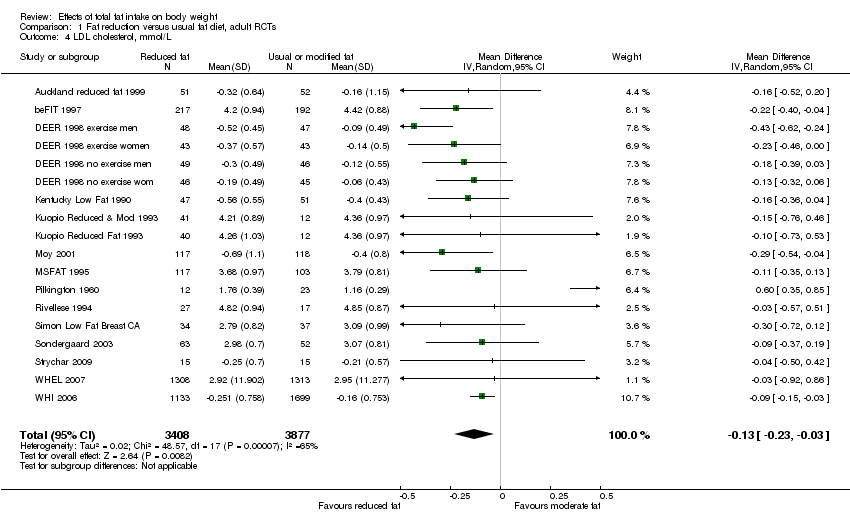
Comparison 1 Fat reduction versus usual fat diet, adult RCTs, Outcome 4 LDL cholesterol, mmol/L.

Comparison 1 Fat reduction versus usual fat diet, adult RCTs, Outcome 5 HDL cholesterol, mmol/L.

Comparison 1 Fat reduction versus usual fat diet, adult RCTs, Outcome 6 Total cholesterol, mmol/L.
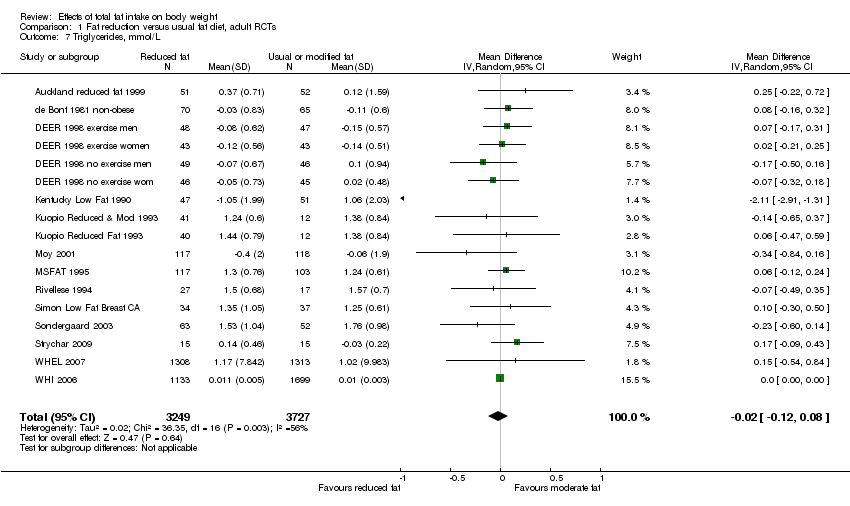
Comparison 1 Fat reduction versus usual fat diet, adult RCTs, Outcome 7 Triglycerides, mmol/L.
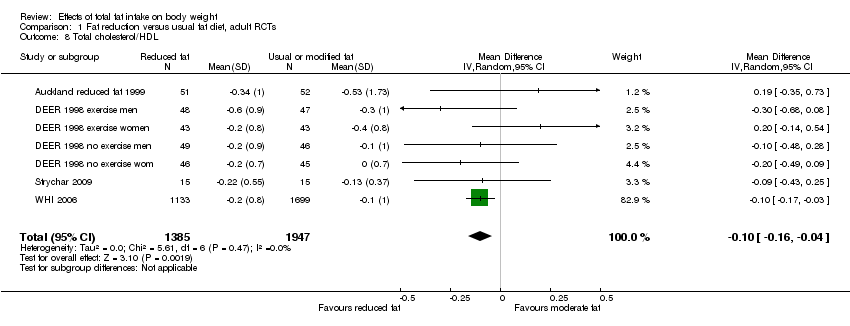
Comparison 1 Fat reduction versus usual fat diet, adult RCTs, Outcome 8 Total cholesterol/HDL.

Comparison 1 Fat reduction versus usual fat diet, adult RCTs, Outcome 9 Systolic blood pressure, mmHg.
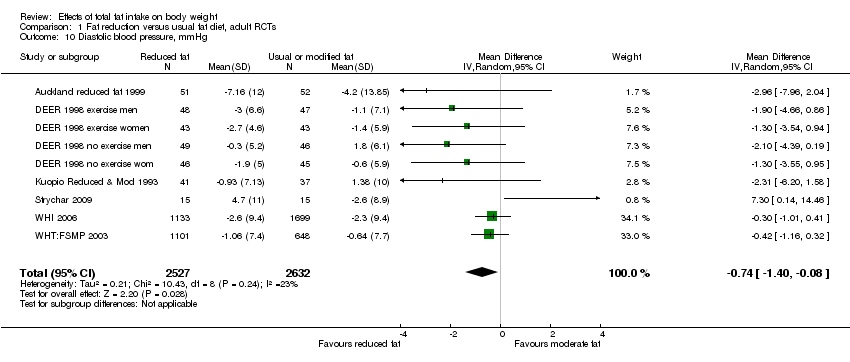
Comparison 1 Fat reduction versus usual fat diet, adult RCTs, Outcome 10 Diastolic blood pressure, mmHg.

Comparison 2 Fat reduction versus usual fat diet, adult RCTs ‐ subgrouping, Outcome 1 Weight ‐ subgrouped by duration of advice.
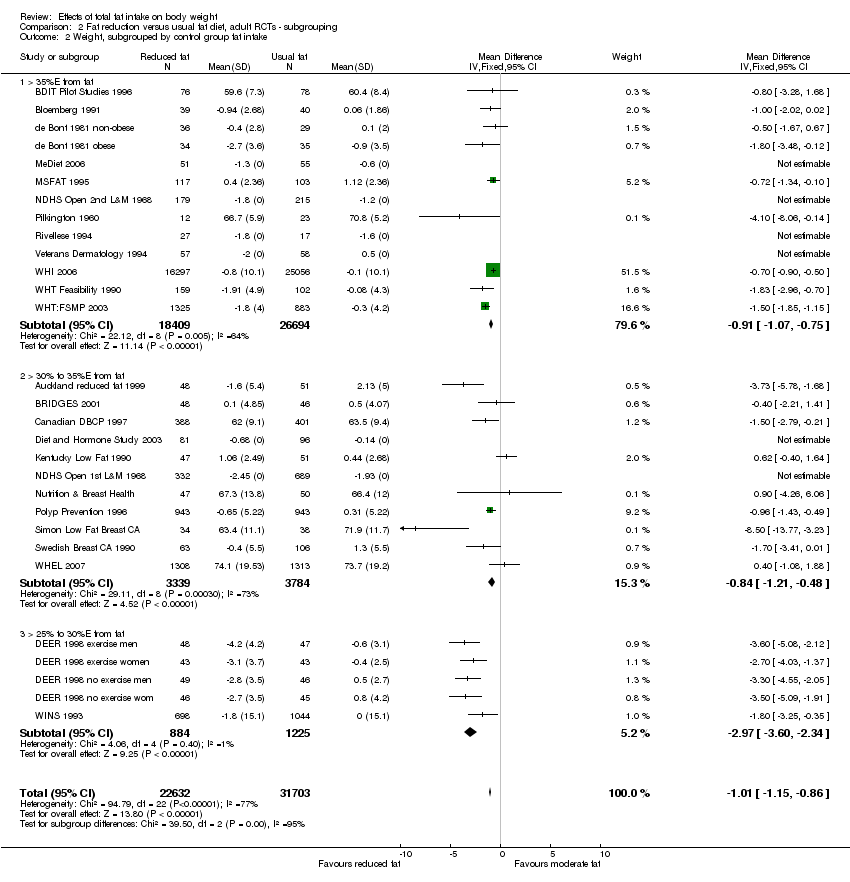
Comparison 2 Fat reduction versus usual fat diet, adult RCTs ‐ subgrouping, Outcome 2 Weight, subgrouped by control group fat intake.
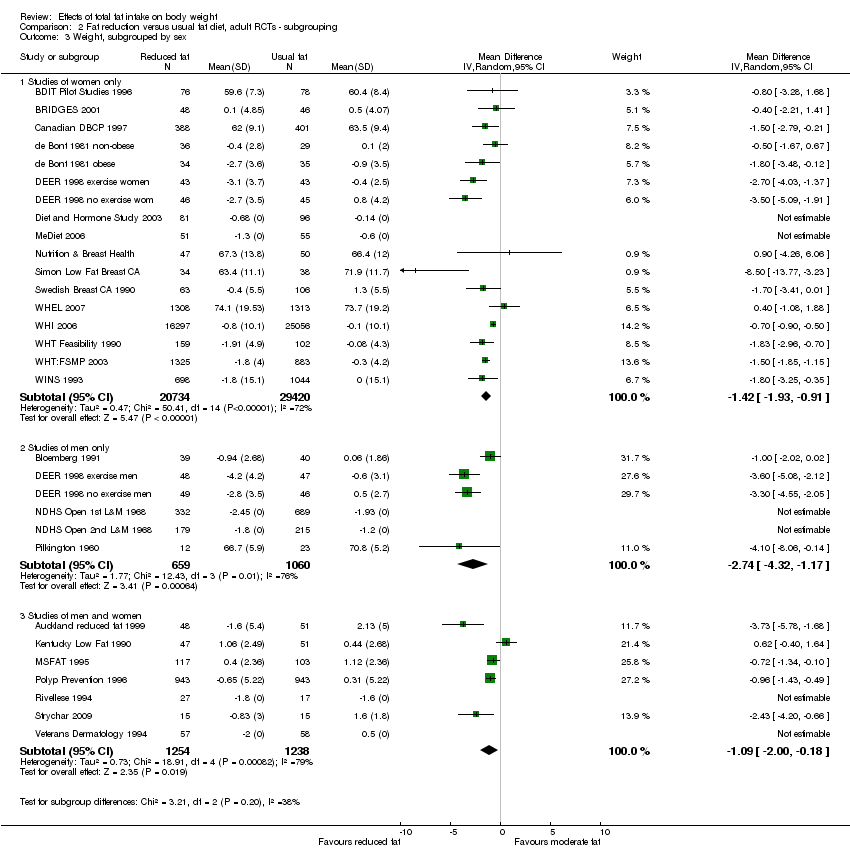
Comparison 2 Fat reduction versus usual fat diet, adult RCTs ‐ subgrouping, Outcome 3 Weight, subgrouped by sex.

Comparison 2 Fat reduction versus usual fat diet, adult RCTs ‐ subgrouping, Outcome 4 Weight, subgrouped by year of first publication of results.
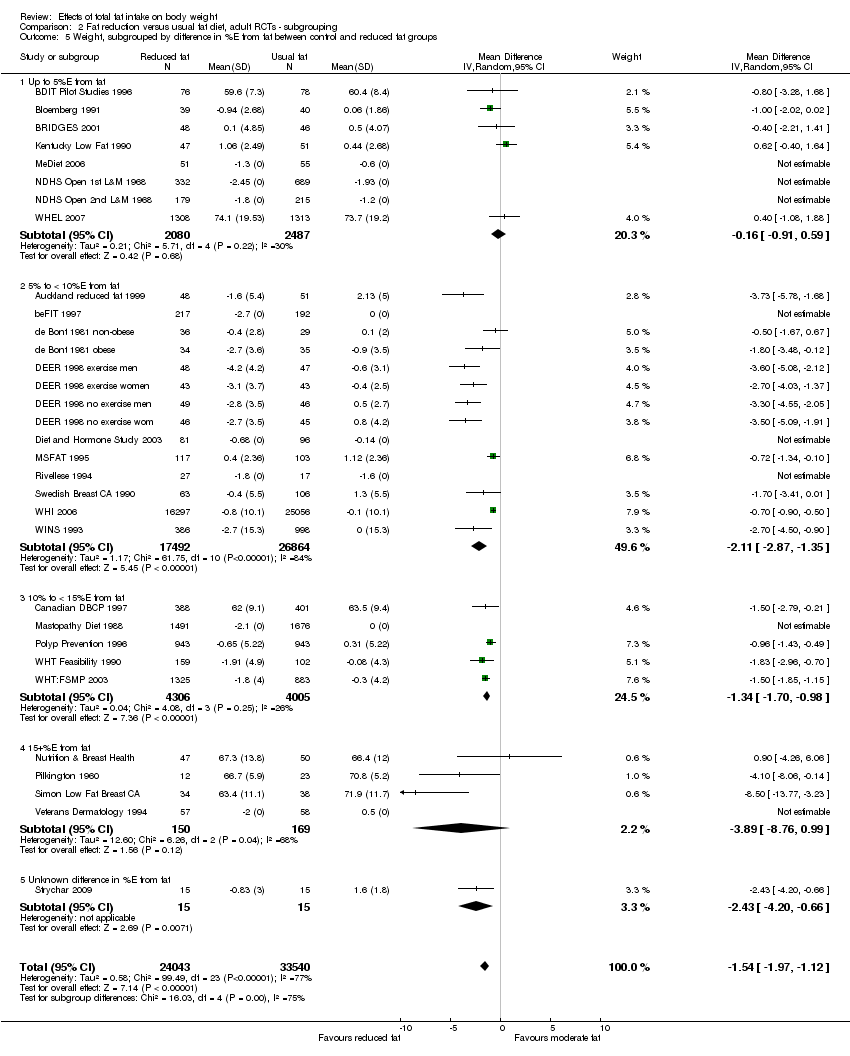
Comparison 2 Fat reduction versus usual fat diet, adult RCTs ‐ subgrouping, Outcome 5 Weight, subgrouped by difference in %E from fat between control and reduced fat groups.
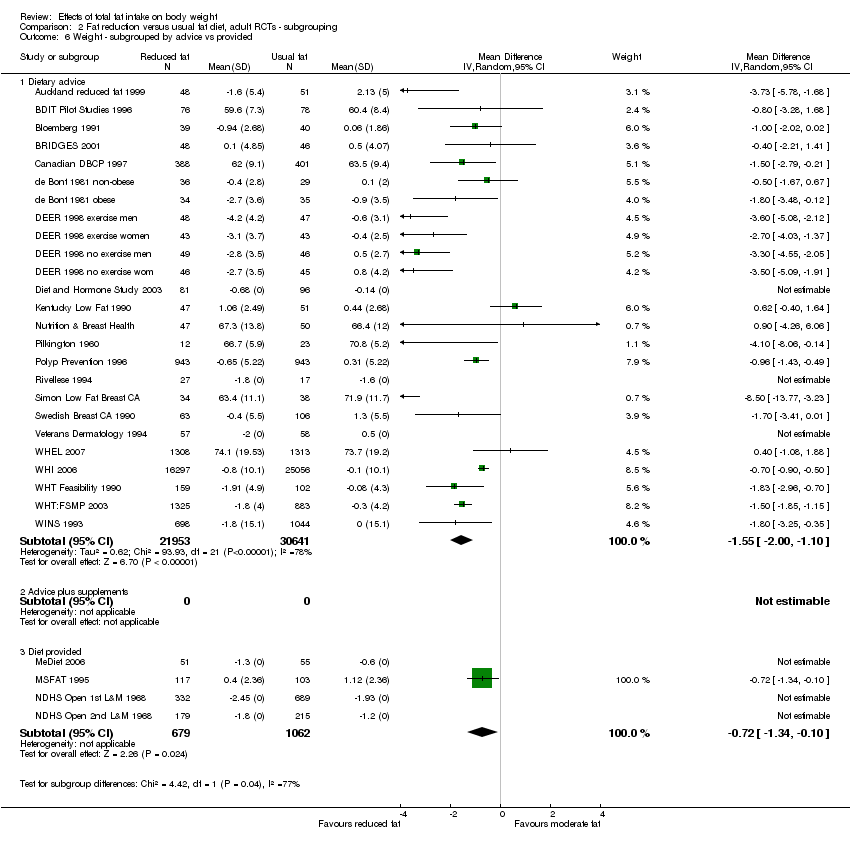
Comparison 2 Fat reduction versus usual fat diet, adult RCTs ‐ subgrouping, Outcome 6 Weight ‐ subgrouped by advice vs provided.

Comparison 2 Fat reduction versus usual fat diet, adult RCTs ‐ subgrouping, Outcome 7 Weight subgrouped by fat goals.

Comparison 2 Fat reduction versus usual fat diet, adult RCTs ‐ subgrouping, Outcome 8 Weight, kg subgrouped of above below 30%E from fat.

Comparison 2 Fat reduction versus usual fat diet, adult RCTs ‐ subgrouping, Outcome 9 Weight, kg subgrouped by BMI baseline.
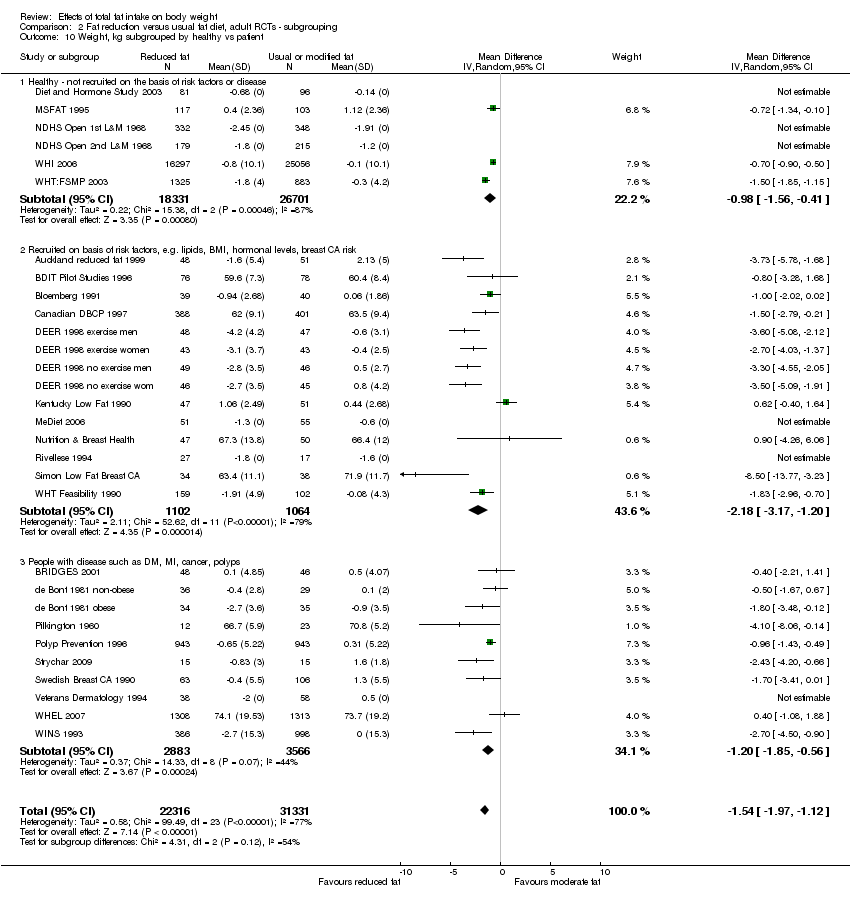
Comparison 2 Fat reduction versus usual fat diet, adult RCTs ‐ subgrouping, Outcome 10 Weight, kg subgrouped by healthy vs patient.

Comparison 2 Fat reduction versus usual fat diet, adult RCTs ‐ subgrouping, Outcome 11 Weight, kg subgrouped by energy reduction in int group.

Comparison 3 Fat reduction versus usual fat diet, adult RCTs ‐ sensitivity analyses, Outcome 1 Weight, kg ‐ removing studies with more attention to low fat arms.

Comparison 3 Fat reduction versus usual fat diet, adult RCTs ‐ sensitivity analyses, Outcome 2 Weight, kg ‐ removing studies with dietary interventions other than fat.

Comparison 3 Fat reduction versus usual fat diet, adult RCTs ‐ sensitivity analyses, Outcome 3 Weight, kg ‐ fixed‐effect analysis.

Comparison 3 Fat reduction versus usual fat diet, adult RCTs ‐ sensitivity analyses, Outcome 4 Weight, kg ‐ removing WHI.
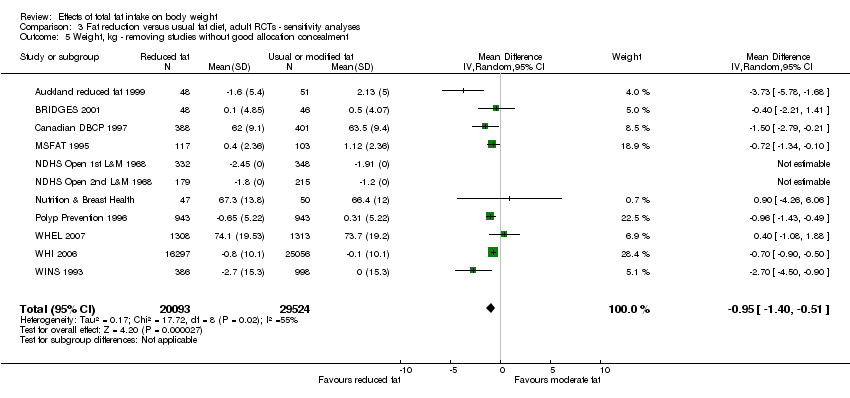
Comparison 3 Fat reduction versus usual fat diet, adult RCTs ‐ sensitivity analyses, Outcome 5 Weight, kg ‐ removing studies without good allocation concealment.

Comparison 4 Fat reduction versus usual fat, child RCTs, Outcome 1 BMI, kg/m2 ‐ in child RCTs.
| Low dietary fat compared with usual fat for body fatness | ||||||
| Patient or population: children, young people and adults from the general population Methods: randomised controlled trials | ||||||
| Outcomes | Illustrative comparative risks* (95% CI) | Relative effect | No of participants | Quality of the evidence | Comments | |
| Assumed risk | Corresponding risk | |||||
| Usual fat | Low dietary fat | |||||
| Weight, kg (adults) | Median weight change ‐0.04kg1 | The mean weight, kg (adults) in the low fat groups was | — | 53,647 | ⊕⊕⊕⊕ | — |
| *The basis for the assumed risk (e.g. the median control group risk across studies) is provided in footnotes. The corresponding risk (and its 95% confidence interval) is based on the assumed risk in the comparison group and the relative effect of the intervention (and its 95% CI). | ||||||
| GRADE Working Group grades of evidence | ||||||
| 1The median weight change in the control groups over the course of each study was ‐0.04kg, ranging from ‐1.91kg to 2.13kg. 2While most studies were unblinded for participants and allocation concealment was often unclear (as randomisation was described poorly), RCT results in adults were remarkably consistent in their direction. Sensitivity analyses removing studies without clear allocation concealment did not lose the statistically significant relative weight reduction in the low fat arm, and neither did running fixed‐effect (rather than random‐effects) meta‐analysis or removing studies with attention bias favouring those in the low fat arm, or those with other interventions alongside the fat reduction. The consistent weight loss was despite the fact that none of the studies included intended to alter weight in either arm, so that publication bias on this outcome is unlikely. Together this suggests that the risk of bias was low. | ||||||
| Study | Participants at baseline | + / 0 / ‐ | Results and/or estimate of effect? |
| CARDIA Ludwig 1999 (1) USA | 2909 healthy black and white young adults Baseline age: 18 to 30 yrs Follow‐up: 10 yrs %E from fat: unclear (lower quintile < 30, upper > 41.7) BMI: unclear | + (weight) in black men and women 0 (weight) in white men and women | Adjusted means of 10‐year body weight according to quintiles of total fat as a percentage of total energy. P for trend 0.32 in white men and women (quintile 1 weight 168.6 lb, quintile 5 weight 169.4 lb), 0.03 for black men and women (quintile 1 weight 182.1 lb, quintile 5 weight 185.7 lb) |
| Danish Diet Cancer & Health Study Halkjaer 2009 (2‐4) Denmark | 22,570 women and 20,126 men Baseline age: 50 to 64 yrs Follow‐up: 5 yrs %E from fat: unclear (approx 32% in women, 33% in men) BMI: median 24.7 women, 26.1 men | 0 (Δ waist) women 0 (Δ waist) men | Association between total fat intake at baseline and change in waist circumference over 5 years suggested no statistically significant effects in women (mean change in waist circumference ‐0.03 cm/MJ/d total fat, 95% CI ‐0.20 to 0.14) or men (mean change in waist circumference 0.06 cm/MJ/d total fat, 95% CI ‐0.05 to 0.17) |
| 12,353 women and 10,080 men Baseline age: 50 to 60 yrs Follow‐up: 5 yrs %E from fat: median 33.8% women, 35.2% in men BMI: median 24.4 women, 25.8 men | 0 (Δ waist circumference) 0 (Δ body weight) | Macronutrient energy substitution where energy from protein was replaced by fat or carbohydrate. Multiple linear regression investigated the association between dietary protein in relation to change in body weight or waist circumference over 5 years. No statistically significant effect of replacing 5%E from fat with protein on change in body weight (8.0 g/year, 95% CI ‐16.6 to 32.5, P value = 0.525) or waist circumference (0.1 mm/year, 95% CI ‐0.3 to 0.4, P value = 0.799) | |
| Danish MONICA Iqbal 2006 (5) Denmark | 900 women and 862 men Baseline age: 30 to 60 yrs Follow‐up: 5 yrs %E from fat: 43.8% (SD 6.5 women, 42.7 (SD 6.3) men BMI: 23.4 (SD 3.7 women, 25.1 (SD 3.3) men | 0 (Δ weight) women 0 (Δ weight) men | Regression assessment of total fat as %E and other dietary factors as a function of change in body weight suggested no significant effects of %E from fat on 5‐year change in body weight in women (unadjusted beta 0.47, SE 0.89, P value = 0.60, adjusted beta 0.86, SE 0.92, P value = 0.35) or men (unadjusted beta ‐0.14, SE 0.69, P value = 0.84, adjusted beta 0.11, SE 0.69, P value = 0.87) |
| Diabetes Control & Complications Trial (DCCT) & EDIC Cundiff 2012 (6) USA | 1055 women and men with diabetes, HbA1c ≤ 9.5 Baseline age: 13 to 39 yrs (mean 27.4) Follow‐up: 14 to 19 yrs (mean 16.4 yrs) %E from fat: 36.2% (90% CI 26.6 to 45.1) BMI: 23.4 (90% CI 19.4 to 27.9) | 0 (Δ BMI/year) | Multiple regression analyses generated the formula linking macronutrient intake and exercise at baseline with change in BMI per year. Univariate analyses suggested no relationship between total fat (as %E) and change in BMI per year (β 0.04 kg/m2/year, P value = 0.22), and only total fat minus polyunsaturated fat (%E, not total fat) was included in the formula predicting BMI change per year |
| EPIC‐PANACEA Vergnaud 2013 (7) Europe (10 countries) EPIC Beulens 2014 (8) Europe (15 cohorts) | 373,803 men and women from the general European population Baseline age: 25 to 70 yrs Follow‐up: 5 yrs (2 to 11) %E from fat: mean 35.4 (SD unclear) BMI: mean 25.6 women, 26.7 men (SDs unclear) | 0 (Δ weight) when replacing fat with CHO in women or men ‐ (Δ weight) when replacing fat with protein in women or men | Multivariate substitution models were performed to estimate weight change associated with replacement of 5%E of one macronutrient with another. 5% greater proportion of E from fat at the expense of carbohydrate was not associated with weight change in women or men (P value = 0.36, P value = 0.73). Replacing 5%E from protein with fat was associated with weight reduction in women (β 0.4 kg/5 years, P value < 0.0001) and men (β 0.3 kg/5 years, P value = 0.003) |
| 6192 people with type 2 diabetes Baseline age: unclear Follow‐up: 5 yrs %E from fat: unclear BMI: unclear | ‐ (Δ weight) when replacing CHO with total fat | Linear regression was used to explore the relationship between replacement of CHO with total fat (and also MUFA and PUFA) and 5‐year weight change. This is an abstract so results reported as "5‐year weight change decreased when carbohydrates were substituted with total fat" (no further details) | |
| Health Professionals Follow‐Up Study (HPFUS) Coakley 1998 (9) USA | 19,478 male health professionals Baseline age: 45 to 75 yrs Follow‐up: 4 yrs %E from fat: unclear, energy adjusted fat intake mean 69.6 g/d (SD 13.8) BMI: unclear | + (Δ weight) 45 to 54 yrs men + (Δ weight) 55 to 64 yrs men 0 (Δ weight) 65+ yrs men | Multivariate regression analyses determined whether total fat intake and other habits were predictive of 4‐year weight change, and found that a change of adjusted fat intake of 10 g/d predicted 0.10 kg of weight change over 4 years (P value < 0.001 for ages 45 to 54 and 55 to 64 years, P value > 0.05 for age 65+) |
| Melbourne Collaborative Cohort Study (MCCS) MacInnis 2013 (10) Australia | 5879 healthy Australian‐born non‐smokers Baseline age: 40 to 69 yrs Follow‐up: 11.7 yrs %E from fat: 33% (SD 6) women, 33 (SD 5) men BMI: unclear | + (weight) overall + (waist circumference) overall + (weight) 40 to 49 yrs 0 (weight) 50 to 59 yrs 0 (weight) 60 to 69 yrs + (waist) 40 to 49 yrs + (waist) 50 to 59 yrs 0 (waist) 60 to 69 yrs | Multivariable linear regression was used to predict waist circumference and weight at 12‐year follow‐up. Higher percentage of energy from fat at baseline was associated with weight (0.26 kg per 10%E from fat, P value = 0.03) and waist circumference (0.85 cm per 10%E from fat, P value < 0.001) in the whole sample. When assessed in age bands, total fat was associated with weight in those aged 40 to 49 years at baseline (P value = 0.002), but not in those aged 50 to 59 (P value = 0.94) or 60 to 69 years (P value = 0.79), and with waist circumference in those aged 40 to 49 (P value < 0.001) and 50 to 59 (P value = 0.01), but not in those aged 60 to 69 (P value = 0.14) |
| Memphis Klesges 1992 (11‐13) USA | 152 women and 142 men (Caucasian health professionals) Baseline age: 24 to 52 yrs Follow‐up: 2 yrs %E from fat: mean 36.8 (SD 6.1) women, 36.0 (SD 5.4) men BMI: mean 24.8 (SD 5.0) women, 27.8 (SD 4.3) men | + (Δ weight) women 0 (Δ weight) men 0 (Δ waist) women ‐ (Δ waist) men | Stepwise multivariate regression analyses assessed whether various lifestyle factors were predictive of weight change over 2 years. Percentage of energy as fat was predictive of weight change in women (coefficient 0.53, SE 0.16, P value = 0.0010) but not in men (exact data not provided) Hierarchical linear regression assessed the effects of lifestyle factors on change in waist circumference over 2 years, and found no significant effect in women (coefficient ‐0.04, P value = 0.50) but a statistically significant negative relationship in men (coefficient ‐0.05, P value = 0.04) |
| NHANES Follow‐up Kant 1995 (14) USA | 4567 women and 2580 men Baseline age: 25 to 74 yrs Follow‐up: mean 10.6 (SD 5) yrs %E from fat: mean 36.4 (SD 5.0) women, 37.0 (SD 10.1) men BMI: mean 25.2 (SD 5.0) women, 25.9 (SD 5.0) men | + (Δ weight) < 50 yrs women 0 (Δ weight) 50+ yrs women 0 (Δ weight) < 50 yrs men 0 (Δ weight) 50+ yrs men | Univariate regression analyses assessed whether fat as %E is predictive of 10‐year weight change and found no significant effects in women (Beta ‐0.011, SE 0.017, P value = 0.51) or men (Beta 0.043, SE 0.022, P value = 0.06). Effects were similar in multivariate regression in women (Beta ‐0.033, SE 0.019, P value = 0.08 for women overall, Beta ‐0.053, SE 0.025, P value = 0.04 for women aged < 50 yrs, Beta ‐0.019, SE 0.030, P value = 0.55 for women aged 50+) or men (Beta 0.021, SE 0.022, P value = 0.33 for men overall, Beta ‐0.004, SE 0.028, P value = 0.88 for men aged < 50 yrs, Beta ‐0.058, SE 0.035, P value = 0.10 for men aged 50+) |
| Nurses' Health Study Colditz 1990 (15) Field 2007 (16) USA | 31,940 women (nurses) Baseline age: 30 to 55+ Follow‐up: 8 yrs %E from fat: unclear BMI: unclear | 0 (Δ weight) women | Correlation between total fat (g/d) and weight gain over subsequent 4 years (beta ‐0.0007, t ‐0.4), not statistically significant |
| 41,518 women (nurses) Baseline age: 41 to 68 yrs (mean 53.7, SD 7.1 yrs) Follow‐up: 8 yrs %E from fat: 32.8 (SD 5.6) BMI: 25.0 (SD 4.5) | ? unclear (Δ weight) women | Association between a 1% difference in total fat as %E and weight change (in pounds over 8 years) was modelled using linear regression. There was a weak relationship between total fat and weight change (β 0.11 lb/1% total fat difference, P value < 0.0001 stated in text, but no statistical significance indicated in table) | |
| Pawtucket HHP Parker 1997 (17) USA | 289 women and 176 men Baseline age: 18 to 64 yrs Follow‐up: 4 yrs %E from fat: unclear BMI: mean 26.5 (SD 5.0) | 0 (Δ weight) women and men | Multiple regression assessed association of weight change with different nutrients at baseline. Found no effect of total fat in grams on weight change over 4 years (coefficient 2.30, P value = 0.71) |
| San Luis Valley Diabetes Study (SLVDS) Mosca 2004 (18) USA | 433 women and 349 men ‐ non‐diabetic, Hispanic and non‐Hispanic white Baseline age: 20 to 74 yrs Follow‐up: 14 yrs %E from fat: mean 38.3 (SD 8.9) white women, 37.2 (8.9) Hispanic women, 38.9 (8.7) white men, 37.8 (9.8) Hispanic men BMI: mean 24.3 (SD 4.4) white women, 25.0 (4.6) Hispanic women, 25.7 (3.3) white men, 24.7 (3.8) Hispanic men | + (Δ weight) overall (includes women and men, Hispanic and non‐Hispanic white) | Linear mixed model (random‐effects, PROC MIXED in SAS) was used to assess whether those who generally consume a relatively high fat diet gain more weight over time. They found a significant association between %E from total fat and weight change between participants (β 0.012, P value = 0.0178) after adjusting for potential confounders |
| SEASONS Ma 2005 (19) USA | 275 healthy women and 297 healthy men Baseline age: 20 to 70 yrs Follow‐up: 1 yr %E from fat: mean 36.7 (SD 9.0) BMI: mean 27.4 (SD 5.5) | 0 (BMI) women and men – with no energy adjustment | Regression analyses to assess effects of total fat %E on BMI. Longitudinal effect was not statistically significant (coefficient 0.005, P value = 0.07) |
| Women’s Gothenburg Lissner 1997 (20) Sweden | 361 women Baseline age: 38 to 60 yrs Follow‐up: 6 yrs %E from fat: mean 34.1 (SD 4.0) lower fat group, 42.3 (SD 3.0) higher fat group BMI: mean 24.6 (SD 4.1) lower fat group, 24.1 (SD 4.1) higher fat group | + (Δ weight) sedentary 0 (Δ weight) moderate 0 (Δ weight) active | Multivariate regression used to test for interactive effects of dietary fat intake on weight change over 6 years. A significant effect of high vs low %E from fat was found in sedentary women (high fat women gained 2.64 kg while low fat women lost 0.64 kg over 6 years, P value = 0.03) but this was lost with further energy adjustment. No effects were seen in more active women (2 categories), where those with low and high fat intakes all gained 1 to 2 kg on average |
| Key: + = positive relationship found between fat intake and weight outcome. 0 = no relationship found between fat intake and weight outcome. ‐ = negative (inverse) relationship found between fat intake and weight outcome. Abbreviations: BMI: body mass index; CHO: carbohydrates; CI: confidence interval; MUFA: monounsaturated fatty acid; PUFA: polyunsaturated fatty acid; SD: standard deviation; SE: standard error. References for this table: (1) Ludwig DS, Pereira MA, Kroenke CH, Hilner JE, Van Horn L, Slattery MI, et al. Dietary fiber, weight gain, and cardiovascular disease risk factors in young adults. JAMA 2006;282:1539‐46. (2) Halkjaer J, Tjonneland A, Thomsen BL, Overvad K, Sorensen TIA. Intake of macronutrients as predictors of 5‐y changes in waist circumference. American Journal of Clinical Nutrition 2006;84:789‐97. (3) Halkjaer J, Tjonneland A, Overvad K, Sorensen TIA. Dietary predictors of 5‐year changes in waist circumference. Journal of the American Dietetic Association 2009;109(8):1356‐66. (4) Ankarfeldt MZA. Interactions of dietary protein and adiposity measures in relation to subsequent changes in body weight and waist circumference. Obesity 2014;22(9):2097‐103. (5) Iqbal SI, Helge JW, Heitmann BL. Do energy density and dietary fiber influence subsequent 5‐year weight changes in adult men and women? Obesity (Silver Spring) 2006;14:106‐14. (6) Cundiff DK, Raghuvanshi N. Future body mass index modelling based on macronutrient profiles and physical activity. Theoretical Biology & Medical Modelling 2012;9:43. (7) Vergnaud A‐CN. Macronutrient composition of the diet and prospective weight change in participants of the EPIC‐PANACEA Study. PLoS One 2013;8(3). (8) Beulens JWJ. Dietary fat intake in low‐carbohydrate diets and subsequent mortality and weight change in type 2 diabetes. Diabetologia 2014;57(Suppl 1):S311. (9) Coakley EH, Rimm EB, Colditz GA, Kawachi I, Willett WC. Predictors of weight change in men: results from the health professionals follow‐up study. International Journal of Obesity (Lond) 1998;22:89‐96. (10) MacInnes RJ, Hodge AM, Dixon HG, Peeters A, Johnson LEA, English DR, et al. Predictors of increased body weight and waist circumference for middle‐aged adults. Public Health Nutrition 2013;17(5):1087‐97. (11) Eck LH, Pascale RW, Klesges RC, White Ray JA, Klesges LM. Predictors of waist circumference change in healthy young adults. International Journal of Obesity (Lond) 1995;19:765‐9. (12) Klesges RC, Isbell TR, Klesges LM. Relationship between dietary restraint, energy intake, physical activity, and body weight: a prospective analysis. Journal of Abnormal Psychology 1992;101:668‐74. (13) Klesges RC, Klesges LM, Haddock CK, Eck LH. A longitudinal analysis of the impact of dietary intake and physical activity on weight change in adults. American Journal of Clinical Nutrition 1992;55:818‐22. (14) Kant AK, Graubard BI, Schatzkin A, Ballard‐Barbash R. Proportion of energy intake from fat and subsequent weight change in the NHANES I Epidemiologic Followup Study. American Journal of Clinical Nutrition 1995;61:11‐7. (15) Colditz GA, Willett WC, Stampfer MJ, London SJ, Segal MR, Speizer FE. Patterns of weight change and their relation to diet in a cohort of healthy women. American Journal of Clinical Nutrition 1990;51:1100‐5. (16) Field AE, Willett WC, Lissner L, Colditz GA. Dietary fat and weight gain among women in the Nurses' Health Study. Obesity (Silver Spring) 2007;15(4):967‐76. (17) Parker DR, Gonzalez S, Derby CA, Gans KM, Lasater TM, Carleton RA. Dietary factors in relation to weight change among men and women from two southeastern New England communities. International Journal of Obesity (Lond) 1997;21:103‐9. (18) Mosca CL, Marshall JA, Grunwald GK, Cornier MA, Baxter J. Insulin resistance as a modifier of the relationship between dietary fat intake and weight gain. International Journal of Obesity (Lond) 2004;28:803‐12. (19) Ma Y, Olendzki BC, Chiriboga D, Hebert JR, Li Y, Li W, et al. Association between dietary carbohydrates and body weight. American Journal of Epidemiology 2005;161:359‐67. (20) Lissner L, Heitmann BL, Bengtsson C. Low‐fat diets may prevent weight gain in sedentary women. Obesity Research 1997;5(1):43‐8. | |||
| Study | Participants at baseline | + / 0 / ‐ | Results and/or estimate of effect |
| Adelaide Nutrition Study Magarey 2001 (1) Australia | 243 boys and girls Age: diet analysed at 2, 4, 6, 8, 11, 13 and 15 years old Follow‐up: assessed for each gap (e.g. 2 to 4 years, 2 to 6 years, 2 to 8 years, 4 to 6 years etc), 2 to 13 years %E from fat: boys aged 2 yrs 38.4 (SD 5.8), girls aged 2 38.1 (SD 13.4), boys aged 15 33.2 (SD 5.6), girls aged 15 yrs 34.4 (SD 5.6) BMI: boys aged 2 yrs 16.8 (SD 1.7), girls aged 2 16.5 (SD 1.4), boys aged 15 20.2 (SD 2.6), girls aged 15 yrs 21.4 (SD 4.1) | 0 (BMI) for 20 of 21 possible age gaps 0 (triceps skinfold) for 21 of 21 possible age gaps 0 (sub‐scapular skinfold) for 20 of 21 possible age gaps | Single dietary assessment for each of 21 analyses Analysis: multiple regression analysis was used to predict whether body fatness at a specific age was predicted by macronutrient intake at previous ages. For BMI only one of 21 possible gaps showed a statistically significant relationship between total fat intake as a percentage of energy and later BMI (a significant relationship, P value < 0.01, was only seen between fat at age 6 and BMI at age 8). For triceps skinfold none of 21 possible gaps showed a statistically significant relationship between total fat intake as a percentage of energy and later triceps skinfold. For subscapular skinfold only one of 21 possible gaps showed a statistically significant relationship between total fat intake as a percentage of energy and later sub‐scapular skinfold (a significant relationship, P value < 0.01, was only seen between fat at age 2 and skinfold at age 15) |
| Amsterdam Growth & Health Long. Study (AGAHLS) Twisk 1998, Koppes 2009 (2;3) Netherlands | 83 boys (then men) and 98 girls (then women) Age: recruited aged 13, diet analysed at ages 13, 14, 15, 16, 21, 27 Follow‐up: 14 yrs (age 27) %E from fat: not reported BMI: boys aged 13 yrs 17.3 (SD 1.6), girls 18.1 (SD 2.1), men aged 27 yrs 22.6 (SD 2.2), women 21.9 (SD 2.5) | 0 (sum of 4 skinfolds) 0 (BMI) Both for absolute fat intake and %E from fat | Multiple dietary assessments Analysis: first order auto‐regressive model (fatness at each time point related to exposure at the previous time point) estimated by generalised estimating equations. There was no relationship between total fat intake (absolute, g/d) and later fatness as assessed by sum of four skinfolds (P value = 0.41) or BMI (P value = 0.23), or between fat intake as %E and later fatness as assessed by sum of four skinfolds (P value = 0.92) or BMI (P value = 0.69) |
| 168 boys (then men) and 182 girls (then women) Age: recruited aged 13 (SD 0.7), diet analysed at ages 13, 14, 15, 16, 21, 27, 32, 36 Follow‐up: 23 yrs (age 36) %E from fat: not reported BMI: as above | 0 (high %body fat at age 36), 0 of 14 analyses 0 (% body fatness) in men or women | Multiple dietary assessments Analysis: generalised estimating equation regression analyses found that dietary fat intake (%E) at ages 13, 14, 15, 16, 21, 27 or 32 did not predict high body fatness (> 25% for men, > 35% for women, assessed by DEXA at 36 years) in either men or women (in any of 7 analyses in men or 7 in women). Regression coefficients using all available data gathered between ages 13 and 36 found no relationship between %E from fat and sum of skinfolds in either men (P value = 0.42) or women (P value = 0.89) | |
| Bogaert 2003 (4) Australia | 29 boys and 30 girls Age: recruited aged 6 to 9 yrs, mean 8.6 (SE 0.2) yrs Follow‐up: at 6 and 12 mo %E from fat: 33.5 (SD 0.8) in boys aged < 8 yrs, 31.7 (SD 2.7) girls < 8 yrs, 37.5 (SD 1.2) boys aged 8+ yrs, 33.6 (SD 1.7) girls aged 8+ yrs BMI: z scores boys mean 0.3 (SE 0.1), girls mean 0.5 (SE 0.3) | 0 (Δ BMI) | Single dietary assessment Analysis: correlations were calculated to assess the relation between %E from fat at baseline and BMI z‐score change from baseline to 12 months. No "positive relation" was found |
| Carruth and Skinner 2001 (5;6) USA | 29 white boys and 24 girls Age: recruited at 24 months, diet assessed at 24 to 32, 28 to 36, 42, 48, 54, 60 months old Follow‐up: body fat assessed at 70 months %E from fat: 31% boys, 32% girls at 27 months, 31% boys, 33% girls at 60 months BMI: 15.7 (SD 1.2) in boys and 15.4 (SD 1.0) in girls at 60 months | + (%body fat) + (g body fat) | Multiple dietary assessments Analysis: regression analyses (general linear models) of total fat intake (averaging over 6 dietary assessments aged 27 to 60 months) predicted body fat at 70 months (assessed as %body fat, P value = 0.02 and grams of body fat, P value = 0.01, both assessed by DEXA) |
| 37 white boys and 33 girls Age: recruited at 24 months (except 2 joined at 1 year, 6 joined at 2 years from similar study), diet assessed at 2.0, 2.3, 2.7, 3.0, 3.5, 4.0, 4.5, 5.0, 6.0, 7.0, 8.0 yrs old Follow‐up: BMI assessed at 8 yrs %E from fat: mean 32% (SD not stated) BMI: 16.5 in boys and 16.2 in girls at 2 yrs, 16.8 in boys and 17.1 in girls at 8 yrs | + (BMI) by g/d of fat + (BMI) by %E from fat | Multiple dietary assessments Analysis: forward stepwise regression was used to assess the relationship between dietary fat (averaged from 9 sets of 3‐day dietary data from ages 2 to 8) and BMI at age 8 years. Whether assessing fat as g/d (P value = 0.004) or %E from fat (P value = 0.010) there was a significant relationship (adjusted for BMI at 2 years and adiposity rebound age) | |
| Davison 2001 (7) USA | 197 non‐Hispanic white girls Age: 5.4 (0.4) yrs Follow‐up: 2 yrs (age 7.3 ±0.3) %E from fat: 31 (SD unclear) BMI: 15.8 (1.4) | + (Δ BMI) | Single dietary assessment Analysis: in hierarchical regression models, girls' fat intake (as %E) at 5 yrs had a significant relationship with change in BMI from 5 to 7 years, P value = 0.02 |
| Etude Longitud. Alimentation Nutrition Croissance des Enfants (ELANCE) Rolland‐Cachera 2013 (8) France | 40 boys and 33 girls whose diets were assessed at 2 yrs Age: 2 yrs Follow‐up: 18 years (age 20) %E from fat: 31.9 (SD 5.7) boys, 32.8 (SD 4.5) girls BMI: unclear | 0 (BMI) 0 (% triceps skinfold) ‐ (% sub‐scapular skinfold) ‐ (fat mass) | Single dietary assessment (for this analysis) Analysis: association between dietary intake at 2 years and adult body composition was analysed using linear regression models. No statistically significant relationships were found between %E from fat at 2 years and BMI (P value = 0.23), % triceps skinfold (P value = 0.19), or fat‐free mass (P value = 0.98) at age 20. Greater total fat intake predicted lower % subscapular skinfold (P value = 0.03) and fat mass (P value = 0.04). All data presented from the adjusted models |
| European Youth Heart Study Brixval 2009 (9) Denmark | 171 girls and 137 boys (but total of 384 stated also, numbers vary between tables) Age: boys 9.7 (SD 0.4) yrs, girls 9.6 (SD0.4) yrs Follow‐up: 6 years (age 15 to 16) %E from fat: 32.1 (SD 6.6) boys, 33.3 (SD 6.7) girls BMI: 17.1 (SD 2.0) boys, 17.2 (SD 2.4) girls | 0 (Δ BMI z‐score) boys 0 (Δ BMI z‐score) girls | Single dietary assessment. Analysis: examined the associations between dietary fat intake at 9 years and subsequent 6‐year weight development using regression analysis. None of the regression models (various levels of adjustment) suggested that fat %E was associated with change in BMI over 6 years (in boys P value = 0.27, girls P value = 0.75 in the most adjusted model) |
| Klesges 1995 (10) USA | 110 boys and 93 girls Age: 3 to 5 yrs (boys 4.4 (0.5), girls 4.3 (0.5) Follow‐up: 2 yrs %E from fat: boys and girls 33.0 (5.0) BMI: boys 16.1 (1.4), girls 16.1 (1.2) | 0 /+ /0/0 (Δ BMI) | Multiple dietary assessments Analysis: assessed whether baseline %E from fat, change from baseline to 1 year, 1 yr to 2 yrs, or baseline to 2 yrs (along with other variables) predicted change in BMI over 2 yrs Multiple regression analysis suggested lower baseline %E from fat correlated to lower BMI change (regression coefficient = 0.034, P value = 0.05 – marginal significance) at 2 yrs, 0.17 k/m2per 5% more E from fat Change in %E from fat over the last year was correlated with BMI change (regression numbers not legible, probably P value = 0.01), 0.20 kg/m2 per 5%E from fat change. Change in %E from fat from baseline to 1 yr, and baseline to 2 yrs did not predict change in BMI |
| Obesity & Metabolic Disorders Cohort in Children (OMDCC) Lee 2012 (11) Korea | 1504 1st and 4th grade children Age: 7.3 (SD 0.3) in 1st graders, 10.0 (SD 0.4) years in 4th graders Follow‐up: 2 years %E from fat: 26.6 (SD 4.9) in 1st graders, 25.2 (SD 5.1) in 4th graders BMI: 16.0 (SD 2.3) in 1st graders, 18.1 (SD 3.0) in 4th graders | 0 (Δ BMI) | Single dietary assessment Multiple linear regression modelling assessed relationships between baseline environmental factors, parental and lifestyle habits and change in BMI over 2 years. They found no statistically significant relationship between fat intake and change in BMI over 2 years (P value = 0.104) |
| Trial of Activity for Adolescent Girls (TAAG) Cohen 2014 (12) USA | 265 girls in 8th grade Age: mean 13.9 (SD 0.4) yrs Follow‐up: 2 and 3 yrs %E from fat: unclear BMI: mean 22.1 (SD 5.2) | 0 (BMI percentile) ‐ (% body fat) | Single dietary assessment Multivariable random coefficients model designed to examine whether habitual physical activity, diet and environmental exposure were predictive of future weight gain or percentage body fat. The multivariate model found no relationship between fat calories at baseline and BMI percentile (P value = 0.16), but suggested a reduction in % body fat associated with increased fat calories (P value = 0.03) |
| Viva la Familia Study Butte 2007 (13) USA | 1030 Hispanic boys and girls (unclear how many of each) Age: unclear, 4 to 19 yrs? Follow‐up: 1 yr %E from fat: 34.0 (6.0) BMI: not stated | + (Δ weight) | Single dietary assessment Analysis: %E from fat was positively correlated with 1 yr weight gain (kg/y). For 798 participants generalised estimating equations (GEE) suggested coefficient 0.044, SD 0.018, P value = 0.014 |
| Key: + = positive ss relationship found between fat intake and weight outcome. 0 = no ss relationship found between fat intake and weight outcome. ‐ = negative (inverse) ss relationship found between fat intake and weight outcome. Abbreviations: BMI: body mass index; DEXA: dual energy X‐ray absorptiometry; SD: standard deviation; SE: standard error; ss: statistically significant References for this table: (1) Magarey AM, Daniels LA, Boulton TJC, Cockington RA. Does fat intake predict adiposity in healthy children and adolescents aged 2‐15 y? A longitudinal analysis. European Journal of Clinical Nutrition 2001;55:471‐81. (2) Twisk JWR, Kempner HCG, van Mechelen W, Post GB, van Lenthe FJ. Body fatness: longitudinal relationship of body mass index and the sum of skinfolds with other risk factors for coronary heart disease. International Journal of Obesity (Lond) 1998;22:915‐22. (3) Koppes LLJ, Boon N, Nooyens ACJ, van Mechelen W, Saris WHM. Macronutrient distribution over a period of 23 years in relation to energy intake and body fatness. British Journal of Nutrition 2009;101:108‐15. (4) Bogaert N, Steinbeck KS, Baur LA, Brock K, Bermingham MA. Food, activity and family ‐ environmental vs biochemical predictors of weight gain in children. European Journal of Clinical Nutrition 2003;57:1242‐9. (5) Carruth BR, Skinner JD. The role of dietary calcium and other nutrients in moderating body fat in preschool children. International Journal of Obesity (Lond) 2001;25:559‐66. (6) Skinner JD, Bounds W, Carruth BR, Morris M, Ziegler P. Predictors of children's body mass index: a longitudinal study of diet and growth in children aged 2‐8 years. International Journal of Obesity (Lond) 2004;28:476‐82. (7) Davison KK, Birch LL. Child and parent characteristics as predictors of change in girls' body mass index. International Journal of Obesity (Lond) 2001;25:1834‐42. (8) Rolland‐Cachera MF, Maillot M, Deheeger M, Souberbielle JC, Peneau S, Hercberg S, et al. Association of nutrition in early life with body fat and serum leptin at adult age. International Journal of Obesity 2013 Aug;37(8):1116‐22. (9) Brixval CS, Anderson LB, Heitmann BL. Fat intake and weight development from 9 to 16 years of age: the European Youth Heart Study ‐ a Longitudinal Study. Obesity Facts 2009;3:166‐70. (10) Klesges RC, Klesges LM, Eck LH, Shelton ML. A longitudinal analysis of accelerated weight gain in preschool children. Pediatrics 1995;95:126‐30. (11) Lee HH, Park HA, Kang JH, Cho YG, Park JK, Lee R, et al. Factors related to body mass index and body mass index change in Korean children: preliminary results from the obesity and metabolic disorders cohort in childhood. Korean Journal of Family Medicine 2012 May;33(3):134‐43. (12) Cohen DAG. Energy balance in adolescent girls: The trial of activity for adolescent girls cohort. Obesity (Silver Spring) 2014;22(3):772‐80. (13) Butte NF, Cai G, Cole SA, Wilson TA, Fisher JO, Zakeri IF, et al. Metabolic and behavioral predictors of weight gain in Hispanic children: The Viva la Familia Study. American Journal of Clinical Nutrition 2007;85:1478‐85. | |||
| Study | Reason for exclusion |
| Alexy U, Reinehr T, et al. (2006). Positive changes of dietary habits after an outpatient training program for overweight children. Nutrition Research 26(5): 202‐8 | Weight loss intention |
| Amesz EMS. Optimal growth and lower fat mass in preterm infants fed a protein‐enriched postdischarge formula. Journal of Pediatric Gastroenterology and Nutrition. 2010;50(2):200‐7 | Includes infants |
| Anand SS, Davis AD, et al. (2007). A family‐based intervention to promote healthy lifestyles in an aboriginal community in Canada. Canadian Journal of Public Health Revue Canadienne de Sante Publique. 98(6): 447‐52 | Weight loss intention |
| Angelopoulos PD, Milionis HJ, et al. (2009). Changes in BMI and blood pressure after a school based intervention: the CHILDREN study. European Journal of Public Health 19(3): 319‐25 | Multifactorial intervention |
| Burrows TJ. Long‐term changes in food consumption trends in overweight children in the HIKCUPS intervention. Journal of Pediatric Gastroenterology and Nutrition. 2011;53(5):543‐7 | All obese or overweight at baseline |
| Dal Molin Netto B, Landi Masquio DC, Da Silveira Campos RM, De Lima Sanches P, Campos Corgosinho F, Tock L, et al. The high glycemic index diet was an independent predictor to explain changes in agouti‐related protein in obese adolescents. Nutricion Hospitalaria. 2014;29(2):305‐14 | Obese adolescents |
| Evans RK, Franco RL, et al. (2009). Evaluation of a 6‐month multi‐disciplinary healthy weight management program targeting urban, overweight adolescents: effects on physical fitness, physical activity, and blood lipid profiles. International Journal of Pediatric Obesity 4(3): 130‐3 | Multifactorial intervention, weight loss goal |
| Forneris T, Fries E, et al. (2010). Results of a rural school‐based peer‐led intervention for youth: goals for health. Journal of School Health 80(2): 57‐65 | No relevant outcomes |
| Garnett SPB. Researching Effective Strategies to Improve Insulin Sensitivity in Children and Teenagers ‐ RESIST. A randomised control trial investigating the effects of two different diets on insulin sensitivity in young people with insulin resistance and/or pre‐diabetes. BMC Public Health. 2010;10(pp 575):2010. 2. Garnett SPD. Optimum macronutrient content of the diet for adolescents with pre‐diabetes; RESIST a randomised control trial ACTRN12608000416392. Endocrine Reviews. 2012;Conference(var.pagings) | All obese or overweight at baseline |
| Hernandez TLA. Women with gestational diabetes randomised to a low‐carbohydrate/higher fat diet demonstrate greater insulin resistance and infant adiposity. Diabetes. 2013;Conference(var.pagings):July | Effect on infants |
| Horan MKM. The association of maternal characteristics and macronutrient intake in pregnancy with neonatal body composition. Archives of Disease in Childhood: Fetal and Neonatal Edition. 2014;Conference(var.pagings):June | Infants |
| Jebb SA, Frost G, et al. (2007). The RISCK study: Testing the impact of the amount and type of dietary fat and carbohydrate on metabolic risk. Nutrition Bulletin 32(2): 154‐6 | Design paper |
| Kaitosaari T, Ronnemaa T, et al. (2006). Low‐saturated fat dietary counselling starting in infancy improves insulin sensitivity in 9‐year‐old healthy children: the Special Turku Coronary Risk Factor Intervention Project for Children (STRIP) study. Diabetes Care 29(4): 781‐5 | No relevant outcomes |
| Lagstrom H, Hakanen M, et al. (2008) Growth patterns and obesity development in overweight or normal‐weight 13‐year‐old adolescents: the STRIP study. Pediatrics 122(4): e876‐83 | No relevant exposures |
| Mirza NM, Palmer MG, Sinclair KB, McCarter R, He J, Ebbeling CB, et al. Effects of a low glycemic load or a low‐fat dietary intervention on body weight in obese Hispanic American children and adolescents: a randomised controlled trial. American Journal of Clinical Nutrition. 2013;97(2):276‐85 | All obese at baseline |
| Mobley CCS. Effect of nutrition changes on foods selected by students in a middle school‐based diabetes prevention intervention program: The HEALTHY experience. Journal of School Health. 2012;82(2):82‐90 | No total fat intake assessment |
| Niinikoski H, Lagstrom H, Jokinen E, Siltala M, Ronnemaa T, Viikari J, et al. Impact of repeated dietary counselling between infancy and 14 years of age on dietary intakes and serum lipids and lipoproteins: the STRIP study. Circulation. 2007;116(9):1032‐40 | Aim to reduce saturated fat not total fat |
| Ramon‐Krauel MS. A low‐glycemic‐load versus low‐fat diet in the treatment of fatty liver in obese children. Childhood Obesity. 2013;9(3):252‐60 | All obese at baseline |
| Shalitin S, Ashkenazi‐Hoffnung L, et al. (2010). Effects of a twelve‐week randomised intervention of exercise and/or diet on weight loss and weight maintenance, and other metabolic parameters in obese preadolescent children. Hormone Research 72(5): 287‐301 | Weight loss/unsuitable exposures |
| Sharma SF. One‐year change in energy and macronutrient intakes of overweight and obese inner‐city African American children: Effect of community‐based Taking Action Together type 2 diabetes prevention program. Eating Behaviors. 2012;13(3):271‐4 | All obese or overweight at baseline |
| Singhal A, Kennedy K, Lanigan J, Fewtrell M, Cole TJ, Stephenson T, et al. Nutrition in infancy and long‐term risk of obesity: evidence from 2 randomised controlled trials. American Journal of Clinical Nutrition. 2010;92(5):1133‐44 | Infants |
| Thakwalakwa C, Ashorn P, Phuka J, Cheung YB, Briend A, Puumalainen T, et al. A lipid‐based nutrient supplement but not corn‐soy blend modestly increases weight gain among 6‐ to 18‐month‐old moderately underweight children in rural Malawi. Journal of Nutrition 2010;140(11):2008‐13 | Duration < 26 weeks |
| Williamson DA, Han H, Johnson WD, Martin CK, Newton RL, Jr. Modification of the school cafeteria environment can impact childhood nutrition. Results from the Wise Mind and LA Health studies. Appetite. 2013;61(1):77‐84 | Weight loss aimed |
| Williamson DA, Copeland AL, et al. (2007). Wise Mind project: a school‐based environmental approach for preventing weight gain in children. Obesity 15(4): 906‐17 | Multifactorial intervention |
| Study | Reason for exclusion |
| Adams T, Rini A (2007). Predicting 1‐year change in body mass index among college students. Journal of American College Health 55(6): 361‐5 | No relevant exposures |
| Aerenhouts D, Deriemaeker P, Hebbelinck M, Clarys P, Aerenhouts D, Deriemaeker P, et al. Energy and macronutrient intake in adolescent sprint athletes: a follow‐up study. Journal of Sports Sciences. 2011;29(1):73‐82 | No relationship between total fat and body fatness |
| Ahluwalia N, Ferrieres J, et al. (2009). Association of macronutrient intake patterns with being overweight in a population‐based random sample of men in France. Diabetes & Metabolism 35(2): 129‐36 | Invalid study design |
| Aljadani HM, Patterson A, Sibbritt D, Hutchesson MJ, Jensen ME, Collins CE. Diet quality, measured by fruit and vegetable intake, predicts weight change in young women. Journal of Obesity. 2013;2013:525161 | No relevant outcomes |
| Almoosawi S, Prynne CJ, Hardy R, Stephen AM. Time‐of‐day and nutrient composition of eating occasions: prospective association with the metabolic syndrome in the 1946 British birth cohort. International Journal of Obesity. 2013;37(5):725‐31 | No total fat assessment |
| Al‐Sarraj T, Saadi H, et al. (2010). Metabolic syndrome prevalence, dietary intake, and cardiovascular risk profile among overweight and obese adults 18‐50 years old from the United Arab Emirates. Metabolic Syndrome & Related Disorders 8(1): 39‐46 | Cross‐sectional study |
| Althuizen E, van Poppel MN, de Vries JH, Seidell JC, van MW, Althuizen E, et al. Postpartum behaviour as predictor of weight change from before pregnancy to one year postpartum. BMC Public Health. 2011;11:165 | Total fat assessment is not baseline |
| Bailey BWS. Dietary predictors of visceral adiposity in overweight young adults. British Journal of Nutrition. 2010;103(12):1702‐5 | Cross‐sectional |
| Berg CM, Lappas G, et al. (2008). Food patterns and cardiovascular disease risk factors: the Swedish INTERGENE research program. American Journal of Clinical Nutrition 88(2): 289‐97 | Invalid study design |
| Bes‐Rastrollo M, van Dam RM, et al. (2008) Prospective study of dietary energy density and weight gain in women. American Journal of Clinical Nutrition 88(3): 769‐77 | Not total fat to body fatness |
| Black MHW. High‐fat diet is associated with obesity‐mediated insulin resistance and beta‐cell dysfunction in Mexican Americans. Journal of Nutrition. 2013;143(4):479‐85. 2. Black MHW. Variants in PPARG interact with high‐fat diet to influence longitudinal decline in beta‐cell function in Mexican Americans at risk for type 2 diabetes (T2D). Diabetes. 2014;Conference(var.pagings):June | Not prospective |
| Bujnowski D, Xun P, Daviglus ML, Van HL, He K, Stamler J, et al. Longitudinal association between animal and vegetable protein intake and obesity among men in the United States: the Chicago Western Electric Study. Journal of the American Dietetic Association. 2011;111(8):1150‐5 | No total fat intake assessment |
| Carvalho LKB. Annual variation in body fat is associated with systemic inflammation in chronic kidney disease patients Stages 3 and 4: A longitudinal study. Nephrology Dialysis Transplantation. 2012;27(4):1423‐8 | No total fat assessment and chronic kidney disease |
| Castellanos DC, Connell C, Lee J. Factors affecting weight gain and dietary intake in Latino males residing in Mississippi: a preliminary study. Hispanic Health Care International. 2011;9(2):91‐8 | Cross‐sectional |
| Chang A, Van Horn L, Jacobs Jr DR, Liu K, Muntner P, Newsome B, et al. Lifestyle‐related factors, obesity, and incident microalbuminuria: the CARDIA (Coronary Artery Risk Development in Young Adults) Study. American Journal of Kidney Diseases. 2013;62(2):267‐75 | Assesses dietary patterns |
| Chopra VP. Dietary factors affecting weight gain in midlife women. FASEB Journal. 2013;Conference(var.pagings):April | All overweight or obese at baseline |
| de Groot S, Post MW, Snoek GJ, Schuitemaker M, van der Woude LH. Longitudinal association between lifestyle and coronary heart disease risk factors among individuals with spinal cord injury. Spinal Cord. 2013;51(4):314‐8 | No total fat assessment |
| de Koning L, Malik VS, Kellogg MD, Rimm EB, Willett WC, Hu FB. Sweetened beverage consumption, incident coronary heart disease, and biomarkers of risk in men. Circulation. 2012;125(14):1735‐41 | No body fatness outcomes |
| Dujmovic M, Kresic G, Mandic ML, Kenjeric D, Cvijanovic O, Dujmovic M, et al. Changes in dietary intake and body weight in lactating and non‐lactating women: prospective study in northern coastal Croatia. Collegium Antropologicum. 2014;38(1):179‐87 | Follow‐up < 1 year |
| Eghtesadi SS‐K. Dietary patterns predicting changes in obesity indices (BMI,WC,WHR) in longitudinal Tehran lipid and glucose study. Annals of Nutrition and Metabolism. 2013;Conference(var.pagings):2013 | No total fat intake assessment |
| Erber E, Hopping BN, Grandinetti A, Park SY, Kolonel LN, Maskarinec G. Dietary patterns and risk for diabetes: the multiethnic cohort. Diabetes Care. 2010;33(3):532‐8 | No total fat intake assessment and no body fatness outcomes |
| Ericson U, Rukh G, Stojkovic I, Sonestedt E, Gullberg B, Wirfalt E, et al. Sex‐specific interactions between the IRS1 polymorphism and intakes of carbohydrates and fat on incident type 2 diabetes. American Journal of Clinical Nutrition. 2013;97(1):208‐16 | Cross‐sectional |
| Hairston KGV. Lifestyle factors and 5‐year abdominal fat accumulation in a minority cohort: The IRAS family study. Obesity. 2012;20(2):421‐7 | No total fat intake assessment |
| Heppe DHMV. Maternal milk consumption, fetal growth, and the risks of neonatal complications: The Generation R Study. American Journal of Clinical Nutrition. 2011;94(2):501‐9 | Fetal growth assessment |
| Holmberg S, Thelin A, Holmberg S, Thelin A. High dairy fat intake related to less central obesity: a male cohort study with 12 years' follow‐up. Scandinavian Journal of Primary Health Care. 2013;31(2):89‐94 | No total fat intake assessment |
| Ibe YT. Food groups and weight gain in Japanese men. Clinical Obesity. 2014;4(3):157‐64 | No relationship between total fat and body fatness assessed |
| Jaacks LMG. Age, period and cohort effects on adult body mass index and overweight from 1991 to 2009 in China: The China Health And Nutrition Survey. International Journal of Epidemiology. 2013;42(3):828‐37 | No total fat intake assessment |
| Jaakkola JH. Eating behavior influences diet, weight, and central obesity in women after pregnancy. Nutrition. 2013;29(10):1209‐13 | No total fat intake assessment |
| Jarvandi S, Gougeon R, Bader A, Dasgupta K, Jarvandi S, Gougeon R, et al. Differences in food intake among obese and non‐obese women and men with type 2 diabetes. Journal of the American College of Nutrition. 2011;30(4):225‐32 | Cross‐sectional |
| Johns DJ, Ambrosini GL, Jebb SA, Sjöström L, Carlsson LMS, Lindroos AK. Tracking of an energy‐dense, high saturated fat, low‐fibre dietary pattern, foods and nutrient composition over 10 years in the severely obese. Journal of Human Nutrition & Dietetics. 2011;24(4):391‐2. 2. Johns DJ, Lindroos AK, Jebb SA, Sjostrom L, Carlsson LM, Ambrosini GL, et al. Tracking of a dietary pattern and its components over 10‐years in the severely obese. PLoS One [Electronic Resource]. 2014;9(5):e97457 | No relevant outcomes |
| Kimokoti RWG. Dietary patterns of women are associated with incident abdominal obesity but not metabolic syndrome. Journal of Nutrition. 2012;142(9):1720‐7. 2. Kimokoti RWN. Diet quality, physical activity, smoking status, and weight fluctuation are associated with weight change in women and men. Journal of Nutrition. 2010;140(7):1287‐93 | No total fat intake assessment |
| Kirk JK, Craven T, Lipkin EW, Katula J, Pedley C, O'Connor PJ, et al. Longitudinal changes in dietary fat intake and associated changes in cardiovascular risk factors in adults with type 2 diabetes: the ACCORD trial. Diabetes Research & Clinical Practice. 2013;100(1):61‐8 | Compares PEP score, not total fat |
| Ko GTC, Chan JCN, et al. (2007). Associations between dietary habits and risk factors for cardiovascular diseases in a Hong Kong Chinese working population‐‐the "Better Health for Better Hong Kong" (BHBHK) health promotion campaign. Asia Pacific Journal of Clinical Nutrition 16(4): 757‐65 | No relevant exposures |
| Laatikainen T, Philpot B, Hankonen N, Sippola R, Dunbar JA, Absetz P, et al. Predicting changes in lifestyle and clinical outcomes in preventing diabetes: The Greater Green Triangle Diabetes Prevention Project. Preventive Medicine. 2012;54(2):157‐61 | No relevant outcomes |
| Manios Y, Kourlaba G, Grammatikaki E, Androutsos O, Ioannou E, Roma‐Giannikou E, et al. Comparison of two methods for identifying dietary patterns associated with obesity in preschool children: the GENESIS study. European Journal of Clinical Nutrition. 2010;64(12):1407‐14 | Cross‐sectional |
| Meidtner KF. Variation in genes related to hepatic lipid metabolism and changes in waist circumference and body weight. Genes and Nutrition. 2014;9(2) | No total fat intake assessment |
| Mejean C, Macouillard P, Castetbon K, Kesse‐Guyot E, Hercberg S, Mejean C, et al. Socio‐economic, demographic, lifestyle and health characteristics associated with consumption of fatty‐sweetened and fatty‐salted foods in middle‐aged French adults. British Journal of Nutrition. 2011;105(5):776‐86 | No total fat intake assessment |
| Mirmiran PB. Association between dietary phytochemical index and 3‐year changes in weight, waist circumference and body adiposity index in adults: Tehran Lipid and Glucose study. Nutrition and Metabolism. 2012(9):108 | No assessment of total fat on body fatness |
| Moran LJ, Ranasinha S, Zoungas S, McNaughton SA, Brown WJ, Teede HJ, et al. The contribution of diet, physical activity and sedentary behaviour to body mass index in women with and without polycystic ovary syndrome. Human Reproduction. 2013;28(8):2276‐83 | Cross‐sectional |
| Mozaffarian D, Cao H, King IB, Lemaitre RN, Song X, Siscovick DS, et al. Circulating palmitoleic acid and risk of metabolic abnormalities and new‐onset diabetes. American Journal of Clinical Nutrition. 2010;92(6):1350‐8 | No body fatness outcomes |
| Naniwadekar AS. Nutritional assessment of patients with chronic pancreatitis and impact of dietary advice. Gastroenterology. 2010;Conference(var.pagings):S393 | Pancreatitis patients |
| Neeland IJT. Dysfunctional adiposity and the risk of prediabetes and type 2 diabetes in obese adults. JAMA ‐ Journal of the American Medical Association. 2012;308(11):1150‐9 | No total fat intake assessment |
| Niu J, Seo DC, Niu J, Seo DC. Central obesity and hypertension in Chinese adults: a 12‐year longitudinal examination. Preventive Medicine. 2014;62:113‐8 | No relevant outcomes |
| Noori N, Dukkipati R, Kovesdy CP, Sim JJ, Feroze U, Murali SB, et al. Dietary omega‐3 fatty acid, ratio of omega‐6 to omega‐3 intake, inflammation, and survival in long‐term hemodialysis patients. American Journal of Kidney Diseases. 2011;58(2):248‐56 | No total fat assessment and haemodialysis patients |
| Plotnikoff RC, Karunamuni N, et al. (2009) An examination of the relationship between dietary behaviours and physical activity and obesity in adults with type 2 diabetes. Canadian Journal of Diabetes 33(1): 27‐34 | No relevant exposures |
| Qi QR. Consumption of branched chain amino acids and risk of coronary heart disease in us men and women. Circulation. 2013;Conference(var.pagings) | No total fat intake on weight assessment |
| Quatromoni PA, Pencina M, Cobain MR, Jacques PF, D'Agostino RB. Dietary quality predicts adult weight gain: findings from the Framingham Offspring Study. Obesity (Silver Spring, Md). 2006;14(8):1383‐91 | No relevant outcomes |
| Rautiainen SW. Dairy consumption and risk of becoming overweight or obese in middle‐aged and older women. Circulation. 2014;Conference(var.pagings):25 | No total fat intake assessment |
| Rukh G, Sonestedt E, Melander O, Hedblad B, Wirfalt E, Ericson U, et al. Genetic susceptibility to obesity and diet intakes: association and interaction analyses in the Malmo Diet and Cancer Study. Genes & Nutrition. 2013;8(6):535‐47 | Not prospective |
| Sammel MD, Grisson JA, Freeman EW, Hollander L, Liu L, Liu S, et al. Weight gain among women in the late reproductive years. Family Practice 2003; 20: 401–9 | No total fat assessment |
| Sanchez‐Villegas A, Bes‐Rastrollo M, Martinez‐Gonzalez MA, Serra‐Majem L. Adherence to a Mediterranean dietary pattern and weight gain in a follow‐up study: the SUN cohort. International Journal of Obesity 2006; 30: 350–8 | No relevant outcomes |
| Sayon‐Orea CB‐R. Longitudinal association between yogurt consumption and weight gain, and the risk of overweight/obesity: The SUN cohort study. Obesity Facts. 2014;Conference(var.pagings):May | No total fat intake assessment |
| Scholz U, Ochsner S, Hornung R, Knoll N, Scholz U, Ochsner S, et al. Does social support really help to eat a low‐fat diet? Main effects and sex differences of received social support within the Health Action Process Approach. Applied Psychology. 2013;Health and Well‐being. 5(2):270‐90 | All obese or overweight at baseline |
| Schulz M, Kroke A, Liese AD, Hoffmann K, Bergmann MM, Boeing H. Food groups as predictors for short‐term weight changes in men and women of the EPIC Potsdam cohort. Journal of Nutrition 2002; 132: 1335–40 | No total fat assessment |
| Sherafat‐Kazemzadeh R, Egtesadi S, Mirmiran P, Gohari M, Farahani SJ, Esfahani FH, et al. Dietary patterns by reduced rank regression predicting changes in obesity indices in a cohort study: Tehran Lipid and Glucose Study. Asia Pacific Journal of Clinical Nutrition. 2010;19(1):22‐32.2. Sherafat‐Kazemzadeh R, Egtesadi S, Mirmiran P, Hedayati M, Gohari M, Vafa M, et al. Predicting of changes in obesity indices regarding to dietary patterns in longitudinal Tehran lipid and glucose study. Iranian Journal of Endocrinology & Metabolism. 2010;12(2):197 | No assessment of total fat on body fatness |
| Simpson A, Maynard V, Simpson A, Maynard V. A longitudinal study of the effect of Antarctic residence on energy dynamics and aerobic fitness. International Journal of Circumpolar Health. 2012;71:17227 | No total fat intake assessment |
| Tanisawa KI. Strong influence of dietary intake and physical activity on body fatness in elderly Japanese men: age‐associated loss of polygenic resistance against obesity. Genes and Nutrition. 2014;9(5) | Cross‐sectional |
| Threapleton DE, Greenwood DC, Burley VJ, Aldwairji M, Cade JE, Threapleton DE, et al. Dietary fibre and cardiovascular disease mortality in the UK Women's Cohort Study. European Journal of Epidemiology. 2013;28(4):335‐46 | No total fat intake assessment |
| Vadiveloo M, Scott M, Quatromoni P, Jacques P, Parekh N, Vadiveloo M, et al. Trends in dietary fat and high‐fat food intakes from 1991 to 2008 in the Framingham Heart Study participants. British Journal of Nutrition. 2014;111(4):724‐34. 2. Vadiveloo MS. Increases in dietary fat intake among the Framingham heart study participants: Trends from 1991‐2008. Circulation. 2012;Conference(var.pagings) | No assessment of total fat on body fatness |
| Verheijden MW, van der Veen JE, van Zadelhoff WM, Bakx C, Koelen MA, van den Hoogen HJ, et al. Nutrition guidance in Dutch family practice: behavioral determinants of reduction of fat consumption. American Journal of Clinical Nutrition. 2003;77(4 Suppl):1058s‐64s | No relevant outcomes |
| Wang HT. Longitudinal association between dairy consumption and changes of body weight and waist circumference: The Framingham Heart Study.International Journal of Obesity. 2014;38(2):299‐305 | No total fat intake assessment |
| Wolongevicz DM, Zhu L, Pencina MJ, Kimokoti RW, Newby PK, D'Agostino RB, et al. Diet quality and obesity in women: the Framingham Nutrition Studies. British Journal of Nutrition. 2010;103(8):1223‐9 | No relevant outcomes |
| Yadav VM. Effects of a low fat plant based diet in multiple sclerosis (MS): results of a 1‐year long randomised controlled (RC) study. Neurology. 2014;Conference(var.pagings) | Multiple sclerosis patients |
| Yin JQ. Maternal diet, breastfeeding and adolescent body composition: A 16‐year prospective study. European Journal of Clinical Nutrition. 2012;66(12):1329‐34 | No total fat intake assessment |
| Yoshimura YK. Relations of nutritional intake to age, sex and body mass index in Japanese elderly patients with type2 diabetes: The Japanese Elderly Diabetes Intervention Trial. Geriatrics and Gerontology International. 2012;12(SUPPL.1):29‐40 | Cross‐sectional |
| Younossi ZMS. Prevalence and independent predictors of non‐alcoholic fatty liver disease (NAFLD) in lean U.S population. Hepatology. 2011;Conference(var.pagings):October | NAFLD |
| Yuan BD. Study on transition of dietary patterns in Jiangsu province, 1989‐2009, China. FASEB Journal. 2011;Conference(var.pagings):April. 2. Yuan BD. Nutrition transition in Jiangsu, China, 1989‐2009. Annals of Nutrition and Metabolism. 2013;Conference(var.pagings):2013 | No total fat intake assessment |
| Zamora D, Gordon‐Larsen P, Jacobs DR, Jr., Popkin BM, Zamora D, Gordon‐Larsen P, et al. Diet quality and weight gain among black and white young adults: the Coronary Artery Risk Development in Young Adults (CARDIA) Study (1985‐2005). American Journal of Clinical Nutrition. 2010;92(4):784‐93 | No assessment of total fat on body fatness |
| Zelber‐Sagi SL. Non‐alcoholic fatty liver disease (NAFLD) independently predicts type‐2 diabetes and pre‐diabetes during a seven‐year prospective follow‐up. Journal of Hepatology. 2012;Conference(var.pagings):April | No relevant outcomes |
| Study | Reason for exclusion |
| Alexy U, Libuda L, Mersmann S, Kersting M, Alexy U, Libuda L, et al. Convenience foods in children's diet and association with dietary quality and body weight status. European Journal of Clinical Nutrition. 2011;65(2):160‐6 | Not longitudinal |
| Ambrosini GLE. Identification of a dietary pattern prospectively associated with increased adiposity during childhood and adolescence. International Journal of Obesity (2005). 2012;36(10):1299‐305. 2.Ambrosini GLE. Tracking a dietary pattern associated with increased adiposity in childhood and adolescence. Obesity. 2014;22(2):458‐65. 3. Ambrosini GLL. An energy‐dense, high fat, low fibre dietary pattern is prospectively associated with greater adiposity in adolescent girls in the Avon longitudinal study of parents and children. Obesity Reviews. 2010;Conference(var.pagings):July | No total fat intake assessment |
| Barton AJ, Gilbert L, et al. (2006). Cardiovascular risk in Hispanic and non‐Hispanic preschoolers. Nursing Research 55(3): 172‐9 | Cross‐sectional study |
| Berz JP, Singer MR, Guo X, Daniels SR, Moore LL, Berz JPB, et al. Use of a DASH food group score to predict excess weight gain in adolescent girls in the National Growth and Health Study. Archives of Pediatrics & Adolescent Medicine. 2011;165(6):540‐6 | No total fat assessment |
| Bigornia SJL. Dairy intakes at age 10 years do not adversely affect risk of excess adiposity at 13 years. Journal of Nutrition. 2014;144(7):1081‐90 | No total fat assessment |
| Boreham C, Twisk J, van Mechelen W, Savage M, Strain J, Cran G. Relationships between the development of biological risk factors for coronary heart disease and lifestyle parameters during adolescence: The Northern Ireland Young Hearts Project. Public Health. 1999;113(1):7‐12 | No relevant outcomes |
| Burke V, Beilin LJ, Simmer K, Oddy WH, Blake KV, Doherty D, et al. Predictors of body mass index and associations with cardiovascular risk factors in Australian children: a prospective cohort study.International Journal of Obesity (Lond). 2005;29(1):15‐23 | No baseline fat intake |
| Burke V, Beilin LJ, et al. (2006). Television, computer use, physical activity, diet and fatness in Australian adolescents. International Journal of Pediatric Obesity 1(4): 248‐55 | Cross‐sectional study |
| Chaput J‐P, Tremblay A, et al. (2008). A novel interaction between dietary composition and insulin secretion: effects on weight gain in the Quebec Family Study. American Journal of Clinical Nutrition 87(2): 303‐9 | No relevant exposures |
| Davis JN, Alexander KE, et al. Inverse relation between dietary fiber intake and visceral adiposity in overweight Latino youth. American Journal of Clinical Nutrition 2009; 90(5): 1160‐6 | Unsuitable analyses |
| Deshmukh UJ. Growth and body composition changes in Indian undernourished children. Annals of Nutrition and Metabolism. 2013;Conference(var.pagings):2013 | No relevant outcomes |
| Dubois L, Farmer A, et al. (2007). Regular sugar‐sweetened beverage consumption between meals increases risk of overweight among preschool‐aged children. Journal of the American Dietetic Association 107(6): 924‐34 | Invalid study design |
| Elliott SAT. Associations of body mass index and waist circumference with: energy intake and percentage energy from macronutrients, in a cohort of Australian children. Nutrition Journal. 2011;10(1) | Cross‐sectional |
| Enes CC, Slater B, Enes CC, Slater B. Variation in dietary intake and physical activity pattern as predictors of change in body mass index (BMI) Z‐score among Brazilian adolescents. Revista Brasileira de Epidemiologia. 2013;16(2):493‐501 | Not prospective |
| Faith MS, Dennison BA, et al. (2006). Fruit juice intake predicts increased adiposity gain in children from low‐income families: weight status‐by‐environment interaction. Pediatrics 118(5): 2066‐75 | No relevant exposures |
| Frohnert BIJ. Relation between serum free fatty acids and adiposity, insulin resistance, and cardiovascular risk factors from adolescence to adulthood. Diabetes. 2013;62(9):3163‐9 | No total fat assessment |
| Heppe DH, Kiefte‐de Jong JC, Durmus B, Moll HA, Raat H, Hofman A, et al. Parental, fetal, and infant risk factors for preschool overweight: the Generation R Study. Pediatric Research. 2013;73(1):120‐7 | No total fat intake assessment |
| Hooley M, Skouteris H, Millar L, Hooley M, Skouteris H, Millar L. The relationship between childhood weight, dental caries and eating practices in children aged 4‐8 years in Australia, 2004‐2008. Pediatric Obesity. 2012;7(6):461‐70 | No total fat intake assessment |
| Hopkins DS. The effect on growth of using cows milk as the main drink for infants. Annals of Nutrition and Metabolism. 2011;Conference(var.pagings):October | Infants |
| Huh SYR. Prospective association between milk intake and adiposity in preschool‐aged children. Journal of the American Dietetic Association. 2010;110(4):563‐70 | No total fat intake assessment |
| Humenikova L, Gates GE (2007). Dietary intakes, physical activity, and predictors of child obesity among 4‐6th graders in the Czech Republic. Central European Journal of Public Health 15(1): 23‐8 | Cross‐sectional |
| Isharwal S, Arya S, et al. (2008). Dietary nutrients and insulin resistance in urban Asian Indian adolescents and young adults. Annals of Nutrition & Metabolism 52(2): 145‐51 | Invalid study design |
| Kagura J, Feeley AB, Micklesfield LK, Pettifor JM, Norris SA, Kagura J, et al. Association between infant nutrition and anthropometry, and pre‐pubertal body composition in urban South African children. Journal of Developmental Origins of Health and Disease. 2012;3(6):415‐23 | No total fat intake assessment |
| Khalil HM. Developmental trajectories of body mass index (BMI) from birth to late childhood and their relation with paternal and child nutrients intake. Obesity Facts. 2014;Conference(var.pagings):May | No relevant outcomes |
| Labayen I, Ruiz JR, Ortega FB, Huybrechts I, Rodríguez G, Jiménez‐Pavón D, et al. High fat diets are associated with higher abdominal adiposity regardless of physical activity in adolescents; the HELENA study. Clinical Nutrition. 2014;33(5):859‐66 | Cross‐sectional |
| Li SF. Dairy consumption with onset of overweight and obesity among U.S. adolescents.FASEB Journal. 2014;Conference(var.pagings) | No total fat intake assessment |
| Magnussen CG, Thomson R, Cleland VJ, Ukoumunne OC, Dwyer T, Venn A, et al. Factors affecting the stability of blood lipid and lipoprotein levels from youth to adulthood: evidence from the Childhood Determinants of Adult Health Study. Archives of Pediatrics & Adolescent Medicine. 2011;165(1):68‐76 | No relevant outcomes |
| Manios Y. (2006). Design and descriptive results of the "Growth, Exercise and Nutrition Epidemiological Study in preSchoolers": The GENESIS Study. BMC Public Health 6(32) | No fat to weight relationship |
| Mete MS. Dietary patterns and depression in a population with high prevalence of obesity: The strong heart family study. Circulation. 2012;Conference(var.pagings) | No total fat intake assessment |
| Millar L, Rowland B, Nichols M, Swinburn B, Bennett C, Skouteris H, et al. Relationship between raised BMI and sugar sweetened beverage and high fat food consumption among children. Obesity. 2014;22(5):E96‐103. 2. Millar LMR. Sugar sweetened beverage and high fat food consumption are related to raised BMI z‐scores among a cohort of Australian children from 4 to 10 years of age. Obesity Facts. 2013;Conference(var.pagings):May. | No total fat assessment |
| Oldewage‐Theron W, Napier C, Egal A. Dietary fat intake and nutritional status indicators of primary school children in a low‐income informal settlement in the Vaal region... [corrected] [published erratum appears in S AFR J CLIN NUTR 2011; 24(3):164]. South African Journal of Clinical Nutrition. 2011;24(2):99‐104 | Cross‐sectional |
| Pala VL. Dietary patterns and longitudinal change in body mass in European children: a follow‐up study on the IDEFICS multicenter cohort. European Journal of Clinical Nutrition. 2013;67(10):1042‐9 | No total fat intake assessment |
| Pan A, Malik VS, Hao T, Willett WC, Mozaffarian D, Hu FB, et al. Changes in water and beverage intake and long‐term weight changes: results from three prospective cohort studies. International Journal of Obesity. 2013;37(10):1378‐85 | No total fat intake assessment |
| Puengputtho WL. Salt intake and salt reduction in secondary school‐age students of Princess Chulabhorn's College Chiangrai (Regional science school). Annals of Nutrition and Metabolism. 2013;Conference(var.pagings):2013 | No total fat intake on weight assessment |
| Riedel CV. Interactions of genetic and environmental risk factors with respect to body fat mass in children: Results from the ALSPAC study. Obesity. 2013;21(6):1238‐42 | No total fat intake assessment |
| Scharf RJ, Demmer RT, Deboer MD. Longitudinal evaluation of milk type consumed and weight status in preschoolers. Archives of Disease in Childhood. 2013;98(5):335‐40 | No total fat intake assessment |
| Serra‐Majem L, Aranceta‐Bartrina J, et al. Prevalence and determinants of obesity in Spanish children and young people. British Journal of Nutrition. 2006;96 Suppl 1: S67‐72 | Cross‐sectional |
| Vazaiou AP. Protein intake of toddlers in Greece and its nutritional consequences. Hormone Research in Paediatrics. 2011;Conference(var.pagings):October | No assessment of total fat on body fatness |
| Weijs PJM. High beverage sugar as well as high animal protein intake at infancy may increase overweight risk at 8 years: a prospective longitudinal pilot study. Nutrition Journal. 2011;10(1) | Infants |
| Williams CL, Strobino BA. Childhood diet, overweight, and CVD risk factors: the Healthy Start project. Preventive Cardiology. 2008;11(1):11‐20 | No relevant outcomes |
| Wosje KS, Khoury PR, Claytor RP, Copeland KA, Hornung RW, Daniels SR, et al. Dietary patterns associated with fat and bone mass in young children. American Journal of Clinical Nutrition. 2010;92(2):294‐303 | No total fat intake assessment |
| Yin JQ. Maternal diet, breastfeeding and adolescent body composition: A 16‐year prospective study. European Journal of Clinical Nutrition. 2012;66(12):1329‐34 | No total fat intake assessment |
| Zaki MH. Identifying obesogenic dietary factors among Egyptian obese adolescents. Annals of Nutrition and Metabolism. 2013;Conference(var.pagings):2013 | No relevant outcomes |
| Zhang ZG. Added sugar intake and lipids profile among us adolescents: Nhanes 2005‐2010. Circulation. 2014;Conference(var.pagings):25 | Cross‐sectional |
| Study | Number lost to follow‐up | Baseline similarity by total fat intake, funding, control groups | Adjustments (where stratified not counted as not being adjusted)* | Method of assessment | Risk of bias** |
| CARDIA Ludwig 1999 (1) USA | 5111 attended original screening, 3609 attended at years 1, 7 and 10, 2909 included in analysis 43% lost or not analysed Reasons: exclusion of those who were pregnant or lactating, with diabetes, on lipid or BP medication or with extreme dietary factors | Different. Those with lower total fat intake were more likely to be women, non‐smokers, more physically active, with higher alcohol and vitamin supplement intake Funded by: NHLBI, NIDDKD Control group: internal | Weight was adjusted for baseline weight. Analysis adjusted for energy, sex, age, field centre, education, energy intake, physical activity, cigarette smoking, alcohol intake, vitamin supplement use. All adjusted for | Interviewer‐ administered FFQ (700 foods) Single (multiple dietary assessments – but appear to use baseline data only in analysis) | High |
| Danish Diet Cancer & Health Study Halkjaer 2009 (2‐4) Denmark | 57,043 at baseline, 44,897 re‐assessed 5 years later 21% lost or not analysed Reasons: 1781 had died, 435 emigrated, remainder did not want to participate or did not reply | Data not reported Unclear Funded by: National Danish Research Foundation, DiOGenes (EU funding) Control group: internal | BMI, energy, age, smoking, alcohol, wine, beer, spirits, sporting activity Not adjusted for ethnicity, or socioeconomic status | 192‐item semi‐quantitative FFQ checked by dietitian Single dietary assessment used | High |
| 57,053 at baseline, 22,433 included in 5‐year analysis. 61% lost or not analysed Reasons: excluded aged ≥ 60 years (baseline) or ≥ 65 years (follow‐up), did not attend follow‐up, illness at baseline or during follow‐up, average weight gain or loss > 5 kg/year or waist circumference > 7 cm/year, lack of blood sample or other baseline data | Data not reported. Unclear Funded by: National Danish Research Foundation, DiOGenes (EU funding) Control group: internal | Age, sex, physical activity, smoking, education, follow‐up time, fibre intake, glycaemic index, hormone treatment and baseline body weight or waist circumference (analysed as %E from fat, so adjusted for E) Not adjusted for ethnicity | 192‐item semi‐quantitative FFQ checked by dietitian Single dietary assessment used | High | |
| Danish MONICA Iqbal 2006 (5) Denmark | 2025 at baseline, 1762 re‐assessed 5 years later 13% lost or not analysed Reasons: missing or very high energy or unknown history of family obesity | Data not reported Unclear Funded by: Apotekerfonden & Danish Ministry for Health Control group: internal | Baseline BMI, age, physical activity, smoking, education level, cohort, volume, energy intake Not adjusted for ethnicity | Weighed 7‐day food record Single dietary assessment used | Moderate |
| Diabetes Control & Complications Trial (DCCT) & EDIC Cundiff 2012 (6) | 1441 at baseline, 1055 analysed at 14 to 19 years 27% lost or not analysed Reasons: omitted 137 with HbA1c > 9.5, otherwise losses not described in this publication Note: also analysed FAO/WHO data from 167 countries, but these appear cross‐sectional | Data not reported Unclear Funded by: Data collection by NIH, General Clinical Research Center Program (NCRR), analysis not funded Control group: internal | Energy, fibre, saturated, mono‐ and poly‐unsaturated fat, alcohol, exercise (probably) Not adjusted for age, sex, ethnicity or SES | 1 week food record (unclear whether recall or diary based) Multiple dietary assessments (baseline, 2, 5 yrs and completion averaged) | High |
| EPIC‐PANACEA Vergnaud 2013 (7) EPIC Beulens 2014 (8) | 521,448 recruited, 373,803 included in analysis 28% lost or not analysed Reasons: omitted 23,713 with missing or implausible baseline data, 121,866 with missing follow‐up weight, 2066 with implausible weight changes | Those with lower fat intake tended to be older, more physically active and less likely to smoke Dissimilar Funded by: EU and a wide range of charities and government funders Control group: internal | Adjusted for age, baseline BMI, study centre, weekday, season, total E (from non‐alcohol sources, and from alcohol sources), smoking, education, physical activity Not adjusted for ethnicity | Quant. dietary questionnaire of 88‐266 items (country‐specific) Single dietary assessment used | High |
| Unclear how many were included compared with recruited unclear% lost or not analysed Reasons: unclear | Data not reported Unclear Funded by: unclear Control group: internal | Adjustments unclear Not adjusted for … unclear | Country‐specific FFQs | High | |
| Health Professionals Follow‐Up Study (HPFUS) Coakley 1998 (9) USA | 36,353 returned 1992 questionnaires, of whom 19,478 were included in this analysis 46% lost or not analysed Reasons: 9345 had cancer, heart disease, diabetes or stroke, 7530 were missing key information | Data not reported Unclear Funded by: NIH and Centres for Disease Control Control group: internal | Baseline weight, energy, height, activity, TV viewing, high BP, high cholesterol Not adjusted for ethnicity, socioeconomic status | FFQ Single dietary assessment used | High |
| Melbourne Collaborative Cohort Study (MCCS) MacInnis 2013 (10) Australia | Of 9066 at baseline, 5879 included in analyses. 35% lost or not analysed Reasons: 656 died, 1894 declined, 21 did not have waist circumference or weight at follow‐up, and 616 lost ≥ 5 kg weight so excluded | Data not reported Unclear Funded by: Cancer Council Victoria, VicHealth, National Health and Medical Research Council Control group: internal | Weight adjusted for baseline weight, waist for baseline waist circumference. All adjusted for sex, age, physical activity, alcohol, education, smoking, marital status, SES, total energy intake. Not adjusted for ethnicity (all described as "Australian‐born" but > 20% born in Europe) | Self administered 121‐item FFQ developed for study Single dietary assessment used | High |
| Memphis Klesges 1992 (11‐13) USA | 417 were enrolled, 294 were included in weight change analysis, and 230 in the waist circumference change analysis 29% lost or not analysed (weight), 45% (waist) Reasons: "attrition" for weight change, no explanation of further losses for waist circumference data | Data not reported Unclear Funded by: NHLBI and Tennessee Centres of Excellence Control group: internal | Sex, age, pregnancy status, smoking, alcohol, family risk of obesity, energy intake, sports activity, work activity, leisure activity, change from baseline of energy, fat intake, activity, cigarettes Not adjusted for socioeconomic status | Willett's FFQ Single (multiple dietary assessments – but appear to be using baseline data in analysis) | High |
| NHANES Follow‐up Kant 1995 (14) USA | 14,407 were enrolled and eligible, 7147 were included in analysis. 50% lost or not analysed Reasons: no dietary info, unsatisfactory 24‐hour recalls, atypical intake, proxies, mistakes, pregnant or lactating participants, lack of weight data, death | Higher fat as %E associated with younger age, more smoking, higher levels of morbidity Funded by: unclear Control group: internal | Baseline age, race, education, BMI, energy intake, smoking, physical activity, duration of follow‐up, alcohol, morbidity, special diet, parity All adjusted for | 24‐hour dietary recall Single dietary assessment used | High |
| Nurses' Health Study Colditz 1990 (15) Field 2007 (16) USA | Of 121,700 women enrolled, 38,724 were eligible for this study, 31,940 women included in analyses 17% lost or not analysed Reasons: non‐respondent or invalid FFQ | Data not reported Unclear Funded by: NIH Control group: internal | Age, BMI, energy intake Not adjusted for ethnicity, physical activity, socioeconomic status | 61‐item FFQ Single dietary assessment used | High |
| Of 121,700 women enrolled, 41,518 included in analyses 66% lost or not analysed Reasons: of 121,700, 41,518 assessed in 1986 and at 8 years, were free of cancer, hypertension and diabetes, and eligible for this study | Greater fat intake associated with greater baseline weight Unclear Funded by: Boston Obesity Nutrition Research Center and National Cancer Institute Control group: internal | Age, baseline BMI, activity, menopausal status, smoking, protein intake, change in protein intake Not adjusted for ethnicity or SES | 136‐item FFQ in 1986 Single dietary assessment used | High | |
| Pawtucket HHP Parker 1997 (17) USA | Of 1081 enrolled, FFQ administered to random sub‐sample of 556, 465 included in analysis 16% lost or not analysed Reasons: those excluded were those who did not attend both relevant appointments, and were more male, less educated, less active, greater BMI | Data not reported Unclear Funded by: NHLBI Control group: internal | Age, BMI, energy, smoking, activity Not adjusted for sex, ethnicity or socioeconomic status | Willett's FFQ with categories added for fats, oils, sweets, snacks and dairy products Single dietary assessment used | High |
| San Luis Valley Diabetes Study (SLVDS) Mosca 2004 (18) USA | Of 1351 enrolled, 782 "included in analysis", unclear how many in prospective analysis unclear% lost or not analysed Reasons: unclear how many lost and how many excluded. Of 1351, 1027 had and 782 continued to have normal glucose tolerance tests, 140 altered smoking status or became pregnant and were excluded. 782 completed visit 1, 536 visit 2 and 375 visit 3 | Data not reported Unclear Funded by: not stated Control group: internal | Sex, ethnicity, physical activity, baseline BMI, age, smoking status, energy intake Not adjusted for SES | 24‐hour diet recall (bilingual interviewers) with visual aids for food portions | High |
| SEASONS Ma 2005 (19) USA | Of 1257 in original cohort, 641 completed baseline questionnaire and one blood draw, 572 included in analyses 11% lost or not analysed Reasons: unclear, did not attend further appointments | Data not reported Unclear Funded by: NHLBI Control group: internal | None (but analysed as %E from fat, so energy adjusted for indirectly) Not adjusted for age, sex, ethnicity, physical activity or socioeconomic status | 7‐day dietary recall Single (Multiple dietary assessments – but appear to be using baseline data in analysis) | High |
| Women's Gothenburg Lissner 1997 (20) Sweden | Of 1462 in main cohort, 437 randomly selected and asked for dietary information, 361 included in analysis. 17% lost or not analysed Reasons: 64 did not return for weight assessment, 12 had chronic illness so excluded | Higher fat as %E associated with younger age, higher energy intake, more walking and lifting at work, greater likelihood of being a smoker Funded by: Swedish Medical Research Council Control group: internal | Baseline body weight, activity, smoking, age, energy Not adjusted for ethnicity or socioeconomic status | Dietary interview including frequency of 69 food items Single dietary assessment used | High |
| *Of age, sex, energy intake, ethnicity, physical activity (and/or TV watching) and socioeconomic (which includes educational) status. **Moderate risk of bias was suggested where < 20% were lost to follow‐up, up to two factors were unadjusted for in the design or analysis, and diet was assessed using a 24‐hour recall or diet diary. All other studies were at high risk of bias. Reference numbers relate to references below Table 1. Abbreviations: BMI: body mass index; BP: blood pressure; FAO: Food and Agriculture Organization; FFQ: food frequency questionnaire; NIH: National Institutes of Health; NHLBI: National Heart, Lung and Blood Institute; NIDDKD: National Institute of Diabetes and Digestive and Kidney Diseases; SES: socioeconomic status; WHO: World Health Organization | |||||
| Study | Number lost to follow‐up | Baseline similarity, funding, control group | Adjustments* | Method of dietary assessment | Risk of bias** |
| Adelaide Nutrition Study Magarey 2001 (1) Australia | Of 500 recruited to ANS at birth only 130 were seen at age 11, so a further 113 from a separate cohort were added at age 11 ˜74% lost (varied for different follow‐ups) Reason: did not attend Lost characteristics: not stated | Data not reported Unclear Funded by: National Heart Foundation of Australia, Adelaide Children's Hospital Research Foundation, National Health and Medical Research Council of Australia Control group: internal | Adjusted for energy intake, previous adiposity, adiposity of parent at a specific age Not adjusted for sex, ethnicity, physical activity or SES (4) | 3‐day weighed food record | High |
| Amsterdam Growth & Health Long. Study (AGAHLS) Twisk 1998, Koppes 2009 (2;3) Netherlands | Of 307 13‐year olds recruited 181 were reassessed at age 27 41% lost Reason: unclear Lost characteristics: "for the variables of interest no drop‐out effects were observed" | Data not reported Unclear Funded by: Dutch Heart Foundation, Dutch Prevention Fund, Dutch Ministry of Wellbeing and Public Health, Dairy Foundation on Nutrition and Health, Netherlands Olympic Committee, Netherlands Sports Fed., no additional funding was stated for the 36‐year old analysis Control group: internal | Adjusted for physical activity, smoking, alcohol, dietary energy and macronutrient intake. Did not adjust for sex, would have if appropriate. Not adjusted for ethnicity, parental BMI, or SES (3) | Modified cross‐check dietary history interview relating to previous month | High |
| Of 698 13‐year olds recruited (those above plus another school with fewer assessments) 350 had complete data at age 36 50% lost Reason: unclear Lost characteristics: girls who completed follow‐up had slightly lower body fat %age, and boys who completed had lower tobacco and alcohol use at baseline | Carried out for boys and girls separately, at each age. Skinfold data (not % body fat) additionally adjusted for physical activity Not adjusted for ethnicity, parental BMI, physical activity or SES (4) | As above | High | ||
| Bogaert 2003 (4) Australia | Of 59 recruited, 41 were re‐assessed at 12 months 31% lost Reason: unclear Lost characteristics: unclear | Data not reported Unclear Funded by: Australian Rotary Health Found., Financial Markets Found. for Children, National Health & Medical Research Council Control group: internal | Adjustment not described (or not done) – unclear Assume not adjusted for age, sex, ethnicity, parental BMI, physical activity or SES (6) | 2 food records and 1 24‐hour recall from | High |
| Carruth & Skinner 2001 (5;6) USA | Of 72 recruited 53 took part at 70 months 26% lost Reason: 7 parents declined, 7 not in area, 5 could not be scheduled in timeframe Lost characteristics: unclear | Data not reported Unclear Funded by: Gerber products, Tennessee Agricultural Experiment Station Control group: internal | Adjusted for BMI (all children white and of same age) Not adjusted for sex, energy intake, parental BMI, physical activity or SES (5) | 3‐day dietary intake interviews by dietitian | High |
| 62 of 72 recruited (98 recruited at 2 mo of age), plus 2 added at 1 year and 6 added at 2 years took part unclear % lost Reason: as above? Lost characteristics: unclear | Adjusted for BMI at 2 years and adiposity rebound age, assessed across ages 2 to 8, all children white and "predominantly middle or upper socioeconomic status" Factors assessed but found non‐significant so not adjusted for included sex, TV‐watching, parental BMI All adjusted for (0) | 3‐day dietary intake interviews | High | ||
| Davison 2001 (7) | 197 participants at study entry, 192 re‐assessed 2 years later 3% lost Reason: unclear Lost characteristics: none stated | Data not reported Unclear Funded by: NIH Control group: internal | BMI, levels of activity, familial risk of overweight, change in BMI (mother), enjoyment of activity (father), total energy intake (father), and girls' percentage fat intake (girls). Not adjusted for SES (1) | 24‐hour dietary recall | Moderate |
| ELANCE Rolland‐Cachera 2013 (8) France | Unclear how many 10‐month olds, but 222 attended at 10 months and either 2 or 4 years, 73 attended at 20 years, 68 included in analyses. > 67% lost Reason: unclear Lost characteristics: "similar" between those lost to follow‐up and those included | Data not reported Unclear Funded by: Institut Benjamin Delessert Control group: internal | Total energy intake, sex, breast feeding, mother's BMI, father’s occupation Not adjusted for ethnicity or physical activity (2) | Dietary history (dietitian discussion of diet with parent over past month) | High |
| European Youth Heart Study Brixval 2009 (9) Denmark | 384 of 589 baseline children attended follow‐up, 308 in regression model 48% lost Reason: "due to ethical consideration it was not permitted to contact subjects who decided not to participate at follow‐up" Lost characteristics: not stated | Data not reported Unclear Funded by: not stated Control group: internal | Age, puberty status, total energy intake, parental income, activity, overweight parents, protein intake, birth weight. Presented by sex Not adjusted for ethnicity (1) | Interview and questionnaire of children and parents relating to past 24 hours | High |
| Klesges 1995 (10) USA | 203 children at baseline, 146 at follow‐up 28% lost Reason: unclear Lost characteristics: "no significant differences" (P value > 0.15) in BMI, energy intake, fat as %E, physical activity, sex or familial obesity risk between those attending at 2 years and those not attending | Data not reported Unclear Funded by: National Heart Lung and Blood Institute Control group: internal | Age, sex, BMI, physical activity Not adjusted for ethnicity, SES (2) | Dietary FFQ | High |
| OMDCC Lee 2012 (11) Korea | 2740+ baseline children (unclear), 1504 followed up 45% lost Reasons: "analytic sample" – no reasons given Lost characteristics: unclear | Data not reported Unclear Funded by: unclear Control group: internal | Age, sex, sexual maturation, baseline BMI, exercise, TV time, sleep, parental BMI and education, energy intake, food habits and household income Not adjusted for ethnicity (1) | 24‐hour recall for 2 weekdays and 1 weekend day | High |
| TAAG Cohen 2014 (12) | Of 303 randomly selected at baseline, 265 analysed 13% lost Reasons: 38 did not have complete data Lost characteristics: no difference in race, age, mother's education | Data not reported Unclear Funded by: National Heart Lung and Blood Institute Control group: internal | Age, ethnicity, physical activity Not adjusted for energy intake, parental BMI or SES (3) | FFQ | High |
| Viva la Familia Study Butte 2007 (13) USA | 1030 at baseline, with 879 returning after 1 year 15% lost Reasons: unclear Lost characteristics: none stated | Data not reported Unclear Funded by: NIH, USDA/ARS Control group: internal | Adjusted for sex, age, age squared, and Tanner stage and BMI status in Generalised Estimating Equations Not adjusted for parental BMI, physical activity and SES (3) | 24‐hour recall, measured by a registered dietitian | High |
| * Of age, sex, energy intake, ethnicity, parental BMI, physical activity (and/or TV watching) and socioeconomic (which includes educational) status ** Moderate risk of bias was suggested where < 20% were lost to follow‐up, up to three factors were unadjusted for in the design or analysis, and diet was assessed using a 24‐hour recall or diet diary. All other studies were at high risk of bias. References are the same as those following Table 2. Abbreviations: ANS: Adelaide Nutrition Study; BMI: body mass index; FFQ: food frequency questionnaire; NIH: National Institutes of Health; SES: socioeconomic status; USDA/ARS: US Department of Agriculture/ Agricultural Research Service. | |||||
| Factor assessed | Subgroup | Effect on weight, kg (95% CI) | Number of comparisons | Number of participants | I2 for subgroup | Chi2 test for subgroup differences |
| Duration of dietary advice | 6 to < 12 months | ‐1.7 (‐2.3 to ‐1.1) | 10 | 5305 | 71% | P value = 0.04 |
| 12 to < 24 months | ‐2.0 (‐2.5 to ‐1.5) | 17 | 51367 | 71% | ||
| 24 to < 60 months | ‐1.2 (‐1.7 to ‐0.7) | 9 | 49,286 | 56% | ||
| 60+ months | ‐0.7 (‐1.7 to 0.3) | 4 | 40,838 | 58% | ||
| Fat intake in the control group assessed during trial (equivalent to baseline fat intake) | > 35%E from fat | ‐0.9 (‐1.1 to ‐0.8) | 9 | 45,103 | 64% | P value < 0.00001 |
| > 30% to 35%E from fat | ‐0.8 (‐1.2 to ‐0.5) | 9 | 7123 | 73% | ||
| > 25% to 30%E from fat | ‐3.0 (‐3.6 to ‐2.3) | 5 | 2109 | 1% | ||
| Sex | Women only | ‐1.4 (‐1.9 to ‐0.9) | 15 | 50,154 | 72% | P value = 0.20 |
| Men only | ‐2.7 (‐4.3 to ‐1.2) | 4 | 1719 | 76% | ||
| Mixed men and women | ‐1.1 (‐2.0 to ‐0.2) | 5 | 2492 | 79% | ||
| Year of first publication of the trial | 1960s | ‐4.1 (‐8.1 to ‐0.1) | 1 | 1450 | ‐ | P value = 0.07 |
| 1970s | ‐ | 0 | 0 | ‐ | ||
| 1980s | ‐0.9 (‐1.8 to ‐0.01) | 3 | 288 | 0% | ||
| 1990s | ‐1.9 (‐2.6 to ‐1.3) | 14 | 5941 | 80% | ||
| 2000s | ‐0.9 (‐1.6 to ‐0.3) | 6 | 46,686 | 77% | ||
| 2010s | ‐ | 0 | 0 | ‐ | ||
| Difference in %E from fat between intervention and control groups | Up to 5%E from fat | ‐0.2 (‐0.9 to 0.6) | 5 | 4567 | 30% | P value = 0.003 |
| 5 to < 10%E from fat | ‐2.1 (‐2.9 to ‐1.4) | 11 | 44,356 | 84% | ||
| 10 to < 15%E from fat | ‐1.3 (‐1.7 to ‐1.0) | 4 | 8311 | 26% | ||
| 15+%E from fat | ‐3.9 (‐8.8 to 1.0) | 3 | 319 | 68% | ||
| Dietary advice or diet provided | Dietary advice | ‐1.6 (‐2.0 to ‐1.1) | 22 | 52,594 | 78% | P value = 0.04 |
| Diet provided | ‐0.7 (‐1.3 to ‐0.1) | 1 | 1741 | ‐ | ||
| Dietary fat goals for intervention (these were not necessarily achieved) | 30%E from fat | ‐1.0 (‐1.7 to ‐0.3) | 3 | 1628 | 0% | P value = 0.34 |
| 25 to < 30%E from fat | ‐2.5 (‐4.3 to ‐0.6) | 5 | 509 | 90% | ||
| 20 to < 25%E from fat | ‐0.9 (‐1.2 to ‐0.6) | 5 | 43,878 | 31% | ||
| 15 to < 20%E from fat | ‐1.3 (‐2.2 to ‐0.4) | 7 | 7860 | 58% | ||
| Total fat achieved in intervention group | > 30%E from fat | ‐0.8 (‐1.3 to ‐0.4) | 5 | 1767 | 0% | P value = 0.42 |
| ≤ 30%E from fat | ‐1.1 (‐1.6 to ‐0.6) | 13 | 50,099 | 76% | ||
| BMI at baseline (body mass index, kg/m2) | < 25 | ‐1.0 (‐1.7 to ‐0.2) | 8 | 1781 | 56% | P value = 0.17 |
| 25 to < 30 | ‐1.8 (‐2.4 to ‐1.3) | 15 | 51,297 | 83% | ||
| 30+ | ‐1.8 (‐3.5 to ‐0.1) | 1 | 69 | ‐ | ||
| Baseline health of participants | Healthy | ‐1.0 (‐1.6 to ‐0.4) | 3 | 45,032 | 87% | P value = 0.12 |
| With risk factors | ‐2.2 (‐3.2 to ‐1.2) | 12 | 2166 | 79% | ||
| With disease | ‐1.2 (‐1.9 to ‐0.6) | 9 | 6449 | 44% | ||
| Amount of energy reduction in the low fat arm | E intake the same or greater in low fat group | ‐0.5 (‐1.5 to 0.5) | 4 | 3352 | 25% | P value = 0.04 |
| 1 to 100 kcal/d less in low fat arm | ‐1.5 (‐2.9 to ‐0.1) | 4 | 2398 | 66% | ||
| 101 to 200 kcal/d less in low fat arm | ‐1.1 (‐2.2 to ‐0.04) | 5 | 43,755 | 80% | ||
| 201+ kcal/d less in low fat arm | ‐2.2 (‐3.0 to ‐1.5) | 8 | 3954 | 78% | ||
| Note: studies that provide data at different time points or that fit into different categories have all been included, so studies may appear more than once in any series of subgroups. | ||||||
| Trial | Energy intake (SD), kcal | Sugars intake, %E | CHO intake, %E | Protein intake, %E | Alcohol intake, %E | No. of participants | ||||||
| Int. | Cont | Int. | Cont | Int. | Cont | Int. | Cont | Int. | Cont | Int. | Cont | |
| Auckland reduced fat, 1 yr | 1887 (672) | 2269 (750) | — | — | 54.2 (10.5) | 45.8 (10.9) | 18.4 (3.5) | 16.6 (3.9) | 3.6 (7.0) | 5.7 (7.0) | 49 | 61 |
| BDIT pilot studies, 9 yrs | 1460 (376) | 1578 (365) | — | — | 49.6 (7.5) | 46.9 (6.2) | 15.5 (2.4) | 15.3 (2.6) | 2.3 (3.3) | 1.7 (2.4) | 76 | 81 |
| BeFIT | (data not reported in control groups) | |||||||||||
| Bloemberg, Δ to 6 mo | — | — | — | — | 4.4 (6.5) | 1.2 (6.1) | 0.33 (2.9) | 0.57 (1.7) | — | — | 39 | 41 |
| BRIDGES, 6 mo | ‐34 (79) | + 22 (79) | — | — | — | — | — | — | — | — | 48 | 46 |
| Canadian DBCP, 2 yrs | 1540 (317) | 1759 (437) | — | — | 60.3 (8.3) | 48.8 (8.1) | 18.0 (3.2) | 16.9 (2.8) | — | — | 104 | 100 |
| De Bont, Δ to 6 mo | ‐98 (369) | ‐120 (485) | — | — | 7.9 (9.5) | ‐0.1 (10.9) | 2.4 (7.0) | 1.7 (5.9) | ‐0.2 (1.6) | ‐0.4 (2.6) | 71 | 65 |
| DEER (diet alone), Δ to 1 yr | Women: ‐220 (356) Men: ‐285 (541) | Women: ‐19 (367) Men: ‐25 (482) | — | — | Women: +5.5 (8.0) Men: +8.0 (9.3) | Women: ‐0.2 (7.3) Men: +1.1 (6.6) | — | — | — | — | 46, 49 | 45, 46 |
| DEER (diet and ex), Δ to 1 yr | Women: ‐191 (343) Men: ‐167 (516) | Women: ‐54 (410) Men: +141 (437) | — | — | Women: +7.8 (6.2) Men: +9.3 (8.3) | Women: ‐0.3 (7.9) Men: +1.4 (6.3) | — | — | — | — | 43, 48 | 43, 47 |
| Diet and hormone study, 1 yr | 1921 (386) | 2063 (610) | — | — | 64.3 (9.0) | 54.6 (9.2) | 14.5 (2.9) | 14.1 (3.8) | est: 1 (2) | est: 1 (2) | 81 | 96 |
| Kentucky low fat, 1 yr | 1882 (521) | 2010 (528) | — | — | 53 (8.9) | 50 (7.9) | 17 (3.4) | 18 (4.3) | — | — | 47 | 51 |
| Kuopio, wks 14 to 28 | AHA 1791 (382) Mono 1887 (478) Low fat 1648 (430) | 1982 (406) | — | — | AHA 48 (5) Mono 47 (6) Low fat 51 (5) | 46 (6) | AHA 17 (2) Mono 17 (20) Low fat 19 (3) | 16 (2) | — | — | AHA 41 Mono 41 Low fat 40 | 37 |
| Mastopathy diet, 6 mo | 1491 (NR) | 1676 (NR) | — | — | 56.3 (NR) | 48.1 (NR) | 17.9 (NR) | 15.8 (NR) | 4.8 (NR) | 4.2 (NR) | 10 | 9 |
| MeDiet, 6 mo | 1676 (639) | 1654 (498) | 18.7 (6.9) | 21.9 (9.2) | 27.2 (17.0) | 25.8 (11.0) | 14.9 (4.7) | 16.2 (5.1) | 5.6 (11.1) | 1.6 (2.2) | 51? | 55? |
| Moy, 2 yrs | 1825 (NR) | 2092 (NR) | — | — | — | — | — | — | — | — | 117 | 118 |
| MSFAT, 6 mo | 2460 (NR) | 2699 (NR) | — | — | 47 (NR) | 41 (NR) | 16 (NR) | 14 (NR) | 3 (NR) | 3 (NR) | 117 | 103 |
| NDHS open 1st 6 mo (for definitions of groups B, C and D see Characteristics of Included Studies) | B: 2154 (432) | C: 2262 (435) D: 2228 (456) | — | — | B: 48.7 (12.3) | C: 45.3 (12.1) D: 44.7 (11.7) | B: 18.6 (3.4) | C: 17.6 (3.1) D: 17.4 (3.1) | B: 3.7 (3.7) | C: 3.6 (4.0) D: 3.8 (4.0) | B: 339 | C: 355 D: 346 |
| NDHS open 2nd 6 mo (for definitions of groups BC, F and G see Characteristics of Included Studies) | BC: 2249 (492) | F: 2196 (427) G: 2169 (420) | — | — | BC: 45.7 (12.7) | F: 44.1 (11.1) G: 43.3 (11.4) | BC: 17.3 (3.5) | F: 7.3 (3.0) G: 17.7 (2.9) | BC: 3.5 (4.2) | F: 4.2 (4.0) G: 4.0 (4.5) | BC: 491 | F: 214 G: 194 |
| Nutrition and breast health, 1 yr | 1780 and 1960 | 1571 and 1687 | — | — | — | — | — | — | — | — | 23 and 25 | 24 and 23 |
| Nutrition education study, 6 to 9 mo | 1534 (448) | 1721 (620) | — | — | 43.4 (9.5) | 41.5 (8.9) | 19.9 (3.7) | 18.7 (4.4) | 4.5 (7.2) | 4.8 (9.3) | 224 | 69 |
| Pilkington, 1 yr | NR | NR | — | — | — | — | — | — | — | — | 12 | 23 |
| Polyp prevention trial, yr 4 | 1978 (471) | 2030 (518) | — | — | 58.3 (7.4) | 47.1 (7.2) | 17.3 (2.5) | 16.5 (2.4) | — | — | 605 | 581 |
| Rivellese, 6 mo | NR | NR | 14 | 10 | 55 | 48 | 18 | 16 | — | — | 27 | 17 |
| Simon low fat, 1 yr | 1570 (NR) | 1594 (NR) | — | — | — | — | — | — | — | — | 65 | 68 |
| Sondergaard, 12 mo | — | — | — | — | 52.3 (6.4) | 48.5 (8.7) | 17.0 (2.9) | 16.6 (3.1) | 4.5 (5.3) | 6.4 (7.4) | 62 | 51 |
| Strychar, 6 mo | NR | NR | — | — | — | — | — | — | — | — | 15 | 15 |
| Swedish breast CA, Δ to 2 yrs | ‐215 (P value < 0.01) | ‐143 (P value < 0.01) | +4.8 (P value < 0.01) | +1.4 (P value < 0.01) | +11.0 (P value < 0.01) | +2.7 (P value < 0.01) | +1.7 (P value < 0.01) | +0.3 (P value > 0.05) | +0.2 (P value > 0.05) | +0.4 (P value > 0.05) | 63 | 106 |
| Veteran's dermatology, during trial | 1995 (564) | 2196 (615) | — | — | 60.3 (6.3) | 44.6 (6.9) | 17.7 (2.2) | 15.7 (2.4) | 3.2 (3.4) | 3.2 (3.9) | 57? | 58? |
| WHEL, 1 yr | 1664 (345) | 1635 (384) | — | — | 65.3 (8.5) | 57.1 (9.3) | — | — | — | — | 197 | 196 |
| WHI, 7.5 yrs | 1446 (510) | 1564 (595) | — | — | 52.7 (9.8) | 44.7 (8.5) | — | — | — | — | 14246 | 22083 |
| WHT: feasibility, 2 yrs | 1356 (358) | 1617 (391) | — | — | 59.0 (8.8) | 46.9 (8.9) | 19.2 (3.9) | 16.8 (3.8) | — | — | 163 | 101 |
| WHT: FSMP, Δ to 18 mo | ‐488 (NR) | ‐255 (NR) | — | — | — | — | — | — | — | — | 285 | 194 |
| WINS, 5 yrs | ‐167 (p value < 0.0001 vs cont) | 0 | — | — | — | — | — | — | — | — | 380 | 648 |
| est: estimated by review authors from data on g/d and mean energy intakes Abbreviations: AHA: American Heart Association; CHO: carbohydrates; DBCP: Diet and Breast Cancer Prevention; SD: standard deviation | ||||||||||||
| Outcome or subgroup title | No. of studies | No. of participants | Statistical method | Effect size |
| 1 Weight, kg Show forest plot | 30 | 53647 | Mean Difference (IV, Random, 95% CI) | ‐1.54 [‐1.97, ‐1.12] |
| 2 BMI, kg/m2 Show forest plot | 10 | 45703 | Mean Difference (IV, Random, 95% CI) | ‐0.50 [‐0.74, ‐0.26] |
| 3 Waist circumference, cm Show forest plot | 1 | 15671 | Mean Difference (IV, Random, 95% CI) | ‐0.30 [‐0.58, ‐0.02] |
| 4 LDL cholesterol, mmol/L Show forest plot | 18 | 7285 | Mean Difference (IV, Random, 95% CI) | ‐0.13 [‐0.23, ‐0.03] |
| 5 HDL cholesterol, mmol/L Show forest plot | 19 | 7166 | Mean Difference (IV, Random, 95% CI) | ‐0.01 [‐0.03, 0.00] |
| 6 Total cholesterol, mmol/L Show forest plot | 20 | 7715 | Mean Difference (IV, Random, 95% CI) | ‐0.20 [‐0.29, ‐0.11] |
| 7 Triglycerides, mmol/L Show forest plot | 17 | 6976 | Mean Difference (IV, Random, 95% CI) | ‐0.02 [‐0.12, 0.08] |
| 8 Total cholesterol/HDL Show forest plot | 7 | 3332 | Mean Difference (IV, Random, 95% CI) | ‐0.10 [‐0.16, ‐0.04] |
| 9 Systolic blood pressure, mmHg Show forest plot | 9 | 5159 | Mean Difference (IV, Random, 95% CI) | ‐1.16 [‐1.95, ‐0.37] |
| 10 Diastolic blood pressure, mmHg Show forest plot | 9 | 5159 | Mean Difference (IV, Random, 95% CI) | ‐0.74 [‐1.40, ‐0.08] |
| Outcome or subgroup title | No. of studies | No. of participants | Statistical method | Effect size |
| 1 Weight ‐ subgrouped by duration of advice Show forest plot | 30 | Mean Difference (IV, Random, 95% CI) | Subtotals only | |
| 1.1 6 to < 12 months | 16 | 5305 | Mean Difference (IV, Random, 95% CI) | ‐1.74 [‐2.34, ‐1.13] |
| 1.2 12 to < 24 months | 18 | 51367 | Mean Difference (IV, Random, 95% CI) | 0.00 [‐2.51, ‐1.48] |
| 1.3 24 to < 60 months | 10 | 49286 | Mean Difference (IV, Random, 95% CI) | ‐1.18 [‐1.65, ‐0.70] |
| 1.4 60+ months | 4 | 40838 | Mean Difference (IV, Random, 95% CI) | ‐0.68 [‐1.66, 0.29] |
| 2 Weight, subgrouped by control group fat intake Show forest plot | 29 | 54335 | Mean Difference (IV, Fixed, 95% CI) | ‐1.01 [‐1.15, ‐0.86] |
| 2.1 > 35%E from fat | 13 | 45103 | Mean Difference (IV, Fixed, 95% CI) | ‐0.91 [‐1.07, ‐0.75] |
| 2.2 > 30% to 35%E from fat | 11 | 7123 | Mean Difference (IV, Fixed, 95% CI) | ‐0.84 [‐1.21, ‐0.48] |
| 2.3 > 25% to 30%E from fat | 5 | 2109 | Mean Difference (IV, Fixed, 95% CI) | ‐2.97 [‐3.60, ‐2.34] |
| 3 Weight, subgrouped by sex Show forest plot | 30 | Mean Difference (IV, Random, 95% CI) | Subtotals only | |
| 3.1 Studies of women only | 17 | 50154 | Mean Difference (IV, Random, 95% CI) | ‐1.42 [‐1.93, ‐0.91] |
| 3.2 Studies of men only | 6 | 1719 | Mean Difference (IV, Random, 95% CI) | ‐2.74 [‐4.32, ‐1.17] |
| 3.3 Studies of men and women | 7 | 2492 | Mean Difference (IV, Random, 95% CI) | ‐1.09 [0.00, ‐0.18] |
| 4 Weight, subgrouped by year of first publication of results Show forest plot | 30 | Mean Difference (IV, Random, 95% CI) | Subtotals only | |
| 4.1 1960s | 3 | 1450 | Mean Difference (IV, Random, 95% CI) | ‐4.10 [‐8.06, ‐0.14] |
| 4.2 1970s | 0 | 0 | Mean Difference (IV, Random, 95% CI) | 0.0 [0.0, 0.0] |
| 4.3 1980s | 3 | 288 | Mean Difference (IV, Random, 95% CI) | ‐0.91 [‐1.80, ‐0.01] |
| 4.4 1990s | 16 | 5941 | Mean Difference (IV, Random, 95% CI) | ‐1.94 [‐2.62, ‐1.25] |
| 4.5 2000s | 8 | 46686 | Mean Difference (IV, Random, 95% CI) | ‐0.94 [‐1.59, ‐0.29] |
| 4.6 2010s | 0 | 0 | Mean Difference (IV, Random, 95% CI) | 0.0 [0.0, 0.0] |
| 5 Weight, subgrouped by difference in %E from fat between control and reduced fat groups Show forest plot | 32 | 57583 | Mean Difference (IV, Random, 95% CI) | ‐1.54 [‐1.97, ‐1.12] |
| 5.1 Up to 5%E from fat | 8 | 4567 | Mean Difference (IV, Random, 95% CI) | ‐0.16 [‐0.91, 0.59] |
| 5.2 5% to < 10%E from fat | 14 | 44356 | Mean Difference (IV, Random, 95% CI) | ‐2.11 [‐2.87, ‐1.35] |
| 5.3 10% to < 15%E from fat | 5 | 8311 | Mean Difference (IV, Random, 95% CI) | ‐1.34 [‐1.70, ‐0.98] |
| 5.4 15+%E from fat | 4 | 319 | Mean Difference (IV, Random, 95% CI) | ‐3.89 [‐8.76, 0.99] |
| 5.5 Unknown difference in %E from fat | 1 | 30 | Mean Difference (IV, Random, 95% CI) | ‐2.43 [‐4.20, ‐0.66] |
| 6 Weight ‐ subgrouped by advice vs provided Show forest plot | 29 | Mean Difference (IV, Random, 95% CI) | Subtotals only | |
| 6.1 Dietary advice | 25 | 52594 | Mean Difference (IV, Random, 95% CI) | ‐1.55 [‐2.00, ‐1.10] |
| 6.2 Advice plus supplements | 0 | 0 | Mean Difference (IV, Random, 95% CI) | 0.0 [0.0, 0.0] |
| 6.3 Diet provided | 4 | 1741 | Mean Difference (IV, Random, 95% CI) | ‐0.72 [‐1.34, ‐0.10] |
| 7 Weight subgrouped by fat goals Show forest plot | 29 | Mean Difference (IV, Random, 95% CI) | Subtotals only | |
| 7.1 30%E from fat goal | 5 | 1628 | Mean Difference (IV, Random, 95% CI) | ‐0.96 [‐1.66, ‐0.26] |
| 7.2 25% to < 30%E from fat goal | 6 | 509 | Mean Difference (IV, Random, 95% CI) | ‐2.45 [‐4.27, ‐0.64] |
| 7.3 20% to < 25%E from fat goal | 6 | 43878 | Mean Difference (IV, Random, 95% CI) | ‐0.90 [‐1.24, ‐0.55] |
| 7.4 15% to < 20%E from fat goal | 8 | 7860 | Mean Difference (IV, Random, 95% CI) | ‐1.28 [‐2.19, ‐0.37] |
| 7.5 10% to < 15%E from fat goal | 0 | 0 | Mean Difference (IV, Random, 95% CI) | 0.0 [0.0, 0.0] |
| 7.6 No specific goal stated | 4 | 460 | Mean Difference (IV, Random, 95% CI) | ‐2.49 [‐5.03, 0.05] |
| 8 Weight, kg subgrouped of above below 30%E from fat Show forest plot | 24 | Mean Difference (IV, Random, 95% CI) | Subtotals only | |
| 8.1 Int achieved > 30%E from fat | 8 | 1767 | Mean Difference (IV, Random, 95% CI) | ‐0.83 [‐1.28, ‐0.37] |
| 8.2 Int achieved 30%E from fat or less | 16 | 50099 | Mean Difference (IV, Random, 95% CI) | ‐1.11 [‐1.62, ‐0.60] |
| 9 Weight, kg subgrouped by BMI baseline Show forest plot | 28 | 53147 | Mean Difference (IV, Random, 95% CI) | ‐1.54 [‐1.97, ‐1.12] |
| 9.1 BMI at baseline < 25 | 10 | 1781 | Mean Difference (IV, Random, 95% CI) | ‐0.96 [‐1.69, ‐0.22] |
| 9.2 BMI at baseline ≥ 25 to 29.9 | 17 | 51297 | Mean Difference (IV, Random, 95% CI) | ‐1.83 [‐2.38, ‐1.28] |
| 9.3 BMI at baseline ≥ 30 | 1 | 69 | Mean Difference (IV, Random, 95% CI) | ‐1.80 [‐3.48, ‐0.12] |
| 10 Weight, kg subgrouped by healthy vs patient Show forest plot | 30 | 53647 | Mean Difference (IV, Random, 95% CI) | ‐1.54 [‐1.97, ‐1.12] |
| 10.1 Healthy ‐ not recruited on the basis of risk factors or disease | 6 | 45032 | Mean Difference (IV, Random, 95% CI) | ‐0.98 [‐1.56, ‐0.41] |
| 10.2 Recruited on basis of risk factors, e.g. lipids, BMI, hormonal levels, breast CA risk | 14 | 2166 | Mean Difference (IV, Random, 95% CI) | ‐2.18 [‐3.17, ‐1.20] |
| 10.3 People with disease such as DM, MI, cancer, polyps | 10 | 6449 | Mean Difference (IV, Random, 95% CI) | ‐1.20 [‐1.85, ‐0.56] |
| 11 Weight, kg subgrouped by energy reduction in int group Show forest plot | 26 | 53459 | Mean Difference (IV, Random, 95% CI) | ‐1.52 [‐1.97, ‐1.07] |
| 11.1 E intake same or greater in low fat group | 6 | 3352 | Mean Difference (IV, Random, 95% CI) | ‐0.51 [‐1.49, 0.47] |
| 11.2 E intake 1 to 100 kcal/d less in low fat group | 5 | 2398 | Mean Difference (IV, Random, 95% CI) | ‐1.49 [‐2.92, ‐0.06] |
| 11.3 E intake 101 to 200 kcal/d less in low fat group | 6 | 43755 | Mean Difference (IV, Random, 95% CI) | ‐1.14 [‐2.24, ‐0.04] |
| 11.4 E intake > 201 kcal/d less in low fat group | 9 | 3954 | Mean Difference (IV, Random, 95% CI) | ‐2.23 [‐2.97, ‐1.49] |
| Outcome or subgroup title | No. of studies | No. of participants | Statistical method | Effect size |
| 1 Weight, kg ‐ removing studies with more attention to low fat arms Show forest plot | 8 | 1537 | Mean Difference (IV, Random, 95% CI) | ‐1.25 [‐2.09, ‐0.41] |
| 2 Weight, kg ‐ removing studies with dietary interventions other than fat Show forest plot | 22 | 5516 | Mean Difference (IV, Random, 95% CI) | ‐1.92 [‐2.57, ‐1.26] |
| 3 Weight, kg ‐ fixed‐effect analysis Show forest plot | 30 | 54005 | Mean Difference (IV, Fixed, 95% CI) | ‐1.02 [‐1.16, ‐0.87] |
| 4 Weight, kg ‐ removing WHI Show forest plot | 29 | 12294 | Mean Difference (IV, Random, 95% CI) | ‐1.64 [‐2.12, ‐1.16] |
| 5 Weight, kg ‐ removing studies without good allocation concealment Show forest plot | 11 | 49617 | Mean Difference (IV, Random, 95% CI) | ‐0.95 [‐1.40, ‐0.51] |
| Outcome or subgroup title | No. of studies | No. of participants | Statistical method | Effect size |
| 1 BMI, kg/m2 ‐ in child RCTs Show forest plot | 1 | 191 | Mean Difference (IV, Random, 95% CI) | ‐1.5 [‐2.45, ‐0.55] |