Chlorpromazin versus Penfluridol bei Schizophrenie
Abstract
Background
The efficacy of chlorpromazine, a benchmark antipsychotic, has not been fully assessed in direct comparison with different individual antipsychotics. Penfluridol is another old antipsychotic with a long half‐life so one oral dose may last up to one week. This could confer advantage.
Objectives
To assess the clinical effects of chlorpromazine compared with penfluridol for adults with schizophrenia.
Search methods
On 31 March 2017, we searched the Cochrane Schizophrenia Group’s Study‐Based Register of Trials which is based on regular searches of CINAHL, BIOSIS, AMED, Embase, PubMed, MEDLINE, PsycINFO, and registries of clinical trials. There are no language, date, document type, or publication status limitations for inclusion of records in the register.
Selection criteria
We included all randomised clinical trials focusing on chlorpromazine versus penfluridol for adults with schizophrenia or related disorders. Outcomes of interest were death, service utilisation, global state, mental state, adverse effects and leaving the study early. We included trials meeting our selection criteria and reporting useable data.
Data collection and analysis
We extracted data independently. For binary outcomes, we calculated risk ratio (RR) and its 95% confidence interval (CI), on an intention‐to‐treat basis. For continuous data, we planned to estimate the mean difference (MD) between groups and its 95% CI. We employed a fixed‐effect model for analyses. We assessed risk of bias for included studies and created a 'Summary of findings' table using GRADE.
Main results
The review includes three studies with a total of 130 participants. Short‐term results for hospital admissions showed no clear difference between chlorpromazine and penfluridol (1 RCT, n = 29, RR 0.19, 95% CI 0.01 to 3.60, low‐quality evidence). No clear difference in the incidence of akathisia was found at medium term (2 RCTs, n = 85, RR 0.19, 95% CI 0.04 to 1.06, low‐quality evidence), and similar numbers of participants ‐ nearly half ‐ from each treatment group left the study early (3 RCTs, n = 130, RR 1.21, 95% CI 0.83 to 1.77, low‐quality evidence). The risk of needing additional antiparkinsonian medication was less in the chlorpromazine group (2 RCTs, n = 74, RR 0.70, 95% CI 0.51 to 0.95). No useable data reported clinically important change in global or mental state. No data were reported for relapse. No deaths were reported by the trials.
Authors' conclusions
Only three small studies provided data and the quality of reporting and evidence is low. Limited data indicate the efficacy and adverse effects profiles of chlorpromazine and penfluridol are generally similar. Penfluridol, however, may confer advantage by needing to be given only once per week. Firm conclusions are not possible without good‐quality trials, and where these treatments are used, such trials are justified.
PICO
Laienverständliche Zusammenfassung
Chlorpromazin versus Penfluridol bei Schizophrenie
Fragestellung
Wie wirksam ist das Antipsychotikum Chlorpromazin als Behandlung für Schizophrenie im Vergleich zu Penfluridol?
Hintergrund
Schizophrenie ist eine schwere psychische Erkrankung, bei der Menschen Symptome wie Halluzinationen und Wahnvorstellungen, sozialer Rückzug, verminderte Motivation und schlechte emotionale Reaktion erfahren. Zur Behandlung von Schizophrenie dienen hauptsächlich antipsychotische Medikamente. Chlorpromazin und Penfluridol sind weit verbreitete Antipsychotika. Allerdings haben verschiedene Antipsychotika verschiedene Wirkungen. Die Kenntnis der einzelnen Wirkungen verschiedener Antipsychotika und welche besonderen Nebenwirkungen diese verursachen, könnte bei der Entscheidung helfen, welches Antipsychotikum für eine Person mit Schizophrenie verschrieben werden soll. Dieser Review vergleicht Chlorpromazin mit Penfluridol und ist Teil einer Reihe von Reviews, die Chlorpromazin direkt mit anderen Antipsychotika vergleichen.
Suche
Der Informations‐Spezialist von Cochrane Schizophrenia durchsuchte das Studien‐Register der Gruppe im März 2017 nach Studien, welche Erwachsene mit Schizophrenie oder ähnlichen Erkrankungen randomisierten, um entweder Chlorpromazin oder Penfluridol zu erhalten. Sieben Referenzen wurden gefunden und von den Review‐Autoren geprüft.
Gefundene Evidenz
Nur drei randomisierte kontrollierte Studien, mit insgesamt 130 Teilnehmern, erfüllten die Einschlusskriterien des Reviews und stellten brauchbare Daten zur Verfügung. Die Qualität der verfügbaren Evidenz war niedrig, es wurde kein wirklicher Unterschied zwischen Chlorpromazin und Penfluridol bei Krankenhauseinweisungen, Inzidenz von Akathisie oder Anzahl der Teilnehmer, welche die Studie vorzeitig verließen, festgestellt. Während den Studien gab es keine Todesfälle. Aufgrund der schlechten Berichterstattung waren wir nicht in der Lage, die verfügbaren Daten für den globalen und psychischen Zustand zu verwenden und keine der Studien berichtete Rückfall‐Daten.
Schlussfolgerungen
Aufgrund einer solch schlechten Datenqualität können wir keine eindeutigen Schlussfolgerungen über die zu vergleichende Wirksamkeit von Chlorpromazin und Penfluridol ziehen ‐ Penfluridol muss jedoch nur einmal pro Woche gegeben werden, was für die schlechte Therapietreue, die bei Schizophrenie häufig ist, hilfreich sein könnte. Bemerkenswerterweise sind für solche alten Medikamente mehr Studien, die Daten von hoher Qualität berichten, erforderlich.
Authors' conclusions
Summary of findings
| Chlorpromazine versus Penfluridol for schizophrenia | ||||||
| Patient or population: patients with schizophrenia | ||||||
| Outcomes | Illustrative comparative risks* (95% CI) | Relative effect | No of Participants | Quality of the evidence | Comments | |
| Assumed risk3 | Corresponding risk | |||||
| Penfluridol | Chlorpromazine | |||||
| Service utilisation: hospital admission (short term) | 150 per 1000 | 28 per 1000 | RR 0.19 (0.01 to 3.60) | 29 | ⊕⊕⊝⊝ low 1,2 | |
| Global state: clinically important change in global state | See comment | Not estimable | 0 | See comment | No studies reported 'clinically important change in global state'. Change in global state was measure using global state scales but all data were presented without SD. | |
| Global state: relapse | See comment | Not estimable | 0 | See comment | No studies reported this outcome. | |
| Mental state: clinically important change in mental state | See comment | Not estimable | 0 | See comment | No studies reported 'clinically important change in mental state'. Change in mental state was measure using mental state scales but all data were presented without SD. | |
| Adverse effect/event: clinically important extrapyramidal adverse events ‐ akathisia (medium term) | 200 per 1000 | 38 per 1000 | RR 0.19 (0.04 to 1.06) | 85 | ⊕⊕⊝⊝ low 1,2 | The same studies reported data for other extrapyramidal adverse events such as rigidity, tremor, dystonia and dyskinesia. There was no observable difference between chlorpromazine and penfluridol regarding any of these adverse effects. |
| Adverse effect/event: death | See comment | Not estimated | 2 RCTs (0) | See comment | No deaths reported. | |
| Leaving the study early: any reason (medium term) | 400 per 1000 | 484 per 1000 | RR 1.21 (0.83 to 1.77) | 130 | ⊕⊕⊝⊝ low 1,2 | |
| *The basis for the assumed risk (e.g. the median control group risk across studies) is provided in footnotes. The corresponding risk (and its 95% confidence interval) is based on the assumed risk in the comparison group and the relative effect of the intervention (and its 95% CI). | ||||||
| GRADE Working Group grades of evidence | ||||||
| 1 Serious risk of bias: downgraded by one level ‐ study had an unclear risk of bias for random sequence generation and blinding of assessors. | ||||||
Background
Description of the condition
Schizophrenia is a chronic disabling and relapsing mental illness with a worldwide lifetime prevalence of around 1% (Almeida‐Filho 1997; Perala 2007). A person with schizophrenia experiences formal thought disorder and some cognitive disturbances (Fioravanti 2005; Liddle 1987). Symptoms can be divided into positive symptoms (such as delusions, hallucinations) and negative symptoms (such as poverty of speech, flattened affect, lack of pleasure, and lack of motivation) (Crow 1980). Although the symptoms of schizophrenia can be treated with antipsychotic medication, people often relapse. One of the main reasons of relapse in schizophrenia is poor compliance to drugs, often due to their adverse effects, or lack of insight to the disorder (Lindstrom 2000).
Description of the intervention
Antipsychotic drugs are the first‐line treatment for symptoms of schizophrenia. Chlorpromazine is one of the essential antipsychotic drugs in the World Health Organization's list of essential drugs (WHO 2015). Chlorpromazine was introduced in the 1950s for the treatment of both acute and chronic psychoses, including schizophrenia and the manic phase of bipolar disorder, as well as amphetamine‐induced psychoses. In early trials for schizophrenia, chlorpromazine in comparison with placebo showed efficacy in terms of clinical recovery, improvements in social functioning, and preventing relapse. Chlorpromazine has long been recognised as a benchmark by which other antipsychotics have been evaluated (Adams 2014). Chlorpromazine has a wide range of effects on various parts of the body; in addition to extrapyramidal side effects, it has anticholinergic and antihistaminergic effects which cause other adverse effects. To name a few, dry mouth, blurred vision, urinary retention, restlessness, tremors, facial rigidity, shuffling gait and repetitive movements of the face and/or trunk are some of its common side effects (Adams 2014). Chlorpromazine as a phenothiazine is the first of drugs named neuroleptics; after its discovery, new phenothiazine derivatives have also been introduced (Rees 1960).
Penfluridol is a long‐acting antipsychotic agent first synthesised in 1963. This drug is usually administered once weekly and can be considered as a depot medication (Gerlach 1975). It is a diphenylbutylpiperdine. Similar to chlorpromazine, the side effects of penfluridol are tardive dyskinesia, extrapyramidal symptoms and sedation (Reynolds 1982).
How the intervention might work
Both chlorpromazine and penfluridol are typical antipsychotic drugs. Chlorpromazine is a phenothiazine [Subclass: aliphatic side chain; Formula: 2‐chloro‐10‐(3‐dimethylaminopropyl) phenothiazine] (Figure 1). Trade names include Largactil, Hibernal, Megaphen, Solidon and Thorazine. Since it is a dopamine antagonist, its antipsychotic property affects particular areas of the brain.

Chlorpromazine structure
Penfluridol shows a relative antidopaminergic effect through the blocking of dopaminergic receptor membrane (Gerlach 1975; Janssen 1970). It belongs to the diphenylbutylpiperidines (Ionescu 1983; van Praag 1971) [Formula: 4‐(p‐chloro‐ ß‐trifluoro‐m‐tolyl)‐1‐[4,4‐bis(pfluorophenyl) butyl]‐4‐piperidinol] (Figure 2). Trade names include Semap, Sémap and Flupidol. Pimozide is the other drug in this class. Penfluridol is a tertiary amine and only slightly soluble in water (Janssen 1970). After absorption from the gastrointestinal tract, it deposits in fatty tissue from which it is gradually released, giving the prolonged duration of effects of penfluridol with its 70 hour half‐life.

Penfluridol structure
Why it is important to do this review
Chlorpromazine is widely used for psychotic disorders in Africa, India and South‐East Asia. Chlorpromazine is also usually a benchmark for evaluating other drugs (Adams 2005). This review is one of a series of reviews in order to evaluate chlorpromazine in comparison with other antipsychotics so that a full overview of chlorpromazine's clinical efficacy can be completed (Table 1). There is a Cochrane systematic review of Penfluridol for schizophrenia (Soares 2006), however, the clinical profile of chlorpromazine compared with a long‐acting antipsychotic such as penfluridol needs to be updated.
| Review title | Reference |
| Acetophenazine versus chlorpromazine | |
| Chlorpromazine dose for people with schizophrenia | |
| Cessation of medication for people with schizophrenia already stable on chlorpromazine | |
| Chlorpromazine versus atypical antipsychotic drugs for schizophrenia | |
| Chlorpromazine versus clotiapine for schizophrenia | Developing protocol |
| Chlorpromazine versus haloperidol for schizophrenia | |
| Chlorpromazine versus metiapine | |
| Chlorpromazine versus penfluridol for schizophrenia | Current review |
| Chlorpromazine versus piperacetazine | |
| Chlorpromazine versus placebo for schizophrenia | |
| Chlorpromazine for psychosis induced aggression or agitation |
Objectives
To assess the clinical effects of chlorpromazine compared with penfluridol for adults with schizophrenia.
Methods
Criteria for considering studies for this review
Types of studies
We searched for all relevant randomised controlled trials. If a trial had been described as 'double‐blind' but implied randomisation, we planned to include such a trial in a sensitivity analysis ( see Sensitivity analysis). We excluded quasi‐randomised studies, such as those allocating by alternate days of the week. Where people were given additional treatments within penfluridol prescription, we only included the data if the adjunct treatment was evenly distributed between groups and it was only the penfluridol that was randomised.
Types of participants
Adults, however defined, with schizophrenia or related disorders, including schizophreniform disorder and schizoaffective disorder again, by any means of diagnosis. We are interested in making sure that information is as relevant to the current care of people with schizophrenia as possible so proposed, if information was available, to clearly highlight the current clinical state (acute, early post‐acute, partial remission, remission) as well as the stage (prodromal, first episode, early illness, persistent) and as to whether the studies primarily focused on people with particular problems (for example, negative symptoms, treatment‐resistant illnesses).
Types of interventions
1. Chlorpromazine
Any dose and mode or pattern of administration.
2. Penfluridol
Any dose and mode or pattern of administration.
Types of outcome measures
We divided outcomes into short term (less than 12 weeks), medium term (12‐52 weeks) and long term (over one year).
Primary outcomes
1. Service utilisation*
1.1 Hospital admission/readmission
2. Global state
2.1 Clinically important change in global state ‐as defined by each of the studies (short term)
3. Adverse effects
3.1 Clinically important extrapyramidal side effects ‐ as defined by each of the studies
Secondary outcomes
1. Service utilisation
1.1 Days in hospital
2. Global state
2.1 Average endpoint/change score on global state scale
2.2 Relapse ‐ as defined by each of the studies
3. Mental state
3.1 Clinically important change in negative symptoms ‐ as defined by each of the studies
3.2 Average endpoint/change score on mental state scale
3.3 Average endpoint/change score in negative symptoms
4. Behaviour
4.1 Clinically important change in behaviour ‐ as defined by each of the studies
4.2 Average endpoint/change score on behaviour scale
5. Adverse effects/events
5.1 General
5.1.1. Death‐suicide/natural causes
5.1.2 At least one serious adverse effect/event
5.2 Specific (grouped by system‐one expanded example given below)
5.2.1 Movement disorders
a. Any extrapyramidal side effects
b. Use of antiparkinson drugs
c. Clinically important extrapyramidal side effects‐as defined by each of the studies
d. Average endpoint/change score on extrapyramidal side effects scale
5.2.2 Anticholinergic
5.2.3 Cardiovascular
5.2.4 Central nervous system
5.2.5 Gastrointestinal
5.2.6 Endocrine (e.g. amenorrhoea, galactorrhoea, hyperlipidaemia, hyperglycaemia, hyperinsulinaemia)
5.2.7 Haematology (e.g. haemogram, leucopenia, agranulocytosis/neutropenia)
5.2.8 Hepatic (e.g. abnormal transaminase, abnormal liver function)
5.2.9 Metabolic
5.2.10 Various other
6. Leaving the study early
6.1 For any reason
6.2 Due to adverse effects
7. Social functioning
7.1 Clinically important change in social functioning ‐as defined by each of the studies
7.2 Average endpoint/change score on social functioning scale
7.3 Employment status
8. Economic outcomes
9. Quality of life/satisfaction with care, for either recipients of care or carers
9.1 Clinically important change in quality of life/satisfaction‐as defined by each of the studies
9.2 Average endpoint/change score on quality of life/satisfaction scale
10. Cognitive functioning
10.1 Clinically important change in cognitive functioning ‐ as defined by each of the studies
10.2 Average endpoint/change score on cognitive functioning scale
'Summary of findings' table
We used the GRADE approach to interpret findings (Schünemann 2011); and used GRADEpro GDT to export data from our review to create a 'Summary of findings' table . This table provides outcome‐specific information concerning the overall certainty of evidence from each included study in the comparison, the magnitude of effect of the interventions examined, and the sum of available data on all outcomes we rate as important to patient care and decision making. We selected the following main outcomes for inclusion in the 'Summary of findings' table:
-
Service utilisation: Hospital admission
-
Global state: Clinically important change in global state‐as defined by each of the studies (short term)
-
Global state: Relapse
-
Mental state: Clinically important change in mental state ‐as defined by each of the studies (short term)
-
Adverse effects: Clinically important extrapyramidal side effects ‐ as defined by each of the studies
-
Adverse effects: Death
-
Leaving the study early
Search methods for identification of studies
Electronic searches
Cochrane Schizophrenia Group’s Study‐Based Register of Trials
On 17 August 2015 and 31 March 2017, the Information Specialist searched the register using the following search strategy:
(Chlorpromazine AND Penfluridol) in Intervention Field of STUDY
In such a study‐based register, searching the major concept retrieves all the synonyms and relevant studies because all the studies have already been organised based on their interventions and linked to the relevant topics.
This register is compiled by systematic searches of major resources (including AMED, BIOSIS, CINAHL, Embase, MEDLINE, PsycINFO, PubMed, and registries of clinical trials) and their monthly updates, handsearches, grey literature, and conference proceedings (see Group’s Module). There is no language, date, document type, or publication status limitations for inclusion of records into the register.
Searching other resources
1. Reference searching
We inspected the references of all included studies for further relevant studies.
2. Personal contact
We did not contact the manufacturers of penfluridol or chlorpromazine for additional data.
Data collection and analysis
Selection of studies
Review authors NN and NK independently inspected citations from the searches and identified relevant abstracts. MV independently re‐inspected a random 20% sample to ensure reliability. Where disputes arose, we acquired the full‐text report for more detailed scrutiny. NN and NK obtained and inspected the full reports of the abstracts meeting the review criteria. Again, MV re‐inspected a random 20% of reports in order to ensure reliable selection. If it had not been possible to resolve disagreement by discussion, we would have attempted to contact the authors of the study for clarification.
Data extraction and management
1. Extraction
Review author MV extracted data from all included studies. In addition, to ensure reliability, NN independently extracted data from all included studies. There were no disagreements between review authors in terms of the extracted data. If required, we would have extracted data presented only in graphs and figures whenever possible, but would have only included the data if two review authors independently had the same results.
2. Management
2.1 Forms
We extracted data onto standard, pre‐designed simple forms.
2.2 Scale‐derived data
We would have included continuous data from rating scales only if:
-
the psychometric properties of the measuring instrument have been described in a peer‐reviewed journal (Marshall 2000);
-
the measuring instrument has not been written or modified by one of the trialists for that particular trial; and
-
the instrument should be a global assessment of an area of functioning and not sub‐scores which are not, in themselves, validated or shown to be reliable. However there are exceptions; we would have included sub‐scores from mental state scales measuring positive and negative symptoms of schizophrenia.
Ideally, the measuring instrument should either be i. a self‐report or, ii. completed by an independent rater or relative (not the therapist). We realise that this is not often reported clearly; in 'Description of studies' in the Results section we would have noted whether or not this was the case.
2.3 Endpoint versus change data
There are advantages to both endpoint and change data. Change data can remove a component of between‐person variability from the analysis. On the other hand, calculation of change needs two assessments (baseline and endpoint), which can be difficult in unstable and difficult to measure conditions such as schizophrenia. We decided primarily to use endpoint data, and only use change data if the former were not available. We would have combined endpoint and change data in the analysis as we prefer to use mean differences (MD) rather than standardised mean differences (SMD) (Deeks 2011).
2.4 Skewed data
Continuous data on clinical and social outcomes are often not normally distributed. To avoid the pitfall of applying parametric tests to non‐parametric data, we planned to apply the following standards to scale data.
For endpoint data from studies N < 200
-
If a scale started from the finite number zero, we would have subtracted the lowest possible value from the mean, and divided this by the standard deviation (SD). If this value was lower than 1, it would have strongly suggested a skew and we would have excluded such data. If this ratio was higher than 1 but below 2, there is a suggestion of skew. We would have entered such data and tested whether its inclusion or exclusion changed the results substantially. If these data did change the results we would have entered them as 'other data'. Finally, if the ratio was larger than 2, we would have included these data, because skew was less likely (Altman 1996; Higgins 2011).
-
If a scale starts from a positive value (such as the Positive and Negative Syndrome Scale (PANSS), which can have values from 30 to 210) (Kay 1986), the calculation described above can be modified to take the scale starting point into account. In these cases skew is present if 2 SD > (S‐S min), where S is the mean score and 'S min' is the minimum score.
For change data
-
We would have entered change data as when continuous data are presented on a scale that includes a possibility of negative values (such as change data), it is difficult to tell whether data are skewed or not. We would have presented and entered change data into statistical analyses.
2.5 Common measure
To facilitate comparison between trials, we intended to convert variables that can be reported in different metrics, such as days in hospital (mean days per year, per week, or per month) to a common metric (e.g. mean days per month).
2.6 Conversion of continuous to binary
We would have made efforts to convert continuous outcome measures to dichotomous data. This can be done by identifying cut‐off points on rating scales and dividing participants accordingly into 'clinically improved' or 'not clinically improved'. It is generally assumed that if there is a 50% reduction in a scale‐derived score such as the Brief Psychiatric Rating Scale (BPRS, Overall 1962) or the Positive and Negative Syndrome Scale (PANSS, Kay 1986), this could be considered as a clinically significant response (Leucht 2005a; Leucht 2005b). Had data based on these thresholds not been available, we would have used the primary cut‐off presented by the original authors.
2.7 Direction of graphs
Where possible, we entered data in such a way that the area to the left of the line of no effect indicates a favourable outcome for chlorpromazine.
Assessment of risk of bias in included studies
MV and MV worked independently to assess risk of bias by using criteria described in the Cochrane Handbook for Systematic Reviews of Interventions (Higgins 2011a) to assess trial quality. This set of criteria is based on evidence of associations between an overestimate of effect and high risk of bias of the article, such as sequence generation, allocation concealment, blinding, incomplete outcome data and selective reporting.
If the raters had disagreed, the final rating would have been made by consensus. If inadequate details of randomisation and other characteristics of trials were provided, we would have contacted authors of the studies in order to obtain additional information. We would have reported non‐concurrence in quality assessment, and if disputes arose as to which category a trial was to be allocated, again, we would have resolved these by discussion.
We noted the level of risk of bias both the Results text of the review and in the summary of findings Table for the main comparison
Measures of treatment effect
1. Binary data
For binary outcomes, we calculated a standard estimation of the risk ratio (RR) and its 95% confidence interval (CI). It has been shown that RR is more intuitive (Boissel 1999) than odds ratios (ORs) and that ORs tend to be interpreted as RRs by clinicians (Deeks 2000). The number needed to treat for an additional beneficial/harmful outcome (NNTB/NNTH) statistic with its CIs is intuitively attractive to clinicians, but is problematic both in its accurate calculation in meta‐analyses and interpretation (Hutton 2009). For binary data presented in the 'Summary of findings' table, where possible, we calculated illustrative comparative risks.
2. Continuous data
There were no usable reported continuous data in the included studies.
Unit of analysis issues
1. Cluster trials
Studies increasingly employ 'cluster randomisation' (such as randomisation by clinician or practice), but analysis and pooling of clustered data poses problems. Firstly, authors often fail to account for intraclass correlation in clustered studies, leading to a 'unit of analysis' error (Divine 1992) whereby P values are spuriously low, CIs unduly narrow, and statistical significance overestimated. This causes type I errors (Bland 1997; Gulliford 1999).
If we had included cluster‐randomised trials and clustering had not been accounted for in primary studies, we would have presented data in a table, with a (*) symbol to indicate the presence of a probable unit of analysis error. In subsequent versions of this review, we will seek to contact first authors of studies to obtain intra‐class correlation coefficients (ICCs) for their clustered data and adjust for this by using accepted methods (Gulliford 1999). If clustering had been incorporated into the analysis of primary studies, we would have presented these data as if from a non‐cluster randomised study, but adjusted the data for the clustering effect.
We have sought statistical advice and have been advised that the binary data as presented in a report should be divided by a 'design effect'. This is calculated using the mean number of participants per cluster (m) and the ICC [Design effect=1+(m‐1)*ICC] (Donner 2002). If the ICC was not reported we would have assumed it to be 0.1 (Ukoumunne 1999).
If cluster studies have been appropriately analysed taking into account ICCs and relevant data documented in the report, synthesis with other studies would be possible using the generic inverse variance technique.
2. Cross‐over trials
A major concern of cross‐over trials is the carry‐over effect. It occurs if an effect (e.g. pharmacological, physiological or psychological) of the treatment in the first phase is carried over to the second phase. As a consequence, on entry to the second phase the participants can differ systematically from their initial state, despite a wash‐out phase. For the same reason, cross‐over trials are not appropriate if the condition of interest is unstable (Elbourne 2002). As both effects are very likely in severe mental illness, if cross‐over trials had been included, we would only have used data of the first phase of cross‐over studies.
3. Studies with multiple treatment groups
Had a study involved more than two treatment arms, we would have presented the additional treatment arms in comparisons. If data were binary, we would simply have added and combined the data within the two‐by‐two table. If data were continuous, we would have combined data following the formula in section 7.7.3.8 (Combining groups) of the Cochrane Handbook for Systematic Reviews of Interventions (Higgins 2011). If the additional treatment arms were not relevant, we would not have used these data.
Dealing with missing data
1. Overall loss of credibility
At some degree of loss of follow‐up, data must lose credibility (Xia 2009). We chose that, for any particular outcome, should more than 50% of data be unaccounted for, we would not reproduce these data or use them within analyses. If, however, more than 50% of those in one arm of a study were lost, but the total loss was less than 50%, we would address this within the 'Summary of findings' table by down‐rating quality. Finally, we also planned to downgrade quality within the 'Summary of findings' table should the loss be 25% to 50% in total.
2. Binary
In the case where attrition for a binary outcome was between 0% and 50% and where these data were not clearly described, we planned to present data on a 'once‐randomised‐always‐analyse' basis (an intention‐to‐treat analysis (ITT)). Those leaving the study early would all have been assumed to have the same rates of negative outcome as those who completed. We would have used the rate of those who stayed in the study ‐ in that particular arm of the trial ‐ and applied this also to those who did not. We planned to undertake a sensitivity analysis to test how prone the primary outcomes were to change when data only from people who completed the study to that point were compared to the intention‐to‐treat analysis using the above assumptions.
3. Continuous
3.1 Attrition
In cases where attrition for a continuous outcome was between 0% and 50%, and data only from people who completed the study to that point were reported, we would have reproduced such data.
3.2 Standard deviations
If standard deviations (SDs) were not reported, we would first have tried to obtain the missing values from the authors. If not available, where there were missing measures of variance for continuous data, but an exact standard error (SE) and confidence intervals available for group means, and either a P value or t value available for differences in mean, we can calculate them according to the rules described in the Cochrane Handbook for Systematic Reviews of Interventions (Higgins 2011): When only the SE is reported, SDs are calculated by the formula SD=SE * square root (n). Chapters 7.7.3 and 16.1.3 of the Cochrane Handbook for Systematic Reviews of Interventions (Higgins 2011) present detailed formulae for estimating SDs from P values, t or F values, confidence intervals, ranges or other statistics. If these formulae do not apply, we can calculate the SDs according to a validated imputation method which is based on the SDs of the other included studies (Furukawa 2006). Although some of these imputation strategies can introduce error, the alternative would be to exclude a given study’s outcome and thus to lose information. We nevertheless would examine the validity of the imputations in a sensitivity analysis excluding imputed values.
3.3 Assumptions about participants who left the trials early or were lost to follow‐up
Various methods are available to account for participants who leave the trials early or are lost to follow‐up. Some trials just present the results of study completers, others use the method of last observation carried forward (LOCF), while more recently methods such as multiple imputation or mixed effects models for repeated measurements (MMRM) have become more of a standard. While the latter methods seem to be somewhat better than LOCF (Leon 2006), we feel that the high percentage of participants leaving the studies early and differences in the reasons for leaving the studies early between groups is often the core problem in randomised schizophrenia trials. We therefore decided we would not exclude studies based on the statistical approach used. However, we would preferably have used the more sophisticated approaches. For example, MMRM or multiple‐imputation is preferred to LOCF and we would only present completer analyses if some kind of ITT data were not available at all. Moreover, we addressed this issue in the 'Risk of bias' tool.
Assessment of heterogeneity
1. Clinical heterogeneity
We considered all included studies initially, without seeing comparison data, to judge clinical heterogeneity. We simply inspected all studies for clearly outlying people or situations which we had not predicted would arise. If such situations or participant groups had arisen, we would have discussed any issues.
2. Methodological heterogeneity
We considered all included studies initially, without seeing comparison data, to judge methodological heterogeneity. We simply inspected all studies for clearly outlying methods which we had not predicted would arise. If such methodological outliers had arisen, we would have discussed any issues.
3. Statistical heterogeneity
3.1 Visual inspection
We visually inspected graphs to investigate the possibility of statistical heterogeneity.
3.2 Employing the I2 statistic
We investigated heterogeneity between studies by considering the I2 method alongside the Chi2 P value. The I2 provides an estimate of the percentage of inconsistency thought to be due to chance (Higgins 2003). The importance of the observed value of I2 depends on i. magnitude and direction of effects and ii. strength of evidence for heterogeneity (e.g. P value from Chi2 test, or a confidence interval for I2). We would have considered an I2 estimate greater than or equal to around 50% accompanied by a statistically significant Chi2 statistic, as evidence of substantial levels of heterogeneity (Section 9.5.2, Deeks 2011). If substantial levels of heterogeneity had been found in the primary outcome, we would have explored reasons for heterogeneity (Subgroup analysis and investigation of heterogeneity).
Assessment of reporting biases
Reporting biases arise when the dissemination of research findings is influenced by the nature and direction of results (Egger 1997). These are described in section 10.1 of the Cochrane Handbook for Systematic Reviews of Interventions (Sterne 2011).
1. Protocol versus full study
We tried to locate protocols of included randomised trials. If the protocol was available, we compared outcomes in the protocol and in the published report . If the protocol was not available, we compared outcomes listed in the methods section of the trial report with actually reported results.
2. Funnel plot
We are aware that funnel plots may be useful in investigating reporting biases but are of limited power to detect small‐study effects. We planned not to use funnel plots for outcomes where there were 10 or fewer studies, or where all studies were of similar size. In other cases, where funnel plots were possible, we would have sought statistical advice in their interpretation.
Data synthesis
We understand that there is no closed argument for preference for use of fixed‐effect or random‐effects models. The random‐effects method incorporates an assumption that the different studies are estimating different, yet related, intervention effects. This often seems to be true to us and the random‐effects model takes into account differences between studies even if there is no statistically significant heterogeneity. There is, however, a disadvantage to the random‐effects model. It puts added weight onto small studies which often are the most biased ones. Depending on the direction of effect these studies can either inflate or deflate the effect size. We chose fixed model for all analyses.
Subgroup analysis and investigation of heterogeneity
1. Subgroup analyses
1.1 Primary outcomes
No subgroup analysis was anticipated.
2. Investigation of heterogeneity
If inconsistency was high, we would have reported it. First, we would have investigated whether data had been entered correctly. Second, if data were correct, we would have visually inspected the graph and successively removed outlying studies to see if homogeneity was restored. For this review, we decided that should this occur with data contributing to the summary finding of no more than around 10% of the total weighting, we would present the data. If not, we would not pool these data, but discuss any issues. We know of no supporting research for this 10% cut‐off but are investigating use of prediction intervals as an alternative to this unsatisfactory state.
If unanticipated clinical or methodological heterogeneity had been obvious we would simply have stated hypotheses regarding these for future reviews or versions of this review. We did not anticipate undertaking analyses relating to these.
Sensitivity analysis
If substantial differences had been noted in the direction or precision of effect estimates in any of the sensitivity analyses listed below, we would not have pooled data from the excluded trials with the other trials contributing to the outcome, but presented them separately as 'other data'.
1. Implication of randomisation
We would have included trials in a sensitivity analysis if they had been described in some way as to imply randomisation. For the primary outcomes, if there had been no substantive difference when we added the implied randomised studies to those with better descriptions of randomisation, then we would have employed all data from these studies.
2. Assumptions for lost binary data
Where assumptions had to be made regarding people lost to follow‐up (see Dealing with missing data), we would have compared the findings of the primary outcomes when we used our assumptions and when we used data only from people who completed the study to that point. If there was a substantial difference, we would have reported results and discussed them but continued to employ our assumption.
3. Risk of bias
For the primary outcome, we would have analysed the effects of excluding trials that were judged to be at high risk of bias across one or more of the domains of randomisation (see Assessment of risk of bias in included studies). If the exclusion of trials at high risk of bias had not substantially altered the direction of effect or the precision of the effect estimates, then we would have included data from these trials in the analysis.
4. Imputed values
If we had included cluster trials, we would have undertaken a sensitivity analysis to assess the effects of including data from trials where we used imputed values for ICC in calculating the design effect in cluster‐randomised trials.
5. Fixed‐effect or random‐effects
We synthesised all data using a fixed‐effect model. However, we also synthesised data for the primary outcome using a random‐effects model to evaluate whether this altered the significance of the results. If there had been a substantial difference, we would have reported this.
Results
Description of studies
Please see Characteristics of included studies and Characteristics of excluded studies.
Results of the search
Details of the search results are illustrated in the PRISMA table (Figure 3).
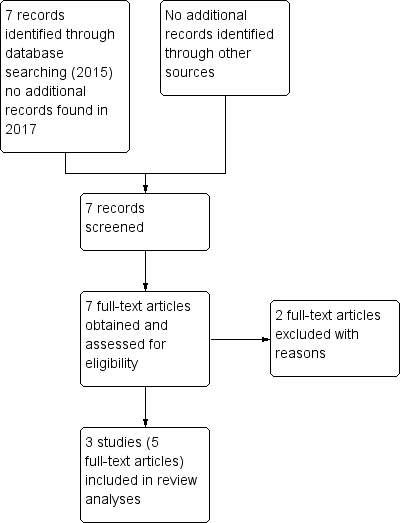
Study flow diagram.
In the original search we found seven reports that were potentially relevant. There were no duplicates. We inspected full text of these reports and then grouped these into trials where several reports referred to the same trial. After excluding two trials, we included three trials (five reports).
Included studies
1. Duration
Duration of studies ranged from 13 to 52 weeks. Results of Chouinard 1977 were reported in three separate published articles. Two of them contain results of participants receiving the chlorpromazine or penfluridol for an inpatient phase of three weeks and the other has results of an outpatient follow‐up phase which lasted 10 weeks. Wang 1982 was a medium‐term trial of 20 weeks and, finally, Claghorn 1979 was for a total of 52 weeks.
2. Participants
A total of 130 people aged 19 to 60 years participated in the studies.
All participants were diagnosed with schizophrenia. Participants in Chouinard 1977 were classified as paranoid or non‐paranoid subtype based on the Diagnostic and Statistical Manual of Mental Disorders_II (DSM‐II criteria). Wang 1982 reported no criteria for diagnosis of schizophrenia. The diagnostic criteria for Claghorn 1979 are not clear. All participants had a history of chronic schizophrenia with the people in the Claghorn 1979 study being particularly unwell with a duration of illness in the decades and even the particular episode of illness being between eight and 10 years long.
Participants in Wang 1982 were all males. Claghorn 1979 and Chouinard 1977 included both men and women.
3. Setting
Chouinard 1977 had an inpatient setting for three weeks, followed by a 10‐week outpatient phase. Wang 1982 included both inpatients and outpatients. Claghorn 1979, dealing with a group of very ill people, was conducted all in hospital.
4. Intervention
Both intervention drugs were administered orally.
4.1 Chlorpromazine
The starting dose and maximum doses of chlorpromazine in Wang 1982 were 415 mg/day and 1050 mg/day, respectively. Chouinard 1977 prescribed chlorpromazine at dose of 300 mg/day during the first week, 600 mg/day in the second week and 900 mg/day during the third week, and continued the last dose in the 10‐week follow‐up phase (the mean dose was 650 mg/day). Although there were higher doses used, the final mean dose in Claghorn 1979 settled at 300 mg/day.
4.2 Penfluridol
The initial dose, and maximum doses of penfluridol Wang 1982 were 60 mg/week and 140 mg/week, respectively. Chouinard 1977 prescribed penfluridol at single dose of 40 mg in the first week, 80 mg in the second week and 120 mg during the third week and continued the last dose in the 10‐week follow‐up phase (the mean dose was 102 mg/week). A similar regimen was adopted by Claghorn 1979, with the final mean dose being 74 mg/week.
5. Outcomes and outcome scales
Studies reported dichotomous (binary) and continuous outcomes; however, all scale data were impossible to use as, either, means were presented without SD or attrition was over 50% (please see Dealing with missing data). No included study reported economic outcomes, and effects of interventions on quality of life, employment status or cognitive functioning.
Excluded studies
We excluded two studies. One was a quasi‐randomised study (Bao 1988). We initially had excluded Claghorn 1979 as less than 50% of people completed the entire course of the trial, but found that some adverse effects and the number actually leaving were reported on 100% of people; as a result, this study is now included. Li 1987 also seemed to have high attrition, but in addition, the number of people in each group was not mentioned. Therefore we excluded this study.
Risk of bias in included studies
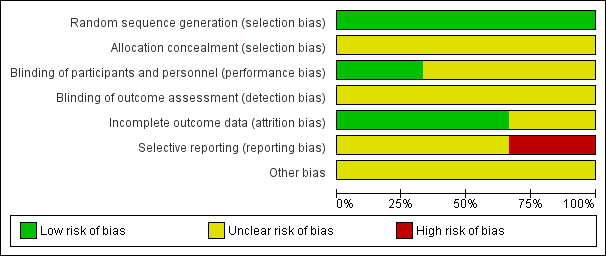
'Risk of bias' graph: review authors' judgements about each risk of bias item presented as percentages across all included studies.

'Risk of bias' summary: review authors' judgements about each risk of bias item for each included study.
Allocation
None of the included studies described the methods used to generate random allocation, although Claghorn 1979 used block randomisation. Having said that, the Claghorn 1979 study, conscious of how allocation can still result in imbalanced groups, reported on differences in distribution of illness duration and sex. There was an implication from the writing in this study that the authors understood the randomisation procedure. We have no information from these old studies about allocation concealment.
Blinding
All three included trials used a double‐blind design. Chouinard 1977 had an unclear risk of bias as reports did not explain how they used a double‐blind method and how successful their attempts at blinding were. Claghorn 1979 used placebo tablets to mask that participants in one group really only got one active dose per week whereas those allocated to chlorpromazine were given active compound daily. Wang 1982 described their method of blinding. In this study all patients received identical appearing capsules on a special "blister pack" medication card allowing the patient to take the medication on a twice‐a‐day schedule. We rated Wang 1982 as low risk of bias for performance bias as they had described the methods used to ensure blinding of participants and personnel.
Incomplete outcome data
This was not a major issue in two of the trials. Claghorn 1979, however, had high attrition that was clearly described.
Selective reporting
We felt that both Chouinard 1977 and Wang 1982 carry at least an 'unclear' risk of bias for selective reporting as quite a few outcomes were not clearly reported. Claghorn 1979, however, we thought, should be rated as 'high' risk as there was clear selective reporting of adverse effects. We recognise that when extensive investigations are undertaken this can generate a very long list of rare adverse effects that is cumbersome to reproduce in the published report. With online storage of data this becomes less of a problem and we may be judging Claghorn 1979 by standards of three decades beyond its publication. However, we think, even in 1979, inclusion of extensive lists of adverse effects was not rare and such a table would have been reassuring to the reader that rare but important effects had not been under‐reported.
Other potential sources of bias
All three studies had an unclear risk of bias for other potential sources of bias.
Effects of interventions
See: Summary of findings for the main comparison
1. COMPARISON 1. Chlorpromazine versus penfluridol
1. Service utilisation: hospital readmission
We identified one short‐term study (n = 29) reporting data for this outcome. We did not find evidence of a clear difference between chlorpromazine and penfluridol (risk ratio (RR) 0.19, 95% confidence interval (CI) 0.01 to 3.60, low‐quality evidence; Analysis 1.1).
1.2 Adverse effects: 1a. General ‐ needing antiparkinsonian medication
Short‐term results from Chouinard 1977 showed no observable difference between chlorpromazine and penfluridol for numbers of participants needing antiparkinsonian medication (1 RCT, n = 33, RR 0.82, 95% CI 0.46 to 1.46) and Wang 1982 however found evidence that chlorpromazine had a favourable effect in the medium term (1 RCT, n = 41, RR 0.63, 95% CI 0.43 to 0.91). Overall, there was suggestion that use of chlorpromazine carried less risk of needing additional medication for movement disorder adverse effects (2 RCTs, n = 74, RR 0.70, 95% CI 0.51 to 0.95; Analysis 1.2).
1.3 Adverse effects: 1b. General ‐ need to reduce antipsychotic dose due to adverse effects
Similar numbers of participants from each group needed a reduction in their antipsychotic dose to alleviate adverse effects (1 RCT, n = 33, RR 0.74, 95% CI 0.26 to 2.06; Analysis 1.3).
1.4 Adverse effects: 2a. Specific ‐ extrapyramidal events (moderate or severe) ‐ short term
Chouinard 1977 assessed extrapyramidal adverse effects at three weeks. No incidences of akathisia, dyskinesia, dystonia or tremor were observed. Two participants receiving penfluridol experienced rigidity, while no rigidity occurred in the chlorpromazine group, however, these data do not show a substantial difference between chlorpromazine and penfluridol for this outcome (1 RCT, n = 33, RR 0.15, 95% CI 0.01 to 2.90; Analysis 1.4).
1.5 Adverse effects: 2b. Specific ‐ extrapyramidal events (moderate or severe) ‐ medium term
Overall, no differences between chlorpromazine and penfluridol were evident for extrapyramidal events (Analysis 1.5).
1.5.1 akathisia
Two studies reported data for akathisia , there was not a clear difference in effect between chlorpromazine and penfluridol (2 RCTs, n = 85, RR 0.19, 95% CI 0.04 to 1.06, low‐quality evidence).
1.5.2 dyskinsia
Two studies reported data for dyskinesia, there was not a clear difference in effect between chlorpromazine and penfluridol (2 RCTs, n = 85, RR 0.97, 95% CI 0.14 to 6.52).
1.5.3 dystonia
One study reported data for dystonia, with one person from each group experiencing dystonia (1 RCT, n = 29, RR 0.93, 95% CI 0.06 to 13.54).
1.5.4 muscle spasm
One study (n = 56) reported data for muscle spasm, there was not a clear difference between chlorpromazine and penfluridol (RR 3.00, 95% CI 0.13 to 70.64).
1.5.5 rigidity
Two studies (n = 70) reported data for this outcome, there was not a clear difference in effect between chlorpromazine and penfluridol (RR 0.22, 95% CI 0.04 to 1.20).
1.5.6 tremor
Two studies (n = 85) reported data for this outcome, there was not a clear difference in effect between chlorpromazine and penfluridol RR 0.70, 95% CI 0.14 to 3.43).
1.6 Adverse effects: 2c. Specific ‐ anticholinergic (moderate or severe) ‐ short term
One study provided data for anticholinergic effects. Overall, no differences between chlorpromazine and penfluridol were evident for anticholingeric adverse effects in the short term (Analysis 1.6).
1.6.1 constipation
Six people receiving chlorpromazine and one person receiving penfluridol experienced constipation (1 RCT, n = 33, RR 4.42, 95% CI 0.60 to 32.71).
1.6.2 dry mouth
Only one person in the chlorpromazine group experienced dry mouth (1 RCT, n = 33, RR 2.25, 95% CI 0.10 to 51.46).
1.6.3 increased salivation
One person receiving penfluridol experienced an increase in salivation (1 RCT, n = 33, RR 0.25, 95% CI 0.01 to 5.72).
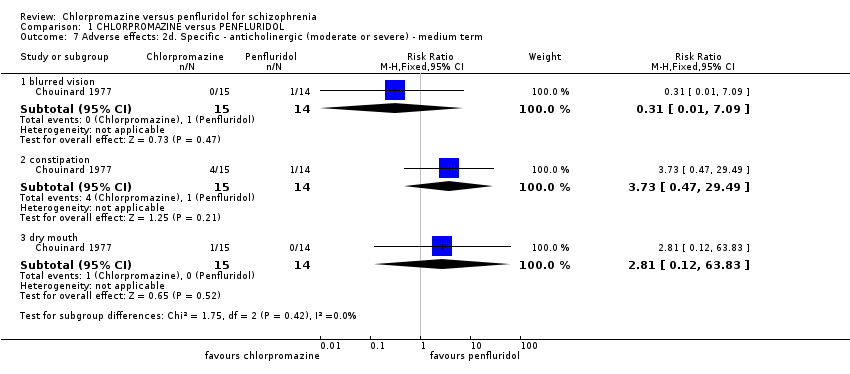
1.7 Adverse effects: 2d. Specific ‐ anticholinergic (moderate or severe) ‐ medium term
Again, only one study reported data. Overall, no differences between chlorpromazine and penfluridol were evident for anticholingeric adverse effects in the medium term (Analysis 1.7).
1.7.1 blurred vision
No people receiving chlorpromazine and one receiving penfluridol experienced blurred vision (1 RCT, n = 29, RR 0.31, 95% CI 0.01 to 7.09).
1.7.2 constipation
Four people in the chlorpromazine group and one receiving penfluridol experienced constipation (1 RCT, n = 29, RR 3.73, 95% CI 0.47 to 29.49).
1.7.3 dry mouth
One person receiving chlorpromazine experienced dry mouth (1 RCT, n = 29, RR 2.81, 95% CI 0.12 to 63.83).
1.8 Adverse effects: 2e. Specific ‐ central nervous system (moderate or severe) ‐ short term
Data from one study found no differences between chlorpromazine and penfluridol were evident for anticholingeric adverse effects in the short term (Analysis 1.8).
1.8.1 agitation
One person receiving chlorpromazine became agitated in the short term (1 RCT, n = 33, RR 2.25, 95% CI 0.10 to 51.46).
1.8.2. drowsiness
FIve people receiving chlorpromazine became drowsy (1 RCT, n = 33, RR 8.25, 95% CI 0.49 to 137.94).
1.8.3 dizziness
One participant in the chlorpromazine group and three in the penfluridol group experienced dizziness (1 RCT, n = 33, RR 0.25, 95% CI 0.03 to 2.12).
1.8.4 insomnia
One person receiving chlorpromazine experienced insomnia (1 RCT, n = 33, RR 2.25, 95% CI 0.10 to 51.46).
1.9 Adverse effects: 2f. Specific ‐ central nervous system (moderate or severe) ‐ medium term
Two studies reported central nervous system effects data for the medium term, there was no clear differences between the two treatments for specific central nervous system effects.
1.9.1 drowsiness
Two studies showed no evidence of a clear difference between the two treatments for drowsiness (2 RCTs, n = 85, RR 1.05, 95% CI 0.54 to 2.05).
1.9.2 dizziness
One study reported data for dizziness. One person in the chlorpromazine group and two in the penfluridol group experienced dizziness (1 RCT, n = 29, RR 0.47, 95% CI 0.05 to 4.60).
1.9.3 excitement
One study reported data for excitement. One person in the chlorpromazine group experienced excitement (1 RCT, n = 29, RR 2.81, 95% CI 0.12 to 63.83).
1.9.4 faintness
One study reported data for faintness. Two participants from each group experienced faintness (1 RCT, n = 29, RR 0.93, 95% CI 0.15 to 5.76).
1.9.5 insomnia
Two studies reported data for insomnia. There was evidence of a clear difference, favouring chlorpromazine (2 RCTs, n = 85, RR 0.17, 95% CI 0.03 to 0.93).
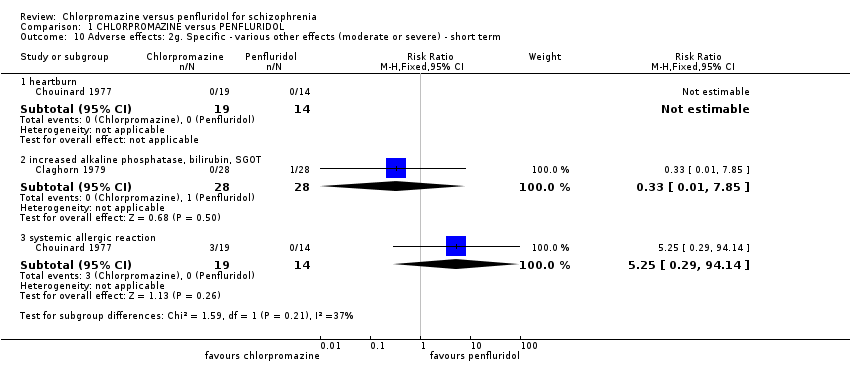
1.10 Adverse effects: 2g. Specific ‐ various other effects (moderate or severe) ‐ short term
Two studies provided data for various other effects. One reported on heartburn and the other reported on systemic allergic reaction. Chlorpromazine was no different in its effect compared to penfluridol for various other short‐term effects (Analysis 1.10).
1.10.1 heartburn
One study (n = 33) provided data for heartburn. No one experienced heartburn in either group.
1.10.2 increased alkaline phosphatase, bilirubin, SGOT (serum glutamic oxaloacetic transaminase)
One study found no evidence of a difference between the two treatments (1 RCT, n = 56, RR 0.33 95% CI 0.01 to 7.85)
1.10.3 Systemic allergic reaction
One study provided data. Three people in the chlorpromazine group experienced systemic allergic reaction (1 RCT, n = 33, RR 5.25, 95% CI 0.29 to 94.14).
1.11 Adverse effects: 2h. Specific ‐ various other effects (moderate or severe) ‐ medium term
Various other adverse effects were measured in the medium term by one study . No clear difference was seen between the two treatments for any of these effects Analysis 1.11.
1.11. 1 depression
(1 RCT, n = 29, RR 0.19, 95% CI 0.01 to 3.60).
1.11.2 decreased sexual drive
(1 RCT, n = 29, RR 0.47, 95% CI 0.05 to 4.60).
1.11.3 impotence
(1 RCT, n = 29, RR 2.81, 95% CI 0.12 to 63.83).
1.11.4 photosensitivity
(1 RCT, n = 29, RR 2.81, 95% CI 0.12 to 63.83).
1.11.5 poor appetite
(1 RCT, n = 29, RR 0.93, 95% CI 0.06 to 13.54).
1.12 Leaving the study early: 1a. Any reason
Pooled data from three studies showed no clear medium‐term differences between penfluridol and chlorpromazine (3 RCTs, n = 130, RR 1.21. 95% CI 0.83 to 1.77, low‐quality evidence; Analysis 1.12).
1.13 Leaving the study early: 1b. Due to adverse events
Two studies found no clear differences, in either short or medium term, when leaving early was due to adverse effects (Analysis 1.13)
Discussion
Summary of main results
The summary below shows the outcomes selected for the summary of findings Table for the main comparison and addresses the main findings of this review.
1. Service utilisation: hospital readmission
There was only one study reporting two participants on penfluridol who were readmitted (due to depression). There was no clear differences between the drugs, but this important outcome was only reported in one tiny study (n = 29) and data quality have to be considered low. Best evidence highlights no difference. but the best evidence is poor.
2. Global state
This is not a difficult outcome to record. No study reported on a binary outcome and the continuous data‐measured by Clinical Global Impression (CGI) were unusable (standard deviations of means were not reported in both included studies). No study reported on relapse as the other aspect of global state.
3. Mental state
There is, at least, consistency across outcomes. Again, no study reported on a binary outcome and the continuous data were unusable (standard deviations of means were not reported in both included studies). It is easy to unfairly judge pioneering studies of the past by standards of today, but we think it unlikely that the participants in these trials gave informed consent to have data squandered.
4. Adverse effects/events
4.1 Extrapyramidal adverse events‐akathisia
We chose this medium‐term outcome because two studies reported on it. Data quality were low, trials were very small (2 RCTs, N = 85) and results equivocal, but there was a suggestion that should studies have been larger, the chlorpromazine group would have experienced less akathisia. Penfluridol, with a relatively higher potency, would be expected to induce more extrapyramidal side effects than chlorpromazine. However, the small sample size and probable reporting bias could mean little difference between the two drugs regarding extrapyramidal adverse effects was observed.
4.2 Death
The lifetime incidence of suicide in people with schizophrenia is estimated to be 10% to 13% (Caldwell 1992). Sudden death as an adverse effect of antipsychotic drugs has been shown to have an incidence rate ratio of 1.99 (Manu 2011). There was no report of death in the short and small included studies. Of course this is an important effect/event but, in retrospect, it might not have been wise to present this in the 'Summary of findings' as we would always have been unlikely to detect this rare event.
5. Leaving the study early
Leaving the study early may be the result of a multitude of reasons including lack of efficacy, adverse effects or an unacceptable study design. All in all, similar numbers of participants left early from each treatment group, neither drug was worse or better than the other. Nearly half of those entered into the studies left or were withdrawn early. On one hand, this could reflect a real‐world situation, attrition is often high, but there is the worry that these studies not convincingly reflecting care in routine practice, had any authority they had further eroded by loss to follow‐up.
Overall completeness and applicability of evidence
1. Completeness
These are old, small and limited studies. Much data were wasted because of poor reporting and more were never recorded. These are two important drugs and we do not have anywhere near a complete picture of their comparative effects.
2. Applicability
Studies in this review included people in both outpatient and inpatient settings. People in the trials were often chronically unwell. This is an important group of people, but not inclusive of everyone with schizophrenia. Trials are also three to four decades old. In many places services have changed considerably in that time, in others, less so. What evidence we have is thin, and its applicability problematic.
Quality of the evidence
The quality of the current evidence is low, based on ratings generated though GRADE (Schünemann 2011). None of the studies reported how randomisation was achieved and only one trial described the method of allocation concealment. Although studies were reported as double‐blinded, none clearly described whether assessors were blinded to the treatment groups. All scale data were reported as means without standard deviations for the main results. Most results were presented in the text with authors simply reporting that results were statistically significant or not, but they did not report statistical measures of probability (P values) or the confidence interval. Although P values are influenced by the strength of the association, they also depend on the sample size of the groups. It is sometimes possible to extract raw data from P values, but their exact values are needed. In the reviewed studies this was not possible, because they were reported as ’P < 0.05’ or ’P < 0.001’.
Potential biases in the review process
1. Adding the old to the new
We have found no time‐related differences in studies within this review and no indication of change of the effect size over time. Synthesis of the results of studies seems justified.
2. Failing to identify old trials
We identified trials by meticulous searching, including handsearching old files. Nevertheless, it may be difficult to avoid some bias from not identifying long‐lost studies.
3. Failing to identify other language trials
We identified trials in other languages by searching specialist databases. This should have identified, for example, Chinese studies. However, there is always a danger of failing to identify studies and especially if published in languages other than English. It seems unlikely, however, that we have failed to find large important studies.
Agreements and disagreements with other studies or reviews
To our knowledge, there is no previous review specifically comparing chlorpromazine with penfluridol (Table 1). In another Cochrane study of penfluridol in schizophrenia, penfluridol has been suggested to have no significant difference with any other typical antipsychotics in terms of global state, mental state, attrition, and requiring antiparkinsonian medication (Soares 2006). Compared with placebo, chlorpromazine has shown to improve global state and reduce relapse rate and attrition significantly (Adams 2005).

Chlorpromazine structure

Penfluridol structure

Study flow diagram.

'Risk of bias' graph: review authors' judgements about each risk of bias item presented as percentages across all included studies.

'Risk of bias' summary: review authors' judgements about each risk of bias item for each included study.

Comparison 1 CHLORPROMAZINE versus PENFLURIDOL, Outcome 1 Service utilisation: 1. Hospital readmission.

Comparison 1 CHLORPROMAZINE versus PENFLURIDOL, Outcome 2 Adverse effects: 1a. General ‐ needing antiparkinsonian medication.

Comparison 1 CHLORPROMAZINE versus PENFLURIDOL, Outcome 3 Adverse effects: 1b. General ‐ need to reduce antipsychotic dose due to side effects.

Comparison 1 CHLORPROMAZINE versus PENFLURIDOL, Outcome 4 Adverse effects: 2a. Specific ‐ extrapyramidal events (moderate or severe) ‐ short term.

Comparison 1 CHLORPROMAZINE versus PENFLURIDOL, Outcome 5 Adverse effects: 2b. Specific ‐ extrapyramidal events (moderate or severe) ‐ medium term.

Comparison 1 CHLORPROMAZINE versus PENFLURIDOL, Outcome 6 Adverse effects: 2c. Specific ‐ anticholinergic (moderate or severe) ‐ short term.
Comparison 1 CHLORPROMAZINE versus PENFLURIDOL, Outcome 7 Adverse effects: 2d. Specific ‐ anticholinergic (moderate or severe) ‐ medium term.

Comparison 1 CHLORPROMAZINE versus PENFLURIDOL, Outcome 8 Adverse effects: 2e. Specific ‐ central nervous system (moderate or severe) ‐ short term.

Comparison 1 CHLORPROMAZINE versus PENFLURIDOL, Outcome 9 Adverse effects: 2f. Specific ‐ central nervous system (moderate or severe) ‐ medium term.
Comparison 1 CHLORPROMAZINE versus PENFLURIDOL, Outcome 10 Adverse effects: 2g. Specific ‐ various other effects (moderate or severe) ‐ short term.

Comparison 1 CHLORPROMAZINE versus PENFLURIDOL, Outcome 11 Adverse effects: 2h. Specific ‐ various other effects (moderate or severe) ‐ medium term.

Comparison 1 CHLORPROMAZINE versus PENFLURIDOL, Outcome 12 Leaving the study early: 1a. Any reason.

Comparison 1 CHLORPROMAZINE versus PENFLURIDOL, Outcome 13 Leaving the study early: 1b. Due to adverse events.
| Methods | Allocation: randomised, fully explicit description of methods of randomisation and allocation concealment. |
| Participants | Diagnosis: schizophrenia. |
| Interventions | 1. Chlorpromazine: oral‐maximum around 400 mg/day. N = 150. 2. Penfluridol: oral‐maximum around 80 mg/week. N = 150. Both groups could receive antiparkinsonian medication as required. |
| Outcomes | Service utilisation: Hospital admission, time to admission. Global state: Clinically significant response in global state, relapse. Mental state: Clinically significant response in mental state. Adverse effects: Clinically significant extrapyramidal side effects, death. Leaving the study early. Functioning: Employed, days working, in supportive relationship, healthy days. Economic outcomes. |
| Notes | * Powered to be able to identify a difference of ˜ 20% between groups for primary outcome with adequate degree of certainty. |
| Chlorpromazine versus Penfluridol for schizophrenia | ||||||
| Patient or population: patients with schizophrenia | ||||||
| Outcomes | Illustrative comparative risks* (95% CI) | Relative effect | No of Participants | Quality of the evidence | Comments | |
| Assumed risk3 | Corresponding risk | |||||
| Penfluridol | Chlorpromazine | |||||
| Service utilisation: hospital admission (short term) | 150 per 1000 | 28 per 1000 | RR 0.19 (0.01 to 3.60) | 29 | ⊕⊕⊝⊝ low 1,2 | |
| Global state: clinically important change in global state | See comment | Not estimable | 0 | See comment | No studies reported 'clinically important change in global state'. Change in global state was measure using global state scales but all data were presented without SD. | |
| Global state: relapse | See comment | Not estimable | 0 | See comment | No studies reported this outcome. | |
| Mental state: clinically important change in mental state | See comment | Not estimable | 0 | See comment | No studies reported 'clinically important change in mental state'. Change in mental state was measure using mental state scales but all data were presented without SD. | |
| Adverse effect/event: clinically important extrapyramidal adverse events ‐ akathisia (medium term) | 200 per 1000 | 38 per 1000 | RR 0.19 (0.04 to 1.06) | 85 | ⊕⊕⊝⊝ low 1,2 | The same studies reported data for other extrapyramidal adverse events such as rigidity, tremor, dystonia and dyskinesia. There was no observable difference between chlorpromazine and penfluridol regarding any of these adverse effects. |
| Adverse effect/event: death | See comment | Not estimated | 2 RCTs (0) | See comment | No deaths reported. | |
| Leaving the study early: any reason (medium term) | 400 per 1000 | 484 per 1000 | RR 1.21 (0.83 to 1.77) | 130 | ⊕⊕⊝⊝ low 1,2 | |
| *The basis for the assumed risk (e.g. the median control group risk across studies) is provided in footnotes. The corresponding risk (and its 95% confidence interval) is based on the assumed risk in the comparison group and the relative effect of the intervention (and its 95% CI). | ||||||
| GRADE Working Group grades of evidence | ||||||
| 1 Serious risk of bias: downgraded by one level ‐ study had an unclear risk of bias for random sequence generation and blinding of assessors. | ||||||
| Review title | Reference |
| Acetophenazine versus chlorpromazine | |
| Chlorpromazine dose for people with schizophrenia | |
| Cessation of medication for people with schizophrenia already stable on chlorpromazine | |
| Chlorpromazine versus atypical antipsychotic drugs for schizophrenia | |
| Chlorpromazine versus clotiapine for schizophrenia | Developing protocol |
| Chlorpromazine versus haloperidol for schizophrenia | |
| Chlorpromazine versus metiapine | |
| Chlorpromazine versus penfluridol for schizophrenia | Current review |
| Chlorpromazine versus piperacetazine | |
| Chlorpromazine versus placebo for schizophrenia | |
| Chlorpromazine for psychosis induced aggression or agitation |
| Outcome or subgroup title | No. of studies | No. of participants | Statistical method | Effect size |
| 1 Service utilisation: 1. Hospital readmission Show forest plot | 1 | 29 | Risk Ratio (M‐H, Fixed, 95% CI) | 0.19 [0.01, 3.60] |
| 1.1 short term | 1 | 29 | Risk Ratio (M‐H, Fixed, 95% CI) | 0.19 [0.01, 3.60] |
| 2 Adverse effects: 1a. General ‐ needing antiparkinsonian medication Show forest plot | 2 | 74 | Risk Ratio (M‐H, Fixed, 95% CI) | 0.70 [0.51, 0.95] |
| 2.1 short term | 1 | 33 | Risk Ratio (M‐H, Fixed, 95% CI) | 0.82 [0.46, 1.46] |
| 2.2 medium term | 1 | 41 | Risk Ratio (M‐H, Fixed, 95% CI) | 0.63 [0.43, 0.91] |
| 3 Adverse effects: 1b. General ‐ need to reduce antipsychotic dose due to side effects Show forest plot | 1 | Risk Ratio (M‐H, Fixed, 95% CI) | Subtotals only | |
| 3.1 medium term | 1 | 33 | Risk Ratio (M‐H, Fixed, 95% CI) | 0.74 [0.26, 2.06] |
| 4 Adverse effects: 2a. Specific ‐ extrapyramidal events (moderate or severe) ‐ short term Show forest plot | 1 | Risk Ratio (M‐H, Fixed, 95% CI) | Subtotals only | |
| 4.1 akatisia | 1 | 33 | Risk Ratio (M‐H, Fixed, 95% CI) | 0.0 [0.0, 0.0] |
| 4.2 dyskinesia | 1 | 33 | Risk Ratio (M‐H, Fixed, 95% CI) | 0.0 [0.0, 0.0] |
| 4.3 dystonia | 1 | 33 | Risk Ratio (M‐H, Fixed, 95% CI) | 0.0 [0.0, 0.0] |
| 4.4 rigidity | 1 | 33 | Risk Ratio (M‐H, Fixed, 95% CI) | 0.15 [0.01, 2.90] |
| 4.5 tremor | 1 | 33 | Risk Ratio (M‐H, Fixed, 95% CI) | 0.0 [0.0, 0.0] |
| 5 Adverse effects: 2b. Specific ‐ extrapyramidal events (moderate or severe) ‐ medium term Show forest plot | 3 | Risk Ratio (M‐H, Fixed, 95% CI) | Subtotals only | |
| 5.1 akathisia | 2 | 85 | Risk Ratio (M‐H, Fixed, 95% CI) | 0.19 [0.04, 1.06] |
| 5.2 dyskinesia | 2 | 85 | Risk Ratio (M‐H, Fixed, 95% CI) | 0.97 [0.14, 6.52] |
| 5.3 dystonia | 1 | 29 | Risk Ratio (M‐H, Fixed, 95% CI) | 0.93 [0.06, 13.54] |
| 5.4 muscle spasm | 1 | 56 | Risk Ratio (M‐H, Fixed, 95% CI) | 3.0 [0.13, 70.64] |
| 5.5 rigidity | 2 | 70 | Risk Ratio (M‐H, Fixed, 95% CI) | 0.22 [0.04, 1.20] |
| 5.6 tremor | 2 | 85 | Risk Ratio (M‐H, Fixed, 95% CI) | 0.70 [0.14, 3.43] |
| 6 Adverse effects: 2c. Specific ‐ anticholinergic (moderate or severe) ‐ short term Show forest plot | 1 | Risk Ratio (M‐H, Fixed, 95% CI) | Subtotals only | |
| 6.1 constipation | 1 | 33 | Risk Ratio (M‐H, Fixed, 95% CI) | 4.42 [0.60, 32.71] |
| 6.2 dry mouth | 1 | 33 | Risk Ratio (M‐H, Fixed, 95% CI) | 2.25 [0.10, 51.46] |
| 6.3 increased salivation | 1 | 33 | Risk Ratio (M‐H, Fixed, 95% CI) | 0.25 [0.01, 5.72] |
| 7 Adverse effects: 2d. Specific ‐ anticholinergic (moderate or severe) ‐ medium term Show forest plot | 1 | Risk Ratio (M‐H, Fixed, 95% CI) | Subtotals only | |
| 7.1 blurred vision | 1 | 29 | Risk Ratio (M‐H, Fixed, 95% CI) | 0.31 [0.01, 7.09] |
| 7.2 constipation | 1 | 29 | Risk Ratio (M‐H, Fixed, 95% CI) | 3.73 [0.47, 29.49] |
| 7.3 dry mouth | 1 | 29 | Risk Ratio (M‐H, Fixed, 95% CI) | 2.81 [0.12, 63.83] |
| 8 Adverse effects: 2e. Specific ‐ central nervous system (moderate or severe) ‐ short term Show forest plot | 1 | Risk Ratio (M‐H, Fixed, 95% CI) | Subtotals only | |
| 8.1 agitation | 1 | 33 | Risk Ratio (M‐H, Fixed, 95% CI) | 2.25 [0.10, 51.46] |
| 8.2 drowsiness | 1 | 33 | Risk Ratio (M‐H, Fixed, 95% CI) | 8.25 [0.49, 137.94] |
| 8.3 dizziness | 1 | 33 | Risk Ratio (M‐H, Fixed, 95% CI) | 0.25 [0.03, 2.12] |
| 8.4 insomnia | 1 | 33 | Risk Ratio (M‐H, Fixed, 95% CI) | 2.25 [0.10, 51.46] |
| 9 Adverse effects: 2f. Specific ‐ central nervous system (moderate or severe) ‐ medium term Show forest plot | 2 | Risk Ratio (M‐H, Fixed, 95% CI) | Subtotals only | |
| 9.1 drowsiness | 2 | 85 | Risk Ratio (M‐H, Fixed, 95% CI) | 1.05 [0.54, 2.05] |
| 9.2 dizziness | 1 | 29 | Risk Ratio (M‐H, Fixed, 95% CI) | 0.47 [0.05, 4.60] |
| 9.3 excitement | 1 | 29 | Risk Ratio (M‐H, Fixed, 95% CI) | 2.81 [0.12, 63.83] |
| 9.4 faintness | 1 | 29 | Risk Ratio (M‐H, Fixed, 95% CI) | 0.93 [0.15, 5.76] |
| 9.5 insomnia | 2 | 85 | Risk Ratio (M‐H, Fixed, 95% CI) | 0.17 [0.03, 0.93] |
| 10 Adverse effects: 2g. Specific ‐ various other effects (moderate or severe) ‐ short term Show forest plot | 2 | Risk Ratio (M‐H, Fixed, 95% CI) | Subtotals only | |
| 10.1 heartburn | 1 | 33 | Risk Ratio (M‐H, Fixed, 95% CI) | 0.0 [0.0, 0.0] |
| 10.2 increased alkaline phosphatase, bilirubin, SGOT | 1 | 56 | Risk Ratio (M‐H, Fixed, 95% CI) | 0.33 [0.01, 7.85] |
| 10.3 systemic allergic reaction | 1 | 33 | Risk Ratio (M‐H, Fixed, 95% CI) | 5.25 [0.29, 94.14] |
| 11 Adverse effects: 2h. Specific ‐ various other effects (moderate or severe) ‐ medium term Show forest plot | 1 | Risk Ratio (M‐H, Fixed, 95% CI) | Subtotals only | |
| 11.1 depression | 1 | 29 | Risk Ratio (M‐H, Fixed, 95% CI) | 0.19 [0.01, 3.60] |
| 11.2 decreased sexual drive | 1 | 29 | Risk Ratio (M‐H, Fixed, 95% CI) | 0.47 [0.05, 4.60] |
| 11.3 impotence | 1 | 29 | Risk Ratio (M‐H, Fixed, 95% CI) | 2.81 [0.12, 63.83] |
| 11.4 photosensitivity | 1 | 29 | Risk Ratio (M‐H, Fixed, 95% CI) | 2.81 [0.12, 63.83] |
| 11.5 poor appetite | 1 | 29 | Risk Ratio (M‐H, Fixed, 95% CI) | 0.93 [0.06, 13.54] |
| 12 Leaving the study early: 1a. Any reason Show forest plot | 3 | Risk Ratio (M‐H, Fixed, 95% CI) | Subtotals only | |
| 12.1 medium term | 3 | 130 | Risk Ratio (M‐H, Fixed, 95% CI) | 1.21 [0.83, 1.77] |
| 13 Leaving the study early: 1b. Due to adverse events Show forest plot | 2 | Risk Ratio (M‐H, Fixed, 95% CI) | Subtotals only | |
| 13.1 short term | 1 | 33 | Risk Ratio (M‐H, Fixed, 95% CI) | 6.75 [0.39, 116.00] |
| 13.2 medium term | 2 | 74 | Risk Ratio (M‐H, Fixed, 95% CI) | 1.53 [0.72, 3.28] |