Farmacoterapia para el abandono del hábito de fumar: efectos por subgrupos definidos por marcadores biológicos informados genéticamente
Referencias
References to studies included in this review
References to studies excluded from this review
Additional references
References to other published versions of this review
Characteristics of studies
Characteristics of included studies [ordered by study ID]
Ir a:
| Methods | 2 × 2 factorial randomised clinical trial conducted to evaluate the efficacy of nicotine gum and counseling for African American light smokers (the “Kick It at Swope II Trial” (KIS‐II)) Study period: March 2003 to June 2004 | |
| Participants | N = 755 Participants were recruited using clinic, media, and community outreach efforts, including radio, television, gas pump, billboard advertising, community health fairs, signs posted in minority‐owned businesses, and referral letters mailed from physicians in the Kansas City, KS, USA, area Inclusion criteria: (a) self‐identified as ‘African American or black’, (b) ≥ 18 years, (c) smoked ≤ 10 cigarettes/d for ≥ 6 months, (d) before enrolment, smoked on ≥ 25 of the last 30 days, (e) was interested in quitting in the next 2 weeks, (f) spoke English, and (g) had a permanent home address and working telephone. Only 1 smoker per household was allowed to enrol Exclusion criteria: (a) contraindication for nicotine gum (jaw problems, irregular heartbeat, recent myocardial infarction, or stroke), (b) used other pharmacotherapy for smoking cessation in the last 30 days, (c) used other forms of tobacco within the last 30 days, (d) was pregnant or planning to become pregnant within the next 6 months, (e) was breastfeeding, or (f) was planning to move out of the local area within the next 6 months. Individuals demonstrating marked inappropriate affect or behavior were excluded from the study. | |
| Interventions | Health education plus NRT gum (N = 189) Motivational interviewing plus NRT gum (N = 189) Health education plus placebo gum (N = 189) Motivational interviewing plus placebo gum (N = 188) Participants were assigned randomly to 1 of 4 study arms: 2 mg nicotine gum plus health education (HE); 2 mg nicotine gum plus motivational interviewing (MI); placebo gum plus HE; and placebo gum plus MI | |
| Outcomes | Primary outcomes: cotinine‐verified 7‐day abstinence at week 26, defined as having smoked no cigarettes ‐ not even a puff ‐ on the previous 7 days A salivary cotinine cutoff of ≤ 20 ng/mL was used to verify abstinence at 26 weeks; a cutoff of ≤ 10 ppm was used for CO. Secondary outcomes: Secondary outcome was 7‐day abstinence at week 8. Process measures included counseling attendance at randomisation and at weeks 1, 3, 6, and 8; and 16 counseling visits and self‐reported gum usage in the past 7 days at weeks 1, 3, and 8 (end of gum treatment). | |
| Funding source | This project was supported by the National Cancer Institute at the National Institutes of Health (R01 CA091912). GlaxoSmithKline provided study medication but played no role in design or conduct of the study nor in interpretation and analysis of data. | |
| Declaration of interest | “NLB serves as a consultant to several pharmaceutical companies that market smoking cessation medications and has been a paid expert witness in litigation against tobacco companies. SPD is a scientific adviser to Genophen. RFT has participated in one‐day advisory meetings for Novartis and McNeil. RFT is an Associate Editor for Clinical Pharmacology & Therapeutics but was not involved in the review or decision process for this article. The other authors declared no conflict of interest.” | |
| Notes | The present study did not report analyses of pharmacogenetics. However, 608/755 (80%) were successfully genotyped. These results were published in subsequent papers (Ho 2009; Zhu 2014). | |
| Risk of bias | ||
| Bias | Authors' judgement | Support for judgement |
| Random sequence generation (selection bias) | Low risk | Randomisation codes were generated in blocks and were linked to medication distribution and counseling assignment. |
| Allocation concealment (selection bias) | Low risk | “The Investigative Pharmacy at the University of Kansas Medical Center packaged the study medication using codes to maintain blinding. At the randomization visit, a sealed envelope with pre‐assigned randomization numbers was drawn to determine which form of counseling the participant would receive. The envelope and box of gum with matching randomization numbers were given to participants in the order in which they were randomized.” |
| Blinding of participants and personnel (performance bias) | Low risk | “Study staff and participants were blinded to whether participants received active gum or placebo. However, assignment to MI counseling versus HE was not blinded.” |
| Blinding of outcome assessment (detection bias) | Low risk | Researchers and participants were blinded to active or placebo medication. |
| Incomplete outcome data (attrition bias) | Low risk | All randomised participants were accounted for in the analyses. |
| Selective reporting (reporting bias) | Low risk | Primary endpoints were reported. |
| Other bias | Low risk | 80% of participants were genotyped, which was balanced across drug treatment groups. See ‘Notes’ above. |
| Methods | Randomised controlled clinical trial of behavioural support for smoking cessation (the “Patch in Practice Study”) Study period: July 2002 to March 2005 | |
| Participants | N = 925 Recruited from 26 general practice clinics in Buckinghamshire and Oxfordshire, UK Inclusion criteria: current smokers, age ≥ 18, smoked ≥ 10 cigarettes/d Exclusion criteria: contraindications to nicotine replacement therapy (NRT) | |
| Interventions | Basic support (N = 469) Weekly support (N = 456) Participants were randomised to behavioural support provided by practice nurse before quitting, telephoned around quit day, and seen 1 and 4 weeks after the initial appointment (basic support) vs basic support plus weekly support ‐ additional telephone call at 10 days and 3 weeks after the initial appointment, and an additional visit at 2 weeks to motivate adherence to nicotine replacement and to renew quit attempts. 15 mg/16 h nicotine patches were given to all participants. | |
| Outcomes | Primary outcomes: confirmed sustained abstinence at 1, 4, 12, and 26 weeks from quit day. Sustained abstinence was defined as self‐reported total abstinence after a 14‐day grace period from quit date confirmed by expired air carbon monoxide (CO) < 10 ppm. Secondary outcomes: not indicated | |
| Funding source | “This study was funded by a programme grant from Cancer Research UK (trial registration ISRCTN 05689186). United Pharmaceuticals supplied the nicotine patches for the study free to be given without charge to the participants.” | |
| Declaration of interest | “PA has received free nicotine replacement products from Novartis and nortriptyline from King Pharmaceuticals for distribution to trial participants; personal income for advice to Xenova, a biotechnology company investigating a nicotine vaccine; small gifts and had numerous meals paid for by drug companies, including those producing medications for smoking cessation; and travel grants to attend conferences from the Society for Research in Nicotine and Tobacco. KB, CS, and AA have received small gifts and had meals paid for by drug companies, including those manufacturing medications for smoking cessation. M Munafó has received fees for invited lectures from the National Health Service, GlaxoSmithKline, Novartis, the Moffitt Cancer Research Center, and the Karolinska Institutet; benefits in kind (hospitality, etc.) from various pharmaceutical companies; research and travel support from the European Research Advisory Board, GlaxoSmithKline, Pfizer Consumer Healthcare and Novartis; and he has acted as a consultant to the European Commission, The American Institutes for Research, the National Audit Office, and G‐Nostics Ltd. EJ has received consultancy income from the European Network for Smoking Prevention. M Murphy has received consultancy income from the European Network for Smoking Prevention and has provided scientific consultancy services through the University of Oxford ISIS Innovation to the National Audit Office and G‐Nostics Ltd. The Childhood Cancer Research Group and the Cancer Research UK General Practice Research Group have received unrestricted educational grants, research project grants, and consultancy fees from Ciba Geigy/Novartis, GlaxoSmithKline, Pharmacia/Pfizer, Ares‐Serono, Sanofi‐Synthelabo, Third Wave Technologies, Astra Zeneca, and G‐Nostics.” | |
| Notes | This paper did not report analyses of pharmacogenetics. However, DNA was collected from all trial participants and analyses of pharmacogenetics were reported in subsequent papers (David 2008; David 2011; Munafò 2008;Munafò 2009; Munafò 2011; Munafò 2012;Spruell 2012; Uhl 2010). | |
| Risk of bias | ||
| Bias | Authors' judgement | Support for judgement |
| Random sequence generation (selection bias) | Low risk | Random number sequence generation specified |
| Allocation concealment (selection bias) | Low risk | Random number sequence sealed in numbered envelopes. Nurses opened sealed envelopes in sequence following eligibility and consent determination. |
| Blinding of participants and personnel (performance bias) | High risk | Participants and nurses were necessarily not blinded to allocation. |
| Blinding of outcome assessment (detection bias) | Low risk | Research staff was blinded to allocation. |
| Incomplete outcome data (attrition bias) | Low risk | Loss to follow‐up was balanced and transparently reported. |
| Selective reporting (reporting bias) | Low risk | Primary outcomes were reported. |
| Other bias | Low risk | DNA samples were collected on all participants at the time of study entry. |
| Methods | Double‐blind parallel‐group placebo‐controlled randomised clinical trial Study period: dates not reported | |
| Participants | N = 61 Participants were schizophrenic patients on stable neuroleptic medication who were recruited by hospital doctors and clinicians from community mental health centres and ambulatory clinics. Inclusion criteria: age between 18 and 70 years, met DSM‐IV‐TR criteria for schizophrenia or schizoaffective disorder, clinically stable (based on psychotic and affective symptoms) as judged by treatment team and psychiatrists, had a stable dose of antipsychotic drugs for ≥ 1 month before the start date, in stable physical health, stable cigarette smoking habits (not defined), strong desire to quit smoking or at least to reduce significantly the number of cigarettes per day (score > 5 on motivational questionnaire) Exclusion criteria: not reported | |
| Interventions | Sustained‐release bupropion + cognitive‐behavioural group therapy (n = 45) Placebo + cognitive‐behavioural group therapy (n = 16) All participants had 2‐week stabilisation period followed by 14 weeks of study medication. Initial dose was 150 mg/d for 3 days, then 300 mg/d. All participants participated in a 14‐week, 15‐session group cognitive‐behavioural therapy. Participants received no additional treatment. | |
| Outcomes | Outcomes: self‐reports of daily cigarette consumption and the Fagerstrom Test of Nicotine Dependence (FTND), both measured at baseline, week 7, and week 14 | |
| Funding source | This research was supported by a Junior Investigator Award from the National Alliance for Research on Schizophrenia and Depression (NARSAD) (AR) and was partially supported by Phillip Morris USA and Phillip Morris International. | |
| Declaration of interest | Declaration of interest was not reported. | |
| Notes | This paper provided analysis of pharmacogenetics. | |
| Risk of bias | ||
| Bias | Authors' judgement | Support for judgement |
| Random sequence generation (selection bias) | High risk | Participants were randomly allocated according to order of arrival. |
| Allocation concealment (selection bias) | High risk | Allocation was based on order of arrival. |
| Blinding of participants and personnel (performance bias) | Unclear risk | The study was double‐blind; however it is unclear who exactly was blinded. |
| Blinding of outcome assessment (detection bias) | Unclear risk | Blinding of participants and personnel was unclear; study outcome is objective and can be influenced by participants. |
| Incomplete outcome data (attrition bias) | High risk | Incomplete outcome data were greater in the bupropion group, potentially influencing the overall treatment effect. |
| Selective reporting (reporting bias) | Unclear risk | No protocol was found. |
| Other bias | Low risk | Analysis of pharmacogenetics was performed on the total study population. |
| Methods | Randomised double‐blind placebo‐controlled trial of sustained‐release bupropion and behavioural support for smoking cessation (the “Zyban Collaborative Trial”) Study period: November 1997 to January 2001 | |
| Participants | N = 524 Recruited from the general population and treated at 1 of 3 community‐based academic teaching hospitals in Pawtucket and Providence, RI, USA Inclusion criteria: current smokers, age ≥ 18, smoked ≥ 10 cigarettes/d Exclusion criteria: (a) current Axis I disorder according to the Diagnostic and Statistical Manual of Mental Disorders (4th edition; DSM‐IV; American Psychiatric Association, 1994), (b) DSM‐IV diagnosis of past‐year psychoactive substance abuse or dependence (other than nicotine), (c) current use of psychotropic medication or medication that may interact adversely with bupropion, (d) current weekly (or more frequent) psychotherapy, or (e) use of other tobacco products. Participants also were screened by a study physician to rule out the following: any unstable medical condition; hypertension; pregnancy, lactation, or refusal to use contraception while on study medication; history of seizure disorder or head injury with loss of consciousness; eating disorder; or panic disorder. Participants agreed to use only study‐supplied medication for smoking cessation for the duration of their study participation. | |
| Interventions | Standard treatment + placebo (N = 157) Standard plus depression treatment + placebo (N = 112) Standard treatment + bupropion sustained‐release (SR) (N = 147) Standard plus depression treatment + bupropion SR (N = 108) Participants were randomised to 1 of 4 twelve‐week treatments: (a) standard, cognitive–behavioural smoking cessation treatment (ST) plus bupropion (BUP), (b) ST plus placebo (PLAC), (c) standard cessation treatment combined with cognitive–behavioural treatment for depression (CBTD) plus BUP, and (d) CBTD plus PLAC. Follow‐up assessments were conducted 2, 6, and 12 months after treatment, and self‐reported abstinence was verified biochemically. Bupropion was delivered according to the standard therapeutic dose (150 mg/d for the first 3 days, followed by 300 mg/d) for a total of 12 weeks. All participants and study staff were blind to medication condition. | |
| Outcomes | Primary outcomes: biochemically verified point prevalence abstinence at end of treatment and at 2‐, 6‐ and 12‐month follow‐up. Abstinence was confirmed by a combination of CO ≤ 10 ppm and cotinine ≤ 15 ng/mL. | |
| Funding source | This study was funded in part by US Public Health Service grants HL32318, DA08511, CA84719, and DA14276, and by GlaxoSmithKline, Inc., which provided study medication. | |
| Declaration of interest | SPD is a scientific advisor with BaseHealth and participated in a 1‐day workshop with Pfizer. MRM has received research support from Pfizer and GlaxoSmithKline. CL has served as a consultant and has received research funding from Astra Zeneca, GlaxoSmithKline, and Pfizer. | |
| Notes | DNA was collected after start of trial, resulting in genotyping for 59% of trial participants. Participants contributing DNA were significantly more likely to be female (51% vs 40%) and older (45.4 vs 43.2 years), and had been smoking longer (27.1 vs 24.8 years). Analyses of pharmacogenetics were reported in subsequent papers from the original study sample (PMID: 17654295, PMID: 18058343). An additional 60 participants were recruited, randomised to bupropion vs placebo, and administered the same ST behavioural treatment following completion of the original trial. Analyses of the larger sample were reported in additional publications (David 2013a; Leventhal 2012; Uhl 2008). | |
| Risk of bias | ||
| Bias | Authors' judgement | Support for judgement |
| Random sequence generation (selection bias) | Low risk | Participants were randomly assigned to 1 of 2 treatment sites, where they were to receive 1 of 2 manualised group treatments, ST, or CBTD, and were randomly assigned to receive 1 of 2 medication conditions or 1 of 2 behavioural interventions, using the urn randomisation technique. |
| Allocation concealment (selection bias) | Unclear risk | Behavioural treatment allocation may not have been blinded but did appear to result in balanced pharmacological treatment arms. |
| Blinding of participants and personnel (performance bias) | Low risk | All participants and study staff were blind to medication condition. |
| Blinding of outcome assessment (detection bias) | Unclear risk | Blinding of outcome assessment was not described. |
| Incomplete outcome data (attrition bias) | Low risk | Handling of missing data was described. Analyses using intention‐to‐treat vs only complete data were conducted and demonstrated concordance. |
| Selective reporting (reporting bias) | Low risk | Primary endpoints were reported. |
| Other bias | High risk | 59% of original trial participants were genotyped, which may not be representative of the original study population. Analyses of pharmacogenetics were reported in multiple subsequent papers. See ‘Notes’ above. |
| Methods | Double‐blind parallel‐group placebo‐controlled randomised clinical trial Study period: February 1996 to April 1997 | |
| Participants | N = 147 Participants were smokers recruited from the Houston, Texas, metropolitan area via newspaper, radio, and TV advertisements and public service announcements. Inclusion criteria: smoking ≥ 10 cigarettes/d at baseline, between 18 and 75 years old Exclusion criteria: taking smoking cessation treatment; taking psychoactive medication; or having any uncontrolled systemic illness, contraindications for taking venlafaxine or the nicotine patch, current substance abuse, or other psychiatric disorders | |
| Interventions | Venlafaxine (n = 71) Placebo (n = 76) 21 weeks of active venlafaxine or placebo. After a 1‐week no‐medication baseline (3 weeks before the quit date), participants began antidepressant therapy 2 weeks before quitting at an initial dose of 75 mg/d (37.5 mg/d twice daily). The dose was increased up to 150 mg/d during the week just before participants were to quit. During each subsequent week, the dose was raised in 37.5‐mg increments up to a maximum 225 mg/d. Two weeks before the end of treatment, the dose was decreased by 37.5 mg every 2 to 3 days. The medication cycle was completed 18 weeks after quitting. | |
| Outcomes | Outcomes: Abstinence was assessed on the quit date and at post quit weeks 1, 3, 6, 18 (end of treatment), 26, and 52. Abstinence was verified in person by expired air carbon monoxide ≤ 10 ppm or by a saliva cotinine sample of < 15 ng/µL at 26 or 52 weeks. | |
| Funding source | Support for this research was provided by grants from the MD Anderson Cancer Center (PRS), the National Cancer Institute (P50CA70907), and the National Institute on Drug Abuse (R01DA1182‐01) to Paul M. Cinciripini. Study medication was provided by Wyeth‐Ayerst Laboratories. | |
| Declaration of interest | Declaration of interest was not reported. | |
| Notes | Analysis of pharmacogenetics was reported in Cinciripini 2005. | |
| Risk of bias | ||
| Bias | Authors' judgement | Support for judgement |
| Random sequence generation (selection bias) | Unclear risk | Randomisation was performed by the pharmacy, but details are absent. |
| Allocation concealment (selection bias) | Low risk | Randomisation was centralised and was performed by a third party (pharmacy). |
| Blinding of participants and personnel (performance bias) | Low risk | Participants, study staff, and study personnel with direct patient contact were blinded to group assignment. |
| Blinding of outcome assessment (detection bias) | Low risk | Blinding was appropriate and the outcome of the study was objective. |
| Incomplete outcome data (attrition bias) | Low risk | Incomplete outcome data were similar between groups. |
| Selective reporting (reporting bias) | Unclear risk | No protocol was found. |
| Other bias | Low risk | Additional analyses of pharmacogenetics in Cinciripini 2004 were conducted in the large majority of the original randomised trial population, so selection bias seems unlikely. |
| Methods | Randomised double‐blind placebo‐controlled trial of sustained‐release bupropion for smoking cessation in African Americans (the “Kick It at Swope III Trial” (KIS‐III)) (ClinicalTrials.gov Identifier: NCT00666978) Study period: December 2007 to May 2010 | |
| Participants | N = 540 Participants were recruited through clinic‐ and community‐based efforts. Clinic‐based efforts included use of fliers, posters, physician letters, pharmacy inserts, and lobby recruitment at the primary study site, Swope Health Services in Kansas City, 2 Swope affiliate clinics, and 2 regional hospitals (University of Kansas Medical Center and Truman Medical Center) in Kansas City, Kansas, USA. Inclusion criteria: (a) African American, (b) ≥ 18 years, (c) interested in stopping smoking, (d) smoked ≤ 10 cigarettes/d for ≥ 2 years, (e) smoked on ≥ 25 days in the past month, and (f) were willing to attend 4 clinic visits over the course of 6 months; (g) must have smoked ≥ 3 years, and (h) had a home address and (i) a functioning telephone number Exclusion criteria: (a) current use of bupropion; (b) use of psychoactive medications; (c) use of NRT, (d) fluoxetine, (e) clonidine, (f) buspirone, or (g) doxepin in the past 30 days; (h) history of alcohol or (i) substance abuse within the past year; (j) current drinking of 14 or more alcoholic drinks per week and/or binge drinking (≥ 5 drinks on 1 occasion) 2 or more times in the past month; (k) history of seizures or head trauma; (l) history of bulimia or anorexia nervosa; (m) pregnant (verified by over‐the‐counter pregnancy test kit for women of childbearing age only) or (n) contemplating pregnancy; (o) breastfeeding; (p) myocardial infarction in the past 30 days; (q) use of other forms of tobacco in the past 30 days; (r) reported use of opiates, (s) cocaine, (t) or stimulants; (u) diabetes treated with oral hypoglycaemics or insulin; (v) planning to move from the Kansas City metro area in the next 12 months; and (w) having another smoker in the household enrolled in the study | |
| Interventions | Bupropion SR (N = 270) Placebo (N = 270) Participants were randomly assigned to receive 300 mg bupropion SR (150 mg once daily for 3 days, then 150 mg twice daily) (n = 270 participants) or placebo (n = 270 participants) for 7 weeks, and up to 6 sessions of health education counseling. | |
| Outcomes | Primary outcomes: salivary cotinine–verified 7‐day point prevalence smoking abstinence at week 26 (a cut point of 15 ng/mL differentiated smokers from non‐smokers) Secondary outcomes: Salivary cotinine–verified smoking abstinence at end of medication treatment at week 7 was also examined. | |
| Funding source | “The Kick It at Swope III (KIS‐III) study is a federally funded registered clinical trial (ClinicalTrials.gov identifier: NCT00666978) from the grant “Enhancing Tobacco Use Treatment for African American Light Smokers”.” | |
| Declaration of interest | “JSA serves as a consultant to Pfizer Pharmaceuticals, Inc.; NLB serves as a consultant to Pfizer Pharmaceuticals, Inc., and has been a paid expert witness in litigation against tobacco companies; RFT holds shares in Nicogen Research, Inc., a company that is focused on novel smoking cessation treatment approaches; no Pfizer or Nicogen funds were used in this work.” “NLB serves as a consultant to several pharmaceutical companies that market smoking cessation medications and has been a paid expert witness in litigation against tobacco companies. SPD is a scientific adviser to Genophen. RFT has participated in one‐day advisory meetings for Novartis and McNeil. RFT is an Associate Editor for Clinical Pharmacology & Therapeutics but was not involved in the review or decision process for this article. The other authors declared no conflict of interest.” | |
| Notes | The present study did not report analyses of pharmacogenetics. However, 534/540 (˜ 90%) were successfully genotyped. These results were published in subsequent papers (Zhu 2013; Zhu 2014). | |
| Risk of bias | ||
| Bias | Authors' judgement | Support for judgement |
| Random sequence generation (selection bias) | Low risk | A computer‐generated table of random numbers was used to randomise. |
| Allocation concealment (selection bias) | Low risk | Allocation was concealed before group assignment. |
| Blinding of participants and personnel (performance bias) | Low risk | Study staff and participants were blinded to treatment conditions. |
| Blinding of outcome assessment (detection bias) | Low risk | Blinding was appropriate, and the outcome of the study was objective. |
| Incomplete outcome data (attrition bias) | Low risk | Loss to follow‐up was ˜ 30% in both groups, but all participants were accounted for in intention‐to‐treat follow‐up. |
| Selective reporting (reporting bias) | Low risk | Primary outcomes were reported. |
| Other bias | Low risk | 534/540 (˜ 90%) from the original trial were successfully genotyped, and distribution of participants across treatment groups was balanced. See ‘Notes’ above. |
| Methods | Randomised parallel‐group double‐blind placebo‐controlled trial of NRT vs placebo patch with non‐randomised continuing smoking control arm Study period: 1998 to 2004 (specific months not reported) | |
| Participants | N = 171 Inclusion criteria: “Smokers wanting to quit” Exclusion criteria: (a) smoking < 7 cigarettes/d for the past 2 years, (b) habitual cigarette nicotine deliveries < 0.6 mg, (c) use of psychoactive drugs or medications other than alcohol and caffeine, (d) alcohol use in excess of 28 alcoholic drinks/week, (e) age < 18 or > 50 years, (f) non‐English speaking, (g) atypical sleep cycles, (h) pregnancy, and (i) serious medical or visual problems | |
| Interventions | Smoke control (N = 38) Nicotine patch (N = 90) Placebo patch (N = 81) Participants were randomly assigned in an 80:20 ratio to a quit group or a group that continued to smoke; those in the quit group were randomised (50:50) to nicotine patch or placebo patch. Participants received an abbreviated form of the American Lung Association smoking cessation programme. Nicotine patches and placebo patches of corresponding size were 21 mg for the first 17 days of abstinence, 14 mg for days 18 to 26, and 7 mg for days 27 to 38. | |
| Outcomes | Primary outcomes: Implied primary outcomes are symptom trajectories of affect (anger, anxiety, depression). Secondary outcomes: Abstinence was biochemically verified but was not reported as an outcome. Abstinence failure was defined as smoking a total of more than 4 cigarettes after quitting. | |
| Funding source | Research was supported by National Institute on Drug Abuse Grant R01 DA12289 awarded to David G. Gilbert and by nicotine and placebo patches from GlaxoSmithKline. | |
| Declaration of interest | None | |
| Notes | Participants were excluded for abstinence failure. DNA appears to have been collected for all participants. | |
| Risk of bias | ||
| Bias | Authors' judgement | Support for judgement |
| Random sequence generation (selection bias) | Low risk | Randomisation sequence described using an urn technique |
| Allocation concealment (selection bias) | Unclear risk | Quit group allocation and pharmacological treatment allocation were randomised, but quit group allocation was not blinded. |
| Blinding of participants and personnel (performance bias) | Low risk | Double‐blind design |
| Blinding of outcome assessment (detection bias) | Unclear risk | 77% in the nicotine patch group correctly guessed treatment assignment, which may have been shared with data collectors. |
| Incomplete outcome data (attrition bias) | Unclear risk | Treatment dropout high in both groups were reported as “all relapsed to smoking”. |
| Selective reporting (reporting bias) | High risk | Multiple gene x treatment interactions were reported for multiple behavioural phenotypes. |
| Other bias | High risk | Exclusion of relapsers from analyses may create study population imbalance for genetic predisposition to successfully quit smoking. |
| Methods | Double‐blind parallel‐group placebo and active treatment–controlled randomised clinical trial Study period: June 2003 to April 2005 | |
| Participants | N = 1025 Participants generally were healthy smokers (≥ 10 cigarettes/d) with < 3 months of smoking abstinence in the past year, 18 to 75 years old, recruited via media advertising. Inclusion criteria: generally healthy, smoking ≥ 10 cigarettes/d, < 3 months of smoking abstinence in the past year, 18 to 75 years old, motivated to stop smoking Exclusion criteria: any serious or unstable disease within past 6 months; seizure risk; diabetes mellitus requiring insulin or oral hypoglycaemic medications; hepatic or renal impairment; clinically significant cardiovascular disease within past 6 months; uncontrolled hypertension; severe chronic obstructive pulmonary disease; history of cancer (except treated basal cell or squamous cell carcinoma of the skin); history of clinically significant allergic reactions; major depressive disorder within past year requiring treatment; history of panic disorder, psychosis, bipolar disorder, or eating disorders; alcohol or drug abuse/dependency within the past year; use of tobacco products other than cigarettes; use of nicotine replacement therapy, clonidine, or nortriptyline within the month before enrolment; body mass index < 15 or > 38 or weight < 45.5 kg; prior exposure to bupropion; and prior varenicline exposure | |
| Interventions | Varenicline (n = 352) Bupropion SR (n = 329) Placebo (n = 344) Study medication was taken orally for 12 weeks. Active drugs were titrated as follows: varenicline 0.5 mg/d for days 1 to 3, 0.5 mg twice per day for days 4 to 7, then 1 mg twice per day through week 12; bupropion SR 150 mg/d for days 1 to 3, then 150 mg twice per day through week 12. All participants received brief (≤ 10‐minute), standardised, individual counseling to assist in problem solving and skills training for relapse prevention. | |
| Outcomes | Primary outcome: exhaled carbon monoxide–confirmed 4‐week continuous abstinence rate for weeks 9 through 12, defined as the proportion of participants who reported no smoking (not even a puff) or use of any nicotine‐containing products confirmed by an exhaled carbon monoxide measurement ≤ 10 ppm Other outcomes: continuous abstinence rates from week 9 through week 24, and from week 9 through week 52; 7‐day point prevalence abstinence rates at weeks 12, 24, and 52 | |
| Funding source | This study was supported by Pfizer Inc., which provided funding, study drug and placebo, and monitoring. The database containing findings of the 19 individual investigator sites was maintained by Pfizer Inc., and statistical analyses were performed at Pfizer Inc. by Mr Billing and by Ann Pennington, MS. Independent analysis was performed to verify the findings of Pfizer Inc. | |
| Declaration of interest | Dr Gonzales reports having received research contracts from Pfizer, Sanofi‐Aventis, GlaxoSmithKline, and Nabi Biopharmaceuticals; and consulting fees and honoraria from Pfizer, Sanofi‐Aventis, and GlaxoSmithKline; and owning 5 shares of Pfizer stock. Dr Rennard reports having had or currently having a number of relationships with companies who provide products and/or services relevant to outpatient management of chronic obstructive pulmonary disease. These relationships include serving as a consultant for Adams, Almirall, Altana, Array Biopharma, AstraZeneca, Aventis, Biolipox, Centocor, Dey, Critical Therapeutics, GlaxoSmithKline, Johnson & Johnson, Merck, Novartis,OnoPharma, Otsuka, RJ Reynolds, Roche, Sankyo, Schering‐Plough, Scios, and Wyeth; advising regarding clinical trials for Altana, AstraZeneca, Aventis, Centocor, GlaxoSmithKline, Novartis, Pfizer, and Philip Morris; and speaking at continuing medical education programs and performing funded research at both basic and clinical levels for Altana, AstraZeneca, Boehringer Ingelheim, GlaxoSmithKline, and Novartis. Dr Nides reports having received research grants, consulting fees, and honoraria from Pfizer, Sanofi‐Aventis, and GlaxoSmithKline. Dr Oncken reports having received research grants, consulting fees, and honoraria from Pfizer; receiving, at no cost, nicotine replacement and placebo products from GlaxoSmithKline for smoking cessation studies; and receiving honoraria from Pri‐Med. Drs Azoulay, Watsky, Gong, Williams, and Reeves and Mr Billing report owning Pfizer stock or having stock options in Pfizer. | |
| Notes | Analysis of pharmacogenetics was reported in King 2012. | |
| Risk of bias | ||
| Bias | Authors' judgement | Support for judgement |
| Random sequence generation (selection bias) | Low risk | A predefined, central, computer‐generated randomisation sequence stratified by centre assigned participants to treatment groups using a block size of 6. |
| Allocation concealment (selection bias) | Low risk | Centralised randomisation |
| Blinding of participants and personnel (performance bias) | Low risk | Participants and investigators were blinded to drug treatment assignments. Participants were not encouraged to guess their treatment assignment. |
| Blinding of outcome assessment (detection bias) | Low risk | Blinding was appropriate, and the outcome of the study was objective. |
| Incomplete outcome data (attrition bias) | Unclear risk | More refusal to continue participation in the placebo group and more dropout in the bupropion SR group due to adverse effects. Dropouts were assumed to be smoking. |
| Selective reporting (reporting bias) | Low risk | All outcomes listed on clinicaltrials.gov (NCT00141206) are reported. |
| Other bias | Low risk | Additional analyses of pharmacogenetics in King 2012 were conducted in a subset of the original randomised trial population, but baseline characteristics were comparable between treatment groups, so selection bias seems unlikely. |
| Methods | Randomised double‐blind placebo‐controlled trial of smoking cessation with a 2 × 2 factorial design (the “Patch Trial”) Study period: June 1991 to March 1992 | |
| Participants | N = 1686 Recruited from 19 general practice clinics in Oxfordshire, UK Inclusion criteria: current smokers, age ≥ 18 and ≤ 65 years, smoked ≥ 15 cigarettes/d Exclusion criteria: (a) known skin hypersensitivity to nicotine, (b) severe skin condition likely to make patch use impossible, (c) untreated peptic ulcer, (d) life‐threatening arrhythmia, (e) active cancer, (f) cerebrovascular or cardiovascular event within past 6 months, (g) lactation, and (h) existing or planned pregnancy. Patients were warned that they should not use other forms of nicotine, such as cigars, pipes, or nicotine chewing gum, during the trial, and that medication with centrally acting alpha activity (such as clonidine) was contraindicated. | |
| Interventions | 16‐Page booklet plus nicotine patch (N = 422) 46‐Page booklet plus nicotine patch (N = 420) 16‐Page booklet plus placebo patch (N = 422) 46‐Page booklet plus placebo patch (N = 422) Participants were randomised to 1 of 4 treatment groups: (a) nicotine patch with a standard, 16‐page Health Education Authority pamphlet on smoking cessation; (b) nicotine patch with a 46‐page booklet giving specific and more detailed information on smoking cessation with the help of patches; (c) placebo patch with a standard, 16‐page Health Education Authority pamphlet on smoking cessation; or (d) placebo patch with a 46‐page booklet giving specific and more detailed information on smoking cessation with the help of patches. Patches were delivered 21 mg/d × 4 weeks, followed by 14 mg/d × 4 weeks, then 7 mg/d × 4 weeks. | |
| Outcomes | Primary outcomes: biochemically verified point prevalence abstinence at 1 and 4 weeks (CO ≤ 10 ppm), and at 12, 24, and 52 weeks by cotinine ≤ 20 ng/mL or CO ≤ 10 ppm. Non‐attenders were assumed to be smoking. Abstinence at follow‐up in 1999 to 2000 was confirmed by a plasma cotinine level ≤ 20 ng/mL. Secondary outcomes: withdrawal symptoms | |
| Funding source | The Patch Trial was supported by Ciba‐Geigy Pharmaceuticals, which also supplied the nicotine and placebo patches. The Patch II Study was funded by the Imperial Cancer Research Fund and Cancer Research UK. “Personal funding to SPD provided by DA027331; National Institute for Health Research fellowship (to PA); and the UK Centre for Tobacco Control Studies (UKCTCS to P.A. and M.M.). The UKCTCS gratefully acknowledges funding from British Heart Foundation, Cancer Research UK, Economic and Social Research Council, Medical Research Council, and the Department of Health, under the auspices of the UK Clinical Research Collaboration.” | |
| Declaration of interest | No conflicts of interest were declared for the original Patch Trial. However, subsequent papers on pharmacogenetics report: “Paul Aveyard has done consultancy for McNeil, Pfizer, and Celtic Biotechnology and Sean David has done consultancy with Pfizer—both with regard to smoking cessation” (PMID: 21330274). | |
| Notes | The “Patch II Study”: 1532 of the original 1686 Patch Trial participants were contacted again between July 1999 and July 2000 and were invited to participate in 8‐year follow‐up of smoking status and to provide DNA samples, of whom 840 returned questionnaires and 755 were successfully genotyped. These results were published in subsequent papers (David 2007; David 2008; David 2008a; David 2011; Johnstone 2004; Johnstone 2006; Johnstone 2007; Munafò 2007; Munafò 2011; Munafò 2012; Uhl 2010; Yudkin 2004). | |
| Risk of bias | ||
| Bias | Authors' judgement | Support for judgement |
| Random sequence generation (selection bias) | Low risk | “Randomisation was carried out by prior random allocation of study numbers to each intervention group and by sequential allocation of a study number to patients on entry.” |
| Allocation concealment (selection bias) | Low risk | “Prepared precoded packages containing the patches were handed to the patients by the general practitioner.” |
| Blinding of participants and personnel (performance bias) | Low risk | “The packaging and appearance of the two types of patch were identical.” |
| Blinding of outcome assessment (detection bias) | Low risk | Research staff were blinded to randomisation status throughout the trial. |
| Incomplete outcome data (attrition bias) | Unclear risk | 755/1686 (45%) Patch Trial participants were genotyped and Patch II Study participants were more female, were slightly older, and were more likely to be abstinent than non‐genotyped Patch Trial participants. However, Patch II Study participants were balanced to treatment allocation. |
| Selective reporting (reporting bias) | Low risk | Primary outcome results were published for all candidate genes in comprehensive reviews and subsequent papers. |
| Other bias | High risk | 45% of original trial participants were genotyped, which may not be representative of the original study population. Analyses of pharmacogenetics were reported in multiple subsequent papers. See ‘Notes’ above. |
| Methods | Randomised parallel‐group open‐label efficacy clinical trial consisting of 2 phases: phase 1 lasting 12 weeks, during which all participants receive a standard treatment of NRT, bupropion, and 5 group counseling sessions; followed by phase 2, randomisation to 1 of 5 treatments for another 40 weeks. Outcomes are measured at multiple time points to 104 weeks. Study period: 2002 to 2004 | |
| Participants | N = 407 Recruited through multi‐media advertising, public service announcements, flyers, and direct mailing Inclusion criteria: treatment‐seeking smokers 18 years of age or older who currently smoke 10 cigarettes/d, report a regular smoking history ≥ 5 years, and answer "yes" to the question, “Do you smoke within 30 minutes of arising?” Exclusion criteria: history of seizure or head injury resulting in unconsciousness; any condition that might predispose to seizures (brain tumour or stroke); current or history of anorexia nervosa or bulimia; any disease acutely life‐threatening or so severe that the patient is judged unable to comply with the protocol; use of a protease inhibitor or MAO inhibitor within the past 2 weeks; current use of psychiatric drugs that would interfere with interpretation of study results, including antidepressants; treatment for alcohol dependence during the past year, or evidence of alcohol abuse so severe that the patient is judged potentially unable to comply with the protocol; patients who know they are leaving the Bay Area within the study period and non‐English speakers; suicidal or homicidal ideation; current major depression; history of bipolar disorder; recent (within 12 months) myocardial infarction; any other medical condition that would contraindicate use of NRT or bupropion; physical limitation so severe that participation in a programme of moderate exercise is not possible; and pregnancy or lactation | |
| Interventions | All participants receive 10 weeks of NRT (patch, tapering from 21 mg to 7 mg over 8 weeks, starting at week 3) and 12 weeks of bupropion treatment and 5 mandatory group counseling sessions. At week 11, subjects are randomly assigned to 1 of 5 treatment groups: (a) no further treatment, with assessments at weeks 12, 24, 36, 52, 64, and 104 weeks (standard assessments for all treatments); (b) extended active medication (bupropion) treatment through week 52 with low‐intensity (monthly) counseling with medical staff; (c) extended placebo medication treatment through week 52 with low‐intensity counseling with medical staff; (d) extended active medication treatment with high‐intensity (session 20 to 40 minutes in duration at weeks 12, 14, 16, 18, 20, 24, 28, 32, 36, 44, and 52, and telephone contact at weeks 13, 15, 18, 22, 26, 30, 34, 36, 40, and 48) counseling; and (e) extended placebo medication treatment with high‐intensity counseling. High‐intensity counseling sessions included additional information focusing on motivation, social support, mood management, weight gain, and dependence/withdrawal. | |
| Outcomes | Primary outcome: biochemically verified 7‐day point prevalence abstinence at weeks 12, 24, 52, 64, and 104 | |
| Funding source | The clinical trial was supported by a grant from the National Institute on Drug Abuse (R01DA015732, Maintaining Abstinence in Chronic Smokers, PI: Sharon M Hall). | |
| Declaration of interest | Declaration of interest was not reported. | |
| Notes | Analyses of pharmacogenetics were described in Bergen 2013. | |
| Risk of bias | ||
| Bias | Authors' judgement | Support for judgement |
| Random sequence generation (selection bias) | Low risk | Computerised allocation was performed by study statistician who did not have contact with participants. |
| Allocation concealment (selection bias) | Low risk | Assignment for individual participants was transmitted electronically to staff. |
| Blinding of participants and personnel (performance bias) | Unclear risk | The trial was open‐label, but other aspects of the trial suggest rigorous management and lower probability of high performance bias to unclear. |
| Blinding of outcome assessment (detection bias) | Low risk | Outcome assessment was done by self‐report and by 2 biochemical methods using exhaled breath and urine (i.e. very thorough outcome assessment). |
| Incomplete outcome data (attrition bias) | Low risk | Attrition rates were low for the companion trial. |
| Selective reporting (reporting bias) | Low risk | Outcome assessment was very thorough, with 3 pieces of information required to note an individual as abstinent. In the companion trial, only 17/905 urine determinations had data discordant with outcomes of self‐report and CO measurement (< 2%). |
| Other bias | Low risk | Analyses of pharmacogenetics were performed on ˜ 37% of total study, ˜ 50% of self‐identified “Caucasian”. Minimum arm N was 26. Data show no significant differences by arm with respect to proportion of the arm genotyped. Not generalisable to other ancestries |
| Methods | Randomised parallel‐group open‐label efficacy clinical trial consisting of 2 phases: phase 1, lasting 12 weeks during which all participants receive a standard treatment of NRT, bupropion, and 5 group counseling sessions; followed by phase 2, randomization to 1 of 4 treatments for another 40 weeks. Outcomes are measured at multiple time points to 104 weeks. Study period: 2002 to 2004 | |
| Participants | N = 402 N = 403 were enrolled, but 1 individual died before randomisation. Recruited through multi‐media advertising, public service announcements, flyers, and direct mailing. Inclusion criteria: treatment‐seeking smokers 50 years of age or older who currently smoke 10 cigarettes/d Exclusion criteria: history of seizure or head injury resulting in unconsciousness; any condition that might predispose to seizures (brain tumour or stroke); current or history of anorexia nervosa or bulimia; any disease acutely life‐threatening or so severe that the patient is judged unable to comply with the protocol; use of a protease inhibitor or MAO inhibitor within the past 2 weeks; current use of psychiatric drugs that would interfere with interpretation of study results, including antidepressants; treatment for alcohol dependence during the past year, or evidence of alcohol abuse so severe that the patient is judged potentially unable to comply with the protocol; patients who know they are leaving the Bay Area within the study period and non‐English speakers; suicidal or homicidal ideation; current major depression; history of bipolar disorder; recent (within 12 months) myocardial infarction; any other medical condition that would contraindicate use of NRT or bupropion; physical limitation so severe that participation in a programme of moderate exercise is not possible; and pregnancy or lactation | |
| Interventions | All participants receive 10 weeks of NRT (gum, 2 mg for those smoking < 25 cigarettes/d, up to 12 pieces a day, or 4 mg for heavier smokers or heavy users of 2‐mg gum still reporting withdrawal) and 12 weeks of bupropion treatment (150 mg for a week, then 300 mg the second week and thereafter, with no adverse effects) and 5 mandatory group counseling sessions (90 minutes each). At week 8 (to permit NRT tapering for those assigned to no further treatment), participants are randomly assigned to 1 of 4 treatment groups: (a) no further treatment, with assessments at weeks 12, 24, 36, 52, 64, and 104 (standard assessments for all treatments); (b) extended NRT (to week 52) with no further counseling; (c) extended NRT with extended cognitive‐behavioural therapy to prevent relapse and encourage abstinence in case of relapse before week 12, and in case of lapses after week 12, where extended individual (20 to 40 minutes) counseling occurred at week 10, every 2 weeks thereafter, then every 4 weeks, then at weeks 44 and 52, with telephone contact in between clinical visits; and (d) extended NRT and extended counseling. Extended counseling sessions included additional information focusing on motivation, social support, mood management, weight gain, and dependence/withdrawal. | |
| Outcomes | Primary outcome: biochemically verified 7‐day point prevalence abstinence at weeks 12, 24, 52, 64, and 104 | |
| Funding source | Clinical trial and publications (portion related to this trial) were supported by grants from the National Institute on Drug Abuse (R01 DA02538, K05 DA016752, K23 DA018691 and P50 DA 09253, and R01 DA15732). | |
| Declaration of interest | Declarations of interest were not reported. | |
| Notes | Neither this paper nor the clinicaltrials.gov record provided analyses of pharmacogenetics. These were provided in Bergen 2013. | |
| Risk of bias | ||
| Bias | Authors' judgement | Support for judgement |
| Random sequence generation (selection bias) | Low risk | Computerised allocation performed by study statistician who did not have contact with participants. |
| Allocation concealment (selection bias) | Low risk | Assignment for individual participants was transmitted electronically to staff. |
| Blinding of participants and personnel (performance bias) | Unclear risk | Trial was open‐label, but other aspects of trial suggest rigorous management and lower probability of high performance bias to unclear. |
| Blinding of outcome assessment (detection bias) | Low risk | Outcome assessment was done by self‐report and by 2 biochemical methods using exhaled breath and urine (i.e. very thorough outcome assessment). |
| Incomplete outcome data (attrition bias) | Low risk | Attrition rates were low (ranging from 3.2% at week 12 to 13.4% at week 104). Per‐arm assessment rates averaged 93%, and abstinence assessments were available for 92% of participants. |
| Selective reporting (reporting bias) | Low risk | Outcome assessment was very thorough, with 3 pieces of information required to note an individual as abstinent. Only 17/905 urine determinations had data discordant with outcomes of self‐report and CO measurement (< 2%). |
| Other bias | Low risk | Analyses of pharmacogenetics performed on ˜ 42% of total study; ˜ 55% of self‐identified “Caucasian”; minimum arm N was 35; no significant differences by arm with respect to proportion of arm analysed. Not generalisable to other ancestries |
| Methods | Double‐blind parallel‐group placebo and active treatment–controlled randomised clinical trial Study period: June 2003 to March 2005 | |
| Participants | N = 1027 Participants were generally healthy smokers. Inclusion criteria: smoking ≥ 10 cigarettes/d the previous year, < 3 months of smoking abstinence in the past year, and 18 to 75 years old Exclusion criteria: previous use of bupropion in any form; contraindications for use of bupropion (e.g. history of seizure, diagnosis of eating disorder, use of a monoamine oxidase inhibitor in the prior 14 days, hepatic or renal impairment, diabetes requiring insulin, oral hypoglycaemics); serious or unstable disease within previous 6 months; clinically significant cardiovascular disease in previous 6 months; uncontrolled hypertension; baseline systolic blood pressure higher than 150 mmHg or diastolic blood pressure higher than 95 mmHg; severe chronic obstructive pulmonary disease; history of cancer; clinically significant allergic reactions; body mass index < 15 or > 38; body weight < 45 kg; history of alcohol or other drug abuse or dependence in the previous 12 months (nicotine excepted); treatment for major depression in the previous 12 months; history of or current panic disorder, psychosis, or bipolar disorder; use of another investigational drug within the past 30 days; intention to donate blood or blood products during treatment phase of the study (12 weeks); previous participation in any varenicline study; use in the previous month or intention to use medications that might interfere with study medication evaluation (e.g. nicotine replacement, nortriptyline, clonidine); use of marijuana or other tobacco products during the study; clinically significant abnormalities in screening laboratory values | |
| Interventions | Varenicline (n = 344) Bupropion SR (n = 342) Placebo (n = 341) Treatment phase doses were 1 mg of varenicline twice daily and 150 mg of bupropion SR twice daily for 12 weeks, with an initial dose titration to full strength during the first week for both drugs. All participants received a folder on the study medication without de‐blinding treatment allocation. | |
| Outcomes | Primary outcome: exhaled carbon monoxide–confirmed 4‐week continuous abstinence rate for weeks 9 through 12, defined as the proportion of participants who reported no smoking (not even a puff) and no use of nicotine‐containing products confirmed by an exhaled carbon monoxide measurement ≤ 10 ppm Other outcomes: continuous abstinence rates from week 9 through week 24, and from week 9 through week 52; 7‐day point prevalence abstinence rates at weeks 12, 24, and 52 | |
| Funding source | The clinical trial was sponsored by Pfizer Inc., which provided funding, study drug and placebo, and monitoring. Drs Azoulay, Watsky, Williams, Gong, and Reeves, and Mr Billing, employees of Pfizer Inc., were involved in all elements of this study. In addition, the database containing findings of the 14 investigator sites was maintained by Pfizer Inc., and statistical analyses were performed at Pfizer Inc. by Mr Billing and Ann Pennington, MS. Independent analysis was performed to verify the findings of Pfizer Inc. | |
| Declaration of interest | Dr Jorenby reported receiving research support from Pfizer, Nabi Biopharmaceutical, and Sanofi‐Aventis, and consulting fees from Nabi Biopharmaceutical. Dr Hays reported receiving a research grant from Pfizer. Dr Rigotti reported receiving research grant funding and consulting fees from GlaxoSmithKline, which markets smoking cessation medications, and from Pfizer and Sanofi‐Aventis, which are developing smoking cessation medications. Dr Rigotti also reported receiving consulting fees from Merck, which is developing smoking cessation medications. | |
| Notes | Analysis of pharmacogenetics was reported in King 2012. | |
| Risk of bias | ||
| Bias | Authors' judgement | Support for judgement |
| Random sequence generation (selection bias) | Low risk | Randomisation was completed centrally with the use of a computer‐generated list; sites used an electronic system to assign participants to treatment. |
| Allocation concealment (selection bias) | Low risk | Centralised randomisation |
| Blinding of participants and personnel (performance bias) | Unclear risk | Blinding of personnel is not explicitly described. |
| Blinding of outcome assessment (detection bias) | Low risk | Outcome of the study was objective. |
| Incomplete outcome data (attrition bias) | Unclear risk | More refusal to continue participation in the placebo group. Dropouts were assumed to be smoking. |
| Selective reporting (reporting bias) | Low risk | All outcomes listed on clinicaltrials.gov (NCT00143364) are reported. |
| Other bias | Low risk | Additional analyses of pharmacogenetics in King 2012 were conducted in a subset of the original randomised trial population, but baseline characteristics were comparable between treatment groups, so selection bias seems unlikely. |
| Methods | Double‐blind parallel‐group placebo‐controlled randomised clinical trial Study period: June 2005 to April 2010 | |
| Participants | N = 143 Participants were in recovery from alcohol problems and were recruited from a residential substance abuse treatment programme and from the community. Inclusion criteria: smoked ≥ 10 cigarettes/d, history of alcohol abuse or dependence, and between 2 and 12 months of abstinence from alcohol Exclusion criteria: older than age 70; diagnosis of schizophrenia; current psychotic episode; cardiac problems in the past 3 months; uncontrolled hypertension; history of seizure; history of head injury with neurological sequelae or prolonged loss of consciousness; and use of medications that lower the seizure threshold | |
| Interventions | Bupropion + nicotine patch (n = 73) Placebo + nicotine patch (n = 70) Participants were taking study medication for 8 weeks. They began study medication (bupropion 150 mg SR tablets or placebo) 1 week before their quit day. Participants were instructed to take 1 tabletd for 3 days, then one 150‐mg tablet twice per day for the remainder of the treatment phase of the study. All participants received a nicotine patch for 7 weeks, starting 1 week after starting study medication on their quit day. They received a 21‐mg patch for 4 weeks, a 14‐mg patch for 2 weeks, and a 7‐mg patch for 1 week. | |
| Outcomes | Outcomes: 7‐day point prevalence smoking abstinence at week 7 (end of treatment), week 11, and week 24. At week 7, smoking abstinence was defined via self‐report (complete abstinence during the 7 days before the time of assessment) and biochemical verification (CO reading < 8 ppm). At week 11 and week 24, smoking abstinence was defined via self‐report and biochemical verification (salivary cotinine levels ≤ 15 ng/mL) | |
| Funding source | Study was sponsored through personal funding by David Kalman: NIDA R01‐DA11713‐01; Peter Monti: NIAAA K05 Senior Scientist Award; and Marc Mooney: NIDA K01‐DA‐019446. NIDA and NIAAA had no further role in study design; in collection, analysis, and interpretation of data; in writing of the report; or in the decision to submit the paper for publication. | |
| Declaration of interest | No conflicts were declared. None of the review authors have any connection with the tobacco, alcohol, pharmaceutical, or gaming industries or with any body substantially funded by 1 of these organizations. | |
| Notes | Analysis of pharmacogenetics was reported in McGeary 2012. | |
| Risk of bias | ||
| Bias | Authors' judgement | Support for judgement |
| Random sequence generation (selection bias) | Low risk | Urn randomisation with 4 variables was used to allocate participants. |
| Allocation concealment (selection bias) | Low risk | Randomisation was based on 4 variables. |
| Blinding of participants and personnel (performance bias) | Unclear risk | Active and placebo medications were identical in appearance. No further details are presented. |
| Blinding of outcome assessment (detection bias) | Low risk | Outcome of the study was objective. |
| Incomplete outcome data (attrition bias) | High risk | Excluded from analysis participants who did not receive the study medication; no ITT analysis was performed. |
| Selective reporting (reporting bias) | High risk | Weeks of abstinence assessment are different from those listed on clinicaltrials.gov (NCT00304707). |
| Other bias | Unclear risk | Additional analyses of pharmacogenetics were conducted in a subset of the original randomised trial population in McGeary 2012, but comparability of baseline characteristics between treatment groups is unclear. |
| Methods | Open‐label cessation and double‐blind extended treatment phase Setting: community cessation clinic, USA Recruitment: community volunteers Study period: December 2001 to March 2004 | |
| Participants | N = 362 54% males; average age ˜ 45; average number of cigarettes/d: ˜ 20 Inclusion criteria: smokers; 18 to 65 years of age; smoking at least 10 cigarettes/d or 3.5 packs/week Exclusion criteria: pregnancy, current lactation, epilepsy, bipolar disorder, schizophrenia, receiving active treatment for or reporting current depression or substance abuse, current use of bupropion or NRT, use of medication that could interact with bupropion or NRT | |
| Interventions | Open‐label phase: All participants received bupropion SR 300 mg/d (Zyban) for 11 weeks and nicotine patch therapy for 10 weeks. Double‐blind phase: bupropion SR (150 mg/d) (n = 181) vs placebo (n = 181) for 14 weeks; at week 12, those assigned to placebo had their bupropion SR dose tapered to 150 mg/d for 2 weeks, then were switched to placebo in week 14 | |
| Outcomes | Primary outcome: point prevalence abstinence rates at 25‐week and 52‐week follow‐up Secondary outcomes: repeated point prevalence abstinence; continuous abstinence; craving and withdrawal symptoms; physiological measurements; adverse events; medication compliance | |
| Funding source | Support was provided solely by National Cancer Institute Grant CA 090300 awarded to Joel D. Killen. Nicotine patches and bupropion were kindly provided by GlaxoSmithKline. | |
| Declaration of interest | GlaxoSmithKline did not otherwise participate in the design, conduct, analysis, or reporting of this study. | |
| Notes | Analysis of pharmacogenetics was reported in Sarginson 2011. | |
| Risk of bias | ||
| Bias | Authors' judgement | Support for judgement |
| Random sequence generation (selection bias) | Low risk | Randomisation was conducted before study entry by the method of permuted block (block size = 2 to obtain balance between groups) and was stratified on gender in the order of participant ID numbers. |
| Allocation concealment (selection bias) | Low risk | When a participant was assigned to the next available ID number in the corresponding gender, he or she was associated with that treatment group. |
| Blinding of participants and personnel (performance bias) | Low risk | Both participants and researchers were blinded to treatment at extended treatment phases. |
| Blinding of outcome assessment (detection bias) | Low risk | Both participants and researchers were blinded to treatment at extended treatment phases. |
| Incomplete outcome data (attrition bias) | Low risk | Lost at 12 months' follow‐up: 8% bupropion; 13% placebo |
| Selective reporting (reporting bias) | Low risk | Study protocol was not available, but detailed reporting of outcomes does not suggest selective reporting. |
| Other bias | Unclear risk | Of 304 trial participants, 270 provided samples for DNA extraction, but the selection process for those 270 is unclear. |
| Methods | Open‐label cessation and double‐blind extended treatment phase with follow‐up conducted at 20 and 52 weeks Setting: community cessation clinic, USA Recruitment: community volunteers Study period: February 2004 to March 2006 | |
| Participants | N = 304; 3 were excluded because of wrong treatment 40% females; average age: ˜ 46; average cigarettes/d: ˜ 20 Inclusion criteria: smokers, 18 to 65 years of age; smoking ≥ 10 cigarettes/d or 3.5 packs/week Exclusion criteria: pregnancy, current lactation, epilepsy, bipolar disorder, schizophrenia, receiving active treatment for or reporting current depression or substance abuse, history of heart problems in the previous 6 months, head trauma leading to unconsciousness in the past year, history of severe head injury resulting in brain surgery or specific neurological problems, current use of bupropion or nicotine replacement therapy (NRT), or medication that could interact with bupropion or NRT | |
| Interventions | Open‐label – pharmacotherapy: bupropion SR for 9 weeks and nicotine patch therapy for 8 weeks. During their first week, participants continued to smoke while taking bupropion SR (150 mg/d on days 1 to 3, then 300 mg/d on days 4 to 7). Nicotine patch (21 mg) was added to treatment with bupropion (300 mg) on the target quit date if the participant succeeded. After 1 month, participants were tapered to 14 mg nicotine patch for 2 weeks, then to 7 mg for 2 weeks. Open‐label – common behavioural therapy: 6 clinic sessions, 30 minutes each, at baseline, quit week, and weeks 1, 2, 4, and 6 Double‐blind – telephone support (control): n = 147 (excluded: n = 1); 5 minutes general support calls at weeks 8, 12, 16, and 20 Double‐blind – extended cognitive‐behavioural therapy: n = 154 (excluded: n = 2); 4 sessions, 30 minutes each, at weeks 8, 12, 16, and 20 and weekly check‐in calls to automated system; report of relapse or craving prompted proactive calls | |
| Outcomes | Primary outcomes: expired air CO‐confirmed 7‐day point prevalence abstinence evaluated at both 20 and 52 weeks Secondary outcomes: nicotine dependence (craving and withdrawal symptoms); major depressive disorder; medication compliance; heart rate and blood pressure; adverse events; medication compliance | |
| Funding source | Support was provided solely by a grant from the National Institute on Drug Abuse. | |
| Declaration of interest | Dr Schatzberg serves as a consultant to GlaxoSmithKline. | |
| Notes | Analysis of pharmacogenetics is reported in Sarginson 2011. | |
| Risk of bias | ||
| Bias | Authors' judgement | Support for judgement |
| Random sequence generation (selection bias) | Low risk | Randomisation to extended treatment condition was conducted via a permuted block method (block size = 4 to obtain balance between groups) and was stratified by gender. |
| Allocation concealment (selection bias) | Low risk | Participants were assigned to the next available ID number in the corresponding gender. |
| Blinding of participants and personnel (performance bias) | Low risk | Research team and participants were blinded to extended treatment assignment until the end of the open‐label phase. |
| Blinding of outcome assessment (detection bias) | Low risk | Research team and participants were blinded to extended treatment assignment. |
| Incomplete outcome data (attrition bias) | Low risk | Follow‐up: 89% in standard care; 90% in intervention group |
| Selective reporting (reporting bias) | Low risk | Study protocol was not available but detailed reporting of outcomes does not suggest selective reporting. |
| Other bias | Unclear risk | Of 304 trial participants, 270 provided samples for DNA extraction, but the selection process for those 270 was unclear. |
| Methods | 8‐Week double‐blind randomized placebo‐controlled clinical trial Setting: community‐based, USA Recruitment: community recruitment through radio, newspapers, community website, and notices distributed via local organisations Study period: May 2006 to July 2008 | |
| Participants | N = 243 Inclusion criteria: 18 to 65 years of age; smoked 10 or more cigarettes a day Males: 70%; average age: 45; average cigarettes/d: 19 | |
| Interventions | Selegiline patch for 8 weeks, 6 mg/24 hours, starting on TQD vs identical placebo patch on same schedule Both groups received 9 sessions of individual cognitive‐behavioural therapy. | |
| Outcomes | Primary outcome: point prevalence abstinence (PPA) at week 25 and week 52 (i.e. report of non‐smoking (not even a puff) for 7 consecutive days before contact and an expired air carbon monoxide level < 10 ppm) Secondary outcomes: time to relapse; occurrence, duration, and severity of adverse events | |
| Funding source | National Institute on Drug Abuse; medication and matching placebo were provided by Somerset Pharmaceuticals, Inc. | |
| Declaration of interest | Dr Schatzberg served as a consultant for Somerset Pharmaceuticals. | |
| Notes | Analyses of pharmacogenomics are reported in Sarginson 2015 (N = 231 with DNA samples; 77.1% Caucasian, 9.1% Hispanic, 3.9% Asian, 1.3% black, 0.4% other, and 8.2% mixed ancestry). All analyses of pharmacogenomics were performed in both the full cohort and the Caucasian‐only cohort. | |
| Risk of bias | ||
| Bias | Authors' judgement | Support for judgement |
| Random sequence generation (selection bias) | Low risk | Use of random number generator |
| Allocation concealment (selection bias) | Low risk | Participants were assigned sequential ID numbers corresponding to drugs used. Also: “The drug (active or placebo) associated with each ID was pre‐packaged and labelled by ID only at an off‐site location by an individual who had no association with the participants.” |
| Blinding of participants and personnel (performance bias) | Low risk | “Treatment assignment was concealed from staff and both research staff and participants were blind to week 52.” |
| Blinding of outcome assessment (detection bias) | Low risk | “Treatment assignment was concealed from staff and both research staff and participants were blind to week 52.” |
| Incomplete outcome data (attrition bias) | Low risk | Follow‐up at 12 months: 87% (same in both arms) |
| Selective reporting (reporting bias) | Low risk | Registered in clinicaltrials.gov under NCT01330030; no deviation from prespecified outcomes |
| Other bias | Low risk | 12 people did not provide DNA for analyses of pharmacogenomics; use of PCA was included in analyses of pharmacogenomics. |
| Methods | Double‐blind randomised placebo‐controlled clinical trial of bupropion HCL (brand name Zyban) in adult male and female smokers Study period: June 1999 to March 2002 | |
| Participants | N = 555 allocated and received intervention (Lerman 2006). Numbers included in published pharmacogenetic analyses include ˜ 414 (Lerman, 2006), ˜ 412 (Conti, 2008), and ˜ 416 (Bergen, 2013), which refer to European ancestry individuals only, but data made available for this review include non‐Hispanic white and non‐Hispanic black, total ˜ 494. Participants were smokers seeking treatment and were recruited through advertisements for a free smoking cessation programme at Georgetown University and at the State University of New York at Buffalo. Inclusion criteria: age ≥ 18 years, reported smoking ≥ 10 cigarettes/d for the previous 12 months, who provided informed consent for both genotyping and treatment Exclusion criteria: planning a pregnancy, pregnant, lactating; seizure disorder, history of head trauma or prior seizure, family history of a seizure disorder; brain (or CNS) tumour; history of or current diagnosis of bulimia or anorexia nervosa; diabetes treated with oral hypoglycaemics or insulin; excessive use of alcohol or alcoholism; current addiction to opiates, cocaine, or stimulants; use of other drugs containing bupropion (e.g. Wellbutrin, Wellbutrin SR); allergy to bupropion; currently taking particular medications (e.g. monoamine oxidase inhibitor, antipsychotics, antidepressants, theophylline, systemic steroids, over‐the‐counter stimulants and anorectics); recently taking an MAOI (< 14 days); or recent discontinuation of a benzodiazepine | |
| Interventions | Bupropion and 7 sessions of in‐person behavioural group counseling (N = 285 allocated, 229 received allocation), and Placebo and 7 sessions of in‐person behavioural group counseling (N = 70 allocated, 211 received allocation) Participants received 10 weeks of pills (active or placebo) initiated on the first day of counseling. Bupropion treatment was standard (150 mg/d for 3 days, then 300 mg/d). The target quit day was day of the third counseling session. | |
| Outcomes | Primary outcomes: continuous abstinence measured at end of treatment and at 6 months after cessation Secondary outcomes: short‐term quit rates using 7‐day and 30‐day point prevalence 83% and 86% of participants reporting abstinence at end of treatment and at 6 months provided a CO sample for verification. | |
| Funding source | Study medication for the bupropion trial was provided by GlaxoSmithKline. This research was supported by grants from the National Cancer Institute and the National Institutes of Drug Abuse, P50CA/DA84718 and RO1CA 63562. | |
| Declaration of interest | Dr Berrettini has consulted for GlaxoSmithKline. | |
| Notes | Lerman 2002 described an interim analysis of mediators on cessation and was the first published description of this trial. Lerman 2006 is the definitive description of the trial and the first published analysis of pharmacogenetics. | |
| Risk of bias | ||
| Bias | Authors' judgement | Support for judgement |
| Random sequence generation (selection bias) | Low risk | Randomisation was computer generated by a senior data manager. |
| Allocation concealment (selection bias) | Low risk | Allocation was concealed from counselors and study assistants. |
| Blinding of participants and personnel (performance bias) | Low risk | Double‐blind |
| Blinding of outcome assessment (detection bias) | Low risk | Outcomes were assessed via a timeline follow‐back method through phone interviews with study assistants. |
| Incomplete outcome data (attrition bias) | High risk | As described in Lerman 2006, 17% withdrew after allocation but before intervention (not included in ITT analysis), and 23% of the remainder were lost to follow‐up or discontinued treatment but were included in the ITT analysis. No significant differences in losses were reported at either stage by arm. However, as abstinence outcomes were 27% at EOT and 22% at 6 months, attrition proportion seems high. |
| Selective reporting (reporting bias) | Low risk | Conti 2008 reported on continuous abstinence. |
| Other bias | Low risk | Genotype completion rate was very high overall, so selection bias by treatment group is low. |
| Methods | Open‐label randomised clinical trial of transdermal vs spray nicotine replacement therapy (brand names Nicoderm and Nicotrol), with behavioural group counseling provided to all participants Study period: February 2000 to August 2003 | |
| Participants | Participants were smokers seeking treatment and were recruited through advertisements for a free smoking cessation programme at Georgetown University and at the University of Pennsylvania. Inclusion criteria: ≥ 18 years of age, reported smoking of ≥ 10 cigarettes/d for the previous 12 months, and provided informed consent for both genotyping and treatment Exclusion criteria: planning a pregnancy, pregnancy or lactation; seizure disorder, history of head trauma or prior seizure; unstable angina, heart attack, or stroke within past 6 months; current treatment for or recent diagnosis of cancer; drug or alcohol dependence; current diagnosis or history of a DSM‐IV axis I psychiatric disorder; current use of bupropion or nicotine‐containing products other than cigarettes; and skin allergies or chronic dermatitis | |
| Interventions | N = 600 allocated and received intervention (Lerman 2006). Numbers included in published pharmacogenetic analyses include ˜ 368 (Lerman 2006) and ˜ 378 (Bergen 2013), which refer to European ancestry individuals only. Treatment allocation could not be concealed. Eight weeks of NRT (standard Nicoderm patch, N = 302, or Nicotrol spray, N = 298) was provided to participants on the target quit date after 2 weeks of counseling. A total of 7 sessions of behavioural group counselling was provided. | |
| Outcomes | Primary outcomes: continuous abstinence measured at end of treatment and at 6 months after cessation 76% and 72% of participants reporting abstinence at end of treatment and at 6 months provided a CO sample for verification. | |
| Funding source | This work was supported by a Transdisciplinary Tobacco Use Research Center Grant from the National Cancer Institute and the National Institute on Drug Abuse P5084718, and the Abramson Cancer Center and Annenberg Public Policy Center (CL), and PHS grants P60DA005186 (WB), DA02277, DA12393, CA078703, and the UCSF Comprehensive Cancer Center (NB), and Public Health Services Research Grant M01‐RR0040 from the National Institutes of Health. Nicotine nasal spray was provided by Pharmacia, Helsingborg, Sweden. | |
| Declaration of interest | Dr Berrettini acts as a consultant to GlaxoSmithKline. | |
| Notes | Lerman 2004 described an interim analysis of pharmacogenetics of abstinence and was the first published description of this trial. Lerman 2006 is the definitive description of the trial. | |
| Risk of bias | ||
| Bias | Authors' judgement | Support for judgement |
| Random sequence generation (selection bias) | Low risk | Randomisation was computer generated by a senior data manager. |
| Allocation concealment (selection bias) | High risk | Allocation could not be concealed from counselors and study assistants. |
| Blinding of participants and personnel (performance bias) | High risk | Open‐label trial |
| Blinding of outcome assessment (detection bias) | Low risk | Outcomes were assessed via a timeline follow‐back method through phone interviews with study assistants. |
| Incomplete outcome data (attrition bias) | High risk | As described in Lerman 2006, 11% withdrew after allocation but before intervention (not included in ITT analysis), and 22% of the remainder were lost to follow‐up or discontinued treatment but were included in the ITT analysis. No significant differences in losses at either stage by arm. However, as abstinence outcomes were 33% at EOT and 20% at 6 months, attrition proportion seems high. |
| Selective reporting (reporting bias) | Unclear risk | Lerman et al reported on primary and secondary outcomes; Bergen et al on secondary outcomes. |
| Other bias | Low risk | Genotype completion rate was very high overall, so selection bias by treatment group is low. |
| Methods | Double‐blind parallel‐group placebo and active treatment‐controlled randomised clinical trial Study period: November 2010 to September 2013 | |
| Participants | N = 1246 Participants were smokers seeking treatment and were recruited through advertisements for a free smoking cessation programme. Inclusion criteria: age between 18 and 65 years, reported smoking ≥ 10 cigarettes/d for 6 months or longer (verified by carbon monoxide concentrations > 10 ppm) Exclusion criteria: use of non‐cigarette tobacco products, e‐cigarettes, or current smoking treatment; history of substance misuse treatment, current use of cocaine or methamphetamine, or more than 25 alcoholic drinks/week; medical contraindications; history of DSM‐IV Axis I psychiatric disorder or suicide risk score on the Mini‐International Neuropsychiatric Interview (MINI) > 1, or current major depression; current use of antipsychotics, stimulants, opiate medications, anticoagulants, rescue inhalers, antiarryhthmics, or medications altering CYP2A6 activity (e.g. monoamine oxidase inhibitors, tricyclic antidepressants); and inability to provide informed consent or any condition that could compromise safety | |
| Interventions | Placebo pill + placebo patch (n = 408) Placebo pill + nicotine patch (n = 418) Varenicline + placebo patch (n = 420) Participants received 11 weeks of patches: 21 mg (6 weeks), 14 mg (2 weeks), and 7 mg (3 weeks). Varenicline (or placebo) was delivered for 12 weeks (1 week before the target quit date): days 1 to 3 (0·5 mg once daily); days 4 to 7 (0·5 mg twice daily); and days 8 to 84 (1·0 mg twice daily). | |
| Outcomes | Primary outcome: biochemically verified 7‐day point prevalence abstinence at end of treatment Secondary outcomes: side effects, withdrawal symptoms, 6‐month and 12‐month quit rates | |
| Funding source | This work was supported by a grant from the National Institute on Drug Abuse, the National Cancer Institute, the National Human Genome Research Institute, and the National Institute on General Medical Sciences (U01‐DA20830) to CL and RFT; funding from the Abramson Cancer Center at the University of Pennsylvania (P30 CA16520) and a grant from the Commonwealth of Pennsylvania Department of Health was provided to CL; a grant from the Canadian Institutes of Health Research (CIHR TMH109787), an endowed Chair in Addiction for the Department of Psychiatry, CAMH Foundation, the Canada Foundation for Innovation (#20289 and #16014), and the Ontario Ministry of Research and Innovation were given to RFT. The Pennsylvania Department of Health disclaims responsibility for analyses, interpretations, or conclusions. Pfizer provided varenicline and placebo pills at no cost. | |
| Declaration of interest | CL received study medication and placebo, and support for medication packaging, from Pfizer; she has also consulted for Gilead, and has been a paid expert witness in litigation against tobacco companies. | |
| Notes | This paper provided analysis of pharmacogenetics. Additional analyses are reported in Tyndale 2015. | |
| Risk of bias | ||
| Bias | Authors' judgement | Support for judgement |
| Random sequence generation (selection bias) | Low risk | A biostatistician, independent of study investigators, developed a randomisation procedure, which was integrated into a centralised data management system. |
| Allocation concealment (selection bias) | Low risk | Randomisation was centrally organised. |
| Blinding of participants and personnel (performance bias) | Low risk | Participants, study investigators, and personnel were masked to treatment group allocation. |
| Blinding of outcome assessment (detection bias) | Low risk | Blinding was appropriate, and the outcome of the study was objective. |
| Incomplete outcome data (attrition bias) | Low risk | Incomplete outcome data are similar in all treatment groups; different validation analyses were performed to deal with missing data. |
| Selective reporting (reporting bias) | Low risk | All outcomes listed on clinicaltrials.gov (NCT01314001) are reported. However, 12‐month quit rates were not listed in the protocol but are presented in the manuscript. |
| Other bias | Low risk | Additional analyses of pharmacogenetics in Tyndale 2015 were conducted in Caucasians only, but these seem to be distributed equally among treatment groups, so selection bias seems unlikely. |
| Methods | Open‐label parallel‐group randomised controlled trial of genotype‐based vs dependence score‐based oral dose of NRT for smoking cessation (the “Personalised Extra Treatment (PET) Trial”) Study period: June 2007 to September 2009 | |
| Participants | N = 633 Participants were recruited from 29 primary care practices in Birmingham and Bristol, UK. Inclusion criteria: (a) ≥ 18 years of age, (b) regular cigarette smoker of ≥ 10 cigarettes/d, (c) wants to stop smoking, (d) able to give informed consent to participate, (e) able to complete study questionnaires, alone or with assistance Exclusion criteria: (a) cigar, pipe, and oral tobacco users who do not also smoke ≥ 10 cigarettes/d, (b) contraindications to NRT use, (c) pregnant or lactating women and those who plan to become pregnant during the course of treatment, (d) previous severe adverse reactions to NRT patch or to oral NRT, (e) currently taking medication for smoking cessation that they are unwilling to stop, (f) taking medication with a known influence on smoking cessation that they should not stop (e.g. nortriptyline for depression), (g) non‐English speakers, (h) those deemed unsuitable for the study by their primary care physicians | |
| Interventions | DNA‐tailored oral NRT dose (N = 315) Nicotine dependence‐tailored NRT dose (N = 318) Participants were randomly allocated on a 1:1 basis to 1 of 2 groups: (a) NRT oral dose tailored by DNA analysis (OPRM1 gene) (genotype), or (b) NRT oral dose tailored by nicotine dependence questionnaire score (phenotype). All participants were offered behavioural support and an NRT patch, tailored for all participants by phenotype (daily cigarettes smoked). Trial interventions comprised communication that the prescribed dose of oral NRT was based on either genotype (intervention) or phenotype (comparison). Support for behavioural change was based on withdrawal‐oriented therapy and was provided for all participants twice before quit day and weekly thereafter until 4 weeks after quitting, then once more 8 weeks after quitting. | |
| Outcomes | Primary outcomes: adherence to prescription of NRT over 28 days, motivation to make further quit attempts Secondary outcomes: adherence to prescription of NRT over 7 days, 6‐month abstinence | |
| Funding source | “This study was funded as part of a grant from the Medical Research Council, UK (Risk communication in preventive medicine: Optimising the impact of DNA risk information; G0500274 PI: TMM). The trial protocol was peer reviewed by the Council. PA is funded by a personal award from the National Institute of Health Research (NIHR) and by the UK Centre for Tobacco Control Studies (UKCTCS). PA and MRM are members of UKCTCS, a UKCRC Public Health Research Centre of Excellence. Funding from British Heart Foundation, Cancer Research UK, Economic and Social Research Council, Medical Research Council, and National Institute for Health Research, under the auspices of the UK Clinical Research Collaboration, is gratefully acknowledged. The sponsors and funders had no role in study design, data collection and analysis, decision to publish, or preparation of the manuscript.” | |
| Declaration of interest | “PA has done consultancy and research on smoking cessation for pharmaceutical companies. The remaining authors declare that they have no conflicts of interest.” | |
| Notes | DNA samples were collected at study entry. | |
| Risk of bias | ||
| Bias | Authors' judgement | Support for judgement |
| Random sequence generation (selection bias) | Low risk | “The trial statistician generated the sequences and received the stratifier data and participant and family identifier required to randomise participants, and participant date of birth to confirm group allocation at trial closure.” |
| Allocation concealment (selection bias) | Low risk | Before group assignment, allocation was concealed. |
| Blinding of participants and personnel (performance bias) | High risk | Randomisation sequence was revealed sequentially and was concealed from the study team, nurses, and participants. After assignment to groups, allocation was no longer blinded. |
| Blinding of outcome assessment (detection bias) | Low risk | Blinding was appropriate, and the outcome of the study was objective. |
| Incomplete outcome data (attrition bias) | Low risk | Loss to follow‐up was modest and balanced, and all participants were analysed by intention‐to‐treat. |
| Selective reporting (reporting bias) | Low risk | Trial protocol was pre‐registered and was published before the results paper, which reported prespecified outcomes. |
| Other bias | Low risk | The trial and its outcomes were reported openly. |
| Methods | Open‐label behavioural intervention and placebo‐controlled pharmacotherapy intervention randomised clinical trial Study period: January 2001 to October 2003 | |
| Participants | N = 463 Participants were smokers seeking treatment recruited through mass media and screened by 3 rounds (telephone, group orientation, office visit). Inclusion criteria: aged 18 years or older who reported smoking ≥ 10 cigarettes/d and whose expired carbon monoxide (CO) levels exceeded 9 ppm. Participants reported being motivated to quit smoking (3 or 4 on a 4‐point self‐report scale) and being willing to fulfil study requirements. Exclusion criteria: serious psychopathology (bipolar disorder or psychosis), current depression, contraindications to use of bupropion SR (e.g. uncontrolled hypertension, history of seizure disorder, history of eating disorders, current heavy drinking, risk of pregnancy, current breastfeeding). Participants were excluded if their score on the Center for Epidemiologic Studies Depression (CES‐D) scale was above 16, except when an interview with a licensed clinician suggested that symptoms were related to a cause other than clinical depression. | |
| Interventions | Active (bupropion SR) pharmacotherapy and individual targeted counseling (n = 113) Active pharmacotherapy, general counseling (N = 116) Placebo pharmacotherapy, individual targeted counseling (N = 121) Placebo pharmacotherapy, general counseling (N = 113) Participants attended 5 office visits in the 3 weeks before the quit date. Participants received 9 weeks of study pills (active or placebo), to begin 1 week before and to end 8 weeks after the planned quit date. Participants attended another 8 office visits over the 8 weeks following the quit date (provided breath samples at each visit and a blood sample at baseline and at end of treatment), then completed 10 monthly follow‐up calls. All participants received education regarding medication use and adherence, quit day information, and general encouragement, and completed electronic diaries for 2 weeks before and 4 weeks after the quit date. Participants randomised to individual targeted counseling received eight 10‐minute individual counseling sessions (2 prequit, 1 quit day, 5 postquit over 4 weeks). | |
| Outcomes | Primary outcomes: electronic diary and retrospective report of lapse and of relapse (7 days) with 7‐day point prevalence abstinence confirmed via CO at each office visit and cotinine testing at end of treatment; 7‐day point prevalence abstinence at 6 and 12 months with CO testing Secondary outcomes: prolonged abstinence outcomes at end of treatment, at 6 and 12 months | |
| Funding source | This work was supported by Transdisciplinary Tobacco Use Research Center grants CA084724 from the National Cancer Institute and DA19706 from the National Institute on Drug Abuse. GlaxoSmithKline provided complimentary active and placebo medication used in this study. GlaxoSmithKline was not involved in the design, data collection, analysis, or reporting of this study. | |
| Declaration of interest | DEJ has received research support from Nabi Biopharmaceutical and Pfizer, Inc., and consulting fees from Nabi Biopharmaceutical. SS serves as consultant to GlaxoSmithKline Consumer Healthcare on an exclusive basis regarding over‐the‐counter smoking cessation products and is a partner in a company that is developing a new nicotine medication. He is a cofounder of invivodata, Inc., which provides electronic diary services for clinical research. In 1998 the University of Wisconsin appointed MCF to a named Chair made possible by an unrestricted gift to the university from GlaxoWellcome. | |
| Notes | This work did not report analyses of pharmacogenetics, but these were reported in Bergen 2013. | |
| Risk of bias | ||
| Bias | Authors' judgement | Support for judgement |
| Random sequence generation (selection bias) | Low risk | Randomisation via random number list |
| Allocation concealment (selection bias) | Unclear risk | Study pills did not differ in appearance between active and placebo but were packaged in containers before enrolment of participants. Randomisation was done via a random number list. |
| Blinding of participants and personnel (performance bias) | Unclear risk | Research staff and participants were blind to pharmacotherapy randomisation but were not blind to counseling randomisation. |
| Blinding of outcome assessment (detection bias) | Low risk | Outcome assessment was done by electronic diary through end of treatment, and by interview (self‐report), performed in office or by phone calls, with biochemical abstinence verified at each office visit (CO) and at 6 and 12 months (cotinine). Discordance between reports or verification methods analysed in multiple ways, but final prevalences highly similar |
| Incomplete outcome data (attrition bias) | Low risk | Attrition was substantial and did not differ by treatment arm at quit, end of treatment, or any other follow‐up point. Attrition was related to various covariates included in abstinence models in the primary paper. |
| Selective reporting (reporting bias) | Low risk | Primary and secondary outcomes were reported. |
| Other bias | High risk | DNA samples were provided for 41% of self‐identified whites for analysis of pharmacogenetics. Most (˜ 99%) DNA samples were successfully genotyped. Analyses of pharmacogenetics in Bergen 2013 are distributed equally among treatment groups, so selection bias is unlikely in this sample. |
| Methods | Double‐blind parallel‐group placebo and active treatment‐controlled randomised clinical trial Study period: study dates not reported | |
| Participants | N = 647 Participants were healthy cigarette smokers. Recruitment methods not reported Inclusion criteria: 18 to 65 years of age, smoke ≥ 10 cigarettes/d Exclusion criteria: treatment with an investigational drug within the previous month; major depression within the prior year; panic disorder, psychosis, or bipolar disorder; use of nicotine replacement or bupropion within the previous 3 months; cardiovascular disease; clinically significant medical disease; drug or alcohol abuse or dependence within the past year; use of tobacco products other than cigarettes or marijuana within the previous month | |
| Interventions | 0.5 mg twice‐daily non‐titrated varenicline (n = 129) 0.5 mg twice‐daily titrated varenicline (n = 130) 1.0 mg twice‐daily non‐titrated varenicline (n = 129) 1.0 mg twice‐daily titrated varenicline (n = 130) Placebo (n = 129) Participants received study medication for 12 weeks. Specifically, participants in each of these groups received the following medication: 0.5 mg twice daily non‐titrated (i.e. 0.5 mg twice daily for 12 weeks); 0.5 mg twice daily titrated (i.e. 0.5 mg once daily for 7 days, then 0.5 mg twice daily for 11 weeks); 1.0 mg twice daily non‐titrated (i.e. 1.0 mg twice daily for 12 weeks); 1.0 mg twice daily titrated (i.e. 0.5 mg once daily for 3 days, then 0.5 mg twice daily for 4 days, then 1.0 mg twice daily for 11 weeks); or placebo (i.e. 2 placebo tablets twice daily for 12 weeks). All participants received a smoking cessation booklet at the baseline visit and brief smoking cessation counseling (up to 10 minutes) at each visit. | |
| Outcomes | Primary outcomes: carbon monoxide–confirmed 4‐week continuous quit rate for weeks 4 through 7 and weeks 9 through 12 during treatment and continuous abstinence rates for weeks 9 through 52 for each dose relative to placebo. Continuous abstinence was defined as self‐report of no cigarette use during the specified time period confirmed by an exhaled carbon monoxide measurement ≤ 10 ppm Other outcomes: carbon monoxide–confirmed 7‐day point prevalence abstinence, changes in the Minnesota Nicotine Withdrawal Scale and the modified Cigarette Evaluation Questionnaire, carbon monoxide–confirmed 7‐day point prevalence abstinence at weeks 24 and 52 | |
| Funding source | Pfizer Inc. provided funding for this study. Pfizer Inc. was involved in all elements of this study, including, but not limited to, study design and monitoring. | |
| Declaration of interest | Dr Oncken has received research grants, consulting fees, and honoraria from Pfizer; nicotine replacement and placebo products from GlaxoSmithKline at no cost for smoking cessation studies; and honoraria from Pri‐Med. Dr Gonzales has received research contracts, consulting fees, and honoraria from Pfizer, Sanofi‐Aventis, and GlaxoSmithKline, and owns 5 shares of Pfizer stock that he received as a gift from his parents. Dr Rennard has had or currently has a number of relationships with companies that provide products and/or services relevant to outpatient management of chronic obstructive pulmonary disease. These relationships include serving as a consultant (for Adams, Almirall, Altana, Array Biopharma, AstraZeneca, Aventis, Biolipox, Centocor, Dey, Critical Therapeutics, GlaxoSmithKline, Johnson & Johnson, Merck, Novartis, Ono Pharma, Otsuka, RJ Reynolds, Roche, Sankyo, Schering‐Plough, Scios, and Wyeth), advising regarding clinical trials (Altana, AstraZeneca, Aventis, Centocor, GlaxoSmithKline, Novartis, Pfizer, and Philip Morris), speaking at continuing medical education programs and performing funded research at both basic and clinical levels (Altana, AstraZeneca, Boehringer Ingelheim, GlaxoSmithKline, and Novartis). He does not own any stock in any pharmaceutical companies. Dr Nides has received research grants, consulting fees, and honoraria from Pfizer, Sanofi‐Avenits, and GlaxoSmithKline. Drs Watsky and Reeves and Messrs Billing and Anziano are employees of Pfizer and own Pfizer stock or hold Pfizer stock options. | |
| Notes | Analysis of pharmacogenetics was reported in King 2012. | |
| Risk of bias | ||
| Bias | Authors' judgement | Support for judgement |
| Random sequence generation (selection bias) | Unclear risk | No details reported |
| Allocation concealment (selection bias) | Unclear risk | No details reported |
| Blinding of participants and personnel (performance bias) | Low risk | Participants and investigators were blinded to study drug treatment assignment. Participants were not encouraged to guess their treatment assignment. |
| Blinding of outcome assessment (detection bias) | Low risk | Blinding was appropriate, and the outcome of the study was objective. |
| Incomplete outcome data (attrition bias) | Unclear risk | More dropout in the placebo group and specific dropout for lack of efficacy occurred more often in the 1.0 mg twice‐daily titrated varenicline group. Dropouts were assumed to be smoking. |
| Selective reporting (reporting bias) | Unclear risk | No protocol was found. |
| Other bias | Low risk | Additional analyses of pharmacogenetics were conducted in King 2012 in a subset of the original randomised trial population, but baseline characteristics were comparable between treatment groups, so selection bias seems unlikely. |
| Methods | Double‐blind placebo‐controlled combination pharmacotherapy intervention randomised clinical trial. Ten cohorts of participants were randomised in a block manner to 3 intervention arms. Study period: January 2001 to October 2002 | |
| Participants | N = 608 Participants were smokers seeking treatment who were recruited through mass media. Inclusion criteria: 18 years of age or older, who reported smoking ≥ 10 cigarettes/d and being motivated to quit (3 or 4 on a 4‐point self‐report scale). Exclusion criteria: expired carbon monoxide (CO) levels < 10 ppm; CES‐D score > 16; suicidality; contraindications to use of bupropion SR (e.g. uncontrolled hypertension, history of seizure disorder, history of eating disorders, current heavy drinking, current breastfeeding). Female participants were not pregnant and agreed to prevent pregnancy during treatment. | |
| Interventions | Active (bupropion SR) pharmacotherapy and active nicotine gum (4 mg as needed up to 12 mg/d) (n = 228) Active bupropion pharmacotherapy and placebo gum (N = 224) Placebo pharmacotherapy and placebo gum (N = 156) Participants attended a baseline screening (physical exam, questionnaires to assess medical/psychological exclusions, and nicotine dependence inventories), were randomised to 1 of 3 intervention arms for 9 weeks of treatment. After the baseline visit, participants attended office visits each week for 4 weeks, then every other week for 4 weeks (through the end of treatment). Participants received three 10‐minute counseling sessions (at baseline, quit day, and first post‐quit day weeks), providing medication instruction and Public Health Service Guideline elements. At remaining office visits, participants completed questionnaires and vital sign assessment and received medications. Participants completed a daily diary through treatment and used a cell phone for 2 weeks to collect real‐time data. Participants were followed monthly by telephone (smoking calendar and symptoms) to 6 months and 12 months. | |
| Outcomes | Primary outcome: 7‐day point prevalence abstinence at 6 months confirmed via CO (breath) or cotinine (blood) analysis Secondary outcomes: 7‐day point prevalence abstinence at 1 week post quit, at end of treatment, and at 12 months (12‐month abstinence confirmed via CO (breath) or cotinine (blood) analysis), continuous abstinence | |
| Funding source | This work was supported by Transdisciplinary Tobacco Use Research Center grants CA084724 from the National Cancer Institute and DA019706 from the National Institute on Drug Abuse. | |
| Declaration of interest | Dr Fiore neither consults for nor accepts honoraria from the pharmaceutical industry, effective 1 January 2006. In 1998 the University of Wisconsin appointed Dr Fiore to a named chair, made possible by an unrestricted gift to the university from GlaxoWellcome. Dr Baker has received monies from pharmaceutical companies (Nabi, Glaxo, Pfizer, Sanofi) to conduct clinical trials; he has received no personal remuneration from these companies. | |
| Notes | This work did not report analyses of pharmacogenetics, but these were reported in Bergen 2013. | |
| Risk of bias | ||
| Bias | Authors' judgement | Support for judgement |
| Random sequence generation (selection bias) | Unclear risk | No description |
| Allocation concealment (selection bias) | Unclear risk | No description |
| Blinding of participants and personnel (performance bias) | Low risk | Research staff and participants were blind to pharmacotherapy randomisation. |
| Blinding of outcome assessment (detection bias) | Low risk | Outcome assessment was done by daily diary and by self‐report through end of treatment, and by self‐report through the remaining 12 months, with biochemical abstinence verified at 6 and 12 months. |
| Incomplete outcome data (attrition bias) | Low risk | Attrition was moderate and did not differ by treatment arm at quit, at end of treatment, and at 6 and 12 months. |
| Selective reporting (reporting bias) | Low risk | Primary and secondary outcomes were reported. |
| Other bias | Unclear risk | DNA samples were provided for 60% of self‐identified white trial participants for analysis of pharmacogenetics. Most (˜ 99%) DNA samples were successfully genotyped. Analyses of pharmacogenetics are distributed equally among treatment groups in Bergen 2013, so selection bias is unlikely in this sample. |
| Methods | Double‐blind placebo‐controlled single and combination pharmacotherapy intervention randomised clinical trial Study period: September 2004 to August 2010 | |
| Participants | N = 1504 Participants were smokers seeking treatment who were recruited through mass media. Inclusion criteria: 18 years of age or older who reported smoking ≥ 10 cigarettes/dfor the past 6 months, expired CO > 9 ppm, motivated to quit (3 or 4 on a 4‐point self‐report scale), able to read and write English, and willing to complete assessments Exclusion criteria: using any form of tobacco other than cigarettes, currently taking bupropion, or having a current psychosis or schizophrenia diagnosis. In addition, participants were excluded if they had medical contraindications for any of the study medications, including high alcohol consumption (6 drinks/d on 6 or 7 days of the week), a history of seizure, high blood pressure (> 160/100 mm Hg), bipolar disorder, an eating disorder, a recent cardiac event, or allergies to any of the medications. Only 1 person per household could participate. Finally, pregnant and breastfeeding women were not eligible for participation; eligible female participants had to agree to take steps to prevent pregnancy during the medication treatment phase of the study. | |
| Interventions | Active (bupropion SR) pharmacotherapy for 9 weeks ‐ 1 week prequit, 8 weeks post quit (n = 264) Nicotine lozenge (2 or 4 mg for 12 weeks post quit) (n = 260) Nicotine patch (24‐hour patch 21, 14, and 7 mg over 8 weeks post quit) (n = 262) Nicotine patch (8 weeks post quit) plus nicotine lozenge (12 weeks post quit) (n = 267) Active bupropion pharmacotherapy plus nicotine lozenge (n = 262) Placebo pharmacotherapy (placebo bupropion, placebo lozenge, placebo patch, placebo patch plus lozenge, and placebo bupropion plus lozenge) (n = 189) Participants attended 5 baseline (prequit) screenings (physical exam, questionnaires to assess medical/psychological exclusions, and nicotine dependence inventories, and cardiovascular assessments). Participants were randomised to 1 of 6 intervention arms for 9 to 12 weeks of treatment at the fifth baseline visit. Participants attended study visits on their quit day and 1, 2, 4, and 8 weeks post quit, and received six 10‐ to 20‐minute counseling sessions at the third and fifth baseline visits, on their quit day, and at weeks 1, 2, and 4. | |
| Outcomes | Primary outcome: 7‐day point prevalence abstinence at 1 week post quit, at end of treatment, and at 6 months post quit, confirmed via CO (breath) analysis Secondary outcomes: initial cessation, days to lapse, days to relapse, latency to relapse after lapse | |
| Funding source | This research was conducted at the University of Wisconsin–Madison and was supported by grant P50 DA019706 from the National Institute on Drug Abuse and by grant M01 RR03186 from the General Clinical Research Centers Program of the National Center for Research Resources. Dr Piper was supported by an Institutional Clinical and Translational Science Award, University of Wisconsin–Madison (KL2 grant 1KL2RR025012‐01). Medication was provided to participants at no cost under a research agreement with GlaxoSmithKline. | |
| Declaration of interest | Study authors report the following potential conflicts of interest for the past 5 years: Dr Smith has received research support from Elan Corporation. Dr Baker has served as an investigator on research projects sponsored by pharmaceutical companies, including Sanofi‐Synthelabo, Pfizer Inc., and Nabi Biopharmaceuticals. Dr Jorenby has received research support from the National Institute on Drug Abuse, the National Cancer Institute, Pfizer Inc., Sanofi‐Synthelabo, and Nabi Biopharmaceuticals. He has received support for educational activities from the National Institute on Drug Abuse and the Veterans Administration, and consulting fees from Nabi Biopharmaceuticals. Dr Fiore has received honoraria from Pfizer. He has served as an investigator on research studies at the University of Wisconsin that were funded by Pfizer, Sanofi‐ Synthelabo, GlaxoSmithKline, and Nabi Biopharmaceuticals. In 1998, the University of Wisconsin appointed Dr Fiore to a named chair funded by an unrestricted gift to University of Wisconsin from Glaxo Wellcome. | |
| Notes | This work did not report analyses of pharmacogenetics, but these were reported in Bergen 2013. | |
| Risk of bias | ||
| Bias | Authors' judgement | Support for judgement |
| Random sequence generation (selection bias) | Unclear risk | Blocked on sex and self‐reported race but no other description |
| Allocation concealment (selection bias) | Low risk | Allocation was concealed until the moment of randomisation (3 different types of pharmacotherapy). |
| Blinding of participants and personnel (performance bias) | Low risk | Research staff and participants were blind to active vs placebo pharmacotherapy randomisation. |
| Blinding of outcome assessment (detection bias) | Low risk | Outcome assessment was done by self‐report, with biochemical (CO) verification at 6 and 12 months. |
| Incomplete outcome data (attrition bias) | Low risk | Attrition was very modest and did not differ by treatment arm during treatment or follow‐up. |
| Selective reporting (reporting bias) | Low risk | Primary and secondary outcomes were reported. |
| Other bias | Low risk | DNA samples were provided for 83% of self‐identified white trial participants for analysis of pharmacogenetics. Most (˜ 99%) DNA samples were successfully genotyped. Pharmacogenetic analyses are distributed equally amongst treatment groups in Bergen 2013, so selection bias is unlikely in these arms and subsamples. |
| Methods | Randomised double‐blind parallel‐arm placebo‐controlled factorial trial with 2 levels of nicotine dependence and 2 nicotine doses Setting: academic centre, USA Recruitment: community volunteers Study period: not reported; August 2007 to May 2009 according to clinicaltrials.gov | |
| Participants | N = 479 43.4% males; average age: ˜ 44; average cigarettes/d: 24 Inclusion criteria (as reported in clincatrials.gov): “18‐65 years old, smokers of at least 10 cigarettes per day for three cumulative or continuous years of a brand that delivers at least 0.5 mg nicotine, have an expired air carbon monoxide reading of at least 10 ppm, and express a desire to quit smoking. Additionally, subjects must express a willingness to switch to denicotinized cigarettes.” Exclusion criteria (as reported in clincatrials.gov): “Participants with hypertension or hypotension may, however, be allowed to participate in the study if the study physician or P.A. determines that the condition is stable, controlled by medication, and in no way jeopardizes the individual's safety. Subjects with no previous diagnosis of hypertension may have a screening blood pressure up to 160/100. Potential subjects who report coronary heart disease; heart attack; cardiac rhythm disorder (irregular heart rhythm); chest pains (unless history, exam, and EKG clearly indicate a non‐cardiac source); cardiac (heart) disorder (including but not limited to valvular heart disease, heart murmur, heart failure); history of skin allergy; active skin condition (psoriasis) within the last five years; skin disorder except minor skin conditions (including but not limited to facial acne, minor localized infections, and superficial minor wounds.); liver or kidney disorder (except kidney stones, gallstones); gastrointestinal problems or disease other than gastroesophageal reflux or heartburn; ulcers; lung disorder (including but not limited to COPD, emphysema, and asthma); brain abnormality (including but not limited to, stroke, brain tumour, seizure disorder); history of fainting; problems giving blood samples; difficulty passing urine; diabetes treated with insulin, non‐insulin treated diabetes (unless glucose is less than 180mg/dcl and HbA1c is less than 7%); current cancer or treatment for cancer in the past 6 months (except basal or squamous cell skin cancer); other major medical condition; current psychiatric disease (with the exception of depression, anxiety disorders, OCD and ADHD) will be excluded from the study. Potential subjects who do not have a self reported diagnosis of the above listed conditions may be excluded if the study physician or P.A. determines that the history, physical findings, EKG, or laboratory studies reveal information that may jeopardize the subject's safe study participation.” | |
| Interventions | Nicotine patch 21 mg/24 h vs 42 mg/24 h in low vs high nicotine dependence groups Treatment groups: (a) less dependent/21 mg nicotine patch, (b) less dependent/42 mg nicotine patch, (c) more dependent/21 mg nicotine patch, and (d) more dependent/42 mg nicotine patch | |
| Outcomes | Primary outcome: continuous abstinence from target quit date through end of treatment (10 weeks) Secondary outcomes: 4‐week continuous abstinence during weeks 7 to 10 after target quit date; 7‐day point abstinence at 6 months | |
| Funding source | National Institutes of Health (NIH), Intramural Research Program, National Institute on Drug Abuse, Department of Health and Social Services; grant to Duke University from Philip Morris USA, Richmond, VA, USA | |
| Declaration of interest | G.R. Uhl and J.E. Rose are listed as inventors for a patent application filed by Duke University based on genomic markers that distinguishes successful quitters from unsuccessful quitters in data from other clinical trials. Rose is the Principal Investigator for a grant from Philip Morris USA, Richmond, VA, USA, to Duke University; the company had no role in planning or execution of the study, data analysis, or publication of results. | |
| Notes | This study provides analysis of pharmacogenetics. | |
| Risk of bias | ||
| Bias | Authors' judgement | Support for judgement |
| Random sequence generation (selection bias) | Unclear risk | Insufficient information |
| Allocation concealment (selection bias) | Unclear risk | Double‐blind design but no further details provided |
| Blinding of participants and personnel (performance bias) | Unclear risk | Double‐blind design but no further details provided |
| Blinding of outcome assessment (detection bias) | Unclear risk | Double‐blind design but no further details provided |
| Incomplete outcome data (attrition bias) | Unclear risk | Reasons for withdrawal not reported |
| Selective reporting (reporting bias) | Low risk | Protocol available at clinicaltrials.gov (NCT00734617); no deviations from prespecified endpoints |
| Methods | Parallel randomised double‐blind placebo‐controlled trial Setting: academic centre, USA Recruitment: community volunteers Study period: October 2004 to March 2008 | |
| Participants | N = 575 44.7% females; average age: 44.8; average cigarettes/d: 21.2 Inclusion criteria: age 18 to 65 years, smoked ≥ 10 cigarettes/d for at least the past year Exclusion criteria: pregnancy or lactation, uncontrolled hypertension, unstable angina, heart attack or stroke within previous 6 months, recent diagnosis of cancer or kidney or liver failure, history of organ transplantation, current diabetes, drug or alcohol dependence, history of Axis I psychiatric disorder, current use of a concomitant medication, or current treatment of nicotine addiction | |
| Interventions | Transdermal nicotine (21 mg) for 8 weeks and placebo for 16 weeks (standard therapy) (n = 287) vs transdermal nicotine (21 mg) for 24 weeks (extended therapy) (n = 288) Behavioural counseling was provided to both groups at weeks ‐2, 0, 1, 4, 8, 12, 16, and 20. | |
| Outcomes | Primary outcome: self‐reported and biochemically confirmed 7‐day point prevalence abstinence at weeks 24 and 52 Secondary outcomes: self‐reported continuous abstinence; prolonged abstinence; time to relapse; incremental cost per additional quitter by treatment group at week 24 Also evaluated: side effects; adherence | |
| Funding source | Transdisciplinary Tobacco Use Research Center Grant from the National Cancer Institute and the National Institute on Drug Abuse at the National Institutes of Health | |
| Declaration of interest | Dr Lerman has served as a consultant to GlaxoSmithKline ‐ one company that manufactures the nicotine patch. She has also served as a consultant for or has received research funding from AstraZeneca, Pfizer, and Novartis. Financial support for this study was not provided by an industry sponsor. Dr Lerman had full access to the data and had full responsibility for the decision to submit for publication. | |
| Notes | Analyses of pharmacogenetics are reported in Gold 2012 and Lerman 2010. | |
| Risk of bias | ||
| Bias | Authors' judgement | Support for judgement |
| Random sequence generation (selection bias) | Low risk | Computer‐based randomisation; non‐stratified randomisation scheme was generated by sampling without replacement and by using small blocks of 20 participants. |
| Allocation concealment (selection bias) | Low risk | A computer programme linked randomisation to the patch supply, and only the database manager could link identification to treatment allocation. |
| Blinding of participants and personnel (performance bias) | Low risk | Participants and all study personnel, except for the database manager, were blinded to randomisation. |
| Blinding of outcome assessment (detection bias) | Low risk | Participants and all study personnel, except for the database manager, were blinded to randomisation. |
| Incomplete outcome data (attrition bias) | Low risk | Completion rates at 52 weeks: 83% for extended therapy; 79% for standard therapy |
| Selective reporting (reporting bias) | Low risk | Protocol available at ClinicalTrials.gov (registration number: NCT00364156); no deviations from prespecified outcomes identified |
| Other bias | Low risk | Analyses of pharmacogenetics were conducted only in Caucasians. Distribution seems balanced between treatment groups because of randomisation. |
| Methods | Double‐blind randomised clinical trial Setting: community hospital, China Recruitment: community volunteers Study period: March to December 2004 | |
| Participants | N = 249 93.5% males; average age: 41; average cigarettes/d: 23 Inclusion criteria: (a) Han Chinese 20 to 70 years of age who lived in the Haidian District of Beijing; (b) had to be motivated to stop smoking; (c) smoked C10 cigarettes/d and smoked for C3 years; (d) presented with carbon monoxide (CO) level C10 ppm in exhaled air; (e) provided written informed consent and able to take part in assessment Exclusion criteria: psychiatric disorder, alcohol abuse, and other drug abuse (per DSM‐IV); pathological changes in the floor of the mouth; cardiovascular disease; taking psychotropic medications; using other forms of tobacco or any other NRT products during the past 6 months; pregnant or breastfeeding | |
| Interventions | Nicotine sublingual tablet (NST) vs placebo “Smokers were recommended to use one or two tablets (4 mg of nicotine) per hour, up to a maximum of 20 tablets per day. Subjects were advised to use the full treatment dose for 4 weeks (minimum of 15 tablets and maximum of 20 tablets per day). After this time‐point, treatment could be tapered off up to the 8‐week visit. During the next 4‐week follow‐up phase, no further medication was dispensed.” “In addition, all participants received six sessions of standardized behavioral group counseling focusing on self‐ monitoring and behavioral modification approaches.” | |
| Outcomes | Continuous, self‐reported complete abstinence for ≥ 7 days, verified by exhaled CO level < 10 ppm | |
| Funding source | National Natural Science Foundation of China; Training Program Foundation for Excellent Talents by the Beijing Municipal Government, China; Stanley Medical Research Institute; Department of Veterans Affairs, Mental Illness Research, Education and Clinical Center (MIRECC); US National Institutes of Health | |
| Declaration of interest | Not reported | |
| Notes | This study provides analysis of pharmacogenetics. | |
| Risk of bias | ||
| Bias | Authors' judgement | Support for judgement |
| Random sequence generation (selection bias) | Low risk | Use of a computer‐generated randomisation scheme operated by a senior data manager |
| Allocation concealment (selection bias) | Low risk | “Allocation was concealed from the investigator who delivered the interventions and assessed the outcomes.” |
| Blinding of participants and personnel (performance bias) | Low risk | Double‐blind design |
| Blinding of outcome assessment (detection bias) | Low risk | Interviewers were blinded. |
| Incomplete outcome data (attrition bias) | Unclear risk | Numbers and reasons for missing participants are not given. |
| Selective reporting (reporting bias) | Unclear risk | No relevant details on protocol availability |
| Methods | Open‐label randomised trial Setting: HMO, USA Recruitment: volunteers from Group Health Cooperative (GHC) membership Study duration: April 1998 to May 1999 | |
| Participants | N = 1524 57% females; average age: 45; average cigarettes/d: ˜ 23 Inclusion criteria: at least 18 years of age, smoked ≥ 10 cigarettes/d, were motivated to stop smoking, were otherwise in good general health, had sufficient verbal and written command of English to provide informed consent and study responses, and were enrolled and planned to stay enrolled in GHC for the next 12 months Exclusion criteria: (1) any predisposition to seizure, as defined by a personal or family history of a seizure disorder, such as epilepsy, or a personal history of febrile seizures; (2) history of stroke or transient ischaemic attack; (3) history of head injury resulting in loss of consciousness for longer than 1 hour; (4) current use of medications contraindicated to bupropion SR or known to lower the seizure threshold (complete list available on request); (5) history of or current diagnosis of anorexia nervosa or bulimia; (6) being of poor general health, as defined by the presence of severe and chronic cardiovascular disease (including myocardial infarction within the previous 3 months), severe and chronic pulmonary disease, renal or hepatic dysfunction, neurological disease, uncontrolled hypertension, or uncontrolled diabetes mellitus; (7) participation in GHC's Free & Clear (FC) smoking cessation programme in the previous 12 months (1 of the treatments included in the present study); (8) current depression; (9) current drinking of 14 or more alcoholic drinks/week and/or binge drinking 2 or more times in the past month; and (10) current pregnancy or plans to become pregnant or current nursing of a child | |
| Interventions | Factorial design crossing 2 drug doses with 2 intensities of behavioural counseling: 150 mg bupropion SR with less intensive counseling (n = 382) or with more intensive counseling (n = 4381); or 300 mg bupropion SR with less intensive counseling (n = 4383) or with more intensive counseling (n = 4378) Free & Clear proactive telephone counseling (4 brief calls), access to quit‐line and S‐H materials vs Zyban Advantage Program (ZAP) tailored S‐H materials, single telephone call after TQD, access to Zyban support line Prescription was mailed. No face‐to‐face contact during enrolment or Rx | |
| Outcomes | Primary outcomes: self‐reported point prevalence 7‐day non‐smoking status at 3 and 12 months following target quit date Secondary outcomes: adverse and abstinence effects reported since beginning of treatment with bupropion SR | |
| Funding source | US National Cancer Institute | |
| Declaration of interest | Study authors have no relevant financial interests and have received no financial support or medication from GlaxoSmithKline. | |
| Notes | Analyses of pharmacogenetics are reported in Swan 2005 and Swan 2007. | |
| Risk of bias | ||
| Bias | Authors' judgement | Support for judgement |
| Random sequence generation (selection bias) | Low risk | “Open‐label randomized trial. The computer code for the procedure calculated probabilities of group assignment that were dynamically modified based on the number of members in each group so that final group sizes were equal. No restrictions such as stratification or blocking were used as part of the randomization process.” |
| Allocation concealment (selection bias) | Low risk | Procedure using a random number generator was built into study database. |
| Blinding of participants and personnel (performance bias) | High risk | Study was not blinded. |
| Blinding of outcome assessment (detection bias) | High risk | Study was not blinded. |
| Incomplete outcome data (attrition bias) | Low risk | Follow‐up at 12 months: 83% intervention; 88% control |
| Selective reporting (reporting bias) | Unclear risk | No relevant information reported |
| Other bias | High risk | Participants who responded at 12‐month follow‐up (n = 1299) were invited to participate in the ‘genetic factors’ supplemental study; 496 (50%) actually provided samples. |
| Methods | Open‐label randomised behavioural intervention clinical trial Study period: October 2005 to June 2008 | |
| Participants | N = 1202 Participants were smokers seeking treatment who were recruited through health plan advertisements, physician referrals, and a commercial smoking cessation plan’s advertisements. Inclusion criteria: age ≥ 18 years, reported smoking ≥ 10 cigarettes/d for 12 months and ≥ 5 cigarettes/d for the past week, with dependable telephone and Internet access; were financially eligible for smoking cessation services under their health plan and medically eligible for varenicline treatment Exclusion criteria: current pregnancy, plans to become pregnant during the medication treatment period, or breastfeeding; self‐report of poor health; severe or chronic heart disease; severe COPD; on dialysis with recent creatinine values > 3; current self‐reported diagnosis of or treatment for psychotic disorder; concurrent use of bupropion or nicotine replacement therapy; current use of recreational or street drugs; current drinking of ≥ 14 alcoholic drinks/week or binge drinking ≥ 2 times in the past month; current use of cimetidine, metformin, phenformin, pindolol, or procainamide; and recent participation in 2 specific smoking cessation programmes | |
| Interventions | Varenicline and Proactive Telephone Counseling (PTC, n = 402) Varenicline and Web (N = 401) Varenicline, PTC and Web (N = 399) All randomised participants received a prescription for 12 weeks of varenicline, a 5‐ to 10‐minute orientation call, printed Quit Guides including recommended guidelines for varenicline, and access to a toll‐free telephone call in line for ad hoc calls. PTC arm participants received up to 5 phone calls. Web arm participants had online access to an interactive online programme modified from PTC content. PTC and Web arm participants received calls that encouraged them to use Web programme tools. | |
| Outcomes | Primary outcome: self‐reported 7‐day and 30‐day point prevalence abstinence at 3 months and at 6 months after the targeted quit day Secondary outcomes: probable side effects (6) and probable abstinence effects (9) at 3 months after the targeted quit day | |
| Funding source | This work was supported by Grant R01CA071358 from the National Cancer Institute. Pfizer provided varenicline and nominal support for recruiting participants. | |
| Declaration of interest | SMZ owns stock in Free & Clear, Inc.; GES received financial support from Pfızer to attend a 1‐day advisory meeting in 2008, and a small grant from Pfızer to support recruitment and study intake. | |
| Notes | This paper did not provide analyses of pharmacogenetics, but these were reported in Bergen 2013. | |
| Risk of bias | ||
| Bias | Authors' judgement | Support for judgement |
| Random sequence generation (selection bias) | Low risk | Automated algorithm |
| Allocation concealment (selection bias) | Unclear risk | No data on which to make a judgement (method of concealment not described) |
| Blinding of participants and personnel (performance bias) | Low risk | Participants and staff were not blinded to treatment assignment. Differences between treatments were obvious to both participants and personnel. |
| Blinding of outcome assessment (detection bias) | Low risk | Outcome assessment was done by self‐report, which was performed through follow‐up calls. Those who could not be contacted were assumed to be smoking. |
| Incomplete outcome data (attrition bias) | Unclear risk | Although missing outcome data were substantial (˜ 25% for 3‐month and 6‐month follow‐up), missing outcome data were balanced in numbers across intervention groups. In this trial, self‐report was not biochemically confirmed. |
| Selective reporting (reporting bias) | Low risk | Primary and secondary outcomes were reported. |
| Other bias | Unclear risk | Biospecimen collection was done post hoc; 47% of the trial population provided a biospecimen after a multiple‐step consent and exclusion process. Data show a highly significant difference in abstinence prevalence in the sample available for pharmacogenetic analysis vs the overall trial population (55% vs 44%, P = 1E‐5 at 3 months; 43% vs 33% at 6 months, P = 1E‐4). Most (˜ 94%) samples collected were genotyped. Pharmacogenetic analyses were conducted in self‐identified whites only in Bergen 2013, distributed equally among treatment groups. |
| Methods | Randomised open‐label trial of bupropion SR or nicotine patch in adult male and female smokers Setting: community hospital, Spain Recruitment period: 2007 to 2010 (months not indicated) | |
| Participants | N = 76 "Heavy smokers" 100% were genotyped Inclusion criteria: (a) to be enrolled in a ‘standard’ (12‐week duration) smoking cessation programme with nicotine substitutive treatment (NST) or bupropion following medical criteria, (b) smoking history > 10 cigarettes/d and > 10 packs/y, and (c) > 3 scores in the Fagerstrom test for nicotine dependence (FTND) Exclusion criteria: not defined | |
| Interventions | Bupropion (N = 34) NRT (N = 36) Doses of bupropion SR provided were 150 mg once per day for days 1 to 6, followed by 150 mg twice per day for days 7 to 84), for 12 weeks For NRT, doses were as follows: (1) for smokers ≥ 20 cigarettes/d, Nicotinell TTS 30 (4 weeks), Nicotinell TTS 20 (4 weeks), and Nicotinell TTS 10 (4 weeks); (2) for smokers < 20 cigarettes/d, Nicotinell TTS 20 (4 weeks), Nicotinell TTS 20 (4 weeks), and Nicotinell TTS 10 (4 weeks) | |
| Outcomes | 12‐Month post‐treatment prolonged abstinence; abstinence rate was measured at 3, 6, 9, and 12 months during follow‐up visits. Biochemical verification was not mentioned. | |
| Funding source | Research was supported by the UEM 03‐2006 Internal Project of European University of Madrid and by the 035‐2006 Project of the Spanish Lung Foundation (SEPAR). | |
| Declaration of interest | No competing interests | |
| Notes | 6 candidate polymorphisms in CYP2A6, 5‐HTT, and HTR2A genes were genotyped. | |
| Risk of bias | ||
| Bias | Authors' judgement | Support for judgement |
| Random sequence generation (selection bias) | High risk | Random sequence generation was not mentioned in the paper. |
| Allocation concealment (selection bias) | High risk | Open‐label design |
| Blinding of participants and personnel (performance bias) | High risk | Open‐label design |
| Blinding of outcome assessment (detection bias) | Unclear risk | No mention of blinding of outcomes |
| Incomplete outcome data (attrition bias) | Unclear risk | No frequencies of abstinence outcomes reported; thus no way to confirm reporting of outcomes for all participants |
| Selective reporting (reporting bias) | Unclear risk | Outcomes were not described transparently; thus one cannot confirm whether selective outcome reporting occurred. |
| Other bias | Unclear risk | Only 3 CYP2A6 alleles were genotyped. Therefore, *1 allele calls are likely overrepresented. SLC6A4 5‐HTTLPR "L" and "S" are not defined. |
| Methods | Placebo‐controlled double‐dummy randomised trial of bupropion SR vs nortriptyline or placebo for smoking cessation in patients at risk for chronic obstructive pulmonary disease (COPD) or with COPD Study period: March 2002 to August 2003 | |
| Participants | N = 255 Inclusion criteria: (a) current daily smokers at risk for COPD or with COPD, (b) 30 to 70 years of age, (c) smoking history ≥ 5 years, (d) smoked on average ≥ 10 cigarettes/d during the past year, and (e) were motivated to stop smoking Exclusion criteria: (a) having used or were still using bupropion SR or nortriptyline; (b) were using NRT or (c) psychoactive medication at the time of assessment; and (d) had any serious or unstable medical disorders that might affect lung function or for which bupropion SR or nortriptyline was contraindicated | |
| Interventions | Bupropion SR (N = 86) Nortriptyline (N = 80) Placebo (N = 89) Eligible individuals were randomly assigned in a 1:1 ratio to receive the following: (1) bupropion SR, 150 mg once daily, for days 1 through 6, followed by 150 mg twice daily for days 7 through 84; (2) nortriptyline, 25 mg once daily, for days 1 through 3, followed by 50 mg once daily for days 3 through 7, then 75 mg once daily for days 8 through 84; or (3) placebo. At the baseline visit, the target quit date (TQD) was set for the second week, usually day 11 from the start of medication. | |
| Outcomes | Primary outcomes: prolonged abstinence from smoking from week 4 to week 26 after the target quit date. Prolonged abstinence was defined as a participant’s report of 0 cigarettes/d (not even a puff ) during weeks 4 through 26, confirmed by urinary cotinine values ≤ 60 ng/mL at weeks 4, 12, and 26 after TQD. Participants were allowed to miss 1 in‐person visit but not the last follow‐up visit. Secondary outcomes: prolonged abstinence during weeks 4 through 12 and 7‐day point prevalence abstinence (defined as having smoked 0 cigarettes, not even a puff, for the previous 7 days) at weeks 4, 12, and 26, confirmed by urinary cotinine levels ≤ 60 ng/mL | |
| Funding source | This work has been supported by a grant from the Netherlands Organization for Health Research and Development (ZonMW, The Hague; Project no. 50–50101‐96–404). The original trial was funded by grants of the Dutch Asthma Foundation (NAF grant no. 3.2.00.21) and the Health Research and Development Council (ZorgOnderzoek Nederland, grant no. 2200.0111), the Netherlands. Lundbeck B.V. provided active nortriptyline free of charge. Lundbeck B.V. as well as GlaxoSmithKline B.V. did not play a role in the design and conduct of the study, nor in interpretation and analysis of the data and the decision to submit for publication. | |
| Declaration of interest | “CPVS has received financing (grants, consultancy and/or travel/accommodation costs) from AstraZeneca, Boehringer Ingelheim, and Pfizer, unrelated to this study. DSP has received financing (grants, consultancy, and/or travel/accommodation costs) from Chiesi, GlaxoSmithKline, AstraZeneca, Nycomed, and Boehringer Ingelheim, unrelated to this study. MQ, EJW, FJVS declare no conflict of interest.” | |
| Notes | The original study did not report pharmacogenetic outcomes. 214/255 (84%) participants in the original clinical trial were genotyped. Results were published in a subsequent pharmacogenetic paper (Quaak 2012). | |
| Risk of bias | ||
| Bias | Authors' judgement | Support for judgement |
| Random sequence generation (selection bias) | Low risk | Randomisation was computer generated. |
| Allocation concealment (selection bias) | Low risk | Randomisation list by a pharmacist, stratified by COPD severity |
| Blinding of participants and personnel (performance bias) | Low risk | Participants and research staff were blinded to treatment assignment. |
| Blinding of outcome assessment (detection bias) | Low risk | “No patient, research nurse, counselor, investigator, or any other staff member was aware of the treatment assignments for the duration of the study.” |
| Incomplete outcome data (attrition bias) | Low risk | All participants were included in analyses. |
| Selective reporting (reporting bias) | Low risk | Primary outcomes were reported. |
| Other bias | Low risk | 214/255 (84%) participants in the original clinical trial were genotyped, with results subsequently published. See ‘Notes’ above. |
| Methods | Double‐blind placebo‐controlled trial Pilot study Setting: (not specified), USA Recruitment: community volunteers Study period: not reported | |
| Participants | N = 78 Inclusion criteria: male and female white smokers of European descent, at least 18 years of age, who were smoking ≥ 10 cigarettes/d for ≥ 5 years and were in generally good physical and mental health Exclusion criteria: not reported | |
| Interventions | Rimonabant 20 mg/d (n = 48) vs placebo (n = 28) for 10 weeks | |
| Outcomes | Smoking status; exhaled CO level | |
| Funding source | This study reports analysis of pharmacogenetics. | |
| Declaration of interest | Pharmacology Research Institute and laboratory of one of the study authors at the University of California Los Angeles (UCLA) | |
| Notes | Not reported | |
| Risk of bias | ||
| Bias | Authors' judgement | Support for judgement |
| Random sequence generation (selection bias) | Unclear risk | No relevant information reported |
| Allocation concealment (selection bias) | Unclear risk | No relevant information reported |
| Blinding of participants and personnel (performance bias) | Unclear risk | Double‐blind design but no other information reported |
| Blinding of outcome assessment (detection bias) | Unclear risk | Double‐blind design but no other information reported |
| Incomplete outcome data (attrition bias) | Unclear risk | Not reported |
| Selective reporting (reporting bias) | Unclear risk | No information on protocol availability reported |
| Other bias | Unclear risk | Distribution of ethnicities between treatment groups unclear |
| Methods | Double‐blind parallel‐group placebo‐controlled randomised clinical trial Study period: June 2006 to February 2008 | |
| Participants | N = 420 Inclusion criteria: over 18 years of age; daily consumption of ≥ 15 cigarettes in the past 3 years and average daily consumption of 10 cigarettes the week before study inclusion; life expectancy of ≥ 1 year; conscious and approachable; able to read and sign an informed consent form; Dutch‐ or French‐speaking; expected duration of hospitalisation ≥ 72 hours; treating physician and anaesthetist agree on the patient’s study inclusion Exclusion criteria: already using NS within 14 days before study inclusion; use of tobacco products other than cigarettes; alcohol abuse of > 5 U/d; simultaneous use of psychoactive drugs or hallucinogens; referred from other hospitals; existing contraindications for NS use; predicted postoperative ICU stay longer than 48 hours; pregnant or lactating | |
| Interventions | 15 minutes counseling + placebo patch (n = 210) 15 minutes counseling + nicotine transdermal patch (n = 210) Participants received a nicotine transdermal patch at a 15 mg/16 hours dose, daily, for maximum 7 days after hospital admission (study inclusion), or a placebo patch for the same study duration. | |
| Outcomes | Primary outcome: total addiction score, calculated from the Minnesota questionnaires, taken up at randomisation, after ≥ 72 hours of hospital admission and after a maximum of 7 treatment days Additional outcomes: point prevalence of quit rate at short (7 days) and long term (6 months) | |
| Funding source | Study was conducted through a grant from the Foundation of Scientific Research (FWO number G.0604.06), Vlaamse Liga tegen Kanker, and an independent research grant from McNeil AB, Helsingborg, Sweden. | |
| Declaration of interest | Apart from the funding source, study authors report no other relevant affiliations or financial involvement with any organisation or entity with a financial interest in or financial conflict with the subject matter or materials discussed in the manuscript, apart from those disclosed. | |
| Notes | All information from this study is extracted from the study protocol; thus information regarding sample size should be interpreted as the initial target rather than the actual number of recruited participants. Analysis of pharmacogenetics is reported in De Ruyck 2010. | |
| Risk of bias | ||
| Bias | Authors' judgement | Support for judgement |
| Random sequence generation (selection bias) | Low risk | Randomisation was performed via an online‐available registration and randomisation website. |
| Allocation concealment (selection bias) | Unclear risk | Randomisation occurred online, but it is unclear whether allocation was properly concealed. |
| Blinding of participants and personnel (performance bias) | Unclear risk | Active and placebo medications were identical in appearance, and the study is labeled as double‐blind. No additional details are presented. |
| Blinding of outcome assessment (detection bias) | Unclear risk | Outcome is subjective and can be influenced by study participants. |
| Incomplete outcome data (attrition bias) | Unclear risk | Final study report not available |
| Selective reporting (reporting bias) | Unclear risk | Final study report not available |
| Other bias | Unclear risk | Final study report not available |
BUP: bupropion; CBTD: cognitive‐behavioural treatment for depression; CES‐D: Center for Epidemiologic Studies Depression Scale; CO: carbon monoxide; DSM‐IV: Diagnostic and Statistical Manual for Mental Disorders, Fourth Edition; DSM‐IV‐TR, Diagnostic and Statistical Manual for Mental Disorders, Fourth Edition, Text Revision; EOT: end of therapy; FTND: Fagerstrom Test of Nicotine Dependence; GHC: Group Health Cooperative; HE: health education; ITT: intention‐to‐treat analysis; MAO: monoamine oxidase; MAOI: monoamine oxidase inhibitor; MI: myocardial infarction; MINI: Mini‐International Neuropsychiatric Interview; NARSAD: National Alliance for Research on Schizophrenia and Depression; NIAAA: National Institute on Alcohol Abuse and Alcoholism; NIDA: National Institute on Drug Abuse; NIHR: National Institute on Health Research; NRT: nicotine replacement therapy; NST: nicotine sublingual tablet; PCA: Principal Component Analysis; PLAC: placebo; PPA: point prevalence abstinence; ppm: parts per million; SR: sustained‐release; ST: standard treatment; TQD: target quit date; UKCRC: UK Clinical Research Collaboration; UKCTCS: UK Centre for Tobacco Control Studies.
Characteristics of excluded studies [ordered by study ID]
Ir a:
| Study | Reason for exclusion |
| Primary paper was not a randomised controlled trial (RCT). | |
| Pharmacogenetic analyses presented results from pooled (not individual) allelotyping (Drgon 2009). This investigation analysed results from Becker 2008 (no data available). | |
| Pharmacogenetic analyses presented results from pooled (not individual) allelotyping (Uhl 2008). This investigation analysed results from Lerman 2002, Lerman 2004, David 2007, and Uhl 2007 (no data available). |
Data and analyses
| Outcome or subgroup title | No. of studies | No. of participants | Statistical method | Effect size |
| 1 Six‐Month Abstinence Show forest plot | 3 | 1597 | Risk Ratio (M‐H, Random, 95% CI) | 1.42 [1.16, 1.75] |
| Analysis 1.1  Comparison 1 Active NRT vs placebo ‐ rs1051730 ‐ non‐Hispanic white, Outcome 1 Six‐Month Abstinence. | ||||
| 1.1 Homozygous Major | 3 | 659 | Risk Ratio (M‐H, Random, 95% CI) | 1.27 [0.93, 1.72] |
| 1.2 Heterozygous | 3 | 731 | Risk Ratio (M‐H, Random, 95% CI) | 1.48 [1.08, 2.01] |
| 1.3 Homozygous Minor | 3 | 207 | Risk Ratio (M‐H, Random, 95% CI) | 2.07 [1.06, 4.01] |
| 2 End of Treatment Show forest plot | 2 | 1391 | Risk Ratio (M‐H, Random, 95% CI) | 1.63 [1.14, 2.32] |
| Analysis 1.2  Comparison 1 Active NRT vs placebo ‐ rs1051730 ‐ non‐Hispanic white, Outcome 2 End of Treatment. | ||||
| 2.1 Homozygous Major | 2 | 582 | Risk Ratio (M‐H, Random, 95% CI) | 1.09 [0.85, 1.41] |
| 2.2 Heterozygous | 2 | 631 | Risk Ratio (M‐H, Random, 95% CI) | 2.13 [1.52, 2.97] |
| 2.3 Homozygous Minor | 2 | 178 | Risk Ratio (M‐H, Random, 95% CI) | 2.18 [1.04, 4.58] |
| Outcome or subgroup title | No. of studies | No. of participants | Statistical method | Effect size |
| 1 End of Treatment Show forest plot | 2 | 1127 | Risk Ratio (M‐H, Random, 95% CI) | 1.38 [0.97, 1.98] |
| Analysis 2.1  Comparison 2 Active NRT vs placebo ‐ rs16969968 ‐ non‐Hispanic white, Outcome 1 End of Treatment. | ||||
| 1.1 Homozygous Major | 2 | 449 | Risk Ratio (M‐H, Random, 95% CI) | 1.01 [0.77, 1.33] |
| 1.2 Heterozygous | 2 | 550 | Risk Ratio (M‐H, Random, 95% CI) | 1.85 [1.33, 2.59] |
| 1.3 Homozygous Minor | 2 | 128 | Risk Ratio (M‐H, Random, 95% CI) | 1.80 [0.45, 7.23] |
| Outcome or subgroup title | No. of studies | No. of participants | Statistical method | Effect size |
| 1 Six‐Month Abstinence Show forest plot | 2 | 709 | Risk Ratio (M‐H, Random, 95% CI) | 1.11 [0.55, 2.26] |
| Analysis 3.1  Comparison 3 Active NRT vs placebo ‐ rs16969968 ‐ non‐Hispanic black or African American, Outcome 1 Six‐Month Abstinence. | ||||
| 1.1 Homozygous Major | 2 | 637 | Risk Ratio (M‐H, Random, 95% CI) | 1.47 [1.07, 2.03] |
| 1.2 Heterozygous or Homozygous Minor | 2 | 72 | Risk Ratio (M‐H, Random, 95% CI) | 0.43 [0.15, 1.26] |
| 2 End of Treatment Show forest plot | 2 | 709 | Risk Ratio (M‐H, Random, 95% CI) | 1.03 [0.36, 2.94] |
| Analysis 3.2  Comparison 3 Active NRT vs placebo ‐ rs16969968 ‐ non‐Hispanic black or African American, Outcome 2 End of Treatment. | ||||
| 2.1 Homozygous Major | 2 | 637 | Risk Ratio (M‐H, Random, 95% CI) | 1.57 [1.15, 2.15] |
| 2.2 Heterozygous or Homozygous Minor | 2 | 72 | Risk Ratio (M‐H, Random, 95% CI) | 0.29 [0.10, 0.86] |
| Outcome or subgroup title | No. of studies | No. of participants | Statistical method | Effect size |
| 1 End of Treatment Show forest plot | 2 | 923 | Risk Ratio (M‐H, Random, 95% CI) | 1.33 [1.04, 1.71] |
| Analysis 4.1  Comparison 4 Active NRT vs placebo ‐ rs 588765 ‐ non‐Hispanic white, Outcome 1 End of Treatment. | ||||
| 1.1 Homozygous Major | 2 | 296 | Risk Ratio (M‐H, Random, 95% CI) | 1.39 [0.89, 2.16] |
| 1.2 Heterozygous | 2 | 469 | Risk Ratio (M‐H, Random, 95% CI) | 1.27 [0.89, 1.79] |
| 1.3 Homozygous Minor | 2 | 158 | Risk Ratio (M‐H, Random, 95% CI) | 1.50 [0.74, 3.06] |
| Outcome or subgroup title | No. of studies | No. of participants | Statistical method | Effect size |
| 1 Six‐Month Abstinence Show forest plot | 2 | 708 | Risk Ratio (M‐H, Random, 95% CI) | 1.18 [0.75, 1.87] |
| Analysis 5.1  Comparison 5 Active NRT vs placebo ‐ rs2036527 ‐ non‐Hispanic black or African American, Outcome 1 Six‐Month Abstinence. | ||||
| 1.1 Homozygous Major | 2 | 425 | Risk Ratio (M‐H, Random, 95% CI) | 1.95 [0.46, 8.26] |
| 1.2 Heterozygous or Homozygous Minor | 2 | 283 | Risk Ratio (M‐H, Random, 95% CI) | 0.90 [0.40, 2.03] |
| 2 End of Treatment Show forest plot | 2 | 708 | Risk Ratio (M‐H, Random, 95% CI) | 1.22 [0.77, 1.93] |
| Analysis 5.2  Comparison 5 Active NRT vs placebo ‐ rs2036527 ‐ non‐Hispanic black or African American, Outcome 2 End of Treatment. | ||||
| 2.1 Homozygous Major | 2 | 425 | Risk Ratio (M‐H, Random, 95% CI) | 2.39 [0.43, 13.35] |
| 2.2 Heterozygous or Homozygous Minor | 2 | 283 | Risk Ratio (M‐H, Random, 95% CI) | 0.89 [0.55, 1.46] |
| Outcome or subgroup title | No. of studies | No. of participants | Statistical method | Effect size |
| 1 Six‐Month Abstinence Show forest plot | 2 | 900 | Risk Ratio (M‐H, Random, 95% CI) | 1.44 [1.08, 1.92] |
| Analysis 6.1  Comparison 6 Active NRT vs placebo ‐ DRD4 (exon 3 48 bp) ‐ non‐Hispanic white, Outcome 1 Six‐Month Abstinence. | ||||
| 1.1 Homozygous Major | 2 | 566 | Risk Ratio (M‐H, Random, 95% CI) | 1.34 [0.93, 1.93] |
| 1.2 Heterozygous | 2 | 290 | Risk Ratio (M‐H, Random, 95% CI) | 1.76 [1.00, 3.10] |
| 1.3 Homozygous Minor | 2 | 44 | Risk Ratio (M‐H, Random, 95% CI) | 1.28 [0.40, 4.11] |
| 2 End of Treatment Show forest plot | 2 | 900 | Risk Ratio (M‐H, Random, 95% CI) | 1.20 [0.88, 1.63] |
| Analysis 6.2  Comparison 6 Active NRT vs placebo ‐ DRD4 (exon 3 48 bp) ‐ non‐Hispanic white, Outcome 2 End of Treatment. | ||||
| 2.1 Homozygous Major | 2 | 566 | Risk Ratio (M‐H, Random, 95% CI) | 1.22 [0.59, 2.51] |
| 2.2 Heterozygous | 2 | 290 | Risk Ratio (M‐H, Random, 95% CI) | 1.40 [0.57, 3.39] |
| 2.3 Homozygous Minor | 2 | 44 | Risk Ratio (M‐H, Random, 95% CI) | 1.02 [0.65, 1.58] |
| Outcome or subgroup title | No. of studies | No. of participants | Statistical method | Effect size |
| 1 Six‐Month Abstinence Show forest plot | 2 | 1417 | Risk Ratio (M‐H, Random, 95% CI) | 1.51 [1.08, 2.10] |
| Analysis 7.1  Comparison 7 Active NRT vs placebo ‐ NMR ‐ non‐Hispanic black and white, Outcome 1 Six‐Month Abstinence. | ||||
| 1.1 Slow NMR | 2 | 628 | Risk Ratio (M‐H, Random, 95% CI) | 1.82 [1.12, 2.94] |
| 1.2 Normal NMR | 2 | 789 | Risk Ratio (M‐H, Random, 95% CI) | 1.21 [0.78, 1.87] |
| 2 End of Treatment Show forest plot | 2 | 1417 | Risk Ratio (M‐H, Random, 95% CI) | 1.51 [1.19, 1.90] |
| Analysis 7.2  Comparison 7 Active NRT vs placebo ‐ NMR ‐ non‐Hispanic black and white, Outcome 2 End of Treatment. | ||||
| 2.1 Slow NMR | 2 | 847 | Risk Ratio (M‐H, Random, 95% CI) | 1.61 [1.18, 2.20] |
| 2.2 Normal NMR | 2 | 570 | Risk Ratio (M‐H, Random, 95% CI) | 1.49 [0.85, 2.60] |
| Outcome or subgroup title | No. of studies | No. of participants | Statistical method | Effect size |
| 1 Six‐Month Abstinence Show forest plot | 4 | 1329 | Risk Ratio (M‐H, Random, 95% CI) | 1.34 [1.11, 1.61] |
| Analysis 8.1  Comparison 8 Bupropion vs placebo ‐ rs1051730 ‐ non‐Hispanic white, Outcome 1 Six‐Month Abstinence. | ||||
| 1.1 Homozygous Major | 4 | 495 | Risk Ratio (M‐H, Random, 95% CI) | 1.24 [0.94, 1.65] |
| 1.2 Heterozygous | 4 | 633 | Risk Ratio (M‐H, Random, 95% CI) | 1.44 [1.09, 1.91] |
| 1.3 Homozygous Minor | 4 | 201 | Risk Ratio (M‐H, Random, 95% CI) | 1.31 [0.57, 2.99] |
| 2 End of Treatment Show forest plot | 6 | 1379 | Risk Ratio (M‐H, Random, 95% CI) | 1.40 [1.19, 1.64] |
| Analysis 8.2  Comparison 8 Bupropion vs placebo ‐ rs1051730 ‐ non‐Hispanic white, Outcome 2 End of Treatment. | ||||
| 2.1 Homozygous Major | 6 | 496 | Risk Ratio (M‐H, Random, 95% CI) | 1.32 [1.05, 1.67] |
| 2.2 Heterozygous | 6 | 655 | Risk Ratio (M‐H, Random, 95% CI) | 1.36 [1.03, 1.79] |
| 2.3 Homozygous Minor | 6 | 228 | Risk Ratio (M‐H, Random, 95% CI) | 1.83 [1.20, 2.79] |
| Outcome or subgroup title | No. of studies | No. of participants | Statistical method | Effect size |
| 1 Six‐Month Abstinence Show forest plot | 2 | 124 | Risk Ratio (M‐H, Random, 95% CI) | 1.50 [0.75, 3.00] |
| Analysis 9.1  Comparison 9 Bupropion vs placebo ‐ rs1051730 ‐ non‐Hispanic black or African American, Outcome 1 Six‐Month Abstinence. | ||||
| 1.1 Homozygous Major | 2 | 92 | Risk Ratio (M‐H, Random, 95% CI) | 1.61 [0.71, 3.64] |
| 1.2 Heterozygous | 2 | 32 | Risk Ratio (M‐H, Random, 95% CI) | 1.30 [0.32, 5.34] |
| 2 End of Treatment Show forest plot | 3 | 157 | Risk Ratio (M‐H, Random, 95% CI) | 1.20 [0.70, 2.06] |
| Analysis 9.2 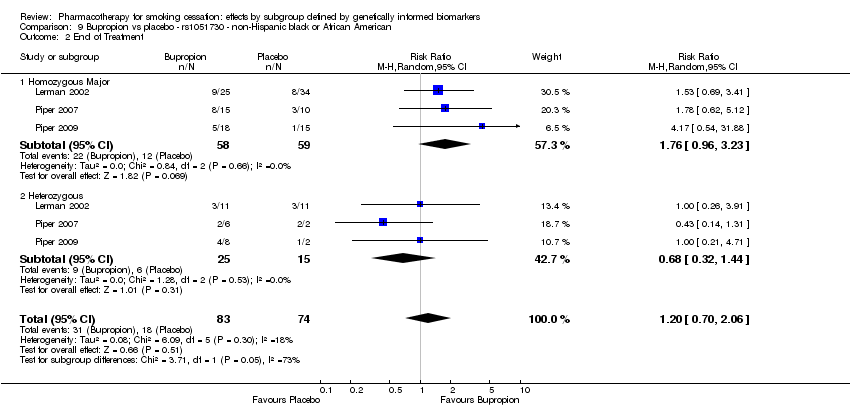 Comparison 9 Bupropion vs placebo ‐ rs1051730 ‐ non‐Hispanic black or African American, Outcome 2 End of Treatment. | ||||
| 2.1 Homozygous Major | 3 | 117 | Risk Ratio (M‐H, Random, 95% CI) | 1.76 [0.96, 3.23] |
| 2.2 Heterozygous | 3 | 40 | Risk Ratio (M‐H, Random, 95% CI) | 0.68 [0.32, 1.44] |
| Outcome or subgroup title | No. of studies | No. of participants | Statistical method | Effect size |
| 1 End of Treatment Show forest plot | 3 | 557 | Risk Ratio (M‐H, Random, 95% CI) | 1.42 [1.13, 1.77] |
| Analysis 10.1 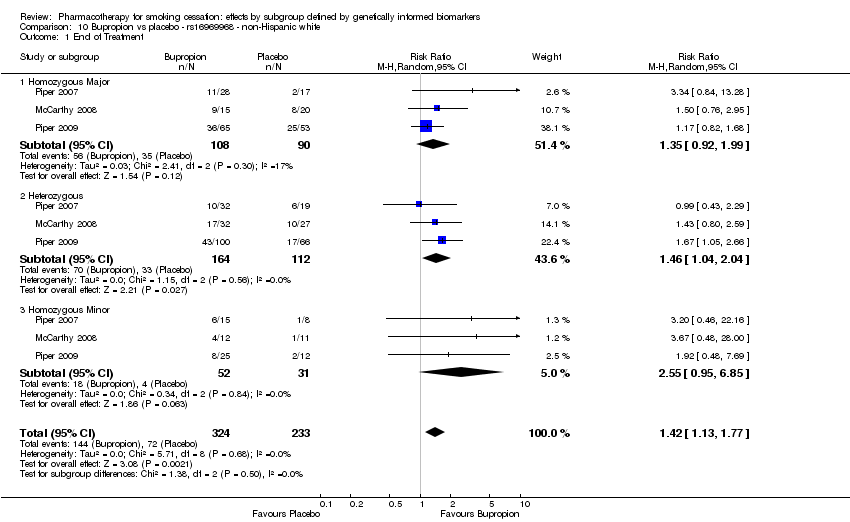 Comparison 10 Bupropion vs placebo ‐ rs16969968 ‐ non‐Hispanic white, Outcome 1 End of Treatment. | ||||
| 1.1 Homozygous Major | 3 | 198 | Risk Ratio (M‐H, Random, 95% CI) | 1.35 [0.92, 1.99] |
| 1.2 Heterozygous | 3 | 276 | Risk Ratio (M‐H, Random, 95% CI) | 1.46 [1.04, 2.04] |
| 1.3 Homozygous Minor | 3 | 83 | Risk Ratio (M‐H, Random, 95% CI) | 2.55 [0.95, 6.85] |
| Outcome or subgroup title | No. of studies | No. of participants | Statistical method | Effect size |
| 1 Six‐Month Abstinence Show forest plot | 2 | 578 | Risk Ratio (M‐H, Random, 95% CI) | 1.30 [0.84, 2.00] |
| Analysis 11.1  Comparison 11 Bupropion vs placebo ‐ rs16969968 ‐ non‐Hispanic black or African American, Outcome 1 Six‐Month Abstinence. | ||||
| 1.1 Homozygous Major | 2 | 512 | Risk Ratio (M‐H, Random, 95% CI) | 1.18 [0.75, 1.87] |
| 1.2 Heterozygous or Homozygous Minor | 2 | 66 | Risk Ratio (M‐H, Random, 95% CI) | 2.82 [0.76, 10.45] |
| 2 End of Treatment Show forest plot | 3 | 611 | Risk Ratio (M‐H, Random, 95% CI) | 1.95 [1.23, 3.08] |
| Analysis 11.2  Comparison 11 Bupropion vs placebo ‐ rs16969968 ‐ non‐Hispanic black or African American, Outcome 2 End of Treatment. | ||||
| 2.1 Homozygous Major | 3 | 541 | Risk Ratio (M‐H, Random, 95% CI) | 2.12 [1.44, 3.10] |
| 2.2 Heterozygous or Homozygous Minor | 3 | 70 | Risk Ratio (M‐H, Random, 95% CI) | 1.65 [0.33, 8.36] |
| Outcome or subgroup title | No. of studies | No. of participants | Statistical method | Effect size |
| 1 Six‐Month Abstinence Show forest plot | 4 | 1107 | Risk Ratio (M‐H, Random, 95% CI) | 1.37 [1.12, 1.67] |
| Analysis 12.1 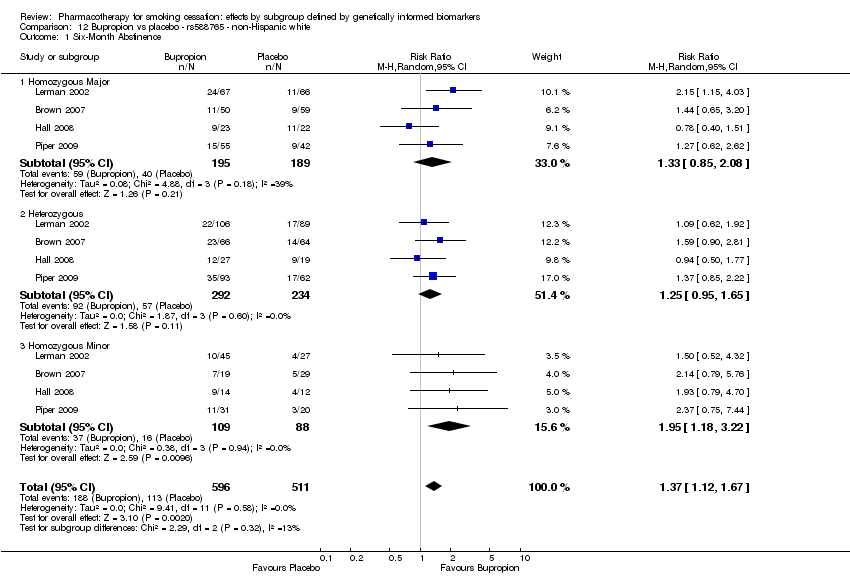 Comparison 12 Bupropion vs placebo ‐ rs588765 ‐ non‐Hispanic white, Outcome 1 Six‐Month Abstinence. | ||||
| 1.1 Homozygous Major | 4 | 384 | Risk Ratio (M‐H, Random, 95% CI) | 1.33 [0.85, 2.08] |
| 1.2 Heterozygous | 4 | 526 | Risk Ratio (M‐H, Random, 95% CI) | 1.25 [0.95, 1.65] |
| 1.3 Homozygous Minor | 4 | 197 | Risk Ratio (M‐H, Random, 95% CI) | 1.95 [1.18, 3.22] |
| 2 End of Treatment Show forest plot | 4 | 1107 | Risk Ratio (M‐H, Random, 95% CI) | 1.36 [1.13, 1.65] |
| Analysis 12.2 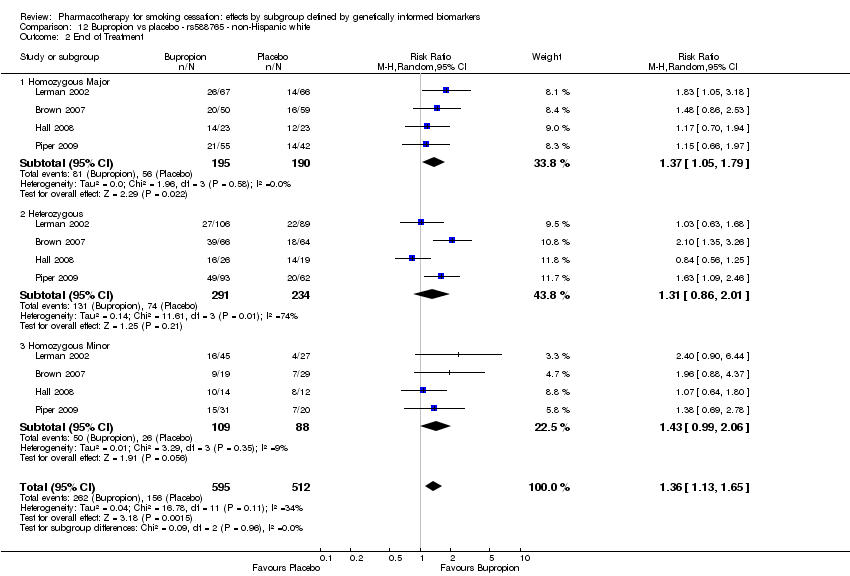 Comparison 12 Bupropion vs placebo ‐ rs588765 ‐ non‐Hispanic white, Outcome 2 End of Treatment. | ||||
| 2.1 Homozygous Major | 4 | 385 | Risk Ratio (M‐H, Random, 95% CI) | 1.37 [1.05, 1.79] |
| 2.2 Heterozygous | 4 | 525 | Risk Ratio (M‐H, Random, 95% CI) | 1.31 [0.86, 2.01] |
| 2.3 Homozygous Minor | 4 | 197 | Risk Ratio (M‐H, Random, 95% CI) | 1.43 [0.99, 2.06] |
| Outcome or subgroup title | No. of studies | No. of participants | Statistical method | Effect size |
| 1 Six‐Month Abstinence Show forest plot | 2 | 738 | Risk Ratio (M‐H, Random, 95% CI) | 1.40 [1.05, 1.86] |
| Analysis 13.1  Comparison 13 Bupropion vs placebo ‐ rs2036527 ‐ non‐Hispanic white, Outcome 1 Six‐Month Abstinence. | ||||
| 1.1 Homozygous Major | 2 | 260 | Risk Ratio (M‐H, Random, 95% CI) | 1.15 [0.73, 1.80] |
| 1.2 Heterozygous | 2 | 370 | Risk Ratio (M‐H, Random, 95% CI) | 1.43 [0.99, 2.06] |
| 1.3 Homozygous Minor | 2 | 108 | Risk Ratio (M‐H, Random, 95% CI) | 2.73 [1.02, 7.36] |
| 2 End of Treatment Show forest plot | 4 | 975 | Risk Ratio (M‐H, Random, 95% CI) | 1.43 [1.19, 1.73] |
| Analysis 13.2  Comparison 13 Bupropion vs placebo ‐ rs2036527 ‐ non‐Hispanic white, Outcome 2 End of Treatment. | ||||
| 2.1 Homozygous Major | 4 | 339 | Risk Ratio (M‐H, Random, 95% CI) | 1.37 [1.04, 1.80] |
| 2.2 Heterozygous | 4 | 482 | Risk Ratio (M‐H, Random, 95% CI) | 1.36 [1.04, 1.79] |
| 2.3 Homozygous Minor | 4 | 154 | Risk Ratio (M‐H, Random, 95% CI) | 2.64 [1.33, 5.25] |
| Outcome or subgroup title | No. of studies | No. of participants | Statistical method | Effect size |
| 1 Six‐Month Abstinence Show forest plot | 3 | 660 | Risk Ratio (M‐H, Random, 95% CI) | 1.30 [0.88, 1.92] |
| Analysis 14.1 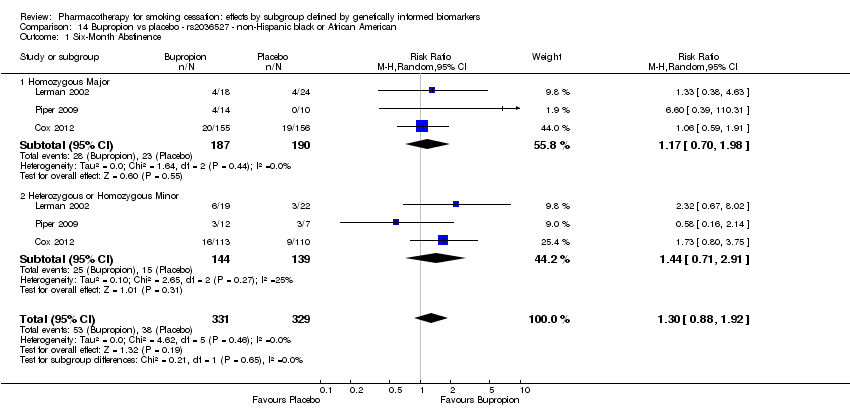 Comparison 14 Bupropion vs placebo ‐ rs2036527 ‐ non‐Hispanic black or African American, Outcome 1 Six‐Month Abstinence. | ||||
| 1.1 Homozygous Major | 3 | 377 | Risk Ratio (M‐H, Random, 95% CI) | 1.17 [0.70, 1.98] |
| 1.2 Heterozygous or Homozygous Minor | 3 | 283 | Risk Ratio (M‐H, Random, 95% CI) | 1.44 [0.71, 2.91] |
| 2 End of Treatment Show forest plot | 4 | 693 | Risk Ratio (M‐H, Random, 95% CI) | 1.87 [1.36, 2.56] |
| Analysis 14.2 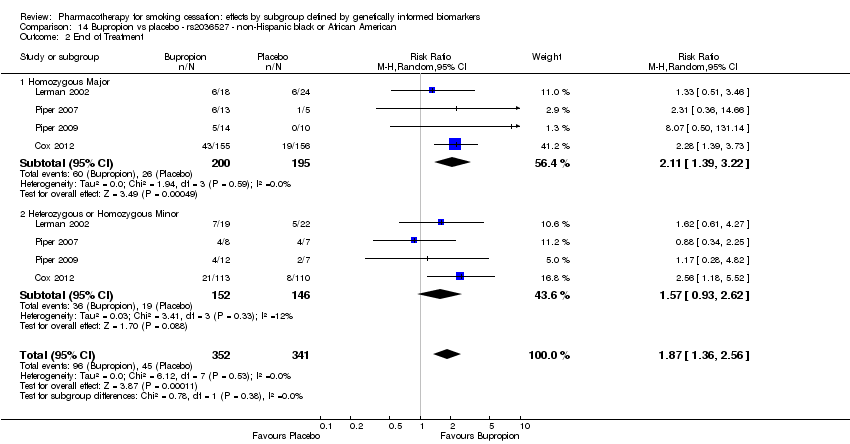 Comparison 14 Bupropion vs placebo ‐ rs2036527 ‐ non‐Hispanic black or African American, Outcome 2 End of Treatment. | ||||
| 2.1 Homozygous Major | 4 | 395 | Risk Ratio (M‐H, Random, 95% CI) | 2.11 [1.39, 3.22] |
| 2.2 Heterozygous or Homozygous Minor | 4 | 298 | Risk Ratio (M‐H, Random, 95% CI) | 1.57 [0.93, 2.62] |
| Outcome or subgroup title | No. of studies | No. of participants | Statistical method | Effect size |
| 1 Six‐Month Abstinence Show forest plot | 2 | 571 | Risk Ratio (M‐H, Random, 95% CI) | 1.41 [1.07, 1.87] |
| Analysis 15.1 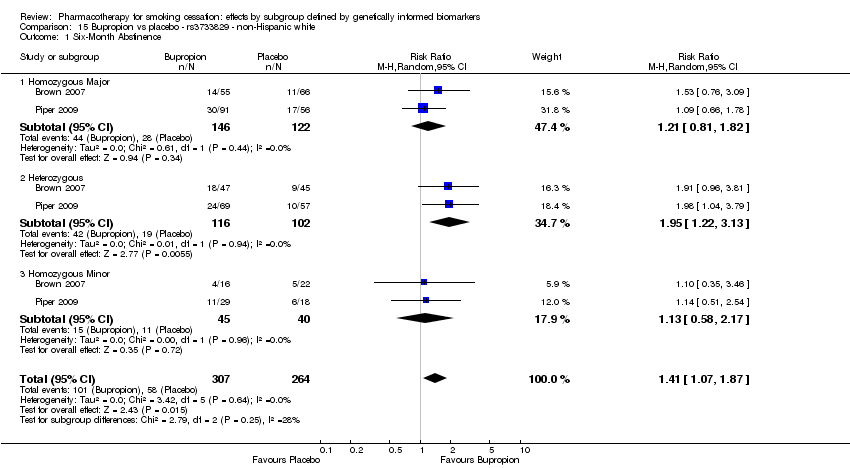 Comparison 15 Bupropion vs placebo ‐ rs3733829 ‐ non‐Hispanic white, Outcome 1 Six‐Month Abstinence. | ||||
| 1.1 Homozygous Major | 2 | 268 | Risk Ratio (M‐H, Random, 95% CI) | 1.21 [0.81, 1.82] |
| 1.2 Heterozygous | 2 | 218 | Risk Ratio (M‐H, Random, 95% CI) | 1.95 [1.22, 3.13] |
| 1.3 Homozygous Minor | 2 | 85 | Risk Ratio (M‐H, Random, 95% CI) | 1.13 [0.58, 2.17] |
| 2 End of Treatment Show forest plot | 4 | 807 | Risk Ratio (M‐H, Random, 95% CI) | 1.55 [1.29, 1.87] |
| Analysis 15.2  Comparison 15 Bupropion vs placebo ‐ rs3733829 ‐ non‐Hispanic white, Outcome 2 End of Treatment. | ||||
| 2.1 Homozygous Major | 4 | 367 | Risk Ratio (M‐H, Random, 95% CI) | 1.44 [1.11, 1.86] |
| 2.2 Heterozygous | 4 | 333 | Risk Ratio (M‐H, Random, 95% CI) | 1.69 [1.24, 2.30] |
| 2.3 Homozygous Minor | 4 | 107 | Risk Ratio (M‐H, Random, 95% CI) | 1.69 [0.96, 2.95] |
| Outcome or subgroup title | No. of studies | No. of participants | Statistical method | Effect size |
| 1 End of Treatment Show forest plot | 2 | 61 | Risk Ratio (M‐H, Random, 95% CI) | 1.51 [0.75, 3.04] |
| Analysis 16.1  Comparison 16 Bupropion vs placebo ‐ rs3733829 ‐ non‐Hispanic black or African American, Outcome 1 End of Treatment. | ||||
| 1.1 Homozygous Major | 2 | 61 | Risk Ratio (M‐H, Random, 95% CI) | 1.51 [0.75, 3.04] |
| Outcome or subgroup title | No. of studies | No. of participants | Statistical method | Effect size |
| 1 End of Treatment Show forest plot | 3 | 557 | Risk Ratio (M‐H, Random, 95% CI) | 1.42 [1.13, 1.78] |
| Analysis 17.1  Comparison 17 Bupropion vs placebo ‐ rs7937 ‐ non‐Hispanic white, Outcome 1 End of Treatment. | ||||
| 1.1 Homozygous Major | 3 | 159 | Risk Ratio (M‐H, Random, 95% CI) | 1.76 [1.13, 2.75] |
| 1.2 Heterozygous | 3 | 285 | Risk Ratio (M‐H, Random, 95% CI) | 1.30 [0.95, 1.76] |
| 1.3 Homozygous Minor | 3 | 113 | Risk Ratio (M‐H, Random, 95% CI) | 1.38 [0.82, 2.31] |
| Outcome or subgroup title | No. of studies | No. of participants | Statistical method | Effect size |
| 1 End of Treatment Show forest plot | 2 | 76 | Risk Ratio (M‐H, Random, 95% CI) | 1.56 [0.77, 3.18] |
| Analysis 18.1  Comparison 18 Bupropion vs placebo ‐ rs7937 ‐ non‐Hispanic black or African American, Outcome 1 End of Treatment. | ||||
| 1.1 Homozygous Major | 2 | 38 | Risk Ratio (M‐H, Random, 95% CI) | 1.70 [0.57, 5.10] |
| 1.2 Heterozygous or Homozygous Minor | 2 | 38 | Risk Ratio (M‐H, Random, 95% CI) | 1.57 [0.42, 5.84] |
| Outcome or subgroup title | No. of studies | No. of participants | Statistical method | Effect size |
| 1 End of Treatment Show forest plot | 3 | 559 | Risk Ratio (M‐H, Random, 95% CI) | 1.37 [1.07, 1.74] |
| Analysis 19.1 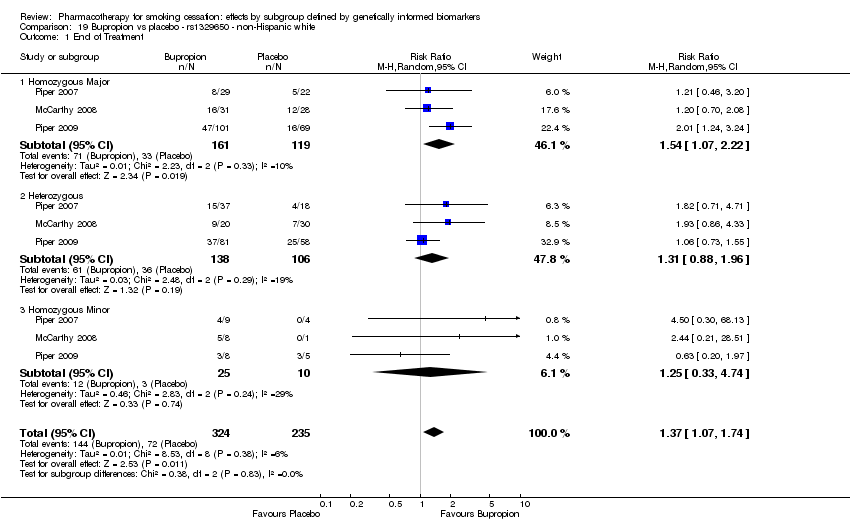 Comparison 19 Bupropion vs placebo ‐ rs1329650 ‐ non‐Hispanic white, Outcome 1 End of Treatment. | ||||
| 1.1 Homozygous Major | 3 | 280 | Risk Ratio (M‐H, Random, 95% CI) | 1.54 [1.07, 2.22] |
| 1.2 Heterozygous | 3 | 244 | Risk Ratio (M‐H, Random, 95% CI) | 1.31 [0.88, 1.96] |
| 1.3 Homozygous Minor | 3 | 35 | Risk Ratio (M‐H, Random, 95% CI) | 1.25 [0.33, 4.74] |
| Outcome or subgroup title | No. of studies | No. of participants | Statistical method | Effect size |
| 1 End of Treatment Show forest plot | 2 | 76 | Risk Ratio (M‐H, Random, 95% CI) | 1.44 [0.70, 2.99] |
| Analysis 20.1  Comparison 20 Bupropion vs placebo ‐ rs1329650 ‐ non‐Hispanic black or African American, Outcome 1 End of Treatment. | ||||
| 1.1 Homozygous Major | 2 | 63 | Risk Ratio (M‐H, Random, 95% CI) | 1.62 [0.67, 3.96] |
| 1.2 Heterozygous or Homozygous Minor | 2 | 13 | Risk Ratio (M‐H, Random, 95% CI) | 0.93 [0.15, 5.70] |
| Outcome or subgroup title | No. of studies | No. of participants | Statistical method | Effect size |
| 1 End of Treatment Show forest plot | 3 | 559 | Risk Ratio (M‐H, Random, 95% CI) | 1.39 [1.11, 1.74] |
| Analysis 21.1  Comparison 21 Bupropion vs placebo ‐ rs1028936 ‐ non‐Hispanic white, Outcome 1 End of Treatment. | ||||
| 1.1 Homozygous Major | 3 | 370 | Risk Ratio (M‐H, Random, 95% CI) | 1.54 [1.15, 2.06] |
| 1.2 Heterozygous | 3 | 175 | Risk Ratio (M‐H, Random, 95% CI) | 1.33 [0.75, 2.35] |
| 1.3 Homozygous Minor | 3 | 14 | Risk Ratio (M‐H, Random, 95% CI) | 1.60 [0.30, 8.49] |
| Outcome or subgroup title | No. of studies | No. of participants | Statistical method | Effect size |
| 1 End of Treatment Show forest plot | 2 | 76 | Risk Ratio (M‐H, Random, 95% CI) | 1.47 [0.68, 3.21] |
| Analysis 22.1  Comparison 22 Bupropion vs placebo ‐ rs1028936 ‐ non‐Hispanic black or African American, Outcome 1 End of Treatment. | ||||
| 1.1 Homozygous Major | 2 | 65 | Risk Ratio (M‐H, Random, 95% CI) | 1.77 [0.74, 4.20] |
| 1.2 Heterozygous or Homozygous Minor | 2 | 11 | Risk Ratio (M‐H, Random, 95% CI) | 0.67 [0.09, 4.77] |
| Outcome or subgroup title | No. of studies | No. of participants | Statistical method | Effect size |
| 1 End of Treatment Show forest plot | 3 | 558 | Risk Ratio (M‐H, Random, 95% CI) | 1.48 [1.18, 1.87] |
| Analysis 23.1  Comparison 23 Bupropion vs placebo ‐ rs215605 ‐ non‐Hispanic white, Outcome 1 End of Treatment. | ||||
| 1.1 Homozygous Major | 3 | 219 | Risk Ratio (M‐H, Random, 95% CI) | 1.77 [1.23, 2.55] |
| 1.2 Heterozygous | 3 | 259 | Risk Ratio (M‐H, Random, 95% CI) | 1.35 [0.98, 1.87] |
| 1.3 Homozygous Minor | 3 | 80 | Risk Ratio (M‐H, Random, 95% CI) | 1.12 [0.49, 2.55] |
| Outcome or subgroup title | No. of studies | No. of participants | Statistical method | Effect size |
| 1 End of Treatment Show forest plot | 2 | 76 | Risk Ratio (M‐H, Random, 95% CI) | 1.41 [0.54, 3.69] |
| Analysis 24.1  Comparison 24 Bupropion vs placebo ‐ rs215605 ‐ non‐Hispanic black or African American, Outcome 1 End of Treatment. | ||||
| 1.1 Homozygous Major | 2 | 49 | Risk Ratio (M‐H, Random, 95% CI) | 1.93 [0.15, 24.95] |
| 1.2 Heterozygous or Homozygous Minor | 2 | 27 | Risk Ratio (M‐H, Random, 95% CI) | 1.67 [0.46, 6.13] |
| Outcome or subgroup title | No. of studies | No. of participants | Statistical method | Effect size |
| 1 End of Treatment Show forest plot | 2 | 444 | Risk Ratio (M‐H, Random, 95% CI) | 1.80 [1.07, 3.03] |
| Analysis 25.1  Comparison 25 Bupropion + any NRT vs placebo ‐ rs1051730 ‐ non‐Hispanic white, Outcome 1 End of Treatment. | ||||
| 1.1 Homozygous Major | 2 | 183 | Risk Ratio (M‐H, Random, 95% CI) | 2.11 [0.31, 14.60] |
| 1.2 Heterozygous | 2 | 216 | Risk Ratio (M‐H, Random, 95% CI) | 1.82 [1.23, 2.69] |
| 1.3 Homozygous Minor | 2 | 45 | Risk Ratio (M‐H, Random, 95% CI) | 2.84 [0.90, 8.89] |
| Outcome or subgroup title | No. of studies | No. of participants | Statistical method | Effect size |
| 1 End of Treatment Show forest plot | 2 | 69 | Risk Ratio (M‐H, Random, 95% CI) | 0.91 [0.27, 3.07] |
| Analysis 26.1  Comparison 26 Bupropion + any NRT vs placebo ‐ rs1051730 ‐ non‐Hispanic black or African American, Outcome 1 End of Treatment. | ||||
| 1.1 Homozygous Major | 2 | 58 | Risk Ratio (M‐H, Random, 95% CI) | 1.64 [0.56, 4.83] |
| 1.2 Heterozygous or Homozygous Minor | 2 | 11 | Risk Ratio (M‐H, Random, 95% CI) | 0.22 [0.03, 1.43] |
| Outcome or subgroup title | No. of studies | No. of participants | Statistical method | Effect size |
| 1 End of Treatment Show forest plot | 2 | 441 | Risk Ratio (M‐H, Random, 95% CI) | 1.79 [1.07, 2.99] |
| Analysis 27.1  Comparison 27 Bupropion + any NRT vs placebo ‐ rs16969968 ‐ non‐Hispanic white, Outcome 1 End of Treatment. | ||||
| 1.1 Homozygous Major | 2 | 183 | Risk Ratio (M‐H, Random, 95% CI) | 2.11 [0.31, 14.60] |
| 1.2 Heterozygous | 2 | 215 | Risk Ratio (M‐H, Random, 95% CI) | 1.80 [1.22, 2.66] |
| 1.3 Homozygous Minor | 2 | 43 | Risk Ratio (M‐H, Random, 95% CI) | 2.81 [0.89, 8.88] |
| Outcome or subgroup title | No. of studies | No. of participants | Statistical method | Effect size |
| 1 End of Treatment Show forest plot | 2 | 69 | Risk Ratio (M‐H, Random, 95% CI) | 1.05 [0.46, 2.38] |
| Analysis 28.1  Comparison 28 Bupropion + any NRT vs placebo ‐ rs16969968 ‐ non‐Hispanic black or African American, Outcome 1 End of Treatment. | ||||
| 1.1 Homozygous Major | 2 | 63 | Risk Ratio (M‐H, Random, 95% CI) | 1.20 [0.51, 2.85] |
| 1.2 Heterozygous or Homozygous Minor | 2 | 6 | Risk Ratio (M‐H, Random, 95% CI) | 0.33 [0.03, 4.19] |
| Outcome or subgroup title | No. of studies | No. of participants | Statistical method | Effect size |
| 1 End of Treatment Show forest plot | 2 | 443 | Risk Ratio (M‐H, Random, 95% CI) | 1.74 [1.09, 2.77] |
| Analysis 29.1  Comparison 29 Bupropion + any NRT vs placebo ‐ rs2036527 ‐ non‐Hispanic white, Outcome 1 End of Treatment. | ||||
| 1.1 Homozygous Major | 2 | 181 | Risk Ratio (M‐H, Random, 95% CI) | 2.20 [0.33, 14.75] |
| 1.2 Heterozygous | 2 | 220 | Risk Ratio (M‐H, Random, 95% CI) | 1.83 [1.23, 2.72] |
| 1.3 Homozygous Minor | 2 | 42 | Risk Ratio (M‐H, Random, 95% CI) | 2.12 [0.79, 5.65] |
| Outcome or subgroup title | No. of studies | No. of participants | Statistical method | Effect size |
| 1 End of Treatment Show forest plot | 2 | 69 | Risk Ratio (M‐H, Random, 95% CI) | 1.00 [0.52, 1.92] |
| Analysis 30.1  Comparison 30 Bupropion + any NRT vs placebo ‐ rs2036527 ‐ non‐Hispanic black or African American, Outcome 1 End of Treatment. | ||||
| 1.1 Homozygous Major | 2 | 38 | Risk Ratio (M‐H, Random, 95% CI) | 2.03 [0.39, 10.56] |
| 1.2 Heterozygous | 2 | 23 | Risk Ratio (M‐H, Random, 95% CI) | 1.03 [0.38, 2.77] |
| 1.3 Homozygous Minor | 2 | 8 | Risk Ratio (M‐H, Random, 95% CI) | 0.74 [0.26, 2.05] |
| Outcome or subgroup title | No. of studies | No. of participants | Statistical method | Effect size |
| 1 End of Treatment Show forest plot | 2 | 442 | Risk Ratio (M‐H, Random, 95% CI) | 1.55 [1.20, 2.01] |
| Analysis 31.1  Comparison 31 Bupropion + any NRT vs placebo ‐ rs3733829 ‐ non‐Hispanic white, Outcome 1 End of Treatment. | ||||
| 1.1 Homozygous Major | 2 | 187 | Risk Ratio (M‐H, Random, 95% CI) | 1.48 [0.83, 2.65] |
| 1.2 Heterozygous | 2 | 201 | Risk Ratio (M‐H, Random, 95% CI) | 1.87 [1.04, 3.36] |
| 1.3 Homozygous Minor | 2 | 54 | Risk Ratio (M‐H, Random, 95% CI) | 1.85 [0.91, 3.74] |
| Outcome or subgroup title | No. of studies | No. of participants | Statistical method | Effect size |
| 1 End of Treatment Show forest plot | 2 | 48 | Risk Ratio (M‐H, Random, 95% CI) | 0.42 [0.14, 1.24] |
| Analysis 32.1  Comparison 32 Bupropion + any NRT vs placebo ‐ rs3733829 ‐ non‐Hispanic black or African American, Outcome 1 End of Treatment. | ||||
| 1.1 Homozygous Major | 2 | 48 | Risk Ratio (M‐H, Random, 95% CI) | 0.42 [0.14, 1.24] |
| Outcome or subgroup title | No. of studies | No. of participants | Statistical method | Effect size |
| 1 End of Treatment Show forest plot | 2 | 442 | Risk Ratio (M‐H, Random, 95% CI) | 1.51 [1.16, 1.97] |
| Analysis 33.1  Comparison 33 Bupropion + any NRT vs placebo ‐ rs7937 ‐ non‐Hispanic white, Outcome 1 End of Treatment. | ||||
| 1.1 Homozygous Major | 2 | 131 | Risk Ratio (M‐H, Random, 95% CI) | 2.00 [0.84, 4.75] |
| 1.2 Heterozygous | 2 | 229 | Risk Ratio (M‐H, Random, 95% CI) | 1.39 [0.99, 1.94] |
| 1.3 Homozygous Minor | 2 | 82 | Risk Ratio (M‐H, Random, 95% CI) | 2.34 [0.49, 11.08] |
| Outcome or subgroup title | No. of studies | No. of participants | Statistical method | Effect size |
| 1 End of Treatment Show forest plot | 2 | 69 | Risk Ratio (M‐H, Random, 95% CI) | 1.06 [0.47, 2.38] |
| Analysis 34.1 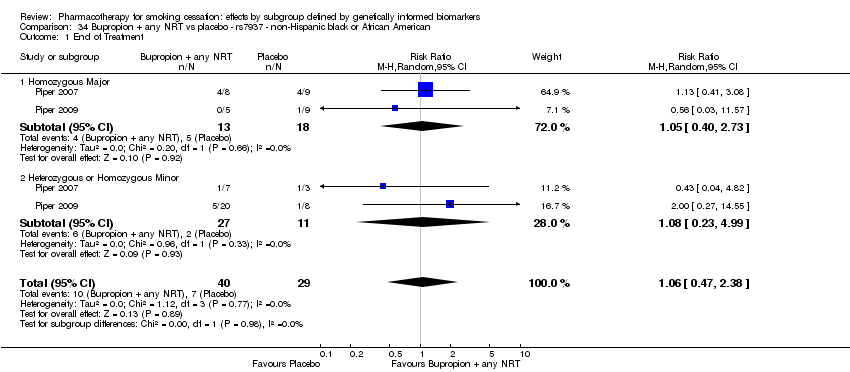 Comparison 34 Bupropion + any NRT vs placebo ‐ rs7937 ‐ non‐Hispanic black or African American, Outcome 1 End of Treatment. | ||||
| 1.1 Homozygous Major | 2 | 31 | Risk Ratio (M‐H, Random, 95% CI) | 1.05 [0.40, 2.73] |
| 1.2 Heterozygous or Homozygous Minor | 2 | 38 | Risk Ratio (M‐H, Random, 95% CI) | 1.08 [0.23, 4.99] |
| Outcome or subgroup title | No. of studies | No. of participants | Statistical method | Effect size |
| 1 End of Treatment Show forest plot | 2 | 442 | Risk Ratio (M‐H, Random, 95% CI) | 1.62 [1.10, 2.39] |
| Analysis 35.1 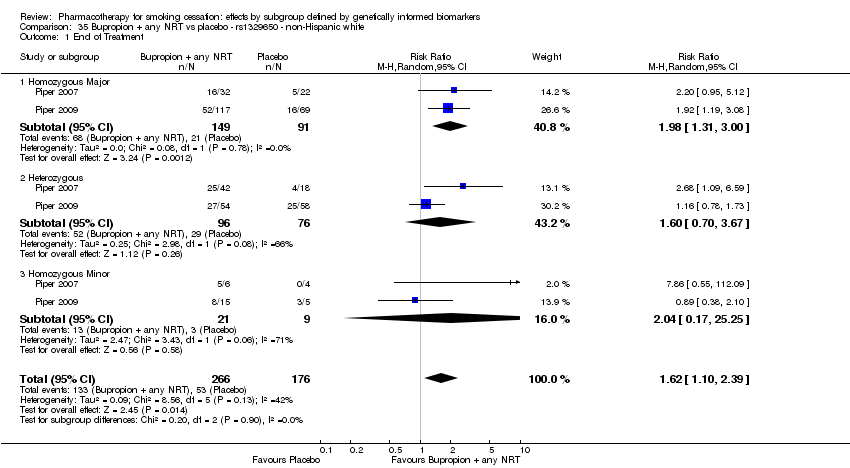 Comparison 35 Bupropion + any NRT vs placebo ‐ rs1329650 ‐ non‐Hispanic white, Outcome 1 End of Treatment. | ||||
| 1.1 Homozygous Major | 2 | 240 | Risk Ratio (M‐H, Random, 95% CI) | 1.98 [1.31, 3.00] |
| 1.2 Heterozygous | 2 | 172 | Risk Ratio (M‐H, Random, 95% CI) | 1.60 [0.70, 3.67] |
| 1.3 Homozygous Minor | 2 | 30 | Risk Ratio (M‐H, Random, 95% CI) | 2.04 [0.17, 25.25] |
| Outcome or subgroup title | No. of studies | No. of participants | Statistical method | Effect size |
| 1 End of Treatment Show forest plot | 2 | 69 | Risk Ratio (M‐H, Random, 95% CI) | 1.07 [0.48, 2.41] |
| Analysis 36.1 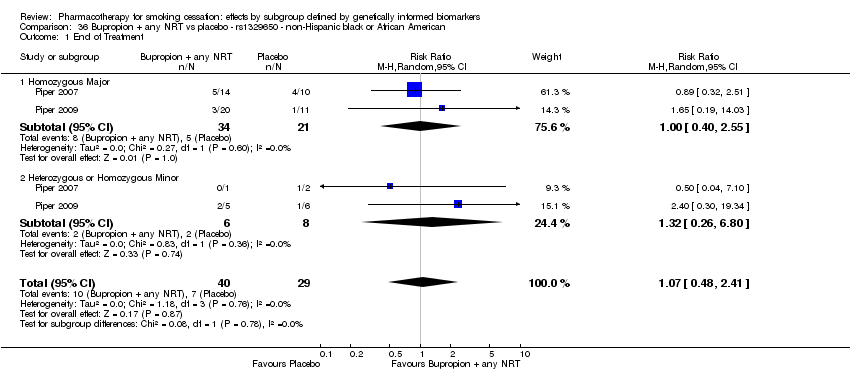 Comparison 36 Bupropion + any NRT vs placebo ‐ rs1329650 ‐ non‐Hispanic black or African American, Outcome 1 End of Treatment. | ||||
| 1.1 Homozygous Major | 2 | 55 | Risk Ratio (M‐H, Random, 95% CI) | 1.00 [0.40, 2.55] |
| 1.2 Heterozygous or Homozygous Minor | 2 | 14 | Risk Ratio (M‐H, Random, 95% CI) | 1.32 [0.26, 6.80] |
| Outcome or subgroup title | No. of studies | No. of participants | Statistical method | Effect size |
| 1 End of Treatment Show forest plot | 2 | 444 | Risk Ratio (M‐H, Random, 95% CI) | 1.64 [1.08, 2.49] |
| Analysis 37.1 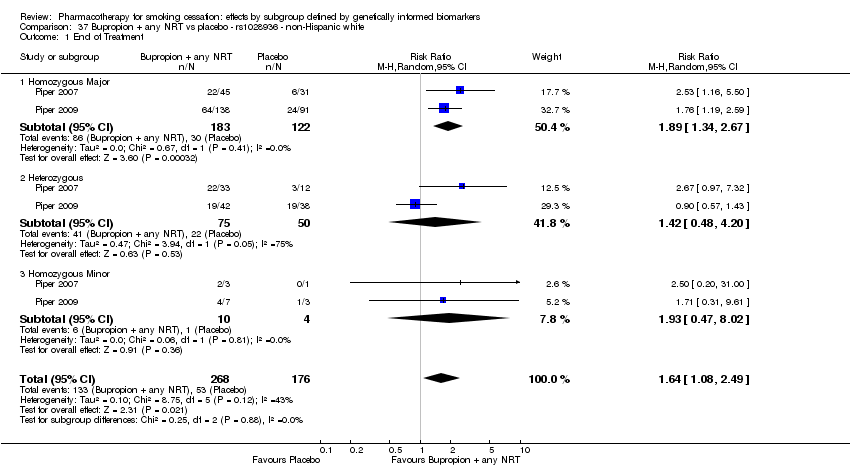 Comparison 37 Bupropion + any NRT vs placebo ‐ rs1028936 ‐ non‐Hispanic white, Outcome 1 End of Treatment. | ||||
| 1.1 Homozygous Major | 2 | 305 | Risk Ratio (M‐H, Random, 95% CI) | 1.89 [1.34, 2.67] |
| 1.2 Heterozygous | 2 | 125 | Risk Ratio (M‐H, Random, 95% CI) | 1.42 [0.48, 4.20] |
| 1.3 Homozygous Minor | 2 | 14 | Risk Ratio (M‐H, Random, 95% CI) | 1.93 [0.47, 8.02] |
| Outcome or subgroup title | No. of studies | No. of participants | Statistical method | Effect size |
| 1 End of Treatment Show forest plot | 2 | 69 | Risk Ratio (M‐H, Random, 95% CI) | 1.07 [0.48, 2.41] |
| Analysis 38.1  Comparison 38 Bupropion + any NRT vs placebo ‐ rs1028936 ‐ non‐Hispanic black or African American, Outcome 1 End of Treatment. | ||||
| 1.1 Homozygous Major | 2 | 57 | Risk Ratio (M‐H, Random, 95% CI) | 1.10 [0.43, 2.84] |
| 1.2 Heterozygous or Homozygous Minor | 2 | 12 | Risk Ratio (M‐H, Random, 95% CI) | 0.96 [0.17, 5.39] |
| Outcome or subgroup title | No. of studies | No. of participants | Statistical method | Effect size |
| 1 End of Treatment Show forest plot | 2 | 442 | Risk Ratio (M‐H, Random, 95% CI) | 1.72 [1.16, 2.53] |
| Analysis 39.1 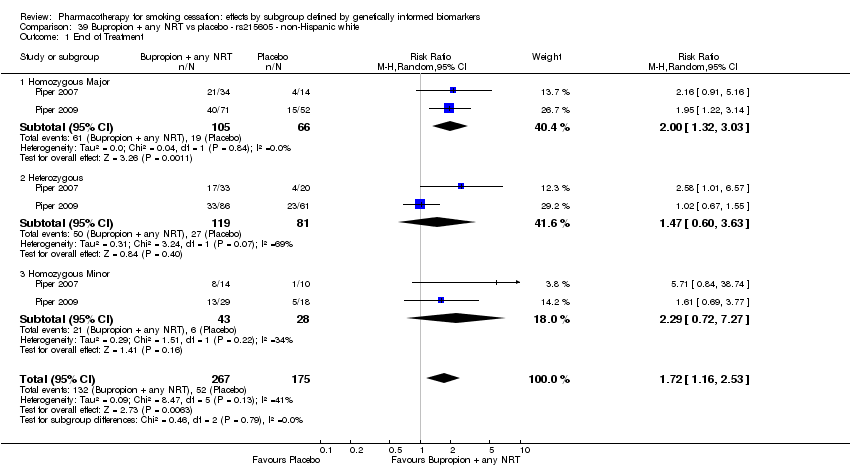 Comparison 39 Bupropion + any NRT vs placebo ‐ rs215605 ‐ non‐Hispanic white, Outcome 1 End of Treatment. | ||||
| 1.1 Homozygous Major | 2 | 171 | Risk Ratio (M‐H, Random, 95% CI) | 2.00 [1.32, 3.03] |
| 1.2 Heterozygous | 2 | 200 | Risk Ratio (M‐H, Random, 95% CI) | 1.47 [0.60, 3.63] |
| 1.3 Homozygous Minor | 2 | 71 | Risk Ratio (M‐H, Random, 95% CI) | 2.29 [0.72, 7.27] |
| Outcome or subgroup title | No. of studies | No. of participants | Statistical method | Effect size |
| 1 End of Treatment Show forest plot | 2 | 68 | Risk Ratio (M‐H, Random, 95% CI) | 0.85 [0.41, 1.77] |
| Analysis 40.1  Comparison 40 Bupropion + any NRT vs placebo ‐ rs215605 ‐ non‐Hispanic black or African American, Outcome 1 End of Treatment. | ||||
| 1.1 Homozygous Major | 2 | 36 | Risk Ratio (M‐H, Random, 95% CI) | 0.71 [0.29, 1.76] |
| 1.2 Heterozygous or Homozygous Minor | 2 | 32 | Risk Ratio (M‐H, Random, 95% CI) | 1.19 [0.34, 4.13] |
| Outcome or subgroup title | No. of studies | No. of participants | Statistical method | Effect size |
| 1 End of Treatment Show forest plot | 2 | 533 | Risk Ratio (M‐H, Random, 95% CI) | 1.18 [0.90, 1.55] |
| Analysis 41.1 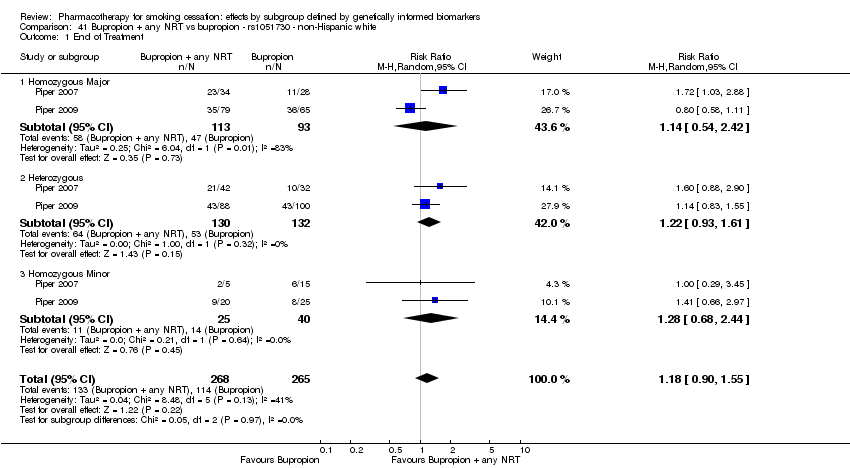 Comparison 41 Bupropion + any NRT vs bupropion ‐ rs1051730 ‐ non‐Hispanic white, Outcome 1 End of Treatment. | ||||
| 1.1 Homozygous Major | 2 | 206 | Risk Ratio (M‐H, Random, 95% CI) | 1.14 [0.54, 2.42] |
| 1.2 Heterozygous | 2 | 262 | Risk Ratio (M‐H, Random, 95% CI) | 1.22 [0.93, 1.61] |
| 1.3 Homozygous Minor | 2 | 65 | Risk Ratio (M‐H, Random, 95% CI) | 1.28 [0.68, 2.44] |
| Outcome or subgroup title | No. of studies | No. of participants | Statistical method | Effect size |
| 1 End of Treatment Show forest plot | 2 | 87 | Risk Ratio (M‐H, Random, 95% CI) | 0.70 [0.37, 1.31] |
| Analysis 42.1 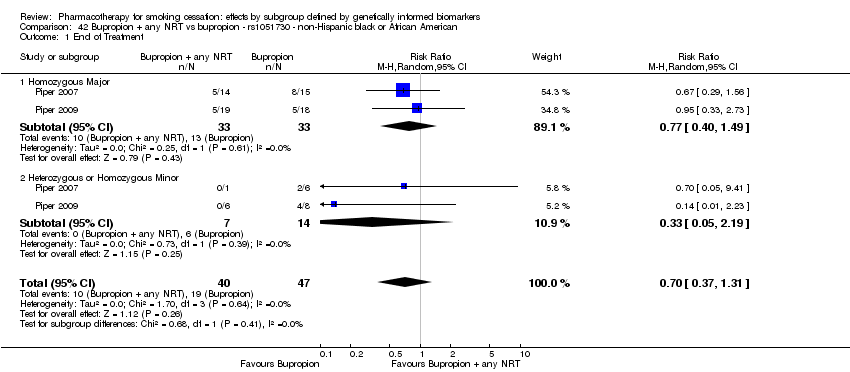 Comparison 42 Bupropion + any NRT vs bupropion ‐ rs1051730 ‐ non‐Hispanic black or African American, Outcome 1 End of Treatment. | ||||
| 1.1 Homozygous Major | 2 | 66 | Risk Ratio (M‐H, Random, 95% CI) | 0.77 [0.40, 1.49] |
| 1.2 Heterozygous or Homozygous Minor | 2 | 21 | Risk Ratio (M‐H, Random, 95% CI) | 0.33 [0.05, 2.19] |
| Outcome or subgroup title | No. of studies | No. of participants | Statistical method | Effect size |
| 1 End of Treatment Show forest plot | 2 | 531 | Risk Ratio (M‐H, Random, 95% CI) | 1.18 [0.90, 1.55] |
| Analysis 43.1  Comparison 43 Bupropion + any NRT vs bupropion ‐ rs16969968 ‐ non‐Hispanic white, Outcome 1 End of Treatment. | ||||
| 1.1 Homozygous Major | 2 | 206 | Risk Ratio (M‐H, Random, 95% CI) | 1.14 [0.54, 2.42] |
| 1.2 Heterozygous | 2 | 262 | Risk Ratio (M‐H, Random, 95% CI) | 1.22 [0.93, 1.61] |
| 1.3 Homozygous Minor | 2 | 63 | Risk Ratio (M‐H, Random, 95% CI) | 1.27 [0.66, 2.44] |
| Outcome or subgroup title | No. of studies | No. of participants | Statistical method | Effect size |
| 1 End of Treatment Show forest plot | 2 | 87 | Risk Ratio (M‐H, Random, 95% CI) | 0.69 [0.37, 1.27] |
| Analysis 44.1  Comparison 44 Bupropion + any NRT vs bupropion ‐ rs16969968 ‐ non‐Hispanic black or African American, Outcome 1 End of Treatment. | ||||
| 1.1 Homozygous Major | 2 | 74 | Risk Ratio (M‐H, Random, 95% CI) | 0.73 [0.38, 1.40] |
| 1.2 Heterozygous or Homozygous Minor | 2 | 13 | Risk Ratio (M‐H, Random, 95% CI) | 0.41 [0.06, 2.76] |
| Outcome or subgroup title | No. of studies | No. of participants | Statistical method | Effect size |
| 1 End of Treatment Show forest plot | 2 | 532 | Risk Ratio (M‐H, Random, 95% CI) | 1.18 [0.91, 1.52] |
| Analysis 45.1  Comparison 45 Bupropion + any NRT vs bupropion ‐ rs2036527 ‐ non‐Hispanic white, Outcome 1 End of Treatment. | ||||
| 1.1 Homozygous Major | 2 | 204 | Risk Ratio (M‐H, Random, 95% CI) | 1.17 [0.54, 2.52] |
| 1.2 Heterozygous | 2 | 264 | Risk Ratio (M‐H, Random, 95% CI) | 1.21 [0.92, 1.60] |
| 1.3 Homozygous Minor | 2 | 64 | Risk Ratio (M‐H, Random, 95% CI) | 1.24 [0.68, 2.25] |
| Outcome or subgroup title | No. of studies | No. of participants | Statistical method | Effect size |
| 1 End of Treatment Show forest plot | 2 | 87 | Risk Ratio (M‐H, Random, 95% CI) | 0.66 [0.35, 1.23] |
| Analysis 46.1  Comparison 46 Bupropion + any NRT vs bupropion ‐ rs2036527 ‐ non‐Hispanic black or African American, Outcome 1 End of Treatment. | ||||
| 1.1 Homozygous Major | 2 | 50 | Risk Ratio (M‐H, Random, 95% CI) | 0.56 [0.23, 1.35] |
| 1.2 Heterozygous or Homozygous Minor | 2 | 37 | Risk Ratio (M‐H, Random, 95% CI) | 0.77 [0.32, 1.90] |
| Outcome or subgroup title | No. of studies | No. of participants | Statistical method | Effect size |
| 1 End of Treatment Show forest plot | 2 | 531 | Risk Ratio (M‐H, Random, 95% CI) | 1.15 [0.96, 1.39] |
| Analysis 47.1  Comparison 47 Bupropion + any NRT vs bupropion ‐ rs3733829 ‐ non‐Hispanic white, Outcome 1 End of Treatment. | ||||
| 1.1 Homozygous Major | 2 | 236 | Risk Ratio (M‐H, Random, 95% CI) | 1.19 [0.77, 1.84] |
| 1.2 Heterozygous | 2 | 229 | Risk Ratio (M‐H, Random, 95% CI) | 1.11 [0.82, 1.51] |
| 1.3 Homozygous Minor | 2 | 66 | Risk Ratio (M‐H, Random, 95% CI) | 1.34 [0.80, 2.25] |
| Outcome or subgroup title | No. of studies | No. of participants | Statistical method | Effect size |
| 1 End of Treatment Show forest plot | 2 | 94 | Risk Ratio (M‐H, Random, 95% CI) | 0.49 [0.25, 0.99] |
| Analysis 48.1  Comparison 48 Bupropion + any NRT vs bupropion ‐ rs3733829 ‐ non‐Hispanic black or African American, Outcome 1 End of Treatment. | ||||
| 1.1 Homozygous Major | 2 | 65 | Risk Ratio (M‐H, Random, 95% CI) | 0.43 [0.18, 1.01] |
| 1.2 Heterozygous or Homozygous Minor | 2 | 29 | Risk Ratio (M‐H, Random, 95% CI) | 0.73 [0.13, 4.20] |
| Outcome or subgroup title | No. of studies | No. of participants | Statistical method | Effect size |
| 1 End of Treatment Show forest plot | 2 | 533 | Risk Ratio (M‐H, Random, 95% CI) | 1.16 [0.95, 1.42] |
| Analysis 49.1  Comparison 49 Bupropion + any NRT vs bupropion ‐ rs7937 ‐ non‐Hispanic white, Outcome 1 End of Treatment. | ||||
| 1.1 Homozygous Major | 2 | 145 | Risk Ratio (M‐H, Random, 95% CI) | 1.01 [0.65, 1.59] |
| 1.2 Heterozygous | 2 | 272 | Risk Ratio (M‐H, Random, 95% CI) | 1.27 [0.81, 2.00] |
| 1.3 Homozygous Minor | 2 | 116 | Risk Ratio (M‐H, Random, 95% CI) | 1.29 [0.90, 1.84] |
| Outcome or subgroup title | No. of studies | No. of participants | Statistical method | Effect size |
| 1 End of Treatment Show forest plot | 2 | 87 | Risk Ratio (M‐H, Random, 95% CI) | 0.75 [0.39, 1.43] |
| Analysis 50.1  Comparison 50 Bupropion + any NRT vs bupropion ‐ rs7937 ‐ non‐Hispanic black or African American, Outcome 1 End of Treatment. | ||||
| 1.1 Homozygous Major | 2 | 33 | Risk Ratio (M‐H, Random, 95% CI) | 0.61 [0.13, 2.86] |
| 1.2 Heterozygous or Homozygous Minor | 2 | 54 | Risk Ratio (M‐H, Random, 95% CI) | 0.73 [0.27, 1.93] |
| Outcome or subgroup title | No. of studies | No. of participants | Statistical method | Effect size |
| 1 End of Treatment Show forest plot | 2 | 531 | Risk Ratio (M‐H, Random, 95% CI) | 1.20 [0.97, 1.49] |
| Analysis 51.1 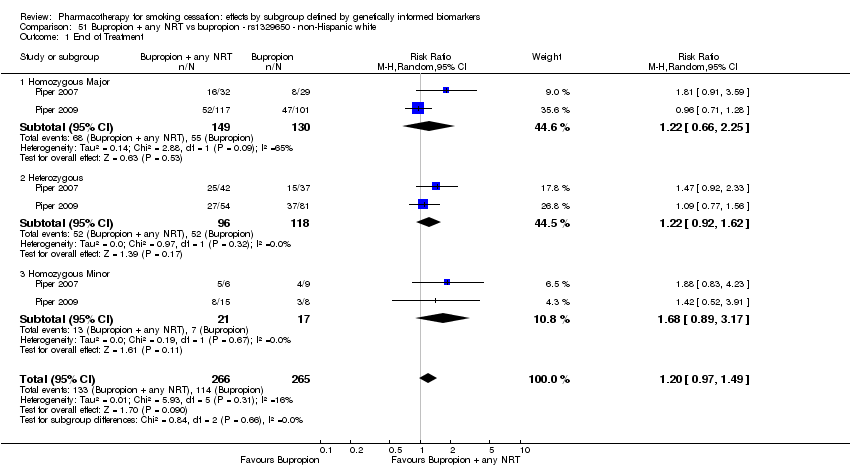 Comparison 51 Bupropion + any NRT vs bupropion ‐ rs1329650 ‐ non‐Hispanic white, Outcome 1 End of Treatment. | ||||
| 1.1 Homozygous Major | 2 | 279 | Risk Ratio (M‐H, Random, 95% CI) | 1.22 [0.66, 2.25] |
| 1.2 Heterozygous | 2 | 214 | Risk Ratio (M‐H, Random, 95% CI) | 1.22 [0.92, 1.62] |
| 1.3 Homozygous Minor | 2 | 38 | Risk Ratio (M‐H, Random, 95% CI) | 1.68 [0.89, 3.17] |
| Outcome or subgroup title | No. of studies | No. of participants | Statistical method | Effect size |
| 1 End of Treatment Show forest plot | 2 | 87 | Risk Ratio (M‐H, Random, 95% CI) | 0.63 [0.33, 1.20] |
| Analysis 52.1  Comparison 52 Bupropion + any NRT vs bupropion ‐ rs1329650 ‐ non‐Hispanic black or African American, Outcome 1 End of Treatment. | ||||
| 1.1 Homozygous Major | 2 | 76 | Risk Ratio (M‐H, Random, 95% CI) | 0.59 [0.30, 1.15] |
| 1.2 Heterozygous or Homozygous Minor | 2 | 11 | Risk Ratio (M‐H, Random, 95% CI) | 1.2 [0.17, 8.24] |
| Outcome or subgroup title | No. of studies | No. of participants | Statistical method | Effect size |
| 1 End of Treatment Show forest plot | 2 | 533 | Risk Ratio (M‐H, Random, 95% CI) | 1.18 [0.92, 1.50] |
| Analysis 53.1 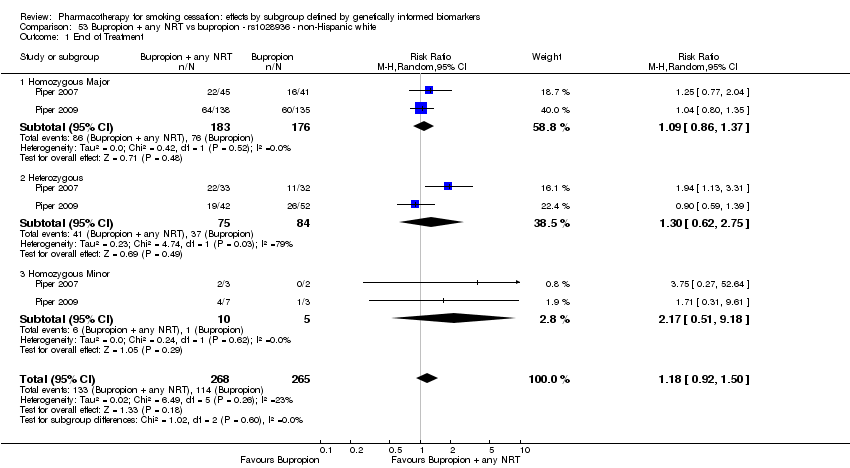 Comparison 53 Bupropion + any NRT vs bupropion ‐ rs1028936 ‐ non‐Hispanic white, Outcome 1 End of Treatment. | ||||
| 1.1 Homozygous Major | 2 | 359 | Risk Ratio (M‐H, Random, 95% CI) | 1.09 [0.86, 1.37] |
| 1.2 Heterozygous | 2 | 159 | Risk Ratio (M‐H, Random, 95% CI) | 1.30 [0.62, 2.75] |
| 1.3 Homozygous Minor | 2 | 15 | Risk Ratio (M‐H, Random, 95% CI) | 2.17 [0.51, 9.18] |
| Outcome or subgroup title | No. of studies | No. of participants | Statistical method | Effect size |
| 1 End of Treatment Show forest plot | 2 | 87 | Risk Ratio (M‐H, Random, 95% CI) | 0.63 [0.33, 1.20] |
| Analysis 54.1  Comparison 54 Bupropion + any NRT vs bupropion ‐ rs1028936 ‐ non‐Hispanic black or African American, Outcome 1 End of Treatment. | ||||
| 1.1 Homozygous Major | 2 | 76 | Risk Ratio (M‐H, Random, 95% CI) | 0.59 [0.30, 1.15] |
| 1.2 Heterozygous or Homozygous Minor | 2 | 11 | Risk Ratio (M‐H, Random, 95% CI) | 1.2 [0.17, 8.24] |
| Outcome or subgroup title | No. of studies | No. of participants | Statistical method | Effect size |
| 1 End of Treatment Show forest plot | 2 | 532 | Risk Ratio (M‐H, Random, 95% CI) | 1.17 [0.93, 1.47] |
| Analysis 55.1  Comparison 55 Bupropion + any NRT vs bupropion ‐ rs215605 ‐ non‐Hispanic white, Outcome 1 End of Treatment. | ||||
| 1.1 Homozygous Major | 2 | 211 | Risk Ratio (M‐H, Random, 95% CI) | 1.28 [0.91, 1.80] |
| 1.2 Heterozygous | 2 | 241 | Risk Ratio (M‐H, Random, 95% CI) | 1.00 [0.69, 1.45] |
| 1.3 Homozygous Minor | 2 | 80 | Risk Ratio (M‐H, Random, 95% CI) | 1.61 [0.64, 4.08] |
| Outcome or subgroup title | No. of studies | No. of participants | Statistical method | Effect size |
| 1 End of Treatment Show forest plot | 2 | 87 | Risk Ratio (M‐H, Random, 95% CI) | 0.71 [0.37, 1.35] |
| Analysis 56.1  Comparison 56 Bupropion + any NRT vs bupropion ‐ rs215605 ‐ non‐Hispanic black or African American, Outcome 1 End of Treatment. | ||||
| 1.1 Homozygous Major | 2 | 49 | Risk Ratio (M‐H, Random, 95% CI) | 0.51 [0.09, 2.94] |
| 1.2 Heterozygous or Homozygous Minor | 2 | 38 | Risk Ratio (M‐H, Random, 95% CI) | 0.71 [0.26, 1.93] |
| Outcome or subgroup title | No. of studies | No. of participants | Statistical method | Effect size |
| 1 Six‐Month Abstinence Show forest plot | 7 | Risk Ratio (M‐H, Random, 95% CI) | Subtotals only | |
| Analysis 57.1  Comparison 57 Active NRT ‐ rs1051730 ‐ non‐Hispanic white, Outcome 1 Six‐Month Abstinence. | ||||
| 1.1 Homozygous Major vs Homozygous Minor | 7 | 1559 | Risk Ratio (M‐H, Random, 95% CI) | 0.92 [0.71, 1.19] |
| 1.2 Heterozygous vs Homozygous Minor | 7 | 1650 | Risk Ratio (M‐H, Random, 95% CI) | 0.91 [0.75, 1.11] |
| 2 End of Treatment Show forest plot | 5 | Risk Ratio (M‐H, Random, 95% CI) | Subtotals only | |
| Analysis 57.2 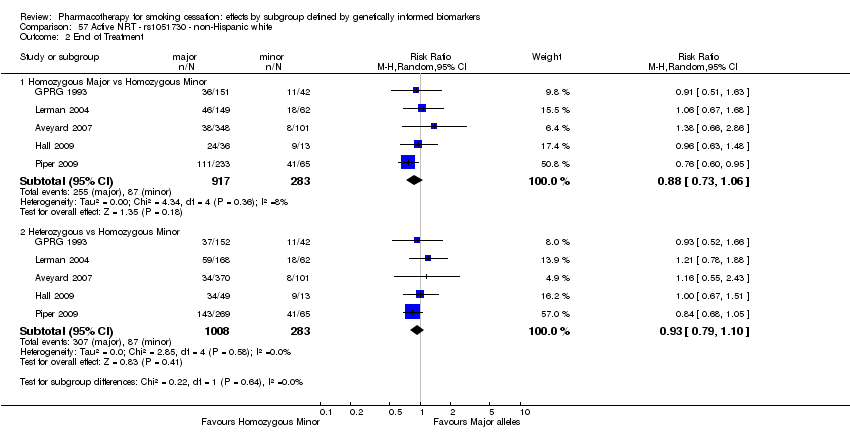 Comparison 57 Active NRT ‐ rs1051730 ‐ non‐Hispanic white, Outcome 2 End of Treatment. | ||||
| 2.1 Homozygous Major vs Homozygous Minor | 5 | 1200 | Risk Ratio (M‐H, Random, 95% CI) | 0.88 [0.73, 1.06] |
| 2.2 Heterozygous vs Homozygous Minor | 5 | 1291 | Risk Ratio (M‐H, Random, 95% CI) | 0.93 [0.79, 1.10] |
| Outcome or subgroup title | No. of studies | No. of participants | Statistical method | Effect size |
| 1 Six‐Month Abstinence Show forest plot | 2 | Risk Ratio (M‐H, Random, 95% CI) | Subtotals only | |
| Analysis 58.1  Comparison 58 Active NRT ‐ rs1051730 ‐ non‐Hispanic black or African American, Outcome 1 Six‐Month Abstinence. | ||||
| 1.1 Homozygous Major vs Homozygous Minor | 2 | 187 | Risk Ratio (M‐H, Random, 95% CI) | 1.08 [0.26, 4.57] |
| 1.2 Heterozygous vs Homozygous Minor | 2 | 56 | Risk Ratio (M‐H, Random, 95% CI) | 1.11 [0.25, 4.99] |
| Outcome or subgroup title | No. of studies | No. of participants | Statistical method | Effect size |
| 1 Six‐Month Abstinence Show forest plot | 2 | Risk Ratio (M‐H, Random, 95% CI) | Subtotals only | |
| Analysis 59.1  Comparison 59 Active NRT ‐ rs16969968 ‐ non‐Hispanic black or African American, Outcome 1 Six‐Month Abstinence. | ||||
| 1.1 Homozygous Major vs Heterozygous or Homozygous Minor | 2 | 392 | Risk Ratio (M‐H, Random, 95% CI) | 2.24 [0.92, 5.45] |
| 2 End of Treatment Show forest plot | 2 | Risk Ratio (M‐H, Random, 95% CI) | Subtotals only | |
| Analysis 59.2 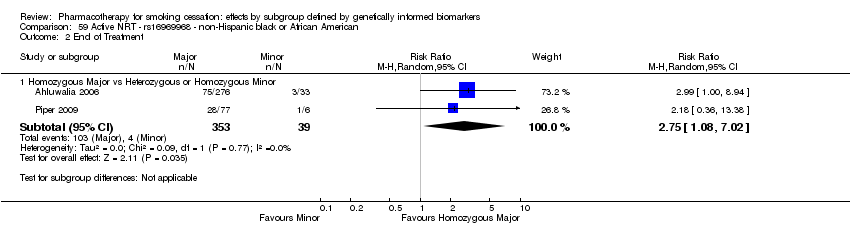 Comparison 59 Active NRT ‐ rs16969968 ‐ non‐Hispanic black or African American, Outcome 2 End of Treatment. | ||||
| 2.1 Homozygous Major vs Heterozygous or Homozygous Minor | 2 | 392 | Risk Ratio (M‐H, Random, 95% CI) | 2.75 [1.08, 7.02] |
| Outcome or subgroup title | No. of studies | No. of participants | Statistical method | Effect size |
| 1 Six‐Month Abstinence Show forest plot | 3 | Risk Ratio (M‐H, Random, 95% CI) | Subtotals only | |
| Analysis 60.1  Comparison 60 Active NRT ‐ rs588765 ‐ non‐Hispanic white, Outcome 1 Six‐Month Abstinence. | ||||
| 1.1 Homozygous Major vs Homozygous Minor | 3 | 433 | Risk Ratio (M‐H, Random, 95% CI) | 1.05 [0.80, 1.37] |
| 1.2 Heterozygous vs Homozygous Minor | 3 | 546 | Risk Ratio (M‐H, Random, 95% CI) | 0.99 [0.76, 1.29] |
| 2 End of Treatment Show forest plot | 3 | Risk Ratio (M‐H, Random, 95% CI) | Subtotals only | |
| Analysis 60.2  Comparison 60 Active NRT ‐ rs588765 ‐ non‐Hispanic white, Outcome 2 End of Treatment. | ||||
| 2.1 Homozygous Major vs Homozygous Minor | 3 | 429 | Risk Ratio (M‐H, Random, 95% CI) | 0.95 [0.76, 1.18] |
| 2.2 Heterozygous vs Homozygous Minor | 3 | 542 | Risk Ratio (M‐H, Random, 95% CI) | 0.95 [0.77, 1.17] |
| Outcome or subgroup title | No. of studies | No. of participants | Statistical method | Effect size |
| 1 Six‐Month Abstinence Show forest plot | 2 | Risk Ratio (M‐H, Random, 95% CI) | Subtotals only | |
| Analysis 61.1  Comparison 61 Active NRT ‐ rs2036527 ‐ non‐Hispanic white, Outcome 1 Six‐Month Abstinence. | ||||
| 1.1 Homozygous Major vs Homozygous Minor | 2 | 501 | Risk Ratio (M‐H, Random, 95% CI) | 0.79 [0.60, 1.03] |
| 1.2 Heterozygous vs Homozygous Minor | 2 | 579 | Risk Ratio (M‐H, Random, 95% CI) | 0.83 [0.63, 1.10] |
| 2 End of Treatment Show forest plot | 2 | Risk Ratio (M‐H, Random, 95% CI) | Subtotals only | |
| Analysis 61.2  Comparison 61 Active NRT ‐ rs2036527 ‐ non‐Hispanic white, Outcome 2 End of Treatment. | ||||
| 2.1 Homozygous Major vs Homozygous Minor | 2 | 501 | Risk Ratio (M‐H, Random, 95% CI) | 0.89 [0.59, 1.35] |
| 2.2 Heterozygous vs Homozygous Minor | 2 | 579 | Risk Ratio (M‐H, Random, 95% CI) | 1.00 [0.61, 1.64] |
| Outcome or subgroup title | No. of studies | No. of participants | Statistical method | Effect size |
| 1 Six‐Month Abstinence Show forest plot | 2 | Risk Ratio (M‐H, Random, 95% CI) | Subtotals only | |
| Analysis 62.1  Comparison 62 Active NRT ‐ rs2036527 ‐ non‐Hispanic black or African American, Outcome 1 Six‐Month Abstinence. | ||||
| 1.1 Homozygous Major vs Heterozygous or Homozygous Minor | 2 | 391 | Risk Ratio (M‐H, Random, 95% CI) | 1.25 [0.87, 1.81] |
| 2 End of Treatment Show forest plot | 2 | Risk Ratio (M‐H, Random, 95% CI) | Subtotals only | |
| Analysis 62.2  Comparison 62 Active NRT ‐ rs2036527 ‐ non‐Hispanic black or African American, Outcome 2 End of Treatment. | ||||
| 2.1 Homozygous Major vs Heterozygous or Homozygous Minor | 2 | 391 | Risk Ratio (M‐H, Random, 95% CI) | 1.73 [1.20, 2.49] |
| Outcome or subgroup title | No. of studies | No. of participants | Statistical method | Effect size |
| 1 Six‐Month Abstinence Show forest plot | 3 | Risk Ratio (M‐H, Random, 95% CI) | Subtotals only | |
| Analysis 63.1  Comparison 63 Active NRT ‐ DRD‐4 (exon 3 48 bp) ‐ non‐Hispanic white, Outcome 1 Six‐Month Abstinence. | ||||
| 1.1 Homozygous Major vs Homozygous Minor | 3 | 866 | Risk Ratio (M‐H, Random, 95% CI) | 0.95 [0.51, 1.76] |
| 1.2 Heterozygous vs Homozygous Minor | 3 | 321 | Risk Ratio (M‐H, Random, 95% CI) | 0.81 [0.42, 1.60] |
| 2 End of Treatment Show forest plot | 3 | Risk Ratio (M‐H, Random, 95% CI) | Subtotals only | |
| Analysis 63.2  Comparison 63 Active NRT ‐ DRD‐4 (exon 3 48 bp) ‐ non‐Hispanic white, Outcome 2 End of Treatment. | ||||
| 2.1 Homozygous Major vs Homozygous Minor | 3 | 866 | Risk Ratio (M‐H, Random, 95% CI) | 0.93 [0.71, 1.23] |
| 2.2 Heterozygous vs Homozygous Minor | 3 | 321 | Risk Ratio (M‐H, Random, 95% CI) | 0.85 [0.58, 1.26] |
| Outcome or subgroup title | No. of studies | No. of participants | Statistical method | Effect size |
| 1 Six‐Month Abstinence Show forest plot | 2 | Risk Ratio (M‐H, Random, 95% CI) | Subtotals only | |
| Analysis 64.1  Comparison 64 Active NRT ‐ SLC6A4 (Promoter) ‐ non‐Hispanic white, Outcome 1 Six‐Month Abstinence. | ||||
| 1.1 Homozygous Major vs Homozygous Minor | 2 | 461 | Risk Ratio (M‐H, Random, 95% CI) | 0.92 [0.50, 1.67] |
| 1.2 Heterozygous vs Homozygous Minor | 2 | 649 | Risk Ratio (M‐H, Random, 95% CI) | 1.12 [0.66, 1.90] |
| 2 End of Treatment Show forest plot | 2 | Risk Ratio (M‐H, Random, 95% CI) | Subtotals only | |
| Analysis 64.2  Comparison 64 Active NRT ‐ SLC6A4 (Promoter) ‐ non‐Hispanic white, Outcome 2 End of Treatment. | ||||
| 2.1 Homozygous Major vs Homozygous Minor | 2 | 461 | Risk Ratio (M‐H, Random, 95% CI) | 0.97 [0.77, 1.23] |
| 2.2 Heterozygous vs Homozygous Minor | 2 | 649 | Risk Ratio (M‐H, Random, 95% CI) | 0.94 [0.74, 1.18] |
| Outcome or subgroup title | No. of studies | No. of participants | Statistical method | Effect size |
| 1 Six‐Month Abstinence Show forest plot | 2 | Risk Ratio (M‐H, Random, 95% CI) | Subtotals only | |
| Analysis 65.1  Comparison 65 Active NRT‐NMR ‐ non‐Hispanic white or black or African American, Outcome 1 Six‐Month Abstinence. | ||||
| 1.1 Normal NMR vs Slow NMR | 2 | 718 | Risk Ratio (M‐H, Random, 95% CI) | 0.54 [0.37, 0.78] |
| 2 End of Treatment Show forest plot | 2 | Risk Ratio (M‐H, Random, 95% CI) | Subtotals only | |
| Analysis 65.2 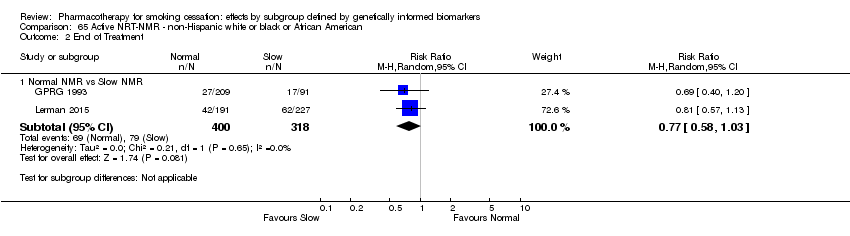 Comparison 65 Active NRT‐NMR ‐ non‐Hispanic white or black or African American, Outcome 2 End of Treatment. | ||||
| 2.1 Normal NMR vs Slow NMR | 2 | 718 | Risk Ratio (M‐H, Random, 95% CI) | 0.77 [0.58, 1.03] |
| Outcome or subgroup title | No. of studies | No. of participants | Statistical method | Effect size |
| 1 Six‐Month Abstinence Show forest plot | 4 | Risk Ratio (M‐H, Random, 95% CI) | Subtotals only | |
| Analysis 66.1  Comparison 66 Bupropion ‐ rs1051730 ‐ non‐Hispanic white, Outcome 1 Six‐Month Abstinence. | ||||
| 1.1 Homozygous Major vs Homozygous Minor | 4 | 316 | Risk Ratio (M‐H, Random, 95% CI) | 1.27 [0.67, 2.43] |
| 1.2 Heterozygous vs Homozygous Minor | 4 | 390 | Risk Ratio (M‐H, Random, 95% CI) | 1.15 [0.65, 2.03] |
| 2 End of Treatment Show forest plot | 6 | Risk Ratio (M‐H, Random, 95% CI) | Subtotals only | |
| Analysis 66.2  Comparison 66 Bupropion ‐ rs1051730 ‐ non‐Hispanic white, Outcome 2 End of Treatment. | ||||
| 2.1 Homozygous Major vs Homozygous Minor | 6 | 386 | Risk Ratio (M‐H, Random, 95% CI) | 1.15 [0.88, 1.50] |
| 2.2 Heterozygous vs Homozygous Minor | 6 | 480 | Risk Ratio (M‐H, Random, 95% CI) | 1.04 [0.81, 1.33] |
| Outcome or subgroup title | No. of studies | No. of participants | Statistical method | Effect size |
| 1 Six‐Month Abstinence Show forest plot | 2 | Risk Ratio (M‐H, Random, 95% CI) | Subtotals only | |
| Analysis 67.1  Comparison 67 Bupropion ‐ rs1051730 ‐ non‐Hispanic black or African American, Outcome 1 Six‐Month Abstinence. | ||||
| 1.1 Homozygous Major vs Heterozygous or Homozygous Minor | 2 | 63 | Risk Ratio (M‐H, Random, 95% CI) | 0.83 [0.36, 1.95] |
| 2 End of Treatment Show forest plot | 3 | Risk Ratio (M‐H, Random, 95% CI) | Subtotals only | |
| Analysis 67.2  Comparison 67 Bupropion ‐ rs1051730 ‐ non‐Hispanic black or African American, Outcome 2 End of Treatment. | ||||
| 2.1 Homozygous Major vs Heterozygous or Homozygous Minor | 3 | 84 | Risk Ratio (M‐H, Random, 95% CI) | 0.94 [0.51, 1.72] |
| Outcome or subgroup title | No. of studies | No. of participants | Statistical method | Effect size |
| 1 End of Treatment Show forest plot | 3 | Risk Ratio (M‐H, Random, 95% CI) | Subtotals only | |
| Analysis 68.1 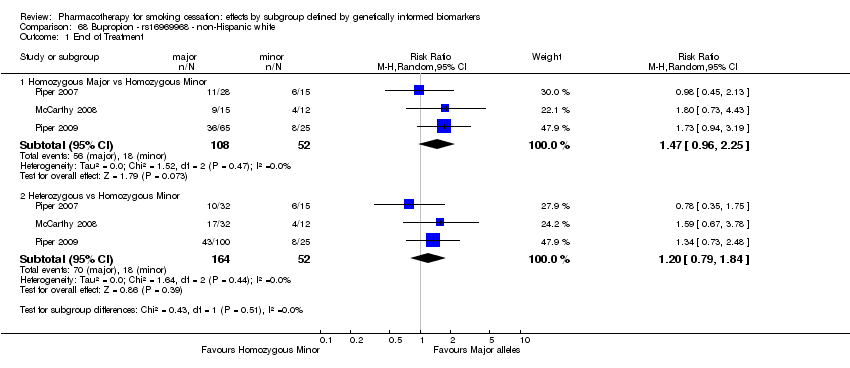 Comparison 68 Bupropion ‐ rs16969968 ‐ non‐Hispanic white, Outcome 1 End of Treatment. | ||||
| 1.1 Homozygous Major vs Homozygous Minor | 3 | 160 | Risk Ratio (M‐H, Random, 95% CI) | 1.47 [0.96, 2.25] |
| 1.2 Heterozygous vs Homozygous Minor | 3 | 216 | Risk Ratio (M‐H, Random, 95% CI) | 1.20 [0.79, 1.84] |
| Outcome or subgroup title | No. of studies | No. of participants | Statistical method | Effect size |
| 1 Six‐Month Abstinence Show forest plot | 2 | Risk Ratio (M‐H, Random, 95% CI) | Subtotals only | |
| Analysis 69.1  Comparison 69 Bupropion ‐ rs16969968 ‐ non‐Hispanic black or African American, Outcome 1 Six‐Month Abstinence. | ||||
| 1.1 Homozygous Major vs Heterozygous or Homozygous Minor | 2 | 294 | Risk Ratio (M‐H, Random, 95% CI) | 0.62 [0.31, 1.21] |
| 2 End of Treatment Show forest plot | 3 | Risk Ratio (M‐H, Random, 95% CI) | Subtotals only | |
| Analysis 69.2  Comparison 69 Bupropion ‐ rs16969968 ‐ non‐Hispanic black or African American, Outcome 2 End of Treatment. | ||||
| 2.1 Homozygous Major vs Heterozygous or Homozygous Minor | 3 | 315 | Risk Ratio (M‐H, Random, 95% CI) | 0.79 [0.48, 1.32] |
| Outcome or subgroup title | No. of studies | No. of participants | Statistical method | Effect size |
| 1 Six‐Month Abstinence Show forest plot | 4 | Risk Ratio (M‐H, Random, 95% CI) | Subtotals only | |
| Analysis 70.1  Comparison 70 Bupropion ‐ rs588765 ‐ non‐Hispanic white, Outcome 1 Six‐Month Abstinence. | ||||
| 1.1 Homozygous Major vs Homozygous Minor | 4 | 304 | Risk Ratio (M‐H, Random, 95% CI) | 0.83 [0.52, 1.34] |
| 1.2 Heterozygous vs Homozygous Minor | 4 | 401 | Risk Ratio (M‐H, Random, 95% CI) | 0.90 [0.66, 1.21] |
| 2 End of Treatment Show forest plot | 4 | Risk Ratio (M‐H, Random, 95% CI) | Subtotals only | |
| Analysis 70.2  Comparison 70 Bupropion ‐ rs588765 ‐ non‐Hispanic white, Outcome 2 End of Treatment. | ||||
| 2.1 Homozygous Major vs Homozygous Minor | 4 | 304 | Risk Ratio (M‐H, Random, 95% CI) | 0.89 [0.69, 1.14] |
| 2.2 Heterozygous vs Homozygous Minor | 4 | 400 | Risk Ratio (M‐H, Random, 95% CI) | 0.96 [0.76, 1.22] |
| Outcome or subgroup title | No. of studies | No. of participants | Statistical method | Effect size |
| 1 Six‐Month Abstinence Show forest plot | 2 | Risk Ratio (M‐H, Random, 95% CI) | Subtotals only | |
| Analysis 71.1  Comparison 71 Bupropion ‐ rs2036527 ‐ non‐Hispanic white, Outcome 1 Six‐Month Abstinence. | ||||
| 1.1 Homozygous Major vs Homozygous Minor | 2 | 208 | Risk Ratio (M‐H, Random, 95% CI) | 0.77 [0.33, 1.81] |
| 1.2 Heterozygous vs Homozygous Minor | 2 | 269 | Risk Ratio (M‐H, Random, 95% CI) | 0.83 [0.51, 1.37] |
| 2 End of Treatment Show forest plot | 4 | Risk Ratio (M‐H, Random, 95% CI) | Subtotals only | |
| Analysis 71.2 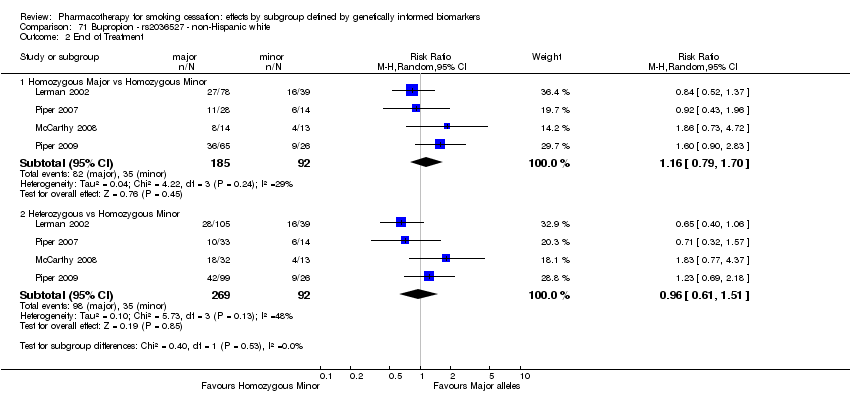 Comparison 71 Bupropion ‐ rs2036527 ‐ non‐Hispanic white, Outcome 2 End of Treatment. | ||||
| 2.1 Homozygous Major vs Homozygous Minor | 4 | 277 | Risk Ratio (M‐H, Random, 95% CI) | 1.16 [0.79, 1.70] |
| 2.2 Heterozygous vs Homozygous Minor | 4 | 361 | Risk Ratio (M‐H, Random, 95% CI) | 0.96 [0.61, 1.51] |
| Outcome or subgroup title | No. of studies | No. of participants | Statistical method | Effect size |
| 1 Six‐Month Abstinence Show forest plot | 3 | Risk Ratio (M‐H, Random, 95% CI) | Subtotals only | |
| Analysis 72.1  Comparison 72 Bupropion ‐ rs2036527 ‐ non‐Hispanic black or African American, Outcome 1 Six‐Month Abstinence. | ||||
| 1.1 Homozygous Major vs Heterozygous or Homozygous Minor | 3 | 331 | Risk Ratio (M‐H, Random, 95% CI) | 0.89 [0.55, 1.46] |
| 2 End of Treatment Show forest plot | 4 | Risk Ratio (M‐H, Random, 95% CI) | Subtotals only | |
| Analysis 72.2  Comparison 72 Bupropion ‐ rs2036527 ‐ non‐Hispanic black or African American, Outcome 2 End of Treatment. | ||||
| 2.1 Homozygous Major vs Heterozygous or Homozygous Minor | 4 | 352 | Risk Ratio (M‐H, Random, 95% CI) | 1.24 [0.87, 1.76] |
| Outcome or subgroup title | No. of studies | No. of participants | Statistical method | Effect size |
| 1 Six‐Month Abstinence Show forest plot | 2 | Risk Ratio (M‐H, Random, 95% CI) | Subtotals only | |
| Analysis 73.1  Comparison 73 Bupropion ‐ rs3733829 ‐ non‐Hispanic white, Outcome 1 Six‐Month Abstinence. | ||||
| 1.1 Homozygous Major vs Homozygous Minor | 2 | 191 | Risk Ratio (M‐H, Random, 95% CI) | 0.90 [0.56, 1.46] |
| 1.2 Heterozygous vs Homozygous Minor | 2 | 161 | Risk Ratio (M‐H, Random, 95% CI) | 1.06 [0.65, 1.71] |
| 2 End of Treatment Show forest plot | 4 | Risk Ratio (M‐H, Random, 95% CI) | Subtotals only | |
| Analysis 73.2  Comparison 73 Bupropion ‐ rs3733829 ‐ non‐Hispanic white, Outcome 2 End of Treatment. | ||||
| 2.1 Homozygous Major vs Homozygous Minor | 4 | 259 | Risk Ratio (M‐H, Random, 95% CI) | 1.02 [0.73, 1.40] |
| 2.2 Heterozygous vs Homozygous Minor | 4 | 237 | Risk Ratio (M‐H, Random, 95% CI) | 0.98 [0.70, 1.36] |
| Outcome or subgroup title | No. of studies | No. of participants | Statistical method | Effect size |
| 1 End of Treatment Show forest plot | 2 | Risk Ratio (M‐H, Random, 95% CI) | Subtotals only | |
| Analysis 74.1 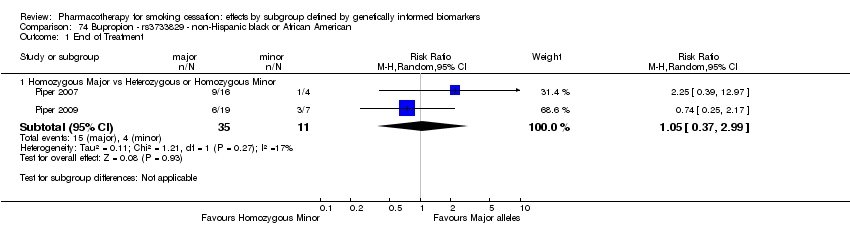 Comparison 74 Bupropion ‐ rs3733829 ‐ non‐Hispanic black or African American, Outcome 1 End of Treatment. | ||||
| 1.1 Homozygous Major vs Heterozygous or Homozygous Minor | 2 | 46 | Risk Ratio (M‐H, Random, 95% CI) | 1.05 [0.37, 2.99] |
| Outcome or subgroup title | No. of studies | No. of participants | Statistical method | Effect size |
| 1 End of Treatment Show forest plot | 3 | Risk Ratio (M‐H, Random, 95% CI) | Subtotals only | |
| Analysis 75.1  Comparison 75 Bupropion ‐ rs7937 ‐ non‐Hispanic white, Outcome 1 End of Treatment. | ||||
| 1.1 Homozygous Major vs Homozygous Minor | 3 | 159 | Risk Ratio (M‐H, Random, 95% CI) | 1.00 [0.71, 1.40] |
| 1.2 Heterozygous vs Homozygous Minor | 3 | 238 | Risk Ratio (M‐H, Random, 95% CI) | 0.90 [0.65, 1.23] |
| Outcome or subgroup title | No. of studies | No. of participants | Statistical method | Effect size |
| 1 End of Treatment Show forest plot | 2 | Risk Ratio (M‐H, Random, 95% CI) | Subtotals only | |
| Analysis 76.1  Comparison 76 Bupropion ‐ rs7937 ‐ non‐Hispanic black or African American, Outcome 1 End of Treatment. | ||||
| 1.1 Homozygous Major vs Homozygous Minor | 2 | 23 | Risk Ratio (M‐H, Random, 95% CI) | 1.16 [0.32, 4.26] |
| 1.2 Heterozygous vs Homozygous Minor | 2 | 27 | Risk Ratio (M‐H, Random, 95% CI) | 0.72 [0.18, 2.93] |
| Outcome or subgroup title | No. of studies | No. of participants | Statistical method | Effect size |
| 1 End of Treatment Show forest plot | 3 | Risk Ratio (M‐H, Random, 95% CI) | Subtotals only | |
| Analysis 77.1  Comparison 77 Bupropion ‐ rs1329650 ‐ non‐Hispanic white, Outcome 1 End of Treatment. | ||||
| 1.1 Homozygous Major vs Homozygous Minor | 3 | 186 | Risk Ratio (M‐H, Random, 95% CI) | 0.85 [0.54, 1.35] |
| 1.2 Heterozygous vs Homozygous Minor | 3 | 163 | Risk Ratio (M‐H, Random, 95% CI) | 0.89 [0.56, 1.42] |
| Outcome or subgroup title | No. of studies | No. of participants | Statistical method | Effect size |
| 1 End of Treatment Show forest plot | 2 | Risk Ratio (M‐H, Random, 95% CI) | Subtotals only | |
| Analysis 78.1  Comparison 78 Bupropion ‐ rs1329650 ‐ non‐Hispanic black or African American, Outcome 1 End of Treatment. | ||||
| 1.1 Homozygous Major vs Heterozygous or Homozygous Minor | 2 | 47 | Risk Ratio (M‐H, Random, 95% CI) | 1.46 [0.35, 6.01] |
| Outcome or subgroup title | No. of studies | No. of participants | Statistical method | Effect size |
| 1 End of Treatment Show forest plot | 3 | Risk Ratio (M‐H, Random, 95% CI) | Subtotals only | |
| Analysis 79.1  Comparison 79 Bupropion ‐ rs1028936 ‐ non‐Hispanic white, Outcome 1 End of Treatment. | ||||
| 1.1 Homozygous Major vs Homozygous Minor | 3 | 221 | Risk Ratio (M‐H, Random, 95% CI) | 0.81 [0.42, 1.55] |
| 1.2 Heterozygous vs Homozygous Minor | 3 | 112 | Risk Ratio (M‐H, Random, 95% CI) | 0.81 [0.40, 1.64] |
| Outcome or subgroup title | No. of studies | No. of participants | Statistical method | Effect size |
| 1 End of Treatment Show forest plot | 2 | Risk Ratio (M‐H, Random, 95% CI) | Subtotals only | |
| Analysis 80.1 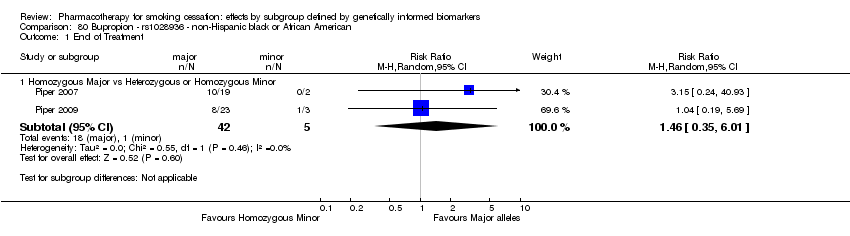 Comparison 80 Bupropion ‐ rs1028936 ‐ non‐Hispanic black or African American, Outcome 1 End of Treatment. | ||||
| 1.1 Homozygous Major vs Heterozygous or Homozygous Minor | 2 | 47 | Risk Ratio (M‐H, Random, 95% CI) | 1.46 [0.35, 6.01] |
| Outcome or subgroup title | No. of studies | No. of participants | Statistical method | Effect size |
| 1 End of Treatment Show forest plot | 3 | Risk Ratio (M‐H, Random, 95% CI) | Subtotals only | |
| Analysis 81.1  Comparison 81 Bupropion ‐ rs215605 ‐ non‐Hispanic white, Outcome 1 End of Treatment. | ||||
| 1.1 Homozygous Major vs Homozygous Minor | 3 | 170 | Risk Ratio (M‐H, Random, 95% CI) | 1.61 [0.87, 3.00] |
| 1.2 Heterozygous vs Homozygous Minor | 3 | 199 | Risk Ratio (M‐H, Random, 95% CI) | 1.56 [0.79, 3.06] |
| Outcome or subgroup title | No. of studies | No. of participants | Statistical method | Effect size |
| 1 End of Treatment Show forest plot | 2 | Risk Ratio (M‐H, Random, 95% CI) | Subtotals only | |
| Analysis 82.1  Comparison 82 Bupropion ‐ rs215605 ‐ non‐Hispanic black or African American, Outcome 1 End of Treatment. | ||||
| 1.1 Homozygous Major vs Heterozygous or Homozygous Minor | 2 | 47 | Risk Ratio (M‐H, Random, 95% CI) | 1.15 [0.54, 2.44] |
| Outcome or subgroup title | No. of studies | No. of participants | Statistical method | Effect size |
| 1 Six‐Month Abstinence Show forest plot | 2 | Risk Ratio (M‐H, Random, 95% CI) | Subtotals only | |
| Analysis 83.1 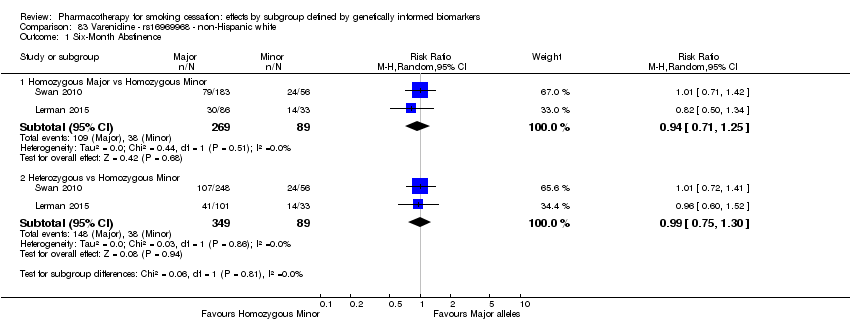 Comparison 83 Varenicline ‐ rs16969968 ‐ non‐Hispanic white, Outcome 1 Six‐Month Abstinence. | ||||
| 1.1 Homozygous Major vs Homozygous Minor | 2 | 358 | Risk Ratio (M‐H, Random, 95% CI) | 0.94 [0.71, 1.25] |
| 1.2 Heterozygous vs Homozygous Minor | 2 | 438 | Risk Ratio (M‐H, Random, 95% CI) | 0.99 [0.75, 1.30] |
| 2 End of Treatment Show forest plot | 2 | Risk Ratio (M‐H, Random, 95% CI) | Subtotals only | |
| Analysis 83.2  Comparison 83 Varenicline ‐ rs16969968 ‐ non‐Hispanic white, Outcome 2 End of Treatment. | ||||
| 2.1 Homozygous Major vs Homozygous Minor | 2 | 358 | Risk Ratio (M‐H, Random, 95% CI) | 0.98 [0.78, 1.24] |
| 2.2 Heterozygous vs Homozygous Minor | 2 | 438 | Risk Ratio (M‐H, Random, 95% CI) | 0.97 [0.77, 1.22] |
| Outcome or subgroup title | No. of studies | No. of participants | Statistical method | Effect size |
| 1 Six‐Month Abstinence Show forest plot | 2 | Risk Ratio (M‐H, Random, 95% CI) | Subtotals only | |
| Analysis 84.1  Comparison 84 Varenicline ‐ rs588765 ‐ non‐Hispanic white, Outcome 1 Six‐Month Abstinence. | ||||
| 1.1 Homozygous Major vs Homozygous Minor | 2 | 354 | Risk Ratio (M‐H, Random, 95% CI) | 1.20 [0.91, 1.60] |
| 1.2 Heterozygous vs Homozygous Minor | 2 | 465 | Risk Ratio (M‐H, Random, 95% CI) | 1.18 [0.90, 1.54] |
| 2 End of Treatment Show forest plot | 2 | Risk Ratio (M‐H, Random, 95% CI) | Subtotals only | |
| Analysis 84.2  Comparison 84 Varenicline ‐ rs588765 ‐ non‐Hispanic white, Outcome 2 End of Treatment. | ||||
| 2.1 Homozygous Major vs Homozygous Minor | 2 | 354 | Risk Ratio (M‐H, Random, 95% CI) | 1.14 [0.91, 1.43] |
| 2.2 Heterozygous vs Homozygous Minor | 2 | 465 | Risk Ratio (M‐H, Random, 95% CI) | 1.10 [0.89, 1.37] |
| Outcome or subgroup title | No. of studies | No. of participants | Statistical method | Effect size |
| 1 End of Treatment Show forest plot | 2 | Risk Ratio (M‐H, Random, 95% CI) | Subtotals only | |
| Analysis 85.1  Comparison 85 Bupropion + any NRT ‐ rs1051730 ‐ non‐Hispanic white, Outcome 1 End of Treatment. | ||||
| 1.1 Homozygous Major vs Homozygous Minor | 2 | 138 | Risk Ratio (M‐H, Random, 95% CI) | 1.10 [0.67, 1.78] |
| 1.2 Heterozygous vs Homozygous Minor | 2 | 155 | Risk Ratio (M‐H, Random, 95% CI) | 1.11 [0.69, 1.80] |
| Outcome or subgroup title | No. of studies | No. of participants | Statistical method | Effect size |
| 1 End of Treatment Show forest plot | 2 | Risk Ratio (M‐H, Random, 95% CI) | Subtotals only | |
| Analysis 86.1  Comparison 86 Bupropion + any NRT ‐ rs1051730 ‐ non‐Hispanic black or African American, Outcome 1 End of Treatment. | ||||
| 1.1 Homozygous Major vs Heterozygous or Homozygous Minor | 2 | 40 | Risk Ratio (M‐H, Random, 95% CI) | 2.26 [0.36, 14.38] |
| Outcome or subgroup title | No. of studies | No. of participants | Statistical method | Effect size |
| 1 End of Treatment Show forest plot | 2 | Risk Ratio (M‐H, Random, 95% CI) | Subtotals only | |
| Analysis 87.1  Comparison 87 Bupropion + any NRT ‐ rs16969968 ‐ non‐Hispanic white, Outcome 1 End of Treatment. | ||||
| 1.1 Homozygous Major vs Homozygous Minor | 2 | 136 | Risk Ratio (M‐H, Random, 95% CI) | 1.12 [0.67, 1.85] |
| 1.2 Heterozygous vs Homozygous Minor | 2 | 153 | Risk Ratio (M‐H, Random, 95% CI) | 1.13 [0.68, 1.86] |
| Outcome or subgroup title | No. of studies | No. of participants | Statistical method | Effect size |
| 1 End of Treatment Show forest plot | 2 | Risk Ratio (M‐H, Random, 95% CI) | Subtotals only | |
| Analysis 88.1  Comparison 88 Bupropion + any NRT ‐ rs16969968 ‐ non‐Hispanic black or African American, Outcome 1 End of Treatment. | ||||
| 1.1 Homozygous Major vs Heterozygous or Homozygous Minor | 2 | 40 | Risk Ratio (M‐H, Random, 95% CI) | 1.66 [0.27, 10.32] |
| Outcome or subgroup title | No. of studies | No. of participants | Statistical method | Effect size |
| 1 End of Treatment Show forest plot | 2 | Risk Ratio (M‐H, Random, 95% CI) | Subtotals only | |
| Analysis 89.1  Comparison 89 Bupropion + any NRT ‐ rs2036527 ‐ non‐Hispanic white, Outcome 1 End of Treatment. | ||||
| 1.1 Homozygous Major vs Homozygous Minor | 2 | 135 | Risk Ratio (M‐H, Random, 95% CI) | 1.12 [0.70, 1.79] |
| 1.2 Heterozygous vs Homozygous Minor | 2 | 156 | Risk Ratio (M‐H, Random, 95% CI) | 1.04 [0.65, 1.66] |
| Outcome or subgroup title | No. of studies | No. of participants | Statistical method | Effect size |
| 1 End of Treatment Show forest plot | 2 | Risk Ratio (M‐H, Random, 95% CI) | Subtotals only | |
| Analysis 90.1  Comparison 90 Bupropion + any NRT ‐ rs2036527 ‐ non‐Hispanic black or African American, Outcome 1 End of Treatment. | ||||
| 1.1 Homozygous Major vs Homozygous Minor | 2 | 28 | Risk Ratio (M‐H, Random, 95% CI) | 0.51 [0.06, 4.51] |
| 1.2 Heterozygous vs Homozygous Minor | 2 | 17 | Risk Ratio (M‐H, Random, 95% CI) | 0.70 [0.03, 15.98] |
| Outcome or subgroup title | No. of studies | No. of participants | Statistical method | Effect size |
| 1 End of Treatment Show forest plot | 2 | Risk Ratio (M‐H, Random, 95% CI) | Subtotals only | |
| Analysis 91.1  Comparison 91 Bupropion + any NRT ‐ rs3733829 ‐ non‐Hispanic white, Outcome 1 End of Treatment. | ||||
| 1.1 Homozygous Major vs Homozygous Minor | 2 | 144 | Risk Ratio (M‐H, Random, 95% CI) | 0.94 [0.66, 1.34] |
| 1.2 Heterozygous vs Homozygous Minor | 2 | 153 | Risk Ratio (M‐H, Random, 95% CI) | 0.79 [0.55, 1.14] |
| Outcome or subgroup title | No. of studies | No. of participants | Statistical method | Effect size |
| 1 End of Treatment Show forest plot | 2 | Risk Ratio (M‐H, Random, 95% CI) | Subtotals only | |
| Analysis 92.1 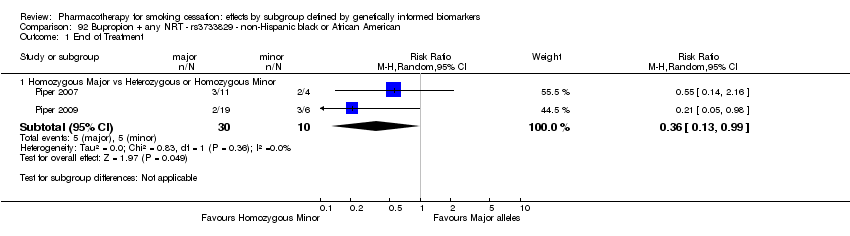 Comparison 92 Bupropion + any NRT ‐ rs3733829 ‐ non‐Hispanic black or African American, Outcome 1 End of Treatment. | ||||
| 1.1 Homozygous Major vs Heterozygous or Homozygous Minor | 2 | 40 | Risk Ratio (M‐H, Random, 95% CI) | 0.36 [0.13, 0.99] |
| Outcome or subgroup title | No. of studies | No. of participants | Statistical method | Effect size |
| 1 End of Treatment Show forest plot | 2 | Risk Ratio (M‐H, Random, 95% CI) | Subtotals only | |
| Analysis 93.1  Comparison 93 Bupropion + any NRT ‐ rs7937 ‐ non‐Hispanic white, Outcome 1 End of Treatment. | ||||
| 1.1 Homozygous Major vs Homozygous Minor | 2 | 128 | Risk Ratio (M‐H, Random, 95% CI) | 0.79 [0.57, 1.10] |
| 1.2 Heterozygous vs Homozygous Minor | 2 | 194 | Risk Ratio (M‐H, Random, 95% CI) | 0.81 [0.51, 1.28] |
| Outcome or subgroup title | No. of studies | No. of participants | Statistical method | Effect size |
| 1 End of Treatment Show forest plot | 2 | Risk Ratio (M‐H, Random, 95% CI) | Subtotals only | |
| Analysis 94.1  Comparison 94 Bupropion + any NRT ‐ rs7937 ‐ non‐Hispanic black or African American, Outcome 1 End of Treatment. | ||||
| 1.1 Homozygous Major vs Heterozygous or Homozygous Minor | 2 | 40 | Risk Ratio (M‐H, Random, 95% CI) | 1.29 [0.12, 13.56] |
| Outcome or subgroup title | No. of studies | No. of participants | Statistical method | Effect size |
| 1 End of Treatment Show forest plot | 2 | Risk Ratio (M‐H, Random, 95% CI) | Subtotals only | |
| Analysis 95.1  Comparison 95 Bupropion + any NRT ‐ rs1329650 ‐ non‐Hispanic white, Outcome 1 End of Treatment. | ||||
| 1.1 Homozygous Major vs Homozygous Minor | 2 | 170 | Risk Ratio (M‐H, Random, 95% CI) | 0.64 [0.43, 0.94] |
| 1.2 Heterozygous vs Homozygous Minor | 2 | 117 | Risk Ratio (M‐H, Random, 95% CI) | 0.71 [0.50, 1.03] |
| Outcome or subgroup title | No. of studies | No. of participants | Statistical method | Effect size |
| 1 End of Treatment Show forest plot | 2 | Risk Ratio (M‐H, Random, 95% CI) | Subtotals only | |
| Analysis 96.1  Comparison 96 Bupropion + any NRT ‐ rs1329650 ‐ non‐Hispanic black or African American, Outcome 1 End of Treatment. | ||||
| 1.1 Homozygous Major vs Heterozygous or Homozygous Minor | 2 | 40 | Risk Ratio (M‐H, Random, 95% CI) | 0.54 [0.15, 1.94] |
| Outcome or subgroup title | No. of studies | No. of participants | Statistical method | Effect size |
| 1 End of Treatment Show forest plot | 2 | Risk Ratio (M‐H, Random, 95% CI) | Subtotals only | |
| Analysis 97.1 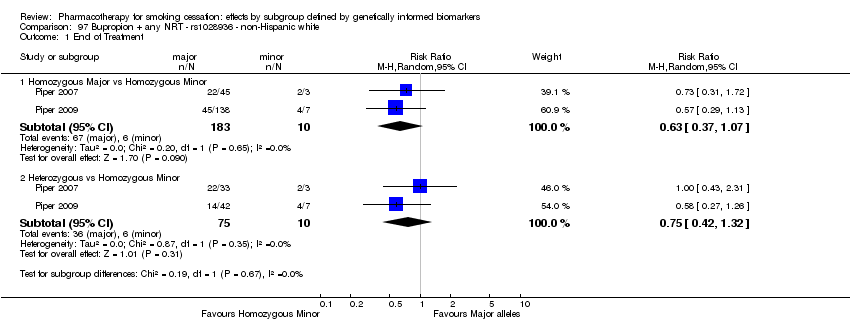 Comparison 97 Bupropion + any NRT ‐ rs1028936 ‐ non‐Hispanic white, Outcome 1 End of Treatment. | ||||
| 1.1 Homozygous Major vs Homozygous Minor | 2 | 193 | Risk Ratio (M‐H, Random, 95% CI) | 0.63 [0.37, 1.07] |
| 1.2 Heterozygous vs Homozygous Minor | 2 | 85 | Risk Ratio (M‐H, Random, 95% CI) | 0.75 [0.42, 1.32] |
| Outcome or subgroup title | No. of studies | No. of participants | Statistical method | Effect size |
| 1 End of Treatment Show forest plot | 2 | Risk Ratio (M‐H, Random, 95% CI) | Subtotals only | |
| Analysis 98.1 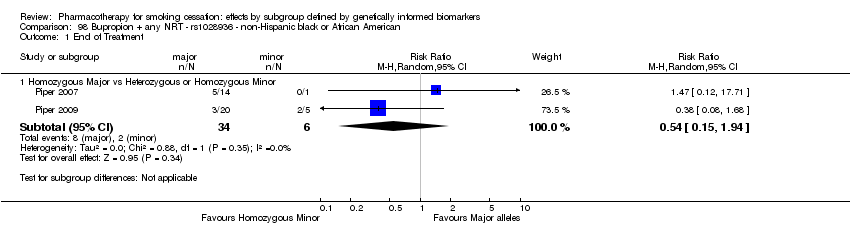 Comparison 98 Bupropion + any NRT ‐ rs1028936 ‐ non‐Hispanic black or African American, Outcome 1 End of Treatment. | ||||
| 1.1 Homozygous Major vs Heterozygous or Homozygous Minor | 2 | 40 | Risk Ratio (M‐H, Random, 95% CI) | 0.54 [0.15, 1.94] |
| Outcome or subgroup title | No. of studies | No. of participants | Statistical method | Effect size |
| 1 End of Treatment Show forest plot | 2 | Risk Ratio (M‐H, Random, 95% CI) | Subtotals only | |
| Analysis 99.1  Comparison 99 Bupropion + any NRT ‐ rs215605 ‐ non‐Hispanic white, Outcome 1 End of Treatment. | ||||
| 1.1 Homozygous Major vs Homozygous Minor | 2 | 148 | Risk Ratio (M‐H, Random, 95% CI) | 1.18 [0.84, 1.66] |
| 1.2 Heterozygous vs Homozygous Minor | 2 | 162 | Risk Ratio (M‐H, Random, 95% CI) | 0.88 [0.61, 1.26] |
| Outcome or subgroup title | No. of studies | No. of participants | Statistical method | Effect size |
| 1 End of Treatment Show forest plot | 2 | Risk Ratio (M‐H, Random, 95% CI) | Subtotals only | |
| Analysis 100.1  Comparison 100 Bupropion + any NRT ‐ rs215605 ‐ non‐Hispanic black or African American, Outcome 1 End of Treatment. | ||||
| 1.1 Homozygous Major vs Heterozygous or Homozygous Minor | 2 | 40 | Risk Ratio (M‐H, Random, 95% CI) | 0.76 [0.04, 13.56] |
| Outcome or subgroup title | No. of studies | No. of participants | Statistical method | Effect size |
| 1 Six‐Month Abstinence Show forest plot | 6 | Risk Ratio (M‐H, Random, 95% CI) | Subtotals only | |
| Analysis 101.1  Comparison 101 Placebo ‐ rs1051730 ‐ non‐Hispanic white, Outcome 1 Six‐Month Abstinence. | ||||
| 1.1 Homozygous Major vs Homozygous Minor | 6 | 533 | Risk Ratio (M‐H, Random, 95% CI) | 1.29 [0.86, 1.92] |
| 1.2 Heterozygous vs Homozygous Minor | 6 | 597 | Risk Ratio (M‐H, Random, 95% CI) | 1.08 [0.72, 1.62] |
| 2 End of Treatment Show forest plot | 7 | Risk Ratio (M‐H, Random, 95% CI) | Subtotals only | |
| Analysis 101.2  Comparison 101 Placebo ‐ rs1051730 ‐ non‐Hispanic white, Outcome 2 End of Treatment. | ||||
| 2.1 Homozygous Major vs Homozygous Minor | 7 | 542 | Risk Ratio (M‐H, Random, 95% CI) | 1.39 [0.91, 2.13] |
| 2.2 Heterozygous vs Homozygous Minor | 7 | 605 | Risk Ratio (M‐H, Random, 95% CI) | 1.24 [0.81, 1.89] |
| Outcome or subgroup title | No. of studies | No. of participants | Statistical method | Effect size |
| 1 Six‐Month Abstinence Show forest plot | 2 | Risk Ratio (M‐H, Random, 95% CI) | Subtotals only | |
| Analysis 102.1  Comparison 102 Placebo ‐ rs1051730 ‐ non‐Hispanic black or African American, Outcome 1 Six‐Month Abstinence. | ||||
| 1.1 Homozygous Major vs Heterozygous or Homozygous Minor | 2 | 63 | Risk Ratio (M‐H, Random, 95% CI) | 0.73 [0.08, 6.73] |
| 2 End of Treatment Show forest plot | 3 | Risk Ratio (M‐H, Random, 95% CI) | Subtotals only | |
| Analysis 102.2  Comparison 102 Placebo ‐ rs1051730 ‐ non‐Hispanic black or African American, Outcome 2 End of Treatment. | ||||
| 2.1 Homozygous Major vs Heterozygous or Homozygous Minor | 3 | 83 | Risk Ratio (M‐H, Random, 95% CI) | 0.76 [0.24, 2.45] |
| Outcome or subgroup title | No. of studies | No. of participants | Statistical method | Effect size |
| 1 Six‐Month Abstinence Show forest plot | 2 | Risk Ratio (M‐H, Random, 95% CI) | Subtotals only | |
| Analysis 103.1  Comparison 103 Placebo ‐ rs16969968 ‐ non‐Hispanic white, Outcome 1 Six‐Month Abstinence. | ||||
| 1.1 Homozygous Major vs Homozygous Minor | 2 | 162 | Risk Ratio (M‐H, Random, 95% CI) | 1.05 [0.51, 2.14] |
| 1.2 Heterozygous vs Homozygous Minor | 2 | 211 | Risk Ratio (M‐H, Random, 95% CI) | 0.79 [0.32, 1.96] |
| 2 End of Treatment Show forest plot | 4 | Risk Ratio (M‐H, Random, 95% CI) | Subtotals only | |
| Analysis 103.2 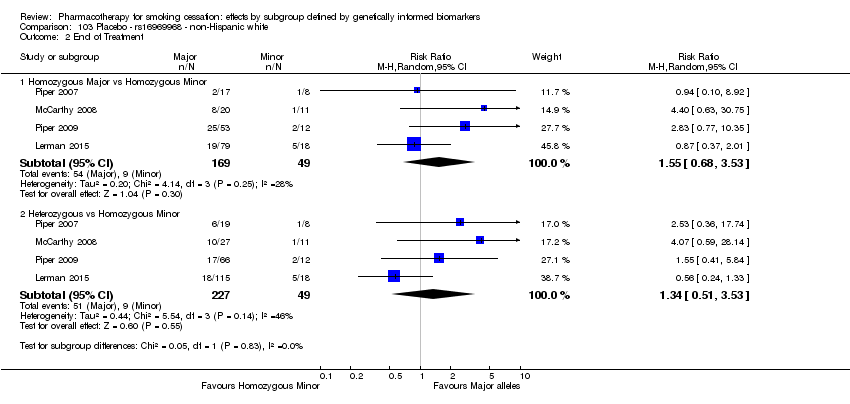 Comparison 103 Placebo ‐ rs16969968 ‐ non‐Hispanic white, Outcome 2 End of Treatment. | ||||
| 2.1 Homozygous Major vs Homozygous Minor | 4 | 218 | Risk Ratio (M‐H, Random, 95% CI) | 1.55 [0.68, 3.53] |
| 2.2 Heterozygous vs Homozygous Minor | 4 | 276 | Risk Ratio (M‐H, Random, 95% CI) | 1.34 [0.51, 3.53] |
| Outcome or subgroup title | No. of studies | No. of participants | Statistical method | Effect size |
| 1 Six‐Month Abstinence Show forest plot | 3 | Risk Ratio (M‐H, Random, 95% CI) | Subtotals only | |
| Analysis 104.1  Comparison 104 Placebo ‐ rs16969968 ‐ non‐Hispanic black or African American, Outcome 1 Six‐Month Abstinence. | ||||
| 1.1 Homozygous Major vs Heterozygous or Homozygous Minor | 3 | 584 | Risk Ratio (M‐H, Random, 95% CI) | 0.74 [0.42, 1.33] |
| 2 End of Treatment Show forest plot | 4 | Risk Ratio (M‐H, Random, 95% CI) | Subtotals only | |
| Analysis 104.2  Comparison 104 Placebo ‐ rs16969968 ‐ non‐Hispanic black or African American, Outcome 2 End of Treatment. | ||||
| 2.1 Homozygous Major vs Heterozygous or Homozygous Minor | 4 | 596 | Risk Ratio (M‐H, Random, 95% CI) | 0.55 [0.35, 0.86] |
| Outcome or subgroup title | No. of studies | No. of participants | Statistical method | Effect size |
| 1 Six‐Month Abstinence Show forest plot | 5 | Risk Ratio (M‐H, Random, 95% CI) | Subtotals only | |
| Analysis 105.1 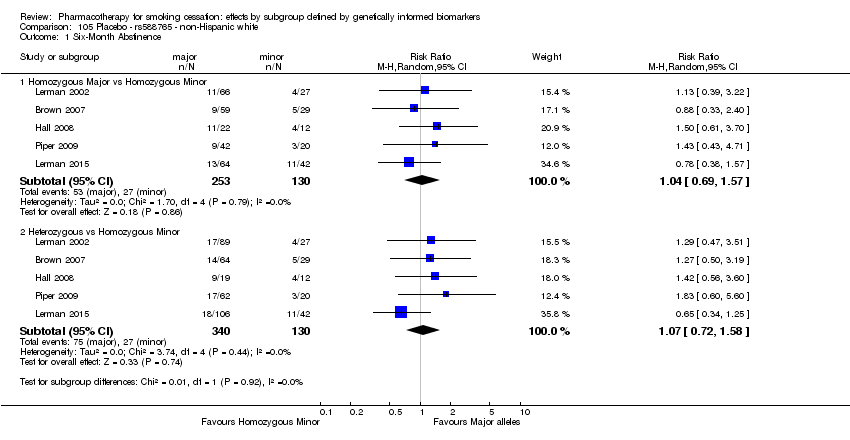 Comparison 105 Placebo ‐ rs588765 ‐ non‐Hispanic white, Outcome 1 Six‐Month Abstinence. | ||||
| 1.1 Homozygous Major vs Homozygous Minor | 5 | 383 | Risk Ratio (M‐H, Random, 95% CI) | 1.04 [0.69, 1.57] |
| 1.2 Heterozygous vs Homozygous Minor | 5 | 470 | Risk Ratio (M‐H, Random, 95% CI) | 1.07 [0.72, 1.58] |
| 2 End of Treatment Show forest plot | 5 | Risk Ratio (M‐H, Random, 95% CI) | Subtotals only | |
| Analysis 105.2  Comparison 105 Placebo ‐ rs588765 ‐ non‐Hispanic white, Outcome 2 End of Treatment. | ||||
| 2.1 Homozygous Major vs Homozygous Minor | 5 | 362 | Risk Ratio (M‐H, Random, 95% CI) | 0.88 [0.63, 1.21] |
| 2.2 Heterozygous vs Homozygous Minor | 5 | 404 | Risk Ratio (M‐H, Random, 95% CI) | 1.08 [0.80, 1.46] |
| Outcome or subgroup title | No. of studies | No. of participants | Statistical method | Effect size |
| 1 Six‐Month Abstinence Show forest plot | 2 | Risk Ratio (M‐H, Random, 95% CI) | Subtotals only | |
| Analysis 106.1 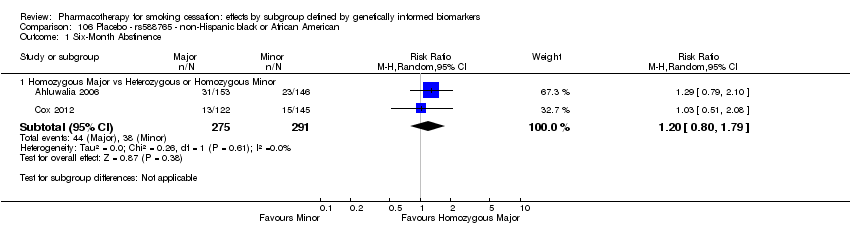 Comparison 106 Placebo ‐ rs588765 ‐ non‐Hispanic black or African American, Outcome 1 Six‐Month Abstinence. | ||||
| 1.1 Homozygous Major vs Heterozygous or Homozygous Minor | 2 | 566 | Risk Ratio (M‐H, Random, 95% CI) | 1.20 [0.80, 1.79] |
| 2 End of Treatment Show forest plot | 2 | Risk Ratio (M‐H, Random, 95% CI) | Subtotals only | |
| Analysis 106.2 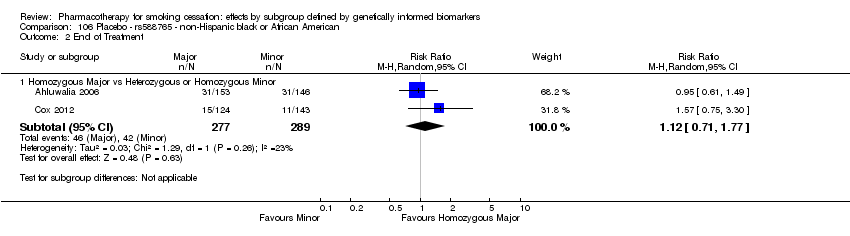 Comparison 106 Placebo ‐ rs588765 ‐ non‐Hispanic black or African American, Outcome 2 End of Treatment. | ||||
| 2.1 Homozygous Major vs Heterozygous or Homozygous Minor | 2 | 566 | Risk Ratio (M‐H, Random, 95% CI) | 1.12 [0.71, 1.77] |
| Outcome or subgroup title | No. of studies | No. of participants | Statistical method | Effect size |
| 1 Six‐Month Abstinence Show forest plot | 2 | Risk Ratio (M‐H, Random, 95% CI) | Subtotals only | |
| Analysis 107.1  Comparison 107 Placebo ‐ rs2036527 ‐ non‐Hispanic white, Outcome 1 Six‐Month Abstinence. | ||||
| 1.1 Homozygous Major vs Homozygous Minor | 2 | 160 | Risk Ratio (M‐H, Random, 95% CI) | 1.85 [0.77, 4.44] |
| 1.2 Heterozygous vs Homozygous Minor | 2 | 209 | Risk Ratio (M‐H, Random, 95% CI) | 1.58 [0.66, 3.77] |
| 2 End of Treatment Show forest plot | 4 | Risk Ratio (M‐H, Random, 95% CI) | Subtotals only | |
| Analysis 107.2 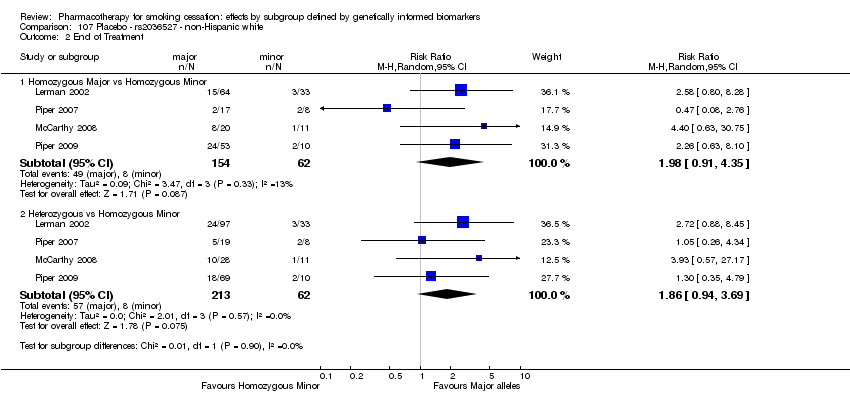 Comparison 107 Placebo ‐ rs2036527 ‐ non‐Hispanic white, Outcome 2 End of Treatment. | ||||
| 2.1 Homozygous Major vs Homozygous Minor | 4 | 216 | Risk Ratio (M‐H, Random, 95% CI) | 1.98 [0.91, 4.35] |
| 2.2 Heterozygous vs Homozygous Minor | 4 | 275 | Risk Ratio (M‐H, Random, 95% CI) | 1.86 [0.94, 3.69] |
| Outcome or subgroup title | No. of studies | No. of participants | Statistical method | Effect size |
| 1 Six‐Month Abstinence Show forest plot | 4 | Risk Ratio (M‐H, Random, 95% CI) | Subtotals only | |
| Analysis 108.1  Comparison 108 Placebo ‐ rs2036527 ‐ non‐Hispanic black or African American, Outcome 1 Six‐Month Abstinence. | ||||
| 1.1 Homozygous Major vs Heterozygous or Homozygous Minor | 4 | 629 | Risk Ratio (M‐H, Random, 95% CI) | 1.12 [0.71, 1.77] |
| 2 End of Treatment Show forest plot | 5 | Risk Ratio (M‐H, Random, 95% CI) | Subtotals only | |
| Analysis 108.2  Comparison 108 Placebo ‐ rs2036527 ‐ non‐Hispanic black or African American, Outcome 2 End of Treatment. | ||||
| 2.1 Homozygous Major vs Heterozygous or Homozygous Minor | 5 | 641 | Risk Ratio (M‐H, Random, 95% CI) | 1.08 [0.71, 1.64] |
| Outcome or subgroup title | No. of studies | No. of participants | Statistical method | Effect size |
| 1 Six‐Month Abstinence Show forest plot | 3 | Risk Ratio (M‐H, Random, 95% CI) | Subtotals only | |
| Analysis 109.1  Comparison 109 Placebo ‐ DRD‐4 (exon 3 48 bp) ‐ non‐Hispanic white, Outcome 1 Six‐Month Abstinence. | ||||
| 1.1 Homozygous Major vs Homozygous Minor | 3 | 387 | Risk Ratio (M‐H, Random, 95% CI) | 1.07 [0.37, 3.16] |
| 1.2 Heterozygous vs Homozygous Minor | 3 | 212 | Risk Ratio (M‐H, Random, 95% CI) | 0.60 [0.22, 1.63] |
| 2 End of Treatment Show forest plot | 3 | Risk Ratio (M‐H, Random, 95% CI) | Subtotals only | |
| Analysis 109.2  Comparison 109 Placebo ‐ DRD‐4 (exon 3 48 bp) ‐ non‐Hispanic white, Outcome 2 End of Treatment. | ||||
| 2.1 Homozygous Major vs Homozygous Minor | 3 | 387 | Risk Ratio (M‐H, Random, 95% CI) | 1.08 [0.51, 2.29] |
| 2.2 Heterozygous vs Homozygous Minor | 3 | 212 | Risk Ratio (M‐H, Random, 95% CI) | 0.88 [0.61, 1.29] |
| Outcome or subgroup title | No. of studies | No. of participants | Statistical method | Effect size |
| 1 Six‐Month Abstinence Show forest plot | 2 | Risk Ratio (M‐H, Random, 95% CI) | Subtotals only | |
| Analysis 110.1 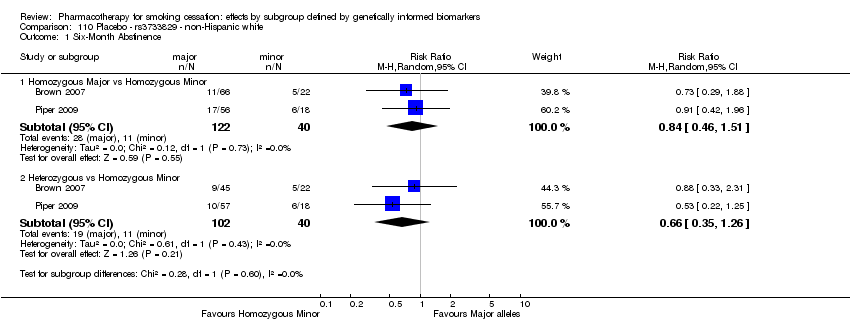 Comparison 110 Placebo ‐ rs3733829 ‐ non‐Hispanic white, Outcome 1 Six‐Month Abstinence. | ||||
| 1.1 Homozygous Major vs Homozygous Minor | 2 | 162 | Risk Ratio (M‐H, Random, 95% CI) | 0.84 [0.46, 1.51] |
| 1.2 Heterozygous vs Homozygous Minor | 2 | 142 | Risk Ratio (M‐H, Random, 95% CI) | 0.66 [0.35, 1.26] |
| 2 End of Treatment Show forest plot | 4 | Risk Ratio (M‐H, Random, 95% CI) | Subtotals only | |
| Analysis 110.2  Comparison 110 Placebo ‐ rs3733829 ‐ non‐Hispanic white, Outcome 2 End of Treatment. | ||||
| 2.1 Homozygous Major vs Homozygous Minor | 4 | 215 | Risk Ratio (M‐H, Random, 95% CI) | 1.23 [0.74, 2.05] |
| 2.2 Heterozygous vs Homozygous Minor | 4 | 203 | Risk Ratio (M‐H, Random, 95% CI) | 0.97 [0.57, 1.65] |
| Outcome or subgroup title | No. of studies | No. of participants | Statistical method | Effect size |
| 1 End of Treatment Show forest plot | 3 | Risk Ratio (M‐H, Random, 95% CI) | Subtotals only | |
| Analysis 111.1  Comparison 111 Placebo ‐ rs7937 ‐ non‐Hispanic white, Outcome 1 End of Treatment. | ||||
| 1.1 Homozygous Major vs Homozygous Minor | 3 | 113 | Risk Ratio (M‐H, Random, 95% CI) | 0.81 [0.45, 1.45] |
| 1.2 Heterozygous vs Homozygous Minor | 3 | 160 | Risk Ratio (M‐H, Random, 95% CI) | 0.95 [0.57, 1.60] |
| Outcome or subgroup title | No. of studies | No. of participants | Statistical method | Effect size |
| 1 End of Treatment Show forest plot | 2 | Risk Ratio (M‐H, Random, 95% CI) | Subtotals only | |
| Analysis 112.1  Comparison 112 Placebo ‐ rs7937 ‐ non‐Hispanic black or African American, Outcome 1 End of Treatment. | ||||
| 1.1 Homozygous Major vs Heterozygous or Homozygous Minor | 2 | 29 | Risk Ratio (M‐H, Random, 95% CI) | 1.17 [0.27, 5.04] |
| Outcome or subgroup title | No. of studies | No. of participants | Statistical method | Effect size |
| 1 End of Treatment Show forest plot | 3 | Risk Ratio (M‐H, Random, 95% CI) | Subtotals only | |
| Analysis 113.1  Comparison 113 Placebo ‐ rs1329650 ‐ non‐Hispanic white, Outcome 1 End of Treatment. | ||||
| 1.1 Homozygous Major vs Homozygous Minor | 3 | 129 | Risk Ratio (M‐H, Random, 95% CI) | 0.81 [0.18, 3.62] |
| 1.2 Heterozygous vs Homozygous Minor | 3 | 116 | Risk Ratio (M‐H, Random, 95% CI) | 0.80 [0.39, 1.63] |
| Outcome or subgroup title | No. of studies | No. of participants | Statistical method | Effect size |
| 1 End of Treatment Show forest plot | 2 | Risk Ratio (M‐H, Random, 95% CI) | Subtotals only | |
| Analysis 114.1  Comparison 114 Placebo ‐ rs1329650 ‐ non‐Hispanic black or African American, Outcome 1 End of Treatment. | ||||
| 1.1 Homozygous Major vs Heterozygous or Homozygous Minor | 2 | 29 | Risk Ratio (M‐H, Random, 95% CI) | 0.72 [0.19, 2.78] |
| Outcome or subgroup title | No. of studies | No. of participants | Statistical method | Effect size |
| 1 End of Treatment Show forest plot | 3 | Risk Ratio (M‐H, Random, 95% CI) | Subtotals only | |
| Analysis 115.1  Comparison 115 Placebo ‐ rs1028936 ‐ non‐Hispanic white, Outcome 1 End of Treatment. | ||||
| 1.1 Homozygous Major vs Homozygous Minor | 3 | 163 | Risk Ratio (M‐H, Random, 95% CI) | 0.95 [0.29, 3.14] |
| 1.2 Heterozygous vs Homozygous Minor | 3 | 77 | Risk Ratio (M‐H, Random, 95% CI) | 1.20 [0.36, 4.03] |
| Outcome or subgroup title | No. of studies | No. of participants | Statistical method | Effect size |
| 1 End of Treatment Show forest plot | 2 | Risk Ratio (M‐H, Random, 95% CI) | Subtotals only | |
| Analysis 116.1  Comparison 116 Placebo ‐ rs1028936 ‐ non‐Hispanic black or African American, Outcome 1 End of Treatment. | ||||
| 1.1 Homozygous Major vs Heterozygous or Homozygous Minor | 2 | 29 | Risk Ratio (M‐H, Random, 95% CI) | 0.49 [0.18, 1.32] |
| Outcome or subgroup title | No. of studies | No. of participants | Statistical method | Effect size |
| 1 End of Treatment Show forest plot | 3 | Risk Ratio (M‐H, Random, 95% CI) | Subtotals only | |
| Analysis 117.1  Comparison 117 Placebo ‐ rs215605 ‐ non‐Hispanic white, Outcome 1 End of Treatment. | ||||
| 1.1 Homozygous Major vs Homozygous Minor | 3 | 129 | Risk Ratio (M‐H, Random, 95% CI) | 0.97 [0.52, 1.82] |
| 1.2 Heterozygous vs Homozygous Minor | 3 | 140 | Risk Ratio (M‐H, Random, 95% CI) | 1.15 [0.63, 2.12] |
| Outcome or subgroup title | No. of studies | No. of participants | Statistical method | Effect size |
| 1 End of Treatment Show forest plot | 2 | Risk Ratio (M‐H, Random, 95% CI) | Subtotals only | |
| Analysis 118.1  Comparison 118 Placebo ‐ rs215605 ‐ non‐Hispanic black or African American, Outcome 1 End of Treatment. | ||||
| 1.1 Homozygous Major vs Heterozygous or Homozygous Minor | 2 | 29 | Risk Ratio (M‐H, Random, 95% CI) | 0.98 [0.03, 38.58] |
| Outcome or subgroup title | No. of studies | No. of participants | Statistical method | Effect size |
| 1 Six‐Month Abstinence Show forest plot | 2 | Risk Ratio (M‐H, Random, 95% CI) | Subtotals only | |
| Analysis 119.1  Comparison 119 Placebo ‐ SLC6A4 (Promoter) ‐ non‐Hispanic white, Outcome 1 Six‐Month Abstinence. | ||||
| 1.1 Homozygous Major or Heterozygous vs Homozygous Minor | 2 | 151 | Risk Ratio (M‐H, Random, 95% CI) | 0.75 [0.32, 1.79] |
| 2 End of Treatment Show forest plot | 2 | Risk Ratio (M‐H, Random, 95% CI) | Subtotals only | |
| Analysis 119.2  Comparison 119 Placebo ‐ SLC6A4 (Promoter) ‐ non‐Hispanic white, Outcome 2 End of Treatment. | ||||
| 2.1 Homozygous Major or Heterozygous vs Homozygous Minor | 2 | 151 | Risk Ratio (M‐H, Random, 95% CI) | 1.07 [0.83, 1.38] |
| Outcome or subgroup title | No. of studies | No. of participants | Statistical method | Effect size |
| 1 Six‐Month Abstinence Show forest plot | 2 | Risk Ratio (M‐H, Random, 95% CI) | Subtotals only | |
| Analysis 120.1  Comparison 120 Placebo ‐ NMR ‐ non‐Hispanic white or black or African American, Outcome 1 Six‐Month Abstinence. | ||||
| 1.1 Normal NMR vs Slow NMR | 2 | 699 | Risk Ratio (M‐H, Random, 95% CI) | 1.02 [0.70, 1.48] |
| 2 End of Treatment Show forest plot | 2 | Risk Ratio (M‐H, Random, 95% CI) | Subtotals only | |
| Analysis 120.2  Comparison 120 Placebo ‐ NMR ‐ non‐Hispanic white or black or African American, Outcome 2 End of Treatment. | ||||
| 2.1 Normal NMR vs Slow NMR | 2 | 718 | Risk Ratio (M‐H, Random, 95% CI) | 0.63 [0.35, 1.14] |

Flow diagram of the search and study selection.

Risk of bias summary: review authors' judgements about each risk of bias item for each study.

Risk of bias graph: review authors' judgements about each risk of bias item presented as percentages across all included studies.

Comparison 1 Active NRT vs placebo ‐ rs1051730 ‐ non‐Hispanic white, Outcome 1 Six‐Month Abstinence.

Comparison 1 Active NRT vs placebo ‐ rs1051730 ‐ non‐Hispanic white, Outcome 2 End of Treatment.

Comparison 2 Active NRT vs placebo ‐ rs16969968 ‐ non‐Hispanic white, Outcome 1 End of Treatment.
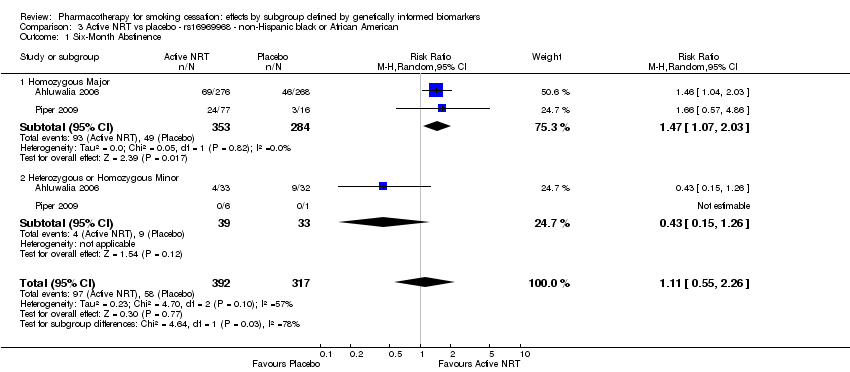
Comparison 3 Active NRT vs placebo ‐ rs16969968 ‐ non‐Hispanic black or African American, Outcome 1 Six‐Month Abstinence.

Comparison 3 Active NRT vs placebo ‐ rs16969968 ‐ non‐Hispanic black or African American, Outcome 2 End of Treatment.

Comparison 4 Active NRT vs placebo ‐ rs 588765 ‐ non‐Hispanic white, Outcome 1 End of Treatment.
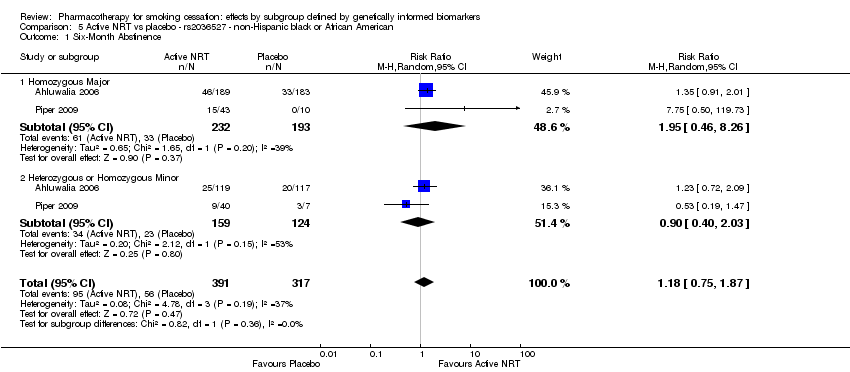
Comparison 5 Active NRT vs placebo ‐ rs2036527 ‐ non‐Hispanic black or African American, Outcome 1 Six‐Month Abstinence.
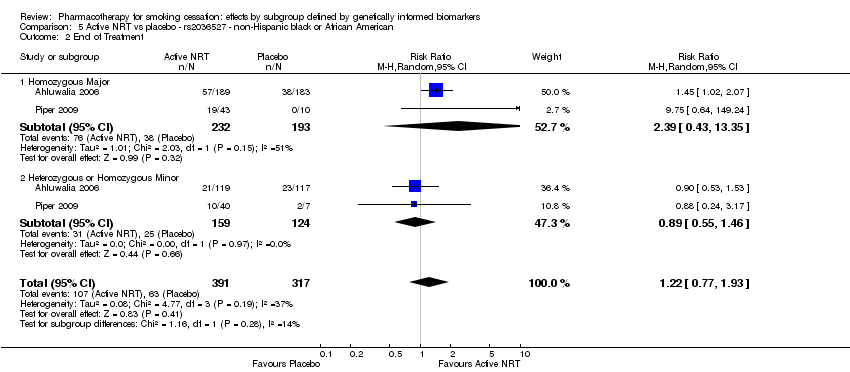
Comparison 5 Active NRT vs placebo ‐ rs2036527 ‐ non‐Hispanic black or African American, Outcome 2 End of Treatment.
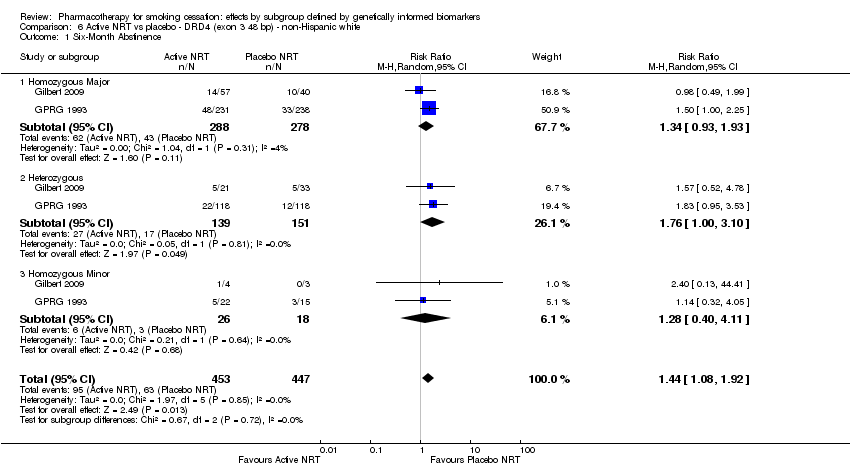
Comparison 6 Active NRT vs placebo ‐ DRD4 (exon 3 48 bp) ‐ non‐Hispanic white, Outcome 1 Six‐Month Abstinence.
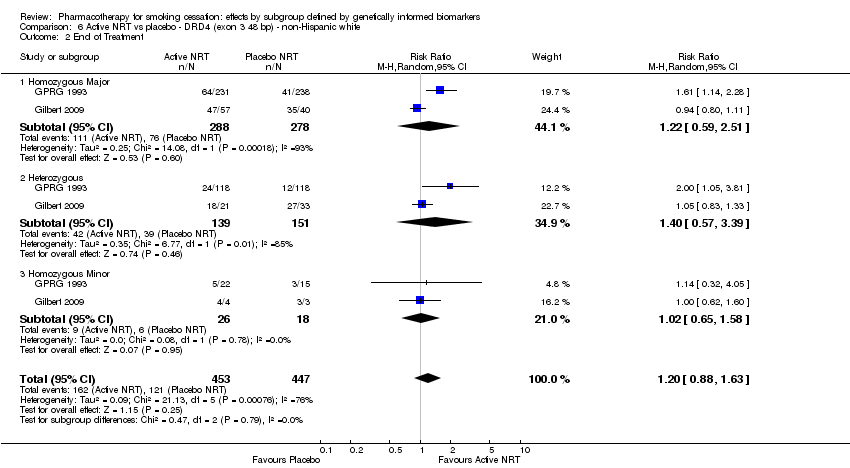
Comparison 6 Active NRT vs placebo ‐ DRD4 (exon 3 48 bp) ‐ non‐Hispanic white, Outcome 2 End of Treatment.

Comparison 7 Active NRT vs placebo ‐ NMR ‐ non‐Hispanic black and white, Outcome 1 Six‐Month Abstinence.

Comparison 7 Active NRT vs placebo ‐ NMR ‐ non‐Hispanic black and white, Outcome 2 End of Treatment.

Comparison 8 Bupropion vs placebo ‐ rs1051730 ‐ non‐Hispanic white, Outcome 1 Six‐Month Abstinence.
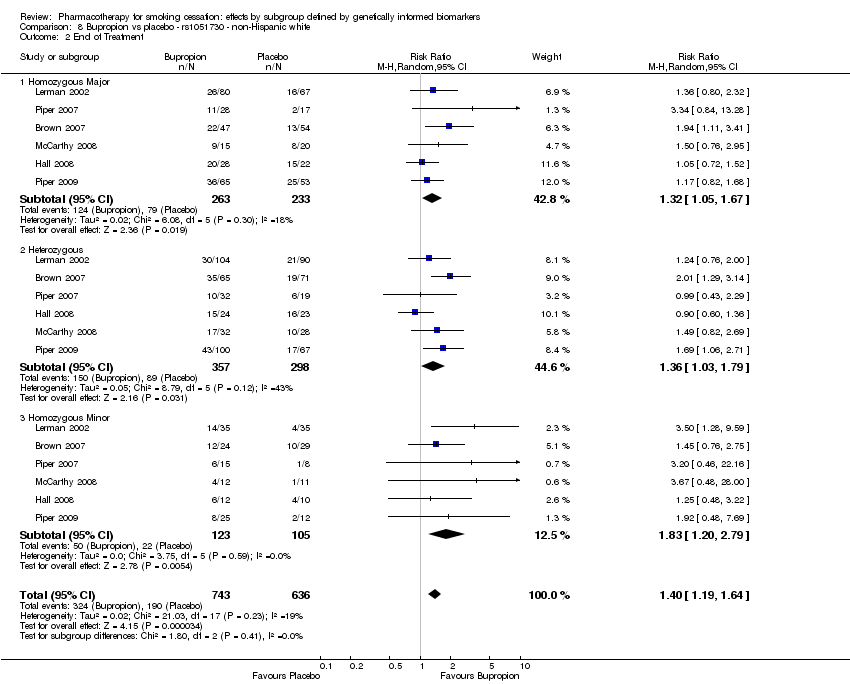
Comparison 8 Bupropion vs placebo ‐ rs1051730 ‐ non‐Hispanic white, Outcome 2 End of Treatment.

Comparison 9 Bupropion vs placebo ‐ rs1051730 ‐ non‐Hispanic black or African American, Outcome 1 Six‐Month Abstinence.

Comparison 9 Bupropion vs placebo ‐ rs1051730 ‐ non‐Hispanic black or African American, Outcome 2 End of Treatment.

Comparison 10 Bupropion vs placebo ‐ rs16969968 ‐ non‐Hispanic white, Outcome 1 End of Treatment.

Comparison 11 Bupropion vs placebo ‐ rs16969968 ‐ non‐Hispanic black or African American, Outcome 1 Six‐Month Abstinence.

Comparison 11 Bupropion vs placebo ‐ rs16969968 ‐ non‐Hispanic black or African American, Outcome 2 End of Treatment.

Comparison 12 Bupropion vs placebo ‐ rs588765 ‐ non‐Hispanic white, Outcome 1 Six‐Month Abstinence.

Comparison 12 Bupropion vs placebo ‐ rs588765 ‐ non‐Hispanic white, Outcome 2 End of Treatment.

Comparison 13 Bupropion vs placebo ‐ rs2036527 ‐ non‐Hispanic white, Outcome 1 Six‐Month Abstinence.

Comparison 13 Bupropion vs placebo ‐ rs2036527 ‐ non‐Hispanic white, Outcome 2 End of Treatment.

Comparison 14 Bupropion vs placebo ‐ rs2036527 ‐ non‐Hispanic black or African American, Outcome 1 Six‐Month Abstinence.

Comparison 14 Bupropion vs placebo ‐ rs2036527 ‐ non‐Hispanic black or African American, Outcome 2 End of Treatment.

Comparison 15 Bupropion vs placebo ‐ rs3733829 ‐ non‐Hispanic white, Outcome 1 Six‐Month Abstinence.

Comparison 15 Bupropion vs placebo ‐ rs3733829 ‐ non‐Hispanic white, Outcome 2 End of Treatment.

Comparison 16 Bupropion vs placebo ‐ rs3733829 ‐ non‐Hispanic black or African American, Outcome 1 End of Treatment.

Comparison 17 Bupropion vs placebo ‐ rs7937 ‐ non‐Hispanic white, Outcome 1 End of Treatment.

Comparison 18 Bupropion vs placebo ‐ rs7937 ‐ non‐Hispanic black or African American, Outcome 1 End of Treatment.

Comparison 19 Bupropion vs placebo ‐ rs1329650 ‐ non‐Hispanic white, Outcome 1 End of Treatment.

Comparison 20 Bupropion vs placebo ‐ rs1329650 ‐ non‐Hispanic black or African American, Outcome 1 End of Treatment.

Comparison 21 Bupropion vs placebo ‐ rs1028936 ‐ non‐Hispanic white, Outcome 1 End of Treatment.

Comparison 22 Bupropion vs placebo ‐ rs1028936 ‐ non‐Hispanic black or African American, Outcome 1 End of Treatment.
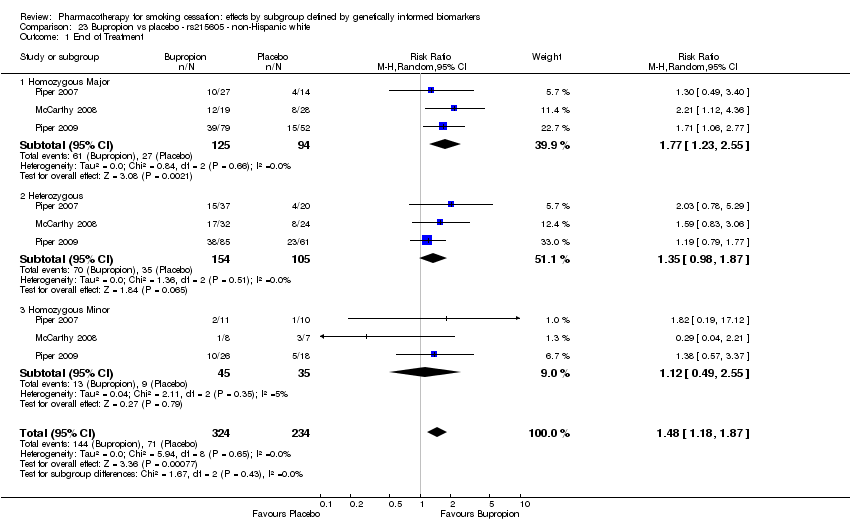
Comparison 23 Bupropion vs placebo ‐ rs215605 ‐ non‐Hispanic white, Outcome 1 End of Treatment.

Comparison 24 Bupropion vs placebo ‐ rs215605 ‐ non‐Hispanic black or African American, Outcome 1 End of Treatment.

Comparison 25 Bupropion + any NRT vs placebo ‐ rs1051730 ‐ non‐Hispanic white, Outcome 1 End of Treatment.

Comparison 26 Bupropion + any NRT vs placebo ‐ rs1051730 ‐ non‐Hispanic black or African American, Outcome 1 End of Treatment.
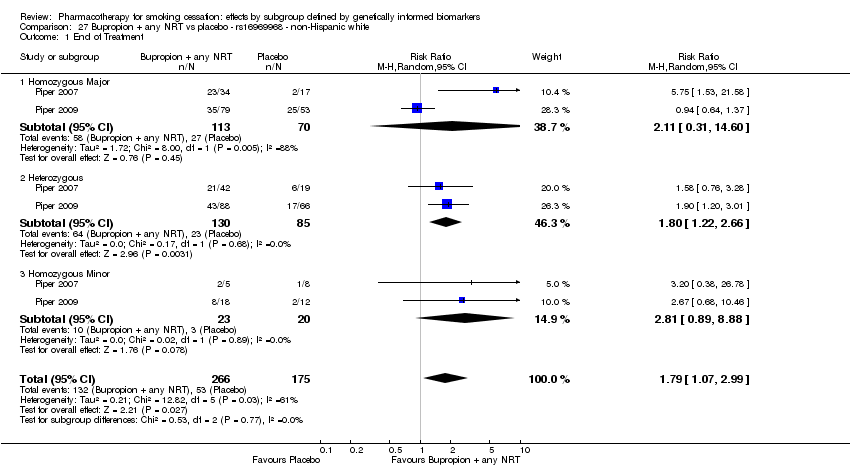
Comparison 27 Bupropion + any NRT vs placebo ‐ rs16969968 ‐ non‐Hispanic white, Outcome 1 End of Treatment.
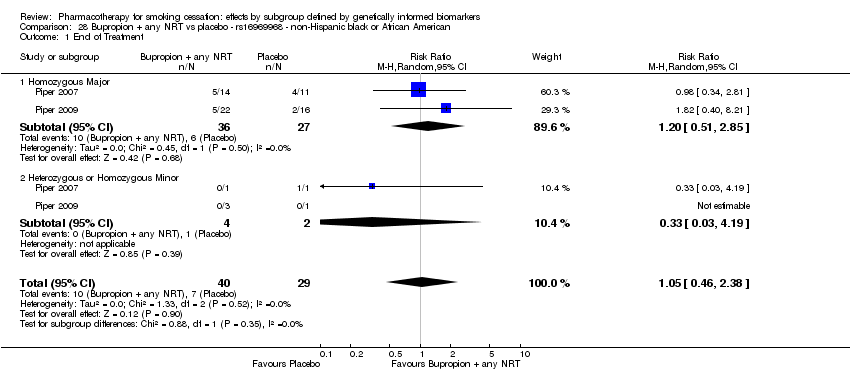
Comparison 28 Bupropion + any NRT vs placebo ‐ rs16969968 ‐ non‐Hispanic black or African American, Outcome 1 End of Treatment.
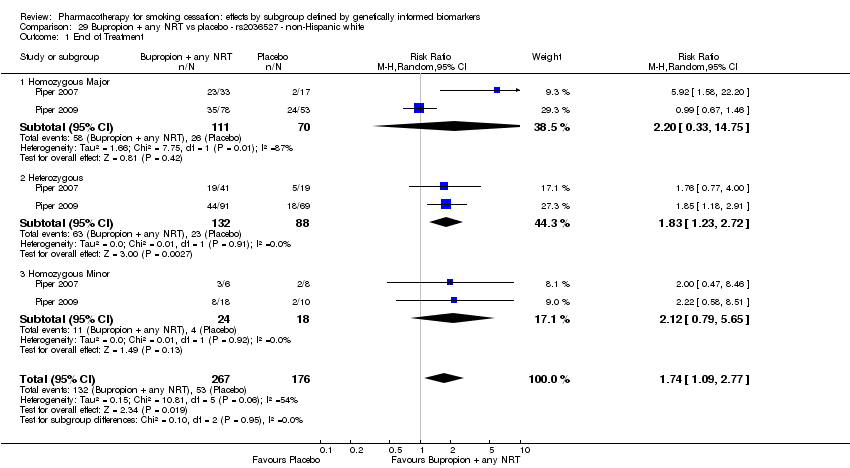
Comparison 29 Bupropion + any NRT vs placebo ‐ rs2036527 ‐ non‐Hispanic white, Outcome 1 End of Treatment.

Comparison 30 Bupropion + any NRT vs placebo ‐ rs2036527 ‐ non‐Hispanic black or African American, Outcome 1 End of Treatment.

Comparison 31 Bupropion + any NRT vs placebo ‐ rs3733829 ‐ non‐Hispanic white, Outcome 1 End of Treatment.

Comparison 32 Bupropion + any NRT vs placebo ‐ rs3733829 ‐ non‐Hispanic black or African American, Outcome 1 End of Treatment.

Comparison 33 Bupropion + any NRT vs placebo ‐ rs7937 ‐ non‐Hispanic white, Outcome 1 End of Treatment.

Comparison 34 Bupropion + any NRT vs placebo ‐ rs7937 ‐ non‐Hispanic black or African American, Outcome 1 End of Treatment.

Comparison 35 Bupropion + any NRT vs placebo ‐ rs1329650 ‐ non‐Hispanic white, Outcome 1 End of Treatment.

Comparison 36 Bupropion + any NRT vs placebo ‐ rs1329650 ‐ non‐Hispanic black or African American, Outcome 1 End of Treatment.

Comparison 37 Bupropion + any NRT vs placebo ‐ rs1028936 ‐ non‐Hispanic white, Outcome 1 End of Treatment.
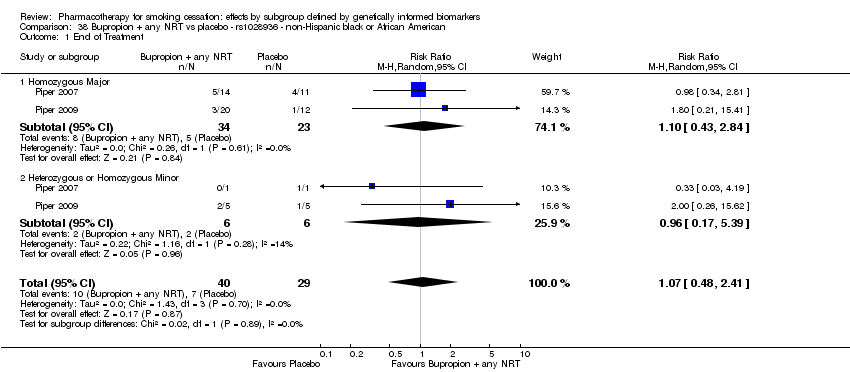
Comparison 38 Bupropion + any NRT vs placebo ‐ rs1028936 ‐ non‐Hispanic black or African American, Outcome 1 End of Treatment.

Comparison 39 Bupropion + any NRT vs placebo ‐ rs215605 ‐ non‐Hispanic white, Outcome 1 End of Treatment.
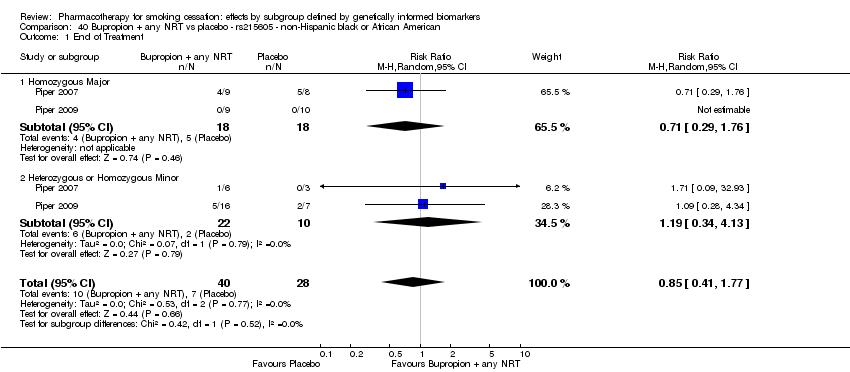
Comparison 40 Bupropion + any NRT vs placebo ‐ rs215605 ‐ non‐Hispanic black or African American, Outcome 1 End of Treatment.

Comparison 41 Bupropion + any NRT vs bupropion ‐ rs1051730 ‐ non‐Hispanic white, Outcome 1 End of Treatment.

Comparison 42 Bupropion + any NRT vs bupropion ‐ rs1051730 ‐ non‐Hispanic black or African American, Outcome 1 End of Treatment.
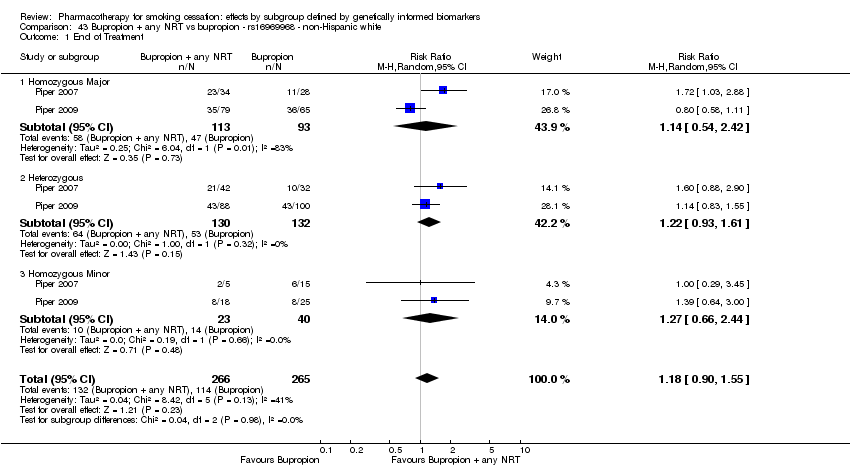
Comparison 43 Bupropion + any NRT vs bupropion ‐ rs16969968 ‐ non‐Hispanic white, Outcome 1 End of Treatment.

Comparison 44 Bupropion + any NRT vs bupropion ‐ rs16969968 ‐ non‐Hispanic black or African American, Outcome 1 End of Treatment.

Comparison 45 Bupropion + any NRT vs bupropion ‐ rs2036527 ‐ non‐Hispanic white, Outcome 1 End of Treatment.

Comparison 46 Bupropion + any NRT vs bupropion ‐ rs2036527 ‐ non‐Hispanic black or African American, Outcome 1 End of Treatment.

Comparison 47 Bupropion + any NRT vs bupropion ‐ rs3733829 ‐ non‐Hispanic white, Outcome 1 End of Treatment.

Comparison 48 Bupropion + any NRT vs bupropion ‐ rs3733829 ‐ non‐Hispanic black or African American, Outcome 1 End of Treatment.

Comparison 49 Bupropion + any NRT vs bupropion ‐ rs7937 ‐ non‐Hispanic white, Outcome 1 End of Treatment.

Comparison 50 Bupropion + any NRT vs bupropion ‐ rs7937 ‐ non‐Hispanic black or African American, Outcome 1 End of Treatment.

Comparison 51 Bupropion + any NRT vs bupropion ‐ rs1329650 ‐ non‐Hispanic white, Outcome 1 End of Treatment.

Comparison 52 Bupropion + any NRT vs bupropion ‐ rs1329650 ‐ non‐Hispanic black or African American, Outcome 1 End of Treatment.

Comparison 53 Bupropion + any NRT vs bupropion ‐ rs1028936 ‐ non‐Hispanic white, Outcome 1 End of Treatment.
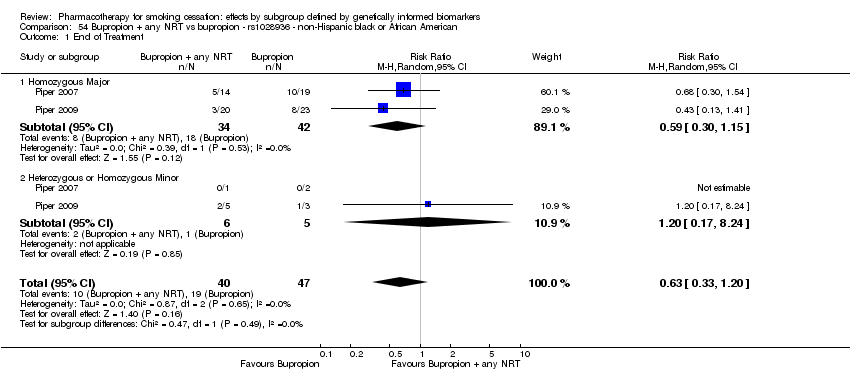
Comparison 54 Bupropion + any NRT vs bupropion ‐ rs1028936 ‐ non‐Hispanic black or African American, Outcome 1 End of Treatment.

Comparison 55 Bupropion + any NRT vs bupropion ‐ rs215605 ‐ non‐Hispanic white, Outcome 1 End of Treatment.

Comparison 56 Bupropion + any NRT vs bupropion ‐ rs215605 ‐ non‐Hispanic black or African American, Outcome 1 End of Treatment.
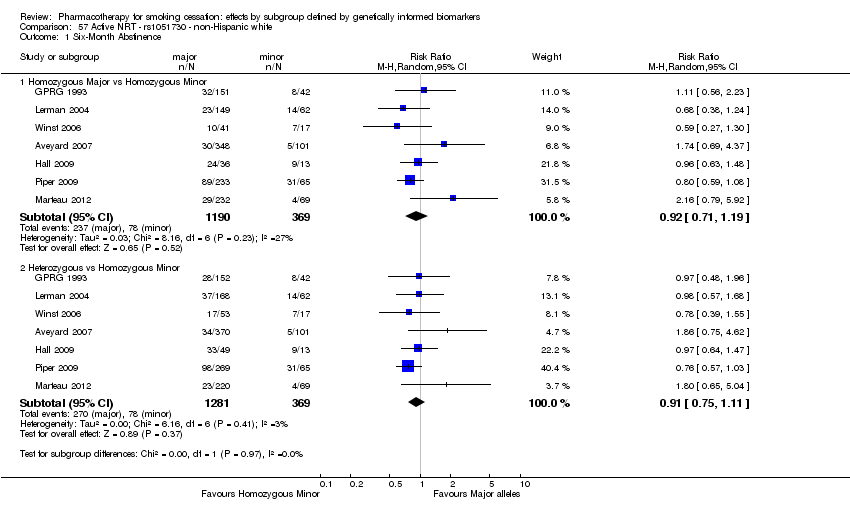
Comparison 57 Active NRT ‐ rs1051730 ‐ non‐Hispanic white, Outcome 1 Six‐Month Abstinence.

Comparison 57 Active NRT ‐ rs1051730 ‐ non‐Hispanic white, Outcome 2 End of Treatment.

Comparison 58 Active NRT ‐ rs1051730 ‐ non‐Hispanic black or African American, Outcome 1 Six‐Month Abstinence.

Comparison 59 Active NRT ‐ rs16969968 ‐ non‐Hispanic black or African American, Outcome 1 Six‐Month Abstinence.

Comparison 59 Active NRT ‐ rs16969968 ‐ non‐Hispanic black or African American, Outcome 2 End of Treatment.

Comparison 60 Active NRT ‐ rs588765 ‐ non‐Hispanic white, Outcome 1 Six‐Month Abstinence.

Comparison 60 Active NRT ‐ rs588765 ‐ non‐Hispanic white, Outcome 2 End of Treatment.
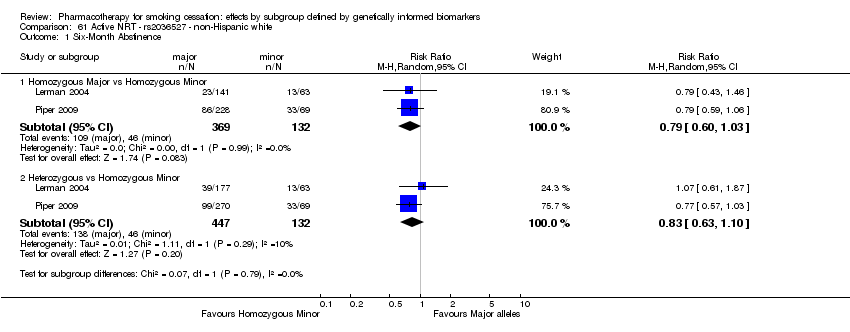
Comparison 61 Active NRT ‐ rs2036527 ‐ non‐Hispanic white, Outcome 1 Six‐Month Abstinence.

Comparison 61 Active NRT ‐ rs2036527 ‐ non‐Hispanic white, Outcome 2 End of Treatment.

Comparison 62 Active NRT ‐ rs2036527 ‐ non‐Hispanic black or African American, Outcome 1 Six‐Month Abstinence.

Comparison 62 Active NRT ‐ rs2036527 ‐ non‐Hispanic black or African American, Outcome 2 End of Treatment.
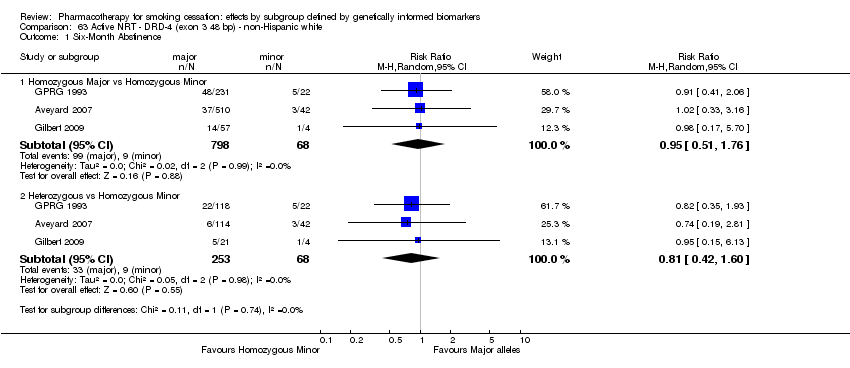
Comparison 63 Active NRT ‐ DRD‐4 (exon 3 48 bp) ‐ non‐Hispanic white, Outcome 1 Six‐Month Abstinence.
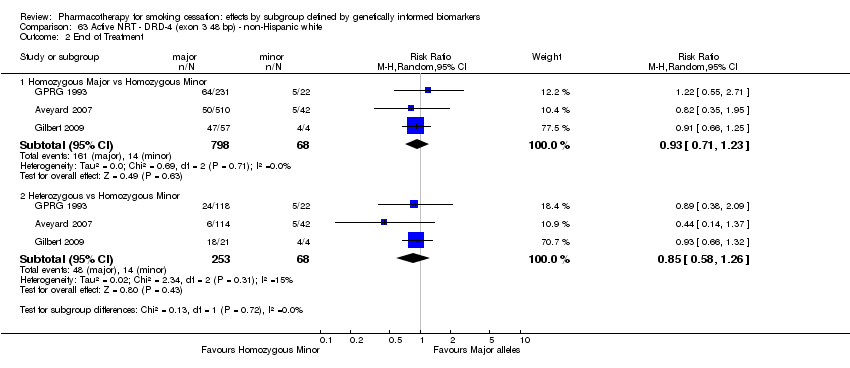
Comparison 63 Active NRT ‐ DRD‐4 (exon 3 48 bp) ‐ non‐Hispanic white, Outcome 2 End of Treatment.
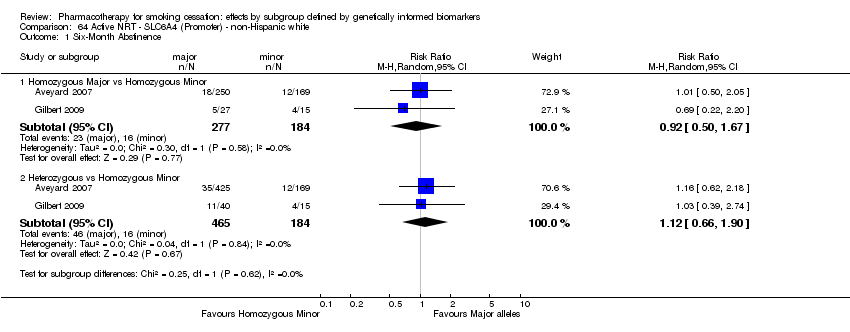
Comparison 64 Active NRT ‐ SLC6A4 (Promoter) ‐ non‐Hispanic white, Outcome 1 Six‐Month Abstinence.
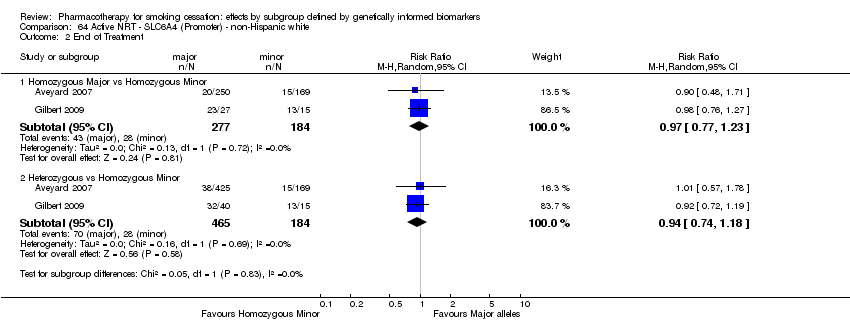
Comparison 64 Active NRT ‐ SLC6A4 (Promoter) ‐ non‐Hispanic white, Outcome 2 End of Treatment.

Comparison 65 Active NRT‐NMR ‐ non‐Hispanic white or black or African American, Outcome 1 Six‐Month Abstinence.

Comparison 65 Active NRT‐NMR ‐ non‐Hispanic white or black or African American, Outcome 2 End of Treatment.

Comparison 66 Bupropion ‐ rs1051730 ‐ non‐Hispanic white, Outcome 1 Six‐Month Abstinence.

Comparison 66 Bupropion ‐ rs1051730 ‐ non‐Hispanic white, Outcome 2 End of Treatment.

Comparison 67 Bupropion ‐ rs1051730 ‐ non‐Hispanic black or African American, Outcome 1 Six‐Month Abstinence.

Comparison 67 Bupropion ‐ rs1051730 ‐ non‐Hispanic black or African American, Outcome 2 End of Treatment.

Comparison 68 Bupropion ‐ rs16969968 ‐ non‐Hispanic white, Outcome 1 End of Treatment.
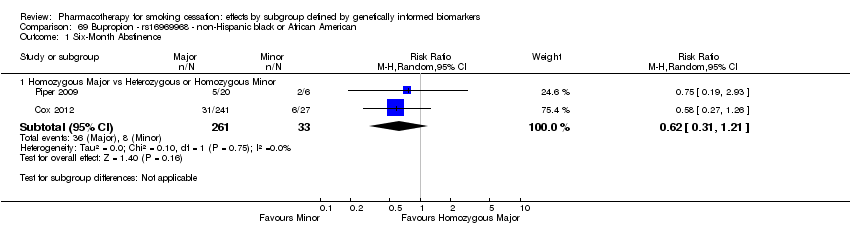
Comparison 69 Bupropion ‐ rs16969968 ‐ non‐Hispanic black or African American, Outcome 1 Six‐Month Abstinence.

Comparison 69 Bupropion ‐ rs16969968 ‐ non‐Hispanic black or African American, Outcome 2 End of Treatment.

Comparison 70 Bupropion ‐ rs588765 ‐ non‐Hispanic white, Outcome 1 Six‐Month Abstinence.

Comparison 70 Bupropion ‐ rs588765 ‐ non‐Hispanic white, Outcome 2 End of Treatment.

Comparison 71 Bupropion ‐ rs2036527 ‐ non‐Hispanic white, Outcome 1 Six‐Month Abstinence.

Comparison 71 Bupropion ‐ rs2036527 ‐ non‐Hispanic white, Outcome 2 End of Treatment.

Comparison 72 Bupropion ‐ rs2036527 ‐ non‐Hispanic black or African American, Outcome 1 Six‐Month Abstinence.

Comparison 72 Bupropion ‐ rs2036527 ‐ non‐Hispanic black or African American, Outcome 2 End of Treatment.

Comparison 73 Bupropion ‐ rs3733829 ‐ non‐Hispanic white, Outcome 1 Six‐Month Abstinence.

Comparison 73 Bupropion ‐ rs3733829 ‐ non‐Hispanic white, Outcome 2 End of Treatment.

Comparison 74 Bupropion ‐ rs3733829 ‐ non‐Hispanic black or African American, Outcome 1 End of Treatment.

Comparison 75 Bupropion ‐ rs7937 ‐ non‐Hispanic white, Outcome 1 End of Treatment.

Comparison 76 Bupropion ‐ rs7937 ‐ non‐Hispanic black or African American, Outcome 1 End of Treatment.
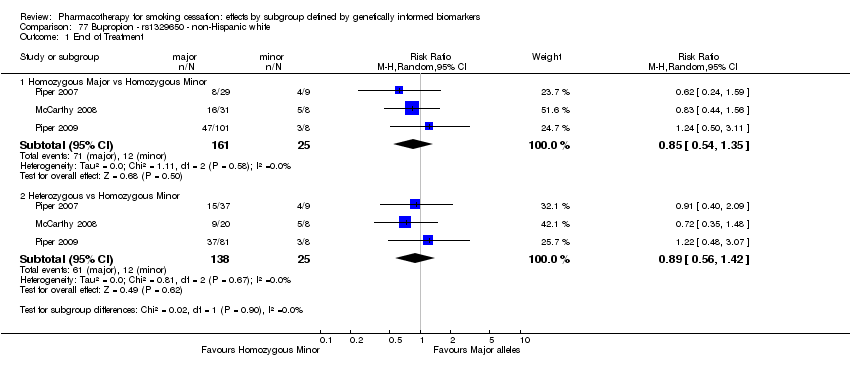
Comparison 77 Bupropion ‐ rs1329650 ‐ non‐Hispanic white, Outcome 1 End of Treatment.

Comparison 78 Bupropion ‐ rs1329650 ‐ non‐Hispanic black or African American, Outcome 1 End of Treatment.

Comparison 79 Bupropion ‐ rs1028936 ‐ non‐Hispanic white, Outcome 1 End of Treatment.

Comparison 80 Bupropion ‐ rs1028936 ‐ non‐Hispanic black or African American, Outcome 1 End of Treatment.

Comparison 81 Bupropion ‐ rs215605 ‐ non‐Hispanic white, Outcome 1 End of Treatment.
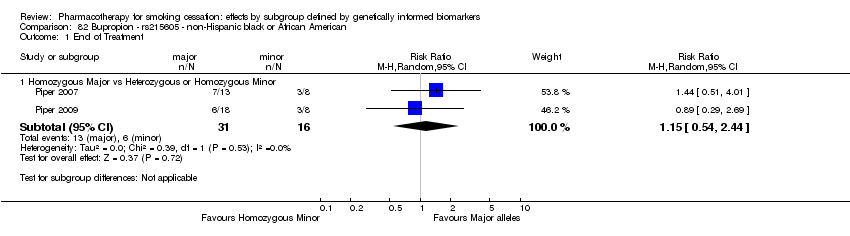
Comparison 82 Bupropion ‐ rs215605 ‐ non‐Hispanic black or African American, Outcome 1 End of Treatment.

Comparison 83 Varenicline ‐ rs16969968 ‐ non‐Hispanic white, Outcome 1 Six‐Month Abstinence.
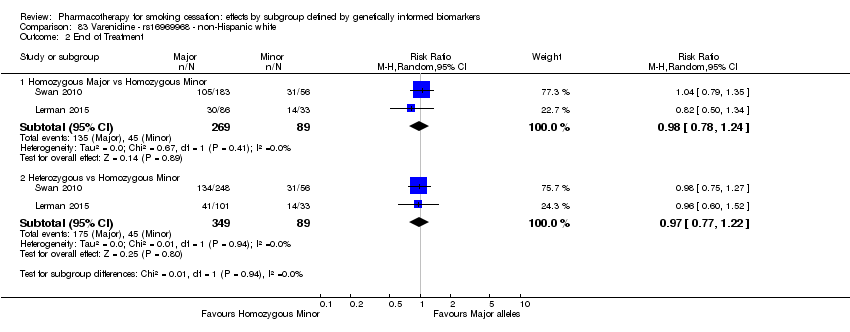
Comparison 83 Varenicline ‐ rs16969968 ‐ non‐Hispanic white, Outcome 2 End of Treatment.

Comparison 84 Varenicline ‐ rs588765 ‐ non‐Hispanic white, Outcome 1 Six‐Month Abstinence.
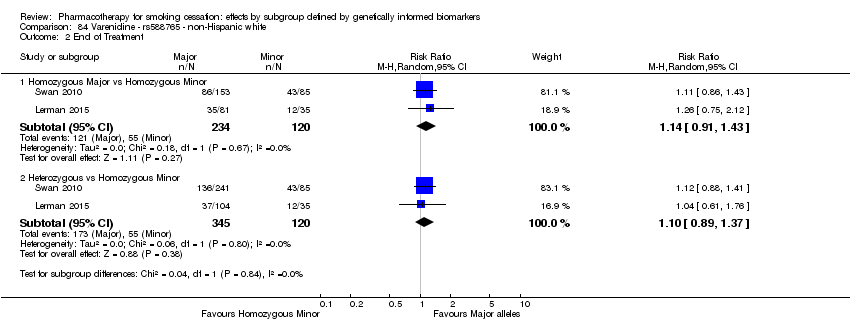
Comparison 84 Varenicline ‐ rs588765 ‐ non‐Hispanic white, Outcome 2 End of Treatment.
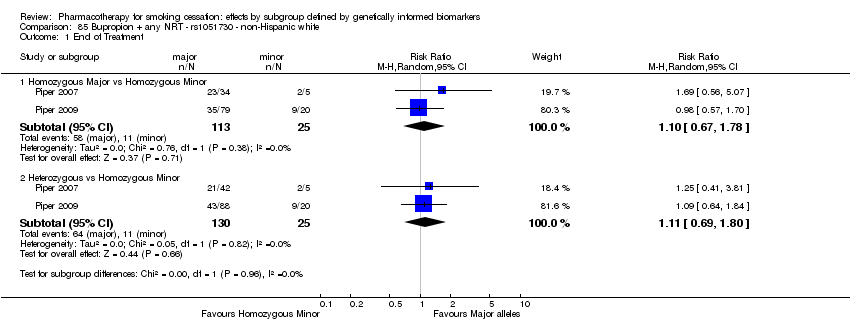
Comparison 85 Bupropion + any NRT ‐ rs1051730 ‐ non‐Hispanic white, Outcome 1 End of Treatment.

Comparison 86 Bupropion + any NRT ‐ rs1051730 ‐ non‐Hispanic black or African American, Outcome 1 End of Treatment.

Comparison 87 Bupropion + any NRT ‐ rs16969968 ‐ non‐Hispanic white, Outcome 1 End of Treatment.
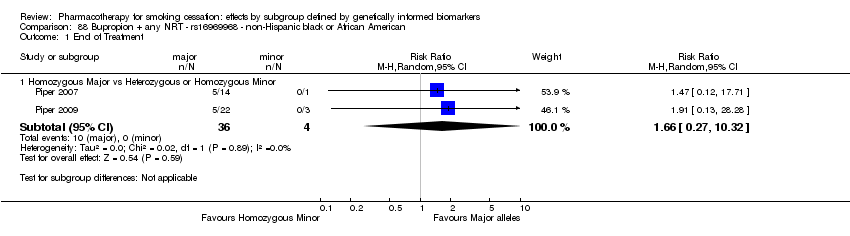
Comparison 88 Bupropion + any NRT ‐ rs16969968 ‐ non‐Hispanic black or African American, Outcome 1 End of Treatment.
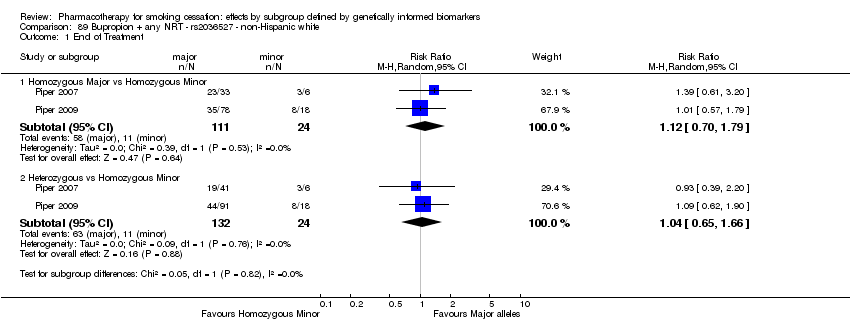
Comparison 89 Bupropion + any NRT ‐ rs2036527 ‐ non‐Hispanic white, Outcome 1 End of Treatment.
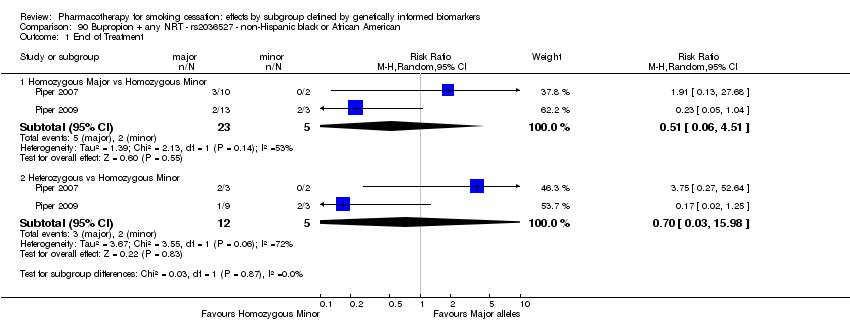
Comparison 90 Bupropion + any NRT ‐ rs2036527 ‐ non‐Hispanic black or African American, Outcome 1 End of Treatment.

Comparison 91 Bupropion + any NRT ‐ rs3733829 ‐ non‐Hispanic white, Outcome 1 End of Treatment.

Comparison 92 Bupropion + any NRT ‐ rs3733829 ‐ non‐Hispanic black or African American, Outcome 1 End of Treatment.

Comparison 93 Bupropion + any NRT ‐ rs7937 ‐ non‐Hispanic white, Outcome 1 End of Treatment.

Comparison 94 Bupropion + any NRT ‐ rs7937 ‐ non‐Hispanic black or African American, Outcome 1 End of Treatment.

Comparison 95 Bupropion + any NRT ‐ rs1329650 ‐ non‐Hispanic white, Outcome 1 End of Treatment.

Comparison 96 Bupropion + any NRT ‐ rs1329650 ‐ non‐Hispanic black or African American, Outcome 1 End of Treatment.

Comparison 97 Bupropion + any NRT ‐ rs1028936 ‐ non‐Hispanic white, Outcome 1 End of Treatment.

Comparison 98 Bupropion + any NRT ‐ rs1028936 ‐ non‐Hispanic black or African American, Outcome 1 End of Treatment.
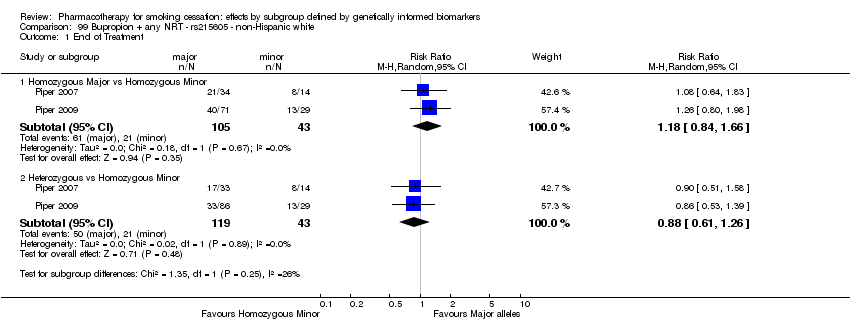
Comparison 99 Bupropion + any NRT ‐ rs215605 ‐ non‐Hispanic white, Outcome 1 End of Treatment.
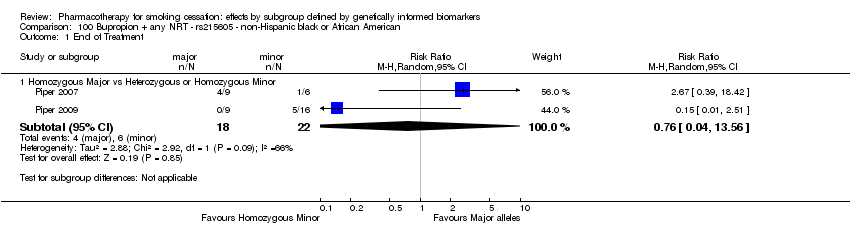
Comparison 100 Bupropion + any NRT ‐ rs215605 ‐ non‐Hispanic black or African American, Outcome 1 End of Treatment.

Comparison 101 Placebo ‐ rs1051730 ‐ non‐Hispanic white, Outcome 1 Six‐Month Abstinence.

Comparison 101 Placebo ‐ rs1051730 ‐ non‐Hispanic white, Outcome 2 End of Treatment.

Comparison 102 Placebo ‐ rs1051730 ‐ non‐Hispanic black or African American, Outcome 1 Six‐Month Abstinence.

Comparison 102 Placebo ‐ rs1051730 ‐ non‐Hispanic black or African American, Outcome 2 End of Treatment.

Comparison 103 Placebo ‐ rs16969968 ‐ non‐Hispanic white, Outcome 1 Six‐Month Abstinence.

Comparison 103 Placebo ‐ rs16969968 ‐ non‐Hispanic white, Outcome 2 End of Treatment.
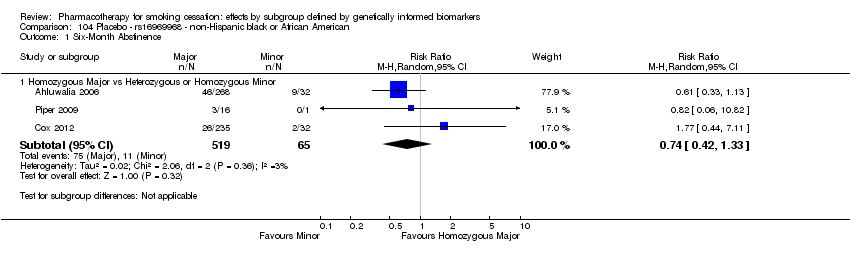
Comparison 104 Placebo ‐ rs16969968 ‐ non‐Hispanic black or African American, Outcome 1 Six‐Month Abstinence.

Comparison 104 Placebo ‐ rs16969968 ‐ non‐Hispanic black or African American, Outcome 2 End of Treatment.

Comparison 105 Placebo ‐ rs588765 ‐ non‐Hispanic white, Outcome 1 Six‐Month Abstinence.

Comparison 105 Placebo ‐ rs588765 ‐ non‐Hispanic white, Outcome 2 End of Treatment.

Comparison 106 Placebo ‐ rs588765 ‐ non‐Hispanic black or African American, Outcome 1 Six‐Month Abstinence.

Comparison 106 Placebo ‐ rs588765 ‐ non‐Hispanic black or African American, Outcome 2 End of Treatment.

Comparison 107 Placebo ‐ rs2036527 ‐ non‐Hispanic white, Outcome 1 Six‐Month Abstinence.

Comparison 107 Placebo ‐ rs2036527 ‐ non‐Hispanic white, Outcome 2 End of Treatment.

Comparison 108 Placebo ‐ rs2036527 ‐ non‐Hispanic black or African American, Outcome 1 Six‐Month Abstinence.

Comparison 108 Placebo ‐ rs2036527 ‐ non‐Hispanic black or African American, Outcome 2 End of Treatment.
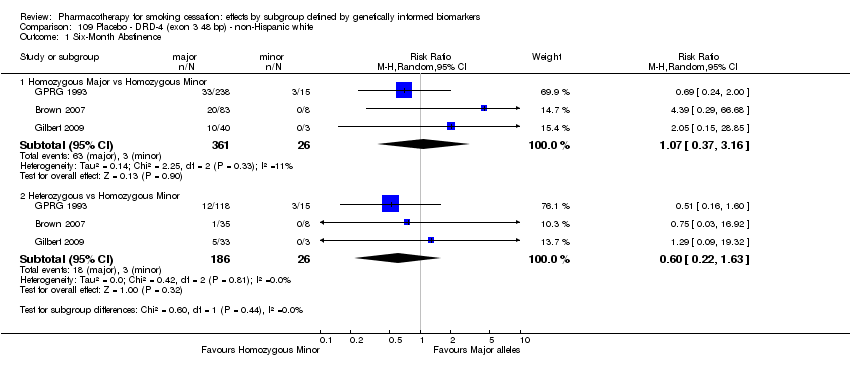
Comparison 109 Placebo ‐ DRD‐4 (exon 3 48 bp) ‐ non‐Hispanic white, Outcome 1 Six‐Month Abstinence.

Comparison 109 Placebo ‐ DRD‐4 (exon 3 48 bp) ‐ non‐Hispanic white, Outcome 2 End of Treatment.

Comparison 110 Placebo ‐ rs3733829 ‐ non‐Hispanic white, Outcome 1 Six‐Month Abstinence.

Comparison 110 Placebo ‐ rs3733829 ‐ non‐Hispanic white, Outcome 2 End of Treatment.
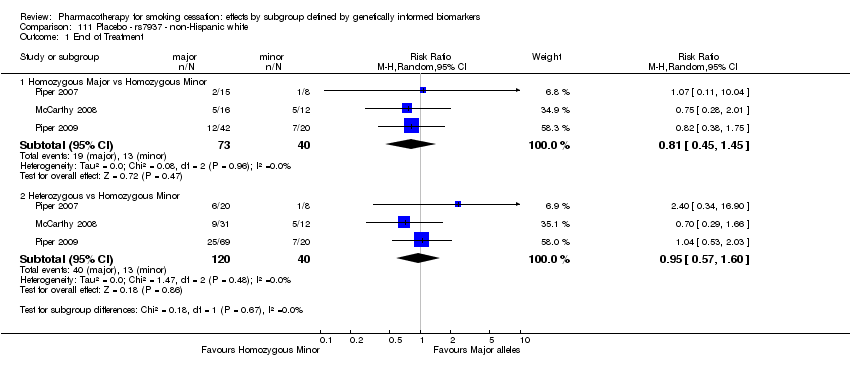
Comparison 111 Placebo ‐ rs7937 ‐ non‐Hispanic white, Outcome 1 End of Treatment.

Comparison 112 Placebo ‐ rs7937 ‐ non‐Hispanic black or African American, Outcome 1 End of Treatment.

Comparison 113 Placebo ‐ rs1329650 ‐ non‐Hispanic white, Outcome 1 End of Treatment.

Comparison 114 Placebo ‐ rs1329650 ‐ non‐Hispanic black or African American, Outcome 1 End of Treatment.

Comparison 115 Placebo ‐ rs1028936 ‐ non‐Hispanic white, Outcome 1 End of Treatment.

Comparison 116 Placebo ‐ rs1028936 ‐ non‐Hispanic black or African American, Outcome 1 End of Treatment.

Comparison 117 Placebo ‐ rs215605 ‐ non‐Hispanic white, Outcome 1 End of Treatment.

Comparison 118 Placebo ‐ rs215605 ‐ non‐Hispanic black or African American, Outcome 1 End of Treatment.
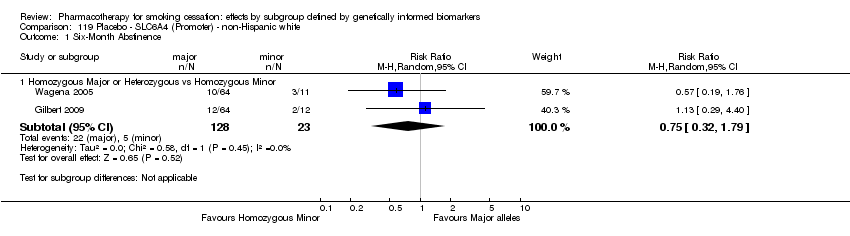
Comparison 119 Placebo ‐ SLC6A4 (Promoter) ‐ non‐Hispanic white, Outcome 1 Six‐Month Abstinence.

Comparison 119 Placebo ‐ SLC6A4 (Promoter) ‐ non‐Hispanic white, Outcome 2 End of Treatment.
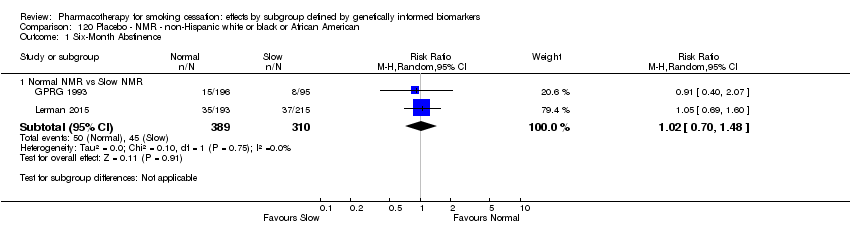
Comparison 120 Placebo ‐ NMR ‐ non‐Hispanic white or black or African American, Outcome 1 Six‐Month Abstinence.
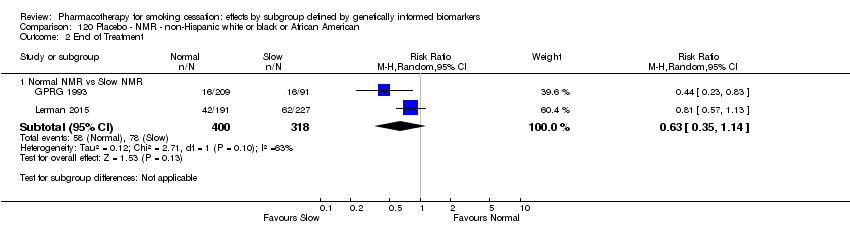
Comparison 120 Placebo ‐ NMR ‐ non‐Hispanic white or black or African American, Outcome 2 End of Treatment.
| Active NRT compared with placebo ‐ rs1051730 ‐ non‐Hispanic white for smoking cessationa | ||||||
| Patient or population: people who smoke | ||||||
| Outcomes | Anticipated absolute effects* (95% CI) | Relative effect | No. of participants | Quality of the evidence | Comments | |
| Risk with active NRT ‐ rs1051730 ‐ non‐Hispanic white | Risk with placebo | |||||
| Abstinence at end of treatment | Study population | RR 1.63 | 1391 | ⊕⊕⊕⊝ | Pooled result across studies, including all genotypes. Between‐genotype group heterogeneity P value = 0.004 (see results for individual subgroups in below rows) | |
| 327 per 1000 | 200 per 1000 | |||||
| Abstinence at end of treatment ‐ homozygous major | Study population | RR 1.09 | 582 | ⊕⊕⊝⊝ | For participants with homozygous major genotype, low‐quality evidence suggests no effect. | |
| 286 per 1000 | 263 per 1000 | |||||
| Abstinence at end of treatment ‐ heterozygous | Study population | RR 2.13 | 631 | ⊕⊕⊕⊝ | For participants with heterozygous genotype, moderate‐quality evidence shows effect in favour intervention. | |
| 335 per 1000 | 157 per 1000 | |||||
| Abstinence at end of treatment ‐ homozygous minor | Study population | RR 2.18 | 178 | ⊕⊕⊝⊝ | For participants with homozygous minor genotype, low‐quality evidence shows effect in favour intervention. | |
| 338 per 1000 | 155 per 1000 | |||||
| *The risk in the intervention group (and its 95% confidence interval) is based on the assumed risk in the comparison group and the relative effect of the intervention (and its 95% CI). | ||||||
| GRADE Working Group grades of evidence | ||||||
| aThis is the first of seven 'Summary of findings' tables for the main comparison. For a complete list, see the 'Additional summary of findings' section. bNot downgraded owing to inconsistency, as large statistical heterogeneity can be explained by differences between genotypes. cDowngraded one level owing to risk of bias: high potential for selection bias in GRPG 1993 due to low fraction of genotyped participants. dDowngraded one level owing to imprecision: optimal information size criterion is met, but 95% CIs include the null effect and fail to exclude important benefit or important harm. eDowngraded one level owing to imprecision: optimal information size criterion is not met in this stratum. Counts in this stratum are smaller than in a single adequately powered trial. | ||||||
| Active NRT compared with placebo ‐ rs16969968 ‐ non‐Hispanic white for smoking cessation | ||||||
| Patient or population: people who smoke | ||||||
| Outcomes | Anticipated absolute effects* (95% CI) | Relative effect | No. of participants | Quality of the evidence | Comments | |
| Risk with placebo ‐ rs16969968 ‐ non‐Hispanic white | Risk with active NRT | |||||
| End of treatment | Study population | RR 1.38 | 1127 | ⊕⊕⊕⊝ | Pooled result across studies, including all genotypes. Between‐genotype group heterogeneity P value = 0.03 (see results for individual subgroups in below rows) | |
| 251 per 1000 | 346 per 1000 | |||||
| End of treatment ‐ homozygous major | Study population | RR 1.01 | 449 | ⊕⊕⊝⊝ | For participants with homozygous major genotype, low‐quality evidence suggests no effect. | |
| 333 per 1000 | 337 per 1000 | |||||
| End of treatment ‐ heterozygous | Study population | RR 1.85 | 550 | ⊕⊕⊕⊕ | For participants with heterozygous genotype, high‐quality evidence shows effect in favour of intervention. | |
| 193 per 1000 | 358 per 1000 | |||||
| End of treatment ‐ homozygous minor | Study population | RR 1.80 | 128 | ⊕⊕⊝⊝ | For participants with homozygous minor genotype, low‐quality evidence shows that point estimate favours intervention, but 95% CI crosses null effect. | |
| 233 per 1000 | 420 per 1000 | |||||
| *The risk in the intervention group (and its 95% confidence interval) is based on the assumed risk in the comparison group and the relative effect of the intervention (and its 95% CI). | ||||||
| GRADE Working Group grades of evidence. | ||||||
| aDowngraded one level owing to imprecision: Optimal information size criterion is met, but 95% CIs include the null effect and fail to exclude important benefit or important harm. bNot downgraded owing to inconsistency, as large statistical heterogeneity can be explained by differences in genotypes. cDowngraded one level owing to inconsistency: unexplained heterogeneity. dDowngraded two levels owing to serious imprecision: optimal information size criterion not met, and 95% CIs include the null effect and fail to exclude important benefit or important harm. | ||||||
| Active NRT compared with placebo ‐ rs16969968 ‐ non‐Hispanic black or African American for smoking cessation | ||||||
| Patient or population: people who smoke | ||||||
| Outcomes | Anticipated absolute effects* (95% CI) | Relative effect | No. of participants | Quality of the evidence | Comments | |
| Risk with active NRT ‐ rs16969968 ‐ non‐Hispanic black or African American | Risk with placebo | |||||
| Abstinence at 6 months | Study population | RR 1.11 | 709 | ⊕⊕⊕⊝ | Pooled result across studies, including all genotypes. Between‐genotype group heterogeneity P value = 0.03 (see results for individual subgroups in below rows) | |
| 203 per 1000 | 183 per 1000 | |||||
| Abstinence at 6 months ‐ homozygous major | Study population | RR 1.47 | 637 | ⊕⊕⊕⊕ | For participants with homozygous major genotype, high‐quality evidence shows effect in favour of intervention. | |
| 254 per 1000 | 173 per 1000 | |||||
| Abstinence at 6 months ‐ heterozygous or homozygous minor | Study population | RR 0.43 | 72 | ⊕⊕⊝⊝ | For participants with heterozygous or homozygous minor genotype, point estimate favours control, but 95% CI crosses null effect. | |
| 117 per 1000 | 273 per 1000 | |||||
| Abstinence at end of treatment | Study population | RR 1.03 | 709 | ⊕⊕⊕⊝ | Pooled result across studies, including all genotypes. Between‐genotype group heterogeneity P value = 0.003 (see results for individual subgroups in below rows) | |
| 201 per 1000 | 196 per 1000 | |||||
| Abstinence at end of treatment ‐ homozygous major | Study population | RR 1.57 | 637 | ⊕⊕⊕⊕ | For participants with homozygous major genotype, high‐quality evidence shows effect in favour of intervention. | |
| 276 per 1000 | 176 per 1000 | |||||
| Abstinence at end of treatment ‐ heterozygous or homozygous minor | Study population | RR 0.29 | 72 | ⊕⊕⊕⊝ | For participants with heterozygous or homozygous minor genotype, moderate‐quality evidence shows effect in favour of control. | |
| 105 per 1000 | 364 per 1000 | |||||
| *The risk in the intervention group (and its 95% confidence interval) is based on the assumed risk in the comparison group and the relative effect of the intervention (and its 95% CI). | ||||||
| GRADE Working Group grades of evidence. | ||||||
| aNot downgraded owing to inconsistency, as large statistical heterogeneity can be explained by differences in genotypes. bDowngraded one level owing to imprecision: Optimal information size criterion is met, but 95% CIs include the null effect and fail to exclude important benefit or important harm. cDowngraded two levels owing to serious imprecision: optimal information size criterion not met, but 95% CIs include the null effect and fail to exclude important benefit or important harm. dDowngraded one level owing to imprecision: low number of events; optimal information size criterion not met. | ||||||
| Active NRT compared with placebo ‐ rs 588765 ‐ non‐Hispanic white for smoking cessation | ||||||
| Patient or population: people who smoke | ||||||
| Outcomes | Anticipated absolute effects* (95% CI) | Relative effect | No. of participants | Quality of the evidence | Comments | |
| Risk with placebo ‐ rs 588765 ‐ non‐Hispanic white | Risk with active NRT | |||||
| End of treatment | Study population | RR 1.33 | 923 | ⊕⊕⊕⊝ | Pooled result across studies, including all genotypes. Between‐genotype group heterogeneity P value = 0.92 (see results for individual subgroups in below rows) | |
| 211 per 1000 | 281 per 1000 | |||||
| End of treatment ‐ homozygous major | Study population | RR 1.39 | 296 | ⊕⊕⊝⊝ | For participants with homozygous major genotype, low‐quality evidence suggests that point estimate favours intervention, but 95% CI crosses null effect. | |
| 208 per 1000 | 288 per 1000 | |||||
| End of treatment ‐ heterozygous | Study population | RR 1.27 | 469 | ⊕⊕⊝⊝ | For participants with heterozygous genotype, point estimate favours intervention, but 95% CI crosses null effect. | |
| 208 per 1000 | 265 per 1000 | |||||
| End of treatment ‐ homozygous minor | Study population | RR 1.50 | 158 | ⊕⊕⊝⊝ | For participants with homozygous minor genotype, low‐quality evidence suggests that point estimate favours intervention, but 95% CI crosses null effect. | |
| 226 per 1000 | 339 per 1000 | |||||
| *The risk in the intervention group (and its 95% confidence interval) is based on the assumed risk in the comparison group and the relative effect of the intervention (and its 95% CI). | ||||||
| GRADE Working Group grades of evidence. | ||||||
| aDowngraded one level owing to imprecision: low number of events; optimal information size criterion not met. bDowngraded two levels owing to serious imprecision: optimal information size criterion not met, but 95% CIs include the null effect and fail to exclude important benefit or important harm. | ||||||
| Active NRT compared with placebo ‐ rs2036527 ‐ non‐Hispanic black or African American for smoking cessation | ||||||
| Patient or population: people who smoke | ||||||
| Outcomes | Anticipated absolute effects* (95% CI) | Relative effect | No. of participants | Quality of the evidence | Comments | |
| Risk with placebo ‐ rs2036527 ‐ non‐Hispanic black or African American | Risk with active NRT | |||||
| 6‐Month abstinence | Study population | RR 1.18 | 708 | ⊕⊕⊝⊝ | Pooled result across studies, including all genotypes. Between‐genotype group heterogeneity P value = 0.19 (see results for individual subgroups in below rows) | |
| 177 per 1000 | 208 per 1000 | |||||
| 6‐Month abstinence ‐ homozygous major | Study population | RR 1.95 | 425 | ⊕⊝⊝⊝ | For participants with homozygous major genotype, very low‐quality evidence suggests that point estimate favours intervention, but 95% CI crosses null effect. | |
| 171 per 1000 | 333 per 1000 | |||||
| 6‐Month abstinence ‐ heterozygous or homozygous minor | Study population | RR 0.90 | 283 | ⊕⊕⊕⊝ | For participants with heterozygous or homozygous minor genotype, moderate‐quality evidence shows no effect. | |
| 185 per 1000 | 167 per 1000 | |||||
| End of treatment | Study population | RR 1.22 | 708 | ⊕⊕⊝⊝ | Pooled results across studies, including all genotypes. Between‐genotype group heterogeneity P value = 0.19 (see results for individual subgroups in below rows) | |
| 199 per 1000 | 242 per 1000 | |||||
| End of treatment ‐ homozygous major | Study population | RR 2.39 | 425 | ⊕⊕⊝⊝ | For participants with homozygous major genotype, low‐quality evidence suggests that point estimate favours intervention, but 95% CI crosses null effect. | |
| 197 per 1000 | 471 per 1000 | |||||
| End of treatment ‐ heterozygous or homozygous minor | Study population | RR 0.89 | 283 | ⊕⊕⊕⊝ | For participants with heterozygous or homozygous minor genotype, moderate‐quality evidence shows no effect. | |
| 202 per 1000 | 179 per 1000 | |||||
| *The risk in the intervention group (and its 95% confidence interval) is based on the assumed risk in the comparison group and the relative effect of the intervention (and its 95% CI). | ||||||
| GRADE Working Group grades of evidence. | ||||||
| cDowngraded one level owing to imprecision: low number of events; optimal information size criterion not met. | ||||||
| Active NRT compared with placebo ‐ DRD4 (exon 3 48 bp) ‐ non‐Hispanic white for smoking cessation | ||||||
| Patient or population: people who smoke | ||||||
| Outcomes | Anticipated absolute effects* (95% CI) | Relative effect | No. of participants | Quality of the evidence | Comments | |
| Risk with placebo ‐ DRD4 (exon 3 48 bp) ‐ non‐Hispanic white | Risk with active NRT | |||||
| 6‐Month abstinence | Study population | RR 1.44 | 900 | ⊕⊕⊝⊝ | Pooled result across studies, including all genotypes. Between‐genotype group heterogeneity P value = 0.85 (see results for individual subgroups in below rows) | |
| 141 per 1000 | 203 per 1000 | |||||
| 6‐month abstinence ‐ homozygous major | Study population | RR 1.34 | 566 | ⊕⊝⊝⊝ | For participants with homozygous major genotype, very low‐quality evidence suggests that point estimate favours intervention, but 95% CI crosses null effect. | |
| 155 per 1000 | 207 per 1000 | |||||
| 6‐Month abstinence ‐ heterozygous | Study population | RR 1.76 | 290 | ⊕⊕⊝⊝ | For participants with heterozygous genotype, low‐quality evidence suggests effect in favour of intervention. | |
| 113 per 1000 | 198 per 1000 | |||||
| 6‐Month abstinence ‐ homozygous minor | Study population | RR 1.28 | 44 | ⊕⊝⊝⊝ | For participants with homozygous minor genotype, very low‐quality evidence suggests that point estimate favours intervention, but 95% CI crosses null effect. | |
| 167 per 1000 | 213 per 1000 | |||||
| End of treatment | Study population | RR 1.20 | 900 | ⊕⊕⊝⊝ | Pooled result across studies, including all genotypes. Between‐genotype group heterogeneity P value = 0.78 (see results for individual subgroups in below rows) | |
| 271 per 1000 | 325 per 1000 | |||||
| End of treatment ‐ homozygous major | Study population | RR 1.22 | 566 | ⊕⊝⊝⊝ | For participants with homozygous major genotype, very low‐quality evidence suggests that point estimate favours intervention, but 95% CI crosses null effect. | |
| 273 per 1000 | 334 per 1000 | |||||
| End of treatment ‐ heterozygous | Study population | RR 1.40 | 290 | ⊕⊝⊝⊝ | For participants with heterozygous genotype, very low‐quality evidence suggests that point estimate favours intervention, but 95% CI crosses null effect. | |
| 258 per 1000 | 362 per 1000 | |||||
| End of treatment ‐ homozygous minor | Study population | RR 1.02 | 44 | ⊕⊕⊝⊝ | For participants with homozygous minor genotype, low‐quality evidence suggests no effect. | |
| 333 per 1000 | 340 per 1000 | |||||
| *The risk in the intervention group (and its 95% confidence interval) is based on the assumed risk in the comparison group and the relative effect of the intervention (and its 95% CI). | ||||||
| GRADE Working Group grades of evidence. | ||||||
| aDowngraded one level owing to high risk of bias: high risk of selection bias in GRPG 1993 due to low fraction of genotyped participants. bDowngraded one level owing to imprecision: low number of events; optimal information size criterion not met. cDowngraded one level owing to imprecision: 95% CIs include the null effect and fail to exclude important benefit or important harm. | ||||||
| Active NRT compared with placebo ‐ NMR ‐ non‐Hispanic black and white for smoking cessation | ||||||
| Patient or population: people who smoke | ||||||
| Outcomes | Anticipated absolute effects* (95% CI) | Relative effect | No. of participants | Quality of the evidence | Comments | |
| Risk with placebo ‐ NMR ‐ non‐Hispanic black and white | Risk with active NRT | |||||
| 6‐Month abstinence | Study population | RR 1.51 | 1417 | ⊕⊕⊕⊝ | Pooled result across studies, including all genotypes. Between‐genotype group heterogeneity: P value = 0.29 (see results for individual subgroups in below rows) | |
| 99 per 1000 | 149 per 1000 | |||||
| 6‐Month abstinence ‐ slow NMR | Study population | RR 1.82 | 628 | ⊕⊕⊕⊝ | For participants with slow NMR genotype, moderate‐quality evidence favours intervention. | |
| 116 per 1000 | 211 per 1000 | |||||
| 6‐Month abstinence ‐ normal NMR | Study population | RR 1.21 | 789 | ⊕⊕⊝⊝ | For participants with normal NMR genotype, point estimate favours intervention, but 95% CI crosses null effect. | |
| 85 per 1000 | 103 per 1000 | |||||
| End of treatment | Study population | RR 1.51 | 1417 | ⊕⊕⊕⊝ | Pooled result across studies, including all genotypes. Between‐genotype group heterogeneity: P value = 0.52 (see results for individual subgroups in below rows) | |
| 136 per 1000 | 205 per 1000 | |||||
| End of treatment ‐ slow NMR | Study population | RR 1.61 | 847 | ⊕⊕⊕⊝ | For participants with slow NMR genotype, moderate‐quality evidence favours intervention. | |
| 127 per 1000 | 204 per 1000 | |||||
| End of treatment ‐ normal NMR | Study population | RR 1.49 | 570 | ⊕⊕⊝⊝ | For participants with normal NMR genotype, point estimate favours intervention, but 95% CI crosses null effect. | |
| 149 per 1000 | 222 per 1000 | |||||
| *The risk in the intervention group (and its 95% confidence interval) is based on the assumed risk in the comparison group and the relative effect of the intervention (and its 95% CI). | ||||||
| GRADE Working Group grades of evidence. | ||||||
| aDowngraded one level owing to risk of bias: 755/1532 (49%) participants from Patch Trial (GPRG 1993) were genotyped, which could contribute to selection bias. bDowngraded one level owing to imprecision: optimal information size criterion is met, but 95% CIs include the null effect and fail to exclude important benefit or important harm. | ||||||
| Genetic term | Explanation |
| Single‐nucleotide polymorphism (SNP) | A single base pair change in the DNA sequence at a particular point compared with the “common” or “wild‐type” sequence (Attia 2009) Most common form of genetic variation in the genome, in which a single‐base substitution has created 2 forms of a DNA sequence that differ by a single nucleotide (Pearson 2008) |
| Alleles | Alternate forms of a gene or chromosomal locus that differ in DNA sequence (Pearson 2008) |
| Genome‐wide association study (GWAS) | Any study of genetic variation across the entire human genome designed to identify genetic association with observable traits or the presence or absence of a disease, usually referring to studies with genetic marker density of 100,000 or more to represent a large proportion of variation in the human genome (Pearson 2008) |
| Genotype | The genetic constitution of an individual, either overall or at a specific gene (Attia 2009) |
| Hardy‐Weinberg equilibrium (HWE) | Population distribution of 2 alleles (with frequencies p and q) such that the distribution is stable from generation to generation and genotypes occur at frequencies of p2, 2pq, and q2 for the major allele homozygote, heterozygote, and minor allele homozygote, respectively (Pearson 2008) |
| Linkage disequilibrium | Measure of association between 2 alleles located near each other on a chromosome, such that they are inherited together more frequently than would be expected by chance (Pearson 2008) |
| Loci | The site(s) on a chromosome at which the gene for a particular trait is located on a gene at which a particular SNP is located (Attia 2009) |
| Minor allele | The allele of a biallelic polymorphism that is less frequent in the study population (Pearson 2008) |
| Major allele | The allele of a biallelic polymorphism that is more frequent in the study population (Pearson 2008) |
| Pharmacogenetics | The field of studying the genetic basis of drug response and applying this knowledge to clinical practice by guiding drug prescribing |
| Pharmacogenomics | Similar to pharmacogenetics but uses information across the whole genome |
| Population stratification | A form of confounding in genetic association studies caused by genetic differences between cases and controls unrelated to disease but due to sampling from populations of different ancestries (Pearson 2008) |
| Wild‐type allele | The allele at a particular single‐nucleotide polymorphism (SNP) that is most frequent in a population, also called “common” allele (Attia 2009) |
| DNA = deoxyribonucleic acid; SNP = Single‐nucleotide polymorphism; GWAS = Genome‐wide association study; HWE = Hardy‐Weinberg equilibrium | |
| Polymorphism | Race group | ||||
| Gene/Region | SNP or VNTRa | Whiteb | Black or African Americanc | East Asiand | Mexicane |
| CHRNA3 | rs1051730 | G/A | G/A | G/A | G/A |
| CHRNA5 | rs16969968 | G/A | G/A | G/A | G/A |
| CHRNA5 | rs588765 | C/T | C/T | C/T | C/T |
| CHRNA5 | rs2036527 | G/A | G/A | G/A | G/A |
| CHRNB3 | rs13280604 | A/G | G/A | A/G | A/G |
| CYP2A6 | rs4105144 | T/C | T/C | T/C | T/C |
| CYP2B6 | rs6474412 | T/C | C/T | T/C | T/C |
| DBH | rs3025343 | G/A | G/A | G/A | G/A |
| DRD4 (exon 3 48 bp) | SI000224I | 4 (0.65), 7 (0.18), 3, 2 | 4 (0.75), 7 (0.14), 6, 5 | 4 (0.79), 2 (0.17), 5 | 7 (0.52), 4 (0.41), 2 |
| EGLN2 | rs3733829 | A/G | A/G | A/G | G/A |
| EGLN2 | rs7937 | T/C | C/T | T/C | T/C |
| LOC100188947 | rs1329650 | G/T | G/T | T/G | G/T |
| LOC100188947 | rs1028936 | A/C | A/C | C/A | A/C |
| PDE1C | rs215605 | T/G | G/T | G/T | T/G |
| SLC6A3 (3' 40 bp) | SI000156M | 10 (0.69), 9 (0.31) | 10 (0.73), 9 (0.21), 3, 8 | 10 (0.91), 9 | 10 (0.74), 9 (0.24) |
| SLC6A4 (Promoter) | SI664268Gf | L (0.62), S (0.38) | L (0.78), S (0.07), 19 (0.15) | L (0.27), S (0.71) | L (0.42), S (0.58) |
| aSNP rsID and frequencies from the 1000 Genomes Project database (http://analysistools.nci.nih.gov/LDlink/), VNTR UID and frequencies from ALFRED (http://alfred.med.yale.edu/alfred/index.asp). | |||||
| bGBR or European (PopID = 20, SampID = 20C). | |||||
| cASW or per VNTR (DRD4, Biaka (PopID = 5, SampID = 5F); SLC6A3, African American (PopID = 98R, SampID = 101C); SLC6A4, Biaka. | |||||
| dCHB + JPT, or mean of Han and Japanese, for SLC6A3 and SLC6A4, Han (SampID = 9J) and Japanese (SampID = 10B). | |||||
| eMXL or per VNTR (DRD4, see Table 2, Aguirre‐Samudio 2014; SLC6A3, Hispanic American from ALFRED; SLC6A4, see Table 2, Peralta‐Leal 2012). | |||||
| fFor Euro, African American and East Asian, extracted from Promoter VNTR + rs25531 Table in ALFRED. L = 16 repeats, S = 14 repeats. | |||||
| SNP = Single‐nucleotide polymorphism; VNTR = variable number tandem repeat; G = nucleobase guanine; A = nucleobase adenine; C = nucleobase cytosine; T = nucleobase thymine; rsID=reference SNP cluster ID; UID=Unique Identifier, from ALFRED; GBR=British in England and Scotland population description code from 1000 Genomes Project; PopID=Population ID from ALFRED; SampID=Sample ID from ALFRED; ASW=Americans of African Ancestry in SW USA population description code, from 1000 Genomes Project; CHB=Han Chinese in Bejing, China population description code, from 1000 Genomes Project; JPT=Japanese in Tokyo, Japan population description code, from 1000 Genomes Project; Han=Han Chinese living in the San Francisco, California, from ALFRED; MXL=Mexican Ancestry from Los Angeles USA population description code, from 1000 Genomes Project; L=Long (16 repeats); S=Short (14 repeats) | |||||
| Treatment comparison | SNP or VNTRa | Ethnicity | Number of studies (individual treatment 1/treatment 2) included | Analysis number | Significant treatment effect Letter indicates which treatment is favoured: a = active NRT b = bupropion ba = bupropion + active NRT p = placebo v = varenicline | P value heterogeneity genotype groups | |||
| Active NRT vs placebo | O | HoMa | Het | HoMi | |||||
| rs1051730 | NHW | 3 (1023/574) | 1.1 | a | a | a | 0.40 | ||
| rs16969968 | NHB | 2 (392/317) | 3.1 | a | 0.03a | ||||
| rs2036527 | NHB | 2 (391/317) | 5.1 | 0.36a | |||||
| DRD4 (exon 3 48 bp) | NHW | 2 (453/447) | 6.1 | a | a | 0.72 | |||
| O | S | N | |||||||
| NMR | NHW or NHB | 2 (719/699) | 7.1 | a | a | 0.22 | |||
| Bupropion vs placebo | O | HoMa | Het | HoMi | |||||
| rs1051730 | NHW | 4 (797/532) | 8.1 | b | b | 0.77 | |||
| NHB | 3 (63/63) | 9.1 | 0.80 | ||||||
| rs16969968 | NHB | 2 (294/284) | 11.1 | 0.22a | |||||
| rs588765 | NHW | 4 (596/511) | 12.1 | b | b | 0.32 | |||
| rs2036527 | NHW | 2 (412/326) | 13.1 | b | b | 0.28 | |||
| NHB | 3 (331/329) | 14.1 | 0.65 | ||||||
| rs3733829 | NHW | 2 (307/264) | 15.1 | b | b | 0.25 | |||
| Het: heterozygous; HoMa: homozygous major; HoMi: homozygous minor; N: normal NMR; NHB: non‐Hispanic black or African American; NHW: non‐Hispanic white; NMR: nicotine metabolite ratio; NRT: nicotine replacement therapy; O = overall; SNP: single‐nucleotide polymorphism; VNTR: variable number tandem repeat. aHomozygous major vs heterozygous + homozygous minor. | |||||||||
| Treatment comparison | SNP or VNTRa | Ethnicity | Number of studies (individual treatment 1/treatment 2) included | Analysis number | Significant treatment effect Letter indicates which treatment is favoured: a = active NRT b = bupropion ba = bupropion + active NRT p = placebo v = varenicline | P value heterogeneity genotype groups | |||
| Active NRT vs placebo | O | HoMa | Het | HoMi | |||||
| rs1051730 | NHW | 2 (912/479) | 1.2 | a | a | a | 0.004 | ||
| rs16969968 | NHW | 2 (784/343) | 2.1 | a | 0.02 | ||||
| NHB | 2 (392/317) | 3.2 | a | pb | 0.003a | ||||
| rs588765 | NHW | 2 (587/336) | 4.1 | a | 0.89 | ||||
| rs2036527 | NHB | 2 (391/317) | 5.2 | 0.28a | |||||
| DRD4 (exon 3 48 bp) | NHW | 2 (453/447) | 6.2 | 0.79 | |||||
| O | S | N | |||||||
| NMR | NHW or NHB | 2 (718/699) | 7.2 | a | a | 0.80 | |||
| Bupropion vs placebo | O | HoMa | Het | HoMi | |||||
| rs1051730 | NHW | 6 (743/636) | 8.2 | b | b | b | b | 0.41 | |
| NHB | 3 (84/75) | 9.2 | 0.12 | ||||||
| rs16969968 | NHW | 3 (324/233) | 10.1 | b | b | 0.50 | |||
| NHB | 3 (315/296) | 11.2 | b | bb | 0.77a | ||||
| rs588765 | NHW | 4 (595/512) | 12.2 | b | b | 0.96 | |||
| rs2036527 | NHW | 4 (546/429) | 13.2 | b | b | b | b | 0.20 | |
| NHB | 4 (352/341) | 14.2 | b | b | 0.38 | ||||
| rs3733829 | NHW | 4 (440/367) | 15.2 | b | b | b | 0.71 | ||
| NHB | 2 (46/29) | 16.1 | 0.56a | ||||||
| rs7937 | NHW | 3 (324/233) | 17.1 | b | b | 0.54 | |||
| NHB | 2 (47/29) | 18.1 | 0.92a | ||||||
| rs1329650 | NHW | 3 (324/235) | 19.1 | b | b | 0.83 | |||
| NHB | 2 (47/29) | 20.1 | 0.59a | ||||||
| rs1028936 | NHW | 3 (324/235) | 21.1 | b | b | 0.90 | |||
| NHB | 2 (47/29) | 22.1 | 0.37a | ||||||
| rs215605 | NHW | 3 (324/234) | 23.1 | b | b | 0.43 | |||
| NHB | 2 (47/29) | 24.1 | 0.92a | ||||||
| Bupropion + any NRT vs placebo | O | HoMa | Het | HoMi | |||||
| rs1051730 | NHW | 2 (268/176) | 25.1 | ba | ba | 0.77 | |||
| NHB | 2 (40/29) | 26.1 | 0.07a | ||||||
| rs16969968 | NHW | 2 (266/175) | 27.1 | ba | ba | 0.77 | |||
| NHB | 2 (40/29) | 28.1 | 0.35a | ||||||
| rs2036527 | NHW | 2 (267/176) | 29.1 | ba | ba | 0.95 | |||
| NHB | 2 (40/29) | 30.1 | 0.59 | ||||||
| rs3733829 | NHW | 2 (266/175) | 31.1 | ba | ba | 0.83 | |||
| NHB | 2 (48/21[ES1] ) | 32.1 | 0.45a | ||||||
| rs7937 | NHW | 2 (268/174) | 33.1 | ba | 0.62 | ||||
| NHB | 2 (40/29) | 34.1 | 0.98a | ||||||
| rs1329650 | NHW | 2 (266/176) | 35.1 | ba | ba | 0.90 | |||
| NHB | 2 (40/29) | 36.1 | 0.78a | ||||||
| rs1028936 | NHW | 2 (268/176) | 37.1 | ba | ba | 0.88 | |||
| NHB | 2 (40/29) | 38.1 | 0.89a | ||||||
| rs215605 | NHW | 2 (267/175) | 39.1 | ba | ba | 0.79 | |||
| NHB | 2 (40/28) | 40.1 | 0.52a | ||||||
| Bupropion + any NRT vs bupropion | O | HoMa | Het | HoMi | |||||
| rs1051730 | NHW | 2 (268/265) | 41.1 | 0.97 | |||||
| NHB | 2 (40/47) | 42.1 | 0.41a | ||||||
| rs16969968 | NHW | 2 (266/265) | 43.1 | 0.98 | |||||
| NHB | 2 (40/47) | 44.1 | 0.57a | ||||||
| rs2036527 | NHW | 2 (267/265) | 45.1 | 0.99 | |||||
| NHB | 2 (40/47) | 46.1 | 0.61a | ||||||
| rs3733829 | NHW | 2 (267/264) | 47.1 | 0.82 | |||||
| NHB | 2 (48/46) | 48.1 | b | 0.58a | |||||
| rs7937 | NHW | 2 (268/265) | 49.1 | 0.69 | |||||
| NHB | 2 (40/47) | 50.1 | 0.85a | ||||||
| rs1329650 | NHW | 2 (266/265) | 51.1 | 0.66 | |||||
| NHB | 2 (40/47) | 52.1 | 0.49a | ||||||
| rs1028936 | NHW | 2 (268/265) | 53.1 | 0.60 | |||||
| NHB | 2 (40/47) | 54.1 | 0.49a | ||||||
| rs215605 | NHW | 2 (267/265) | 55.1 | 0.50 | |||||
| NHB | 2 (40/47) | 56.1 | 0.75a | ||||||
| Het: heterozygous; HoMa: homozygous major; HoMi: homozygous minor; N: normal NMR; NHB: non‐Hispanic black or African American; NHW: non‐Hispanic white; NMR: nicotine metabolite ratio; NRT: nicotine replacement therapy; O: overall; SNP: single‐nucleotide polymorphism; VNTR: variable number tandem repeat. aHomozygous major vs heterozygous + homozygous minor. bHeterozygous + homozygous minor. | |||||||||
| Treatment group | SNP or VNTRa | Ethnicity | Number of studies (individuals in homozygous major/heterozygous/homozygous minor) included | Analysis number | Significant treatment effect Letter indicates which genotype is favoured: ma = genotype group with 1 or more major alleles mi = homozygous minor s = slow NMR n = normal NMR | P value heterogeneity in genotype comparisons | |
| Active NRT | MaMi | HetMi | |||||
| rs1051730 | NHW | 7 (1352/1025/310) | 57.1 | 0.93 | |||
| NHB | 2 (181/50/6) | 58.1 | 0.98 | ||||
| rs16969968 | NHB | 2 (353/39a) | 59.1 | N/A | |||
| rs588765 | NHW | 3 (286/399/147) | 60.1 | 0.76 | |||
| rs2036527 | NHW | 2 (369/447/132) | 61.1 | 0.79 | |||
| NHB | 2 (232/159a) | 62.1 | N/A | ||||
| DRD4 (exon 3 48 bp) | NHW | 3 (798/253/68) | 63.1 | 0.74 | |||
| SLC6A4 (Promoter) | NHW | 2 (277/465/184) | 64.1 | 0.62 | |||
| Normal vs slow | |||||||
| NMR | NHW and NHB | 2 (400/318) | 65.1 | s | N/A | ||
| Bupropion | |||||||
| rs1051730 | NHW | 4 (220/294/96) | 66.1 | 0.82 | |||
| NHB | 2 (43/20a) | 67.1 | N/A | ||||
| rs16969968 | NHB | 2 (261/33a) | 69.1 | N/A | |||
| rs588765 | NHW | 4 (195/292/109) | 70.1 | 0.80 | |||
| rs2036527 | NHW | 2 (143/204/65) | 71.1 | 0.87 | |||
| NHB | 3 (187/144a) | 72.1 | N/A | ||||
| rs3733829 | NHW | 2 (146/116/45) | 73.1 | 0.65 | |||
| Varenicline | |||||||
| rs16969968 | NHW | 2 (269/349/89) | 83.1 | 0.81 | |||
| rs588765 | NHW | 2 (234/345/120) | 84.1 | 0.90 | |||
| Placebo | |||||||
| rs1051730 | NHW | 6 (377/441/156) | 101.1 | 0.54 | |||
| NHB | 2 (49/14a) | 102.1 | N/A | ||||
| rs16969968 | NHW | 2 (132/181/30) | 103.1 | 0.63 | |||
| NHB | 3 (519/65a) | 104.1 | N/A | ||||
| rs588765 | NHW | 5 (253/340/130) | 105.1 | 0.92 | |||
| NHB | 2 (275/291a) | 106.1 | N/A | ||||
| rs2036527 | NHW | 2 (117/166/43) | 107.1 | 0.81 | |||
| NHB | 4 (373/256a) | 108.1 | N/A | ||||
| DRD4 (exon 3 48 bp) | NHW | 3 (361/186/26) | 109.1 | 0.44 | |||
| rs3733829 | NHW | 2 (122/102/40) | 110.1 | 0.60 | |||
| SLC6A4 (Promoter) | NHW | 2 (128/23a) | 119.1 | N/A | |||
| Normal vs slow | |||||||
| NMR | NHW and NHB | 2 (389/310) | 120.1 | N/A | |||
| HetMi: heterozygous vs homozygous minor; MaMi: homozygous major vs homozygous minor; NHB: non‐Hispanic black or African American; NHW: non‐Hispanic white; NMR: nicotine metabolite ratio; NRT: nicotine replacement therapy; NS: normal NMR vs slow NMR; SNP: single‐nucleotide polymorphism; VNTR: variable number tandem repeat. aHeterozygous and homozygous minor combined. | |||||||
| Treatment group | SNP or VNTRa | Ethnicity | Number of studies (individuals in homozygous major/heterozygous/homozygous minor) included | Analysis number | Significant treatment effect Letter indicates which genotype is favored: ma = genotype group with 1 or more major alleles mi = homozygous minor s = slow NMR n = normal NMR | P value heterogeneity in genotype comparisons | |
| Active NRT | MaMi | HetMi | |||||
| rs1051730 | NHW | 5 (917/1008/283) | 57.2 | 0.64 | |||
| rs16969968 | NHB | 2 (353/39a) | 59.2 | mab | N/A | ||
| rs588765 | NHW | 3 (286/399/147) | 60.2 | 0.97 | |||
| rs2036527 | NHW | 2 (369/447/132) | 61.2 | 0.74 | |||
| NHB | 2 (232/159a) | 62.2 | mab | N/A | |||
| DRD4 (exon 3 48 bp) | NHW | 3 (798/253/68) | 63.2 | 0.72 | |||
| SLC6A4 (Promoter) | NHW | 2 (277/465/184) | 64.2 | 0.83 | |||
| Normal vs slow | |||||||
| NMR | NHW and NHB | 2 (400/318) | 65.2 | N/A | |||
| Bupropion | |||||||
| rs1051730 | NHW | 6 (263/357/123) | 66.2 | 0.59 | |||
| NHB | 3 (58/26a) | 67.2 | N/A | ||||
| rs16969968 | NHW | 3 (108/164/52) | 68.1 | 0.51 | |||
| NHB | 3 (279/36a) | 69.2 | N/A | ||||
| rs588765 | NHW | 4 (195/292/109) | 70.2 | 0.65 | |||
| rs2036527 | NHW | 4 (185/269/92) | 71.2 | 0.53 | |||
| NHB | 4 (200/152a) | 72.2 | N/A | ||||
| rs3733829 | NHW | 4 (203/181/56) | 73.2 | 0.87 | |||
| NHB | 2 (35/11a) | 74.1 | N/A | ||||
| rs7937 | NHW | 3 (86/165/73) | 75.1 | 0.66 | |||
| NHB | 2 (20/24/3) | 76.1 | 0.62 | ||||
| rs1329650 | NHW | 3 (161/138/25) | 77.1 | 0.90 | |||
| NHB | 2 (42/5a) | 78.1 | N/A | ||||
| rs1028936 | NHW | 3 (212/103/9) | 79.1 | 1.00 | |||
| NHB | 2 (42/5a) | 80.1 | N/A | ||||
| rs215605 | NHW | 3 (125/154/45) | 81.1 | 0.94 | |||
| NHB | 2 (31/16a) | 82.1 | N/A | ||||
| Varenicline | |||||||
| rs16969968 | NHW | 2 (269/349/89) | 83.2 | 0.94 | |||
| rs588765 | NHW | 2 (234/345/120) | 84.2 | 0.84 | |||
| Bupropion + any NRT | |||||||
| rs1051730 | NHW | 2 (113/130/25) | 85.1 | 0.96 | |||
| NHB | 2 (33/7a) | 86.1 | N/A | ||||
| rs16969968 | NHW | 2 (113/130/23) | 87.1 | 0.98 | |||
| NHB | 2 (36/4a) | 88.1 | N/A | ||||
| rs2036527 | NHW | 2 (111/132/24) | 89.1 | 0.82 | |||
| NHB | 2 (23/12/5) | 90.1 | 0.87 | ||||
| rs3733829 | NHW | 2 (114/123/30) | 91.1 | 0.52 | |||
| NHB | 2 (30/10a) | 92.1 | mib | N/A | |||
| rs7937 | NHW | 2 (74/140/54) | 93.1 | 0.95 | |||
| NHB | 2 (13/27a) | 94.1 | N/A | ||||
| rs1329650 | NHW | 2 (149/96/21) | 95.1 | mi | 0.67 | ||
| NHB | 2 (34/6a) | 96.1 | N/A | ||||
| rs1028936 | NHW | 2 (183/75/10) | 97.1 | 0.67 | |||
| NHB | 2 (34/6a) | 98.1 | N/A | ||||
| rs215605 | NHW | 2 (105/119/43) | 99.1 | 0.25 | |||
| NHB | 2 (18/22a) | 100.1 | |||||
| Placebo | |||||||
| rs1051730 | NHW | 7 (378/441/164) | 101.2 | 0.71 | |||
| NHB | 3 (63/20a) | 102.2 | N/A | ||||
| rs16969968 | NHW | 4 (169/227/49) | 103.2 | 0.83 | |||
| NHB | 4 (530/66a) | 104.2 | mib | N/A | |||
| rs588765 | NHW | 5 (254/296/108) | 105.2 | 0.34 | |||
| NHB | 2 (277/289a) | 106.2 | N/A | ||||
| rs2036527 | NHW | 4 (154/213/62) | 107.2 | 0.90 | |||
| NHB | 5 (378/263a) | 108.2 | N/A | ||||
| DRD4 (exon 3 48 bp) | NHW | 3 (361/186/26) | 109.2 | 0.65 | |||
| rs3733829 | NHW | 4 (164/152/51) | 110.2 | 0.53 | |||
| rs7937 | NHW | 3 (73/120/40) | 111.1 | 0.67 | |||
| NHB | 2 (18/11a) | 112.1 | N/A | ||||
| rs1329650 | NHW | 3 (119/106/10) | 113.1 | 0.99 | |||
| NHB | 2 (21/8a) | 114.1 | N/A | ||||
| rs1028936 | NHW | 3 (158/72/5) | 115.1 | 0.79 | |||
| NHB | 2 (23/6a) | 116.1 | N/A | ||||
| rs215605 | NHW | 3 (94/105/35) | 117.1 | 0.70 | |||
| NHB | 2 (18/11a) | 118.1 | N/A | ||||
| SLC6A4 (Promoter) | NHW | 2 (128/23a) | 119.2 | N/A | |||
| Normal vs slow | |||||||
| NMR | NHW and NHB | 2 (400/318) | 120.2 | N/A | |||
| HetMi: heterozygous vs homozygous minor; MaMi: homozygous major vs homozygous minor; NHB: non‐Hispanic black or African American; NHW: non‐Hispanic white; NS: normal NMR vs slow NMR; SNP: single‐nucleotide polymorphism; VNTR: variable number tandem repeat; NMR = nicotine metabolite ratio. aHeterozygous and homozygous minor combined. bHomozygous major vs heterozygous and homozygous minor. | |||||||
| Outcome or subgroup title | No. of studies | No. of participants | Statistical method | Effect size |
| 1 Six‐Month Abstinence Show forest plot | 3 | 1597 | Risk Ratio (M‐H, Random, 95% CI) | 1.42 [1.16, 1.75] |
| 1.1 Homozygous Major | 3 | 659 | Risk Ratio (M‐H, Random, 95% CI) | 1.27 [0.93, 1.72] |
| 1.2 Heterozygous | 3 | 731 | Risk Ratio (M‐H, Random, 95% CI) | 1.48 [1.08, 2.01] |
| 1.3 Homozygous Minor | 3 | 207 | Risk Ratio (M‐H, Random, 95% CI) | 2.07 [1.06, 4.01] |
| 2 End of Treatment Show forest plot | 2 | 1391 | Risk Ratio (M‐H, Random, 95% CI) | 1.63 [1.14, 2.32] |
| 2.1 Homozygous Major | 2 | 582 | Risk Ratio (M‐H, Random, 95% CI) | 1.09 [0.85, 1.41] |
| 2.2 Heterozygous | 2 | 631 | Risk Ratio (M‐H, Random, 95% CI) | 2.13 [1.52, 2.97] |
| 2.3 Homozygous Minor | 2 | 178 | Risk Ratio (M‐H, Random, 95% CI) | 2.18 [1.04, 4.58] |
| Outcome or subgroup title | No. of studies | No. of participants | Statistical method | Effect size |
| 1 End of Treatment Show forest plot | 2 | 1127 | Risk Ratio (M‐H, Random, 95% CI) | 1.38 [0.97, 1.98] |
| 1.1 Homozygous Major | 2 | 449 | Risk Ratio (M‐H, Random, 95% CI) | 1.01 [0.77, 1.33] |
| 1.2 Heterozygous | 2 | 550 | Risk Ratio (M‐H, Random, 95% CI) | 1.85 [1.33, 2.59] |
| 1.3 Homozygous Minor | 2 | 128 | Risk Ratio (M‐H, Random, 95% CI) | 1.80 [0.45, 7.23] |
| Outcome or subgroup title | No. of studies | No. of participants | Statistical method | Effect size |
| 1 Six‐Month Abstinence Show forest plot | 2 | 709 | Risk Ratio (M‐H, Random, 95% CI) | 1.11 [0.55, 2.26] |
| 1.1 Homozygous Major | 2 | 637 | Risk Ratio (M‐H, Random, 95% CI) | 1.47 [1.07, 2.03] |
| 1.2 Heterozygous or Homozygous Minor | 2 | 72 | Risk Ratio (M‐H, Random, 95% CI) | 0.43 [0.15, 1.26] |
| 2 End of Treatment Show forest plot | 2 | 709 | Risk Ratio (M‐H, Random, 95% CI) | 1.03 [0.36, 2.94] |
| 2.1 Homozygous Major | 2 | 637 | Risk Ratio (M‐H, Random, 95% CI) | 1.57 [1.15, 2.15] |
| 2.2 Heterozygous or Homozygous Minor | 2 | 72 | Risk Ratio (M‐H, Random, 95% CI) | 0.29 [0.10, 0.86] |
| Outcome or subgroup title | No. of studies | No. of participants | Statistical method | Effect size |
| 1 End of Treatment Show forest plot | 2 | 923 | Risk Ratio (M‐H, Random, 95% CI) | 1.33 [1.04, 1.71] |
| 1.1 Homozygous Major | 2 | 296 | Risk Ratio (M‐H, Random, 95% CI) | 1.39 [0.89, 2.16] |
| 1.2 Heterozygous | 2 | 469 | Risk Ratio (M‐H, Random, 95% CI) | 1.27 [0.89, 1.79] |
| 1.3 Homozygous Minor | 2 | 158 | Risk Ratio (M‐H, Random, 95% CI) | 1.50 [0.74, 3.06] |
| Outcome or subgroup title | No. of studies | No. of participants | Statistical method | Effect size |
| 1 Six‐Month Abstinence Show forest plot | 2 | 708 | Risk Ratio (M‐H, Random, 95% CI) | 1.18 [0.75, 1.87] |
| 1.1 Homozygous Major | 2 | 425 | Risk Ratio (M‐H, Random, 95% CI) | 1.95 [0.46, 8.26] |
| 1.2 Heterozygous or Homozygous Minor | 2 | 283 | Risk Ratio (M‐H, Random, 95% CI) | 0.90 [0.40, 2.03] |
| 2 End of Treatment Show forest plot | 2 | 708 | Risk Ratio (M‐H, Random, 95% CI) | 1.22 [0.77, 1.93] |
| 2.1 Homozygous Major | 2 | 425 | Risk Ratio (M‐H, Random, 95% CI) | 2.39 [0.43, 13.35] |
| 2.2 Heterozygous or Homozygous Minor | 2 | 283 | Risk Ratio (M‐H, Random, 95% CI) | 0.89 [0.55, 1.46] |
| Outcome or subgroup title | No. of studies | No. of participants | Statistical method | Effect size |
| 1 Six‐Month Abstinence Show forest plot | 2 | 900 | Risk Ratio (M‐H, Random, 95% CI) | 1.44 [1.08, 1.92] |
| 1.1 Homozygous Major | 2 | 566 | Risk Ratio (M‐H, Random, 95% CI) | 1.34 [0.93, 1.93] |
| 1.2 Heterozygous | 2 | 290 | Risk Ratio (M‐H, Random, 95% CI) | 1.76 [1.00, 3.10] |
| 1.3 Homozygous Minor | 2 | 44 | Risk Ratio (M‐H, Random, 95% CI) | 1.28 [0.40, 4.11] |
| 2 End of Treatment Show forest plot | 2 | 900 | Risk Ratio (M‐H, Random, 95% CI) | 1.20 [0.88, 1.63] |
| 2.1 Homozygous Major | 2 | 566 | Risk Ratio (M‐H, Random, 95% CI) | 1.22 [0.59, 2.51] |
| 2.2 Heterozygous | 2 | 290 | Risk Ratio (M‐H, Random, 95% CI) | 1.40 [0.57, 3.39] |
| 2.3 Homozygous Minor | 2 | 44 | Risk Ratio (M‐H, Random, 95% CI) | 1.02 [0.65, 1.58] |
| Outcome or subgroup title | No. of studies | No. of participants | Statistical method | Effect size |
| 1 Six‐Month Abstinence Show forest plot | 2 | 1417 | Risk Ratio (M‐H, Random, 95% CI) | 1.51 [1.08, 2.10] |
| 1.1 Slow NMR | 2 | 628 | Risk Ratio (M‐H, Random, 95% CI) | 1.82 [1.12, 2.94] |
| 1.2 Normal NMR | 2 | 789 | Risk Ratio (M‐H, Random, 95% CI) | 1.21 [0.78, 1.87] |
| 2 End of Treatment Show forest plot | 2 | 1417 | Risk Ratio (M‐H, Random, 95% CI) | 1.51 [1.19, 1.90] |
| 2.1 Slow NMR | 2 | 847 | Risk Ratio (M‐H, Random, 95% CI) | 1.61 [1.18, 2.20] |
| 2.2 Normal NMR | 2 | 570 | Risk Ratio (M‐H, Random, 95% CI) | 1.49 [0.85, 2.60] |
| Outcome or subgroup title | No. of studies | No. of participants | Statistical method | Effect size |
| 1 Six‐Month Abstinence Show forest plot | 4 | 1329 | Risk Ratio (M‐H, Random, 95% CI) | 1.34 [1.11, 1.61] |
| 1.1 Homozygous Major | 4 | 495 | Risk Ratio (M‐H, Random, 95% CI) | 1.24 [0.94, 1.65] |
| 1.2 Heterozygous | 4 | 633 | Risk Ratio (M‐H, Random, 95% CI) | 1.44 [1.09, 1.91] |
| 1.3 Homozygous Minor | 4 | 201 | Risk Ratio (M‐H, Random, 95% CI) | 1.31 [0.57, 2.99] |
| 2 End of Treatment Show forest plot | 6 | 1379 | Risk Ratio (M‐H, Random, 95% CI) | 1.40 [1.19, 1.64] |
| 2.1 Homozygous Major | 6 | 496 | Risk Ratio (M‐H, Random, 95% CI) | 1.32 [1.05, 1.67] |
| 2.2 Heterozygous | 6 | 655 | Risk Ratio (M‐H, Random, 95% CI) | 1.36 [1.03, 1.79] |
| 2.3 Homozygous Minor | 6 | 228 | Risk Ratio (M‐H, Random, 95% CI) | 1.83 [1.20, 2.79] |
| Outcome or subgroup title | No. of studies | No. of participants | Statistical method | Effect size |
| 1 Six‐Month Abstinence Show forest plot | 2 | 124 | Risk Ratio (M‐H, Random, 95% CI) | 1.50 [0.75, 3.00] |
| 1.1 Homozygous Major | 2 | 92 | Risk Ratio (M‐H, Random, 95% CI) | 1.61 [0.71, 3.64] |
| 1.2 Heterozygous | 2 | 32 | Risk Ratio (M‐H, Random, 95% CI) | 1.30 [0.32, 5.34] |
| 2 End of Treatment Show forest plot | 3 | 157 | Risk Ratio (M‐H, Random, 95% CI) | 1.20 [0.70, 2.06] |
| 2.1 Homozygous Major | 3 | 117 | Risk Ratio (M‐H, Random, 95% CI) | 1.76 [0.96, 3.23] |
| 2.2 Heterozygous | 3 | 40 | Risk Ratio (M‐H, Random, 95% CI) | 0.68 [0.32, 1.44] |
| Outcome or subgroup title | No. of studies | No. of participants | Statistical method | Effect size |
| 1 End of Treatment Show forest plot | 3 | 557 | Risk Ratio (M‐H, Random, 95% CI) | 1.42 [1.13, 1.77] |
| 1.1 Homozygous Major | 3 | 198 | Risk Ratio (M‐H, Random, 95% CI) | 1.35 [0.92, 1.99] |
| 1.2 Heterozygous | 3 | 276 | Risk Ratio (M‐H, Random, 95% CI) | 1.46 [1.04, 2.04] |
| 1.3 Homozygous Minor | 3 | 83 | Risk Ratio (M‐H, Random, 95% CI) | 2.55 [0.95, 6.85] |
| Outcome or subgroup title | No. of studies | No. of participants | Statistical method | Effect size |
| 1 Six‐Month Abstinence Show forest plot | 2 | 578 | Risk Ratio (M‐H, Random, 95% CI) | 1.30 [0.84, 2.00] |
| 1.1 Homozygous Major | 2 | 512 | Risk Ratio (M‐H, Random, 95% CI) | 1.18 [0.75, 1.87] |
| 1.2 Heterozygous or Homozygous Minor | 2 | 66 | Risk Ratio (M‐H, Random, 95% CI) | 2.82 [0.76, 10.45] |
| 2 End of Treatment Show forest plot | 3 | 611 | Risk Ratio (M‐H, Random, 95% CI) | 1.95 [1.23, 3.08] |
| 2.1 Homozygous Major | 3 | 541 | Risk Ratio (M‐H, Random, 95% CI) | 2.12 [1.44, 3.10] |
| 2.2 Heterozygous or Homozygous Minor | 3 | 70 | Risk Ratio (M‐H, Random, 95% CI) | 1.65 [0.33, 8.36] |
| Outcome or subgroup title | No. of studies | No. of participants | Statistical method | Effect size |
| 1 Six‐Month Abstinence Show forest plot | 4 | 1107 | Risk Ratio (M‐H, Random, 95% CI) | 1.37 [1.12, 1.67] |
| 1.1 Homozygous Major | 4 | 384 | Risk Ratio (M‐H, Random, 95% CI) | 1.33 [0.85, 2.08] |
| 1.2 Heterozygous | 4 | 526 | Risk Ratio (M‐H, Random, 95% CI) | 1.25 [0.95, 1.65] |
| 1.3 Homozygous Minor | 4 | 197 | Risk Ratio (M‐H, Random, 95% CI) | 1.95 [1.18, 3.22] |
| 2 End of Treatment Show forest plot | 4 | 1107 | Risk Ratio (M‐H, Random, 95% CI) | 1.36 [1.13, 1.65] |
| 2.1 Homozygous Major | 4 | 385 | Risk Ratio (M‐H, Random, 95% CI) | 1.37 [1.05, 1.79] |
| 2.2 Heterozygous | 4 | 525 | Risk Ratio (M‐H, Random, 95% CI) | 1.31 [0.86, 2.01] |
| 2.3 Homozygous Minor | 4 | 197 | Risk Ratio (M‐H, Random, 95% CI) | 1.43 [0.99, 2.06] |
| Outcome or subgroup title | No. of studies | No. of participants | Statistical method | Effect size |
| 1 Six‐Month Abstinence Show forest plot | 2 | 738 | Risk Ratio (M‐H, Random, 95% CI) | 1.40 [1.05, 1.86] |
| 1.1 Homozygous Major | 2 | 260 | Risk Ratio (M‐H, Random, 95% CI) | 1.15 [0.73, 1.80] |
| 1.2 Heterozygous | 2 | 370 | Risk Ratio (M‐H, Random, 95% CI) | 1.43 [0.99, 2.06] |
| 1.3 Homozygous Minor | 2 | 108 | Risk Ratio (M‐H, Random, 95% CI) | 2.73 [1.02, 7.36] |
| 2 End of Treatment Show forest plot | 4 | 975 | Risk Ratio (M‐H, Random, 95% CI) | 1.43 [1.19, 1.73] |
| 2.1 Homozygous Major | 4 | 339 | Risk Ratio (M‐H, Random, 95% CI) | 1.37 [1.04, 1.80] |
| 2.2 Heterozygous | 4 | 482 | Risk Ratio (M‐H, Random, 95% CI) | 1.36 [1.04, 1.79] |
| 2.3 Homozygous Minor | 4 | 154 | Risk Ratio (M‐H, Random, 95% CI) | 2.64 [1.33, 5.25] |
| Outcome or subgroup title | No. of studies | No. of participants | Statistical method | Effect size |
| 1 Six‐Month Abstinence Show forest plot | 3 | 660 | Risk Ratio (M‐H, Random, 95% CI) | 1.30 [0.88, 1.92] |
| 1.1 Homozygous Major | 3 | 377 | Risk Ratio (M‐H, Random, 95% CI) | 1.17 [0.70, 1.98] |
| 1.2 Heterozygous or Homozygous Minor | 3 | 283 | Risk Ratio (M‐H, Random, 95% CI) | 1.44 [0.71, 2.91] |
| 2 End of Treatment Show forest plot | 4 | 693 | Risk Ratio (M‐H, Random, 95% CI) | 1.87 [1.36, 2.56] |
| 2.1 Homozygous Major | 4 | 395 | Risk Ratio (M‐H, Random, 95% CI) | 2.11 [1.39, 3.22] |
| 2.2 Heterozygous or Homozygous Minor | 4 | 298 | Risk Ratio (M‐H, Random, 95% CI) | 1.57 [0.93, 2.62] |
| Outcome or subgroup title | No. of studies | No. of participants | Statistical method | Effect size |
| 1 Six‐Month Abstinence Show forest plot | 2 | 571 | Risk Ratio (M‐H, Random, 95% CI) | 1.41 [1.07, 1.87] |
| 1.1 Homozygous Major | 2 | 268 | Risk Ratio (M‐H, Random, 95% CI) | 1.21 [0.81, 1.82] |
| 1.2 Heterozygous | 2 | 218 | Risk Ratio (M‐H, Random, 95% CI) | 1.95 [1.22, 3.13] |
| 1.3 Homozygous Minor | 2 | 85 | Risk Ratio (M‐H, Random, 95% CI) | 1.13 [0.58, 2.17] |
| 2 End of Treatment Show forest plot | 4 | 807 | Risk Ratio (M‐H, Random, 95% CI) | 1.55 [1.29, 1.87] |
| 2.1 Homozygous Major | 4 | 367 | Risk Ratio (M‐H, Random, 95% CI) | 1.44 [1.11, 1.86] |
| 2.2 Heterozygous | 4 | 333 | Risk Ratio (M‐H, Random, 95% CI) | 1.69 [1.24, 2.30] |
| 2.3 Homozygous Minor | 4 | 107 | Risk Ratio (M‐H, Random, 95% CI) | 1.69 [0.96, 2.95] |
| Outcome or subgroup title | No. of studies | No. of participants | Statistical method | Effect size |
| 1 End of Treatment Show forest plot | 2 | 61 | Risk Ratio (M‐H, Random, 95% CI) | 1.51 [0.75, 3.04] |
| 1.1 Homozygous Major | 2 | 61 | Risk Ratio (M‐H, Random, 95% CI) | 1.51 [0.75, 3.04] |
| Outcome or subgroup title | No. of studies | No. of participants | Statistical method | Effect size |
| 1 End of Treatment Show forest plot | 3 | 557 | Risk Ratio (M‐H, Random, 95% CI) | 1.42 [1.13, 1.78] |
| 1.1 Homozygous Major | 3 | 159 | Risk Ratio (M‐H, Random, 95% CI) | 1.76 [1.13, 2.75] |
| 1.2 Heterozygous | 3 | 285 | Risk Ratio (M‐H, Random, 95% CI) | 1.30 [0.95, 1.76] |
| 1.3 Homozygous Minor | 3 | 113 | Risk Ratio (M‐H, Random, 95% CI) | 1.38 [0.82, 2.31] |
| Outcome or subgroup title | No. of studies | No. of participants | Statistical method | Effect size |
| 1 End of Treatment Show forest plot | 2 | 76 | Risk Ratio (M‐H, Random, 95% CI) | 1.56 [0.77, 3.18] |
| 1.1 Homozygous Major | 2 | 38 | Risk Ratio (M‐H, Random, 95% CI) | 1.70 [0.57, 5.10] |
| 1.2 Heterozygous or Homozygous Minor | 2 | 38 | Risk Ratio (M‐H, Random, 95% CI) | 1.57 [0.42, 5.84] |
| Outcome or subgroup title | No. of studies | No. of participants | Statistical method | Effect size |
| 1 End of Treatment Show forest plot | 3 | 559 | Risk Ratio (M‐H, Random, 95% CI) | 1.37 [1.07, 1.74] |
| 1.1 Homozygous Major | 3 | 280 | Risk Ratio (M‐H, Random, 95% CI) | 1.54 [1.07, 2.22] |
| 1.2 Heterozygous | 3 | 244 | Risk Ratio (M‐H, Random, 95% CI) | 1.31 [0.88, 1.96] |
| 1.3 Homozygous Minor | 3 | 35 | Risk Ratio (M‐H, Random, 95% CI) | 1.25 [0.33, 4.74] |
| Outcome or subgroup title | No. of studies | No. of participants | Statistical method | Effect size |
| 1 End of Treatment Show forest plot | 2 | 76 | Risk Ratio (M‐H, Random, 95% CI) | 1.44 [0.70, 2.99] |
| 1.1 Homozygous Major | 2 | 63 | Risk Ratio (M‐H, Random, 95% CI) | 1.62 [0.67, 3.96] |
| 1.2 Heterozygous or Homozygous Minor | 2 | 13 | Risk Ratio (M‐H, Random, 95% CI) | 0.93 [0.15, 5.70] |
| Outcome or subgroup title | No. of studies | No. of participants | Statistical method | Effect size |
| 1 End of Treatment Show forest plot | 3 | 559 | Risk Ratio (M‐H, Random, 95% CI) | 1.39 [1.11, 1.74] |
| 1.1 Homozygous Major | 3 | 370 | Risk Ratio (M‐H, Random, 95% CI) | 1.54 [1.15, 2.06] |
| 1.2 Heterozygous | 3 | 175 | Risk Ratio (M‐H, Random, 95% CI) | 1.33 [0.75, 2.35] |
| 1.3 Homozygous Minor | 3 | 14 | Risk Ratio (M‐H, Random, 95% CI) | 1.60 [0.30, 8.49] |
| Outcome or subgroup title | No. of studies | No. of participants | Statistical method | Effect size |
| 1 End of Treatment Show forest plot | 2 | 76 | Risk Ratio (M‐H, Random, 95% CI) | 1.47 [0.68, 3.21] |
| 1.1 Homozygous Major | 2 | 65 | Risk Ratio (M‐H, Random, 95% CI) | 1.77 [0.74, 4.20] |
| 1.2 Heterozygous or Homozygous Minor | 2 | 11 | Risk Ratio (M‐H, Random, 95% CI) | 0.67 [0.09, 4.77] |
| Outcome or subgroup title | No. of studies | No. of participants | Statistical method | Effect size |
| 1 End of Treatment Show forest plot | 3 | 558 | Risk Ratio (M‐H, Random, 95% CI) | 1.48 [1.18, 1.87] |
| 1.1 Homozygous Major | 3 | 219 | Risk Ratio (M‐H, Random, 95% CI) | 1.77 [1.23, 2.55] |
| 1.2 Heterozygous | 3 | 259 | Risk Ratio (M‐H, Random, 95% CI) | 1.35 [0.98, 1.87] |
| 1.3 Homozygous Minor | 3 | 80 | Risk Ratio (M‐H, Random, 95% CI) | 1.12 [0.49, 2.55] |
| Outcome or subgroup title | No. of studies | No. of participants | Statistical method | Effect size |
| 1 End of Treatment Show forest plot | 2 | 76 | Risk Ratio (M‐H, Random, 95% CI) | 1.41 [0.54, 3.69] |
| 1.1 Homozygous Major | 2 | 49 | Risk Ratio (M‐H, Random, 95% CI) | 1.93 [0.15, 24.95] |
| 1.2 Heterozygous or Homozygous Minor | 2 | 27 | Risk Ratio (M‐H, Random, 95% CI) | 1.67 [0.46, 6.13] |
| Outcome or subgroup title | No. of studies | No. of participants | Statistical method | Effect size |
| 1 End of Treatment Show forest plot | 2 | 444 | Risk Ratio (M‐H, Random, 95% CI) | 1.80 [1.07, 3.03] |
| 1.1 Homozygous Major | 2 | 183 | Risk Ratio (M‐H, Random, 95% CI) | 2.11 [0.31, 14.60] |
| 1.2 Heterozygous | 2 | 216 | Risk Ratio (M‐H, Random, 95% CI) | 1.82 [1.23, 2.69] |
| 1.3 Homozygous Minor | 2 | 45 | Risk Ratio (M‐H, Random, 95% CI) | 2.84 [0.90, 8.89] |
| Outcome or subgroup title | No. of studies | No. of participants | Statistical method | Effect size |
| 1 End of Treatment Show forest plot | 2 | 69 | Risk Ratio (M‐H, Random, 95% CI) | 0.91 [0.27, 3.07] |
| 1.1 Homozygous Major | 2 | 58 | Risk Ratio (M‐H, Random, 95% CI) | 1.64 [0.56, 4.83] |
| 1.2 Heterozygous or Homozygous Minor | 2 | 11 | Risk Ratio (M‐H, Random, 95% CI) | 0.22 [0.03, 1.43] |
| Outcome or subgroup title | No. of studies | No. of participants | Statistical method | Effect size |
| 1 End of Treatment Show forest plot | 2 | 441 | Risk Ratio (M‐H, Random, 95% CI) | 1.79 [1.07, 2.99] |
| 1.1 Homozygous Major | 2 | 183 | Risk Ratio (M‐H, Random, 95% CI) | 2.11 [0.31, 14.60] |
| 1.2 Heterozygous | 2 | 215 | Risk Ratio (M‐H, Random, 95% CI) | 1.80 [1.22, 2.66] |
| 1.3 Homozygous Minor | 2 | 43 | Risk Ratio (M‐H, Random, 95% CI) | 2.81 [0.89, 8.88] |
| Outcome or subgroup title | No. of studies | No. of participants | Statistical method | Effect size |
| 1 End of Treatment Show forest plot | 2 | 69 | Risk Ratio (M‐H, Random, 95% CI) | 1.05 [0.46, 2.38] |
| 1.1 Homozygous Major | 2 | 63 | Risk Ratio (M‐H, Random, 95% CI) | 1.20 [0.51, 2.85] |
| 1.2 Heterozygous or Homozygous Minor | 2 | 6 | Risk Ratio (M‐H, Random, 95% CI) | 0.33 [0.03, 4.19] |
| Outcome or subgroup title | No. of studies | No. of participants | Statistical method | Effect size |
| 1 End of Treatment Show forest plot | 2 | 443 | Risk Ratio (M‐H, Random, 95% CI) | 1.74 [1.09, 2.77] |
| 1.1 Homozygous Major | 2 | 181 | Risk Ratio (M‐H, Random, 95% CI) | 2.20 [0.33, 14.75] |
| 1.2 Heterozygous | 2 | 220 | Risk Ratio (M‐H, Random, 95% CI) | 1.83 [1.23, 2.72] |
| 1.3 Homozygous Minor | 2 | 42 | Risk Ratio (M‐H, Random, 95% CI) | 2.12 [0.79, 5.65] |
| Outcome or subgroup title | No. of studies | No. of participants | Statistical method | Effect size |
| 1 End of Treatment Show forest plot | 2 | 69 | Risk Ratio (M‐H, Random, 95% CI) | 1.00 [0.52, 1.92] |
| 1.1 Homozygous Major | 2 | 38 | Risk Ratio (M‐H, Random, 95% CI) | 2.03 [0.39, 10.56] |
| 1.2 Heterozygous | 2 | 23 | Risk Ratio (M‐H, Random, 95% CI) | 1.03 [0.38, 2.77] |
| 1.3 Homozygous Minor | 2 | 8 | Risk Ratio (M‐H, Random, 95% CI) | 0.74 [0.26, 2.05] |
| Outcome or subgroup title | No. of studies | No. of participants | Statistical method | Effect size |
| 1 End of Treatment Show forest plot | 2 | 442 | Risk Ratio (M‐H, Random, 95% CI) | 1.55 [1.20, 2.01] |
| 1.1 Homozygous Major | 2 | 187 | Risk Ratio (M‐H, Random, 95% CI) | 1.48 [0.83, 2.65] |
| 1.2 Heterozygous | 2 | 201 | Risk Ratio (M‐H, Random, 95% CI) | 1.87 [1.04, 3.36] |
| 1.3 Homozygous Minor | 2 | 54 | Risk Ratio (M‐H, Random, 95% CI) | 1.85 [0.91, 3.74] |
| Outcome or subgroup title | No. of studies | No. of participants | Statistical method | Effect size |
| 1 End of Treatment Show forest plot | 2 | 48 | Risk Ratio (M‐H, Random, 95% CI) | 0.42 [0.14, 1.24] |
| 1.1 Homozygous Major | 2 | 48 | Risk Ratio (M‐H, Random, 95% CI) | 0.42 [0.14, 1.24] |
| Outcome or subgroup title | No. of studies | No. of participants | Statistical method | Effect size |
| 1 End of Treatment Show forest plot | 2 | 442 | Risk Ratio (M‐H, Random, 95% CI) | 1.51 [1.16, 1.97] |
| 1.1 Homozygous Major | 2 | 131 | Risk Ratio (M‐H, Random, 95% CI) | 2.00 [0.84, 4.75] |
| 1.2 Heterozygous | 2 | 229 | Risk Ratio (M‐H, Random, 95% CI) | 1.39 [0.99, 1.94] |
| 1.3 Homozygous Minor | 2 | 82 | Risk Ratio (M‐H, Random, 95% CI) | 2.34 [0.49, 11.08] |
| Outcome or subgroup title | No. of studies | No. of participants | Statistical method | Effect size |
| 1 End of Treatment Show forest plot | 2 | 69 | Risk Ratio (M‐H, Random, 95% CI) | 1.06 [0.47, 2.38] |
| 1.1 Homozygous Major | 2 | 31 | Risk Ratio (M‐H, Random, 95% CI) | 1.05 [0.40, 2.73] |
| 1.2 Heterozygous or Homozygous Minor | 2 | 38 | Risk Ratio (M‐H, Random, 95% CI) | 1.08 [0.23, 4.99] |
| Outcome or subgroup title | No. of studies | No. of participants | Statistical method | Effect size |
| 1 End of Treatment Show forest plot | 2 | 442 | Risk Ratio (M‐H, Random, 95% CI) | 1.62 [1.10, 2.39] |
| 1.1 Homozygous Major | 2 | 240 | Risk Ratio (M‐H, Random, 95% CI) | 1.98 [1.31, 3.00] |
| 1.2 Heterozygous | 2 | 172 | Risk Ratio (M‐H, Random, 95% CI) | 1.60 [0.70, 3.67] |
| 1.3 Homozygous Minor | 2 | 30 | Risk Ratio (M‐H, Random, 95% CI) | 2.04 [0.17, 25.25] |
| Outcome or subgroup title | No. of studies | No. of participants | Statistical method | Effect size |
| 1 End of Treatment Show forest plot | 2 | 69 | Risk Ratio (M‐H, Random, 95% CI) | 1.07 [0.48, 2.41] |
| 1.1 Homozygous Major | 2 | 55 | Risk Ratio (M‐H, Random, 95% CI) | 1.00 [0.40, 2.55] |
| 1.2 Heterozygous or Homozygous Minor | 2 | 14 | Risk Ratio (M‐H, Random, 95% CI) | 1.32 [0.26, 6.80] |
| Outcome or subgroup title | No. of studies | No. of participants | Statistical method | Effect size |
| 1 End of Treatment Show forest plot | 2 | 444 | Risk Ratio (M‐H, Random, 95% CI) | 1.64 [1.08, 2.49] |
| 1.1 Homozygous Major | 2 | 305 | Risk Ratio (M‐H, Random, 95% CI) | 1.89 [1.34, 2.67] |
| 1.2 Heterozygous | 2 | 125 | Risk Ratio (M‐H, Random, 95% CI) | 1.42 [0.48, 4.20] |
| 1.3 Homozygous Minor | 2 | 14 | Risk Ratio (M‐H, Random, 95% CI) | 1.93 [0.47, 8.02] |
| Outcome or subgroup title | No. of studies | No. of participants | Statistical method | Effect size |
| 1 End of Treatment Show forest plot | 2 | 69 | Risk Ratio (M‐H, Random, 95% CI) | 1.07 [0.48, 2.41] |
| 1.1 Homozygous Major | 2 | 57 | Risk Ratio (M‐H, Random, 95% CI) | 1.10 [0.43, 2.84] |
| 1.2 Heterozygous or Homozygous Minor | 2 | 12 | Risk Ratio (M‐H, Random, 95% CI) | 0.96 [0.17, 5.39] |
| Outcome or subgroup title | No. of studies | No. of participants | Statistical method | Effect size |
| 1 End of Treatment Show forest plot | 2 | 442 | Risk Ratio (M‐H, Random, 95% CI) | 1.72 [1.16, 2.53] |
| 1.1 Homozygous Major | 2 | 171 | Risk Ratio (M‐H, Random, 95% CI) | 2.00 [1.32, 3.03] |
| 1.2 Heterozygous | 2 | 200 | Risk Ratio (M‐H, Random, 95% CI) | 1.47 [0.60, 3.63] |
| 1.3 Homozygous Minor | 2 | 71 | Risk Ratio (M‐H, Random, 95% CI) | 2.29 [0.72, 7.27] |
| Outcome or subgroup title | No. of studies | No. of participants | Statistical method | Effect size |
| 1 End of Treatment Show forest plot | 2 | 68 | Risk Ratio (M‐H, Random, 95% CI) | 0.85 [0.41, 1.77] |
| 1.1 Homozygous Major | 2 | 36 | Risk Ratio (M‐H, Random, 95% CI) | 0.71 [0.29, 1.76] |
| 1.2 Heterozygous or Homozygous Minor | 2 | 32 | Risk Ratio (M‐H, Random, 95% CI) | 1.19 [0.34, 4.13] |
| Outcome or subgroup title | No. of studies | No. of participants | Statistical method | Effect size |
| 1 End of Treatment Show forest plot | 2 | 533 | Risk Ratio (M‐H, Random, 95% CI) | 1.18 [0.90, 1.55] |
| 1.1 Homozygous Major | 2 | 206 | Risk Ratio (M‐H, Random, 95% CI) | 1.14 [0.54, 2.42] |
| 1.2 Heterozygous | 2 | 262 | Risk Ratio (M‐H, Random, 95% CI) | 1.22 [0.93, 1.61] |
| 1.3 Homozygous Minor | 2 | 65 | Risk Ratio (M‐H, Random, 95% CI) | 1.28 [0.68, 2.44] |
| Outcome or subgroup title | No. of studies | No. of participants | Statistical method | Effect size |
| 1 End of Treatment Show forest plot | 2 | 87 | Risk Ratio (M‐H, Random, 95% CI) | 0.70 [0.37, 1.31] |
| 1.1 Homozygous Major | 2 | 66 | Risk Ratio (M‐H, Random, 95% CI) | 0.77 [0.40, 1.49] |
| 1.2 Heterozygous or Homozygous Minor | 2 | 21 | Risk Ratio (M‐H, Random, 95% CI) | 0.33 [0.05, 2.19] |
| Outcome or subgroup title | No. of studies | No. of participants | Statistical method | Effect size |
| 1 End of Treatment Show forest plot | 2 | 531 | Risk Ratio (M‐H, Random, 95% CI) | 1.18 [0.90, 1.55] |
| 1.1 Homozygous Major | 2 | 206 | Risk Ratio (M‐H, Random, 95% CI) | 1.14 [0.54, 2.42] |
| 1.2 Heterozygous | 2 | 262 | Risk Ratio (M‐H, Random, 95% CI) | 1.22 [0.93, 1.61] |
| 1.3 Homozygous Minor | 2 | 63 | Risk Ratio (M‐H, Random, 95% CI) | 1.27 [0.66, 2.44] |
| Outcome or subgroup title | No. of studies | No. of participants | Statistical method | Effect size |
| 1 End of Treatment Show forest plot | 2 | 87 | Risk Ratio (M‐H, Random, 95% CI) | 0.69 [0.37, 1.27] |
| 1.1 Homozygous Major | 2 | 74 | Risk Ratio (M‐H, Random, 95% CI) | 0.73 [0.38, 1.40] |
| 1.2 Heterozygous or Homozygous Minor | 2 | 13 | Risk Ratio (M‐H, Random, 95% CI) | 0.41 [0.06, 2.76] |
| Outcome or subgroup title | No. of studies | No. of participants | Statistical method | Effect size |
| 1 End of Treatment Show forest plot | 2 | 532 | Risk Ratio (M‐H, Random, 95% CI) | 1.18 [0.91, 1.52] |
| 1.1 Homozygous Major | 2 | 204 | Risk Ratio (M‐H, Random, 95% CI) | 1.17 [0.54, 2.52] |
| 1.2 Heterozygous | 2 | 264 | Risk Ratio (M‐H, Random, 95% CI) | 1.21 [0.92, 1.60] |
| 1.3 Homozygous Minor | 2 | 64 | Risk Ratio (M‐H, Random, 95% CI) | 1.24 [0.68, 2.25] |
| Outcome or subgroup title | No. of studies | No. of participants | Statistical method | Effect size |
| 1 End of Treatment Show forest plot | 2 | 87 | Risk Ratio (M‐H, Random, 95% CI) | 0.66 [0.35, 1.23] |
| 1.1 Homozygous Major | 2 | 50 | Risk Ratio (M‐H, Random, 95% CI) | 0.56 [0.23, 1.35] |
| 1.2 Heterozygous or Homozygous Minor | 2 | 37 | Risk Ratio (M‐H, Random, 95% CI) | 0.77 [0.32, 1.90] |
| Outcome or subgroup title | No. of studies | No. of participants | Statistical method | Effect size |
| 1 End of Treatment Show forest plot | 2 | 531 | Risk Ratio (M‐H, Random, 95% CI) | 1.15 [0.96, 1.39] |
| 1.1 Homozygous Major | 2 | 236 | Risk Ratio (M‐H, Random, 95% CI) | 1.19 [0.77, 1.84] |
| 1.2 Heterozygous | 2 | 229 | Risk Ratio (M‐H, Random, 95% CI) | 1.11 [0.82, 1.51] |
| 1.3 Homozygous Minor | 2 | 66 | Risk Ratio (M‐H, Random, 95% CI) | 1.34 [0.80, 2.25] |
| Outcome or subgroup title | No. of studies | No. of participants | Statistical method | Effect size |
| 1 End of Treatment Show forest plot | 2 | 94 | Risk Ratio (M‐H, Random, 95% CI) | 0.49 [0.25, 0.99] |
| 1.1 Homozygous Major | 2 | 65 | Risk Ratio (M‐H, Random, 95% CI) | 0.43 [0.18, 1.01] |
| 1.2 Heterozygous or Homozygous Minor | 2 | 29 | Risk Ratio (M‐H, Random, 95% CI) | 0.73 [0.13, 4.20] |
| Outcome or subgroup title | No. of studies | No. of participants | Statistical method | Effect size |
| 1 End of Treatment Show forest plot | 2 | 533 | Risk Ratio (M‐H, Random, 95% CI) | 1.16 [0.95, 1.42] |
| 1.1 Homozygous Major | 2 | 145 | Risk Ratio (M‐H, Random, 95% CI) | 1.01 [0.65, 1.59] |
| 1.2 Heterozygous | 2 | 272 | Risk Ratio (M‐H, Random, 95% CI) | 1.27 [0.81, 2.00] |
| 1.3 Homozygous Minor | 2 | 116 | Risk Ratio (M‐H, Random, 95% CI) | 1.29 [0.90, 1.84] |
| Outcome or subgroup title | No. of studies | No. of participants | Statistical method | Effect size |
| 1 End of Treatment Show forest plot | 2 | 87 | Risk Ratio (M‐H, Random, 95% CI) | 0.75 [0.39, 1.43] |
| 1.1 Homozygous Major | 2 | 33 | Risk Ratio (M‐H, Random, 95% CI) | 0.61 [0.13, 2.86] |
| 1.2 Heterozygous or Homozygous Minor | 2 | 54 | Risk Ratio (M‐H, Random, 95% CI) | 0.73 [0.27, 1.93] |
| Outcome or subgroup title | No. of studies | No. of participants | Statistical method | Effect size |
| 1 End of Treatment Show forest plot | 2 | 531 | Risk Ratio (M‐H, Random, 95% CI) | 1.20 [0.97, 1.49] |
| 1.1 Homozygous Major | 2 | 279 | Risk Ratio (M‐H, Random, 95% CI) | 1.22 [0.66, 2.25] |
| 1.2 Heterozygous | 2 | 214 | Risk Ratio (M‐H, Random, 95% CI) | 1.22 [0.92, 1.62] |
| 1.3 Homozygous Minor | 2 | 38 | Risk Ratio (M‐H, Random, 95% CI) | 1.68 [0.89, 3.17] |
| Outcome or subgroup title | No. of studies | No. of participants | Statistical method | Effect size |
| 1 End of Treatment Show forest plot | 2 | 87 | Risk Ratio (M‐H, Random, 95% CI) | 0.63 [0.33, 1.20] |
| 1.1 Homozygous Major | 2 | 76 | Risk Ratio (M‐H, Random, 95% CI) | 0.59 [0.30, 1.15] |
| 1.2 Heterozygous or Homozygous Minor | 2 | 11 | Risk Ratio (M‐H, Random, 95% CI) | 1.2 [0.17, 8.24] |
| Outcome or subgroup title | No. of studies | No. of participants | Statistical method | Effect size |
| 1 End of Treatment Show forest plot | 2 | 533 | Risk Ratio (M‐H, Random, 95% CI) | 1.18 [0.92, 1.50] |
| 1.1 Homozygous Major | 2 | 359 | Risk Ratio (M‐H, Random, 95% CI) | 1.09 [0.86, 1.37] |
| 1.2 Heterozygous | 2 | 159 | Risk Ratio (M‐H, Random, 95% CI) | 1.30 [0.62, 2.75] |
| 1.3 Homozygous Minor | 2 | 15 | Risk Ratio (M‐H, Random, 95% CI) | 2.17 [0.51, 9.18] |
| Outcome or subgroup title | No. of studies | No. of participants | Statistical method | Effect size |
| 1 End of Treatment Show forest plot | 2 | 87 | Risk Ratio (M‐H, Random, 95% CI) | 0.63 [0.33, 1.20] |
| 1.1 Homozygous Major | 2 | 76 | Risk Ratio (M‐H, Random, 95% CI) | 0.59 [0.30, 1.15] |
| 1.2 Heterozygous or Homozygous Minor | 2 | 11 | Risk Ratio (M‐H, Random, 95% CI) | 1.2 [0.17, 8.24] |
| Outcome or subgroup title | No. of studies | No. of participants | Statistical method | Effect size |
| 1 End of Treatment Show forest plot | 2 | 532 | Risk Ratio (M‐H, Random, 95% CI) | 1.17 [0.93, 1.47] |
| 1.1 Homozygous Major | 2 | 211 | Risk Ratio (M‐H, Random, 95% CI) | 1.28 [0.91, 1.80] |
| 1.2 Heterozygous | 2 | 241 | Risk Ratio (M‐H, Random, 95% CI) | 1.00 [0.69, 1.45] |
| 1.3 Homozygous Minor | 2 | 80 | Risk Ratio (M‐H, Random, 95% CI) | 1.61 [0.64, 4.08] |
| Outcome or subgroup title | No. of studies | No. of participants | Statistical method | Effect size |
| 1 End of Treatment Show forest plot | 2 | 87 | Risk Ratio (M‐H, Random, 95% CI) | 0.71 [0.37, 1.35] |
| 1.1 Homozygous Major | 2 | 49 | Risk Ratio (M‐H, Random, 95% CI) | 0.51 [0.09, 2.94] |
| 1.2 Heterozygous or Homozygous Minor | 2 | 38 | Risk Ratio (M‐H, Random, 95% CI) | 0.71 [0.26, 1.93] |
| Outcome or subgroup title | No. of studies | No. of participants | Statistical method | Effect size |
| 1 Six‐Month Abstinence Show forest plot | 7 | Risk Ratio (M‐H, Random, 95% CI) | Subtotals only | |
| 1.1 Homozygous Major vs Homozygous Minor | 7 | 1559 | Risk Ratio (M‐H, Random, 95% CI) | 0.92 [0.71, 1.19] |
| 1.2 Heterozygous vs Homozygous Minor | 7 | 1650 | Risk Ratio (M‐H, Random, 95% CI) | 0.91 [0.75, 1.11] |
| 2 End of Treatment Show forest plot | 5 | Risk Ratio (M‐H, Random, 95% CI) | Subtotals only | |
| 2.1 Homozygous Major vs Homozygous Minor | 5 | 1200 | Risk Ratio (M‐H, Random, 95% CI) | 0.88 [0.73, 1.06] |
| 2.2 Heterozygous vs Homozygous Minor | 5 | 1291 | Risk Ratio (M‐H, Random, 95% CI) | 0.93 [0.79, 1.10] |
| Outcome or subgroup title | No. of studies | No. of participants | Statistical method | Effect size |
| 1 Six‐Month Abstinence Show forest plot | 2 | Risk Ratio (M‐H, Random, 95% CI) | Subtotals only | |
| 1.1 Homozygous Major vs Homozygous Minor | 2 | 187 | Risk Ratio (M‐H, Random, 95% CI) | 1.08 [0.26, 4.57] |
| 1.2 Heterozygous vs Homozygous Minor | 2 | 56 | Risk Ratio (M‐H, Random, 95% CI) | 1.11 [0.25, 4.99] |
| Outcome or subgroup title | No. of studies | No. of participants | Statistical method | Effect size |
| 1 Six‐Month Abstinence Show forest plot | 2 | Risk Ratio (M‐H, Random, 95% CI) | Subtotals only | |
| 1.1 Homozygous Major vs Heterozygous or Homozygous Minor | 2 | 392 | Risk Ratio (M‐H, Random, 95% CI) | 2.24 [0.92, 5.45] |
| 2 End of Treatment Show forest plot | 2 | Risk Ratio (M‐H, Random, 95% CI) | Subtotals only | |
| 2.1 Homozygous Major vs Heterozygous or Homozygous Minor | 2 | 392 | Risk Ratio (M‐H, Random, 95% CI) | 2.75 [1.08, 7.02] |
| Outcome or subgroup title | No. of studies | No. of participants | Statistical method | Effect size |
| 1 Six‐Month Abstinence Show forest plot | 3 | Risk Ratio (M‐H, Random, 95% CI) | Subtotals only | |
| 1.1 Homozygous Major vs Homozygous Minor | 3 | 433 | Risk Ratio (M‐H, Random, 95% CI) | 1.05 [0.80, 1.37] |
| 1.2 Heterozygous vs Homozygous Minor | 3 | 546 | Risk Ratio (M‐H, Random, 95% CI) | 0.99 [0.76, 1.29] |
| 2 End of Treatment Show forest plot | 3 | Risk Ratio (M‐H, Random, 95% CI) | Subtotals only | |
| 2.1 Homozygous Major vs Homozygous Minor | 3 | 429 | Risk Ratio (M‐H, Random, 95% CI) | 0.95 [0.76, 1.18] |
| 2.2 Heterozygous vs Homozygous Minor | 3 | 542 | Risk Ratio (M‐H, Random, 95% CI) | 0.95 [0.77, 1.17] |
| Outcome or subgroup title | No. of studies | No. of participants | Statistical method | Effect size |
| 1 Six‐Month Abstinence Show forest plot | 2 | Risk Ratio (M‐H, Random, 95% CI) | Subtotals only | |
| 1.1 Homozygous Major vs Homozygous Minor | 2 | 501 | Risk Ratio (M‐H, Random, 95% CI) | 0.79 [0.60, 1.03] |
| 1.2 Heterozygous vs Homozygous Minor | 2 | 579 | Risk Ratio (M‐H, Random, 95% CI) | 0.83 [0.63, 1.10] |
| 2 End of Treatment Show forest plot | 2 | Risk Ratio (M‐H, Random, 95% CI) | Subtotals only | |
| 2.1 Homozygous Major vs Homozygous Minor | 2 | 501 | Risk Ratio (M‐H, Random, 95% CI) | 0.89 [0.59, 1.35] |
| 2.2 Heterozygous vs Homozygous Minor | 2 | 579 | Risk Ratio (M‐H, Random, 95% CI) | 1.00 [0.61, 1.64] |
| Outcome or subgroup title | No. of studies | No. of participants | Statistical method | Effect size |
| 1 Six‐Month Abstinence Show forest plot | 2 | Risk Ratio (M‐H, Random, 95% CI) | Subtotals only | |
| 1.1 Homozygous Major vs Heterozygous or Homozygous Minor | 2 | 391 | Risk Ratio (M‐H, Random, 95% CI) | 1.25 [0.87, 1.81] |
| 2 End of Treatment Show forest plot | 2 | Risk Ratio (M‐H, Random, 95% CI) | Subtotals only | |
| 2.1 Homozygous Major vs Heterozygous or Homozygous Minor | 2 | 391 | Risk Ratio (M‐H, Random, 95% CI) | 1.73 [1.20, 2.49] |
| Outcome or subgroup title | No. of studies | No. of participants | Statistical method | Effect size |
| 1 Six‐Month Abstinence Show forest plot | 3 | Risk Ratio (M‐H, Random, 95% CI) | Subtotals only | |
| 1.1 Homozygous Major vs Homozygous Minor | 3 | 866 | Risk Ratio (M‐H, Random, 95% CI) | 0.95 [0.51, 1.76] |
| 1.2 Heterozygous vs Homozygous Minor | 3 | 321 | Risk Ratio (M‐H, Random, 95% CI) | 0.81 [0.42, 1.60] |
| 2 End of Treatment Show forest plot | 3 | Risk Ratio (M‐H, Random, 95% CI) | Subtotals only | |
| 2.1 Homozygous Major vs Homozygous Minor | 3 | 866 | Risk Ratio (M‐H, Random, 95% CI) | 0.93 [0.71, 1.23] |
| 2.2 Heterozygous vs Homozygous Minor | 3 | 321 | Risk Ratio (M‐H, Random, 95% CI) | 0.85 [0.58, 1.26] |
| Outcome or subgroup title | No. of studies | No. of participants | Statistical method | Effect size |
| 1 Six‐Month Abstinence Show forest plot | 2 | Risk Ratio (M‐H, Random, 95% CI) | Subtotals only | |
| 1.1 Homozygous Major vs Homozygous Minor | 2 | 461 | Risk Ratio (M‐H, Random, 95% CI) | 0.92 [0.50, 1.67] |
| 1.2 Heterozygous vs Homozygous Minor | 2 | 649 | Risk Ratio (M‐H, Random, 95% CI) | 1.12 [0.66, 1.90] |
| 2 End of Treatment Show forest plot | 2 | Risk Ratio (M‐H, Random, 95% CI) | Subtotals only | |
| 2.1 Homozygous Major vs Homozygous Minor | 2 | 461 | Risk Ratio (M‐H, Random, 95% CI) | 0.97 [0.77, 1.23] |
| 2.2 Heterozygous vs Homozygous Minor | 2 | 649 | Risk Ratio (M‐H, Random, 95% CI) | 0.94 [0.74, 1.18] |
| Outcome or subgroup title | No. of studies | No. of participants | Statistical method | Effect size |
| 1 Six‐Month Abstinence Show forest plot | 2 | Risk Ratio (M‐H, Random, 95% CI) | Subtotals only | |
| 1.1 Normal NMR vs Slow NMR | 2 | 718 | Risk Ratio (M‐H, Random, 95% CI) | 0.54 [0.37, 0.78] |
| 2 End of Treatment Show forest plot | 2 | Risk Ratio (M‐H, Random, 95% CI) | Subtotals only | |
| 2.1 Normal NMR vs Slow NMR | 2 | 718 | Risk Ratio (M‐H, Random, 95% CI) | 0.77 [0.58, 1.03] |
| Outcome or subgroup title | No. of studies | No. of participants | Statistical method | Effect size |
| 1 Six‐Month Abstinence Show forest plot | 4 | Risk Ratio (M‐H, Random, 95% CI) | Subtotals only | |
| 1.1 Homozygous Major vs Homozygous Minor | 4 | 316 | Risk Ratio (M‐H, Random, 95% CI) | 1.27 [0.67, 2.43] |
| 1.2 Heterozygous vs Homozygous Minor | 4 | 390 | Risk Ratio (M‐H, Random, 95% CI) | 1.15 [0.65, 2.03] |
| 2 End of Treatment Show forest plot | 6 | Risk Ratio (M‐H, Random, 95% CI) | Subtotals only | |
| 2.1 Homozygous Major vs Homozygous Minor | 6 | 386 | Risk Ratio (M‐H, Random, 95% CI) | 1.15 [0.88, 1.50] |
| 2.2 Heterozygous vs Homozygous Minor | 6 | 480 | Risk Ratio (M‐H, Random, 95% CI) | 1.04 [0.81, 1.33] |
| Outcome or subgroup title | No. of studies | No. of participants | Statistical method | Effect size |
| 1 Six‐Month Abstinence Show forest plot | 2 | Risk Ratio (M‐H, Random, 95% CI) | Subtotals only | |
| 1.1 Homozygous Major vs Heterozygous or Homozygous Minor | 2 | 63 | Risk Ratio (M‐H, Random, 95% CI) | 0.83 [0.36, 1.95] |
| 2 End of Treatment Show forest plot | 3 | Risk Ratio (M‐H, Random, 95% CI) | Subtotals only | |
| 2.1 Homozygous Major vs Heterozygous or Homozygous Minor | 3 | 84 | Risk Ratio (M‐H, Random, 95% CI) | 0.94 [0.51, 1.72] |
| Outcome or subgroup title | No. of studies | No. of participants | Statistical method | Effect size |
| 1 End of Treatment Show forest plot | 3 | Risk Ratio (M‐H, Random, 95% CI) | Subtotals only | |
| 1.1 Homozygous Major vs Homozygous Minor | 3 | 160 | Risk Ratio (M‐H, Random, 95% CI) | 1.47 [0.96, 2.25] |
| 1.2 Heterozygous vs Homozygous Minor | 3 | 216 | Risk Ratio (M‐H, Random, 95% CI) | 1.20 [0.79, 1.84] |
| Outcome or subgroup title | No. of studies | No. of participants | Statistical method | Effect size |
| 1 Six‐Month Abstinence Show forest plot | 2 | Risk Ratio (M‐H, Random, 95% CI) | Subtotals only | |
| 1.1 Homozygous Major vs Heterozygous or Homozygous Minor | 2 | 294 | Risk Ratio (M‐H, Random, 95% CI) | 0.62 [0.31, 1.21] |
| 2 End of Treatment Show forest plot | 3 | Risk Ratio (M‐H, Random, 95% CI) | Subtotals only | |
| 2.1 Homozygous Major vs Heterozygous or Homozygous Minor | 3 | 315 | Risk Ratio (M‐H, Random, 95% CI) | 0.79 [0.48, 1.32] |
| Outcome or subgroup title | No. of studies | No. of participants | Statistical method | Effect size |
| 1 Six‐Month Abstinence Show forest plot | 4 | Risk Ratio (M‐H, Random, 95% CI) | Subtotals only | |
| 1.1 Homozygous Major vs Homozygous Minor | 4 | 304 | Risk Ratio (M‐H, Random, 95% CI) | 0.83 [0.52, 1.34] |
| 1.2 Heterozygous vs Homozygous Minor | 4 | 401 | Risk Ratio (M‐H, Random, 95% CI) | 0.90 [0.66, 1.21] |
| 2 End of Treatment Show forest plot | 4 | Risk Ratio (M‐H, Random, 95% CI) | Subtotals only | |
| 2.1 Homozygous Major vs Homozygous Minor | 4 | 304 | Risk Ratio (M‐H, Random, 95% CI) | 0.89 [0.69, 1.14] |
| 2.2 Heterozygous vs Homozygous Minor | 4 | 400 | Risk Ratio (M‐H, Random, 95% CI) | 0.96 [0.76, 1.22] |
| Outcome or subgroup title | No. of studies | No. of participants | Statistical method | Effect size |
| 1 Six‐Month Abstinence Show forest plot | 2 | Risk Ratio (M‐H, Random, 95% CI) | Subtotals only | |
| 1.1 Homozygous Major vs Homozygous Minor | 2 | 208 | Risk Ratio (M‐H, Random, 95% CI) | 0.77 [0.33, 1.81] |
| 1.2 Heterozygous vs Homozygous Minor | 2 | 269 | Risk Ratio (M‐H, Random, 95% CI) | 0.83 [0.51, 1.37] |
| 2 End of Treatment Show forest plot | 4 | Risk Ratio (M‐H, Random, 95% CI) | Subtotals only | |
| 2.1 Homozygous Major vs Homozygous Minor | 4 | 277 | Risk Ratio (M‐H, Random, 95% CI) | 1.16 [0.79, 1.70] |
| 2.2 Heterozygous vs Homozygous Minor | 4 | 361 | Risk Ratio (M‐H, Random, 95% CI) | 0.96 [0.61, 1.51] |
| Outcome or subgroup title | No. of studies | No. of participants | Statistical method | Effect size |
| 1 Six‐Month Abstinence Show forest plot | 3 | Risk Ratio (M‐H, Random, 95% CI) | Subtotals only | |
| 1.1 Homozygous Major vs Heterozygous or Homozygous Minor | 3 | 331 | Risk Ratio (M‐H, Random, 95% CI) | 0.89 [0.55, 1.46] |
| 2 End of Treatment Show forest plot | 4 | Risk Ratio (M‐H, Random, 95% CI) | Subtotals only | |
| 2.1 Homozygous Major vs Heterozygous or Homozygous Minor | 4 | 352 | Risk Ratio (M‐H, Random, 95% CI) | 1.24 [0.87, 1.76] |
| Outcome or subgroup title | No. of studies | No. of participants | Statistical method | Effect size |
| 1 Six‐Month Abstinence Show forest plot | 2 | Risk Ratio (M‐H, Random, 95% CI) | Subtotals only | |
| 1.1 Homozygous Major vs Homozygous Minor | 2 | 191 | Risk Ratio (M‐H, Random, 95% CI) | 0.90 [0.56, 1.46] |
| 1.2 Heterozygous vs Homozygous Minor | 2 | 161 | Risk Ratio (M‐H, Random, 95% CI) | 1.06 [0.65, 1.71] |
| 2 End of Treatment Show forest plot | 4 | Risk Ratio (M‐H, Random, 95% CI) | Subtotals only | |
| 2.1 Homozygous Major vs Homozygous Minor | 4 | 259 | Risk Ratio (M‐H, Random, 95% CI) | 1.02 [0.73, 1.40] |
| 2.2 Heterozygous vs Homozygous Minor | 4 | 237 | Risk Ratio (M‐H, Random, 95% CI) | 0.98 [0.70, 1.36] |
| Outcome or subgroup title | No. of studies | No. of participants | Statistical method | Effect size |
| 1 End of Treatment Show forest plot | 2 | Risk Ratio (M‐H, Random, 95% CI) | Subtotals only | |
| 1.1 Homozygous Major vs Heterozygous or Homozygous Minor | 2 | 46 | Risk Ratio (M‐H, Random, 95% CI) | 1.05 [0.37, 2.99] |
| Outcome or subgroup title | No. of studies | No. of participants | Statistical method | Effect size |
| 1 End of Treatment Show forest plot | 3 | Risk Ratio (M‐H, Random, 95% CI) | Subtotals only | |
| 1.1 Homozygous Major vs Homozygous Minor | 3 | 159 | Risk Ratio (M‐H, Random, 95% CI) | 1.00 [0.71, 1.40] |
| 1.2 Heterozygous vs Homozygous Minor | 3 | 238 | Risk Ratio (M‐H, Random, 95% CI) | 0.90 [0.65, 1.23] |
| Outcome or subgroup title | No. of studies | No. of participants | Statistical method | Effect size |
| 1 End of Treatment Show forest plot | 2 | Risk Ratio (M‐H, Random, 95% CI) | Subtotals only | |
| 1.1 Homozygous Major vs Homozygous Minor | 2 | 23 | Risk Ratio (M‐H, Random, 95% CI) | 1.16 [0.32, 4.26] |
| 1.2 Heterozygous vs Homozygous Minor | 2 | 27 | Risk Ratio (M‐H, Random, 95% CI) | 0.72 [0.18, 2.93] |
| Outcome or subgroup title | No. of studies | No. of participants | Statistical method | Effect size |
| 1 End of Treatment Show forest plot | 3 | Risk Ratio (M‐H, Random, 95% CI) | Subtotals only | |
| 1.1 Homozygous Major vs Homozygous Minor | 3 | 186 | Risk Ratio (M‐H, Random, 95% CI) | 0.85 [0.54, 1.35] |
| 1.2 Heterozygous vs Homozygous Minor | 3 | 163 | Risk Ratio (M‐H, Random, 95% CI) | 0.89 [0.56, 1.42] |
| Outcome or subgroup title | No. of studies | No. of participants | Statistical method | Effect size |
| 1 End of Treatment Show forest plot | 2 | Risk Ratio (M‐H, Random, 95% CI) | Subtotals only | |
| 1.1 Homozygous Major vs Heterozygous or Homozygous Minor | 2 | 47 | Risk Ratio (M‐H, Random, 95% CI) | 1.46 [0.35, 6.01] |
| Outcome or subgroup title | No. of studies | No. of participants | Statistical method | Effect size |
| 1 End of Treatment Show forest plot | 3 | Risk Ratio (M‐H, Random, 95% CI) | Subtotals only | |
| 1.1 Homozygous Major vs Homozygous Minor | 3 | 221 | Risk Ratio (M‐H, Random, 95% CI) | 0.81 [0.42, 1.55] |
| 1.2 Heterozygous vs Homozygous Minor | 3 | 112 | Risk Ratio (M‐H, Random, 95% CI) | 0.81 [0.40, 1.64] |
| Outcome or subgroup title | No. of studies | No. of participants | Statistical method | Effect size |
| 1 End of Treatment Show forest plot | 2 | Risk Ratio (M‐H, Random, 95% CI) | Subtotals only | |
| 1.1 Homozygous Major vs Heterozygous or Homozygous Minor | 2 | 47 | Risk Ratio (M‐H, Random, 95% CI) | 1.46 [0.35, 6.01] |
| Outcome or subgroup title | No. of studies | No. of participants | Statistical method | Effect size |
| 1 End of Treatment Show forest plot | 3 | Risk Ratio (M‐H, Random, 95% CI) | Subtotals only | |
| 1.1 Homozygous Major vs Homozygous Minor | 3 | 170 | Risk Ratio (M‐H, Random, 95% CI) | 1.61 [0.87, 3.00] |
| 1.2 Heterozygous vs Homozygous Minor | 3 | 199 | Risk Ratio (M‐H, Random, 95% CI) | 1.56 [0.79, 3.06] |
| Outcome or subgroup title | No. of studies | No. of participants | Statistical method | Effect size |
| 1 End of Treatment Show forest plot | 2 | Risk Ratio (M‐H, Random, 95% CI) | Subtotals only | |
| 1.1 Homozygous Major vs Heterozygous or Homozygous Minor | 2 | 47 | Risk Ratio (M‐H, Random, 95% CI) | 1.15 [0.54, 2.44] |
| Outcome or subgroup title | No. of studies | No. of participants | Statistical method | Effect size |
| 1 Six‐Month Abstinence Show forest plot | 2 | Risk Ratio (M‐H, Random, 95% CI) | Subtotals only | |
| 1.1 Homozygous Major vs Homozygous Minor | 2 | 358 | Risk Ratio (M‐H, Random, 95% CI) | 0.94 [0.71, 1.25] |
| 1.2 Heterozygous vs Homozygous Minor | 2 | 438 | Risk Ratio (M‐H, Random, 95% CI) | 0.99 [0.75, 1.30] |
| 2 End of Treatment Show forest plot | 2 | Risk Ratio (M‐H, Random, 95% CI) | Subtotals only | |
| 2.1 Homozygous Major vs Homozygous Minor | 2 | 358 | Risk Ratio (M‐H, Random, 95% CI) | 0.98 [0.78, 1.24] |
| 2.2 Heterozygous vs Homozygous Minor | 2 | 438 | Risk Ratio (M‐H, Random, 95% CI) | 0.97 [0.77, 1.22] |
| Outcome or subgroup title | No. of studies | No. of participants | Statistical method | Effect size |
| 1 Six‐Month Abstinence Show forest plot | 2 | Risk Ratio (M‐H, Random, 95% CI) | Subtotals only | |
| 1.1 Homozygous Major vs Homozygous Minor | 2 | 354 | Risk Ratio (M‐H, Random, 95% CI) | 1.20 [0.91, 1.60] |
| 1.2 Heterozygous vs Homozygous Minor | 2 | 465 | Risk Ratio (M‐H, Random, 95% CI) | 1.18 [0.90, 1.54] |
| 2 End of Treatment Show forest plot | 2 | Risk Ratio (M‐H, Random, 95% CI) | Subtotals only | |
| 2.1 Homozygous Major vs Homozygous Minor | 2 | 354 | Risk Ratio (M‐H, Random, 95% CI) | 1.14 [0.91, 1.43] |
| 2.2 Heterozygous vs Homozygous Minor | 2 | 465 | Risk Ratio (M‐H, Random, 95% CI) | 1.10 [0.89, 1.37] |
| Outcome or subgroup title | No. of studies | No. of participants | Statistical method | Effect size |
| 1 End of Treatment Show forest plot | 2 | Risk Ratio (M‐H, Random, 95% CI) | Subtotals only | |
| 1.1 Homozygous Major vs Homozygous Minor | 2 | 138 | Risk Ratio (M‐H, Random, 95% CI) | 1.10 [0.67, 1.78] |
| 1.2 Heterozygous vs Homozygous Minor | 2 | 155 | Risk Ratio (M‐H, Random, 95% CI) | 1.11 [0.69, 1.80] |
| Outcome or subgroup title | No. of studies | No. of participants | Statistical method | Effect size |
| 1 End of Treatment Show forest plot | 2 | Risk Ratio (M‐H, Random, 95% CI) | Subtotals only | |
| 1.1 Homozygous Major vs Heterozygous or Homozygous Minor | 2 | 40 | Risk Ratio (M‐H, Random, 95% CI) | 2.26 [0.36, 14.38] |
| Outcome or subgroup title | No. of studies | No. of participants | Statistical method | Effect size |
| 1 End of Treatment Show forest plot | 2 | Risk Ratio (M‐H, Random, 95% CI) | Subtotals only | |
| 1.1 Homozygous Major vs Homozygous Minor | 2 | 136 | Risk Ratio (M‐H, Random, 95% CI) | 1.12 [0.67, 1.85] |
| 1.2 Heterozygous vs Homozygous Minor | 2 | 153 | Risk Ratio (M‐H, Random, 95% CI) | 1.13 [0.68, 1.86] |
| Outcome or subgroup title | No. of studies | No. of participants | Statistical method | Effect size |
| 1 End of Treatment Show forest plot | 2 | Risk Ratio (M‐H, Random, 95% CI) | Subtotals only | |
| 1.1 Homozygous Major vs Heterozygous or Homozygous Minor | 2 | 40 | Risk Ratio (M‐H, Random, 95% CI) | 1.66 [0.27, 10.32] |
| Outcome or subgroup title | No. of studies | No. of participants | Statistical method | Effect size |
| 1 End of Treatment Show forest plot | 2 | Risk Ratio (M‐H, Random, 95% CI) | Subtotals only | |
| 1.1 Homozygous Major vs Homozygous Minor | 2 | 135 | Risk Ratio (M‐H, Random, 95% CI) | 1.12 [0.70, 1.79] |
| 1.2 Heterozygous vs Homozygous Minor | 2 | 156 | Risk Ratio (M‐H, Random, 95% CI) | 1.04 [0.65, 1.66] |
| Outcome or subgroup title | No. of studies | No. of participants | Statistical method | Effect size |
| 1 End of Treatment Show forest plot | 2 | Risk Ratio (M‐H, Random, 95% CI) | Subtotals only | |
| 1.1 Homozygous Major vs Homozygous Minor | 2 | 28 | Risk Ratio (M‐H, Random, 95% CI) | 0.51 [0.06, 4.51] |
| 1.2 Heterozygous vs Homozygous Minor | 2 | 17 | Risk Ratio (M‐H, Random, 95% CI) | 0.70 [0.03, 15.98] |
| Outcome or subgroup title | No. of studies | No. of participants | Statistical method | Effect size |
| 1 End of Treatment Show forest plot | 2 | Risk Ratio (M‐H, Random, 95% CI) | Subtotals only | |
| 1.1 Homozygous Major vs Homozygous Minor | 2 | 144 | Risk Ratio (M‐H, Random, 95% CI) | 0.94 [0.66, 1.34] |
| 1.2 Heterozygous vs Homozygous Minor | 2 | 153 | Risk Ratio (M‐H, Random, 95% CI) | 0.79 [0.55, 1.14] |
| Outcome or subgroup title | No. of studies | No. of participants | Statistical method | Effect size |
| 1 End of Treatment Show forest plot | 2 | Risk Ratio (M‐H, Random, 95% CI) | Subtotals only | |
| 1.1 Homozygous Major vs Heterozygous or Homozygous Minor | 2 | 40 | Risk Ratio (M‐H, Random, 95% CI) | 0.36 [0.13, 0.99] |
| Outcome or subgroup title | No. of studies | No. of participants | Statistical method | Effect size |
| 1 End of Treatment Show forest plot | 2 | Risk Ratio (M‐H, Random, 95% CI) | Subtotals only | |
| 1.1 Homozygous Major vs Homozygous Minor | 2 | 128 | Risk Ratio (M‐H, Random, 95% CI) | 0.79 [0.57, 1.10] |
| 1.2 Heterozygous vs Homozygous Minor | 2 | 194 | Risk Ratio (M‐H, Random, 95% CI) | 0.81 [0.51, 1.28] |
| Outcome or subgroup title | No. of studies | No. of participants | Statistical method | Effect size |
| 1 End of Treatment Show forest plot | 2 | Risk Ratio (M‐H, Random, 95% CI) | Subtotals only | |
| 1.1 Homozygous Major vs Heterozygous or Homozygous Minor | 2 | 40 | Risk Ratio (M‐H, Random, 95% CI) | 1.29 [0.12, 13.56] |
| Outcome or subgroup title | No. of studies | No. of participants | Statistical method | Effect size |
| 1 End of Treatment Show forest plot | 2 | Risk Ratio (M‐H, Random, 95% CI) | Subtotals only | |
| 1.1 Homozygous Major vs Homozygous Minor | 2 | 170 | Risk Ratio (M‐H, Random, 95% CI) | 0.64 [0.43, 0.94] |
| 1.2 Heterozygous vs Homozygous Minor | 2 | 117 | Risk Ratio (M‐H, Random, 95% CI) | 0.71 [0.50, 1.03] |
| Outcome or subgroup title | No. of studies | No. of participants | Statistical method | Effect size |
| 1 End of Treatment Show forest plot | 2 | Risk Ratio (M‐H, Random, 95% CI) | Subtotals only | |
| 1.1 Homozygous Major vs Heterozygous or Homozygous Minor | 2 | 40 | Risk Ratio (M‐H, Random, 95% CI) | 0.54 [0.15, 1.94] |
| Outcome or subgroup title | No. of studies | No. of participants | Statistical method | Effect size |
| 1 End of Treatment Show forest plot | 2 | Risk Ratio (M‐H, Random, 95% CI) | Subtotals only | |
| 1.1 Homozygous Major vs Homozygous Minor | 2 | 193 | Risk Ratio (M‐H, Random, 95% CI) | 0.63 [0.37, 1.07] |
| 1.2 Heterozygous vs Homozygous Minor | 2 | 85 | Risk Ratio (M‐H, Random, 95% CI) | 0.75 [0.42, 1.32] |
| Outcome or subgroup title | No. of studies | No. of participants | Statistical method | Effect size |
| 1 End of Treatment Show forest plot | 2 | Risk Ratio (M‐H, Random, 95% CI) | Subtotals only | |
| 1.1 Homozygous Major vs Heterozygous or Homozygous Minor | 2 | 40 | Risk Ratio (M‐H, Random, 95% CI) | 0.54 [0.15, 1.94] |
| Outcome or subgroup title | No. of studies | No. of participants | Statistical method | Effect size |
| 1 End of Treatment Show forest plot | 2 | Risk Ratio (M‐H, Random, 95% CI) | Subtotals only | |
| 1.1 Homozygous Major vs Homozygous Minor | 2 | 148 | Risk Ratio (M‐H, Random, 95% CI) | 1.18 [0.84, 1.66] |
| 1.2 Heterozygous vs Homozygous Minor | 2 | 162 | Risk Ratio (M‐H, Random, 95% CI) | 0.88 [0.61, 1.26] |
| Outcome or subgroup title | No. of studies | No. of participants | Statistical method | Effect size |
| 1 End of Treatment Show forest plot | 2 | Risk Ratio (M‐H, Random, 95% CI) | Subtotals only | |
| 1.1 Homozygous Major vs Heterozygous or Homozygous Minor | 2 | 40 | Risk Ratio (M‐H, Random, 95% CI) | 0.76 [0.04, 13.56] |
| Outcome or subgroup title | No. of studies | No. of participants | Statistical method | Effect size |
| 1 Six‐Month Abstinence Show forest plot | 6 | Risk Ratio (M‐H, Random, 95% CI) | Subtotals only | |
| 1.1 Homozygous Major vs Homozygous Minor | 6 | 533 | Risk Ratio (M‐H, Random, 95% CI) | 1.29 [0.86, 1.92] |
| 1.2 Heterozygous vs Homozygous Minor | 6 | 597 | Risk Ratio (M‐H, Random, 95% CI) | 1.08 [0.72, 1.62] |
| 2 End of Treatment Show forest plot | 7 | Risk Ratio (M‐H, Random, 95% CI) | Subtotals only | |
| 2.1 Homozygous Major vs Homozygous Minor | 7 | 542 | Risk Ratio (M‐H, Random, 95% CI) | 1.39 [0.91, 2.13] |
| 2.2 Heterozygous vs Homozygous Minor | 7 | 605 | Risk Ratio (M‐H, Random, 95% CI) | 1.24 [0.81, 1.89] |
| Outcome or subgroup title | No. of studies | No. of participants | Statistical method | Effect size |
| 1 Six‐Month Abstinence Show forest plot | 2 | Risk Ratio (M‐H, Random, 95% CI) | Subtotals only | |
| 1.1 Homozygous Major vs Heterozygous or Homozygous Minor | 2 | 63 | Risk Ratio (M‐H, Random, 95% CI) | 0.73 [0.08, 6.73] |
| 2 End of Treatment Show forest plot | 3 | Risk Ratio (M‐H, Random, 95% CI) | Subtotals only | |
| 2.1 Homozygous Major vs Heterozygous or Homozygous Minor | 3 | 83 | Risk Ratio (M‐H, Random, 95% CI) | 0.76 [0.24, 2.45] |
| Outcome or subgroup title | No. of studies | No. of participants | Statistical method | Effect size |
| 1 Six‐Month Abstinence Show forest plot | 2 | Risk Ratio (M‐H, Random, 95% CI) | Subtotals only | |
| 1.1 Homozygous Major vs Homozygous Minor | 2 | 162 | Risk Ratio (M‐H, Random, 95% CI) | 1.05 [0.51, 2.14] |
| 1.2 Heterozygous vs Homozygous Minor | 2 | 211 | Risk Ratio (M‐H, Random, 95% CI) | 0.79 [0.32, 1.96] |
| 2 End of Treatment Show forest plot | 4 | Risk Ratio (M‐H, Random, 95% CI) | Subtotals only | |
| 2.1 Homozygous Major vs Homozygous Minor | 4 | 218 | Risk Ratio (M‐H, Random, 95% CI) | 1.55 [0.68, 3.53] |
| 2.2 Heterozygous vs Homozygous Minor | 4 | 276 | Risk Ratio (M‐H, Random, 95% CI) | 1.34 [0.51, 3.53] |
| Outcome or subgroup title | No. of studies | No. of participants | Statistical method | Effect size |
| 1 Six‐Month Abstinence Show forest plot | 3 | Risk Ratio (M‐H, Random, 95% CI) | Subtotals only | |
| 1.1 Homozygous Major vs Heterozygous or Homozygous Minor | 3 | 584 | Risk Ratio (M‐H, Random, 95% CI) | 0.74 [0.42, 1.33] |
| 2 End of Treatment Show forest plot | 4 | Risk Ratio (M‐H, Random, 95% CI) | Subtotals only | |
| 2.1 Homozygous Major vs Heterozygous or Homozygous Minor | 4 | 596 | Risk Ratio (M‐H, Random, 95% CI) | 0.55 [0.35, 0.86] |
| Outcome or subgroup title | No. of studies | No. of participants | Statistical method | Effect size |
| 1 Six‐Month Abstinence Show forest plot | 5 | Risk Ratio (M‐H, Random, 95% CI) | Subtotals only | |
| 1.1 Homozygous Major vs Homozygous Minor | 5 | 383 | Risk Ratio (M‐H, Random, 95% CI) | 1.04 [0.69, 1.57] |
| 1.2 Heterozygous vs Homozygous Minor | 5 | 470 | Risk Ratio (M‐H, Random, 95% CI) | 1.07 [0.72, 1.58] |
| 2 End of Treatment Show forest plot | 5 | Risk Ratio (M‐H, Random, 95% CI) | Subtotals only | |
| 2.1 Homozygous Major vs Homozygous Minor | 5 | 362 | Risk Ratio (M‐H, Random, 95% CI) | 0.88 [0.63, 1.21] |
| 2.2 Heterozygous vs Homozygous Minor | 5 | 404 | Risk Ratio (M‐H, Random, 95% CI) | 1.08 [0.80, 1.46] |
| Outcome or subgroup title | No. of studies | No. of participants | Statistical method | Effect size |
| 1 Six‐Month Abstinence Show forest plot | 2 | Risk Ratio (M‐H, Random, 95% CI) | Subtotals only | |
| 1.1 Homozygous Major vs Heterozygous or Homozygous Minor | 2 | 566 | Risk Ratio (M‐H, Random, 95% CI) | 1.20 [0.80, 1.79] |
| 2 End of Treatment Show forest plot | 2 | Risk Ratio (M‐H, Random, 95% CI) | Subtotals only | |
| 2.1 Homozygous Major vs Heterozygous or Homozygous Minor | 2 | 566 | Risk Ratio (M‐H, Random, 95% CI) | 1.12 [0.71, 1.77] |
| Outcome or subgroup title | No. of studies | No. of participants | Statistical method | Effect size |
| 1 Six‐Month Abstinence Show forest plot | 2 | Risk Ratio (M‐H, Random, 95% CI) | Subtotals only | |
| 1.1 Homozygous Major vs Homozygous Minor | 2 | 160 | Risk Ratio (M‐H, Random, 95% CI) | 1.85 [0.77, 4.44] |
| 1.2 Heterozygous vs Homozygous Minor | 2 | 209 | Risk Ratio (M‐H, Random, 95% CI) | 1.58 [0.66, 3.77] |
| 2 End of Treatment Show forest plot | 4 | Risk Ratio (M‐H, Random, 95% CI) | Subtotals only | |
| 2.1 Homozygous Major vs Homozygous Minor | 4 | 216 | Risk Ratio (M‐H, Random, 95% CI) | 1.98 [0.91, 4.35] |
| 2.2 Heterozygous vs Homozygous Minor | 4 | 275 | Risk Ratio (M‐H, Random, 95% CI) | 1.86 [0.94, 3.69] |
| Outcome or subgroup title | No. of studies | No. of participants | Statistical method | Effect size |
| 1 Six‐Month Abstinence Show forest plot | 4 | Risk Ratio (M‐H, Random, 95% CI) | Subtotals only | |
| 1.1 Homozygous Major vs Heterozygous or Homozygous Minor | 4 | 629 | Risk Ratio (M‐H, Random, 95% CI) | 1.12 [0.71, 1.77] |
| 2 End of Treatment Show forest plot | 5 | Risk Ratio (M‐H, Random, 95% CI) | Subtotals only | |
| 2.1 Homozygous Major vs Heterozygous or Homozygous Minor | 5 | 641 | Risk Ratio (M‐H, Random, 95% CI) | 1.08 [0.71, 1.64] |
| Outcome or subgroup title | No. of studies | No. of participants | Statistical method | Effect size |
| 1 Six‐Month Abstinence Show forest plot | 3 | Risk Ratio (M‐H, Random, 95% CI) | Subtotals only | |
| 1.1 Homozygous Major vs Homozygous Minor | 3 | 387 | Risk Ratio (M‐H, Random, 95% CI) | 1.07 [0.37, 3.16] |
| 1.2 Heterozygous vs Homozygous Minor | 3 | 212 | Risk Ratio (M‐H, Random, 95% CI) | 0.60 [0.22, 1.63] |
| 2 End of Treatment Show forest plot | 3 | Risk Ratio (M‐H, Random, 95% CI) | Subtotals only | |
| 2.1 Homozygous Major vs Homozygous Minor | 3 | 387 | Risk Ratio (M‐H, Random, 95% CI) | 1.08 [0.51, 2.29] |
| 2.2 Heterozygous vs Homozygous Minor | 3 | 212 | Risk Ratio (M‐H, Random, 95% CI) | 0.88 [0.61, 1.29] |
| Outcome or subgroup title | No. of studies | No. of participants | Statistical method | Effect size |
| 1 Six‐Month Abstinence Show forest plot | 2 | Risk Ratio (M‐H, Random, 95% CI) | Subtotals only | |
| 1.1 Homozygous Major vs Homozygous Minor | 2 | 162 | Risk Ratio (M‐H, Random, 95% CI) | 0.84 [0.46, 1.51] |
| 1.2 Heterozygous vs Homozygous Minor | 2 | 142 | Risk Ratio (M‐H, Random, 95% CI) | 0.66 [0.35, 1.26] |
| 2 End of Treatment Show forest plot | 4 | Risk Ratio (M‐H, Random, 95% CI) | Subtotals only | |
| 2.1 Homozygous Major vs Homozygous Minor | 4 | 215 | Risk Ratio (M‐H, Random, 95% CI) | 1.23 [0.74, 2.05] |
| 2.2 Heterozygous vs Homozygous Minor | 4 | 203 | Risk Ratio (M‐H, Random, 95% CI) | 0.97 [0.57, 1.65] |
| Outcome or subgroup title | No. of studies | No. of participants | Statistical method | Effect size |
| 1 End of Treatment Show forest plot | 3 | Risk Ratio (M‐H, Random, 95% CI) | Subtotals only | |
| 1.1 Homozygous Major vs Homozygous Minor | 3 | 113 | Risk Ratio (M‐H, Random, 95% CI) | 0.81 [0.45, 1.45] |
| 1.2 Heterozygous vs Homozygous Minor | 3 | 160 | Risk Ratio (M‐H, Random, 95% CI) | 0.95 [0.57, 1.60] |
| Outcome or subgroup title | No. of studies | No. of participants | Statistical method | Effect size |
| 1 End of Treatment Show forest plot | 2 | Risk Ratio (M‐H, Random, 95% CI) | Subtotals only | |
| 1.1 Homozygous Major vs Heterozygous or Homozygous Minor | 2 | 29 | Risk Ratio (M‐H, Random, 95% CI) | 1.17 [0.27, 5.04] |
| Outcome or subgroup title | No. of studies | No. of participants | Statistical method | Effect size |
| 1 End of Treatment Show forest plot | 3 | Risk Ratio (M‐H, Random, 95% CI) | Subtotals only | |
| 1.1 Homozygous Major vs Homozygous Minor | 3 | 129 | Risk Ratio (M‐H, Random, 95% CI) | 0.81 [0.18, 3.62] |
| 1.2 Heterozygous vs Homozygous Minor | 3 | 116 | Risk Ratio (M‐H, Random, 95% CI) | 0.80 [0.39, 1.63] |
| Outcome or subgroup title | No. of studies | No. of participants | Statistical method | Effect size |
| 1 End of Treatment Show forest plot | 2 | Risk Ratio (M‐H, Random, 95% CI) | Subtotals only | |
| 1.1 Homozygous Major vs Heterozygous or Homozygous Minor | 2 | 29 | Risk Ratio (M‐H, Random, 95% CI) | 0.72 [0.19, 2.78] |
| Outcome or subgroup title | No. of studies | No. of participants | Statistical method | Effect size |
| 1 End of Treatment Show forest plot | 3 | Risk Ratio (M‐H, Random, 95% CI) | Subtotals only | |
| 1.1 Homozygous Major vs Homozygous Minor | 3 | 163 | Risk Ratio (M‐H, Random, 95% CI) | 0.95 [0.29, 3.14] |
| 1.2 Heterozygous vs Homozygous Minor | 3 | 77 | Risk Ratio (M‐H, Random, 95% CI) | 1.20 [0.36, 4.03] |
| Outcome or subgroup title | No. of studies | No. of participants | Statistical method | Effect size |
| 1 End of Treatment Show forest plot | 2 | Risk Ratio (M‐H, Random, 95% CI) | Subtotals only | |
| 1.1 Homozygous Major vs Heterozygous or Homozygous Minor | 2 | 29 | Risk Ratio (M‐H, Random, 95% CI) | 0.49 [0.18, 1.32] |
| Outcome or subgroup title | No. of studies | No. of participants | Statistical method | Effect size |
| 1 End of Treatment Show forest plot | 3 | Risk Ratio (M‐H, Random, 95% CI) | Subtotals only | |
| 1.1 Homozygous Major vs Homozygous Minor | 3 | 129 | Risk Ratio (M‐H, Random, 95% CI) | 0.97 [0.52, 1.82] |
| 1.2 Heterozygous vs Homozygous Minor | 3 | 140 | Risk Ratio (M‐H, Random, 95% CI) | 1.15 [0.63, 2.12] |
| Outcome or subgroup title | No. of studies | No. of participants | Statistical method | Effect size |
| 1 End of Treatment Show forest plot | 2 | Risk Ratio (M‐H, Random, 95% CI) | Subtotals only | |
| 1.1 Homozygous Major vs Heterozygous or Homozygous Minor | 2 | 29 | Risk Ratio (M‐H, Random, 95% CI) | 0.98 [0.03, 38.58] |
| Outcome or subgroup title | No. of studies | No. of participants | Statistical method | Effect size |
| 1 Six‐Month Abstinence Show forest plot | 2 | Risk Ratio (M‐H, Random, 95% CI) | Subtotals only | |
| 1.1 Homozygous Major or Heterozygous vs Homozygous Minor | 2 | 151 | Risk Ratio (M‐H, Random, 95% CI) | 0.75 [0.32, 1.79] |
| 2 End of Treatment Show forest plot | 2 | Risk Ratio (M‐H, Random, 95% CI) | Subtotals only | |
| 2.1 Homozygous Major or Heterozygous vs Homozygous Minor | 2 | 151 | Risk Ratio (M‐H, Random, 95% CI) | 1.07 [0.83, 1.38] |
| Outcome or subgroup title | No. of studies | No. of participants | Statistical method | Effect size |
| 1 Six‐Month Abstinence Show forest plot | 2 | Risk Ratio (M‐H, Random, 95% CI) | Subtotals only | |
| 1.1 Normal NMR vs Slow NMR | 2 | 699 | Risk Ratio (M‐H, Random, 95% CI) | 1.02 [0.70, 1.48] |
| 2 End of Treatment Show forest plot | 2 | Risk Ratio (M‐H, Random, 95% CI) | Subtotals only | |
| 2.1 Normal NMR vs Slow NMR | 2 | 718 | Risk Ratio (M‐H, Random, 95% CI) | 0.63 [0.35, 1.14] |