Arzneimitteltherapie für die Raucherentwöhnung: Wirkungen in Untergruppen, definiert durch genetisch informierte Biomarker
Abstract
Background
Smoking cessation therapies are not effective for all smokers, and researchers are interested in identifying those subgroups of individuals (e.g. based on genotype) who respond best to specific treatments.
Objectives
To assess whether quit rates vary by genetically informed biomarkers within pharmacotherapy treatment arms and as compared with placebo. To assess the effects of pharmacotherapies for smoking cessation in subgroups of smokers defined by genotype for identified genome‐wide significant polymorphisms.
Search methods
We searched the Cochrane Tobacco Addiction Group specialised register, clinical trial registries, and genetics databases for trials of pharmacotherapies for smoking cessation from inception until 16 August 2016.
Selection criteria
We included randomised controlled trials (RCTs) that recruited adult smokers and reported pharmacogenomic analyses from trials of smoking cessation pharmacotherapies versus controls. Eligible trials included those with data on a priori genome‐wide significant (P < 5 × 10‐8) single‐nucleotide polymorphisms (SNPs), replicated non‐SNPs, and/or the nicotine metabolite ratio (NMR), hereafter collectively described as biomarkers.
Data collection and analysis
We used standard methodological procedures expected by Cochrane. The primary outcome was smoking abstinence at six months after treatment. The secondary outcome was abstinence at end of treatment (EOT). We conducted two types of meta‐analyses‐ one in which we assessed smoking cessation of active treatment versus placebo within genotype groups, and another in which we compared smoking cessation across genotype groups within treatment arms. We carried out analyses separately in non‐Hispanic whites (NHWs) and non‐Hispanic blacks (NHBs). We assessed heterogeneity between genotype groups using T², I², and Cochrane Q statistics.
Main results
Analyses included 18 trials including 9017 participants, of whom 6924 were NHW and 2093 NHB participants. Data were available for the following biomarkers: nine SNPs (rs1051730 (CHRNA3); rs16969968, rs588765, and rs2036527 (CHRNA5); rs3733829 and rs7937 (in EGLN2, near CYP2A6); rs1329650 and rs1028936 (LOC100188947); and rs215605 (PDE1C)), two variable number tandem repeats (VNTRs; DRD4 and SLC6A4), and the NMR. Included data produced a total of 40 active versus placebo comparisons, 16 active versus active comparisons, and 64 between‐genotype comparisons within treatment arms.
For those meta‐analyses showing statistically significant heterogeneity between genotype groups, we found the quality of evidence (GRADE) to be generally moderate. We downgraded quality most often because of imprecision or risk of bias due to potential selection bias in genotyping trial participants.
Comparisons of relative treatment effects by genotype
For six‐month abstinence, we found statistically significant heterogeneity between genotypes (rs16969968) for nicotine replacement therapy (NRT) versus placebo at six months for NHB participants (P = 0.03; n = 2 trials), but not for other biomarkers or treatment comparisons. Six‐month abstinence was increased in the active NRT group as compared to placebo among participants with a GG genotype (risk ratio (RR) 1.47, 95% confidence interval (CI) 1.07 to 2.03), but not in the combined group of participants with a GA or AA genotype (RR 0.43, 95% CI 0.15 to 1.26; ratio of risk ratios (RRR) GG vs GA or AA of 3.51, 95% CI 1.19 to 10.3).
Comparisons of treatment effects between genotype groups within pharmacotherapy randomisation arms
For those receiving active NRT, treatment was more effective in achieving six‐month abstinence among individuals with a slow NMR than among those with a normal NMR among NHW and NHB combined participants (normal NMR vs slow NMR: RR 0.54, 95% CI 0.37 to 0.78; n = 2 trials). We found no such differences in treatment effects between genotypes at six months for any of the other biomarkers among individuals who received pharmacotherapy or placebo.
Authors' conclusions
We did not identify widespread differential treatment effects of pharmacotherapy based on genotype. Some genotype groups within certain ethnic groups may benefit more from NRT or may benefit less from the combination of bupropion with NRT. The reader should interpret these results with caution because none of the statistically significant meta‐analyses included more than two trials per genotype comparison, many confidence intervals were wide, and the quality of this evidence (GRADE) was generally moderate. Although we found evidence of superior NRT efficacy for NMR slow versus normal metabolisers, because of the lack of heterogeneity between NMR groups, we cannot conclude that NRT is more effective for slow metabolisers. Access to additional data from multiple trials is needed, particularly for comparisons of different pharmacotherapies.
PICO
Laienverständliche Zusammenfassung
Haben die Gene von Menschen einen Einfluss darauf, wie wirksam ihnen Medikamente bei der Raucherentwöhnung helfen können?
Hintergrund
Mit dem Rauchen aufzuhören reduziert das Risiko für einen vorzeitigen Tod dramatisch. Trotzdem bleibt die Anzahl an Raucherentwöhnungen gering, sogar mit Hilfe von Behandlungen zur Raucherentwöhnung. Neue Forschungen weisen darauf hin, dass Unterschiede in Teilen unserer Gene, die sogenannten Genotypen, uns möglicherweise dabei helfen könnten herauszufinden, welchen Rauchern am meisten mit bestimmten Behandlungen geholfen werden könnte. Es ist jedoch mehr Forschung notwendig um bestätigen zu können, ob unsere Gene die Wirksamkeit von unterschiedlichen Behandlungen zum Rauchstopp beeinflussen.
Studienmerkmale
Wir suchten nach Studien mit Rauchern, die mit Medikamenten behandelt wurden, um ihnen beim Rauchstopp zu helfen. Wir betrachteten die Gene der Menschen und wie gut ihre Körper Nikotin verarbeiten konnten. Dies könnte helfen, Menschen zu identifizieren, die mit höherer Wahrscheinlichkeit erfolgreich mit dem Rauchen aufhören. Wir fanden 33 Studien, die für unseren Review relevant waren. Außerdem waren wir in der Lage, genug Informationen zu 18 klinischen Studien mit insgesamt über 9000 Rauchern zu erhalten, welche verschiedene Medikamente betrachteten, die Menschen beim Rauchstopp unterstützen sollen.
Hauptergebnisse
Die Ergebnisse zeigen, dass Raucher mit bestimmten Genotypen möglicherweise eher in der Lage sein könnten, durch Nikotinersatz‐Therapien erfolgreich mit dem Rauchen aufzuhören, verglichen mit Rauchern, die diese spezifischen Genotypen nicht besitzen. Raucher, deren Körper Nikotin langsamer verarbeiten, könnten ebenfalls eher von Nikotinersatztherapie profitieren. Wir sahen keine Wirkungen der Gene auf die Wirksamkeit von Medikamenten außer der Nikotinersatz‐Therapie.
Qualität der Evidenz
Diese Ergebnisse sollten vorsichtig interpretiert werden, da die eingeschlossenen Studien die Teilnehmer nicht auf Grundlage von Genotypen oder ihrer Verarbeitungsrate von Nikotin zu den Behandlungen einteilten. Außerdem wurde bei einigen Vergleichen nur eine kleine Anzahl an klinischen Studien eingeschlossen.
Authors' conclusions
Summary of findings
| Active NRT compared with placebo ‐ rs1051730 ‐ non‐Hispanic white for smoking cessationa | ||||||
| Patient or population: people who smoke | ||||||
| Outcomes | Anticipated absolute effects* (95% CI) | Relative effect | No. of participants | Quality of the evidence | Comments | |
| Risk with active NRT ‐ rs1051730 ‐ non‐Hispanic white | Risk with placebo | |||||
| Abstinence at end of treatment | Study population | RR 1.63 | 1391 | ⊕⊕⊕⊝ | Pooled result across studies, including all genotypes. Between‐genotype group heterogeneity P value = 0.004 (see results for individual subgroups in below rows) | |
| 327 per 1000 | 200 per 1000 | |||||
| Abstinence at end of treatment ‐ homozygous major | Study population | RR 1.09 | 582 | ⊕⊕⊝⊝ | For participants with homozygous major genotype, low‐quality evidence suggests no effect. | |
| 286 per 1000 | 263 per 1000 | |||||
| Abstinence at end of treatment ‐ heterozygous | Study population | RR 2.13 | 631 | ⊕⊕⊕⊝ | For participants with heterozygous genotype, moderate‐quality evidence shows effect in favour intervention. | |
| 335 per 1000 | 157 per 1000 | |||||
| Abstinence at end of treatment ‐ homozygous minor | Study population | RR 2.18 | 178 | ⊕⊕⊝⊝ | For participants with homozygous minor genotype, low‐quality evidence shows effect in favour intervention. | |
| 338 per 1000 | 155 per 1000 | |||||
| *The risk in the intervention group (and its 95% confidence interval) is based on the assumed risk in the comparison group and the relative effect of the intervention (and its 95% CI). | ||||||
| GRADE Working Group grades of evidence | ||||||
| aThis is the first of seven 'Summary of findings' tables for the main comparison. For a complete list, see the 'Additional summary of findings' section. bNot downgraded owing to inconsistency, as large statistical heterogeneity can be explained by differences between genotypes. cDowngraded one level owing to risk of bias: high potential for selection bias in GRPG 1993 due to low fraction of genotyped participants. dDowngraded one level owing to imprecision: optimal information size criterion is met, but 95% CIs include the null effect and fail to exclude important benefit or important harm. eDowngraded one level owing to imprecision: optimal information size criterion is not met in this stratum. Counts in this stratum are smaller than in a single adequately powered trial. | ||||||
| Active NRT compared with placebo ‐ rs16969968 ‐ non‐Hispanic white for smoking cessation | ||||||
| Patient or population: people who smoke | ||||||
| Outcomes | Anticipated absolute effects* (95% CI) | Relative effect | No. of participants | Quality of the evidence | Comments | |
| Risk with placebo ‐ rs16969968 ‐ non‐Hispanic white | Risk with active NRT | |||||
| End of treatment | Study population | RR 1.38 | 1127 | ⊕⊕⊕⊝ | Pooled result across studies, including all genotypes. Between‐genotype group heterogeneity P value = 0.03 (see results for individual subgroups in below rows) | |
| 251 per 1000 | 346 per 1000 | |||||
| End of treatment ‐ homozygous major | Study population | RR 1.01 | 449 | ⊕⊕⊝⊝ | For participants with homozygous major genotype, low‐quality evidence suggests no effect. | |
| 333 per 1000 | 337 per 1000 | |||||
| End of treatment ‐ heterozygous | Study population | RR 1.85 | 550 | ⊕⊕⊕⊕ | For participants with heterozygous genotype, high‐quality evidence shows effect in favour of intervention. | |
| 193 per 1000 | 358 per 1000 | |||||
| End of treatment ‐ homozygous minor | Study population | RR 1.80 | 128 | ⊕⊕⊝⊝ | For participants with homozygous minor genotype, low‐quality evidence shows that point estimate favours intervention, but 95% CI crosses null effect. | |
| 233 per 1000 | 420 per 1000 | |||||
| *The risk in the intervention group (and its 95% confidence interval) is based on the assumed risk in the comparison group and the relative effect of the intervention (and its 95% CI). | ||||||
| GRADE Working Group grades of evidence. | ||||||
| aDowngraded one level owing to imprecision: Optimal information size criterion is met, but 95% CIs include the null effect and fail to exclude important benefit or important harm. bNot downgraded owing to inconsistency, as large statistical heterogeneity can be explained by differences in genotypes. cDowngraded one level owing to inconsistency: unexplained heterogeneity. dDowngraded two levels owing to serious imprecision: optimal information size criterion not met, and 95% CIs include the null effect and fail to exclude important benefit or important harm. | ||||||
| Active NRT compared with placebo ‐ rs16969968 ‐ non‐Hispanic black or African American for smoking cessation | ||||||
| Patient or population: people who smoke | ||||||
| Outcomes | Anticipated absolute effects* (95% CI) | Relative effect | No. of participants | Quality of the evidence | Comments | |
| Risk with active NRT ‐ rs16969968 ‐ non‐Hispanic black or African American | Risk with placebo | |||||
| Abstinence at 6 months | Study population | RR 1.11 | 709 | ⊕⊕⊕⊝ | Pooled result across studies, including all genotypes. Between‐genotype group heterogeneity P value = 0.03 (see results for individual subgroups in below rows) | |
| 203 per 1000 | 183 per 1000 | |||||
| Abstinence at 6 months ‐ homozygous major | Study population | RR 1.47 | 637 | ⊕⊕⊕⊕ | For participants with homozygous major genotype, high‐quality evidence shows effect in favour of intervention. | |
| 254 per 1000 | 173 per 1000 | |||||
| Abstinence at 6 months ‐ heterozygous or homozygous minor | Study population | RR 0.43 | 72 | ⊕⊕⊝⊝ | For participants with heterozygous or homozygous minor genotype, point estimate favours control, but 95% CI crosses null effect. | |
| 117 per 1000 | 273 per 1000 | |||||
| Abstinence at end of treatment | Study population | RR 1.03 | 709 | ⊕⊕⊕⊝ | Pooled result across studies, including all genotypes. Between‐genotype group heterogeneity P value = 0.003 (see results for individual subgroups in below rows) | |
| 201 per 1000 | 196 per 1000 | |||||
| Abstinence at end of treatment ‐ homozygous major | Study population | RR 1.57 | 637 | ⊕⊕⊕⊕ | For participants with homozygous major genotype, high‐quality evidence shows effect in favour of intervention. | |
| 276 per 1000 | 176 per 1000 | |||||
| Abstinence at end of treatment ‐ heterozygous or homozygous minor | Study population | RR 0.29 | 72 | ⊕⊕⊕⊝ | For participants with heterozygous or homozygous minor genotype, moderate‐quality evidence shows effect in favour of control. | |
| 105 per 1000 | 364 per 1000 | |||||
| *The risk in the intervention group (and its 95% confidence interval) is based on the assumed risk in the comparison group and the relative effect of the intervention (and its 95% CI). | ||||||
| GRADE Working Group grades of evidence. | ||||||
| aNot downgraded owing to inconsistency, as large statistical heterogeneity can be explained by differences in genotypes. bDowngraded one level owing to imprecision: Optimal information size criterion is met, but 95% CIs include the null effect and fail to exclude important benefit or important harm. cDowngraded two levels owing to serious imprecision: optimal information size criterion not met, but 95% CIs include the null effect and fail to exclude important benefit or important harm. dDowngraded one level owing to imprecision: low number of events; optimal information size criterion not met. | ||||||
| Active NRT compared with placebo ‐ rs 588765 ‐ non‐Hispanic white for smoking cessation | ||||||
| Patient or population: people who smoke | ||||||
| Outcomes | Anticipated absolute effects* (95% CI) | Relative effect | No. of participants | Quality of the evidence | Comments | |
| Risk with placebo ‐ rs 588765 ‐ non‐Hispanic white | Risk with active NRT | |||||
| End of treatment | Study population | RR 1.33 | 923 | ⊕⊕⊕⊝ | Pooled result across studies, including all genotypes. Between‐genotype group heterogeneity P value = 0.92 (see results for individual subgroups in below rows) | |
| 211 per 1000 | 281 per 1000 | |||||
| End of treatment ‐ homozygous major | Study population | RR 1.39 | 296 | ⊕⊕⊝⊝ | For participants with homozygous major genotype, low‐quality evidence suggests that point estimate favours intervention, but 95% CI crosses null effect. | |
| 208 per 1000 | 288 per 1000 | |||||
| End of treatment ‐ heterozygous | Study population | RR 1.27 | 469 | ⊕⊕⊝⊝ | For participants with heterozygous genotype, point estimate favours intervention, but 95% CI crosses null effect. | |
| 208 per 1000 | 265 per 1000 | |||||
| End of treatment ‐ homozygous minor | Study population | RR 1.50 | 158 | ⊕⊕⊝⊝ | For participants with homozygous minor genotype, low‐quality evidence suggests that point estimate favours intervention, but 95% CI crosses null effect. | |
| 226 per 1000 | 339 per 1000 | |||||
| *The risk in the intervention group (and its 95% confidence interval) is based on the assumed risk in the comparison group and the relative effect of the intervention (and its 95% CI). | ||||||
| GRADE Working Group grades of evidence. | ||||||
| aDowngraded one level owing to imprecision: low number of events; optimal information size criterion not met. bDowngraded two levels owing to serious imprecision: optimal information size criterion not met, but 95% CIs include the null effect and fail to exclude important benefit or important harm. | ||||||
| Active NRT compared with placebo ‐ rs2036527 ‐ non‐Hispanic black or African American for smoking cessation | ||||||
| Patient or population: people who smoke | ||||||
| Outcomes | Anticipated absolute effects* (95% CI) | Relative effect | No. of participants | Quality of the evidence | Comments | |
| Risk with placebo ‐ rs2036527 ‐ non‐Hispanic black or African American | Risk with active NRT | |||||
| 6‐Month abstinence | Study population | RR 1.18 | 708 | ⊕⊕⊝⊝ | Pooled result across studies, including all genotypes. Between‐genotype group heterogeneity P value = 0.19 (see results for individual subgroups in below rows) | |
| 177 per 1000 | 208 per 1000 | |||||
| 6‐Month abstinence ‐ homozygous major | Study population | RR 1.95 | 425 | ⊕⊝⊝⊝ | For participants with homozygous major genotype, very low‐quality evidence suggests that point estimate favours intervention, but 95% CI crosses null effect. | |
| 171 per 1000 | 333 per 1000 | |||||
| 6‐Month abstinence ‐ heterozygous or homozygous minor | Study population | RR 0.90 | 283 | ⊕⊕⊕⊝ | For participants with heterozygous or homozygous minor genotype, moderate‐quality evidence shows no effect. | |
| 185 per 1000 | 167 per 1000 | |||||
| End of treatment | Study population | RR 1.22 | 708 | ⊕⊕⊝⊝ | Pooled results across studies, including all genotypes. Between‐genotype group heterogeneity P value = 0.19 (see results for individual subgroups in below rows) | |
| 199 per 1000 | 242 per 1000 | |||||
| End of treatment ‐ homozygous major | Study population | RR 2.39 | 425 | ⊕⊕⊝⊝ | For participants with homozygous major genotype, low‐quality evidence suggests that point estimate favours intervention, but 95% CI crosses null effect. | |
| 197 per 1000 | 471 per 1000 | |||||
| End of treatment ‐ heterozygous or homozygous minor | Study population | RR 0.89 | 283 | ⊕⊕⊕⊝ | For participants with heterozygous or homozygous minor genotype, moderate‐quality evidence shows no effect. | |
| 202 per 1000 | 179 per 1000 | |||||
| *The risk in the intervention group (and its 95% confidence interval) is based on the assumed risk in the comparison group and the relative effect of the intervention (and its 95% CI). | ||||||
| GRADE Working Group grades of evidence. | ||||||
| cDowngraded one level owing to imprecision: low number of events; optimal information size criterion not met. | ||||||
| Active NRT compared with placebo ‐ DRD4 (exon 3 48 bp) ‐ non‐Hispanic white for smoking cessation | ||||||
| Patient or population: people who smoke | ||||||
| Outcomes | Anticipated absolute effects* (95% CI) | Relative effect | No. of participants | Quality of the evidence | Comments | |
| Risk with placebo ‐ DRD4 (exon 3 48 bp) ‐ non‐Hispanic white | Risk with active NRT | |||||
| 6‐Month abstinence | Study population | RR 1.44 | 900 | ⊕⊕⊝⊝ | Pooled result across studies, including all genotypes. Between‐genotype group heterogeneity P value = 0.85 (see results for individual subgroups in below rows) | |
| 141 per 1000 | 203 per 1000 | |||||
| 6‐month abstinence ‐ homozygous major | Study population | RR 1.34 | 566 | ⊕⊝⊝⊝ | For participants with homozygous major genotype, very low‐quality evidence suggests that point estimate favours intervention, but 95% CI crosses null effect. | |
| 155 per 1000 | 207 per 1000 | |||||
| 6‐Month abstinence ‐ heterozygous | Study population | RR 1.76 | 290 | ⊕⊕⊝⊝ | For participants with heterozygous genotype, low‐quality evidence suggests effect in favour of intervention. | |
| 113 per 1000 | 198 per 1000 | |||||
| 6‐Month abstinence ‐ homozygous minor | Study population | RR 1.28 | 44 | ⊕⊝⊝⊝ | For participants with homozygous minor genotype, very low‐quality evidence suggests that point estimate favours intervention, but 95% CI crosses null effect. | |
| 167 per 1000 | 213 per 1000 | |||||
| End of treatment | Study population | RR 1.20 | 900 | ⊕⊕⊝⊝ | Pooled result across studies, including all genotypes. Between‐genotype group heterogeneity P value = 0.78 (see results for individual subgroups in below rows) | |
| 271 per 1000 | 325 per 1000 | |||||
| End of treatment ‐ homozygous major | Study population | RR 1.22 | 566 | ⊕⊝⊝⊝ | For participants with homozygous major genotype, very low‐quality evidence suggests that point estimate favours intervention, but 95% CI crosses null effect. | |
| 273 per 1000 | 334 per 1000 | |||||
| End of treatment ‐ heterozygous | Study population | RR 1.40 | 290 | ⊕⊝⊝⊝ | For participants with heterozygous genotype, very low‐quality evidence suggests that point estimate favours intervention, but 95% CI crosses null effect. | |
| 258 per 1000 | 362 per 1000 | |||||
| End of treatment ‐ homozygous minor | Study population | RR 1.02 | 44 | ⊕⊕⊝⊝ | For participants with homozygous minor genotype, low‐quality evidence suggests no effect. | |
| 333 per 1000 | 340 per 1000 | |||||
| *The risk in the intervention group (and its 95% confidence interval) is based on the assumed risk in the comparison group and the relative effect of the intervention (and its 95% CI). | ||||||
| GRADE Working Group grades of evidence. | ||||||
| aDowngraded one level owing to high risk of bias: high risk of selection bias in GRPG 1993 due to low fraction of genotyped participants. bDowngraded one level owing to imprecision: low number of events; optimal information size criterion not met. cDowngraded one level owing to imprecision: 95% CIs include the null effect and fail to exclude important benefit or important harm. | ||||||
| Active NRT compared with placebo ‐ NMR ‐ non‐Hispanic black and white for smoking cessation | ||||||
| Patient or population: people who smoke | ||||||
| Outcomes | Anticipated absolute effects* (95% CI) | Relative effect | No. of participants | Quality of the evidence | Comments | |
| Risk with placebo ‐ NMR ‐ non‐Hispanic black and white | Risk with active NRT | |||||
| 6‐Month abstinence | Study population | RR 1.51 | 1417 | ⊕⊕⊕⊝ | Pooled result across studies, including all genotypes. Between‐genotype group heterogeneity: P value = 0.29 (see results for individual subgroups in below rows) | |
| 99 per 1000 | 149 per 1000 | |||||
| 6‐Month abstinence ‐ slow NMR | Study population | RR 1.82 | 628 | ⊕⊕⊕⊝ | For participants with slow NMR genotype, moderate‐quality evidence favours intervention. | |
| 116 per 1000 | 211 per 1000 | |||||
| 6‐Month abstinence ‐ normal NMR | Study population | RR 1.21 | 789 | ⊕⊕⊝⊝ | For participants with normal NMR genotype, point estimate favours intervention, but 95% CI crosses null effect. | |
| 85 per 1000 | 103 per 1000 | |||||
| End of treatment | Study population | RR 1.51 | 1417 | ⊕⊕⊕⊝ | Pooled result across studies, including all genotypes. Between‐genotype group heterogeneity: P value = 0.52 (see results for individual subgroups in below rows) | |
| 136 per 1000 | 205 per 1000 | |||||
| End of treatment ‐ slow NMR | Study population | RR 1.61 | 847 | ⊕⊕⊕⊝ | For participants with slow NMR genotype, moderate‐quality evidence favours intervention. | |
| 127 per 1000 | 204 per 1000 | |||||
| End of treatment ‐ normal NMR | Study population | RR 1.49 | 570 | ⊕⊕⊝⊝ | For participants with normal NMR genotype, point estimate favours intervention, but 95% CI crosses null effect. | |
| 149 per 1000 | 222 per 1000 | |||||
| *The risk in the intervention group (and its 95% confidence interval) is based on the assumed risk in the comparison group and the relative effect of the intervention (and its 95% CI). | ||||||
| GRADE Working Group grades of evidence. | ||||||
| aDowngraded one level owing to risk of bias: 755/1532 (49%) participants from Patch Trial (GPRG 1993) were genotyped, which could contribute to selection bias. bDowngraded one level owing to imprecision: optimal information size criterion is met, but 95% CIs include the null effect and fail to exclude important benefit or important harm. | ||||||
Background
Table 1 presents a glossary of genetic terms.
| Genetic term | Explanation |
| Single‐nucleotide polymorphism (SNP) | A single base pair change in the DNA sequence at a particular point compared with the “common” or “wild‐type” sequence (Attia 2009) Most common form of genetic variation in the genome, in which a single‐base substitution has created 2 forms of a DNA sequence that differ by a single nucleotide (Pearson 2008) |
| Alleles | Alternate forms of a gene or chromosomal locus that differ in DNA sequence (Pearson 2008) |
| Genome‐wide association study (GWAS) | Any study of genetic variation across the entire human genome designed to identify genetic association with observable traits or the presence or absence of a disease, usually referring to studies with genetic marker density of 100,000 or more to represent a large proportion of variation in the human genome (Pearson 2008) |
| Genotype | The genetic constitution of an individual, either overall or at a specific gene (Attia 2009) |
| Hardy‐Weinberg equilibrium (HWE) | Population distribution of 2 alleles (with frequencies p and q) such that the distribution is stable from generation to generation and genotypes occur at frequencies of p2, 2pq, and q2 for the major allele homozygote, heterozygote, and minor allele homozygote, respectively (Pearson 2008) |
| Linkage disequilibrium | Measure of association between 2 alleles located near each other on a chromosome, such that they are inherited together more frequently than would be expected by chance (Pearson 2008) |
| Loci | The site(s) on a chromosome at which the gene for a particular trait is located on a gene at which a particular SNP is located (Attia 2009) |
| Minor allele | The allele of a biallelic polymorphism that is less frequent in the study population (Pearson 2008) |
| Major allele | The allele of a biallelic polymorphism that is more frequent in the study population (Pearson 2008) |
| Pharmacogenetics | The field of studying the genetic basis of drug response and applying this knowledge to clinical practice by guiding drug prescribing |
| Pharmacogenomics | Similar to pharmacogenetics but uses information across the whole genome |
| Population stratification | A form of confounding in genetic association studies caused by genetic differences between cases and controls unrelated to disease but due to sampling from populations of different ancestries (Pearson 2008) |
| Wild‐type allele | The allele at a particular single‐nucleotide polymorphism (SNP) that is most frequent in a population, also called “common” allele (Attia 2009) |
DNA = deoxyribonucleic acid; SNP = Single‐nucleotide polymorphism; GWAS = Genome‐wide association study; HWE = Hardy‐Weinberg equilibrium
Description of the condition
Tobacco smoking continues to be the leading cause of preventable death in the world, and yet the most efficacious behavioural and pharmacological treatments are ineffective for most treatment‐seeking smokers (Cahill 2012; Giovino 2012; Hughes 2014; Stead 2012a; Stead 2012b). Although social and other environmental determinants are major contributors to tobacco use, twin and family studies over decades have confirmed that genetic factors contribute substantially to smoking behavior and to disease that can be attributed to smoking (Bidwell 2016; Broms 2006; Carmelli 1992; Fisher 1958; Heath 2002; Li 2003; McCaffery 2008; True 1997; Xian 2008).
Given the low cessation success rate of the most efficacious smoking cessation treatments and the observation of substantial heritability for tobacco dependence, investigators have explored the association between polymorphisms among genes involved in tobacco dependence and genes for smoking cessation drug targets (many of which overlap), to better identify individuals who are more or less likely to successfully quit and abstain from smoking in response to specific medications (Mamoun 2015). It has been postulated that hundreds of genes contribute and may interact with each other and with the environment (e.g. via epigenetic processes) to affect the many dimensions of tobacco dependence through altered neuro‐adaptations, metabolism, and conditioned behaviour (Agrawal 2012; Sullivan 2004). Genomic analyses have the potential to improve the efficacy of smoking cessation treatment if meta‐analyses can identify polymorphisms associated with response to a given pharmacotherapy, and if this is followed by validation of the finding in independent clinical trials and treatment cohorts.
In this review, we used the term ’genomic’ to describe both single‐gene (traditionally described as ’genetic’) and whole‐genome (’genomic’) analyses. We did this because translational research will continue to test more genetic loci of interest; genome‐wide analyses of clinical trials will be performed eventually; and future reviews of more and more complex genetic data are better described as genomic or pharmacogenomic analyses. Our review assesses heterogeneity in treatment effects across genotype groups or nicotine metabolite ratio (NMR) status, and heterogeneity in treatment effects by genotype group or NMR status within treatment arms. These analyses are motivated by specific hypotheses that are pharmacogenomic (i.e. based on which genetic loci in the genome have the greatest effect on nicotine dependence) or pharmacometabolomic (i.e. based on the metabolite ratio of two stable nicotine metabolites that represent the nicotine metabolism rate of the enzyme with the greatest contribution to nicotine metabolism among all protein‐coding genes) in nature.
Description of the intervention
The US Food and Drug Administration (FDA) has approved pharmacotherapies as aids to smoking cessation including five forms of nicotine replacement therapy (NRT), bupropion SR (Zyban), and varenicline (Chantix). NRT forms include gum, lozenge, transdermal patch, nasal spray, and oral inhaler (numerous brands, over‐the‐counter) (Pharmacologic Product Guide). Different NRT therapies offer distinct benefits and limitations with regard to mode of administration and ease of titration; bupropion and varenicline offer alternative mechanisms of action to those offered by NRT, and varenicline offers greater efficacy than NRT monotherapy (Cahill 2013). Pharmacotherapies not approved by the FDA for use in smoking cessation as monotherapy or combination therapy include adrenergics, monoamine oxidase (MAO) inhibitors, selective serotonin reuptake inhibitors (SSRIs), and serotonin–norepinephrine reuptake inhibitors (SNRIs), as well as other drugs and preparations.
Meta‐analyses of the primary literature have identified significant effects of monotherapy and combination therapy versus control therapy on abstinence at six‐month follow‐up (Cochrane Tobacco Addiction Group). In a sample of 117 clinical trials of NRT versus placebo or non‐NRT control, data show a risk ratio (RR) of 1.60‐fold (95% confidence interval (CI) 1.53 to 1.68) (Stead 2012a); in a sample of trials of the antidepressant bupropion (44 trials) or nortriptyline (six trials) versus placebo, or of bupropion versus nortriptyline (three trials), results include significant RRs of 1.62 (95% CI 1.49 to 1.76) and 2.03 (95% CI 1.48 to 2.78) (Hughes 2014); and in a sample of trials comparing the cholinergic partial agonists varenicline (at standard dosage; 27 trials) and cytisine (two trials) versus placebo, investigators reported significant RRs of 2.24 (95% CI 2.06 to 2.43) and 3.98 (95% CI 2.01 to 7.87) (Cahill 2016). Multiple additional meta‐analytical comparisons provide evidence suggesting that varenicline is more effective than bupropion or NRT monotherapy (Mills 2012).
How the intervention might work
Research on the molecular genetics of smoking has pointed to at least two biologically plausible genetic loci contributing to nicotine dependence, cigarette consumption, and smoking cessation. The α5‐α3‐β4 nicotinic acetylcholine receptor gene cluster on chromosome 15q25.1 (CHRNA5‐CHRNA3‐CHRNB4) has been associated with cigarettes smoked per day in genome‐wide association studies; with lung cancer and chronic obstructive pulmonary disease; and with smoking cessation in retrospective pharmacogenetic analyses of clinical trials (Bergen 2013; Chen 2012; Chen 2014; David 2012; King 2012; Liu 2010; Munafò 2011; Saccone 2010; Thorgeirsson 2008; Thorgeirsson 2010; Tobacco and Genetics Consortium 2010; Zhu 2014). The cytochrome p450 2A6 enzyme inactivates approximately 80% of nicotine to cotinine and other metabolites through oxidative hepatic metabolism; extensive functional variation influencing the speed of nicotine metabolism is found at CYP2A6 (Benowitz 2006; Benowitz 2009; McDonagh 2012; Murphy 2014). The NMR 3‐hydroxycotinine/cotinine has been associated with cigarettes smoked per day, lung and other aerodigestive cancers, and smoking cessation (Bloom 2012; Canova 2009; Chen 2014; Dempsey 2004; Fujieda 2004; Gemignani 2007; Ho 2009; Lerman 2006; Lerman 2010; Liu 2011; Patterson 2008; Rotunno 2009; Schnoll 2009; Schnoll 2010; Schoedel 2004; Tamaki 2011; Thorgeirsson 2010; Tobacco and Genetics Consortium 2010; Topcu 2002). Variation in the CHRNA3‐A5‐B4 genetic locus is associated with functional changes in key nicotinic acetylcholine receptors in the brain, which in turn are related to behaviour (i.e. nicotine self‐administration and smoking quantity) (Fowler 2011; Scherf 2012; Ware 2012). Variation in the CYP2A6 genetic locus affects the rate of nicotine metabolism and is associated with smoking quantity (McDonagh 2012). Therefore, biologic plausibility underlies the relationship between these genetic loci and smoking‐related behaviour. Consistent with preclinical studies of nicotine reinforcement and conditioned place preference, genes in the dopamine pathway have been linked to smoking cessation (Balfour 2009; Herman 2014; Leventhal 2014; Tobacco and Genetics Consortium 2010). Many other candidate genes and pathways have been explored for association with smoking cessation in relation to the pharmacology of nicotine and tobacco dependence treatment. Bupropion and to a lesser degree nicotine are metabolised by cytochrome 2B6, which converts bupropion to the more pharmacologically active hydroxybupropion, which in turn has been associated with smoking cessation (Benowitz 2013; Zhu 2012). A low‐affinity organic cation transporter gene (SLC22A2) has been associated with varenicline adverse effects and with abstinence outcomes in individuals randomised to NRT or varenicline (Bergen 2014; King 2012). Both the endogenous opioid system and serotonin neuronal pathways are implicated in some dimensions of nicotine dependence, and polymorphisms in mu‐opioid receptor 1 (OPRM1) and serotonin 5‐HT3 receptor (HTR3B) genes, respectively, have been linked to response to smoking cessation drugs; however, results have been inconclusive and mixed or without consistent replication for a variety of polymorphisms across both neurotransmitter systems (Balfour 2009; David 2008; Hadjiconstantinou 2011; King 2012; Marteau 2012; Munafò 2007; Munafò 2013a; Quaak 2012; Ray 2007; Verhagen 2012; Wang 2010).
Current clinical practice guidelines recommend clinician assessment of every patient's smoking behaviour, which is followed by advice to quit, assessment of willingness to quit, assistance in quitting, and arranging follow‐up support (5 As) (European Smoking Cessation Guidelines 2012; Fiore 2008; West 2000). Clinical practice guidelines describe in detail aspects of patients, clinicians, clinician engagement, behavioural therapy, and pharmacotherapy that contribute towards abstinence (European Smoking Cessation Guidelines 2012; Fiore 2008; West 2000). Both behavioural therapies and pharmacotherapies are effective aids for patient smoking cessation ‐ therapies combining behavioural therapy and pharmacotherapy are recommended for greatest therapeutic efficacy (Patnode 2015). An intervention that addresses pharmacotherapeutic efficacy by genotype or by metabolic activity offers the prospect of improving therapeutic effectiveness beyond the minority of individuals who remain abstinent at 24 weeks with combination therapies delivered by a clinician (European Smoking Cessation Guidelines 2012; Fiore 2008; Kotz 2014; West 2000). A genotype‐based, or metabolism‐based, pharmacogenomic assay and associated intervention for smoking cessation might be developed if robust evidence for improved efficacy were to be developed through the established pathway of discovery and translation to clinical practice via retrospective and prospective tests of clinical data, analytical validity, clinical validity, and clinical utility. This review uses data from retrospective analyses of abstinence differences by genotype or metabolism subgroup in nearly all cases (one trial contributed data from a prospective stratification by metabolism); thus analyses of these data do not provide clinical guidance for pharmacogenomic testing and treatment selection. However, they do describe the scope of available data in terms of sample sizes, clinical treatments, and selected available genomic data. An intervention would be expected to be available as a pharmacogenomic test that the physician can order; results of the pharmacogenomic assay with clinical treatment recommendations based on prior clinical validity and utility analyses would be available to assist the physician in treating individuals for tobacco dependence.
Why it is important to do this review
Smoking cessation clinical trials have provided a growing body of genotype‐based subgroup analyses, but replication is rare, and there have been no comprehensive systematic reviews with meta‐analyses. This review evaluated the effectiveness of pharmacotherapy for smoking cessation in subgroups of treatment‐seeking smokers defined by genotype for genome‐wide significant single‐nucleotide polymorphisms (SNPs), replicated non‐SNP polymorphisms, and/or the NMR. Pharmacotherapies discussed in this review include medications approved to treat symptoms of withdrawal, craving, or other behavioural symptoms that affect the ability of the individual to stop smoking and to remain abstinent; these include all forms of NRT (e.g. patch, gum, lozenge, inhaler, spray) and non‐nicotine pharmacotherapies (e.g. bupropion, varenicline, cytisine, nortriptyline). Identifying whether clinically important differences in treatment response between genomically defined groups are likely is an essential first step in moving the field closer to personalised treatments guided by genomic testing.
Objectives
To assess whether quit rates vary by genetically informed biomarkers within pharmacotherapy treatment arms and as compared with placebo. To assess the effects of pharmacotherapies for smoking cessation in subgroups of smokers defined by genotype for identified genome‐wide significant polymorphisms.
Methods
Criteria for considering studies for this review
Types of studies
All published and unpublished primary and secondary analyses of randomised and quasi‐randomised controlled trials (RCTs) in which smoking cessation pharmacotherapies were initiated to enhance abstinence from smoking, and in which trial participants were genotyped for polymorphisms that are genome‐wide significant (alpha threshold < 5 × 10‐8) SNPs for cigarettes per day, nicotine dependence, or smoking cessation, as well as non‐SNP polymorphisms that were not included in genome‐wide association studies but have been associated with smoking cessation treatment response in at least two trials; or the NMR, which is highly influenced by the cytochrome p450 2A6 (CYP2A6) gene, hereafter collectively described as biomarkers (Chenoweth 2017; David 2012;Saccone 2010;Thorgeirsson 2008;Thorgeirsson 2010;Tobacco and Genetics Consortium 2010). Table 2 presents the polymorphisms of interest and NMR, which two review authors (AWB and SPD) identified via literature review. The comparator could be placebo, or usual/standard care, or a different pharmacotherapy, or a non‐pharmacotherapy intervention, or a no‐intervention control. We also considered trials comparing different doses or durations or regimens of pharmacotherapy, or comparing different formats of NRT, or comparing combinations of pharmacotherapy versus a single type, or comparing different types or intensities of behavioural support as adjuncts to pharmacotherapy. We applied no language or date restrictions. For inclusion of a study in the review, at least one other trial had to provide genetic or NMR data for the same type of smoking cessation medication (e.g. if we found only one genotyped venlafaxine or one genotyped nortriptyline trial, we did not perform meta‐analysis).
| Polymorphism | Race group | ||||
| Gene/Region | SNP or VNTRa | Whiteb | Black or African Americanc | East Asiand | Mexicane |
| CHRNA3 | rs1051730 | G/A | G/A | G/A | G/A |
| CHRNA5 | rs16969968 | G/A | G/A | G/A | G/A |
| CHRNA5 | rs588765 | C/T | C/T | C/T | C/T |
| CHRNA5 | rs2036527 | G/A | G/A | G/A | G/A |
| CHRNB3 | rs13280604 | A/G | G/A | A/G | A/G |
| CYP2A6 | rs4105144 | T/C | T/C | T/C | T/C |
| CYP2B6 | rs6474412 | T/C | C/T | T/C | T/C |
| DBH | rs3025343 | G/A | G/A | G/A | G/A |
| DRD4 (exon 3 48 bp) | SI000224I | 4 (0.65), 7 (0.18), 3, 2 | 4 (0.75), 7 (0.14), 6, 5 | 4 (0.79), 2 (0.17), 5 | 7 (0.52), 4 (0.41), 2 |
| EGLN2 | rs3733829 | A/G | A/G | A/G | G/A |
| EGLN2 | rs7937 | T/C | C/T | T/C | T/C |
| LOC100188947 | rs1329650 | G/T | G/T | T/G | G/T |
| LOC100188947 | rs1028936 | A/C | A/C | C/A | A/C |
| PDE1C | rs215605 | T/G | G/T | G/T | T/G |
| SLC6A3 (3' 40 bp) | SI000156M | 10 (0.69), 9 (0.31) | 10 (0.73), 9 (0.21), 3, 8 | 10 (0.91), 9 | 10 (0.74), 9 (0.24) |
| SLC6A4 (Promoter) | SI664268Gf | L (0.62), S (0.38) | L (0.78), S (0.07), 19 (0.15) | L (0.27), S (0.71) | L (0.42), S (0.58) |
| aSNP rsID and frequencies from the 1000 Genomes Project database (http://analysistools.nci.nih.gov/LDlink/), VNTR UID and frequencies from ALFRED (http://alfred.med.yale.edu/alfred/index.asp). | |||||
| bGBR or European (PopID = 20, SampID = 20C). | |||||
| cASW or per VNTR (DRD4, Biaka (PopID = 5, SampID = 5F); SLC6A3, African American (PopID = 98R, SampID = 101C); SLC6A4, Biaka. | |||||
| dCHB + JPT, or mean of Han and Japanese, for SLC6A3 and SLC6A4, Han (SampID = 9J) and Japanese (SampID = 10B). | |||||
| eMXL or per VNTR (DRD4, see Table 2, Aguirre‐Samudio 2014; SLC6A3, Hispanic American from ALFRED; SLC6A4, see Table 2, Peralta‐Leal 2012). | |||||
| fFor Euro, African American and East Asian, extracted from Promoter VNTR + rs25531 Table in ALFRED. L = 16 repeats, S = 14 repeats. | |||||
SNP = Single‐nucleotide polymorphism; VNTR = variable number tandem repeat; G = nucleobase guanine; A = nucleobase adenine; C = nucleobase cytosine; T = nucleobase thymine; rsID=reference SNP cluster ID; UID=Unique Identifier, from ALFRED; GBR=British in England and Scotland population description code from 1000 Genomes Project; PopID=Population ID from ALFRED; SampID=Sample ID from ALFRED; ASW=Americans of African Ancestry in SW USA population description code, from 1000 Genomes Project; CHB=Han Chinese in Bejing, China population description code, from 1000 Genomes Project; JPT=Japanese in Tokyo, Japan population description code, from 1000 Genomes Project; Han=Han Chinese living in the San Francisco, California, from ALFRED; MXL=Mexican Ancestry from Los Angeles USA population description code, from 1000 Genomes Project; L=Long (16 repeats); S=Short (14 repeats)
Types of participants
Adult men and women who smoke, regardless of the setting from which they were recruited and/or their initial level of nicotine dependence. Participants could be of any ethnicity, but we analysed outcomes within different ethnic subgroups separately. We did not anticipate a sufficient number of genomic pharmacotherapy studies of minors (aged under 18 years) for inclusion in meta‐analyses.
Types of interventions
Smoking cessation pharmacotherapy, which included all forms of NRT (e.g. patch, gum, lozenge, inhaler, spray) and non‐nicotine pharmacotherapies (e.g. bupropion, varenicline, cytisine, nortriptyline).
Types of outcome measures
Primary outcomes
-
Smoking abstinence at six months from the start of treatment.
Secondary outcomes
-
Smoking abstinence at end of treatment defined as abstinence between 7 and 12 weeks after the start of treatment.
We did not collect information about adverse events reported in included trials, because we expected the occurrence of such events to be low, making power for analysis according to genotype insufficient.
Search methods for identification of studies
Electronic searches
On 16 August 2016, we searched the Cochrane Tobacco Addiction Group specialised register for trials of pharmacotherapies for smoking cessation, using the term 'genetic’, 'genomic’, 'pharmacogenetic’, or 'pharmacogenomic’ in the title, abstract, or keywords to identify relevant records. This register contains trials identified from:
-
MEDLINE.
-
Embase.
-
PsycINFO.
-
Reference lists of previous trials and overviews.
See details of search strategies applied for these databases in the Tobacco Addiction Group module.
Additionally, we searched international online clinical trial registers for ongoing and recently completed trials, including the WHO portal; the UK clinical trials gateway; the US clinical trials register; and the Australian and New Zealand clinical trials register.
In addition to the databases mentioned above, we searched genetics databases, including Pharmacogenomics Knowledgebase (PharmGKB) and Pharmacogenomics of Nicotine Addiction Treatment (PNAT). We considered additional searches of National Institutes of Health (NIH) databases, but at the time of this review, smoking cessation clinical trial data were not yet available on Genotypes and Phenotypes (dbGaP), a database developed to archive and distribute data and results from studies that have investigated the interaction of genotype and phenotype in humans.
Searching other resources
We checked the reference lists of published papers and consulted with experts in the field to identify any relevant forthcoming or unpublished research, or both. We contacted the authors of ongoing studies when necessary.
Data collection and analysis
Selection of studies
Two review authors (AWB and SPD) and Ms. Lindsey Stead (Cochrane Tobacco Addiction Group, Oxford) conducted database searches and performed initial screening of abstracts and manuscripts. Two review authors (ES and SPD) independently checked the abstracts and, if relevant, retrieved and reviewed the full texts of records for data. We observed that most of the studies eligible for inclusion were secondary analyses of pharmacotherapy trials. For each eligible study, we identified the primary trial report for long‐term cessation outcomes.
If a given genome‐wide significant SNP or non‐SNP polymorphism was not reported in an RCT that reported other genotyping data, we contacted study authors to request these data from unpublished genotyping data.
Data extraction and management
Four review authors (ES, OAP, AWB, and SPD) curated records for extraction of study characteristics of primary trials. We assessed each trial in duplicate. Review authors resolved disagreements by consensus, or by recourse to a third review author, who was not assigned to that particular trial. We recorded the following information in the Characteristics of included studies tables.
-
Methods: study design, study name (if applicable), study recruitment period.
-
Participants: number of participants in original trial, study recruitment procedure, country, number of study centres, study setting, inclusion and exclusion criteria.
-
Interventions: description of intervention(s) (treatment, dosage, regimen, behavioural support), description of control (treatment, dosage, regimen, behavioural support), number of participants in each treatment arm.
-
Outcomes: primary outcome and secondary outcomes of trials.
-
Funding source.
-
Declaration of interest.
-
Notes: information on genomic analyses: whether they were performed within the RCT or as secondary analysis, and the number of participants successfully genotyped.
Outcome data
We contacted trial authors and asked them to supply genotype counts by outcome, by pharmacotherapy arm, and by self‐identified race/ethnicity for participants in their study for (a) a group (N = 13) of single‐nucleotide polymorphisms (SNPs) with reported genome‐wide significance with smoking cessation, cigarettes per day, or nicotine dependence in genome‐wide association study (GWAS) investigations; (b) three variable numbers of tandem repeat polymorphisms (VNTRs); or (c) NMR data (David 2012; Thorgeirsson 2010; Tobacco and Genetics Consortium 2010). Table 2 provides an overview of all genetic polymorphisms and major and minor alleles stratified by race group. We asked trial authors to complete at least two predesigned data extraction forms ‐ one on the numbers of participants of different race/ethnicity groups included in the trial, and another on abstinence rates for each polymorphism, stratified by outcome, treatment arm, race/ethnicity, and genotype. Some identified papers presented data from multiple studies (e.g. from a meta‐analysis) (Bergen 2013). From the author of these combined analyses, we requested study level data so we could assess and account for differences across studies in the statistical analysis. We collected genotype information for a given polymorphism in a trichotomised fashion (homozygous major (M/M); heterozygous (M/m); homozygous minor (m/m) alleles), and we gathered NMR information in a dichotomised fashion (normal (NMR ≥ 0.31) vs slow (NMR < 0.31) metabolisers). For calculation of abstinence rates, we collected the number of participants who were abstinent at the time point of interest (i.e. at 6 months or at end of treatment) and the total number randomised in that subgroup.
We contacted trial authors twice. When they did not respond to our request, we tried to extract requested data from published reports. If trial authors supplied or if the paper reported genotype data in a dichotomised fashion (i.e. M/M vs M/m + m/m), we used this information to perform analysis in a similar fashion.
Assessment of risk of bias in included studies
Four review authors (ES, OAP, AWB, and SPD) independently assessed included studies for risks of selection bias (randomised sequence generation, allocation concealment), performance and detection bias (presence or absence of blinding), attrition bias (levels and reporting of loss to follow‐up), and any other threats to study quality, as recommended in Chapter 8 of the Cochrane Handbook for Systematic Reviews of Interventions (Higgins 2011). We assessed each trial in duplicate. We also assessed trials for other sources of bias specific to genotype studies: genotype frequencies for each study and polymorphism; potential deviation from Hardy‐Weinberg equilibrium; source of DNA (e.g. buccal swab, blood, saliva); genotyping protocol; and any quality control (QC) methods described. Review authors resolved disagreements by consensus, or by recourse to a third review author, who was not assigned to that particular trial.
Measures of treatment effect
We calculated the cessation rate as the number of people abstinent at six monthsand at end of treatment, based on point prevalence abstinence (preferably biochemically verified but otherwise self‐reported), divided by the total number of participants in that subgroup, separately in each genotype/treatment subgroup. We assessed treatment effects by meta‐analysing active versus placebo effects on abstinence separately in M/M, M/m. and m/m genotype strata; we then generated separate RRs and 95% CIs for active versus placebo for each genotype stratum for each biomarker. Afterwards, we assessed heterogeneity in treatment effect across genotype strata.
For analyses in which we found statistically significant heterogeneity in treatment effects across genotype subgroups, we estimated the difference in treatment effects in M/M versus m/m and in M/m versus m/m to capture the interaction effects of genotype x treatment. Because estimates of treatment effects were expressed in the log‐scale (i.e. logRR), we expressed the genotype x treatment interaction as the ratio of risk ratios (RRR) for treatment effect in one genotype group over treatment effect in the other genotype group. An RRR > 1 means that the treatment effect is greater in individuals with the M/M versus non‐M/M genotype.
Initially, we planned to address the potential effect of methodological heterogeneity in behavioural interventions across studies for those analyses in which we found statistically significant heterogeneity in treatment effects across genotype subgroups. However, because the number of included studies in these analyses was small, we deemed that such analysis was not reliable.
Dealing with missing data
We contacted investigators or study sponsors to verify key study characteristics and to obtain missing numerical outcome data when possible (e.g. when a study was reported as abstract only). In cases for which we received individual participant data, we treated participants lost to follow‐up as continuing smokers, which yields conservative absolute quit rates and makes little difference to the risk ratio unless dropout rates differ substantially between groups. For aggregate data, we relied on the decision of investigators of the primary trial, which conventionally reports smokers who are lost to follow‐up as smoking, in keeping with intention‐to‐treat analyses.
We noted in the ’Risk of bias’ tables whether results showed high or differential loss to follow‐up between treatment groups.
Assessment of heterogeneity
We evaluated levels of clinical heterogeneity between included studies to decide whether it would be appropriate to pool data in planned subgroups. We analysed different pharmacotherapies separately but pooled studies using different types of NRT.
We assessed statistical heterogeneity in each meta‐analysis using T², I², and Chi² statistics (Higgins 2003). We regarded statistical heterogeneity as substantial if I² was greater than 50% and either T² was greater than zero, or the P value was low (< 0.10) in the Chi² test for heterogeneity.
Assessment of reporting biases
We decided that if 10 or more studies contributed data to the meta‐analysis for either outcome, we would investigate reporting biases (such as publication bias) using funnel plots, so as to assess possible asymmetry visually. If asymmetry was suggested by visual assessment, we planned to perform exploratory analyses to investigate this using more formal tests, such as Egger's and Begg's tests (Begg 1994; Egger 1997). This version of the review included too few studies in each of the meta‐analyses performed to allow assessment of reporting bias.
Data synthesis
For each polymorphism, we undertook two types of analysis.
-
Comparisons of relative treatment effect by genotype. We grouped studies based on the characteristics of intervention and control arms.
-
Each individual pharmacotherapy or combination compared with placebo/no pharmacotherapy control.
-
Comparisons between different pharmacotherapies.
-
Combinations of pharmacotherapy compared with a single pharmacotherapy.
-
We tested for heterogeneity in relative effects between genotype subgroups.
-
Comparisons of treatment effects between genotype groups, within pharmacotherapy randomisation arms. Some clinical trials included only one pharmacotherapy arm but more than one behavioural support arm, but we did not stratify analyses by behavioural support arm. Analyses of genotype effects within drug groups separately compared abstinence outcomes between 1 to 0 risk alleles and 2 to 0 risk alleles. If possible, we compared risk allele heterozygotes and homozygotes versus reference alleles in separate analyses (e.g. rs1051730 CT vs CC, or TT vs CC rather than CT/TT vs CC).
Differences in genetic architecture (allele frequencies and/or linkage disequilibrium) between ancestral groups may result in population structure, which may lead to confounding if smoking behaviour‐related outcomes are associated with both ancestry and genetic architecture. Conditions for population stratification are met for comparisons between African Americans and European Americans owing to differences in smoking behaviours (e.g. African Americans smoke fewer cigarettes per day than European Americans and in genetic architecture at relevant loci; we conducted separate analyses for white and black or African American study populations at genotype‐based biomarkers (Beirut 2008; Cardon 2003; Trinidad 2015; Wang 2013). We also considered other ancestries (e.g. Asian), but data were not sufficient to allow separate meta‐analyses in these populations. We did analyse the NMR across ancestry groups rather than separately by ancestry group because the NMR is a metabolic marker (not a genotype). The NMR is genetically informed by prior knowledge about the CYP2A6 genotype, but other genes and environmental factors affect NMR; because it is not a genotype, the same concerns about population stratification do not apply to the NMR.
We pooled risk ratios (RRs) using a Mantel‐Haenszel random‐effects model with a 95% confidence interval (CI) for our meta‐analysis, so as to account for statistical heterogeneity across included studies. When the event is defined as smoking cessation, an RR greater than one indicates that more people in the treatment group than in the control group successfully quit. We carried out statistical analysis using RevMan (Review Manager 5.3).
Subgroup analysis and investigation of heterogeneity
In the event of evidence of heterogeneity within planned subgroups based on genotype and type of pharmacotherapy, we planned to explore the impact of the following possible factors.
-
Different comparators.
-
Levels of behavioural support.
-
Dose or duration of treatment.
-
Gender differences.
-
Motivation to quit.
-
Level of nicotine dependence.
However, because heterogeneity within genotype groups was generally low and available data within genotype groups were generally sparse, we refrained from performing any such subgroup analyses.
Sensitivity analysis
We planned to conduct sensitivity analyses to determine whether inclusion of quasi‐RCTs and risk of bias made a difference in our findings. However, we did not identify any quasi‐RCTs, and we did not find enough studies at this time to undertake sensitivity analyses.
'Summary of findings' table
In keeping with standard Cochrane methods, we created a 'Summary of findings' table for comparisons between active NRT and placebo (because it is the most commonly administered intervention of those included in the review) for the genotypes most frequently studied. As part of this process, we used the five GRADE considerations (study limitations, consistency of effect, imprecision, indirectness, and publication bias) to assess the quality of the body of evidence for each outcome. This assessment of the quality of evidence within the review informs the confidence with which we view our conclusions.
Results
Description of studies
Results of the search
Through our search strategy, we identified a total of 479 unique papers, of which 94 were eligible for inclusion in our review (Figure 1). These corresponded to 35 primary randomised clinical trials of pharmacotherapies that compared two or more smoking cessation intervention arms that met the inclusion criteria stated (Ahluwalia 2006; Aveyard 2007; Bloch 2010; Brown 2007; Cinciripini 2005; Cox 2012; Gilbert 2009; Gonzales 2006; GPRG 1993; Hall 2008; Hall 2009; Jorenby 2006; Kalman 2011; Killen 2006; Killen 2008; Killen 2010; King 2012; Lerman 2002; Lerman 2004; Lerman 2015; Marteau 2012; McCarthy 2008; McClure 2013; Oncken 2006; Piper 2007; Piper 2009; Rose 2010; Schnoll 2010; Sun 2012; Swan 2003; Swan 2010; Verde 2014; Wagena 2005; Wilcox 2011; Winst 2006). We excluded three of these studies (Bloch 2010; King 2012; McClure 2013; see Excluded studies). Of the remaining 33 studies, we were able to obtain data from 14 studies by contacting the principal investigator and for four studies by extracting data from published reports (Ahluwalia 2006; Aveyard 2007; Brown 2007; Cox 2012; Gilbert 2009; GPRG 1993; Hall 2008; Hall 2009; Lerman 2002; Lerman 2004; Lerman 2015; Marteau 2012; McCarthy 2008; Piper 2007; Piper 2009; Swan 2010; Wagena 2005; Winst 2006). In total, we included 18 randomised clinical trials in the quantitative analysis (Ahluwalia 2006; Aveyard 2007; Brown 2007; Cox 2012; Gilbert 2009; GPRG 1993; Hall 2008; Hall 2009; Lerman 2002; Lerman 2004; Lerman 2015; Marteau 2012; McCarthy 2008; Piper 2007; Piper 2009; Swan 2010; Wagena 2005; Winst 2006). We did not consider 14 trials in the quantitative analysis because we obtained no relevant data via contact with the principal investigator or through review of published reports (Cinciripini 2005; Gonzales 2006; Jorenby 2006; Kalman 2011; Killen 2006; Killen 2008; Killen 2010; Oncken 2006; Rose 2010; Schnoll 2010; Sun 2012; Swan 2003; Verde 2014; Wilcox 2011). For the remainder of this report, we will focus only on those studies that contributed to the quantitative analysis.
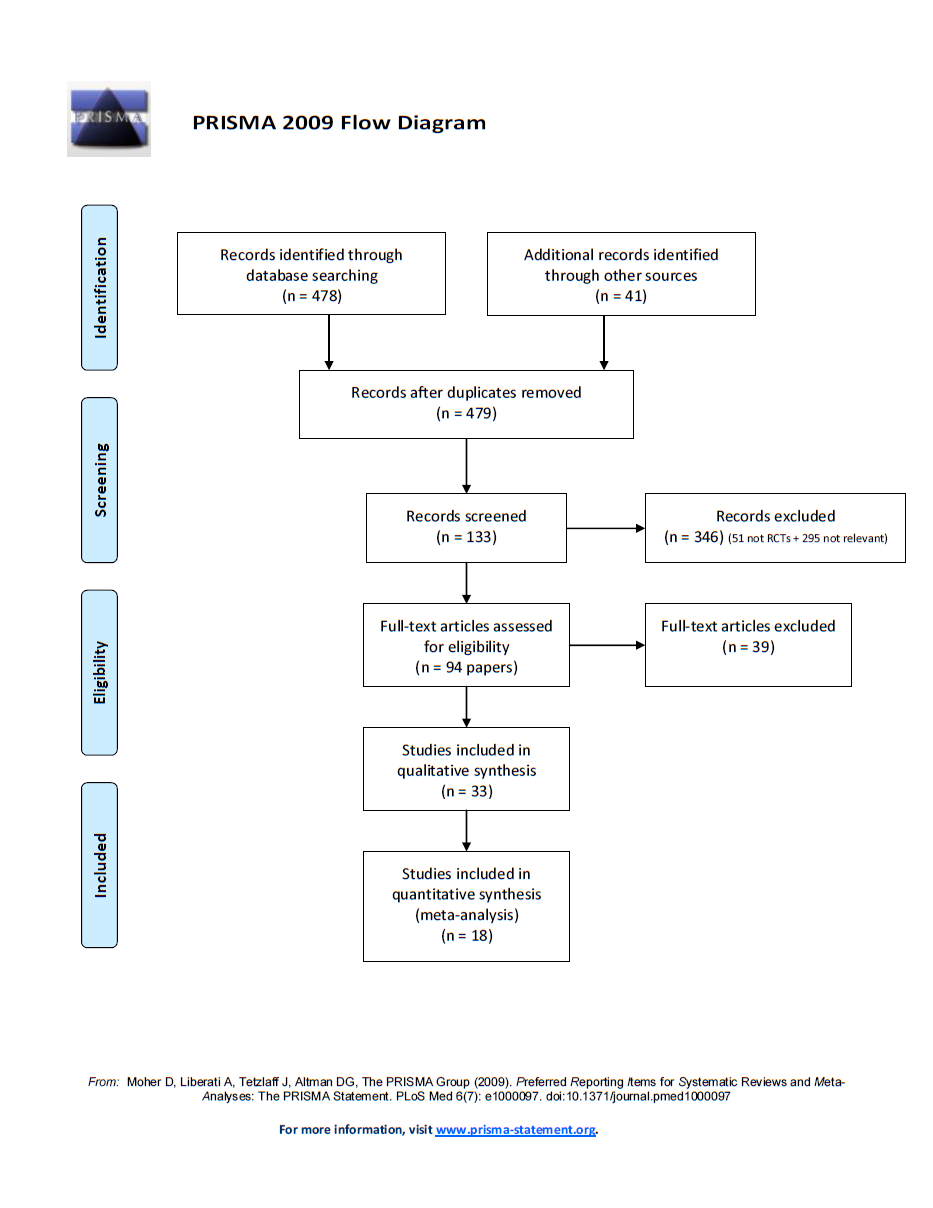
Flow diagram of the search and study selection.
Included studies
Refer to the Characteristics of included studies table for details.
We retrieved data (genotype counts by abstinence status, treatment arm, and race/ethnicity) from 18 randomised clinical trials including 9017 participants, of whom 6924 were non‐Hispanic whites (NHWs) and 2093 were non‐Hispanic black or African American (NHB) participants.
Data were available for 13 biomarkers: nine SNPs (rs1051730 (CHRNA3) (n = 13: Aveyard 2007; Becker 2008; Brown 2007; GPRG 1993; Hall 2008; Hall 2009; Lerman 2002; Lerman 2004; Marteau 2012; McCarthy 2008; Piper 2007; Piper 2009; Swan 2010; Winst 2006), rs16969968 (n = 7: Ahluwalia 2006; Cox 2012; Lerman 2015; McCarthy 2008; Piper 2007; Piper 2009), rs588765 (n = 10: Ahluwalia 2006; Brown 2007; Cox 2012; Hall 2008; Hall 2009; Lerman 2002; Lerman 2004; Lerman 2015; Piper 2009; Swan 2010), rs2036527 (CHRNA5) (n = 7: Ahluwalia 2006; Cox 2012; Lerman 2002; Lerman 2004; McCarthy 2008; Piper 2007; Piper 2009), rs3733829 (n = 4: Brown 2007; McCarthy 2008; Piper 2007; Piper 2009), rs7937 (EGLN2) (n = 3: McCarthy 2008; Piper 2007; Piper 2009), rs1329650 (n = 3: McCarthy 2008; Piper 2007; Piper 2009), rs1028936 (LOC100188947) (n = 3: McCarthy 2008; Piper 2007; Piper 2009), and rs215605 (PDE1C) (n = 3: McCarthy 2008; Piper 2007; Piper 2009)); two VNTRs (DRD4 (n = 4: Aveyard 2007; Brown 2007; Gilbert 2009; GPRG 1993) and SLC6A4 (n = 3: Aveyard 2007; Gilbert 2009; Wagena 2005)); and the NMR (n = 3: Ahluwalia 2006; GPRG 1993; Lerman 2015).
Data were insufficient to allow analysis for five additional biomarkers: four SNPs: rs13280604 (no trials), rs4105144 (no trials), rs6474412 (n = 1: Brown 2007), and rs3025343 (n = 1: Brown 2007); and one VNTR: SLC6A3 (3' 40 bp) (n = 1: Brown 2007), which were identified initially as relevant to investigate.
We identified placebo‐controlled trials of NRT (n = 4: Ahluwalia 2006; Gilbert 2009; GPRG 1993; Winst 2006); bupropion (n = 6: Brown 2007; Cox 2012; Hall 2008; Lerman 2002; McCarthy 2008; Wagena 2005); NRT, bupropion, and NRT + bupropion (n = 1: Piper 2009); NRT and varenicline (n = 1: Lerman 2015); and bupropion and NRT + bupropion (n = 1: Piper 2007). In the other trials, all participants received NRT (n = 4: Aveyard 2007; Hall 2009; Lerman 2004; Marteau 2012) or varenicline (n = 1: Swan 2010). NRT trials included gum (Ahluwalia 2006; Hall 2009; Piper 2007), lozenge (Piper 2009), patch (Aveyard 2007; Cinciripini 2005; Gilbert 2009; GPRG 1993; Hall 2008; Kalman 2011; Killen 2006; Killen 2008; Killen 2010; Lerman 2004; Lerman 2015; Marteau 2012; Piper 2009; Rose 2010; Schnoll 2010; Verde 2014; Winst 2006), and spray (Lerman 2004) NRT interventions. Piper et al included NRT lozenge and transdermal patch intervention arms in this five‐arm trial (Piper 2009).
Trials contained at least one arm of NRT (n = 10: Ahluwalia 2006; Aveyard 2007; Gilbert 2009; GPRG 1993; Hall 2009; Lerman 2004; Lerman 2015; Marteau 2012; Piper 2009; Winst 2006), bupropion (n = 7: Brown 2007; Cox 2012; Hall 2008; Lerman 2002; McCarthy 2008; Piper 2007; Piper 2009; Wagena 2005), varenicline (n = 2: Lerman 2015; Swan 2010), NRT + bupropion (n = 2: Piper 2007; Piper 2009), or placebo (n = 13: Ahluwalia 2006; Brown 2007; Cox 2012; Gilbert 2009; GPRG 1993; Hall 2008; Lerman 2002; Lerman 2015; McCarthy 2008; Piper 2007; Piper 2009; Wagena 2005; Winst 2006), resulting in a total of 40 active versus placebo, 16 active versus active, and 64 between‐genotype comparisons.
Data on the primary outcome ‐ abstinence at six months ‐ were available from 16 trials (Ahluwalia 2006; Aveyard 2007; Brown 2007; Cox 2012; Gilbert 2009; GPRG 1993; Hall 2008; Hall 2009; Lerman 2002; Lerman 2004; Lerman 2015; Marteau 2012; Piper 2009; Swan 2010; Wagena 2005; Winst 2006). Data on abstinence at end of treatment were available from 17 trials (Ahluwalia 2006; Aveyard 2007; Brown 2007; Cox 2012; Gilbert 2009; GPRG 1993; Hall 2008; Hall 2009; Lerman 2002; Lerman 2004; Lerman 2015; McCarthy 2008; Piper 2007; Piper 2009; Swan 2010; Wagena 2005; Winst 2006). Eleven trials included mostly NHW participants (Aveyard 2007; Brown 2007; Gilbert 2009; GPRG 1993; Hall 2008; Hall 2009; Marteau 2012; McCarthy 2008; Swan 2010; Wagena 2005; Winst 2006). Five trials included NHW and NHB participants (Lerman 2002; Lerman 2004; Lerman 2015; Piper 2007; Piper 2009). Two trials included NHB participants only (Ahluwalia 2006; Cox 2012). Available data were insufficient to allow meta‐analyses for Hispanic or Latino race or for non‐Hispanic or non‐Latino ethnic groups other than NHW or NHB.
Excluded studies
In total, we excluded three of the 36 identified randomised clinical trials ‐ one because researchers performed no individual genotyping, and two because investigators reported no genotypes of interest and/or made none available (Becker 2008; King 2012; McClure 2013). Additional information on these studies can be found in the Characteristics of excluded studies tables.
Risk of bias in included studies
Overall risk of bias of randomised clinical trials included in the quantitative analysis varied from low to high. Refer to the Characteristics of included studies table for details, and to Figure 2 and Figure 3 for a summary of ‘Risk of bias’ assessments. For one trial, we had only a protocol available, and this made it difficult to assess risk of bias of this study as actually performed (Winst 2006).
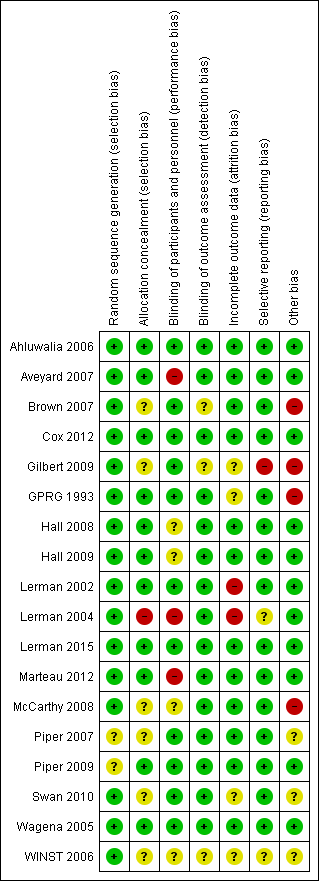
Risk of bias summary: review authors' judgements about each risk of bias item for each study.

Risk of bias graph: review authors' judgements about each risk of bias item presented as percentages across all included studies.
Allocation
We assessed random sequence generation as having low risk of bias for 16 studies (Ahluwalia 2006; Aveyard 2007; Brown 2007; Cox 2012; Gilbert 2009; GPRG 1993; Hall 2008; Hall 2009; Lerman 2002; Lerman 2004; Lerman 2015; Marteau 2012; McCarthy 2008; Swan 2010; Wagena 2005; Winst 2006). We assessed two studies as having unclear risk (Piper 2007; Piper 2009). We considered allocation concealment as having low risk of bias for 10 studies (Ahluwalia 2006; Aveyard 2007; GPRG 1993; Hall 2008; Hall 2009; Lerman 2002; Lerman 2015; Marteau 2012; Piper 2009; Wagena 2005). We found unclear risk for seven studies (Brown 2007; Cox 2012; Gilbert 2009; McCarthy 2008; Piper 2007; Swan 2010; Winst 2006). We determined that one study was at high risk (Lerman 2004).
Blinding
We considered blinding of participants and personnel as having low risk of bias for 11 studies (Ahluwalia 2006; Brown 2007; Cox 2012; Gilbert 2009; GPRG 1993; Lerman 2002; Lerman 2015; Piper 2007; Piper 2009; Swan 2010; Wagena 2005). We judged four studies as having unclear risk (Hall 2008; Hall 2009; McCarthy 2008; Winst 2006). We found that three studies were at high risk (Aveyard 2007; Lerman 2004; Marteau 2012). We considered blinding of outcome assessment as having low risk of bias for 13 studies (Aveyard 2007; GPRG 1993; Hall 2008; Hall 2009; Lerman 2002; Lerman 2004; Lerman 2015; Marteau 2012; McCarthy 2008; Piper 2007; Piper 2009; Swan 2010; Wagena 2005). We determined that five studies were at unclear risk (Ahluwalia 2006; Brown 2007; Cox 2012; Gilbert 2009; Winst 2006).
Incomplete outcome data
We considered incomplete outcome data as having low risk of bias for 12 studies (Ahluwalia 2006; Aveyard 2007; Brown 2007; Cox 2012; Hall 2008; Hall 2009; Lerman 2015; Marteau 2012; McCarthy 2008; Piper 2007; Piper 2009; Wagena 2005). We deemed that four studies had unclear risk (Gilbert 2009; GPRG 1993; Swan 2010; Winst 2006). We found high risk for two studies (Lerman 2002; Lerman 2004).
Selective reporting
We considered selective reporting as having low risk of bias for 15 studies (Ahluwalia 2006; Aveyard 2007; Brown 2007; Cox 2012; GPRG 1993; Hall 2008; Hall 2009; Lerman 2002; Lerman 2015; Marteau 2012; McCarthy 2008; Piper 2007; Piper 2009; Swan 2010; Wagena 2005).We determined that two studies were at unclear risk (Lerman 2004; Winst 2006). We found that one study was at high risk (Gilbert 2009).
Other potential sources of bias
We assessed 11 studies as having low risk of bias for other potential sources of bias based on genotype frequencies (in study and polymorphism), potential deviation from Hardy‐Weinberg equilibrium, source of DNA (e.g. buccal swab, blood, saliva), genotyping protocol, and QC methods (Ahluwalia 2006; Aveyard 2007; Cox 2012; Hall 2008; Hall 2009; Lerman 2002; Lerman 2004; Lerman 2015; Marteau 2012; Piper 2009; Wagena 2005). For three studies, we were unable to assess the risk of other biases (Piper 2007; Swan 2010; Winst 2006). For four studies, we considered the risk of other bias to be high because a large proportion of original trial participants were not genotyped, thereby opening the possibility of selection bias, or because relapsers were excluded from analyses, which may have created study population imbalance for genetic predisposition to successfully quit smoking (Brown 2007; Gilbert 2009; GPRG 1993; McCarthy 2008).
Effects of interventions
See: Summary of findings for the main comparison Active NRT compared with placebo ‐ rs1051730 ‐ non‐Hispanic white for smoking cessation; Summary of findings 2 Active NRT compared with placebo ‐ rs16969968 ‐ non‐Hispanic white for smoking cessation; Summary of findings 3 Active NRT compared with placebo ‐ rs16969968 ‐ non‐Hispanic black or African American for smoking cessation; Summary of findings 4 Active NRT compared with placebo ‐ rs 588765 ‐ non‐Hispanic white for smoking cessation; Summary of findings 5 Active NRT compared with placebo ‐ rs2036527 ‐ non‐Hispanic black or African American for smoking cessation; Summary of findings 6 Active NRT compared with placebo ‐ DRD4 (exon 3 48 bp) ‐ non‐Hispanic white for smoking cessation; Summary of findings 7 Active NRT compared with placebo ‐ NMR ‐ non‐Hispanic black and white for smoking cessation
Results are presented according to type of analysis (comparisons of relative treatment effect by genotype, or comparisons of treatment effect between genotype groups, within pharmacotherapy randomisation arms) and type of treatment (comparison). Table 3, Table 4, Table 5, and Table 6 show the summary results for each type of analysis with separate tables for six‐month abstinence and abstinence at the end of treatment.
| Treatment comparison | SNP or VNTRa | Ethnicity | Number of studies (individual treatment 1/treatment 2) included | Analysis number | Significant treatment effect Letter indicates which treatment is favoured: a = active NRT b = bupropion ba = bupropion + active NRT p = placebo v = varenicline | P value heterogeneity genotype groups | |||
| Active NRT vs placebo | O | HoMa | Het | HoMi | |||||
| rs1051730 | NHW | 3 (1023/574) | 1.1 | a | a | a | 0.40 | ||
| rs16969968 | NHB | 2 (392/317) | 3.1 | a | 0.03a | ||||
| rs2036527 | NHB | 2 (391/317) | 5.1 | 0.36a | |||||
| DRD4 (exon 3 48 bp) | NHW | 2 (453/447) | 6.1 | a | a | 0.72 | |||
| O | S | N | |||||||
| NMR | NHW or NHB | 2 (719/699) | 7.1 | a | a | 0.22 | |||
| Bupropion vs placebo | O | HoMa | Het | HoMi | |||||
| rs1051730 | NHW | 4 (797/532) | 8.1 | b | b | 0.77 | |||
| NHB | 3 (63/63) | 9.1 | 0.80 | ||||||
| rs16969968 | NHB | 2 (294/284) | 11.1 | 0.22a | |||||
| rs588765 | NHW | 4 (596/511) | 12.1 | b | b | 0.32 | |||
| rs2036527 | NHW | 2 (412/326) | 13.1 | b | b | 0.28 | |||
| NHB | 3 (331/329) | 14.1 | 0.65 | ||||||
| rs3733829 | NHW | 2 (307/264) | 15.1 | b | b | 0.25 | |||
Het: heterozygous; HoMa: homozygous major; HoMi: homozygous minor; N: normal NMR; NHB: non‐Hispanic black or African American; NHW: non‐Hispanic white; NMR: nicotine metabolite ratio; NRT: nicotine replacement therapy; O = overall; SNP: single‐nucleotide polymorphism; VNTR: variable number tandem repeat.
aHomozygous major vs heterozygous + homozygous minor.
| Treatment comparison | SNP or VNTRa | Ethnicity | Number of studies (individual treatment 1/treatment 2) included | Analysis number | Significant treatment effect Letter indicates which treatment is favoured: a = active NRT b = bupropion ba = bupropion + active NRT p = placebo v = varenicline | P value heterogeneity genotype groups | |||
| Active NRT vs placebo | O | HoMa | Het | HoMi | |||||
| rs1051730 | NHW | 2 (912/479) | 1.2 | a | a | a | 0.004 | ||
| rs16969968 | NHW | 2 (784/343) | 2.1 | a | 0.02 | ||||
| NHB | 2 (392/317) | 3.2 | a | pb | 0.003a | ||||
| rs588765 | NHW | 2 (587/336) | 4.1 | a | 0.89 | ||||
| rs2036527 | NHB | 2 (391/317) | 5.2 | 0.28a | |||||
| DRD4 (exon 3 48 bp) | NHW | 2 (453/447) | 6.2 | 0.79 | |||||
| O | S | N | |||||||
| NMR | NHW or NHB | 2 (718/699) | 7.2 | a | a | 0.80 | |||
| Bupropion vs placebo | O | HoMa | Het | HoMi | |||||
| rs1051730 | NHW | 6 (743/636) | 8.2 | b | b | b | b | 0.41 | |
| NHB | 3 (84/75) | 9.2 | 0.12 | ||||||
| rs16969968 | NHW | 3 (324/233) | 10.1 | b | b | 0.50 | |||
| NHB | 3 (315/296) | 11.2 | b | bb | 0.77a | ||||
| rs588765 | NHW | 4 (595/512) | 12.2 | b | b | 0.96 | |||
| rs2036527 | NHW | 4 (546/429) | 13.2 | b | b | b | b | 0.20 | |
| NHB | 4 (352/341) | 14.2 | b | b | 0.38 | ||||
| rs3733829 | NHW | 4 (440/367) | 15.2 | b | b | b | 0.71 | ||
| NHB | 2 (46/29) | 16.1 | 0.56a | ||||||
| rs7937 | NHW | 3 (324/233) | 17.1 | b | b | 0.54 | |||
| NHB | 2 (47/29) | 18.1 | 0.92a | ||||||
| rs1329650 | NHW | 3 (324/235) | 19.1 | b | b | 0.83 | |||
| NHB | 2 (47/29) | 20.1 | 0.59a | ||||||
| rs1028936 | NHW | 3 (324/235) | 21.1 | b | b | 0.90 | |||
| NHB | 2 (47/29) | 22.1 | 0.37a | ||||||
| rs215605 | NHW | 3 (324/234) | 23.1 | b | b | 0.43 | |||
| NHB | 2 (47/29) | 24.1 | 0.92a | ||||||
| Bupropion + any NRT vs placebo | O | HoMa | Het | HoMi | |||||
| rs1051730 | NHW | 2 (268/176) | 25.1 | ba | ba | 0.77 | |||
| NHB | 2 (40/29) | 26.1 | 0.07a | ||||||
| rs16969968 | NHW | 2 (266/175) | 27.1 | ba | ba | 0.77 | |||
| NHB | 2 (40/29) | 28.1 | 0.35a | ||||||
| rs2036527 | NHW | 2 (267/176) | 29.1 | ba | ba | 0.95 | |||
| NHB | 2 (40/29) | 30.1 | 0.59 | ||||||
| rs3733829 | NHW | 2 (266/175) | 31.1 | ba | ba | 0.83 | |||
| NHB | 2 (48/21[ES1] ) | 32.1 | 0.45a | ||||||
| rs7937 | NHW | 2 (268/174) | 33.1 | ba | 0.62 | ||||
| NHB | 2 (40/29) | 34.1 | 0.98a | ||||||
| rs1329650 | NHW | 2 (266/176) | 35.1 | ba | ba | 0.90 | |||
| NHB | 2 (40/29) | 36.1 | 0.78a | ||||||
| rs1028936 | NHW | 2 (268/176) | 37.1 | ba | ba | 0.88 | |||
| NHB | 2 (40/29) | 38.1 | 0.89a | ||||||
| rs215605 | NHW | 2 (267/175) | 39.1 | ba | ba | 0.79 | |||
| NHB | 2 (40/28) | 40.1 | 0.52a | ||||||
| Bupropion + any NRT vs bupropion | O | HoMa | Het | HoMi | |||||
| rs1051730 | NHW | 2 (268/265) | 41.1 | 0.97 | |||||
| NHB | 2 (40/47) | 42.1 | 0.41a | ||||||
| rs16969968 | NHW | 2 (266/265) | 43.1 | 0.98 | |||||
| NHB | 2 (40/47) | 44.1 | 0.57a | ||||||
| rs2036527 | NHW | 2 (267/265) | 45.1 | 0.99 | |||||
| NHB | 2 (40/47) | 46.1 | 0.61a | ||||||
| rs3733829 | NHW | 2 (267/264) | 47.1 | 0.82 | |||||
| NHB | 2 (48/46) | 48.1 | b | 0.58a | |||||
| rs7937 | NHW | 2 (268/265) | 49.1 | 0.69 | |||||
| NHB | 2 (40/47) | 50.1 | 0.85a | ||||||
| rs1329650 | NHW | 2 (266/265) | 51.1 | 0.66 | |||||
| NHB | 2 (40/47) | 52.1 | 0.49a | ||||||
| rs1028936 | NHW | 2 (268/265) | 53.1 | 0.60 | |||||
| NHB | 2 (40/47) | 54.1 | 0.49a | ||||||
| rs215605 | NHW | 2 (267/265) | 55.1 | 0.50 | |||||
| NHB | 2 (40/47) | 56.1 | 0.75a | ||||||
Het: heterozygous; HoMa: homozygous major; HoMi: homozygous minor; N: normal NMR; NHB: non‐Hispanic black or African American; NHW: non‐Hispanic white; NMR: nicotine metabolite ratio; NRT: nicotine replacement therapy; O: overall; SNP: single‐nucleotide polymorphism; VNTR: variable number tandem repeat.
aHomozygous major vs heterozygous + homozygous minor.
bHeterozygous + homozygous minor.
| Treatment group | SNP or VNTRa | Ethnicity | Number of studies (individuals in homozygous major/heterozygous/homozygous minor) included | Analysis number | Significant treatment effect Letter indicates which genotype is favoured: ma = genotype group with 1 or more major alleles mi = homozygous minor s = slow NMR n = normal NMR | P value heterogeneity in genotype comparisons | |
| Active NRT | MaMi | HetMi | |||||
| rs1051730 | NHW | 7 (1352/1025/310) | 57.1 | 0.93 | |||
| NHB | 2 (181/50/6) | 58.1 | 0.98 | ||||
| rs16969968 | NHB | 2 (353/39a) | 59.1 | N/A | |||
| rs588765 | NHW | 3 (286/399/147) | 60.1 | 0.76 | |||
| rs2036527 | NHW | 2 (369/447/132) | 61.1 | 0.79 | |||
| NHB | 2 (232/159a) | 62.1 | N/A | ||||
| DRD4 (exon 3 48 bp) | NHW | 3 (798/253/68) | 63.1 | 0.74 | |||
| SLC6A4 (Promoter) | NHW | 2 (277/465/184) | 64.1 | 0.62 | |||
| Normal vs slow | |||||||
| NMR | NHW and NHB | 2 (400/318) | 65.1 | s | N/A | ||
| Bupropion | |||||||
| rs1051730 | NHW | 4 (220/294/96) | 66.1 | 0.82 | |||
| NHB | 2 (43/20a) | 67.1 | N/A | ||||
| rs16969968 | NHB | 2 (261/33a) | 69.1 | N/A | |||
| rs588765 | NHW | 4 (195/292/109) | 70.1 | 0.80 | |||
| rs2036527 | NHW | 2 (143/204/65) | 71.1 | 0.87 | |||
| NHB | 3 (187/144a) | 72.1 | N/A | ||||
| rs3733829 | NHW | 2 (146/116/45) | 73.1 | 0.65 | |||
| Varenicline | |||||||
| rs16969968 | NHW | 2 (269/349/89) | 83.1 | 0.81 | |||
| rs588765 | NHW | 2 (234/345/120) | 84.1 | 0.90 | |||
| Placebo | |||||||
| rs1051730 | NHW | 6 (377/441/156) | 101.1 | 0.54 | |||
| NHB | 2 (49/14a) | 102.1 | N/A | ||||
| rs16969968 | NHW | 2 (132/181/30) | 103.1 | 0.63 | |||
| NHB | 3 (519/65a) | 104.1 | N/A | ||||
| rs588765 | NHW | 5 (253/340/130) | 105.1 | 0.92 | |||
| NHB | 2 (275/291a) | 106.1 | N/A | ||||
| rs2036527 | NHW | 2 (117/166/43) | 107.1 | 0.81 | |||
| NHB | 4 (373/256a) | 108.1 | N/A | ||||
| DRD4 (exon 3 48 bp) | NHW | 3 (361/186/26) | 109.1 | 0.44 | |||
| rs3733829 | NHW | 2 (122/102/40) | 110.1 | 0.60 | |||
| SLC6A4 (Promoter) | NHW | 2 (128/23a) | 119.1 | N/A | |||
| Normal vs slow | |||||||
| NMR | NHW and NHB | 2 (389/310) | 120.1 | N/A | |||
HetMi: heterozygous vs homozygous minor; MaMi: homozygous major vs homozygous minor; NHB: non‐Hispanic black or African American; NHW: non‐Hispanic white; NMR: nicotine metabolite ratio; NRT: nicotine replacement therapy; NS: normal NMR vs slow NMR; SNP: single‐nucleotide polymorphism; VNTR: variable number tandem repeat.
aHeterozygous and homozygous minor combined.
| Treatment group | SNP or VNTRa | Ethnicity | Number of studies (individuals in homozygous major/heterozygous/homozygous minor) included | Analysis number | Significant treatment effect Letter indicates which genotype is favored: ma = genotype group with 1 or more major alleles mi = homozygous minor s = slow NMR n = normal NMR | P value heterogeneity in genotype comparisons | |
| Active NRT | MaMi | HetMi | |||||
| rs1051730 | NHW | 5 (917/1008/283) | 57.2 | 0.64 | |||
| rs16969968 | NHB | 2 (353/39a) | 59.2 | mab | N/A | ||
| rs588765 | NHW | 3 (286/399/147) | 60.2 | 0.97 | |||
| rs2036527 | NHW | 2 (369/447/132) | 61.2 | 0.74 | |||
| NHB | 2 (232/159a) | 62.2 | mab | N/A | |||
| DRD4 (exon 3 48 bp) | NHW | 3 (798/253/68) | 63.2 | 0.72 | |||
| SLC6A4 (Promoter) | NHW | 2 (277/465/184) | 64.2 | 0.83 | |||
| Normal vs slow | |||||||
| NMR | NHW and NHB | 2 (400/318) | 65.2 | N/A | |||
| Bupropion | |||||||
| rs1051730 | NHW | 6 (263/357/123) | 66.2 | 0.59 | |||
| NHB | 3 (58/26a) | 67.2 | N/A | ||||
| rs16969968 | NHW | 3 (108/164/52) | 68.1 | 0.51 | |||
| NHB | 3 (279/36a) | 69.2 | N/A | ||||
| rs588765 | NHW | 4 (195/292/109) | 70.2 | 0.65 | |||
| rs2036527 | NHW | 4 (185/269/92) | 71.2 | 0.53 | |||
| NHB | 4 (200/152a) | 72.2 | N/A | ||||
| rs3733829 | NHW | 4 (203/181/56) | 73.2 | 0.87 | |||
| NHB | 2 (35/11a) | 74.1 | N/A | ||||
| rs7937 | NHW | 3 (86/165/73) | 75.1 | 0.66 | |||
| NHB | 2 (20/24/3) | 76.1 | 0.62 | ||||
| rs1329650 | NHW | 3 (161/138/25) | 77.1 | 0.90 | |||
| NHB | 2 (42/5a) | 78.1 | N/A | ||||
| rs1028936 | NHW | 3 (212/103/9) | 79.1 | 1.00 | |||
| NHB | 2 (42/5a) | 80.1 | N/A | ||||
| rs215605 | NHW | 3 (125/154/45) | 81.1 | 0.94 | |||
| NHB | 2 (31/16a) | 82.1 | N/A | ||||
| Varenicline | |||||||
| rs16969968 | NHW | 2 (269/349/89) | 83.2 | 0.94 | |||
| rs588765 | NHW | 2 (234/345/120) | 84.2 | 0.84 | |||
| Bupropion + any NRT | |||||||
| rs1051730 | NHW | 2 (113/130/25) | 85.1 | 0.96 | |||
| NHB | 2 (33/7a) | 86.1 | N/A | ||||
| rs16969968 | NHW | 2 (113/130/23) | 87.1 | 0.98 | |||
| NHB | 2 (36/4a) | 88.1 | N/A | ||||
| rs2036527 | NHW | 2 (111/132/24) | 89.1 | 0.82 | |||
| NHB | 2 (23/12/5) | 90.1 | 0.87 | ||||
| rs3733829 | NHW | 2 (114/123/30) | 91.1 | 0.52 | |||
| NHB | 2 (30/10a) | 92.1 | mib | N/A | |||
| rs7937 | NHW | 2 (74/140/54) | 93.1 | 0.95 | |||
| NHB | 2 (13/27a) | 94.1 | N/A | ||||
| rs1329650 | NHW | 2 (149/96/21) | 95.1 | mi | 0.67 | ||
| NHB | 2 (34/6a) | 96.1 | N/A | ||||
| rs1028936 | NHW | 2 (183/75/10) | 97.1 | 0.67 | |||
| NHB | 2 (34/6a) | 98.1 | N/A | ||||
| rs215605 | NHW | 2 (105/119/43) | 99.1 | 0.25 | |||
| NHB | 2 (18/22a) | 100.1 | |||||
| Placebo | |||||||
| rs1051730 | NHW | 7 (378/441/164) | 101.2 | 0.71 | |||
| NHB | 3 (63/20a) | 102.2 | N/A | ||||
| rs16969968 | NHW | 4 (169/227/49) | 103.2 | 0.83 | |||
| NHB | 4 (530/66a) | 104.2 | mib | N/A | |||
| rs588765 | NHW | 5 (254/296/108) | 105.2 | 0.34 | |||
| NHB | 2 (277/289a) | 106.2 | N/A | ||||
| rs2036527 | NHW | 4 (154/213/62) | 107.2 | 0.90 | |||
| NHB | 5 (378/263a) | 108.2 | N/A | ||||
| DRD4 (exon 3 48 bp) | NHW | 3 (361/186/26) | 109.2 | 0.65 | |||
| rs3733829 | NHW | 4 (164/152/51) | 110.2 | 0.53 | |||
| rs7937 | NHW | 3 (73/120/40) | 111.1 | 0.67 | |||
| NHB | 2 (18/11a) | 112.1 | N/A | ||||
| rs1329650 | NHW | 3 (119/106/10) | 113.1 | 0.99 | |||
| NHB | 2 (21/8a) | 114.1 | N/A | ||||
| rs1028936 | NHW | 3 (158/72/5) | 115.1 | 0.79 | |||
| NHB | 2 (23/6a) | 116.1 | N/A | ||||
| rs215605 | NHW | 3 (94/105/35) | 117.1 | 0.70 | |||
| NHB | 2 (18/11a) | 118.1 | N/A | ||||
| SLC6A4 (Promoter) | NHW | 2 (128/23a) | 119.2 | N/A | |||
| Normal vs slow | |||||||
| NMR | NHW and NHB | 2 (400/318) | 120.2 | N/A | |||
HetMi: heterozygous vs homozygous minor; MaMi: homozygous major vs homozygous minor; NHB: non‐Hispanic black or African American; NHW: non‐Hispanic white; NS: normal NMR vs slow NMR; SNP: single‐nucleotide polymorphism; VNTR: variable number tandem repeat; NMR = nicotine metabolite ratio.
aHeterozygous and homozygous minor combined.
bHomozygous major vs heterozygous and homozygous minor.
Comparisons of relative treatment effects by genotype
Active NRT versus placebo
Six‐month abstinence
Data were available for the following SNPs: rs1051730 (n = 3, 1597 participants, NHW; Analysis 1.1), rs16969968 (n = 2, 709 participants, NHB; Analysis 3.1), rs2036527 (n = 2, 709 participants, NHB; Analysis 5.1), DRD4 (exon 3 48 bp) (n = 2, 900 participants, NHW; Analysis 6.1), and NMR (n = 2, 1418 participants, NHW or NHB; Analysis 7.1).
Results showed statistically significant heterogeneity between genotype groups in the analysis of NHB for rs16969968 (P = 0.03; Analysis 3.1; summary of findings Table 3). Six‐month abstinence was increased in the active NRT group as compared with the placebo group among participants with a GG genotype (RR 1.47, 95% CI 1.07 to 2.03), but not in the combined group of those with a GA or AA genotype (RR 0.43, 95% CI 0.15 to 1.26; Analysis 3.1; summary of findings Table 3; RRR GG vs GA or AA 3.51, 95% CI 1.19 to 10.3). We found no such heterogeneity for any of the other biomarkers.
End‐of‐treatment abstinence
Data were available for the following SNPs: rs1051730 (n = 2, 1391 participants, NHW; Analysis 1.2), rs16969968 (n = 2, 1127 participants, NHW; Analysis 2.1; n = 2, 709 participants, NHB; Analysis 3.2), rs588765 (n = 2, 923 participants, NHW; Analysis 4.1), rs2036527 (n = 2, 708 participants, NHB; Analysis 5.2), DRD4 (exon 3 48 bp) (n = 2, 900 participants, NHW; Analysis 6.2), and NMR (n = 2, 1417 participants, NHW or NHB; Analysis 7.2).
We found statistically significant heterogeneity between genotype groups in the analysis of NHW for rs1051730 (heterogeneity P = 0.004; Analysis 1.2; summary of findings Table for the main comparison) and rs16969968 (heterogeneity P = 0.02; Analysis 2.1; summary of findings Table for the main comparison), and of NHB for rs16969968 (heterogeneity P = 0.003; Analysis 3.2; summary of findings Table 3). For the rs1051730 analysis in NHW, abstinence at end of treatment was comparable between the active NRT group and the placebo group among participants with a GG genotype (RR 1.09, 95% CI 0.85 to 1.41), but was increased in those with GA or AA genotype (RR 2.13, 95% CI 1.52 to 2.97; and RR 2.18, 95% CI 1.04 to 4.58, respectively; Analysis 1.2; summary of findings Table for the main comparison; RRR GG vs AA and GA vs AA genotype of 0.54, 95% CI 0.26 to 1.14; and 0.96, 95% CI 0.44 to 2.11, respectively). For the rs16969968 analysis in NHW, end‐of‐treatment abstinence increased with active NRT as compared with placebo among individuals with GA genotype (RR 1.85, 95% CI 1.33 to 2.59), but was comparable among those with GG or AA (RR 1.01, 95% CI 0.77 to 1.33; and RR 1.80, 95% CI 0.45 to 7.23, respectively; Analysis 2.1; summary of findings Table for the main comparison; RRR GG vs AA and GA vs AA genotype of 0.78, 95% CI 0.33 to 1.47; and 1.04, 95% CI 0.45 to 2.41, respectively). For rs16969968 in NHB, active NRT increased end‐of‐treatment abstinence compared with placebo among those with GG genotype (RR 1.57, 95% CI 1.15 to 2.15), and it decreased end‐of‐treatment abstinence among those with GA or AA phenotype (RR 0.29, 95% CI 0.10 to 0.86; Analysis 3.2; summary of findings Table 3; RRR GG vs GA or AA genotype of 5.84, 95% CI 1.89 to 18.1). We found no such heterogeneity for any of the other biomarkers.
Bupropion versus placebo
Six‐month abstinence
Data were available for the following SNPs: rs1051730 (n = 4, 1329 participants, NHW; Analysis 8.1; n = 3, 126 participants, NHB; Analysis 9.1), rs16969968 (n = 2, 578 participants, NHB; Analysis 11.1), rs588765 (n = 4, 1108 participants, NHW; Analysis 12.1), rs2036527 (n = 2, 738 participants, NHW; Analysis 13.1; n = 3, 660 participants, NHB; Analysis 14.1), and rs3733829 (n = 2, 571 participants, NHW; Analysis 15.1).
We found no heterogeneity between genotype groups when comparing bupropion versus placebo for any of the biomarkers.
End‐of‐treatment abstinence
Data were available for the following SNPs: rs1051730 (n = 6, 1379 participants, NHW; Analysis 8.2; n = 3, 159 participants, NHB; Analysis 9.2), rs16969968 (n = 3, 557 participants, NHW; Analysis 10.1; n = 3, 611 participants, NHB; Analysis 11.2), rs588765 (n = 4, 1107 participants, NHW; Analysis 12.2), rs2036527 (n = 4, 975 participants, NHW; Analysis 13.2; n = 4, 693 participants, NHB; Analysis 14.2), rs3733829 (n = 4, 807 participants, NHW; Analysis 15.2; n = 2, 75 participants, NHB; Analysis 16.1), rs7937 (n = 3, 557 participants, NHW; Analysis 17.1; n = 2, 76 participants, NHB; Analysis 18.1), rs1329650 (n = 3, 559 participants, NHW; Analysis 19.1; n = 2, 76 participants, NHB; Analysis 20.1), rs1028936 (n = 3, 559 participants, NHW; Analysis 21.1; n = 2, 76 participants, NHB; Analysis 22.1), and rs215605 (n = 3, 558 participants, NHW; Analysis 23.1; n = 2, 76 participants, NHB; Analysis 24.1).
We found no heterogeneity between genotype groups when comparing bupropion versus placebo for any of the biomarkers.
Bupropion + any NRT versus placebo
Six‐month abstinence
No data were available for this outcome.
End‐of‐treatment abstinence
Data were available for the following SNPs: rs1051730 (n = 2, 444 participants, NHW; Analysis 25.1; n = 2, 69 participants, NHB; Analysis 26.1), rs16969968 (n = 2, 441 participants, NHW; Analysis 27.1; n = 2, 69 participants, NHB; Analysis 28.1), rs2036527 (n = 2, 443 participants, NHW; Analysis 29.1; n = 2, 69 participants, NHB; Analysis 30.1), rs3733829 (n = 2, 441 participants, NHW; Analysis 31.1; n = 2, 69 participants, NHB; Analysis 32.1), rs7937 (n = 2, 442 participants, NHW; Analysis 33.1; n = 2, 69 participants, NHB; Analysis 34.1), rs1329650 (n = 2, 442 participants, NHW; Analysis 35.1; n = 2, 69 participants, NHB; Analysis 36.1), rs1028936 (n = 2, 444 participants, NHW; Analysis 37.1; n = 2, 69 participants, NHB; Analysis 38.1), and rs215605 (n = 2, 442 participants, NHW; Analysis 39.1; n = 2, 68 participants, NHB; Analysis 40.1).
We found no heterogeneity between genotype groups when comparing bupropion + any NRT versus placebo for any of the biomarkers.
Bupropion + any NRT versus bupropion alone
Six‐month abstinence
No data were available for this outcome.
End‐of‐treatment abstinence
Data were available for the following SNPs: rs1051730 (n = 2, 533 participants, NHW; Analysis 41.1; n = 2, 87 participants, NHB; Analysis 42.1), rs16969968 (n = 2, 531 participants, NHW; Analysis 43.1; n = 2, 87 participants, NHB; Analysis 44.1), rs2036527 (n = 2, 532 participants, NHW; Analysis 45.1; n = 2, 87 participants, NHB; Analysis 46.1), rs3733829 (n = 2, 531 participants, NHW; Analysis 47.1; n = 2, 94 participants, NHB; Analysis 48.1), rs7937 (n = 2, 533 participants, NHW; Analysis 49.1; n = 2, 87 participants, NHB; Analysis 50.1), rs1329650 (n = 2, 531 participants, NHW; Analysis 51.1; n = 2, 87 participants, NHB; Analysis 52.1), rs1028936 (n = 2, 533 participants, NHW; Analysis 53.1; n = 2, 87 participants, NHB; Analysis 54.1), and rs215605 (n = 2, 532 participants, NHW; Analysis 55.1; n = 2, 87 participants, NHB; Analysis 56.1).
We found no heterogeneity between genotype groups when comparing bupropion + any NRT versus bupropion for any of the biomarkers.
Comparisons of treatment effects between genotype groups within pharmacotherapy randomisation arms
Active NRT
Six‐month abstinence
Data were available for the following SNPs: rs1051730 (n = 7, 2687 participants, NHW; Analysis 57.1; n = 2, 237 participants, NHB; Analysis 58.1), rs16969968 (n = 2, 392 participants, NHB; Analysis 59.1), rs588765 (n = 3, 832 participants, NHW; Analysis 60.1), rs2036527 (n = 2, 948 participants, NHW; Analysis 61.1; n = 2, 391 participants, NHB; Analysis 62.1), DRD4 (exon 3 48 bp) (n = 3, 1119 participants, NHW; Analysis 63.1), SLC6A4 (Promoter) (n = 2, 926 participants, NHW; Analysis 64.1), and NMR (n = 2, 718 participants, NHW and NHB; Analysis 65.1).
Among those receiving active NRT, individuals with a slow NMR were more successful in achieving six‐month abstinence as compared with those with a normal NMR among NHW and NHB participants (normal NMR vs slow NMR: RR 0.54, 95% CI 0.37 to 0.78; Analysis 65.1).
We found no heterogeneity between genotype group comparisons (homozygous major vs homozygous minor compared with heterozygous vs homozygous minor, or slow vs normal) among individuals randomised to active NRT for any of the other biomarkers.
End‐of‐treatment abstinence
Data were available for the following SNPs: rs1051730 (n = 5, 2208 participants, NHW; Analysis 57.2), rs16969968 (n = 2, 392 participants, NHB; Analysis 59.2), rs588765 (n = 3, 832 participants, NHW; Analysis 60.2), rs2036527 (n = 2, 948 participants, NHW; Analysis 61.2; n = 2, 391 participants, NHB; Analysis 62.2), DRD4 (exon 3 48 bp) (n = 3, 1119 participants, NHW; Analysis 63.2), SLC6A4 (Promoter) (n = 2, 926 participants, NHW; Analysis 64.2), and NMR (n = 2, 718 participants, NHW and NHB; Analysis 65.2).
Among those receiving active NRT, GG genotype individuals more often achieved end‐of‐treatment abstinence as compared with individuals with a combination of GA and AA genotypes for rs16969968 and rs2036527 in NHB (RR 2.75, 95% CI 1.08 to 7.02; Analysis 59.2; RR 1.73, 95% CI 1.20 to 2.49; Analysis 62.2; respectively).
We found no heterogeneity between genotype group comparisons (homozygous major vs homozygous minor compared with heterozygous vs homozygous minor, or slow vs normal) among individuals randomised to active NRT for any of the other biomarkers.
Bupropion
Six‐month abstinence
Data were available for the following SNPs: rs1051730 (n = 4, 610 participants, NHW; Analysis 66.1; n = 2, 63 participants, NHB; Analysis 67.1), rs16969968 (n = 2, 294 participants, NHB; Analysis 69.1), rs588765 (n = 4, 596 participants, NHW; Analysis 70.1), rs2036527 (n = 2, 412 participants, NHW; Analysis 71.1; n = 3, 331 participants, NHB; Analysis 72.1), and rs3733829 (n = 2, 307 participants, NHW; Analysis 73.1).
Among those receiving bupropion, we identified no specific genotype groups that were more successful in achieving six‐month abstinence than other groups. Additionally, we found no heterogeneity between genotype group comparisons (homozygous major vs homozygous minor compared with heterozygous vs homozygous minor, or slow vs normal) among individuals randomised to bupropion for any of the biomarkers.
End‐of‐treatment abstinence
Data were available for the following SNPs: rs1051730 (n = 6, 743 participants, NHW; Analysis 66.2; n = 3, 84 participants, NHB; Analysis 67.2), rs16969968 (n = 3, 324 participants, NHW; Analysis 68.1; n = 3, 315 participants, NHB; Analysis 69.2), rs588765 (n = 4, 596 participants, NHW; Analysis 70.2), rs2036527 (n = 4, 546 participants, NHW; Analysis 71.2; n = 4, 352 participants, NHB; Analysis 72.2), rs3733829 (n = 4, 440 participants, NHW; Analysis 73.2; n = 2, 46 participants, NHB; Analysis 74.1), rs7937 (n = 3, 324 participants, NHW; Analysis 75.1; n = 2, 47 participants, NHB; Analysis 76.1), rs1329650 (n = 3, 324 participants, NHW; Analysis 77.1; n = 2, 47 participants, NHB; Analysis 78.1), rs1028936 (n = 3, 324 participants, NHW; Analysis 79.1; n = 2, 47 participants, NHB; Analysis 80.1), and rs215605 (n = 3, 324 participants, NHW; Analysis 81.1; n = 2, 47 participants, NHB; Analysis 82.1).
Among those receiving bupropion, we identified no specific genotype groups that were more successful in achieving end‐of‐therapy abstinence than other groups. Additionally, we found no heterogeneity between genotype group comparisons (homozygous major vs homozygous minor compared with heterozygous vs homozygous minor, or slow vs normal) among individuals randomised to bupropion for any of the biomarkers.
Varenicline
Six‐month abstinence
Data were available for the following SNPs: rs16969968 (n = 2, 707 participants, NHW; Analysis 83.1) and rs588765 (n = 2, 699 participants; Analysis 84.1).
Among those receiving varenicline, we identified no specific genotype groups that were more successful than other groups in achieving six‐month abstinence. Additionally, we found no heterogeneity between genotype group comparisons (homozygous major vs homozygous minor compared with heterozygous vs homozygous minor, or slow vs normal) among individuals randomised to varenicline for any of the biomarkers.
End‐of‐treatment abstinence
Data were available for the following SNPs: rs16969968 (n = 2, 707 participants, NHW; Analysis 83.2) and rs588765 (n = 2, 699 participants, NHW; Analysis 84.2).
Among those receiving varenicline, we identified no specific genotype groups that were more successful than other groups in achieving end‐of‐therapy abstinence. Additionally, we found no heterogeneity between genotype group comparisons (homozygous major vs homozygous minor compared with heterozygous vs homozygous minor, or slow vs normal) among individuals randomised to varenicline for any of the biomarkers.
Bupropion + any NRT
Six‐month abstinence
No data were available for this outcome.
End‐of‐treatment abstinence
Data were available for the following SNPs: rs1051730 (n = 2, 268 participants, NHW; Analysis 85.1; n = 2, 40 participants, NHB; Analysis 86.1), rs16969968 (n = 2, 266 participants, NHW; Analysis 87.1; n = 2, 40 participants, NHB; Analysis 88.1), rs2036527 (n = 2, 267 participants, NHW; Analysis 89.1; n = 2, 40 participants, NHB; Analysis 90.1), rs3733829 (n = 2, 267 participants, NHW; Analysis 91.1; n = 2, 40 participants, NHB; Analysis 92.1), rs7937 (n = 2, 268 participants, NHW; Analysis 93.1; n = 2, 40 participants, NHB; Analysis 94.1), rs1329650 (n = 2, 266 participants, NHW; Analysis 95.1; n = 2, 40 participants, NHB; Analysis 96.1), rs1028936 (n = 2, 268 participants, NHW; Analysis 97.1; n = 2, 40 participants, NHB; Analysis 98.1), and rs215605 (n = 2, 267 participants, NHW; Analysis 99.1; n = 2, 40 participants, NHB; Analysis 100.1).
Among those receiving bupropion + any NRT, GG genotype individuals more often achieved six‐month abstinence as compared with AA genotype individuals for rs1329650 in NHW (AA vs GG, RR 0.64, 95% CI 0.43 to 0.94; Analysis 95.1), as did individuals with GG or AG genotype compared with AA genotype individuals for rs3733829 in NHB (AA vs AG or GG RR 0.36, 95% CI 0.13 to 0.99; Analysis 92.1).
We found no heterogeneity between genotype group comparisons (homozygous major vs homozygous minor compared with heterozygous vs homozygous minor, or slow vs normal) among individuals randomised to bupropion + any NRT for any of the other biomarkers.
Placebo
Six‐month abstinence
Data were available for the following SNPs: rs1051730 (n = 6, 974 participants, NHW; Analysis 101.1; n = 2, 63 participants, NHB; Analysis 102.1), rs16969968 (n = 2, 343 participants, NHW; Analysis 103.1; n = 3, 584 participants, NHB; Analysis 104.1), rs588765 (n = 5, 723 participants, NHW; Analysis 105.1; n = 2, 566 participants, NHB; Analysis 106.1), rs2036527 (n = 2, 326 participants, NHW; Analysis 107.1; n = 4, 629 participants, NHB; Analysis 108.1), DRD4 (exon 3 48 bp) (n = 3, 573 participants, NHW; Analysis 109.1), rs3733829 (n = 2, 264 participants, NHW; Analysis 110.1), SLC6A4 (Promoter) (n = 2, 151 participants, NHW; Analysis 119.1), and NMR (n = 2, 699 participants, NHW and NHB; Analysis 120.1).
Among those receiving placebo, abstinence rates were not statistically significantly different between specific genotype groups. Additionally, we found no heterogeneity between genotype group comparisons (homozygous major vs homozygous minor compared with heterozygous vs homozygous minor, or slow vs normal) among individuals randomised to placebo for any of the biomarkers.
End‐of‐treatment abstinence
Data were available for the following SNPs: rs1051730 (n = 7, 983 participants, NHW; Analysis 101.2; n = 3, 83 participants, NHB; Analysis 102.2), rs16969968 (n = 4, 445 participants, NHW; Analysis 103.2; n = 4, 596 participants, NHB; Analysis 104.2), rs588765 (n = 5, 658 participants, NHW; Analysis 105.2; n = 2, 566 participants, NHB; Analysis 106.2), rs2036527 (n = 4, 429 participants, NHW; Analysis 107.2; n = 5, 641 participants, NHB; Analysis 108.2), DRD4 (exon 3 48 bp) (n = 3, 573 participants, NHW; Analysis 109.2), rs3733829 (n = 4, 367 participants, NHW; Analysis 110.2), rs7937 (n = 3, 233 participants, NHW; Analysis 111.1; n = 2, 29 participants, NHB; Analysis 112.1), rs1329650 (n = 3, 235 participants, NHW; Analysis 113.1; n = 2, 29 participants, NHB; Analysis 114.1), rs1028936 (n = 3, 235 participants, NHW; Analysis 115.1; n = 2, 29 participants, NHB; Analysis 116.1), rs215605 (n = 3, 234 participants, NHW; Analysis 117.1; n = 2, 29 participants, NHB; Analysis 118.1), SLC6A4 (Promoter) (n = 2, 151 participants, NHW; Analysis 119.2), and NMR (n = 2, 718 participants, NHW and NHB; Analysis 120.2).
Abstinence at the end of treatment among those receiving placebo was greater among individuals with AA or GA genotype than among those with GG genotype for rs16969968 in NHB (GG vs GA or AA, RR 0.55, 95% CI 0.35 to 0.86; Analysis 104.2).
We found no heterogeneity between genotype group comparisons (homozygous major vs homozygous minor compared with heterozygous vs homozygous minor, or slow vs normal) among individuals randomised to placebo for any of the other biomarkers.
Discussion
Summary of main results
Using data from 18 randomised controlled trials (RCTs), we investigated whether a total of 13 biomarkers, including nine single‐nucleotide polymorphisms (SNPs), two variable number tandem repeats (VNTRs) (DRD4 and SLC6A4), and the nicotine metabolite ratio (NMR) modify the effects of different smoking cessation pharmacotherapies (nicotine replacement therapy (NRT), bupropion, varenicline, and combination therapy) on abstinence from smoking at six months and at end of treatment. We carried out analyses separately in non‐Hispanic whites (NHWs) and non‐Hispanic blacks (NHBs). Results showed statistical heterogeneity between genotypes for only NRT versus placebo in NHWs for rs1051730 and rs16969968 at end of treatment. In addition, rs16969968 showed evidence of heterogeneity in NHBs at six months, as well as at end of treatment, but sample sizes for some genotype subgroups were small, rendering these results unreliable. Results at rs16969968 for NRT versus placebo in NHWs and in NHBs reflect opposite directions. For the other seven SNPs evaluated in clinical trials, we found no evidence of SNP × treatment interaction. Within‐treatment arm analyses indicated that six‐month abstinence was less often achieved in NHW normal metabolisers and more often among NHB individuals with rs16969968 GG and and rs2036527 GG genotype who received NRT, and that end‐of‐treatment abstinence was less often achieved among NHWs with rs1329650 TT genotype and NHBs with rs3733829 GG or AG genotype who received bupropion + any NRT, and among NHBs with rs16969968 AA or GA genotype who received placebo. Trial results revealed no such differences for other treatments or biomarkers. In conclusion, although these findings suggest superior short‐term efficacy of NRT in specific rs1051730 and rs16969968 genotype subgroups among NHWs, lack of significant genotype differences within treatment arms limits confidence in the validity of these findings. The same holds true for results of within‐treatment analyses.
Overall completeness and applicability of evidence
For the vast majority of biomarkers for which we had data, we found no evidence that they may modify the effects of smoking cessation interventions, although evidence showed nominally significant treatment effects in specific genotype groups. Various reasons may explain this. First, identification of biomarker × treatment interactions may require large sample sizes (Cardon 2000), which were not available for the current RCTs. Traditionally, RCTs are designed to address comparative effectiveness questions regarding one or more active drugs. Genomic analyses are usually conducted retrospectively after trial completion and are rarely taken into account at design stages. Although we aimed to overcome sample size limitations of individual studies by combining data through meta‐analysis, for most comparisons we were not able to obtain summary level data that would allow us to quantitatively synthesise all available information. Second, RCTs that were included in our analyses used genotype information for a few preselected SNPs that were chosen on the basis of biological plausibility and prior genome‐wide significance with regards to smoking phenotypes. However, treatment response is likely to be under polygenic influences of biomarkers with small and large effects. Therefore, additional biomarkers across the genome may confer useful predictive information from which to identify individuals who will benefit from a particular smoking cessation intervention. To achieve this, RCTs should routinely collect and analyse DNA samples at the genome‐wide level. We refer readers to our recent reviews of progress of and recommendations for genomic studies of clinical trials of smoking cessation therapies (Chen 2017; Saccone 2017).
Quality of the evidence
Our analysis constitutes a synthesis of evidence from RCTs retrospectively evaluated for effects of smoking cessation treatments according to specific genotypes. Therefore, our results should be interpreted as evidence of heterogeneity of treatment effects (Varadhan 2013) according to specific biomarkers. Given the large number of analyses performed and assessment of the quality of evidence (GRADE) as moderate, one should interpret the results of this review with caution.
Although treatment effect heterogeneity is critical for making clinical and policy decisions, it provides only indirect evidence of the clinical utility of these genetic markers (i.e. whether measuring a particular biomarker will result in better or worse clinical outcomes).
The chr15q25.1 SNPs rs2036527, rs16969968, and rs1051730 are highly correlated (r2 = 0.90 for rs2036527 vs the latter two SNPs, and r2 = 1 vs the latter two SNPs) in individuals of European ancestry (Utah residents from North and West Europe), but are less highly correlated in African American individuals (r2 = 0.28, 0.38, and 0.46 for rs2036527 vs rs16969968, rs2036527 vs rs1051730, and rs16969968 vs rs1051730; Americans of African Ancestry in SW USA). In addition, the minor allele frequency of all three SNPs is lower among individuals of African American ancestry (from 0.40 to 0.22 for rs2036527, from 0.38 to 0.07 for rs16969968, and from 0.38 to 0.15 for rs1051730). In particular, the minor allele frequency of rs16969968 is much lower among those of African ancestry (means are < 0.01 in sub‐Saharan Africans, 0.027 in East Asians, 0.21 in Amerindians, 0.37 in Europeans, and 0.18 in South Asians; 1000 Genomes Project Consortium 2015). Therefore, one should use caution when comparing results at these chr15q25.1 SNPs between NHWs and NHBs owing to differences in linkage disequilibrium (LD) and power (due to differences in allele frequency). All three variants constitute susceptibility loci for lung cancer and are associated with measures of nicotine dependence (David 2012; Landi 2009; Liu 2010; McKay 2008; Thorgeirsson 2008;Thorgeirsson 2010;Tobacco and Genetics Consortium 2010; Zanetti 2016). rs16969968 (NM˙000745.3:c.1192G>A) is a missense variant (Asp398Asn) of the nicotinic acetylcholine receptor alpha 5 subunit gene (CHRNA5); African American individuals who are homozygous for the major allele have a higher probability of smoking abstinence with NRT than with placebo, but individuals of European ancestry who are heterozygous for rs16969968 (A/G genotype) have a higher probability of smoking abstinence with NRT than with placebo (see Results). Similarly, rs1051730 (NM˙000743.4:c.645C>T) is a synonymous substitution in the nicotinic acetylcholine receptor alpha 3 subunit gene (CHRNA3) that confers higher probability of abstinence among individuals of European ancestry who are heterozygous or homozygous for the minor allele (AA genotype) (see Results). rs2036527, found proximal to CHRNA5, is associated with nicotine dependence and with lung cancer in African Americans, but has much lower LD with the two other chr15q25.1 SNPs in African Americans than in European Americans. We did observe that NHB with GG genotype may benefit more from NRT than from placebo (see Results). Differences in SNP allele frequencies and in LD between NHW and NHB populations at chr15q25.1 (above) and differences in allele frequencies between NHW and NHB at chr19q13.2 (rs3733829) and chr10q23.32 (rs1329650), together with known differences in LD, suggest caution when results are compared between NHWs and NHBs. Given the small number of trials with available data for these and other comparisons, review findings should be interpreted with caution and should be revisited when results of future trials become available.
Potential biases in the review process
We should acknowledge that owing to the numbers of biomarkers, interventions, endpoints, and ancestry subgroups, our systematic review includes a large number of analyses. However, we did not correct for the multiplicity of comparisons because our aim was to synthesise existing evidence rather than focus on hypothesis testing. Therefore, we put greater emphasis on the estimation of effects of smoking cessation interventions than on testing for these effects (Higgins 2011). Moreover, in our review, we report all performed analyses regardless of whether they achieved statistical significance at the nominal P = 0.05 threshold; hence, we are not selectively reporting nominally significant results. Another issue of multiple comparisons relates to the selection of particular SNP × treatment interactions among many in the primary RCTs. Although most trials report only one or a few SNPs, we cannot exclude the possibility that these associations may have been selected among a number of analyses. Formally controlling for this type of multiplicity (e.g. using the approach proposed by Benjamini and Bogomolov) is difficult in the absence of detailed reporting in primary studies (Benjamini 2014). However, most RCTs had low risk of selective reporting and had specified a priori the SNPs of interest used in analyses of pharmacogenomics.
Agreements and disagreements with other studies or reviews
In European ancestry samples, minor alleles of both variants (rs1051730 and rs16969968) have been associated with increased abstinence (Bergen 2013; Chen 2012) and with decreased abstinence after NRT (Munafò 2011). Others have not been associated with abstinence (Tyndale 2015). In addition, a recent meta‐analysis revealed that neither of these SNPs was associated with smoking cessation among individuals randomised to NRT (Leung 2015). In contrast to our meta‐analysis, the studies of Leung et al evaluated only the per‐allele effect for each SNP among those randomised to NRT; these investigators did not examine effect modification, as we did in our analysis. In other words, they did not address the comparative effectiveness of NRT relative to placebo or some other smoking cessation intervention. On the other hand, in our meta‐analysis, we performed both within‐ and across‐treatment arms comparisons of effects of biomarkers to evaluate the efficacy of smoking cessation interventions in specific genotype groups. Hence, the fact that we did find evidence of treatment effect heterogeneity for both rs169969968 and rs1051730 suggests a likely gene × treatment interaction.

Flow diagram of the search and study selection.

Risk of bias summary: review authors' judgements about each risk of bias item for each study.

Risk of bias graph: review authors' judgements about each risk of bias item presented as percentages across all included studies.

Comparison 1 Active NRT vs placebo ‐ rs1051730 ‐ non‐Hispanic white, Outcome 1 Six‐Month Abstinence.

Comparison 1 Active NRT vs placebo ‐ rs1051730 ‐ non‐Hispanic white, Outcome 2 End of Treatment.

Comparison 2 Active NRT vs placebo ‐ rs16969968 ‐ non‐Hispanic white, Outcome 1 End of Treatment.
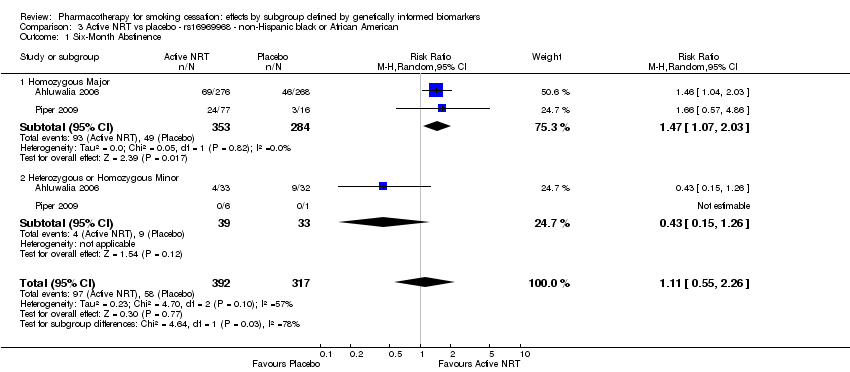
Comparison 3 Active NRT vs placebo ‐ rs16969968 ‐ non‐Hispanic black or African American, Outcome 1 Six‐Month Abstinence.

Comparison 3 Active NRT vs placebo ‐ rs16969968 ‐ non‐Hispanic black or African American, Outcome 2 End of Treatment.

Comparison 4 Active NRT vs placebo ‐ rs 588765 ‐ non‐Hispanic white, Outcome 1 End of Treatment.
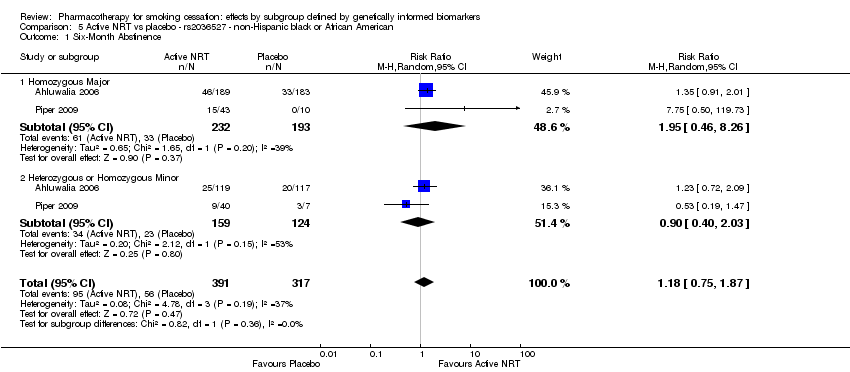
Comparison 5 Active NRT vs placebo ‐ rs2036527 ‐ non‐Hispanic black or African American, Outcome 1 Six‐Month Abstinence.
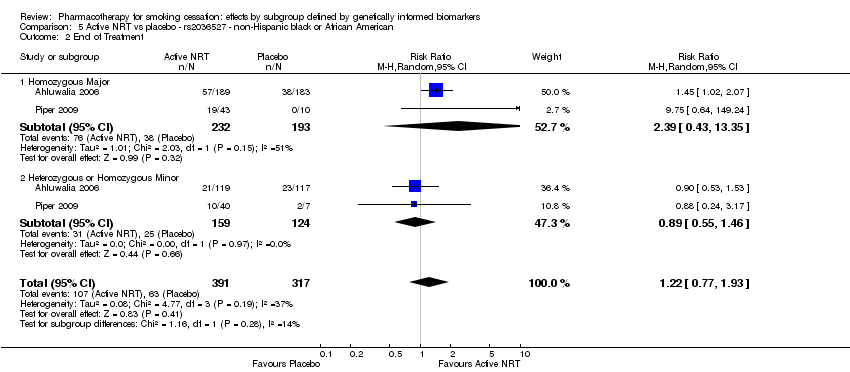
Comparison 5 Active NRT vs placebo ‐ rs2036527 ‐ non‐Hispanic black or African American, Outcome 2 End of Treatment.
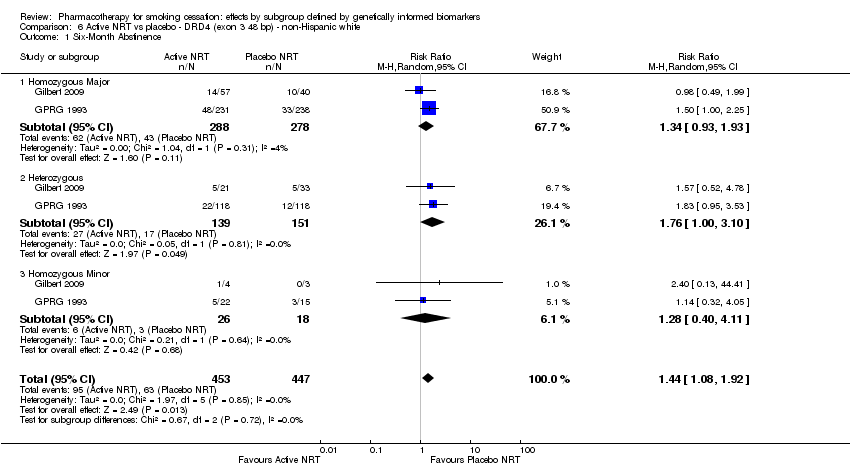
Comparison 6 Active NRT vs placebo ‐ DRD4 (exon 3 48 bp) ‐ non‐Hispanic white, Outcome 1 Six‐Month Abstinence.
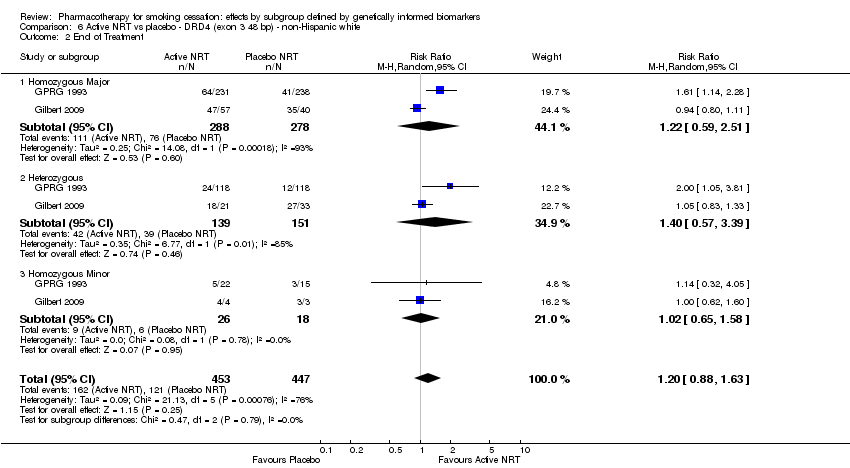
Comparison 6 Active NRT vs placebo ‐ DRD4 (exon 3 48 bp) ‐ non‐Hispanic white, Outcome 2 End of Treatment.

Comparison 7 Active NRT vs placebo ‐ NMR ‐ non‐Hispanic black and white, Outcome 1 Six‐Month Abstinence.

Comparison 7 Active NRT vs placebo ‐ NMR ‐ non‐Hispanic black and white, Outcome 2 End of Treatment.

Comparison 8 Bupropion vs placebo ‐ rs1051730 ‐ non‐Hispanic white, Outcome 1 Six‐Month Abstinence.
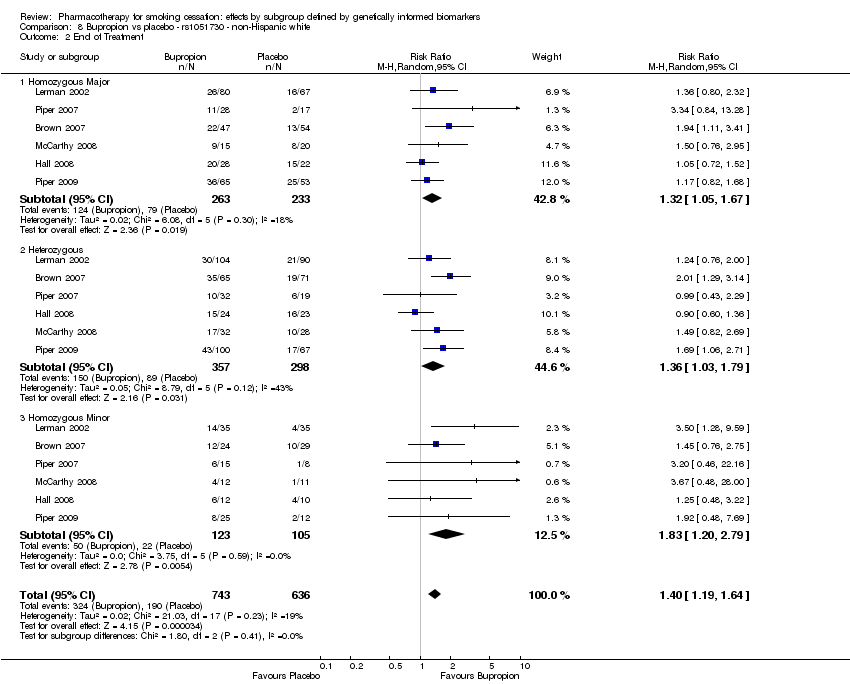
Comparison 8 Bupropion vs placebo ‐ rs1051730 ‐ non‐Hispanic white, Outcome 2 End of Treatment.

Comparison 9 Bupropion vs placebo ‐ rs1051730 ‐ non‐Hispanic black or African American, Outcome 1 Six‐Month Abstinence.

Comparison 9 Bupropion vs placebo ‐ rs1051730 ‐ non‐Hispanic black or African American, Outcome 2 End of Treatment.

Comparison 10 Bupropion vs placebo ‐ rs16969968 ‐ non‐Hispanic white, Outcome 1 End of Treatment.

Comparison 11 Bupropion vs placebo ‐ rs16969968 ‐ non‐Hispanic black or African American, Outcome 1 Six‐Month Abstinence.

Comparison 11 Bupropion vs placebo ‐ rs16969968 ‐ non‐Hispanic black or African American, Outcome 2 End of Treatment.

Comparison 12 Bupropion vs placebo ‐ rs588765 ‐ non‐Hispanic white, Outcome 1 Six‐Month Abstinence.

Comparison 12 Bupropion vs placebo ‐ rs588765 ‐ non‐Hispanic white, Outcome 2 End of Treatment.

Comparison 13 Bupropion vs placebo ‐ rs2036527 ‐ non‐Hispanic white, Outcome 1 Six‐Month Abstinence.

Comparison 13 Bupropion vs placebo ‐ rs2036527 ‐ non‐Hispanic white, Outcome 2 End of Treatment.

Comparison 14 Bupropion vs placebo ‐ rs2036527 ‐ non‐Hispanic black or African American, Outcome 1 Six‐Month Abstinence.

Comparison 14 Bupropion vs placebo ‐ rs2036527 ‐ non‐Hispanic black or African American, Outcome 2 End of Treatment.

Comparison 15 Bupropion vs placebo ‐ rs3733829 ‐ non‐Hispanic white, Outcome 1 Six‐Month Abstinence.

Comparison 15 Bupropion vs placebo ‐ rs3733829 ‐ non‐Hispanic white, Outcome 2 End of Treatment.

Comparison 16 Bupropion vs placebo ‐ rs3733829 ‐ non‐Hispanic black or African American, Outcome 1 End of Treatment.

Comparison 17 Bupropion vs placebo ‐ rs7937 ‐ non‐Hispanic white, Outcome 1 End of Treatment.

Comparison 18 Bupropion vs placebo ‐ rs7937 ‐ non‐Hispanic black or African American, Outcome 1 End of Treatment.

Comparison 19 Bupropion vs placebo ‐ rs1329650 ‐ non‐Hispanic white, Outcome 1 End of Treatment.

Comparison 20 Bupropion vs placebo ‐ rs1329650 ‐ non‐Hispanic black or African American, Outcome 1 End of Treatment.

Comparison 21 Bupropion vs placebo ‐ rs1028936 ‐ non‐Hispanic white, Outcome 1 End of Treatment.

Comparison 22 Bupropion vs placebo ‐ rs1028936 ‐ non‐Hispanic black or African American, Outcome 1 End of Treatment.
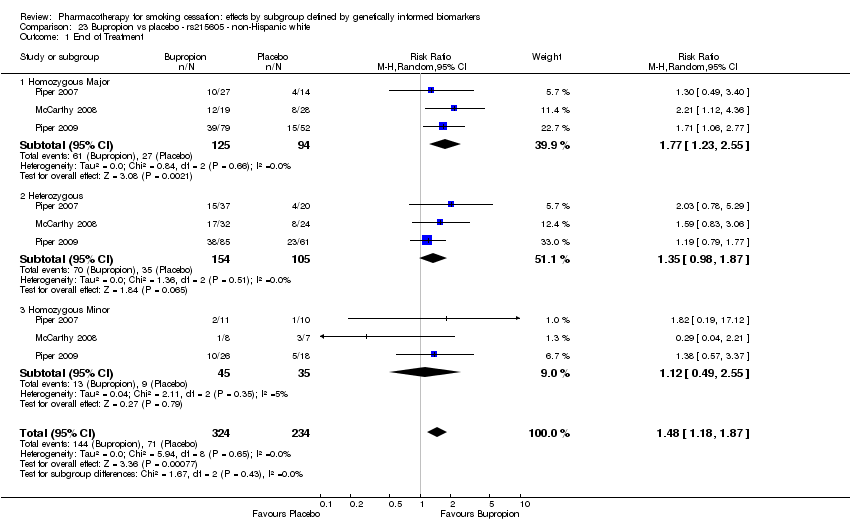
Comparison 23 Bupropion vs placebo ‐ rs215605 ‐ non‐Hispanic white, Outcome 1 End of Treatment.

Comparison 24 Bupropion vs placebo ‐ rs215605 ‐ non‐Hispanic black or African American, Outcome 1 End of Treatment.

Comparison 25 Bupropion + any NRT vs placebo ‐ rs1051730 ‐ non‐Hispanic white, Outcome 1 End of Treatment.

Comparison 26 Bupropion + any NRT vs placebo ‐ rs1051730 ‐ non‐Hispanic black or African American, Outcome 1 End of Treatment.
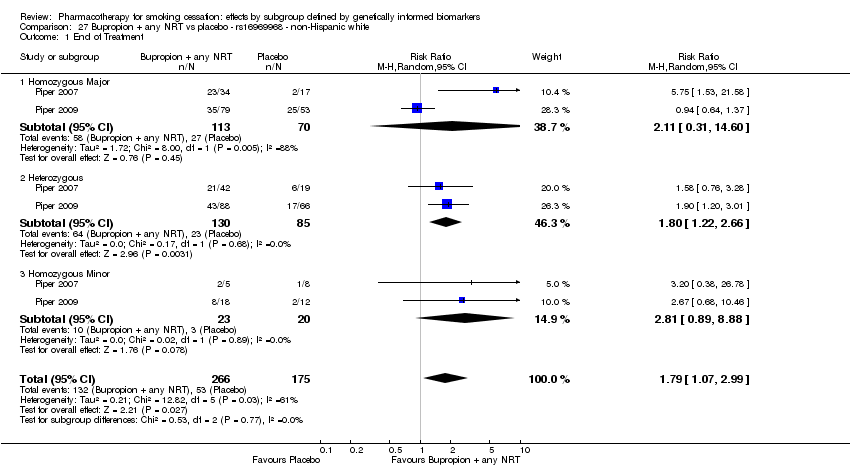
Comparison 27 Bupropion + any NRT vs placebo ‐ rs16969968 ‐ non‐Hispanic white, Outcome 1 End of Treatment.
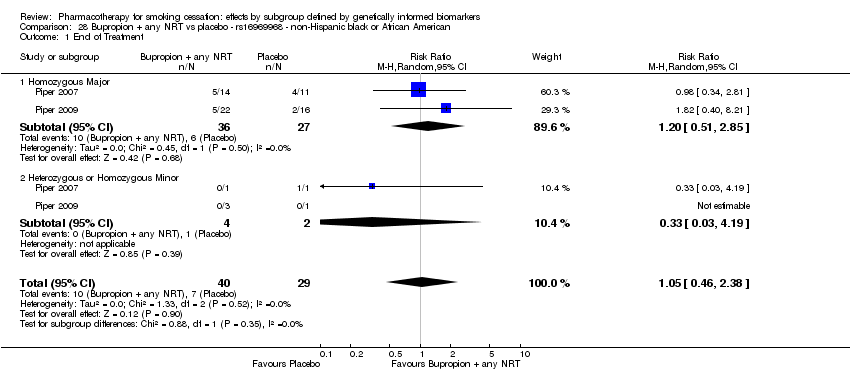
Comparison 28 Bupropion + any NRT vs placebo ‐ rs16969968 ‐ non‐Hispanic black or African American, Outcome 1 End of Treatment.
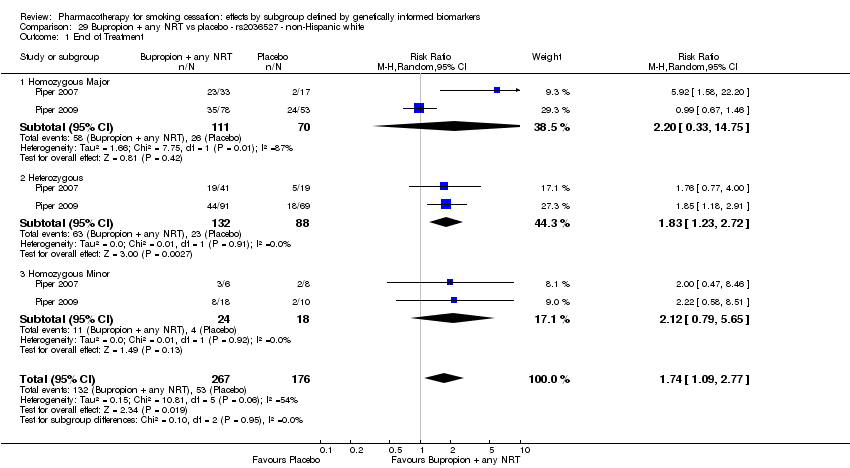
Comparison 29 Bupropion + any NRT vs placebo ‐ rs2036527 ‐ non‐Hispanic white, Outcome 1 End of Treatment.

Comparison 30 Bupropion + any NRT vs placebo ‐ rs2036527 ‐ non‐Hispanic black or African American, Outcome 1 End of Treatment.

Comparison 31 Bupropion + any NRT vs placebo ‐ rs3733829 ‐ non‐Hispanic white, Outcome 1 End of Treatment.

Comparison 32 Bupropion + any NRT vs placebo ‐ rs3733829 ‐ non‐Hispanic black or African American, Outcome 1 End of Treatment.

Comparison 33 Bupropion + any NRT vs placebo ‐ rs7937 ‐ non‐Hispanic white, Outcome 1 End of Treatment.
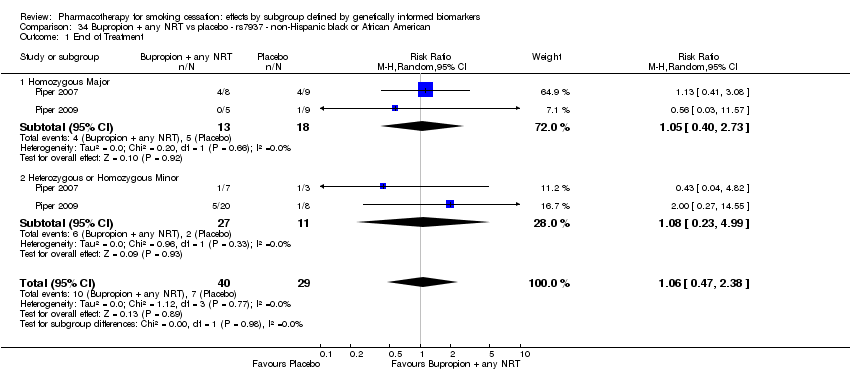
Comparison 34 Bupropion + any NRT vs placebo ‐ rs7937 ‐ non‐Hispanic black or African American, Outcome 1 End of Treatment.

Comparison 35 Bupropion + any NRT vs placebo ‐ rs1329650 ‐ non‐Hispanic white, Outcome 1 End of Treatment.

Comparison 36 Bupropion + any NRT vs placebo ‐ rs1329650 ‐ non‐Hispanic black or African American, Outcome 1 End of Treatment.
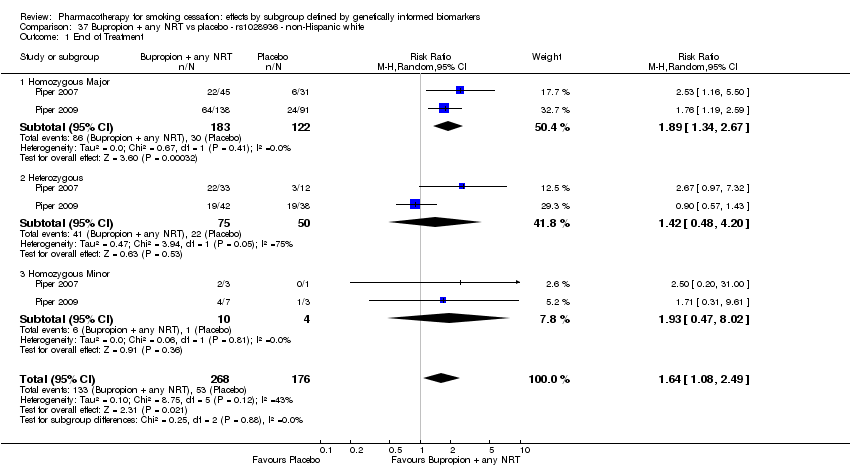
Comparison 37 Bupropion + any NRT vs placebo ‐ rs1028936 ‐ non‐Hispanic white, Outcome 1 End of Treatment.
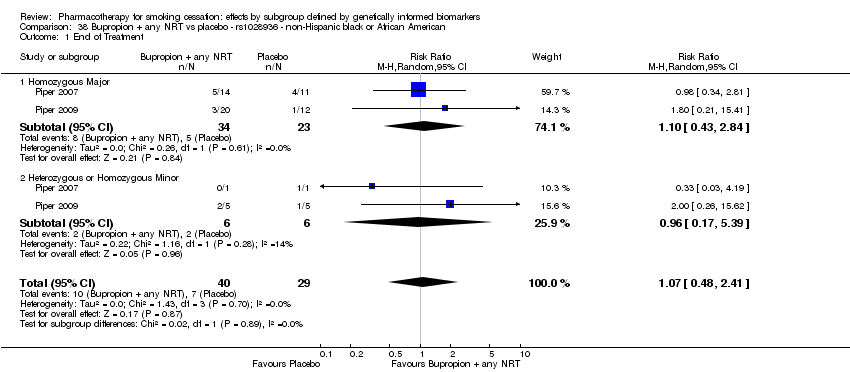
Comparison 38 Bupropion + any NRT vs placebo ‐ rs1028936 ‐ non‐Hispanic black or African American, Outcome 1 End of Treatment.

Comparison 39 Bupropion + any NRT vs placebo ‐ rs215605 ‐ non‐Hispanic white, Outcome 1 End of Treatment.
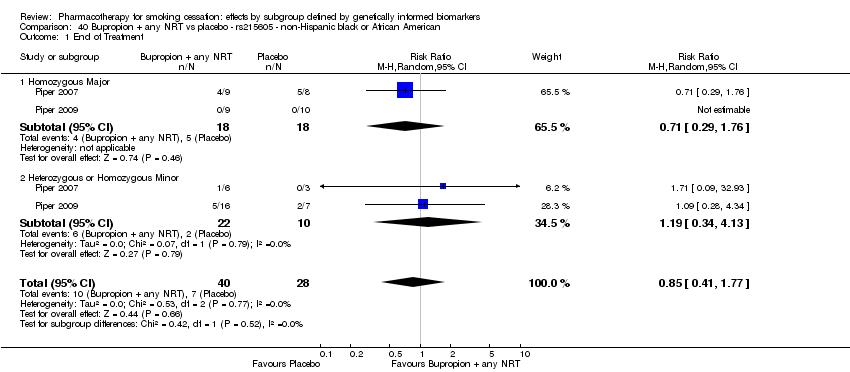
Comparison 40 Bupropion + any NRT vs placebo ‐ rs215605 ‐ non‐Hispanic black or African American, Outcome 1 End of Treatment.
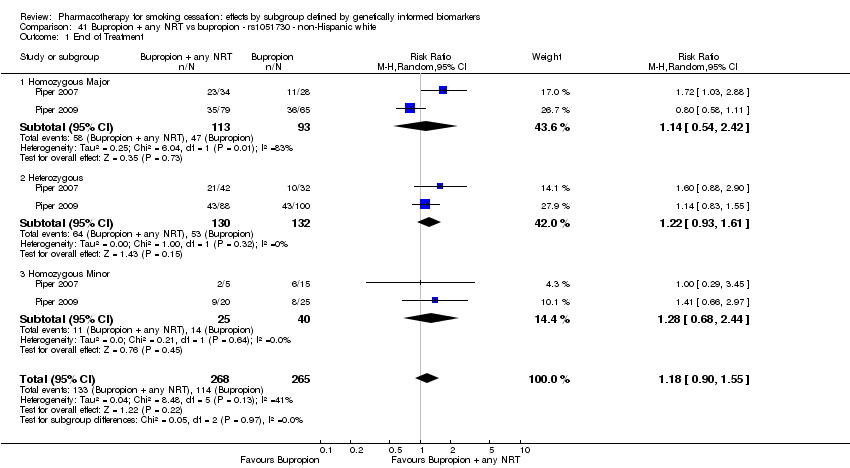
Comparison 41 Bupropion + any NRT vs bupropion ‐ rs1051730 ‐ non‐Hispanic white, Outcome 1 End of Treatment.
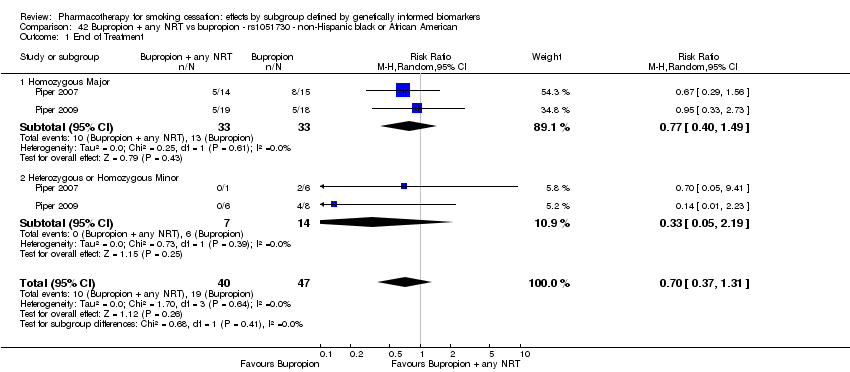
Comparison 42 Bupropion + any NRT vs bupropion ‐ rs1051730 ‐ non‐Hispanic black or African American, Outcome 1 End of Treatment.
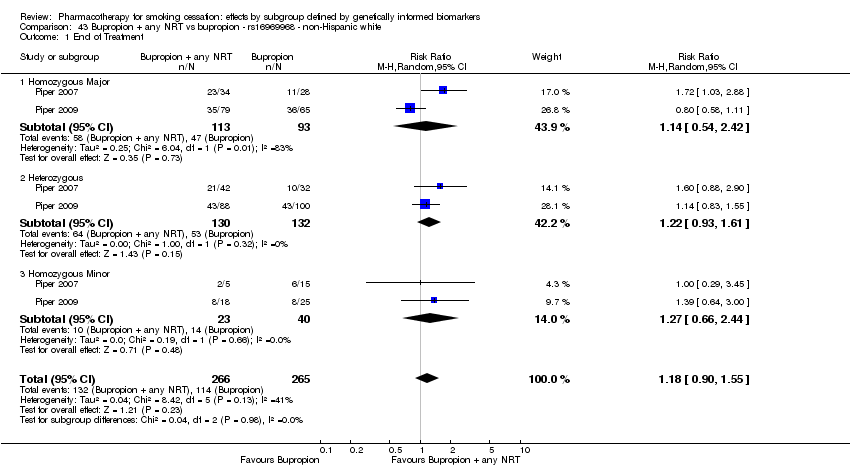
Comparison 43 Bupropion + any NRT vs bupropion ‐ rs16969968 ‐ non‐Hispanic white, Outcome 1 End of Treatment.

Comparison 44 Bupropion + any NRT vs bupropion ‐ rs16969968 ‐ non‐Hispanic black or African American, Outcome 1 End of Treatment.

Comparison 45 Bupropion + any NRT vs bupropion ‐ rs2036527 ‐ non‐Hispanic white, Outcome 1 End of Treatment.

Comparison 46 Bupropion + any NRT vs bupropion ‐ rs2036527 ‐ non‐Hispanic black or African American, Outcome 1 End of Treatment.

Comparison 47 Bupropion + any NRT vs bupropion ‐ rs3733829 ‐ non‐Hispanic white, Outcome 1 End of Treatment.

Comparison 48 Bupropion + any NRT vs bupropion ‐ rs3733829 ‐ non‐Hispanic black or African American, Outcome 1 End of Treatment.

Comparison 49 Bupropion + any NRT vs bupropion ‐ rs7937 ‐ non‐Hispanic white, Outcome 1 End of Treatment.

Comparison 50 Bupropion + any NRT vs bupropion ‐ rs7937 ‐ non‐Hispanic black or African American, Outcome 1 End of Treatment.

Comparison 51 Bupropion + any NRT vs bupropion ‐ rs1329650 ‐ non‐Hispanic white, Outcome 1 End of Treatment.

Comparison 52 Bupropion + any NRT vs bupropion ‐ rs1329650 ‐ non‐Hispanic black or African American, Outcome 1 End of Treatment.

Comparison 53 Bupropion + any NRT vs bupropion ‐ rs1028936 ‐ non‐Hispanic white, Outcome 1 End of Treatment.
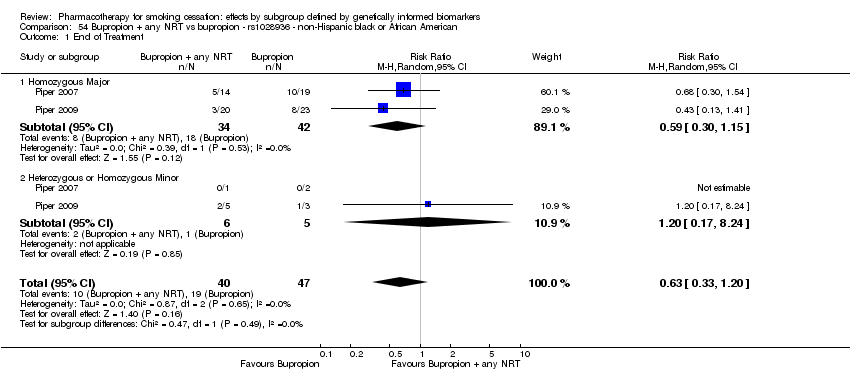
Comparison 54 Bupropion + any NRT vs bupropion ‐ rs1028936 ‐ non‐Hispanic black or African American, Outcome 1 End of Treatment.

Comparison 55 Bupropion + any NRT vs bupropion ‐ rs215605 ‐ non‐Hispanic white, Outcome 1 End of Treatment.

Comparison 56 Bupropion + any NRT vs bupropion ‐ rs215605 ‐ non‐Hispanic black or African American, Outcome 1 End of Treatment.
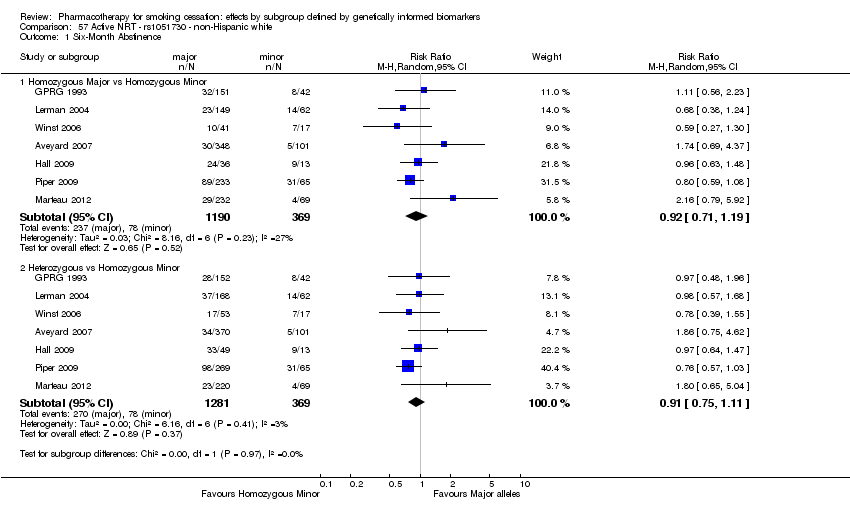
Comparison 57 Active NRT ‐ rs1051730 ‐ non‐Hispanic white, Outcome 1 Six‐Month Abstinence.
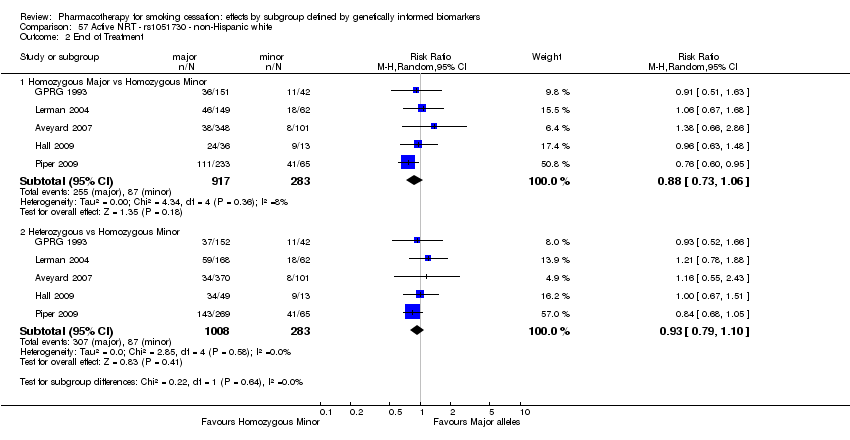
Comparison 57 Active NRT ‐ rs1051730 ‐ non‐Hispanic white, Outcome 2 End of Treatment.

Comparison 58 Active NRT ‐ rs1051730 ‐ non‐Hispanic black or African American, Outcome 1 Six‐Month Abstinence.

Comparison 59 Active NRT ‐ rs16969968 ‐ non‐Hispanic black or African American, Outcome 1 Six‐Month Abstinence.

Comparison 59 Active NRT ‐ rs16969968 ‐ non‐Hispanic black or African American, Outcome 2 End of Treatment.

Comparison 60 Active NRT ‐ rs588765 ‐ non‐Hispanic white, Outcome 1 Six‐Month Abstinence.

Comparison 60 Active NRT ‐ rs588765 ‐ non‐Hispanic white, Outcome 2 End of Treatment.
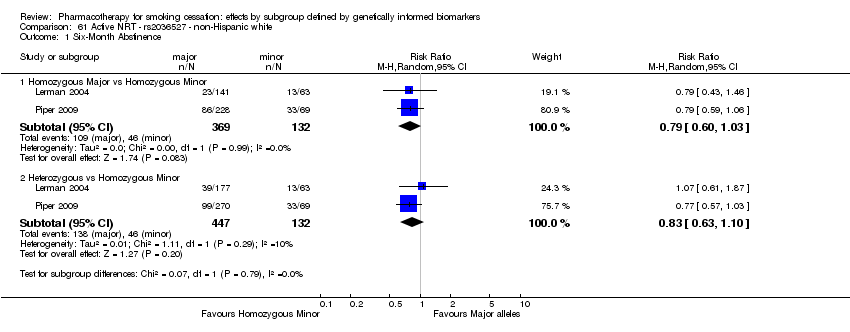
Comparison 61 Active NRT ‐ rs2036527 ‐ non‐Hispanic white, Outcome 1 Six‐Month Abstinence.

Comparison 61 Active NRT ‐ rs2036527 ‐ non‐Hispanic white, Outcome 2 End of Treatment.

Comparison 62 Active NRT ‐ rs2036527 ‐ non‐Hispanic black or African American, Outcome 1 Six‐Month Abstinence.

Comparison 62 Active NRT ‐ rs2036527 ‐ non‐Hispanic black or African American, Outcome 2 End of Treatment.
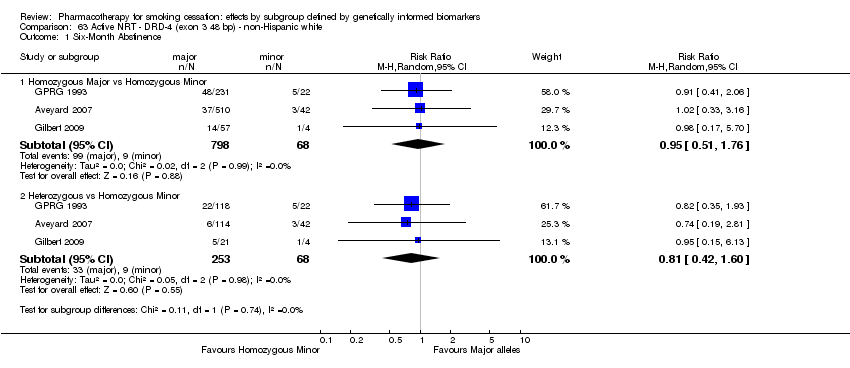
Comparison 63 Active NRT ‐ DRD‐4 (exon 3 48 bp) ‐ non‐Hispanic white, Outcome 1 Six‐Month Abstinence.
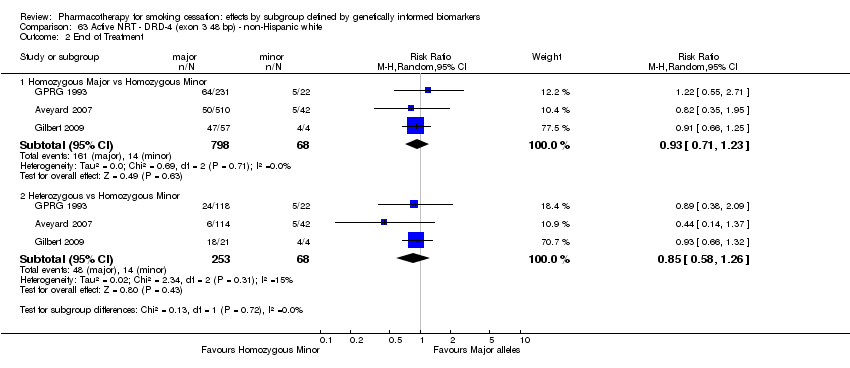
Comparison 63 Active NRT ‐ DRD‐4 (exon 3 48 bp) ‐ non‐Hispanic white, Outcome 2 End of Treatment.
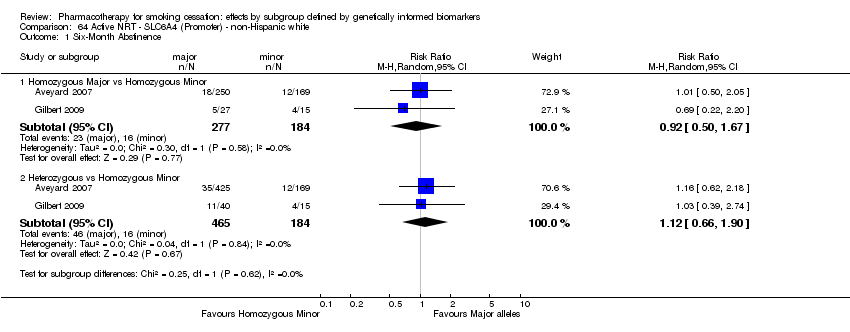
Comparison 64 Active NRT ‐ SLC6A4 (Promoter) ‐ non‐Hispanic white, Outcome 1 Six‐Month Abstinence.
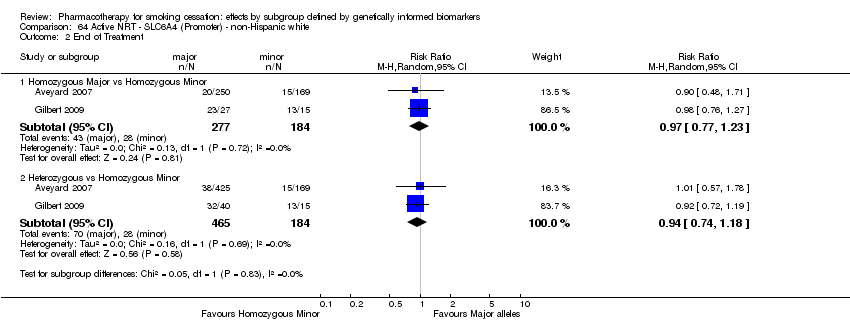
Comparison 64 Active NRT ‐ SLC6A4 (Promoter) ‐ non‐Hispanic white, Outcome 2 End of Treatment.

Comparison 65 Active NRT‐NMR ‐ non‐Hispanic white or black or African American, Outcome 1 Six‐Month Abstinence.

Comparison 65 Active NRT‐NMR ‐ non‐Hispanic white or black or African American, Outcome 2 End of Treatment.

Comparison 66 Bupropion ‐ rs1051730 ‐ non‐Hispanic white, Outcome 1 Six‐Month Abstinence.

Comparison 66 Bupropion ‐ rs1051730 ‐ non‐Hispanic white, Outcome 2 End of Treatment.

Comparison 67 Bupropion ‐ rs1051730 ‐ non‐Hispanic black or African American, Outcome 1 Six‐Month Abstinence.

Comparison 67 Bupropion ‐ rs1051730 ‐ non‐Hispanic black or African American, Outcome 2 End of Treatment.

Comparison 68 Bupropion ‐ rs16969968 ‐ non‐Hispanic white, Outcome 1 End of Treatment.
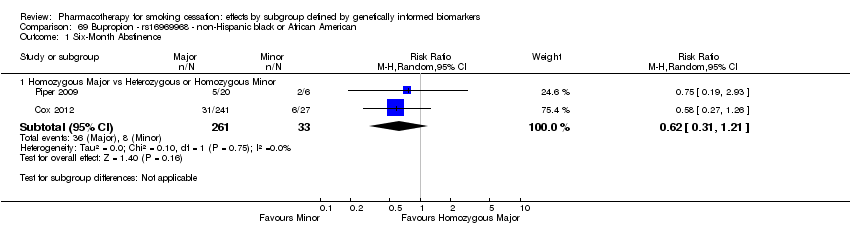
Comparison 69 Bupropion ‐ rs16969968 ‐ non‐Hispanic black or African American, Outcome 1 Six‐Month Abstinence.

Comparison 69 Bupropion ‐ rs16969968 ‐ non‐Hispanic black or African American, Outcome 2 End of Treatment.

Comparison 70 Bupropion ‐ rs588765 ‐ non‐Hispanic white, Outcome 1 Six‐Month Abstinence.

Comparison 70 Bupropion ‐ rs588765 ‐ non‐Hispanic white, Outcome 2 End of Treatment.

Comparison 71 Bupropion ‐ rs2036527 ‐ non‐Hispanic white, Outcome 1 Six‐Month Abstinence.

Comparison 71 Bupropion ‐ rs2036527 ‐ non‐Hispanic white, Outcome 2 End of Treatment.

Comparison 72 Bupropion ‐ rs2036527 ‐ non‐Hispanic black or African American, Outcome 1 Six‐Month Abstinence.

Comparison 72 Bupropion ‐ rs2036527 ‐ non‐Hispanic black or African American, Outcome 2 End of Treatment.

Comparison 73 Bupropion ‐ rs3733829 ‐ non‐Hispanic white, Outcome 1 Six‐Month Abstinence.

Comparison 73 Bupropion ‐ rs3733829 ‐ non‐Hispanic white, Outcome 2 End of Treatment.

Comparison 74 Bupropion ‐ rs3733829 ‐ non‐Hispanic black or African American, Outcome 1 End of Treatment.

Comparison 75 Bupropion ‐ rs7937 ‐ non‐Hispanic white, Outcome 1 End of Treatment.

Comparison 76 Bupropion ‐ rs7937 ‐ non‐Hispanic black or African American, Outcome 1 End of Treatment.
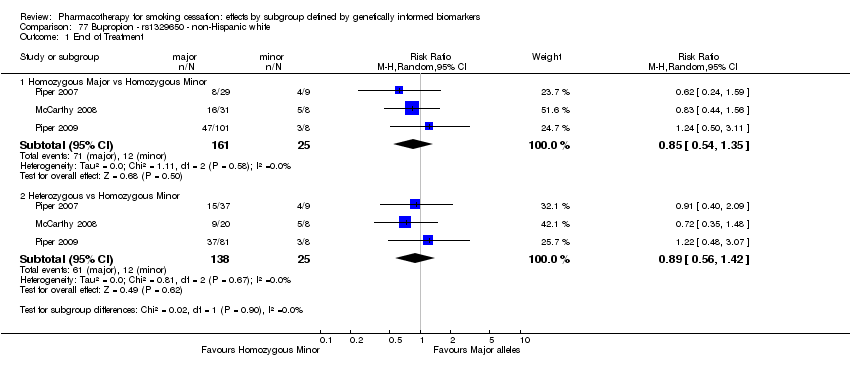
Comparison 77 Bupropion ‐ rs1329650 ‐ non‐Hispanic white, Outcome 1 End of Treatment.

Comparison 78 Bupropion ‐ rs1329650 ‐ non‐Hispanic black or African American, Outcome 1 End of Treatment.

Comparison 79 Bupropion ‐ rs1028936 ‐ non‐Hispanic white, Outcome 1 End of Treatment.

Comparison 80 Bupropion ‐ rs1028936 ‐ non‐Hispanic black or African American, Outcome 1 End of Treatment.

Comparison 81 Bupropion ‐ rs215605 ‐ non‐Hispanic white, Outcome 1 End of Treatment.
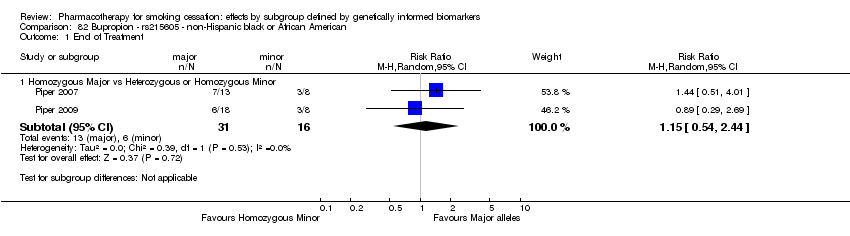
Comparison 82 Bupropion ‐ rs215605 ‐ non‐Hispanic black or African American, Outcome 1 End of Treatment.
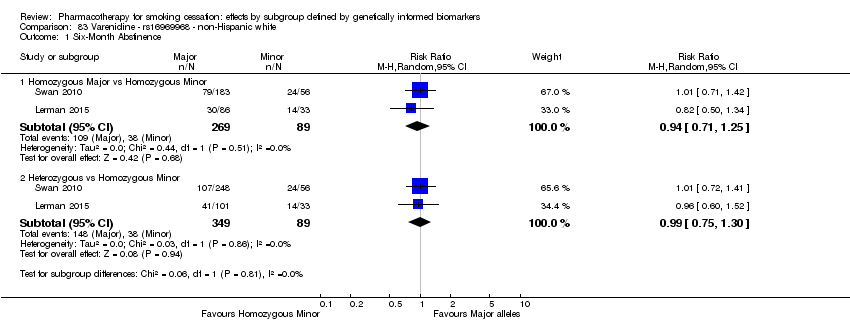
Comparison 83 Varenicline ‐ rs16969968 ‐ non‐Hispanic white, Outcome 1 Six‐Month Abstinence.
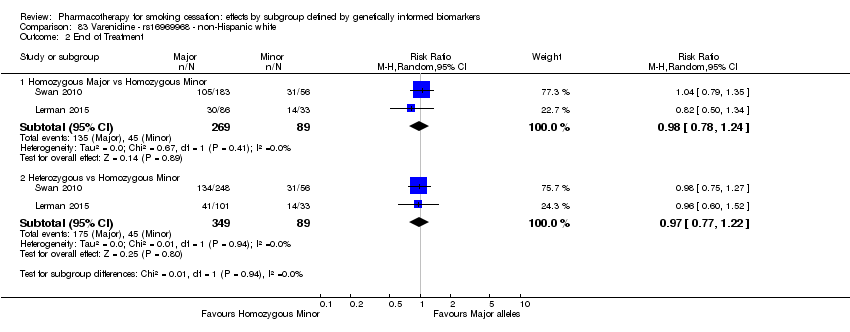
Comparison 83 Varenicline ‐ rs16969968 ‐ non‐Hispanic white, Outcome 2 End of Treatment.

Comparison 84 Varenicline ‐ rs588765 ‐ non‐Hispanic white, Outcome 1 Six‐Month Abstinence.
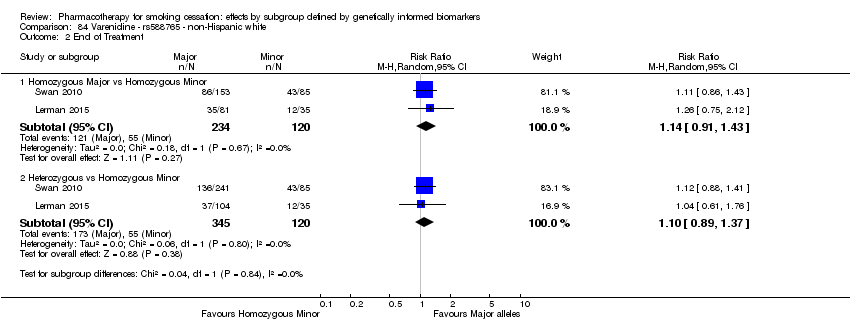
Comparison 84 Varenicline ‐ rs588765 ‐ non‐Hispanic white, Outcome 2 End of Treatment.
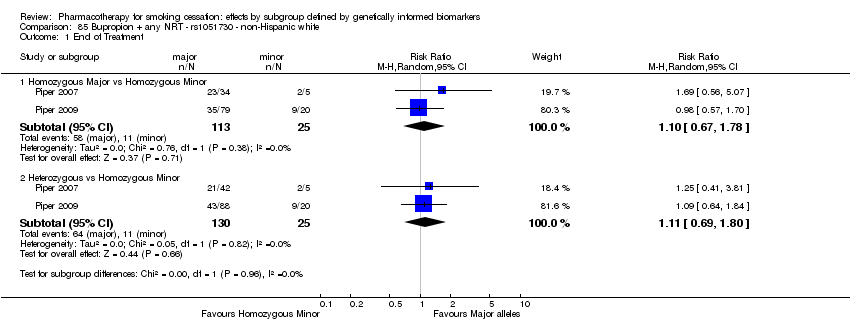
Comparison 85 Bupropion + any NRT ‐ rs1051730 ‐ non‐Hispanic white, Outcome 1 End of Treatment.

Comparison 86 Bupropion + any NRT ‐ rs1051730 ‐ non‐Hispanic black or African American, Outcome 1 End of Treatment.

Comparison 87 Bupropion + any NRT ‐ rs16969968 ‐ non‐Hispanic white, Outcome 1 End of Treatment.
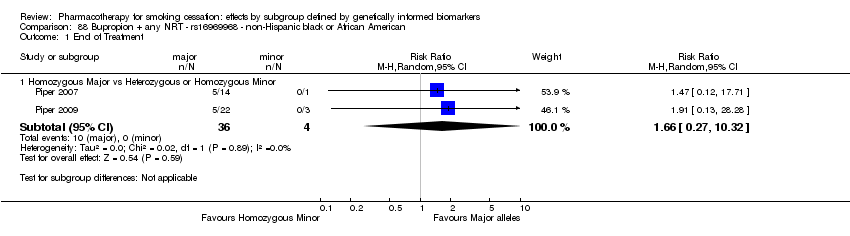
Comparison 88 Bupropion + any NRT ‐ rs16969968 ‐ non‐Hispanic black or African American, Outcome 1 End of Treatment.
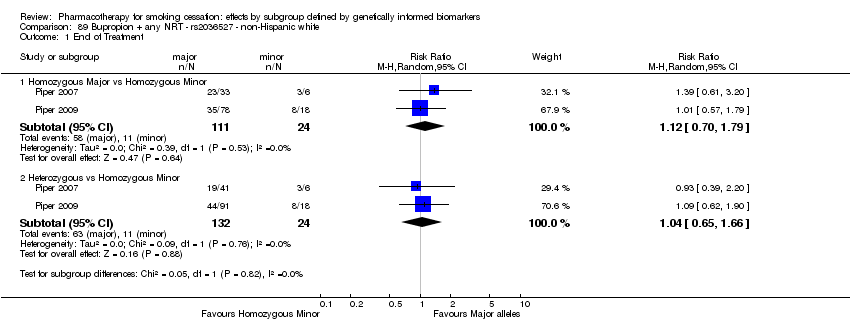
Comparison 89 Bupropion + any NRT ‐ rs2036527 ‐ non‐Hispanic white, Outcome 1 End of Treatment.
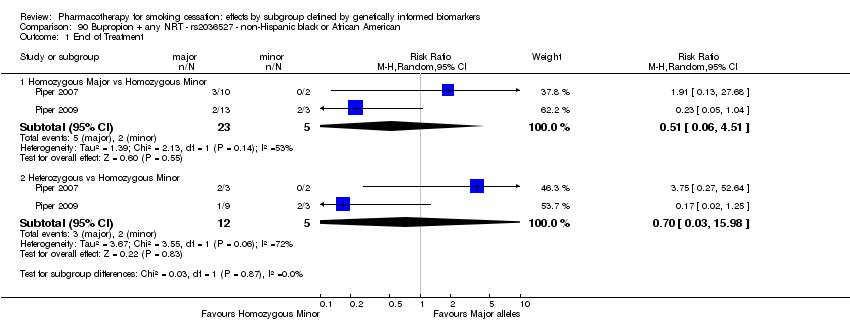
Comparison 90 Bupropion + any NRT ‐ rs2036527 ‐ non‐Hispanic black or African American, Outcome 1 End of Treatment.

Comparison 91 Bupropion + any NRT ‐ rs3733829 ‐ non‐Hispanic white, Outcome 1 End of Treatment.

Comparison 92 Bupropion + any NRT ‐ rs3733829 ‐ non‐Hispanic black or African American, Outcome 1 End of Treatment.

Comparison 93 Bupropion + any NRT ‐ rs7937 ‐ non‐Hispanic white, Outcome 1 End of Treatment.

Comparison 94 Bupropion + any NRT ‐ rs7937 ‐ non‐Hispanic black or African American, Outcome 1 End of Treatment.

Comparison 95 Bupropion + any NRT ‐ rs1329650 ‐ non‐Hispanic white, Outcome 1 End of Treatment.

Comparison 96 Bupropion + any NRT ‐ rs1329650 ‐ non‐Hispanic black or African American, Outcome 1 End of Treatment.
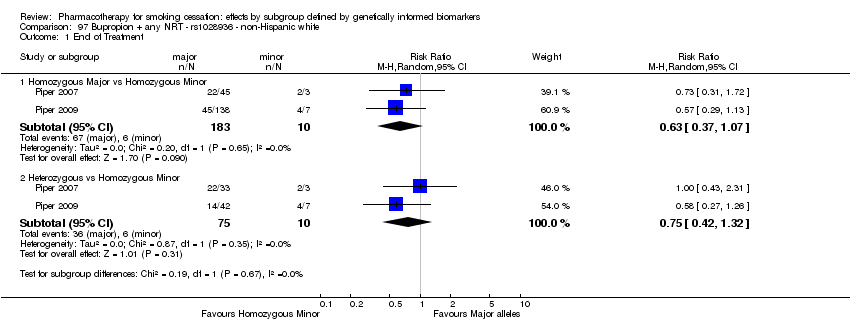
Comparison 97 Bupropion + any NRT ‐ rs1028936 ‐ non‐Hispanic white, Outcome 1 End of Treatment.

Comparison 98 Bupropion + any NRT ‐ rs1028936 ‐ non‐Hispanic black or African American, Outcome 1 End of Treatment.
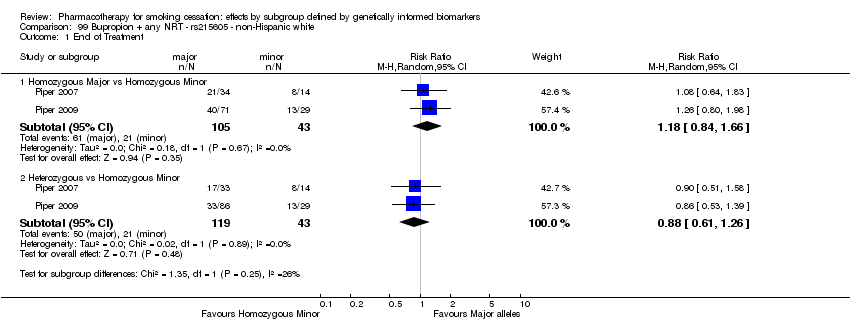
Comparison 99 Bupropion + any NRT ‐ rs215605 ‐ non‐Hispanic white, Outcome 1 End of Treatment.
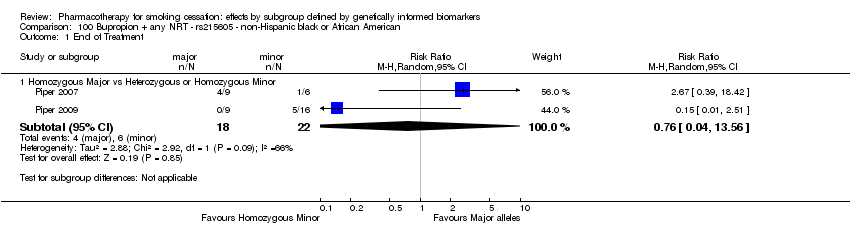
Comparison 100 Bupropion + any NRT ‐ rs215605 ‐ non‐Hispanic black or African American, Outcome 1 End of Treatment.

Comparison 101 Placebo ‐ rs1051730 ‐ non‐Hispanic white, Outcome 1 Six‐Month Abstinence.

Comparison 101 Placebo ‐ rs1051730 ‐ non‐Hispanic white, Outcome 2 End of Treatment.

Comparison 102 Placebo ‐ rs1051730 ‐ non‐Hispanic black or African American, Outcome 1 Six‐Month Abstinence.

Comparison 102 Placebo ‐ rs1051730 ‐ non‐Hispanic black or African American, Outcome 2 End of Treatment.

Comparison 103 Placebo ‐ rs16969968 ‐ non‐Hispanic white, Outcome 1 Six‐Month Abstinence.

Comparison 103 Placebo ‐ rs16969968 ‐ non‐Hispanic white, Outcome 2 End of Treatment.
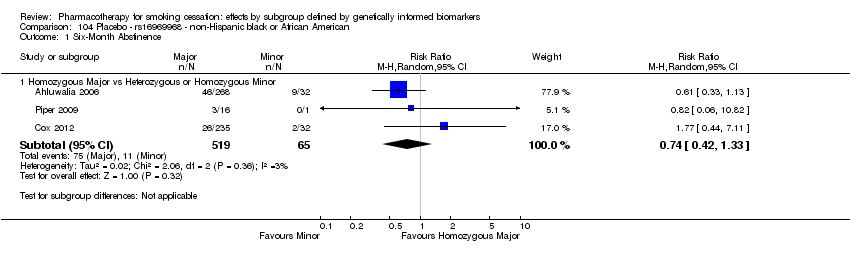
Comparison 104 Placebo ‐ rs16969968 ‐ non‐Hispanic black or African American, Outcome 1 Six‐Month Abstinence.

Comparison 104 Placebo ‐ rs16969968 ‐ non‐Hispanic black or African American, Outcome 2 End of Treatment.

Comparison 105 Placebo ‐ rs588765 ‐ non‐Hispanic white, Outcome 1 Six‐Month Abstinence.

Comparison 105 Placebo ‐ rs588765 ‐ non‐Hispanic white, Outcome 2 End of Treatment.

Comparison 106 Placebo ‐ rs588765 ‐ non‐Hispanic black or African American, Outcome 1 Six‐Month Abstinence.

Comparison 106 Placebo ‐ rs588765 ‐ non‐Hispanic black or African American, Outcome 2 End of Treatment.

Comparison 107 Placebo ‐ rs2036527 ‐ non‐Hispanic white, Outcome 1 Six‐Month Abstinence.

Comparison 107 Placebo ‐ rs2036527 ‐ non‐Hispanic white, Outcome 2 End of Treatment.

Comparison 108 Placebo ‐ rs2036527 ‐ non‐Hispanic black or African American, Outcome 1 Six‐Month Abstinence.

Comparison 108 Placebo ‐ rs2036527 ‐ non‐Hispanic black or African American, Outcome 2 End of Treatment.
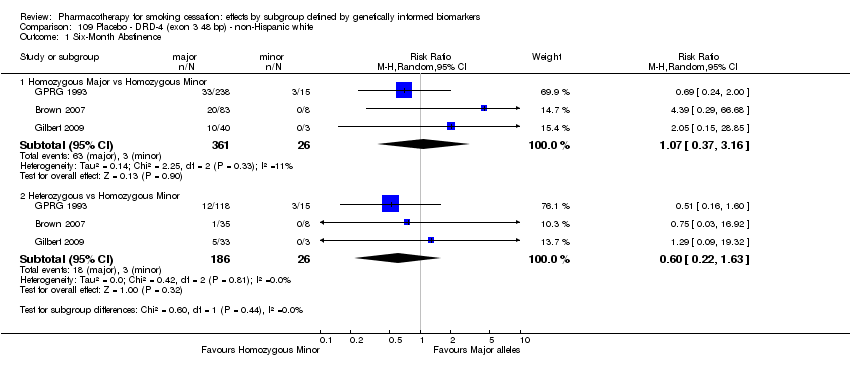
Comparison 109 Placebo ‐ DRD‐4 (exon 3 48 bp) ‐ non‐Hispanic white, Outcome 1 Six‐Month Abstinence.

Comparison 109 Placebo ‐ DRD‐4 (exon 3 48 bp) ‐ non‐Hispanic white, Outcome 2 End of Treatment.

Comparison 110 Placebo ‐ rs3733829 ‐ non‐Hispanic white, Outcome 1 Six‐Month Abstinence.

Comparison 110 Placebo ‐ rs3733829 ‐ non‐Hispanic white, Outcome 2 End of Treatment.
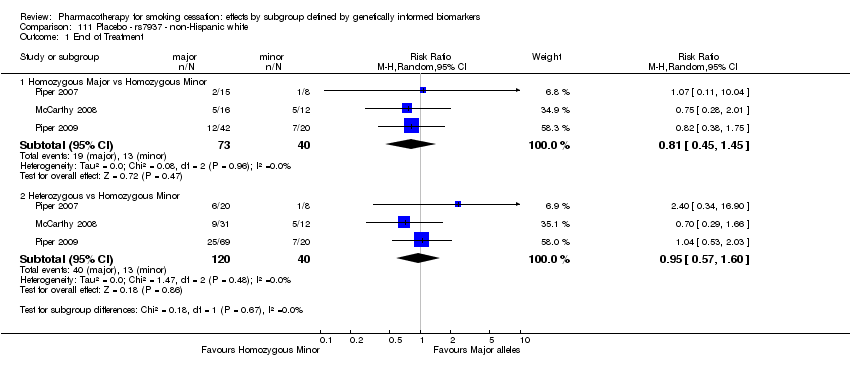
Comparison 111 Placebo ‐ rs7937 ‐ non‐Hispanic white, Outcome 1 End of Treatment.

Comparison 112 Placebo ‐ rs7937 ‐ non‐Hispanic black or African American, Outcome 1 End of Treatment.

Comparison 113 Placebo ‐ rs1329650 ‐ non‐Hispanic white, Outcome 1 End of Treatment.

Comparison 114 Placebo ‐ rs1329650 ‐ non‐Hispanic black or African American, Outcome 1 End of Treatment.

Comparison 115 Placebo ‐ rs1028936 ‐ non‐Hispanic white, Outcome 1 End of Treatment.

Comparison 116 Placebo ‐ rs1028936 ‐ non‐Hispanic black or African American, Outcome 1 End of Treatment.

Comparison 117 Placebo ‐ rs215605 ‐ non‐Hispanic white, Outcome 1 End of Treatment.

Comparison 118 Placebo ‐ rs215605 ‐ non‐Hispanic black or African American, Outcome 1 End of Treatment.
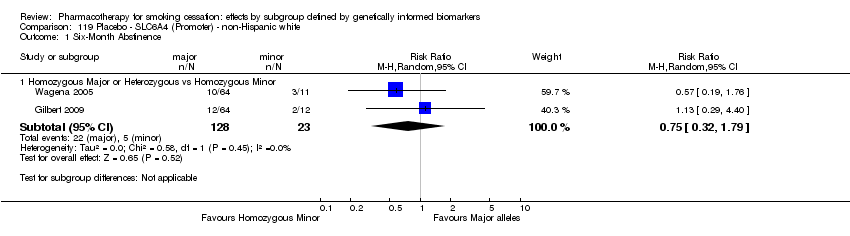
Comparison 119 Placebo ‐ SLC6A4 (Promoter) ‐ non‐Hispanic white, Outcome 1 Six‐Month Abstinence.

Comparison 119 Placebo ‐ SLC6A4 (Promoter) ‐ non‐Hispanic white, Outcome 2 End of Treatment.
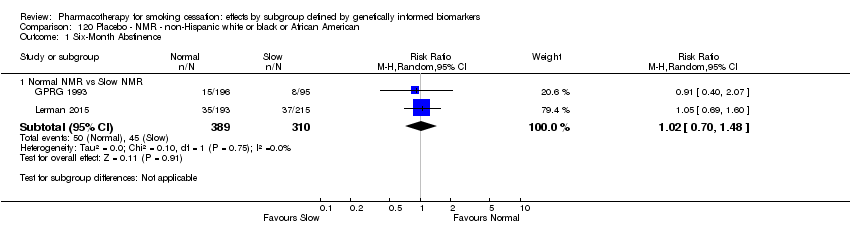
Comparison 120 Placebo ‐ NMR ‐ non‐Hispanic white or black or African American, Outcome 1 Six‐Month Abstinence.
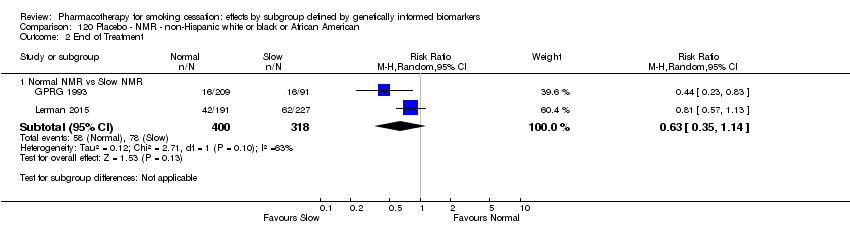
Comparison 120 Placebo ‐ NMR ‐ non‐Hispanic white or black or African American, Outcome 2 End of Treatment.
| Active NRT compared with placebo ‐ rs1051730 ‐ non‐Hispanic white for smoking cessationa | ||||||
| Patient or population: people who smoke | ||||||
| Outcomes | Anticipated absolute effects* (95% CI) | Relative effect | No. of participants | Quality of the evidence | Comments | |
| Risk with active NRT ‐ rs1051730 ‐ non‐Hispanic white | Risk with placebo | |||||
| Abstinence at end of treatment | Study population | RR 1.63 | 1391 | ⊕⊕⊕⊝ | Pooled result across studies, including all genotypes. Between‐genotype group heterogeneity P value = 0.004 (see results for individual subgroups in below rows) | |
| 327 per 1000 | 200 per 1000 | |||||
| Abstinence at end of treatment ‐ homozygous major | Study population | RR 1.09 | 582 | ⊕⊕⊝⊝ | For participants with homozygous major genotype, low‐quality evidence suggests no effect. | |
| 286 per 1000 | 263 per 1000 | |||||
| Abstinence at end of treatment ‐ heterozygous | Study population | RR 2.13 | 631 | ⊕⊕⊕⊝ | For participants with heterozygous genotype, moderate‐quality evidence shows effect in favour intervention. | |
| 335 per 1000 | 157 per 1000 | |||||
| Abstinence at end of treatment ‐ homozygous minor | Study population | RR 2.18 | 178 | ⊕⊕⊝⊝ | For participants with homozygous minor genotype, low‐quality evidence shows effect in favour intervention. | |
| 338 per 1000 | 155 per 1000 | |||||
| *The risk in the intervention group (and its 95% confidence interval) is based on the assumed risk in the comparison group and the relative effect of the intervention (and its 95% CI). | ||||||
| GRADE Working Group grades of evidence | ||||||
| aThis is the first of seven 'Summary of findings' tables for the main comparison. For a complete list, see the 'Additional summary of findings' section. bNot downgraded owing to inconsistency, as large statistical heterogeneity can be explained by differences between genotypes. cDowngraded one level owing to risk of bias: high potential for selection bias in GRPG 1993 due to low fraction of genotyped participants. dDowngraded one level owing to imprecision: optimal information size criterion is met, but 95% CIs include the null effect and fail to exclude important benefit or important harm. eDowngraded one level owing to imprecision: optimal information size criterion is not met in this stratum. Counts in this stratum are smaller than in a single adequately powered trial. | ||||||
| Active NRT compared with placebo ‐ rs16969968 ‐ non‐Hispanic white for smoking cessation | ||||||
| Patient or population: people who smoke | ||||||
| Outcomes | Anticipated absolute effects* (95% CI) | Relative effect | No. of participants | Quality of the evidence | Comments | |
| Risk with placebo ‐ rs16969968 ‐ non‐Hispanic white | Risk with active NRT | |||||
| End of treatment | Study population | RR 1.38 | 1127 | ⊕⊕⊕⊝ | Pooled result across studies, including all genotypes. Between‐genotype group heterogeneity P value = 0.03 (see results for individual subgroups in below rows) | |
| 251 per 1000 | 346 per 1000 | |||||
| End of treatment ‐ homozygous major | Study population | RR 1.01 | 449 | ⊕⊕⊝⊝ | For participants with homozygous major genotype, low‐quality evidence suggests no effect. | |
| 333 per 1000 | 337 per 1000 | |||||
| End of treatment ‐ heterozygous | Study population | RR 1.85 | 550 | ⊕⊕⊕⊕ | For participants with heterozygous genotype, high‐quality evidence shows effect in favour of intervention. | |
| 193 per 1000 | 358 per 1000 | |||||
| End of treatment ‐ homozygous minor | Study population | RR 1.80 | 128 | ⊕⊕⊝⊝ | For participants with homozygous minor genotype, low‐quality evidence shows that point estimate favours intervention, but 95% CI crosses null effect. | |
| 233 per 1000 | 420 per 1000 | |||||
| *The risk in the intervention group (and its 95% confidence interval) is based on the assumed risk in the comparison group and the relative effect of the intervention (and its 95% CI). | ||||||
| GRADE Working Group grades of evidence. | ||||||
| aDowngraded one level owing to imprecision: Optimal information size criterion is met, but 95% CIs include the null effect and fail to exclude important benefit or important harm. bNot downgraded owing to inconsistency, as large statistical heterogeneity can be explained by differences in genotypes. cDowngraded one level owing to inconsistency: unexplained heterogeneity. dDowngraded two levels owing to serious imprecision: optimal information size criterion not met, and 95% CIs include the null effect and fail to exclude important benefit or important harm. | ||||||
| Active NRT compared with placebo ‐ rs16969968 ‐ non‐Hispanic black or African American for smoking cessation | ||||||
| Patient or population: people who smoke | ||||||
| Outcomes | Anticipated absolute effects* (95% CI) | Relative effect | No. of participants | Quality of the evidence | Comments | |
| Risk with active NRT ‐ rs16969968 ‐ non‐Hispanic black or African American | Risk with placebo | |||||
| Abstinence at 6 months | Study population | RR 1.11 | 709 | ⊕⊕⊕⊝ | Pooled result across studies, including all genotypes. Between‐genotype group heterogeneity P value = 0.03 (see results for individual subgroups in below rows) | |
| 203 per 1000 | 183 per 1000 | |||||
| Abstinence at 6 months ‐ homozygous major | Study population | RR 1.47 | 637 | ⊕⊕⊕⊕ | For participants with homozygous major genotype, high‐quality evidence shows effect in favour of intervention. | |
| 254 per 1000 | 173 per 1000 | |||||
| Abstinence at 6 months ‐ heterozygous or homozygous minor | Study population | RR 0.43 | 72 | ⊕⊕⊝⊝ | For participants with heterozygous or homozygous minor genotype, point estimate favours control, but 95% CI crosses null effect. | |
| 117 per 1000 | 273 per 1000 | |||||
| Abstinence at end of treatment | Study population | RR 1.03 | 709 | ⊕⊕⊕⊝ | Pooled result across studies, including all genotypes. Between‐genotype group heterogeneity P value = 0.003 (see results for individual subgroups in below rows) | |
| 201 per 1000 | 196 per 1000 | |||||
| Abstinence at end of treatment ‐ homozygous major | Study population | RR 1.57 | 637 | ⊕⊕⊕⊕ | For participants with homozygous major genotype, high‐quality evidence shows effect in favour of intervention. | |
| 276 per 1000 | 176 per 1000 | |||||
| Abstinence at end of treatment ‐ heterozygous or homozygous minor | Study population | RR 0.29 | 72 | ⊕⊕⊕⊝ | For participants with heterozygous or homozygous minor genotype, moderate‐quality evidence shows effect in favour of control. | |
| 105 per 1000 | 364 per 1000 | |||||
| *The risk in the intervention group (and its 95% confidence interval) is based on the assumed risk in the comparison group and the relative effect of the intervention (and its 95% CI). | ||||||
| GRADE Working Group grades of evidence. | ||||||
| aNot downgraded owing to inconsistency, as large statistical heterogeneity can be explained by differences in genotypes. bDowngraded one level owing to imprecision: Optimal information size criterion is met, but 95% CIs include the null effect and fail to exclude important benefit or important harm. cDowngraded two levels owing to serious imprecision: optimal information size criterion not met, but 95% CIs include the null effect and fail to exclude important benefit or important harm. dDowngraded one level owing to imprecision: low number of events; optimal information size criterion not met. | ||||||
| Active NRT compared with placebo ‐ rs 588765 ‐ non‐Hispanic white for smoking cessation | ||||||
| Patient or population: people who smoke | ||||||
| Outcomes | Anticipated absolute effects* (95% CI) | Relative effect | No. of participants | Quality of the evidence | Comments | |
| Risk with placebo ‐ rs 588765 ‐ non‐Hispanic white | Risk with active NRT | |||||
| End of treatment | Study population | RR 1.33 | 923 | ⊕⊕⊕⊝ | Pooled result across studies, including all genotypes. Between‐genotype group heterogeneity P value = 0.92 (see results for individual subgroups in below rows) | |
| 211 per 1000 | 281 per 1000 | |||||
| End of treatment ‐ homozygous major | Study population | RR 1.39 | 296 | ⊕⊕⊝⊝ | For participants with homozygous major genotype, low‐quality evidence suggests that point estimate favours intervention, but 95% CI crosses null effect. | |
| 208 per 1000 | 288 per 1000 | |||||
| End of treatment ‐ heterozygous | Study population | RR 1.27 | 469 | ⊕⊕⊝⊝ | For participants with heterozygous genotype, point estimate favours intervention, but 95% CI crosses null effect. | |
| 208 per 1000 | 265 per 1000 | |||||
| End of treatment ‐ homozygous minor | Study population | RR 1.50 | 158 | ⊕⊕⊝⊝ | For participants with homozygous minor genotype, low‐quality evidence suggests that point estimate favours intervention, but 95% CI crosses null effect. | |
| 226 per 1000 | 339 per 1000 | |||||
| *The risk in the intervention group (and its 95% confidence interval) is based on the assumed risk in the comparison group and the relative effect of the intervention (and its 95% CI). | ||||||
| GRADE Working Group grades of evidence. | ||||||
| aDowngraded one level owing to imprecision: low number of events; optimal information size criterion not met. bDowngraded two levels owing to serious imprecision: optimal information size criterion not met, but 95% CIs include the null effect and fail to exclude important benefit or important harm. | ||||||
| Active NRT compared with placebo ‐ rs2036527 ‐ non‐Hispanic black or African American for smoking cessation | ||||||
| Patient or population: people who smoke | ||||||
| Outcomes | Anticipated absolute effects* (95% CI) | Relative effect | No. of participants | Quality of the evidence | Comments | |
| Risk with placebo ‐ rs2036527 ‐ non‐Hispanic black or African American | Risk with active NRT | |||||
| 6‐Month abstinence | Study population | RR 1.18 | 708 | ⊕⊕⊝⊝ | Pooled result across studies, including all genotypes. Between‐genotype group heterogeneity P value = 0.19 (see results for individual subgroups in below rows) | |
| 177 per 1000 | 208 per 1000 | |||||
| 6‐Month abstinence ‐ homozygous major | Study population | RR 1.95 | 425 | ⊕⊝⊝⊝ | For participants with homozygous major genotype, very low‐quality evidence suggests that point estimate favours intervention, but 95% CI crosses null effect. | |
| 171 per 1000 | 333 per 1000 | |||||
| 6‐Month abstinence ‐ heterozygous or homozygous minor | Study population | RR 0.90 | 283 | ⊕⊕⊕⊝ | For participants with heterozygous or homozygous minor genotype, moderate‐quality evidence shows no effect. | |
| 185 per 1000 | 167 per 1000 | |||||
| End of treatment | Study population | RR 1.22 | 708 | ⊕⊕⊝⊝ | Pooled results across studies, including all genotypes. Between‐genotype group heterogeneity P value = 0.19 (see results for individual subgroups in below rows) | |
| 199 per 1000 | 242 per 1000 | |||||
| End of treatment ‐ homozygous major | Study population | RR 2.39 | 425 | ⊕⊕⊝⊝ | For participants with homozygous major genotype, low‐quality evidence suggests that point estimate favours intervention, but 95% CI crosses null effect. | |
| 197 per 1000 | 471 per 1000 | |||||
| End of treatment ‐ heterozygous or homozygous minor | Study population | RR 0.89 | 283 | ⊕⊕⊕⊝ | For participants with heterozygous or homozygous minor genotype, moderate‐quality evidence shows no effect. | |
| 202 per 1000 | 179 per 1000 | |||||
| *The risk in the intervention group (and its 95% confidence interval) is based on the assumed risk in the comparison group and the relative effect of the intervention (and its 95% CI). | ||||||
| GRADE Working Group grades of evidence. | ||||||
| cDowngraded one level owing to imprecision: low number of events; optimal information size criterion not met. | ||||||
| Active NRT compared with placebo ‐ DRD4 (exon 3 48 bp) ‐ non‐Hispanic white for smoking cessation | ||||||
| Patient or population: people who smoke | ||||||
| Outcomes | Anticipated absolute effects* (95% CI) | Relative effect | No. of participants | Quality of the evidence | Comments | |
| Risk with placebo ‐ DRD4 (exon 3 48 bp) ‐ non‐Hispanic white | Risk with active NRT | |||||
| 6‐Month abstinence | Study population | RR 1.44 | 900 | ⊕⊕⊝⊝ | Pooled result across studies, including all genotypes. Between‐genotype group heterogeneity P value = 0.85 (see results for individual subgroups in below rows) | |
| 141 per 1000 | 203 per 1000 | |||||
| 6‐month abstinence ‐ homozygous major | Study population | RR 1.34 | 566 | ⊕⊝⊝⊝ | For participants with homozygous major genotype, very low‐quality evidence suggests that point estimate favours intervention, but 95% CI crosses null effect. | |
| 155 per 1000 | 207 per 1000 | |||||
| 6‐Month abstinence ‐ heterozygous | Study population | RR 1.76 | 290 | ⊕⊕⊝⊝ | For participants with heterozygous genotype, low‐quality evidence suggests effect in favour of intervention. | |
| 113 per 1000 | 198 per 1000 | |||||
| 6‐Month abstinence ‐ homozygous minor | Study population | RR 1.28 | 44 | ⊕⊝⊝⊝ | For participants with homozygous minor genotype, very low‐quality evidence suggests that point estimate favours intervention, but 95% CI crosses null effect. | |
| 167 per 1000 | 213 per 1000 | |||||
| End of treatment | Study population | RR 1.20 | 900 | ⊕⊕⊝⊝ | Pooled result across studies, including all genotypes. Between‐genotype group heterogeneity P value = 0.78 (see results for individual subgroups in below rows) | |
| 271 per 1000 | 325 per 1000 | |||||
| End of treatment ‐ homozygous major | Study population | RR 1.22 | 566 | ⊕⊝⊝⊝ | For participants with homozygous major genotype, very low‐quality evidence suggests that point estimate favours intervention, but 95% CI crosses null effect. | |
| 273 per 1000 | 334 per 1000 | |||||
| End of treatment ‐ heterozygous | Study population | RR 1.40 | 290 | ⊕⊝⊝⊝ | For participants with heterozygous genotype, very low‐quality evidence suggests that point estimate favours intervention, but 95% CI crosses null effect. | |
| 258 per 1000 | 362 per 1000 | |||||
| End of treatment ‐ homozygous minor | Study population | RR 1.02 | 44 | ⊕⊕⊝⊝ | For participants with homozygous minor genotype, low‐quality evidence suggests no effect. | |
| 333 per 1000 | 340 per 1000 | |||||
| *The risk in the intervention group (and its 95% confidence interval) is based on the assumed risk in the comparison group and the relative effect of the intervention (and its 95% CI). | ||||||
| GRADE Working Group grades of evidence. | ||||||
| aDowngraded one level owing to high risk of bias: high risk of selection bias in GRPG 1993 due to low fraction of genotyped participants. bDowngraded one level owing to imprecision: low number of events; optimal information size criterion not met. cDowngraded one level owing to imprecision: 95% CIs include the null effect and fail to exclude important benefit or important harm. | ||||||
| Active NRT compared with placebo ‐ NMR ‐ non‐Hispanic black and white for smoking cessation | ||||||
| Patient or population: people who smoke | ||||||
| Outcomes | Anticipated absolute effects* (95% CI) | Relative effect | No. of participants | Quality of the evidence | Comments | |
| Risk with placebo ‐ NMR ‐ non‐Hispanic black and white | Risk with active NRT | |||||
| 6‐Month abstinence | Study population | RR 1.51 | 1417 | ⊕⊕⊕⊝ | Pooled result across studies, including all genotypes. Between‐genotype group heterogeneity: P value = 0.29 (see results for individual subgroups in below rows) | |
| 99 per 1000 | 149 per 1000 | |||||
| 6‐Month abstinence ‐ slow NMR | Study population | RR 1.82 | 628 | ⊕⊕⊕⊝ | For participants with slow NMR genotype, moderate‐quality evidence favours intervention. | |
| 116 per 1000 | 211 per 1000 | |||||
| 6‐Month abstinence ‐ normal NMR | Study population | RR 1.21 | 789 | ⊕⊕⊝⊝ | For participants with normal NMR genotype, point estimate favours intervention, but 95% CI crosses null effect. | |
| 85 per 1000 | 103 per 1000 | |||||
| End of treatment | Study population | RR 1.51 | 1417 | ⊕⊕⊕⊝ | Pooled result across studies, including all genotypes. Between‐genotype group heterogeneity: P value = 0.52 (see results for individual subgroups in below rows) | |
| 136 per 1000 | 205 per 1000 | |||||
| End of treatment ‐ slow NMR | Study population | RR 1.61 | 847 | ⊕⊕⊕⊝ | For participants with slow NMR genotype, moderate‐quality evidence favours intervention. | |
| 127 per 1000 | 204 per 1000 | |||||
| End of treatment ‐ normal NMR | Study population | RR 1.49 | 570 | ⊕⊕⊝⊝ | For participants with normal NMR genotype, point estimate favours intervention, but 95% CI crosses null effect. | |
| 149 per 1000 | 222 per 1000 | |||||
| *The risk in the intervention group (and its 95% confidence interval) is based on the assumed risk in the comparison group and the relative effect of the intervention (and its 95% CI). | ||||||
| GRADE Working Group grades of evidence. | ||||||
| aDowngraded one level owing to risk of bias: 755/1532 (49%) participants from Patch Trial (GPRG 1993) were genotyped, which could contribute to selection bias. bDowngraded one level owing to imprecision: optimal information size criterion is met, but 95% CIs include the null effect and fail to exclude important benefit or important harm. | ||||||
| Genetic term | Explanation |
| Single‐nucleotide polymorphism (SNP) | A single base pair change in the DNA sequence at a particular point compared with the “common” or “wild‐type” sequence (Attia 2009) Most common form of genetic variation in the genome, in which a single‐base substitution has created 2 forms of a DNA sequence that differ by a single nucleotide (Pearson 2008) |
| Alleles | Alternate forms of a gene or chromosomal locus that differ in DNA sequence (Pearson 2008) |
| Genome‐wide association study (GWAS) | Any study of genetic variation across the entire human genome designed to identify genetic association with observable traits or the presence or absence of a disease, usually referring to studies with genetic marker density of 100,000 or more to represent a large proportion of variation in the human genome (Pearson 2008) |
| Genotype | The genetic constitution of an individual, either overall or at a specific gene (Attia 2009) |
| Hardy‐Weinberg equilibrium (HWE) | Population distribution of 2 alleles (with frequencies p and q) such that the distribution is stable from generation to generation and genotypes occur at frequencies of p2, 2pq, and q2 for the major allele homozygote, heterozygote, and minor allele homozygote, respectively (Pearson 2008) |
| Linkage disequilibrium | Measure of association between 2 alleles located near each other on a chromosome, such that they are inherited together more frequently than would be expected by chance (Pearson 2008) |
| Loci | The site(s) on a chromosome at which the gene for a particular trait is located on a gene at which a particular SNP is located (Attia 2009) |
| Minor allele | The allele of a biallelic polymorphism that is less frequent in the study population (Pearson 2008) |
| Major allele | The allele of a biallelic polymorphism that is more frequent in the study population (Pearson 2008) |
| Pharmacogenetics | The field of studying the genetic basis of drug response and applying this knowledge to clinical practice by guiding drug prescribing |
| Pharmacogenomics | Similar to pharmacogenetics but uses information across the whole genome |
| Population stratification | A form of confounding in genetic association studies caused by genetic differences between cases and controls unrelated to disease but due to sampling from populations of different ancestries (Pearson 2008) |
| Wild‐type allele | The allele at a particular single‐nucleotide polymorphism (SNP) that is most frequent in a population, also called “common” allele (Attia 2009) |
| DNA = deoxyribonucleic acid; SNP = Single‐nucleotide polymorphism; GWAS = Genome‐wide association study; HWE = Hardy‐Weinberg equilibrium | |
| Polymorphism | Race group | ||||
| Gene/Region | SNP or VNTRa | Whiteb | Black or African Americanc | East Asiand | Mexicane |
| CHRNA3 | rs1051730 | G/A | G/A | G/A | G/A |
| CHRNA5 | rs16969968 | G/A | G/A | G/A | G/A |
| CHRNA5 | rs588765 | C/T | C/T | C/T | C/T |
| CHRNA5 | rs2036527 | G/A | G/A | G/A | G/A |
| CHRNB3 | rs13280604 | A/G | G/A | A/G | A/G |
| CYP2A6 | rs4105144 | T/C | T/C | T/C | T/C |
| CYP2B6 | rs6474412 | T/C | C/T | T/C | T/C |
| DBH | rs3025343 | G/A | G/A | G/A | G/A |
| DRD4 (exon 3 48 bp) | SI000224I | 4 (0.65), 7 (0.18), 3, 2 | 4 (0.75), 7 (0.14), 6, 5 | 4 (0.79), 2 (0.17), 5 | 7 (0.52), 4 (0.41), 2 |
| EGLN2 | rs3733829 | A/G | A/G | A/G | G/A |
| EGLN2 | rs7937 | T/C | C/T | T/C | T/C |
| LOC100188947 | rs1329650 | G/T | G/T | T/G | G/T |
| LOC100188947 | rs1028936 | A/C | A/C | C/A | A/C |
| PDE1C | rs215605 | T/G | G/T | G/T | T/G |
| SLC6A3 (3' 40 bp) | SI000156M | 10 (0.69), 9 (0.31) | 10 (0.73), 9 (0.21), 3, 8 | 10 (0.91), 9 | 10 (0.74), 9 (0.24) |
| SLC6A4 (Promoter) | SI664268Gf | L (0.62), S (0.38) | L (0.78), S (0.07), 19 (0.15) | L (0.27), S (0.71) | L (0.42), S (0.58) |
| aSNP rsID and frequencies from the 1000 Genomes Project database (http://analysistools.nci.nih.gov/LDlink/), VNTR UID and frequencies from ALFRED (http://alfred.med.yale.edu/alfred/index.asp). | |||||
| bGBR or European (PopID = 20, SampID = 20C). | |||||
| cASW or per VNTR (DRD4, Biaka (PopID = 5, SampID = 5F); SLC6A3, African American (PopID = 98R, SampID = 101C); SLC6A4, Biaka. | |||||
| dCHB + JPT, or mean of Han and Japanese, for SLC6A3 and SLC6A4, Han (SampID = 9J) and Japanese (SampID = 10B). | |||||
| eMXL or per VNTR (DRD4, see Table 2, Aguirre‐Samudio 2014; SLC6A3, Hispanic American from ALFRED; SLC6A4, see Table 2, Peralta‐Leal 2012). | |||||
| fFor Euro, African American and East Asian, extracted from Promoter VNTR + rs25531 Table in ALFRED. L = 16 repeats, S = 14 repeats. | |||||
| SNP = Single‐nucleotide polymorphism; VNTR = variable number tandem repeat; G = nucleobase guanine; A = nucleobase adenine; C = nucleobase cytosine; T = nucleobase thymine; rsID=reference SNP cluster ID; UID=Unique Identifier, from ALFRED; GBR=British in England and Scotland population description code from 1000 Genomes Project; PopID=Population ID from ALFRED; SampID=Sample ID from ALFRED; ASW=Americans of African Ancestry in SW USA population description code, from 1000 Genomes Project; CHB=Han Chinese in Bejing, China population description code, from 1000 Genomes Project; JPT=Japanese in Tokyo, Japan population description code, from 1000 Genomes Project; Han=Han Chinese living in the San Francisco, California, from ALFRED; MXL=Mexican Ancestry from Los Angeles USA population description code, from 1000 Genomes Project; L=Long (16 repeats); S=Short (14 repeats) | |||||
| Treatment comparison | SNP or VNTRa | Ethnicity | Number of studies (individual treatment 1/treatment 2) included | Analysis number | Significant treatment effect Letter indicates which treatment is favoured: a = active NRT b = bupropion ba = bupropion + active NRT p = placebo v = varenicline | P value heterogeneity genotype groups | |||
| Active NRT vs placebo | O | HoMa | Het | HoMi | |||||
| rs1051730 | NHW | 3 (1023/574) | 1.1 | a | a | a | 0.40 | ||
| rs16969968 | NHB | 2 (392/317) | 3.1 | a | 0.03a | ||||
| rs2036527 | NHB | 2 (391/317) | 5.1 | 0.36a | |||||
| DRD4 (exon 3 48 bp) | NHW | 2 (453/447) | 6.1 | a | a | 0.72 | |||
| O | S | N | |||||||
| NMR | NHW or NHB | 2 (719/699) | 7.1 | a | a | 0.22 | |||
| Bupropion vs placebo | O | HoMa | Het | HoMi | |||||
| rs1051730 | NHW | 4 (797/532) | 8.1 | b | b | 0.77 | |||
| NHB | 3 (63/63) | 9.1 | 0.80 | ||||||
| rs16969968 | NHB | 2 (294/284) | 11.1 | 0.22a | |||||
| rs588765 | NHW | 4 (596/511) | 12.1 | b | b | 0.32 | |||
| rs2036527 | NHW | 2 (412/326) | 13.1 | b | b | 0.28 | |||
| NHB | 3 (331/329) | 14.1 | 0.65 | ||||||
| rs3733829 | NHW | 2 (307/264) | 15.1 | b | b | 0.25 | |||
| Het: heterozygous; HoMa: homozygous major; HoMi: homozygous minor; N: normal NMR; NHB: non‐Hispanic black or African American; NHW: non‐Hispanic white; NMR: nicotine metabolite ratio; NRT: nicotine replacement therapy; O = overall; SNP: single‐nucleotide polymorphism; VNTR: variable number tandem repeat. aHomozygous major vs heterozygous + homozygous minor. | |||||||||
| Treatment comparison | SNP or VNTRa | Ethnicity | Number of studies (individual treatment 1/treatment 2) included | Analysis number | Significant treatment effect Letter indicates which treatment is favoured: a = active NRT b = bupropion ba = bupropion + active NRT p = placebo v = varenicline | P value heterogeneity genotype groups | |||
| Active NRT vs placebo | O | HoMa | Het | HoMi | |||||
| rs1051730 | NHW | 2 (912/479) | 1.2 | a | a | a | 0.004 | ||
| rs16969968 | NHW | 2 (784/343) | 2.1 | a | 0.02 | ||||
| NHB | 2 (392/317) | 3.2 | a | pb | 0.003a | ||||
| rs588765 | NHW | 2 (587/336) | 4.1 | a | 0.89 | ||||
| rs2036527 | NHB | 2 (391/317) | 5.2 | 0.28a | |||||
| DRD4 (exon 3 48 bp) | NHW | 2 (453/447) | 6.2 | 0.79 | |||||
| O | S | N | |||||||
| NMR | NHW or NHB | 2 (718/699) | 7.2 | a | a | 0.80 | |||
| Bupropion vs placebo | O | HoMa | Het | HoMi | |||||
| rs1051730 | NHW | 6 (743/636) | 8.2 | b | b | b | b | 0.41 | |
| NHB | 3 (84/75) | 9.2 | 0.12 | ||||||
| rs16969968 | NHW | 3 (324/233) | 10.1 | b | b | 0.50 | |||
| NHB | 3 (315/296) | 11.2 | b | bb | 0.77a | ||||
| rs588765 | NHW | 4 (595/512) | 12.2 | b | b | 0.96 | |||
| rs2036527 | NHW | 4 (546/429) | 13.2 | b | b | b | b | 0.20 | |
| NHB | 4 (352/341) | 14.2 | b | b | 0.38 | ||||
| rs3733829 | NHW | 4 (440/367) | 15.2 | b | b | b | 0.71 | ||
| NHB | 2 (46/29) | 16.1 | 0.56a | ||||||
| rs7937 | NHW | 3 (324/233) | 17.1 | b | b | 0.54 | |||
| NHB | 2 (47/29) | 18.1 | 0.92a | ||||||
| rs1329650 | NHW | 3 (324/235) | 19.1 | b | b | 0.83 | |||
| NHB | 2 (47/29) | 20.1 | 0.59a | ||||||
| rs1028936 | NHW | 3 (324/235) | 21.1 | b | b | 0.90 | |||
| NHB | 2 (47/29) | 22.1 | 0.37a | ||||||
| rs215605 | NHW | 3 (324/234) | 23.1 | b | b | 0.43 | |||
| NHB | 2 (47/29) | 24.1 | 0.92a | ||||||
| Bupropion + any NRT vs placebo | O | HoMa | Het | HoMi | |||||
| rs1051730 | NHW | 2 (268/176) | 25.1 | ba | ba | 0.77 | |||
| NHB | 2 (40/29) | 26.1 | 0.07a | ||||||
| rs16969968 | NHW | 2 (266/175) | 27.1 | ba | ba | 0.77 | |||
| NHB | 2 (40/29) | 28.1 | 0.35a | ||||||
| rs2036527 | NHW | 2 (267/176) | 29.1 | ba | ba | 0.95 | |||
| NHB | 2 (40/29) | 30.1 | 0.59 | ||||||
| rs3733829 | NHW | 2 (266/175) | 31.1 | ba | ba | 0.83 | |||
| NHB | 2 (48/21[ES1] ) | 32.1 | 0.45a | ||||||
| rs7937 | NHW | 2 (268/174) | 33.1 | ba | 0.62 | ||||
| NHB | 2 (40/29) | 34.1 | 0.98a | ||||||
| rs1329650 | NHW | 2 (266/176) | 35.1 | ba | ba | 0.90 | |||
| NHB | 2 (40/29) | 36.1 | 0.78a | ||||||
| rs1028936 | NHW | 2 (268/176) | 37.1 | ba | ba | 0.88 | |||
| NHB | 2 (40/29) | 38.1 | 0.89a | ||||||
| rs215605 | NHW | 2 (267/175) | 39.1 | ba | ba | 0.79 | |||
| NHB | 2 (40/28) | 40.1 | 0.52a | ||||||
| Bupropion + any NRT vs bupropion | O | HoMa | Het | HoMi | |||||
| rs1051730 | NHW | 2 (268/265) | 41.1 | 0.97 | |||||
| NHB | 2 (40/47) | 42.1 | 0.41a | ||||||
| rs16969968 | NHW | 2 (266/265) | 43.1 | 0.98 | |||||
| NHB | 2 (40/47) | 44.1 | 0.57a | ||||||
| rs2036527 | NHW | 2 (267/265) | 45.1 | 0.99 | |||||
| NHB | 2 (40/47) | 46.1 | 0.61a | ||||||
| rs3733829 | NHW | 2 (267/264) | 47.1 | 0.82 | |||||
| NHB | 2 (48/46) | 48.1 | b | 0.58a | |||||
| rs7937 | NHW | 2 (268/265) | 49.1 | 0.69 | |||||
| NHB | 2 (40/47) | 50.1 | 0.85a | ||||||
| rs1329650 | NHW | 2 (266/265) | 51.1 | 0.66 | |||||
| NHB | 2 (40/47) | 52.1 | 0.49a | ||||||
| rs1028936 | NHW | 2 (268/265) | 53.1 | 0.60 | |||||
| NHB | 2 (40/47) | 54.1 | 0.49a | ||||||
| rs215605 | NHW | 2 (267/265) | 55.1 | 0.50 | |||||
| NHB | 2 (40/47) | 56.1 | 0.75a | ||||||
| Het: heterozygous; HoMa: homozygous major; HoMi: homozygous minor; N: normal NMR; NHB: non‐Hispanic black or African American; NHW: non‐Hispanic white; NMR: nicotine metabolite ratio; NRT: nicotine replacement therapy; O: overall; SNP: single‐nucleotide polymorphism; VNTR: variable number tandem repeat. aHomozygous major vs heterozygous + homozygous minor. bHeterozygous + homozygous minor. | |||||||||
| Treatment group | SNP or VNTRa | Ethnicity | Number of studies (individuals in homozygous major/heterozygous/homozygous minor) included | Analysis number | Significant treatment effect Letter indicates which genotype is favoured: ma = genotype group with 1 or more major alleles mi = homozygous minor s = slow NMR n = normal NMR | P value heterogeneity in genotype comparisons | |
| Active NRT | MaMi | HetMi | |||||
| rs1051730 | NHW | 7 (1352/1025/310) | 57.1 | 0.93 | |||
| NHB | 2 (181/50/6) | 58.1 | 0.98 | ||||
| rs16969968 | NHB | 2 (353/39a) | 59.1 | N/A | |||
| rs588765 | NHW | 3 (286/399/147) | 60.1 | 0.76 | |||
| rs2036527 | NHW | 2 (369/447/132) | 61.1 | 0.79 | |||
| NHB | 2 (232/159a) | 62.1 | N/A | ||||
| DRD4 (exon 3 48 bp) | NHW | 3 (798/253/68) | 63.1 | 0.74 | |||
| SLC6A4 (Promoter) | NHW | 2 (277/465/184) | 64.1 | 0.62 | |||
| Normal vs slow | |||||||
| NMR | NHW and NHB | 2 (400/318) | 65.1 | s | N/A | ||
| Bupropion | |||||||
| rs1051730 | NHW | 4 (220/294/96) | 66.1 | 0.82 | |||
| NHB | 2 (43/20a) | 67.1 | N/A | ||||
| rs16969968 | NHB | 2 (261/33a) | 69.1 | N/A | |||
| rs588765 | NHW | 4 (195/292/109) | 70.1 | 0.80 | |||
| rs2036527 | NHW | 2 (143/204/65) | 71.1 | 0.87 | |||
| NHB | 3 (187/144a) | 72.1 | N/A | ||||
| rs3733829 | NHW | 2 (146/116/45) | 73.1 | 0.65 | |||
| Varenicline | |||||||
| rs16969968 | NHW | 2 (269/349/89) | 83.1 | 0.81 | |||
| rs588765 | NHW | 2 (234/345/120) | 84.1 | 0.90 | |||
| Placebo | |||||||
| rs1051730 | NHW | 6 (377/441/156) | 101.1 | 0.54 | |||
| NHB | 2 (49/14a) | 102.1 | N/A | ||||
| rs16969968 | NHW | 2 (132/181/30) | 103.1 | 0.63 | |||
| NHB | 3 (519/65a) | 104.1 | N/A | ||||
| rs588765 | NHW | 5 (253/340/130) | 105.1 | 0.92 | |||
| NHB | 2 (275/291a) | 106.1 | N/A | ||||
| rs2036527 | NHW | 2 (117/166/43) | 107.1 | 0.81 | |||
| NHB | 4 (373/256a) | 108.1 | N/A | ||||
| DRD4 (exon 3 48 bp) | NHW | 3 (361/186/26) | 109.1 | 0.44 | |||
| rs3733829 | NHW | 2 (122/102/40) | 110.1 | 0.60 | |||
| SLC6A4 (Promoter) | NHW | 2 (128/23a) | 119.1 | N/A | |||
| Normal vs slow | |||||||
| NMR | NHW and NHB | 2 (389/310) | 120.1 | N/A | |||
| HetMi: heterozygous vs homozygous minor; MaMi: homozygous major vs homozygous minor; NHB: non‐Hispanic black or African American; NHW: non‐Hispanic white; NMR: nicotine metabolite ratio; NRT: nicotine replacement therapy; NS: normal NMR vs slow NMR; SNP: single‐nucleotide polymorphism; VNTR: variable number tandem repeat. aHeterozygous and homozygous minor combined. | |||||||
| Treatment group | SNP or VNTRa | Ethnicity | Number of studies (individuals in homozygous major/heterozygous/homozygous minor) included | Analysis number | Significant treatment effect Letter indicates which genotype is favored: ma = genotype group with 1 or more major alleles mi = homozygous minor s = slow NMR n = normal NMR | P value heterogeneity in genotype comparisons | |
| Active NRT | MaMi | HetMi | |||||
| rs1051730 | NHW | 5 (917/1008/283) | 57.2 | 0.64 | |||
| rs16969968 | NHB | 2 (353/39a) | 59.2 | mab | N/A | ||
| rs588765 | NHW | 3 (286/399/147) | 60.2 | 0.97 | |||
| rs2036527 | NHW | 2 (369/447/132) | 61.2 | 0.74 | |||
| NHB | 2 (232/159a) | 62.2 | mab | N/A | |||
| DRD4 (exon 3 48 bp) | NHW | 3 (798/253/68) | 63.2 | 0.72 | |||
| SLC6A4 (Promoter) | NHW | 2 (277/465/184) | 64.2 | 0.83 | |||
| Normal vs slow | |||||||
| NMR | NHW and NHB | 2 (400/318) | 65.2 | N/A | |||
| Bupropion | |||||||
| rs1051730 | NHW | 6 (263/357/123) | 66.2 | 0.59 | |||
| NHB | 3 (58/26a) | 67.2 | N/A | ||||
| rs16969968 | NHW | 3 (108/164/52) | 68.1 | 0.51 | |||
| NHB | 3 (279/36a) | 69.2 | N/A | ||||
| rs588765 | NHW | 4 (195/292/109) | 70.2 | 0.65 | |||
| rs2036527 | NHW | 4 (185/269/92) | 71.2 | 0.53 | |||
| NHB | 4 (200/152a) | 72.2 | N/A | ||||
| rs3733829 | NHW | 4 (203/181/56) | 73.2 | 0.87 | |||
| NHB | 2 (35/11a) | 74.1 | N/A | ||||
| rs7937 | NHW | 3 (86/165/73) | 75.1 | 0.66 | |||
| NHB | 2 (20/24/3) | 76.1 | 0.62 | ||||
| rs1329650 | NHW | 3 (161/138/25) | 77.1 | 0.90 | |||
| NHB | 2 (42/5a) | 78.1 | N/A | ||||
| rs1028936 | NHW | 3 (212/103/9) | 79.1 | 1.00 | |||
| NHB | 2 (42/5a) | 80.1 | N/A | ||||
| rs215605 | NHW | 3 (125/154/45) | 81.1 | 0.94 | |||
| NHB | 2 (31/16a) | 82.1 | N/A | ||||
| Varenicline | |||||||
| rs16969968 | NHW | 2 (269/349/89) | 83.2 | 0.94 | |||
| rs588765 | NHW | 2 (234/345/120) | 84.2 | 0.84 | |||
| Bupropion + any NRT | |||||||
| rs1051730 | NHW | 2 (113/130/25) | 85.1 | 0.96 | |||
| NHB | 2 (33/7a) | 86.1 | N/A | ||||
| rs16969968 | NHW | 2 (113/130/23) | 87.1 | 0.98 | |||
| NHB | 2 (36/4a) | 88.1 | N/A | ||||
| rs2036527 | NHW | 2 (111/132/24) | 89.1 | 0.82 | |||
| NHB | 2 (23/12/5) | 90.1 | 0.87 | ||||
| rs3733829 | NHW | 2 (114/123/30) | 91.1 | 0.52 | |||
| NHB | 2 (30/10a) | 92.1 | mib | N/A | |||
| rs7937 | NHW | 2 (74/140/54) | 93.1 | 0.95 | |||
| NHB | 2 (13/27a) | 94.1 | N/A | ||||
| rs1329650 | NHW | 2 (149/96/21) | 95.1 | mi | 0.67 | ||
| NHB | 2 (34/6a) | 96.1 | N/A | ||||
| rs1028936 | NHW | 2 (183/75/10) | 97.1 | 0.67 | |||
| NHB | 2 (34/6a) | 98.1 | N/A | ||||
| rs215605 | NHW | 2 (105/119/43) | 99.1 | 0.25 | |||
| NHB | 2 (18/22a) | 100.1 | |||||
| Placebo | |||||||
| rs1051730 | NHW | 7 (378/441/164) | 101.2 | 0.71 | |||
| NHB | 3 (63/20a) | 102.2 | N/A | ||||
| rs16969968 | NHW | 4 (169/227/49) | 103.2 | 0.83 | |||
| NHB | 4 (530/66a) | 104.2 | mib | N/A | |||
| rs588765 | NHW | 5 (254/296/108) | 105.2 | 0.34 | |||
| NHB | 2 (277/289a) | 106.2 | N/A | ||||
| rs2036527 | NHW | 4 (154/213/62) | 107.2 | 0.90 | |||
| NHB | 5 (378/263a) | 108.2 | N/A | ||||
| DRD4 (exon 3 48 bp) | NHW | 3 (361/186/26) | 109.2 | 0.65 | |||
| rs3733829 | NHW | 4 (164/152/51) | 110.2 | 0.53 | |||
| rs7937 | NHW | 3 (73/120/40) | 111.1 | 0.67 | |||
| NHB | 2 (18/11a) | 112.1 | N/A | ||||
| rs1329650 | NHW | 3 (119/106/10) | 113.1 | 0.99 | |||
| NHB | 2 (21/8a) | 114.1 | N/A | ||||
| rs1028936 | NHW | 3 (158/72/5) | 115.1 | 0.79 | |||
| NHB | 2 (23/6a) | 116.1 | N/A | ||||
| rs215605 | NHW | 3 (94/105/35) | 117.1 | 0.70 | |||
| NHB | 2 (18/11a) | 118.1 | N/A | ||||
| SLC6A4 (Promoter) | NHW | 2 (128/23a) | 119.2 | N/A | |||
| Normal vs slow | |||||||
| NMR | NHW and NHB | 2 (400/318) | 120.2 | N/A | |||
| HetMi: heterozygous vs homozygous minor; MaMi: homozygous major vs homozygous minor; NHB: non‐Hispanic black or African American; NHW: non‐Hispanic white; NS: normal NMR vs slow NMR; SNP: single‐nucleotide polymorphism; VNTR: variable number tandem repeat; NMR = nicotine metabolite ratio. aHeterozygous and homozygous minor combined. bHomozygous major vs heterozygous and homozygous minor. | |||||||
| Outcome or subgroup title | No. of studies | No. of participants | Statistical method | Effect size |
| 1 Six‐Month Abstinence Show forest plot | 3 | 1597 | Risk Ratio (M‐H, Random, 95% CI) | 1.42 [1.16, 1.75] |
| 1.1 Homozygous Major | 3 | 659 | Risk Ratio (M‐H, Random, 95% CI) | 1.27 [0.93, 1.72] |
| 1.2 Heterozygous | 3 | 731 | Risk Ratio (M‐H, Random, 95% CI) | 1.48 [1.08, 2.01] |
| 1.3 Homozygous Minor | 3 | 207 | Risk Ratio (M‐H, Random, 95% CI) | 2.07 [1.06, 4.01] |
| 2 End of Treatment Show forest plot | 2 | 1391 | Risk Ratio (M‐H, Random, 95% CI) | 1.63 [1.14, 2.32] |
| 2.1 Homozygous Major | 2 | 582 | Risk Ratio (M‐H, Random, 95% CI) | 1.09 [0.85, 1.41] |
| 2.2 Heterozygous | 2 | 631 | Risk Ratio (M‐H, Random, 95% CI) | 2.13 [1.52, 2.97] |
| 2.3 Homozygous Minor | 2 | 178 | Risk Ratio (M‐H, Random, 95% CI) | 2.18 [1.04, 4.58] |
| Outcome or subgroup title | No. of studies | No. of participants | Statistical method | Effect size |
| 1 End of Treatment Show forest plot | 2 | 1127 | Risk Ratio (M‐H, Random, 95% CI) | 1.38 [0.97, 1.98] |
| 1.1 Homozygous Major | 2 | 449 | Risk Ratio (M‐H, Random, 95% CI) | 1.01 [0.77, 1.33] |
| 1.2 Heterozygous | 2 | 550 | Risk Ratio (M‐H, Random, 95% CI) | 1.85 [1.33, 2.59] |
| 1.3 Homozygous Minor | 2 | 128 | Risk Ratio (M‐H, Random, 95% CI) | 1.80 [0.45, 7.23] |
| Outcome or subgroup title | No. of studies | No. of participants | Statistical method | Effect size |
| 1 Six‐Month Abstinence Show forest plot | 2 | 709 | Risk Ratio (M‐H, Random, 95% CI) | 1.11 [0.55, 2.26] |
| 1.1 Homozygous Major | 2 | 637 | Risk Ratio (M‐H, Random, 95% CI) | 1.47 [1.07, 2.03] |
| 1.2 Heterozygous or Homozygous Minor | 2 | 72 | Risk Ratio (M‐H, Random, 95% CI) | 0.43 [0.15, 1.26] |
| 2 End of Treatment Show forest plot | 2 | 709 | Risk Ratio (M‐H, Random, 95% CI) | 1.03 [0.36, 2.94] |
| 2.1 Homozygous Major | 2 | 637 | Risk Ratio (M‐H, Random, 95% CI) | 1.57 [1.15, 2.15] |
| 2.2 Heterozygous or Homozygous Minor | 2 | 72 | Risk Ratio (M‐H, Random, 95% CI) | 0.29 [0.10, 0.86] |
| Outcome or subgroup title | No. of studies | No. of participants | Statistical method | Effect size |
| 1 End of Treatment Show forest plot | 2 | 923 | Risk Ratio (M‐H, Random, 95% CI) | 1.33 [1.04, 1.71] |
| 1.1 Homozygous Major | 2 | 296 | Risk Ratio (M‐H, Random, 95% CI) | 1.39 [0.89, 2.16] |
| 1.2 Heterozygous | 2 | 469 | Risk Ratio (M‐H, Random, 95% CI) | 1.27 [0.89, 1.79] |
| 1.3 Homozygous Minor | 2 | 158 | Risk Ratio (M‐H, Random, 95% CI) | 1.50 [0.74, 3.06] |
| Outcome or subgroup title | No. of studies | No. of participants | Statistical method | Effect size |
| 1 Six‐Month Abstinence Show forest plot | 2 | 708 | Risk Ratio (M‐H, Random, 95% CI) | 1.18 [0.75, 1.87] |
| 1.1 Homozygous Major | 2 | 425 | Risk Ratio (M‐H, Random, 95% CI) | 1.95 [0.46, 8.26] |
| 1.2 Heterozygous or Homozygous Minor | 2 | 283 | Risk Ratio (M‐H, Random, 95% CI) | 0.90 [0.40, 2.03] |
| 2 End of Treatment Show forest plot | 2 | 708 | Risk Ratio (M‐H, Random, 95% CI) | 1.22 [0.77, 1.93] |
| 2.1 Homozygous Major | 2 | 425 | Risk Ratio (M‐H, Random, 95% CI) | 2.39 [0.43, 13.35] |
| 2.2 Heterozygous or Homozygous Minor | 2 | 283 | Risk Ratio (M‐H, Random, 95% CI) | 0.89 [0.55, 1.46] |
| Outcome or subgroup title | No. of studies | No. of participants | Statistical method | Effect size |
| 1 Six‐Month Abstinence Show forest plot | 2 | 900 | Risk Ratio (M‐H, Random, 95% CI) | 1.44 [1.08, 1.92] |
| 1.1 Homozygous Major | 2 | 566 | Risk Ratio (M‐H, Random, 95% CI) | 1.34 [0.93, 1.93] |
| 1.2 Heterozygous | 2 | 290 | Risk Ratio (M‐H, Random, 95% CI) | 1.76 [1.00, 3.10] |
| 1.3 Homozygous Minor | 2 | 44 | Risk Ratio (M‐H, Random, 95% CI) | 1.28 [0.40, 4.11] |
| 2 End of Treatment Show forest plot | 2 | 900 | Risk Ratio (M‐H, Random, 95% CI) | 1.20 [0.88, 1.63] |
| 2.1 Homozygous Major | 2 | 566 | Risk Ratio (M‐H, Random, 95% CI) | 1.22 [0.59, 2.51] |
| 2.2 Heterozygous | 2 | 290 | Risk Ratio (M‐H, Random, 95% CI) | 1.40 [0.57, 3.39] |
| 2.3 Homozygous Minor | 2 | 44 | Risk Ratio (M‐H, Random, 95% CI) | 1.02 [0.65, 1.58] |
| Outcome or subgroup title | No. of studies | No. of participants | Statistical method | Effect size |
| 1 Six‐Month Abstinence Show forest plot | 2 | 1417 | Risk Ratio (M‐H, Random, 95% CI) | 1.51 [1.08, 2.10] |
| 1.1 Slow NMR | 2 | 628 | Risk Ratio (M‐H, Random, 95% CI) | 1.82 [1.12, 2.94] |
| 1.2 Normal NMR | 2 | 789 | Risk Ratio (M‐H, Random, 95% CI) | 1.21 [0.78, 1.87] |
| 2 End of Treatment Show forest plot | 2 | 1417 | Risk Ratio (M‐H, Random, 95% CI) | 1.51 [1.19, 1.90] |
| 2.1 Slow NMR | 2 | 847 | Risk Ratio (M‐H, Random, 95% CI) | 1.61 [1.18, 2.20] |
| 2.2 Normal NMR | 2 | 570 | Risk Ratio (M‐H, Random, 95% CI) | 1.49 [0.85, 2.60] |
| Outcome or subgroup title | No. of studies | No. of participants | Statistical method | Effect size |
| 1 Six‐Month Abstinence Show forest plot | 4 | 1329 | Risk Ratio (M‐H, Random, 95% CI) | 1.34 [1.11, 1.61] |
| 1.1 Homozygous Major | 4 | 495 | Risk Ratio (M‐H, Random, 95% CI) | 1.24 [0.94, 1.65] |
| 1.2 Heterozygous | 4 | 633 | Risk Ratio (M‐H, Random, 95% CI) | 1.44 [1.09, 1.91] |
| 1.3 Homozygous Minor | 4 | 201 | Risk Ratio (M‐H, Random, 95% CI) | 1.31 [0.57, 2.99] |
| 2 End of Treatment Show forest plot | 6 | 1379 | Risk Ratio (M‐H, Random, 95% CI) | 1.40 [1.19, 1.64] |
| 2.1 Homozygous Major | 6 | 496 | Risk Ratio (M‐H, Random, 95% CI) | 1.32 [1.05, 1.67] |
| 2.2 Heterozygous | 6 | 655 | Risk Ratio (M‐H, Random, 95% CI) | 1.36 [1.03, 1.79] |
| 2.3 Homozygous Minor | 6 | 228 | Risk Ratio (M‐H, Random, 95% CI) | 1.83 [1.20, 2.79] |
| Outcome or subgroup title | No. of studies | No. of participants | Statistical method | Effect size |
| 1 Six‐Month Abstinence Show forest plot | 2 | 124 | Risk Ratio (M‐H, Random, 95% CI) | 1.50 [0.75, 3.00] |
| 1.1 Homozygous Major | 2 | 92 | Risk Ratio (M‐H, Random, 95% CI) | 1.61 [0.71, 3.64] |
| 1.2 Heterozygous | 2 | 32 | Risk Ratio (M‐H, Random, 95% CI) | 1.30 [0.32, 5.34] |
| 2 End of Treatment Show forest plot | 3 | 157 | Risk Ratio (M‐H, Random, 95% CI) | 1.20 [0.70, 2.06] |
| 2.1 Homozygous Major | 3 | 117 | Risk Ratio (M‐H, Random, 95% CI) | 1.76 [0.96, 3.23] |
| 2.2 Heterozygous | 3 | 40 | Risk Ratio (M‐H, Random, 95% CI) | 0.68 [0.32, 1.44] |
| Outcome or subgroup title | No. of studies | No. of participants | Statistical method | Effect size |
| 1 End of Treatment Show forest plot | 3 | 557 | Risk Ratio (M‐H, Random, 95% CI) | 1.42 [1.13, 1.77] |
| 1.1 Homozygous Major | 3 | 198 | Risk Ratio (M‐H, Random, 95% CI) | 1.35 [0.92, 1.99] |
| 1.2 Heterozygous | 3 | 276 | Risk Ratio (M‐H, Random, 95% CI) | 1.46 [1.04, 2.04] |
| 1.3 Homozygous Minor | 3 | 83 | Risk Ratio (M‐H, Random, 95% CI) | 2.55 [0.95, 6.85] |
| Outcome or subgroup title | No. of studies | No. of participants | Statistical method | Effect size |
| 1 Six‐Month Abstinence Show forest plot | 2 | 578 | Risk Ratio (M‐H, Random, 95% CI) | 1.30 [0.84, 2.00] |
| 1.1 Homozygous Major | 2 | 512 | Risk Ratio (M‐H, Random, 95% CI) | 1.18 [0.75, 1.87] |
| 1.2 Heterozygous or Homozygous Minor | 2 | 66 | Risk Ratio (M‐H, Random, 95% CI) | 2.82 [0.76, 10.45] |
| 2 End of Treatment Show forest plot | 3 | 611 | Risk Ratio (M‐H, Random, 95% CI) | 1.95 [1.23, 3.08] |
| 2.1 Homozygous Major | 3 | 541 | Risk Ratio (M‐H, Random, 95% CI) | 2.12 [1.44, 3.10] |
| 2.2 Heterozygous or Homozygous Minor | 3 | 70 | Risk Ratio (M‐H, Random, 95% CI) | 1.65 [0.33, 8.36] |
| Outcome or subgroup title | No. of studies | No. of participants | Statistical method | Effect size |
| 1 Six‐Month Abstinence Show forest plot | 4 | 1107 | Risk Ratio (M‐H, Random, 95% CI) | 1.37 [1.12, 1.67] |
| 1.1 Homozygous Major | 4 | 384 | Risk Ratio (M‐H, Random, 95% CI) | 1.33 [0.85, 2.08] |
| 1.2 Heterozygous | 4 | 526 | Risk Ratio (M‐H, Random, 95% CI) | 1.25 [0.95, 1.65] |
| 1.3 Homozygous Minor | 4 | 197 | Risk Ratio (M‐H, Random, 95% CI) | 1.95 [1.18, 3.22] |
| 2 End of Treatment Show forest plot | 4 | 1107 | Risk Ratio (M‐H, Random, 95% CI) | 1.36 [1.13, 1.65] |
| 2.1 Homozygous Major | 4 | 385 | Risk Ratio (M‐H, Random, 95% CI) | 1.37 [1.05, 1.79] |
| 2.2 Heterozygous | 4 | 525 | Risk Ratio (M‐H, Random, 95% CI) | 1.31 [0.86, 2.01] |
| 2.3 Homozygous Minor | 4 | 197 | Risk Ratio (M‐H, Random, 95% CI) | 1.43 [0.99, 2.06] |
| Outcome or subgroup title | No. of studies | No. of participants | Statistical method | Effect size |
| 1 Six‐Month Abstinence Show forest plot | 2 | 738 | Risk Ratio (M‐H, Random, 95% CI) | 1.40 [1.05, 1.86] |
| 1.1 Homozygous Major | 2 | 260 | Risk Ratio (M‐H, Random, 95% CI) | 1.15 [0.73, 1.80] |
| 1.2 Heterozygous | 2 | 370 | Risk Ratio (M‐H, Random, 95% CI) | 1.43 [0.99, 2.06] |
| 1.3 Homozygous Minor | 2 | 108 | Risk Ratio (M‐H, Random, 95% CI) | 2.73 [1.02, 7.36] |
| 2 End of Treatment Show forest plot | 4 | 975 | Risk Ratio (M‐H, Random, 95% CI) | 1.43 [1.19, 1.73] |
| 2.1 Homozygous Major | 4 | 339 | Risk Ratio (M‐H, Random, 95% CI) | 1.37 [1.04, 1.80] |
| 2.2 Heterozygous | 4 | 482 | Risk Ratio (M‐H, Random, 95% CI) | 1.36 [1.04, 1.79] |
| 2.3 Homozygous Minor | 4 | 154 | Risk Ratio (M‐H, Random, 95% CI) | 2.64 [1.33, 5.25] |
| Outcome or subgroup title | No. of studies | No. of participants | Statistical method | Effect size |
| 1 Six‐Month Abstinence Show forest plot | 3 | 660 | Risk Ratio (M‐H, Random, 95% CI) | 1.30 [0.88, 1.92] |
| 1.1 Homozygous Major | 3 | 377 | Risk Ratio (M‐H, Random, 95% CI) | 1.17 [0.70, 1.98] |
| 1.2 Heterozygous or Homozygous Minor | 3 | 283 | Risk Ratio (M‐H, Random, 95% CI) | 1.44 [0.71, 2.91] |
| 2 End of Treatment Show forest plot | 4 | 693 | Risk Ratio (M‐H, Random, 95% CI) | 1.87 [1.36, 2.56] |
| 2.1 Homozygous Major | 4 | 395 | Risk Ratio (M‐H, Random, 95% CI) | 2.11 [1.39, 3.22] |
| 2.2 Heterozygous or Homozygous Minor | 4 | 298 | Risk Ratio (M‐H, Random, 95% CI) | 1.57 [0.93, 2.62] |
| Outcome or subgroup title | No. of studies | No. of participants | Statistical method | Effect size |
| 1 Six‐Month Abstinence Show forest plot | 2 | 571 | Risk Ratio (M‐H, Random, 95% CI) | 1.41 [1.07, 1.87] |
| 1.1 Homozygous Major | 2 | 268 | Risk Ratio (M‐H, Random, 95% CI) | 1.21 [0.81, 1.82] |
| 1.2 Heterozygous | 2 | 218 | Risk Ratio (M‐H, Random, 95% CI) | 1.95 [1.22, 3.13] |
| 1.3 Homozygous Minor | 2 | 85 | Risk Ratio (M‐H, Random, 95% CI) | 1.13 [0.58, 2.17] |
| 2 End of Treatment Show forest plot | 4 | 807 | Risk Ratio (M‐H, Random, 95% CI) | 1.55 [1.29, 1.87] |
| 2.1 Homozygous Major | 4 | 367 | Risk Ratio (M‐H, Random, 95% CI) | 1.44 [1.11, 1.86] |
| 2.2 Heterozygous | 4 | 333 | Risk Ratio (M‐H, Random, 95% CI) | 1.69 [1.24, 2.30] |
| 2.3 Homozygous Minor | 4 | 107 | Risk Ratio (M‐H, Random, 95% CI) | 1.69 [0.96, 2.95] |
| Outcome or subgroup title | No. of studies | No. of participants | Statistical method | Effect size |
| 1 End of Treatment Show forest plot | 2 | 61 | Risk Ratio (M‐H, Random, 95% CI) | 1.51 [0.75, 3.04] |
| 1.1 Homozygous Major | 2 | 61 | Risk Ratio (M‐H, Random, 95% CI) | 1.51 [0.75, 3.04] |
| Outcome or subgroup title | No. of studies | No. of participants | Statistical method | Effect size |
| 1 End of Treatment Show forest plot | 3 | 557 | Risk Ratio (M‐H, Random, 95% CI) | 1.42 [1.13, 1.78] |
| 1.1 Homozygous Major | 3 | 159 | Risk Ratio (M‐H, Random, 95% CI) | 1.76 [1.13, 2.75] |
| 1.2 Heterozygous | 3 | 285 | Risk Ratio (M‐H, Random, 95% CI) | 1.30 [0.95, 1.76] |
| 1.3 Homozygous Minor | 3 | 113 | Risk Ratio (M‐H, Random, 95% CI) | 1.38 [0.82, 2.31] |
| Outcome or subgroup title | No. of studies | No. of participants | Statistical method | Effect size |
| 1 End of Treatment Show forest plot | 2 | 76 | Risk Ratio (M‐H, Random, 95% CI) | 1.56 [0.77, 3.18] |
| 1.1 Homozygous Major | 2 | 38 | Risk Ratio (M‐H, Random, 95% CI) | 1.70 [0.57, 5.10] |
| 1.2 Heterozygous or Homozygous Minor | 2 | 38 | Risk Ratio (M‐H, Random, 95% CI) | 1.57 [0.42, 5.84] |
| Outcome or subgroup title | No. of studies | No. of participants | Statistical method | Effect size |
| 1 End of Treatment Show forest plot | 3 | 559 | Risk Ratio (M‐H, Random, 95% CI) | 1.37 [1.07, 1.74] |
| 1.1 Homozygous Major | 3 | 280 | Risk Ratio (M‐H, Random, 95% CI) | 1.54 [1.07, 2.22] |
| 1.2 Heterozygous | 3 | 244 | Risk Ratio (M‐H, Random, 95% CI) | 1.31 [0.88, 1.96] |
| 1.3 Homozygous Minor | 3 | 35 | Risk Ratio (M‐H, Random, 95% CI) | 1.25 [0.33, 4.74] |
| Outcome or subgroup title | No. of studies | No. of participants | Statistical method | Effect size |
| 1 End of Treatment Show forest plot | 2 | 76 | Risk Ratio (M‐H, Random, 95% CI) | 1.44 [0.70, 2.99] |
| 1.1 Homozygous Major | 2 | 63 | Risk Ratio (M‐H, Random, 95% CI) | 1.62 [0.67, 3.96] |
| 1.2 Heterozygous or Homozygous Minor | 2 | 13 | Risk Ratio (M‐H, Random, 95% CI) | 0.93 [0.15, 5.70] |
| Outcome or subgroup title | No. of studies | No. of participants | Statistical method | Effect size |
| 1 End of Treatment Show forest plot | 3 | 559 | Risk Ratio (M‐H, Random, 95% CI) | 1.39 [1.11, 1.74] |
| 1.1 Homozygous Major | 3 | 370 | Risk Ratio (M‐H, Random, 95% CI) | 1.54 [1.15, 2.06] |
| 1.2 Heterozygous | 3 | 175 | Risk Ratio (M‐H, Random, 95% CI) | 1.33 [0.75, 2.35] |
| 1.3 Homozygous Minor | 3 | 14 | Risk Ratio (M‐H, Random, 95% CI) | 1.60 [0.30, 8.49] |
| Outcome or subgroup title | No. of studies | No. of participants | Statistical method | Effect size |
| 1 End of Treatment Show forest plot | 2 | 76 | Risk Ratio (M‐H, Random, 95% CI) | 1.47 [0.68, 3.21] |
| 1.1 Homozygous Major | 2 | 65 | Risk Ratio (M‐H, Random, 95% CI) | 1.77 [0.74, 4.20] |
| 1.2 Heterozygous or Homozygous Minor | 2 | 11 | Risk Ratio (M‐H, Random, 95% CI) | 0.67 [0.09, 4.77] |
| Outcome or subgroup title | No. of studies | No. of participants | Statistical method | Effect size |
| 1 End of Treatment Show forest plot | 3 | 558 | Risk Ratio (M‐H, Random, 95% CI) | 1.48 [1.18, 1.87] |
| 1.1 Homozygous Major | 3 | 219 | Risk Ratio (M‐H, Random, 95% CI) | 1.77 [1.23, 2.55] |
| 1.2 Heterozygous | 3 | 259 | Risk Ratio (M‐H, Random, 95% CI) | 1.35 [0.98, 1.87] |
| 1.3 Homozygous Minor | 3 | 80 | Risk Ratio (M‐H, Random, 95% CI) | 1.12 [0.49, 2.55] |
| Outcome or subgroup title | No. of studies | No. of participants | Statistical method | Effect size |
| 1 End of Treatment Show forest plot | 2 | 76 | Risk Ratio (M‐H, Random, 95% CI) | 1.41 [0.54, 3.69] |
| 1.1 Homozygous Major | 2 | 49 | Risk Ratio (M‐H, Random, 95% CI) | 1.93 [0.15, 24.95] |
| 1.2 Heterozygous or Homozygous Minor | 2 | 27 | Risk Ratio (M‐H, Random, 95% CI) | 1.67 [0.46, 6.13] |
| Outcome or subgroup title | No. of studies | No. of participants | Statistical method | Effect size |
| 1 End of Treatment Show forest plot | 2 | 444 | Risk Ratio (M‐H, Random, 95% CI) | 1.80 [1.07, 3.03] |
| 1.1 Homozygous Major | 2 | 183 | Risk Ratio (M‐H, Random, 95% CI) | 2.11 [0.31, 14.60] |
| 1.2 Heterozygous | 2 | 216 | Risk Ratio (M‐H, Random, 95% CI) | 1.82 [1.23, 2.69] |
| 1.3 Homozygous Minor | 2 | 45 | Risk Ratio (M‐H, Random, 95% CI) | 2.84 [0.90, 8.89] |
| Outcome or subgroup title | No. of studies | No. of participants | Statistical method | Effect size |
| 1 End of Treatment Show forest plot | 2 | 69 | Risk Ratio (M‐H, Random, 95% CI) | 0.91 [0.27, 3.07] |
| 1.1 Homozygous Major | 2 | 58 | Risk Ratio (M‐H, Random, 95% CI) | 1.64 [0.56, 4.83] |
| 1.2 Heterozygous or Homozygous Minor | 2 | 11 | Risk Ratio (M‐H, Random, 95% CI) | 0.22 [0.03, 1.43] |
| Outcome or subgroup title | No. of studies | No. of participants | Statistical method | Effect size |
| 1 End of Treatment Show forest plot | 2 | 441 | Risk Ratio (M‐H, Random, 95% CI) | 1.79 [1.07, 2.99] |
| 1.1 Homozygous Major | 2 | 183 | Risk Ratio (M‐H, Random, 95% CI) | 2.11 [0.31, 14.60] |
| 1.2 Heterozygous | 2 | 215 | Risk Ratio (M‐H, Random, 95% CI) | 1.80 [1.22, 2.66] |
| 1.3 Homozygous Minor | 2 | 43 | Risk Ratio (M‐H, Random, 95% CI) | 2.81 [0.89, 8.88] |
| Outcome or subgroup title | No. of studies | No. of participants | Statistical method | Effect size |
| 1 End of Treatment Show forest plot | 2 | 69 | Risk Ratio (M‐H, Random, 95% CI) | 1.05 [0.46, 2.38] |
| 1.1 Homozygous Major | 2 | 63 | Risk Ratio (M‐H, Random, 95% CI) | 1.20 [0.51, 2.85] |
| 1.2 Heterozygous or Homozygous Minor | 2 | 6 | Risk Ratio (M‐H, Random, 95% CI) | 0.33 [0.03, 4.19] |
| Outcome or subgroup title | No. of studies | No. of participants | Statistical method | Effect size |
| 1 End of Treatment Show forest plot | 2 | 443 | Risk Ratio (M‐H, Random, 95% CI) | 1.74 [1.09, 2.77] |
| 1.1 Homozygous Major | 2 | 181 | Risk Ratio (M‐H, Random, 95% CI) | 2.20 [0.33, 14.75] |
| 1.2 Heterozygous | 2 | 220 | Risk Ratio (M‐H, Random, 95% CI) | 1.83 [1.23, 2.72] |
| 1.3 Homozygous Minor | 2 | 42 | Risk Ratio (M‐H, Random, 95% CI) | 2.12 [0.79, 5.65] |
| Outcome or subgroup title | No. of studies | No. of participants | Statistical method | Effect size |
| 1 End of Treatment Show forest plot | 2 | 69 | Risk Ratio (M‐H, Random, 95% CI) | 1.00 [0.52, 1.92] |
| 1.1 Homozygous Major | 2 | 38 | Risk Ratio (M‐H, Random, 95% CI) | 2.03 [0.39, 10.56] |
| 1.2 Heterozygous | 2 | 23 | Risk Ratio (M‐H, Random, 95% CI) | 1.03 [0.38, 2.77] |
| 1.3 Homozygous Minor | 2 | 8 | Risk Ratio (M‐H, Random, 95% CI) | 0.74 [0.26, 2.05] |
| Outcome or subgroup title | No. of studies | No. of participants | Statistical method | Effect size |
| 1 End of Treatment Show forest plot | 2 | 442 | Risk Ratio (M‐H, Random, 95% CI) | 1.55 [1.20, 2.01] |
| 1.1 Homozygous Major | 2 | 187 | Risk Ratio (M‐H, Random, 95% CI) | 1.48 [0.83, 2.65] |
| 1.2 Heterozygous | 2 | 201 | Risk Ratio (M‐H, Random, 95% CI) | 1.87 [1.04, 3.36] |
| 1.3 Homozygous Minor | 2 | 54 | Risk Ratio (M‐H, Random, 95% CI) | 1.85 [0.91, 3.74] |
| Outcome or subgroup title | No. of studies | No. of participants | Statistical method | Effect size |
| 1 End of Treatment Show forest plot | 2 | 48 | Risk Ratio (M‐H, Random, 95% CI) | 0.42 [0.14, 1.24] |
| 1.1 Homozygous Major | 2 | 48 | Risk Ratio (M‐H, Random, 95% CI) | 0.42 [0.14, 1.24] |
| Outcome or subgroup title | No. of studies | No. of participants | Statistical method | Effect size |
| 1 End of Treatment Show forest plot | 2 | 442 | Risk Ratio (M‐H, Random, 95% CI) | 1.51 [1.16, 1.97] |
| 1.1 Homozygous Major | 2 | 131 | Risk Ratio (M‐H, Random, 95% CI) | 2.00 [0.84, 4.75] |
| 1.2 Heterozygous | 2 | 229 | Risk Ratio (M‐H, Random, 95% CI) | 1.39 [0.99, 1.94] |
| 1.3 Homozygous Minor | 2 | 82 | Risk Ratio (M‐H, Random, 95% CI) | 2.34 [0.49, 11.08] |
| Outcome or subgroup title | No. of studies | No. of participants | Statistical method | Effect size |
| 1 End of Treatment Show forest plot | 2 | 69 | Risk Ratio (M‐H, Random, 95% CI) | 1.06 [0.47, 2.38] |
| 1.1 Homozygous Major | 2 | 31 | Risk Ratio (M‐H, Random, 95% CI) | 1.05 [0.40, 2.73] |
| 1.2 Heterozygous or Homozygous Minor | 2 | 38 | Risk Ratio (M‐H, Random, 95% CI) | 1.08 [0.23, 4.99] |
| Outcome or subgroup title | No. of studies | No. of participants | Statistical method | Effect size |
| 1 End of Treatment Show forest plot | 2 | 442 | Risk Ratio (M‐H, Random, 95% CI) | 1.62 [1.10, 2.39] |
| 1.1 Homozygous Major | 2 | 240 | Risk Ratio (M‐H, Random, 95% CI) | 1.98 [1.31, 3.00] |
| 1.2 Heterozygous | 2 | 172 | Risk Ratio (M‐H, Random, 95% CI) | 1.60 [0.70, 3.67] |
| 1.3 Homozygous Minor | 2 | 30 | Risk Ratio (M‐H, Random, 95% CI) | 2.04 [0.17, 25.25] |
| Outcome or subgroup title | No. of studies | No. of participants | Statistical method | Effect size |
| 1 End of Treatment Show forest plot | 2 | 69 | Risk Ratio (M‐H, Random, 95% CI) | 1.07 [0.48, 2.41] |
| 1.1 Homozygous Major | 2 | 55 | Risk Ratio (M‐H, Random, 95% CI) | 1.00 [0.40, 2.55] |
| 1.2 Heterozygous or Homozygous Minor | 2 | 14 | Risk Ratio (M‐H, Random, 95% CI) | 1.32 [0.26, 6.80] |
| Outcome or subgroup title | No. of studies | No. of participants | Statistical method | Effect size |
| 1 End of Treatment Show forest plot | 2 | 444 | Risk Ratio (M‐H, Random, 95% CI) | 1.64 [1.08, 2.49] |
| 1.1 Homozygous Major | 2 | 305 | Risk Ratio (M‐H, Random, 95% CI) | 1.89 [1.34, 2.67] |
| 1.2 Heterozygous | 2 | 125 | Risk Ratio (M‐H, Random, 95% CI) | 1.42 [0.48, 4.20] |
| 1.3 Homozygous Minor | 2 | 14 | Risk Ratio (M‐H, Random, 95% CI) | 1.93 [0.47, 8.02] |
| Outcome or subgroup title | No. of studies | No. of participants | Statistical method | Effect size |
| 1 End of Treatment Show forest plot | 2 | 69 | Risk Ratio (M‐H, Random, 95% CI) | 1.07 [0.48, 2.41] |
| 1.1 Homozygous Major | 2 | 57 | Risk Ratio (M‐H, Random, 95% CI) | 1.10 [0.43, 2.84] |
| 1.2 Heterozygous or Homozygous Minor | 2 | 12 | Risk Ratio (M‐H, Random, 95% CI) | 0.96 [0.17, 5.39] |
| Outcome or subgroup title | No. of studies | No. of participants | Statistical method | Effect size |
| 1 End of Treatment Show forest plot | 2 | 442 | Risk Ratio (M‐H, Random, 95% CI) | 1.72 [1.16, 2.53] |
| 1.1 Homozygous Major | 2 | 171 | Risk Ratio (M‐H, Random, 95% CI) | 2.00 [1.32, 3.03] |
| 1.2 Heterozygous | 2 | 200 | Risk Ratio (M‐H, Random, 95% CI) | 1.47 [0.60, 3.63] |
| 1.3 Homozygous Minor | 2 | 71 | Risk Ratio (M‐H, Random, 95% CI) | 2.29 [0.72, 7.27] |
| Outcome or subgroup title | No. of studies | No. of participants | Statistical method | Effect size |
| 1 End of Treatment Show forest plot | 2 | 68 | Risk Ratio (M‐H, Random, 95% CI) | 0.85 [0.41, 1.77] |
| 1.1 Homozygous Major | 2 | 36 | Risk Ratio (M‐H, Random, 95% CI) | 0.71 [0.29, 1.76] |
| 1.2 Heterozygous or Homozygous Minor | 2 | 32 | Risk Ratio (M‐H, Random, 95% CI) | 1.19 [0.34, 4.13] |
| Outcome or subgroup title | No. of studies | No. of participants | Statistical method | Effect size |
| 1 End of Treatment Show forest plot | 2 | 533 | Risk Ratio (M‐H, Random, 95% CI) | 1.18 [0.90, 1.55] |
| 1.1 Homozygous Major | 2 | 206 | Risk Ratio (M‐H, Random, 95% CI) | 1.14 [0.54, 2.42] |
| 1.2 Heterozygous | 2 | 262 | Risk Ratio (M‐H, Random, 95% CI) | 1.22 [0.93, 1.61] |
| 1.3 Homozygous Minor | 2 | 65 | Risk Ratio (M‐H, Random, 95% CI) | 1.28 [0.68, 2.44] |
| Outcome or subgroup title | No. of studies | No. of participants | Statistical method | Effect size |
| 1 End of Treatment Show forest plot | 2 | 87 | Risk Ratio (M‐H, Random, 95% CI) | 0.70 [0.37, 1.31] |
| 1.1 Homozygous Major | 2 | 66 | Risk Ratio (M‐H, Random, 95% CI) | 0.77 [0.40, 1.49] |
| 1.2 Heterozygous or Homozygous Minor | 2 | 21 | Risk Ratio (M‐H, Random, 95% CI) | 0.33 [0.05, 2.19] |
| Outcome or subgroup title | No. of studies | No. of participants | Statistical method | Effect size |
| 1 End of Treatment Show forest plot | 2 | 531 | Risk Ratio (M‐H, Random, 95% CI) | 1.18 [0.90, 1.55] |
| 1.1 Homozygous Major | 2 | 206 | Risk Ratio (M‐H, Random, 95% CI) | 1.14 [0.54, 2.42] |
| 1.2 Heterozygous | 2 | 262 | Risk Ratio (M‐H, Random, 95% CI) | 1.22 [0.93, 1.61] |
| 1.3 Homozygous Minor | 2 | 63 | Risk Ratio (M‐H, Random, 95% CI) | 1.27 [0.66, 2.44] |
| Outcome or subgroup title | No. of studies | No. of participants | Statistical method | Effect size |
| 1 End of Treatment Show forest plot | 2 | 87 | Risk Ratio (M‐H, Random, 95% CI) | 0.69 [0.37, 1.27] |
| 1.1 Homozygous Major | 2 | 74 | Risk Ratio (M‐H, Random, 95% CI) | 0.73 [0.38, 1.40] |
| 1.2 Heterozygous or Homozygous Minor | 2 | 13 | Risk Ratio (M‐H, Random, 95% CI) | 0.41 [0.06, 2.76] |
| Outcome or subgroup title | No. of studies | No. of participants | Statistical method | Effect size |
| 1 End of Treatment Show forest plot | 2 | 532 | Risk Ratio (M‐H, Random, 95% CI) | 1.18 [0.91, 1.52] |
| 1.1 Homozygous Major | 2 | 204 | Risk Ratio (M‐H, Random, 95% CI) | 1.17 [0.54, 2.52] |
| 1.2 Heterozygous | 2 | 264 | Risk Ratio (M‐H, Random, 95% CI) | 1.21 [0.92, 1.60] |
| 1.3 Homozygous Minor | 2 | 64 | Risk Ratio (M‐H, Random, 95% CI) | 1.24 [0.68, 2.25] |
| Outcome or subgroup title | No. of studies | No. of participants | Statistical method | Effect size |
| 1 End of Treatment Show forest plot | 2 | 87 | Risk Ratio (M‐H, Random, 95% CI) | 0.66 [0.35, 1.23] |
| 1.1 Homozygous Major | 2 | 50 | Risk Ratio (M‐H, Random, 95% CI) | 0.56 [0.23, 1.35] |
| 1.2 Heterozygous or Homozygous Minor | 2 | 37 | Risk Ratio (M‐H, Random, 95% CI) | 0.77 [0.32, 1.90] |
| Outcome or subgroup title | No. of studies | No. of participants | Statistical method | Effect size |
| 1 End of Treatment Show forest plot | 2 | 531 | Risk Ratio (M‐H, Random, 95% CI) | 1.15 [0.96, 1.39] |
| 1.1 Homozygous Major | 2 | 236 | Risk Ratio (M‐H, Random, 95% CI) | 1.19 [0.77, 1.84] |
| 1.2 Heterozygous | 2 | 229 | Risk Ratio (M‐H, Random, 95% CI) | 1.11 [0.82, 1.51] |
| 1.3 Homozygous Minor | 2 | 66 | Risk Ratio (M‐H, Random, 95% CI) | 1.34 [0.80, 2.25] |
| Outcome or subgroup title | No. of studies | No. of participants | Statistical method | Effect size |
| 1 End of Treatment Show forest plot | 2 | 94 | Risk Ratio (M‐H, Random, 95% CI) | 0.49 [0.25, 0.99] |
| 1.1 Homozygous Major | 2 | 65 | Risk Ratio (M‐H, Random, 95% CI) | 0.43 [0.18, 1.01] |
| 1.2 Heterozygous or Homozygous Minor | 2 | 29 | Risk Ratio (M‐H, Random, 95% CI) | 0.73 [0.13, 4.20] |
| Outcome or subgroup title | No. of studies | No. of participants | Statistical method | Effect size |
| 1 End of Treatment Show forest plot | 2 | 533 | Risk Ratio (M‐H, Random, 95% CI) | 1.16 [0.95, 1.42] |
| 1.1 Homozygous Major | 2 | 145 | Risk Ratio (M‐H, Random, 95% CI) | 1.01 [0.65, 1.59] |
| 1.2 Heterozygous | 2 | 272 | Risk Ratio (M‐H, Random, 95% CI) | 1.27 [0.81, 2.00] |
| 1.3 Homozygous Minor | 2 | 116 | Risk Ratio (M‐H, Random, 95% CI) | 1.29 [0.90, 1.84] |
| Outcome or subgroup title | No. of studies | No. of participants | Statistical method | Effect size |
| 1 End of Treatment Show forest plot | 2 | 87 | Risk Ratio (M‐H, Random, 95% CI) | 0.75 [0.39, 1.43] |
| 1.1 Homozygous Major | 2 | 33 | Risk Ratio (M‐H, Random, 95% CI) | 0.61 [0.13, 2.86] |
| 1.2 Heterozygous or Homozygous Minor | 2 | 54 | Risk Ratio (M‐H, Random, 95% CI) | 0.73 [0.27, 1.93] |
| Outcome or subgroup title | No. of studies | No. of participants | Statistical method | Effect size |
| 1 End of Treatment Show forest plot | 2 | 531 | Risk Ratio (M‐H, Random, 95% CI) | 1.20 [0.97, 1.49] |
| 1.1 Homozygous Major | 2 | 279 | Risk Ratio (M‐H, Random, 95% CI) | 1.22 [0.66, 2.25] |
| 1.2 Heterozygous | 2 | 214 | Risk Ratio (M‐H, Random, 95% CI) | 1.22 [0.92, 1.62] |
| 1.3 Homozygous Minor | 2 | 38 | Risk Ratio (M‐H, Random, 95% CI) | 1.68 [0.89, 3.17] |
| Outcome or subgroup title | No. of studies | No. of participants | Statistical method | Effect size |
| 1 End of Treatment Show forest plot | 2 | 87 | Risk Ratio (M‐H, Random, 95% CI) | 0.63 [0.33, 1.20] |
| 1.1 Homozygous Major | 2 | 76 | Risk Ratio (M‐H, Random, 95% CI) | 0.59 [0.30, 1.15] |
| 1.2 Heterozygous or Homozygous Minor | 2 | 11 | Risk Ratio (M‐H, Random, 95% CI) | 1.2 [0.17, 8.24] |
| Outcome or subgroup title | No. of studies | No. of participants | Statistical method | Effect size |
| 1 End of Treatment Show forest plot | 2 | 533 | Risk Ratio (M‐H, Random, 95% CI) | 1.18 [0.92, 1.50] |
| 1.1 Homozygous Major | 2 | 359 | Risk Ratio (M‐H, Random, 95% CI) | 1.09 [0.86, 1.37] |
| 1.2 Heterozygous | 2 | 159 | Risk Ratio (M‐H, Random, 95% CI) | 1.30 [0.62, 2.75] |
| 1.3 Homozygous Minor | 2 | 15 | Risk Ratio (M‐H, Random, 95% CI) | 2.17 [0.51, 9.18] |
| Outcome or subgroup title | No. of studies | No. of participants | Statistical method | Effect size |
| 1 End of Treatment Show forest plot | 2 | 87 | Risk Ratio (M‐H, Random, 95% CI) | 0.63 [0.33, 1.20] |
| 1.1 Homozygous Major | 2 | 76 | Risk Ratio (M‐H, Random, 95% CI) | 0.59 [0.30, 1.15] |
| 1.2 Heterozygous or Homozygous Minor | 2 | 11 | Risk Ratio (M‐H, Random, 95% CI) | 1.2 [0.17, 8.24] |
| Outcome or subgroup title | No. of studies | No. of participants | Statistical method | Effect size |
| 1 End of Treatment Show forest plot | 2 | 532 | Risk Ratio (M‐H, Random, 95% CI) | 1.17 [0.93, 1.47] |
| 1.1 Homozygous Major | 2 | 211 | Risk Ratio (M‐H, Random, 95% CI) | 1.28 [0.91, 1.80] |
| 1.2 Heterozygous | 2 | 241 | Risk Ratio (M‐H, Random, 95% CI) | 1.00 [0.69, 1.45] |
| 1.3 Homozygous Minor | 2 | 80 | Risk Ratio (M‐H, Random, 95% CI) | 1.61 [0.64, 4.08] |
| Outcome or subgroup title | No. of studies | No. of participants | Statistical method | Effect size |
| 1 End of Treatment Show forest plot | 2 | 87 | Risk Ratio (M‐H, Random, 95% CI) | 0.71 [0.37, 1.35] |
| 1.1 Homozygous Major | 2 | 49 | Risk Ratio (M‐H, Random, 95% CI) | 0.51 [0.09, 2.94] |
| 1.2 Heterozygous or Homozygous Minor | 2 | 38 | Risk Ratio (M‐H, Random, 95% CI) | 0.71 [0.26, 1.93] |
| Outcome or subgroup title | No. of studies | No. of participants | Statistical method | Effect size |
| 1 Six‐Month Abstinence Show forest plot | 7 | Risk Ratio (M‐H, Random, 95% CI) | Subtotals only | |
| 1.1 Homozygous Major vs Homozygous Minor | 7 | 1559 | Risk Ratio (M‐H, Random, 95% CI) | 0.92 [0.71, 1.19] |
| 1.2 Heterozygous vs Homozygous Minor | 7 | 1650 | Risk Ratio (M‐H, Random, 95% CI) | 0.91 [0.75, 1.11] |
| 2 End of Treatment Show forest plot | 5 | Risk Ratio (M‐H, Random, 95% CI) | Subtotals only | |
| 2.1 Homozygous Major vs Homozygous Minor | 5 | 1200 | Risk Ratio (M‐H, Random, 95% CI) | 0.88 [0.73, 1.06] |
| 2.2 Heterozygous vs Homozygous Minor | 5 | 1291 | Risk Ratio (M‐H, Random, 95% CI) | 0.93 [0.79, 1.10] |
| Outcome or subgroup title | No. of studies | No. of participants | Statistical method | Effect size |
| 1 Six‐Month Abstinence Show forest plot | 2 | Risk Ratio (M‐H, Random, 95% CI) | Subtotals only | |
| 1.1 Homozygous Major vs Homozygous Minor | 2 | 187 | Risk Ratio (M‐H, Random, 95% CI) | 1.08 [0.26, 4.57] |
| 1.2 Heterozygous vs Homozygous Minor | 2 | 56 | Risk Ratio (M‐H, Random, 95% CI) | 1.11 [0.25, 4.99] |
| Outcome or subgroup title | No. of studies | No. of participants | Statistical method | Effect size |
| 1 Six‐Month Abstinence Show forest plot | 2 | Risk Ratio (M‐H, Random, 95% CI) | Subtotals only | |
| 1.1 Homozygous Major vs Heterozygous or Homozygous Minor | 2 | 392 | Risk Ratio (M‐H, Random, 95% CI) | 2.24 [0.92, 5.45] |
| 2 End of Treatment Show forest plot | 2 | Risk Ratio (M‐H, Random, 95% CI) | Subtotals only | |
| 2.1 Homozygous Major vs Heterozygous or Homozygous Minor | 2 | 392 | Risk Ratio (M‐H, Random, 95% CI) | 2.75 [1.08, 7.02] |
| Outcome or subgroup title | No. of studies | No. of participants | Statistical method | Effect size |
| 1 Six‐Month Abstinence Show forest plot | 3 | Risk Ratio (M‐H, Random, 95% CI) | Subtotals only | |
| 1.1 Homozygous Major vs Homozygous Minor | 3 | 433 | Risk Ratio (M‐H, Random, 95% CI) | 1.05 [0.80, 1.37] |
| 1.2 Heterozygous vs Homozygous Minor | 3 | 546 | Risk Ratio (M‐H, Random, 95% CI) | 0.99 [0.76, 1.29] |
| 2 End of Treatment Show forest plot | 3 | Risk Ratio (M‐H, Random, 95% CI) | Subtotals only | |
| 2.1 Homozygous Major vs Homozygous Minor | 3 | 429 | Risk Ratio (M‐H, Random, 95% CI) | 0.95 [0.76, 1.18] |
| 2.2 Heterozygous vs Homozygous Minor | 3 | 542 | Risk Ratio (M‐H, Random, 95% CI) | 0.95 [0.77, 1.17] |
| Outcome or subgroup title | No. of studies | No. of participants | Statistical method | Effect size |
| 1 Six‐Month Abstinence Show forest plot | 2 | Risk Ratio (M‐H, Random, 95% CI) | Subtotals only | |
| 1.1 Homozygous Major vs Homozygous Minor | 2 | 501 | Risk Ratio (M‐H, Random, 95% CI) | 0.79 [0.60, 1.03] |
| 1.2 Heterozygous vs Homozygous Minor | 2 | 579 | Risk Ratio (M‐H, Random, 95% CI) | 0.83 [0.63, 1.10] |
| 2 End of Treatment Show forest plot | 2 | Risk Ratio (M‐H, Random, 95% CI) | Subtotals only | |
| 2.1 Homozygous Major vs Homozygous Minor | 2 | 501 | Risk Ratio (M‐H, Random, 95% CI) | 0.89 [0.59, 1.35] |
| 2.2 Heterozygous vs Homozygous Minor | 2 | 579 | Risk Ratio (M‐H, Random, 95% CI) | 1.00 [0.61, 1.64] |
| Outcome or subgroup title | No. of studies | No. of participants | Statistical method | Effect size |
| 1 Six‐Month Abstinence Show forest plot | 2 | Risk Ratio (M‐H, Random, 95% CI) | Subtotals only | |
| 1.1 Homozygous Major vs Heterozygous or Homozygous Minor | 2 | 391 | Risk Ratio (M‐H, Random, 95% CI) | 1.25 [0.87, 1.81] |
| 2 End of Treatment Show forest plot | 2 | Risk Ratio (M‐H, Random, 95% CI) | Subtotals only | |
| 2.1 Homozygous Major vs Heterozygous or Homozygous Minor | 2 | 391 | Risk Ratio (M‐H, Random, 95% CI) | 1.73 [1.20, 2.49] |
| Outcome or subgroup title | No. of studies | No. of participants | Statistical method | Effect size |
| 1 Six‐Month Abstinence Show forest plot | 3 | Risk Ratio (M‐H, Random, 95% CI) | Subtotals only | |
| 1.1 Homozygous Major vs Homozygous Minor | 3 | 866 | Risk Ratio (M‐H, Random, 95% CI) | 0.95 [0.51, 1.76] |
| 1.2 Heterozygous vs Homozygous Minor | 3 | 321 | Risk Ratio (M‐H, Random, 95% CI) | 0.81 [0.42, 1.60] |
| 2 End of Treatment Show forest plot | 3 | Risk Ratio (M‐H, Random, 95% CI) | Subtotals only | |
| 2.1 Homozygous Major vs Homozygous Minor | 3 | 866 | Risk Ratio (M‐H, Random, 95% CI) | 0.93 [0.71, 1.23] |
| 2.2 Heterozygous vs Homozygous Minor | 3 | 321 | Risk Ratio (M‐H, Random, 95% CI) | 0.85 [0.58, 1.26] |
| Outcome or subgroup title | No. of studies | No. of participants | Statistical method | Effect size |
| 1 Six‐Month Abstinence Show forest plot | 2 | Risk Ratio (M‐H, Random, 95% CI) | Subtotals only | |
| 1.1 Homozygous Major vs Homozygous Minor | 2 | 461 | Risk Ratio (M‐H, Random, 95% CI) | 0.92 [0.50, 1.67] |
| 1.2 Heterozygous vs Homozygous Minor | 2 | 649 | Risk Ratio (M‐H, Random, 95% CI) | 1.12 [0.66, 1.90] |
| 2 End of Treatment Show forest plot | 2 | Risk Ratio (M‐H, Random, 95% CI) | Subtotals only | |
| 2.1 Homozygous Major vs Homozygous Minor | 2 | 461 | Risk Ratio (M‐H, Random, 95% CI) | 0.97 [0.77, 1.23] |
| 2.2 Heterozygous vs Homozygous Minor | 2 | 649 | Risk Ratio (M‐H, Random, 95% CI) | 0.94 [0.74, 1.18] |
| Outcome or subgroup title | No. of studies | No. of participants | Statistical method | Effect size |
| 1 Six‐Month Abstinence Show forest plot | 2 | Risk Ratio (M‐H, Random, 95% CI) | Subtotals only | |
| 1.1 Normal NMR vs Slow NMR | 2 | 718 | Risk Ratio (M‐H, Random, 95% CI) | 0.54 [0.37, 0.78] |
| 2 End of Treatment Show forest plot | 2 | Risk Ratio (M‐H, Random, 95% CI) | Subtotals only | |
| 2.1 Normal NMR vs Slow NMR | 2 | 718 | Risk Ratio (M‐H, Random, 95% CI) | 0.77 [0.58, 1.03] |
| Outcome or subgroup title | No. of studies | No. of participants | Statistical method | Effect size |
| 1 Six‐Month Abstinence Show forest plot | 4 | Risk Ratio (M‐H, Random, 95% CI) | Subtotals only | |
| 1.1 Homozygous Major vs Homozygous Minor | 4 | 316 | Risk Ratio (M‐H, Random, 95% CI) | 1.27 [0.67, 2.43] |
| 1.2 Heterozygous vs Homozygous Minor | 4 | 390 | Risk Ratio (M‐H, Random, 95% CI) | 1.15 [0.65, 2.03] |
| 2 End of Treatment Show forest plot | 6 | Risk Ratio (M‐H, Random, 95% CI) | Subtotals only | |
| 2.1 Homozygous Major vs Homozygous Minor | 6 | 386 | Risk Ratio (M‐H, Random, 95% CI) | 1.15 [0.88, 1.50] |
| 2.2 Heterozygous vs Homozygous Minor | 6 | 480 | Risk Ratio (M‐H, Random, 95% CI) | 1.04 [0.81, 1.33] |
| Outcome or subgroup title | No. of studies | No. of participants | Statistical method | Effect size |
| 1 Six‐Month Abstinence Show forest plot | 2 | Risk Ratio (M‐H, Random, 95% CI) | Subtotals only | |
| 1.1 Homozygous Major vs Heterozygous or Homozygous Minor | 2 | 63 | Risk Ratio (M‐H, Random, 95% CI) | 0.83 [0.36, 1.95] |
| 2 End of Treatment Show forest plot | 3 | Risk Ratio (M‐H, Random, 95% CI) | Subtotals only | |
| 2.1 Homozygous Major vs Heterozygous or Homozygous Minor | 3 | 84 | Risk Ratio (M‐H, Random, 95% CI) | 0.94 [0.51, 1.72] |
| Outcome or subgroup title | No. of studies | No. of participants | Statistical method | Effect size |
| 1 End of Treatment Show forest plot | 3 | Risk Ratio (M‐H, Random, 95% CI) | Subtotals only | |
| 1.1 Homozygous Major vs Homozygous Minor | 3 | 160 | Risk Ratio (M‐H, Random, 95% CI) | 1.47 [0.96, 2.25] |
| 1.2 Heterozygous vs Homozygous Minor | 3 | 216 | Risk Ratio (M‐H, Random, 95% CI) | 1.20 [0.79, 1.84] |
| Outcome or subgroup title | No. of studies | No. of participants | Statistical method | Effect size |
| 1 Six‐Month Abstinence Show forest plot | 2 | Risk Ratio (M‐H, Random, 95% CI) | Subtotals only | |
| 1.1 Homozygous Major vs Heterozygous or Homozygous Minor | 2 | 294 | Risk Ratio (M‐H, Random, 95% CI) | 0.62 [0.31, 1.21] |
| 2 End of Treatment Show forest plot | 3 | Risk Ratio (M‐H, Random, 95% CI) | Subtotals only | |
| 2.1 Homozygous Major vs Heterozygous or Homozygous Minor | 3 | 315 | Risk Ratio (M‐H, Random, 95% CI) | 0.79 [0.48, 1.32] |
| Outcome or subgroup title | No. of studies | No. of participants | Statistical method | Effect size |
| 1 Six‐Month Abstinence Show forest plot | 4 | Risk Ratio (M‐H, Random, 95% CI) | Subtotals only | |
| 1.1 Homozygous Major vs Homozygous Minor | 4 | 304 | Risk Ratio (M‐H, Random, 95% CI) | 0.83 [0.52, 1.34] |
| 1.2 Heterozygous vs Homozygous Minor | 4 | 401 | Risk Ratio (M‐H, Random, 95% CI) | 0.90 [0.66, 1.21] |
| 2 End of Treatment Show forest plot | 4 | Risk Ratio (M‐H, Random, 95% CI) | Subtotals only | |
| 2.1 Homozygous Major vs Homozygous Minor | 4 | 304 | Risk Ratio (M‐H, Random, 95% CI) | 0.89 [0.69, 1.14] |
| 2.2 Heterozygous vs Homozygous Minor | 4 | 400 | Risk Ratio (M‐H, Random, 95% CI) | 0.96 [0.76, 1.22] |
| Outcome or subgroup title | No. of studies | No. of participants | Statistical method | Effect size |
| 1 Six‐Month Abstinence Show forest plot | 2 | Risk Ratio (M‐H, Random, 95% CI) | Subtotals only | |
| 1.1 Homozygous Major vs Homozygous Minor | 2 | 208 | Risk Ratio (M‐H, Random, 95% CI) | 0.77 [0.33, 1.81] |
| 1.2 Heterozygous vs Homozygous Minor | 2 | 269 | Risk Ratio (M‐H, Random, 95% CI) | 0.83 [0.51, 1.37] |
| 2 End of Treatment Show forest plot | 4 | Risk Ratio (M‐H, Random, 95% CI) | Subtotals only | |
| 2.1 Homozygous Major vs Homozygous Minor | 4 | 277 | Risk Ratio (M‐H, Random, 95% CI) | 1.16 [0.79, 1.70] |
| 2.2 Heterozygous vs Homozygous Minor | 4 | 361 | Risk Ratio (M‐H, Random, 95% CI) | 0.96 [0.61, 1.51] |
| Outcome or subgroup title | No. of studies | No. of participants | Statistical method | Effect size |
| 1 Six‐Month Abstinence Show forest plot | 3 | Risk Ratio (M‐H, Random, 95% CI) | Subtotals only | |
| 1.1 Homozygous Major vs Heterozygous or Homozygous Minor | 3 | 331 | Risk Ratio (M‐H, Random, 95% CI) | 0.89 [0.55, 1.46] |
| 2 End of Treatment Show forest plot | 4 | Risk Ratio (M‐H, Random, 95% CI) | Subtotals only | |
| 2.1 Homozygous Major vs Heterozygous or Homozygous Minor | 4 | 352 | Risk Ratio (M‐H, Random, 95% CI) | 1.24 [0.87, 1.76] |
| Outcome or subgroup title | No. of studies | No. of participants | Statistical method | Effect size |
| 1 Six‐Month Abstinence Show forest plot | 2 | Risk Ratio (M‐H, Random, 95% CI) | Subtotals only | |
| 1.1 Homozygous Major vs Homozygous Minor | 2 | 191 | Risk Ratio (M‐H, Random, 95% CI) | 0.90 [0.56, 1.46] |
| 1.2 Heterozygous vs Homozygous Minor | 2 | 161 | Risk Ratio (M‐H, Random, 95% CI) | 1.06 [0.65, 1.71] |
| 2 End of Treatment Show forest plot | 4 | Risk Ratio (M‐H, Random, 95% CI) | Subtotals only | |
| 2.1 Homozygous Major vs Homozygous Minor | 4 | 259 | Risk Ratio (M‐H, Random, 95% CI) | 1.02 [0.73, 1.40] |
| 2.2 Heterozygous vs Homozygous Minor | 4 | 237 | Risk Ratio (M‐H, Random, 95% CI) | 0.98 [0.70, 1.36] |
| Outcome or subgroup title | No. of studies | No. of participants | Statistical method | Effect size |
| 1 End of Treatment Show forest plot | 2 | Risk Ratio (M‐H, Random, 95% CI) | Subtotals only | |
| 1.1 Homozygous Major vs Heterozygous or Homozygous Minor | 2 | 46 | Risk Ratio (M‐H, Random, 95% CI) | 1.05 [0.37, 2.99] |
| Outcome or subgroup title | No. of studies | No. of participants | Statistical method | Effect size |
| 1 End of Treatment Show forest plot | 3 | Risk Ratio (M‐H, Random, 95% CI) | Subtotals only | |
| 1.1 Homozygous Major vs Homozygous Minor | 3 | 159 | Risk Ratio (M‐H, Random, 95% CI) | 1.00 [0.71, 1.40] |
| 1.2 Heterozygous vs Homozygous Minor | 3 | 238 | Risk Ratio (M‐H, Random, 95% CI) | 0.90 [0.65, 1.23] |
| Outcome or subgroup title | No. of studies | No. of participants | Statistical method | Effect size |
| 1 End of Treatment Show forest plot | 2 | Risk Ratio (M‐H, Random, 95% CI) | Subtotals only | |
| 1.1 Homozygous Major vs Homozygous Minor | 2 | 23 | Risk Ratio (M‐H, Random, 95% CI) | 1.16 [0.32, 4.26] |
| 1.2 Heterozygous vs Homozygous Minor | 2 | 27 | Risk Ratio (M‐H, Random, 95% CI) | 0.72 [0.18, 2.93] |
| Outcome or subgroup title | No. of studies | No. of participants | Statistical method | Effect size |
| 1 End of Treatment Show forest plot | 3 | Risk Ratio (M‐H, Random, 95% CI) | Subtotals only | |
| 1.1 Homozygous Major vs Homozygous Minor | 3 | 186 | Risk Ratio (M‐H, Random, 95% CI) | 0.85 [0.54, 1.35] |
| 1.2 Heterozygous vs Homozygous Minor | 3 | 163 | Risk Ratio (M‐H, Random, 95% CI) | 0.89 [0.56, 1.42] |
| Outcome or subgroup title | No. of studies | No. of participants | Statistical method | Effect size |
| 1 End of Treatment Show forest plot | 2 | Risk Ratio (M‐H, Random, 95% CI) | Subtotals only | |
| 1.1 Homozygous Major vs Heterozygous or Homozygous Minor | 2 | 47 | Risk Ratio (M‐H, Random, 95% CI) | 1.46 [0.35, 6.01] |
| Outcome or subgroup title | No. of studies | No. of participants | Statistical method | Effect size |
| 1 End of Treatment Show forest plot | 3 | Risk Ratio (M‐H, Random, 95% CI) | Subtotals only | |
| 1.1 Homozygous Major vs Homozygous Minor | 3 | 221 | Risk Ratio (M‐H, Random, 95% CI) | 0.81 [0.42, 1.55] |
| 1.2 Heterozygous vs Homozygous Minor | 3 | 112 | Risk Ratio (M‐H, Random, 95% CI) | 0.81 [0.40, 1.64] |
| Outcome or subgroup title | No. of studies | No. of participants | Statistical method | Effect size |
| 1 End of Treatment Show forest plot | 2 | Risk Ratio (M‐H, Random, 95% CI) | Subtotals only | |
| 1.1 Homozygous Major vs Heterozygous or Homozygous Minor | 2 | 47 | Risk Ratio (M‐H, Random, 95% CI) | 1.46 [0.35, 6.01] |
| Outcome or subgroup title | No. of studies | No. of participants | Statistical method | Effect size |
| 1 End of Treatment Show forest plot | 3 | Risk Ratio (M‐H, Random, 95% CI) | Subtotals only | |
| 1.1 Homozygous Major vs Homozygous Minor | 3 | 170 | Risk Ratio (M‐H, Random, 95% CI) | 1.61 [0.87, 3.00] |
| 1.2 Heterozygous vs Homozygous Minor | 3 | 199 | Risk Ratio (M‐H, Random, 95% CI) | 1.56 [0.79, 3.06] |
| Outcome or subgroup title | No. of studies | No. of participants | Statistical method | Effect size |
| 1 End of Treatment Show forest plot | 2 | Risk Ratio (M‐H, Random, 95% CI) | Subtotals only | |
| 1.1 Homozygous Major vs Heterozygous or Homozygous Minor | 2 | 47 | Risk Ratio (M‐H, Random, 95% CI) | 1.15 [0.54, 2.44] |
| Outcome or subgroup title | No. of studies | No. of participants | Statistical method | Effect size |
| 1 Six‐Month Abstinence Show forest plot | 2 | Risk Ratio (M‐H, Random, 95% CI) | Subtotals only | |
| 1.1 Homozygous Major vs Homozygous Minor | 2 | 358 | Risk Ratio (M‐H, Random, 95% CI) | 0.94 [0.71, 1.25] |
| 1.2 Heterozygous vs Homozygous Minor | 2 | 438 | Risk Ratio (M‐H, Random, 95% CI) | 0.99 [0.75, 1.30] |
| 2 End of Treatment Show forest plot | 2 | Risk Ratio (M‐H, Random, 95% CI) | Subtotals only | |
| 2.1 Homozygous Major vs Homozygous Minor | 2 | 358 | Risk Ratio (M‐H, Random, 95% CI) | 0.98 [0.78, 1.24] |
| 2.2 Heterozygous vs Homozygous Minor | 2 | 438 | Risk Ratio (M‐H, Random, 95% CI) | 0.97 [0.77, 1.22] |
| Outcome or subgroup title | No. of studies | No. of participants | Statistical method | Effect size |
| 1 Six‐Month Abstinence Show forest plot | 2 | Risk Ratio (M‐H, Random, 95% CI) | Subtotals only | |
| 1.1 Homozygous Major vs Homozygous Minor | 2 | 354 | Risk Ratio (M‐H, Random, 95% CI) | 1.20 [0.91, 1.60] |
| 1.2 Heterozygous vs Homozygous Minor | 2 | 465 | Risk Ratio (M‐H, Random, 95% CI) | 1.18 [0.90, 1.54] |
| 2 End of Treatment Show forest plot | 2 | Risk Ratio (M‐H, Random, 95% CI) | Subtotals only | |
| 2.1 Homozygous Major vs Homozygous Minor | 2 | 354 | Risk Ratio (M‐H, Random, 95% CI) | 1.14 [0.91, 1.43] |
| 2.2 Heterozygous vs Homozygous Minor | 2 | 465 | Risk Ratio (M‐H, Random, 95% CI) | 1.10 [0.89, 1.37] |
| Outcome or subgroup title | No. of studies | No. of participants | Statistical method | Effect size |
| 1 End of Treatment Show forest plot | 2 | Risk Ratio (M‐H, Random, 95% CI) | Subtotals only | |
| 1.1 Homozygous Major vs Homozygous Minor | 2 | 138 | Risk Ratio (M‐H, Random, 95% CI) | 1.10 [0.67, 1.78] |
| 1.2 Heterozygous vs Homozygous Minor | 2 | 155 | Risk Ratio (M‐H, Random, 95% CI) | 1.11 [0.69, 1.80] |
| Outcome or subgroup title | No. of studies | No. of participants | Statistical method | Effect size |
| 1 End of Treatment Show forest plot | 2 | Risk Ratio (M‐H, Random, 95% CI) | Subtotals only | |
| 1.1 Homozygous Major vs Heterozygous or Homozygous Minor | 2 | 40 | Risk Ratio (M‐H, Random, 95% CI) | 2.26 [0.36, 14.38] |
| Outcome or subgroup title | No. of studies | No. of participants | Statistical method | Effect size |
| 1 End of Treatment Show forest plot | 2 | Risk Ratio (M‐H, Random, 95% CI) | Subtotals only | |
| 1.1 Homozygous Major vs Homozygous Minor | 2 | 136 | Risk Ratio (M‐H, Random, 95% CI) | 1.12 [0.67, 1.85] |
| 1.2 Heterozygous vs Homozygous Minor | 2 | 153 | Risk Ratio (M‐H, Random, 95% CI) | 1.13 [0.68, 1.86] |
| Outcome or subgroup title | No. of studies | No. of participants | Statistical method | Effect size |
| 1 End of Treatment Show forest plot | 2 | Risk Ratio (M‐H, Random, 95% CI) | Subtotals only | |
| 1.1 Homozygous Major vs Heterozygous or Homozygous Minor | 2 | 40 | Risk Ratio (M‐H, Random, 95% CI) | 1.66 [0.27, 10.32] |
| Outcome or subgroup title | No. of studies | No. of participants | Statistical method | Effect size |
| 1 End of Treatment Show forest plot | 2 | Risk Ratio (M‐H, Random, 95% CI) | Subtotals only | |
| 1.1 Homozygous Major vs Homozygous Minor | 2 | 135 | Risk Ratio (M‐H, Random, 95% CI) | 1.12 [0.70, 1.79] |
| 1.2 Heterozygous vs Homozygous Minor | 2 | 156 | Risk Ratio (M‐H, Random, 95% CI) | 1.04 [0.65, 1.66] |
| Outcome or subgroup title | No. of studies | No. of participants | Statistical method | Effect size |
| 1 End of Treatment Show forest plot | 2 | Risk Ratio (M‐H, Random, 95% CI) | Subtotals only | |
| 1.1 Homozygous Major vs Homozygous Minor | 2 | 28 | Risk Ratio (M‐H, Random, 95% CI) | 0.51 [0.06, 4.51] |
| 1.2 Heterozygous vs Homozygous Minor | 2 | 17 | Risk Ratio (M‐H, Random, 95% CI) | 0.70 [0.03, 15.98] |
| Outcome or subgroup title | No. of studies | No. of participants | Statistical method | Effect size |
| 1 End of Treatment Show forest plot | 2 | Risk Ratio (M‐H, Random, 95% CI) | Subtotals only | |
| 1.1 Homozygous Major vs Homozygous Minor | 2 | 144 | Risk Ratio (M‐H, Random, 95% CI) | 0.94 [0.66, 1.34] |
| 1.2 Heterozygous vs Homozygous Minor | 2 | 153 | Risk Ratio (M‐H, Random, 95% CI) | 0.79 [0.55, 1.14] |
| Outcome or subgroup title | No. of studies | No. of participants | Statistical method | Effect size |
| 1 End of Treatment Show forest plot | 2 | Risk Ratio (M‐H, Random, 95% CI) | Subtotals only | |
| 1.1 Homozygous Major vs Heterozygous or Homozygous Minor | 2 | 40 | Risk Ratio (M‐H, Random, 95% CI) | 0.36 [0.13, 0.99] |
| Outcome or subgroup title | No. of studies | No. of participants | Statistical method | Effect size |
| 1 End of Treatment Show forest plot | 2 | Risk Ratio (M‐H, Random, 95% CI) | Subtotals only | |
| 1.1 Homozygous Major vs Homozygous Minor | 2 | 128 | Risk Ratio (M‐H, Random, 95% CI) | 0.79 [0.57, 1.10] |
| 1.2 Heterozygous vs Homozygous Minor | 2 | 194 | Risk Ratio (M‐H, Random, 95% CI) | 0.81 [0.51, 1.28] |
| Outcome or subgroup title | No. of studies | No. of participants | Statistical method | Effect size |
| 1 End of Treatment Show forest plot | 2 | Risk Ratio (M‐H, Random, 95% CI) | Subtotals only | |
| 1.1 Homozygous Major vs Heterozygous or Homozygous Minor | 2 | 40 | Risk Ratio (M‐H, Random, 95% CI) | 1.29 [0.12, 13.56] |
| Outcome or subgroup title | No. of studies | No. of participants | Statistical method | Effect size |
| 1 End of Treatment Show forest plot | 2 | Risk Ratio (M‐H, Random, 95% CI) | Subtotals only | |
| 1.1 Homozygous Major vs Homozygous Minor | 2 | 170 | Risk Ratio (M‐H, Random, 95% CI) | 0.64 [0.43, 0.94] |
| 1.2 Heterozygous vs Homozygous Minor | 2 | 117 | Risk Ratio (M‐H, Random, 95% CI) | 0.71 [0.50, 1.03] |
| Outcome or subgroup title | No. of studies | No. of participants | Statistical method | Effect size |
| 1 End of Treatment Show forest plot | 2 | Risk Ratio (M‐H, Random, 95% CI) | Subtotals only | |
| 1.1 Homozygous Major vs Heterozygous or Homozygous Minor | 2 | 40 | Risk Ratio (M‐H, Random, 95% CI) | 0.54 [0.15, 1.94] |
| Outcome or subgroup title | No. of studies | No. of participants | Statistical method | Effect size |
| 1 End of Treatment Show forest plot | 2 | Risk Ratio (M‐H, Random, 95% CI) | Subtotals only | |
| 1.1 Homozygous Major vs Homozygous Minor | 2 | 193 | Risk Ratio (M‐H, Random, 95% CI) | 0.63 [0.37, 1.07] |
| 1.2 Heterozygous vs Homozygous Minor | 2 | 85 | Risk Ratio (M‐H, Random, 95% CI) | 0.75 [0.42, 1.32] |
| Outcome or subgroup title | No. of studies | No. of participants | Statistical method | Effect size |
| 1 End of Treatment Show forest plot | 2 | Risk Ratio (M‐H, Random, 95% CI) | Subtotals only | |
| 1.1 Homozygous Major vs Heterozygous or Homozygous Minor | 2 | 40 | Risk Ratio (M‐H, Random, 95% CI) | 0.54 [0.15, 1.94] |
| Outcome or subgroup title | No. of studies | No. of participants | Statistical method | Effect size |
| 1 End of Treatment Show forest plot | 2 | Risk Ratio (M‐H, Random, 95% CI) | Subtotals only | |
| 1.1 Homozygous Major vs Homozygous Minor | 2 | 148 | Risk Ratio (M‐H, Random, 95% CI) | 1.18 [0.84, 1.66] |
| 1.2 Heterozygous vs Homozygous Minor | 2 | 162 | Risk Ratio (M‐H, Random, 95% CI) | 0.88 [0.61, 1.26] |
| Outcome or subgroup title | No. of studies | No. of participants | Statistical method | Effect size |
| 1 End of Treatment Show forest plot | 2 | Risk Ratio (M‐H, Random, 95% CI) | Subtotals only | |
| 1.1 Homozygous Major vs Heterozygous or Homozygous Minor | 2 | 40 | Risk Ratio (M‐H, Random, 95% CI) | 0.76 [0.04, 13.56] |
| Outcome or subgroup title | No. of studies | No. of participants | Statistical method | Effect size |
| 1 Six‐Month Abstinence Show forest plot | 6 | Risk Ratio (M‐H, Random, 95% CI) | Subtotals only | |
| 1.1 Homozygous Major vs Homozygous Minor | 6 | 533 | Risk Ratio (M‐H, Random, 95% CI) | 1.29 [0.86, 1.92] |
| 1.2 Heterozygous vs Homozygous Minor | 6 | 597 | Risk Ratio (M‐H, Random, 95% CI) | 1.08 [0.72, 1.62] |
| 2 End of Treatment Show forest plot | 7 | Risk Ratio (M‐H, Random, 95% CI) | Subtotals only | |
| 2.1 Homozygous Major vs Homozygous Minor | 7 | 542 | Risk Ratio (M‐H, Random, 95% CI) | 1.39 [0.91, 2.13] |
| 2.2 Heterozygous vs Homozygous Minor | 7 | 605 | Risk Ratio (M‐H, Random, 95% CI) | 1.24 [0.81, 1.89] |
| Outcome or subgroup title | No. of studies | No. of participants | Statistical method | Effect size |
| 1 Six‐Month Abstinence Show forest plot | 2 | Risk Ratio (M‐H, Random, 95% CI) | Subtotals only | |
| 1.1 Homozygous Major vs Heterozygous or Homozygous Minor | 2 | 63 | Risk Ratio (M‐H, Random, 95% CI) | 0.73 [0.08, 6.73] |
| 2 End of Treatment Show forest plot | 3 | Risk Ratio (M‐H, Random, 95% CI) | Subtotals only | |
| 2.1 Homozygous Major vs Heterozygous or Homozygous Minor | 3 | 83 | Risk Ratio (M‐H, Random, 95% CI) | 0.76 [0.24, 2.45] |
| Outcome or subgroup title | No. of studies | No. of participants | Statistical method | Effect size |
| 1 Six‐Month Abstinence Show forest plot | 2 | Risk Ratio (M‐H, Random, 95% CI) | Subtotals only | |
| 1.1 Homozygous Major vs Homozygous Minor | 2 | 162 | Risk Ratio (M‐H, Random, 95% CI) | 1.05 [0.51, 2.14] |
| 1.2 Heterozygous vs Homozygous Minor | 2 | 211 | Risk Ratio (M‐H, Random, 95% CI) | 0.79 [0.32, 1.96] |
| 2 End of Treatment Show forest plot | 4 | Risk Ratio (M‐H, Random, 95% CI) | Subtotals only | |
| 2.1 Homozygous Major vs Homozygous Minor | 4 | 218 | Risk Ratio (M‐H, Random, 95% CI) | 1.55 [0.68, 3.53] |
| 2.2 Heterozygous vs Homozygous Minor | 4 | 276 | Risk Ratio (M‐H, Random, 95% CI) | 1.34 [0.51, 3.53] |
| Outcome or subgroup title | No. of studies | No. of participants | Statistical method | Effect size |
| 1 Six‐Month Abstinence Show forest plot | 3 | Risk Ratio (M‐H, Random, 95% CI) | Subtotals only | |
| 1.1 Homozygous Major vs Heterozygous or Homozygous Minor | 3 | 584 | Risk Ratio (M‐H, Random, 95% CI) | 0.74 [0.42, 1.33] |
| 2 End of Treatment Show forest plot | 4 | Risk Ratio (M‐H, Random, 95% CI) | Subtotals only | |
| 2.1 Homozygous Major vs Heterozygous or Homozygous Minor | 4 | 596 | Risk Ratio (M‐H, Random, 95% CI) | 0.55 [0.35, 0.86] |
| Outcome or subgroup title | No. of studies | No. of participants | Statistical method | Effect size |
| 1 Six‐Month Abstinence Show forest plot | 5 | Risk Ratio (M‐H, Random, 95% CI) | Subtotals only | |
| 1.1 Homozygous Major vs Homozygous Minor | 5 | 383 | Risk Ratio (M‐H, Random, 95% CI) | 1.04 [0.69, 1.57] |
| 1.2 Heterozygous vs Homozygous Minor | 5 | 470 | Risk Ratio (M‐H, Random, 95% CI) | 1.07 [0.72, 1.58] |
| 2 End of Treatment Show forest plot | 5 | Risk Ratio (M‐H, Random, 95% CI) | Subtotals only | |
| 2.1 Homozygous Major vs Homozygous Minor | 5 | 362 | Risk Ratio (M‐H, Random, 95% CI) | 0.88 [0.63, 1.21] |
| 2.2 Heterozygous vs Homozygous Minor | 5 | 404 | Risk Ratio (M‐H, Random, 95% CI) | 1.08 [0.80, 1.46] |
| Outcome or subgroup title | No. of studies | No. of participants | Statistical method | Effect size |
| 1 Six‐Month Abstinence Show forest plot | 2 | Risk Ratio (M‐H, Random, 95% CI) | Subtotals only | |
| 1.1 Homozygous Major vs Heterozygous or Homozygous Minor | 2 | 566 | Risk Ratio (M‐H, Random, 95% CI) | 1.20 [0.80, 1.79] |
| 2 End of Treatment Show forest plot | 2 | Risk Ratio (M‐H, Random, 95% CI) | Subtotals only | |
| 2.1 Homozygous Major vs Heterozygous or Homozygous Minor | 2 | 566 | Risk Ratio (M‐H, Random, 95% CI) | 1.12 [0.71, 1.77] |
| Outcome or subgroup title | No. of studies | No. of participants | Statistical method | Effect size |
| 1 Six‐Month Abstinence Show forest plot | 2 | Risk Ratio (M‐H, Random, 95% CI) | Subtotals only | |
| 1.1 Homozygous Major vs Homozygous Minor | 2 | 160 | Risk Ratio (M‐H, Random, 95% CI) | 1.85 [0.77, 4.44] |
| 1.2 Heterozygous vs Homozygous Minor | 2 | 209 | Risk Ratio (M‐H, Random, 95% CI) | 1.58 [0.66, 3.77] |
| 2 End of Treatment Show forest plot | 4 | Risk Ratio (M‐H, Random, 95% CI) | Subtotals only | |
| 2.1 Homozygous Major vs Homozygous Minor | 4 | 216 | Risk Ratio (M‐H, Random, 95% CI) | 1.98 [0.91, 4.35] |
| 2.2 Heterozygous vs Homozygous Minor | 4 | 275 | Risk Ratio (M‐H, Random, 95% CI) | 1.86 [0.94, 3.69] |
| Outcome or subgroup title | No. of studies | No. of participants | Statistical method | Effect size |
| 1 Six‐Month Abstinence Show forest plot | 4 | Risk Ratio (M‐H, Random, 95% CI) | Subtotals only | |
| 1.1 Homozygous Major vs Heterozygous or Homozygous Minor | 4 | 629 | Risk Ratio (M‐H, Random, 95% CI) | 1.12 [0.71, 1.77] |
| 2 End of Treatment Show forest plot | 5 | Risk Ratio (M‐H, Random, 95% CI) | Subtotals only | |
| 2.1 Homozygous Major vs Heterozygous or Homozygous Minor | 5 | 641 | Risk Ratio (M‐H, Random, 95% CI) | 1.08 [0.71, 1.64] |
| Outcome or subgroup title | No. of studies | No. of participants | Statistical method | Effect size |
| 1 Six‐Month Abstinence Show forest plot | 3 | Risk Ratio (M‐H, Random, 95% CI) | Subtotals only | |
| 1.1 Homozygous Major vs Homozygous Minor | 3 | 387 | Risk Ratio (M‐H, Random, 95% CI) | 1.07 [0.37, 3.16] |
| 1.2 Heterozygous vs Homozygous Minor | 3 | 212 | Risk Ratio (M‐H, Random, 95% CI) | 0.60 [0.22, 1.63] |
| 2 End of Treatment Show forest plot | 3 | Risk Ratio (M‐H, Random, 95% CI) | Subtotals only | |
| 2.1 Homozygous Major vs Homozygous Minor | 3 | 387 | Risk Ratio (M‐H, Random, 95% CI) | 1.08 [0.51, 2.29] |
| 2.2 Heterozygous vs Homozygous Minor | 3 | 212 | Risk Ratio (M‐H, Random, 95% CI) | 0.88 [0.61, 1.29] |
| Outcome or subgroup title | No. of studies | No. of participants | Statistical method | Effect size |
| 1 Six‐Month Abstinence Show forest plot | 2 | Risk Ratio (M‐H, Random, 95% CI) | Subtotals only | |
| 1.1 Homozygous Major vs Homozygous Minor | 2 | 162 | Risk Ratio (M‐H, Random, 95% CI) | 0.84 [0.46, 1.51] |
| 1.2 Heterozygous vs Homozygous Minor | 2 | 142 | Risk Ratio (M‐H, Random, 95% CI) | 0.66 [0.35, 1.26] |
| 2 End of Treatment Show forest plot | 4 | Risk Ratio (M‐H, Random, 95% CI) | Subtotals only | |
| 2.1 Homozygous Major vs Homozygous Minor | 4 | 215 | Risk Ratio (M‐H, Random, 95% CI) | 1.23 [0.74, 2.05] |
| 2.2 Heterozygous vs Homozygous Minor | 4 | 203 | Risk Ratio (M‐H, Random, 95% CI) | 0.97 [0.57, 1.65] |
| Outcome or subgroup title | No. of studies | No. of participants | Statistical method | Effect size |
| 1 End of Treatment Show forest plot | 3 | Risk Ratio (M‐H, Random, 95% CI) | Subtotals only | |
| 1.1 Homozygous Major vs Homozygous Minor | 3 | 113 | Risk Ratio (M‐H, Random, 95% CI) | 0.81 [0.45, 1.45] |
| 1.2 Heterozygous vs Homozygous Minor | 3 | 160 | Risk Ratio (M‐H, Random, 95% CI) | 0.95 [0.57, 1.60] |
| Outcome or subgroup title | No. of studies | No. of participants | Statistical method | Effect size |
| 1 End of Treatment Show forest plot | 2 | Risk Ratio (M‐H, Random, 95% CI) | Subtotals only | |
| 1.1 Homozygous Major vs Heterozygous or Homozygous Minor | 2 | 29 | Risk Ratio (M‐H, Random, 95% CI) | 1.17 [0.27, 5.04] |
| Outcome or subgroup title | No. of studies | No. of participants | Statistical method | Effect size |
| 1 End of Treatment Show forest plot | 3 | Risk Ratio (M‐H, Random, 95% CI) | Subtotals only | |
| 1.1 Homozygous Major vs Homozygous Minor | 3 | 129 | Risk Ratio (M‐H, Random, 95% CI) | 0.81 [0.18, 3.62] |
| 1.2 Heterozygous vs Homozygous Minor | 3 | 116 | Risk Ratio (M‐H, Random, 95% CI) | 0.80 [0.39, 1.63] |
| Outcome or subgroup title | No. of studies | No. of participants | Statistical method | Effect size |
| 1 End of Treatment Show forest plot | 2 | Risk Ratio (M‐H, Random, 95% CI) | Subtotals only | |
| 1.1 Homozygous Major vs Heterozygous or Homozygous Minor | 2 | 29 | Risk Ratio (M‐H, Random, 95% CI) | 0.72 [0.19, 2.78] |
| Outcome or subgroup title | No. of studies | No. of participants | Statistical method | Effect size |
| 1 End of Treatment Show forest plot | 3 | Risk Ratio (M‐H, Random, 95% CI) | Subtotals only | |
| 1.1 Homozygous Major vs Homozygous Minor | 3 | 163 | Risk Ratio (M‐H, Random, 95% CI) | 0.95 [0.29, 3.14] |
| 1.2 Heterozygous vs Homozygous Minor | 3 | 77 | Risk Ratio (M‐H, Random, 95% CI) | 1.20 [0.36, 4.03] |
| Outcome or subgroup title | No. of studies | No. of participants | Statistical method | Effect size |
| 1 End of Treatment Show forest plot | 2 | Risk Ratio (M‐H, Random, 95% CI) | Subtotals only | |
| 1.1 Homozygous Major vs Heterozygous or Homozygous Minor | 2 | 29 | Risk Ratio (M‐H, Random, 95% CI) | 0.49 [0.18, 1.32] |
| Outcome or subgroup title | No. of studies | No. of participants | Statistical method | Effect size |
| 1 End of Treatment Show forest plot | 3 | Risk Ratio (M‐H, Random, 95% CI) | Subtotals only | |
| 1.1 Homozygous Major vs Homozygous Minor | 3 | 129 | Risk Ratio (M‐H, Random, 95% CI) | 0.97 [0.52, 1.82] |
| 1.2 Heterozygous vs Homozygous Minor | 3 | 140 | Risk Ratio (M‐H, Random, 95% CI) | 1.15 [0.63, 2.12] |
| Outcome or subgroup title | No. of studies | No. of participants | Statistical method | Effect size |
| 1 End of Treatment Show forest plot | 2 | Risk Ratio (M‐H, Random, 95% CI) | Subtotals only | |
| 1.1 Homozygous Major vs Heterozygous or Homozygous Minor | 2 | 29 | Risk Ratio (M‐H, Random, 95% CI) | 0.98 [0.03, 38.58] |
| Outcome or subgroup title | No. of studies | No. of participants | Statistical method | Effect size |
| 1 Six‐Month Abstinence Show forest plot | 2 | Risk Ratio (M‐H, Random, 95% CI) | Subtotals only | |
| 1.1 Homozygous Major or Heterozygous vs Homozygous Minor | 2 | 151 | Risk Ratio (M‐H, Random, 95% CI) | 0.75 [0.32, 1.79] |
| 2 End of Treatment Show forest plot | 2 | Risk Ratio (M‐H, Random, 95% CI) | Subtotals only | |
| 2.1 Homozygous Major or Heterozygous vs Homozygous Minor | 2 | 151 | Risk Ratio (M‐H, Random, 95% CI) | 1.07 [0.83, 1.38] |
| Outcome or subgroup title | No. of studies | No. of participants | Statistical method | Effect size |
| 1 Six‐Month Abstinence Show forest plot | 2 | Risk Ratio (M‐H, Random, 95% CI) | Subtotals only | |
| 1.1 Normal NMR vs Slow NMR | 2 | 699 | Risk Ratio (M‐H, Random, 95% CI) | 1.02 [0.70, 1.48] |
| 2 End of Treatment Show forest plot | 2 | Risk Ratio (M‐H, Random, 95% CI) | Subtotals only | |
| 2.1 Normal NMR vs Slow NMR | 2 | 718 | Risk Ratio (M‐H, Random, 95% CI) | 0.63 [0.35, 1.14] |