Antisépticos para las quemaduras
Información
- DOI:
- https://doi.org/10.1002/14651858.CD011821.pub2Copiar DOI

- Base de datos:
-
- Cochrane Database of Systematic Reviews
- Versión publicada:
-
- 12 julio 2017see what's new
- Tipo:
-
- Intervention
- Etapa:
-
- Review
- Grupo Editorial Cochrane:
-
Grupo Cochrane de Heridas
- Copyright:
-
- Copyright © 2017 The Cochrane Collaboration. Published by John Wiley & Sons, Ltd.
Cifras del artículo
Altmetric:
Citado por:
Autores
Contributions of authors
Gill Norman: designed and co‐ordinated the review; extracted data; checked the quality of data extraction; analysed and interpreted data; undertook and checked quality assessment; performed statistical analysis; produced the first draft of the review; contributed to writing and editing the review; made an intellectual contribution to the review; wrote to study authors; approved the final review prior to submission and is a guarantor of the review.
Janice Christie: extracted data; checked the quality of data extraction; analysed and interpreted data; undertook and checked quality assessment; made an intellectual contribution to the review wrote to study authors and approved the final review prior to submission.
Zhenmi Liu: extracted data; analysed and interpreted data; undertook quality assessment; made an intellectual contribution to the review; performed translations and approved the final review prior to submission.
Maggie Westby: checked the quality of data extraction; analysed and interpreted data; checked quality assessment; performed statistical analysis; checked the quality of the statistical analysis; contributed to writing or editing the review; made an intellectual contribution to the review; advised on the review and approved the final review prior to submission.
Jayne Jefferies: extracted data; undertook quality assessment; made an intellectual contribution to the review; and approved the final review prior to submission.
Thomas Hudson: extracted data; undertook quality assessment; made an intellectual contribution to the review and approved the final review prior to submission.
Jacky Edwards: contributed to writing or editing the review; made an intellectual contribution to the review and approved the final review prior to submission.
Devi Mohapatra: contributed to writing or editing the review; made an intellectual contribution to the review and approved the final review prior to submission.
Ibrahim Hassan: made an intellectual contribution to the review and approved the final review prior to submission..
Jo Dumville: contributed to writing and editing the review; made an intellectual contribution to the review; advised on the review; approved the final review prior to submission and is a guarantor of the review.
Contributions of editorial base:
Andrea Nelson (Editor): edited the protocol; advised on methodology, interpretation and protocol content; approved the final protocol prior to submission.
Tanya Walsh (Editor): edited the review; advised on methodology, interpretation and review content; approved the final review prior to submission.
Gill Rizzello (Managing Editor) co‐ordinated the editorial process; advised on interpretation and content; edited the protocol and the review.
Reetu Child and Naomi Shaw (Information Specialists): designed the search strategy; edited the search methods section and ran the searches.
Ursula Gonthier (Editorial Assistant) edited the references and the Plain Language Summary.
Sources of support
Internal sources
-
Division of Nursing, Midwifery and Social Work, School of Health Sciences, University of Manchester, UK.
External sources
-
National Institute for Health Research (NIHR), UK.
This project was supported by the National Institute for Health Research, via Cochrane Infrastructure and Cochrane Programme Grant funding (NIHR Cochrane Programme Grant 13/89/08 – High Priority Cochrane Reviews in Wound Prevention and Treatment) to Cochrane Wounds and by the NIHR Research Methods Programme Systematic Review Fellowship NIHR‐RMFI‐2015‐06‐52 (Zhenmi Liu). The views and opinions expressed therein are those of the authors and do not necessarily reflect those of the Systematic Reviews Programme, NIHR, NHS or the Department of Health.
-
National Institute for Health Research Collaboration for Leadership in Applied Health Research and Care (NIHR CLAHRC) Greater Manchester, UK.
Jo Dumville was partly funded by the National Institute for Health Research Collaboration for Leadership in Applied Health Research and Care (NIHR CLAHRC) Greater Manchester. The funder had no role in the design of the studies, data collection and analysis, decision to publish, or preparation of the manuscript. However, the review may be considered to be affiliated to the work of the NIHR CLAHRC Greater Manchester. The views expressed herein are those of the authors and not necessarily those of the NHS, NIHR or the Department of Health.
Declarations of interest
Gill Norman: my employment at the University of Manchester is funded by the National Institute for Health Research (NIHR) UK and focuses on high priority Cochrane Reviews in the prevention and treatment of wounds.
Janice Christie: none known.
Zhenmi Lui: my employment at the University of Manchester is funded by the NIHR (NIHR Research Methods Programme Systematic Review Fellowship NIHR‐RMFI‐2015‐06‐52).
Maggie Westby: My employment at the University of Manchester is funded by the NIHR and focuses on high priority Cochrane Reviews in the prevention and treatment of wounds.
Jayne Jeffries: none known.
Thomas Hudson: none known.
Jacky Edwards: none known.
Devi Prasad Mohapatra: none known.
Ibrahim Hassan: none known.
Jo Dumville: I receive research funding from the NIHR for the production of systematic reviews focusing on high priority Cochrane Reviews in the prevention and treatment of wounds. This work was also partly funded by the National Institute for Health Research Collaboration for Leadership in Applied Health Research and Care (NIHR CLAHRC) Greater Manchester.
Andrew Jull (peer reviewer) is the author of a published Cochrane Review investigating the effect of honey on wounds Jull 2015, which was the source of some of the raw data for this review.
Acknowledgements
The authors would like to acknowledge the contribution to the protocol of peer referees David Margolis, Heather Cleland, Camila Pino, Christine Fyfe and Abimbola Farinde and the copy editor Clare Dooley; and the contributions to the review of peer referees Andrew Jull, Mark Rodgers, Camila Pino and Caitlin Mitchell. They are also grateful to the copy editor, Denise Mitchell.
We would also like to acknowledge the translation assistance of Mario Cruciani, Irina Telegina, Jennifer Brown, Rachel Riera, Ana Luiza C Martimbianco and Debra Fayter.
Version history
| Published | Title | Stage | Authors | Version |
| 2017 Jul 12 | Antiseptics for burns | Review | Gill Norman, Janice Christie, Zhenmi Liu, Maggie J Westby, Jayne M Jefferies, Thomas Hudson, Jacky Edwards, Devi Prasad Mohapatra, Ibrahim A Hassan, Jo C Dumville | |
| 2015 Aug 10 | Antiseptics for burns | Protocol | Gill Norman, Jo C Dumville, Devi Prasad Mohapatra, Ibrahim A Hassan, Jacky Edwards, Janice Christie | |
Differences between protocol and review
The protocol did not address a particular study design which several of our included studies employed: the intra‐individual design where burns or burn areas were randomised to different treatments. The closest parallel to this is the 'split‐mouth' design. It was not clear that the analyses of these studies took the design into account. We have adopted the approach of including these studies in our meta‐analyses but undertaking post‐hoc sensitivity analyses to explore the impact of including them. Where there was a substantive difference between the results of the principal analysis and the sensitivity analysis we were conservative and used the results of the sensitivity analysis to inform the GRADE assessment.
Due to the large number of comparisons included in the review we did not produce a 'Summary of findings' table for every outcome for every comparison, in order to keep them to a manageable size. Instead, where comparisons had limited available data for prespecified outcomes we presented these data together with GRADE judgements in an additional table. Due to the large number of comparisons that only reported mean time to healing (where all wounds healed) as a measure of healing, we included this in both 'Summary of findings' tables and additional tables of GRADE judgements.
Keywords
MeSH
Medical Subject Headings (MeSH) Keywords
- Anti-Bacterial Agents [therapeutic use];
- Anti-Infective Agents, Local [adverse effects, *therapeutic use];
- Apitherapy [*methods];
- Bacterial Infections [etiology, *therapy];
- Bandages;
- Burns [*complications, *therapy];
- Chlorhexidine [therapeutic use];
- Disinfectants [therapeutic use];
- Honey;
- Merbromin [therapeutic use];
- Plant Preparations [therapeutic use];
- Povidone-Iodine [therapeutic use];
- Randomized Controlled Trials as Topic;
- Silver Sulfadiazine [therapeutic use];
- Sodium Hypochlorite [therapeutic use];
- Sulfadiazine [therapeutic use];
- *Wound Healing;
Medical Subject Headings Check Words
Adult; Humans;
PICO

PRISMA flow diagram

Network of included treatment types
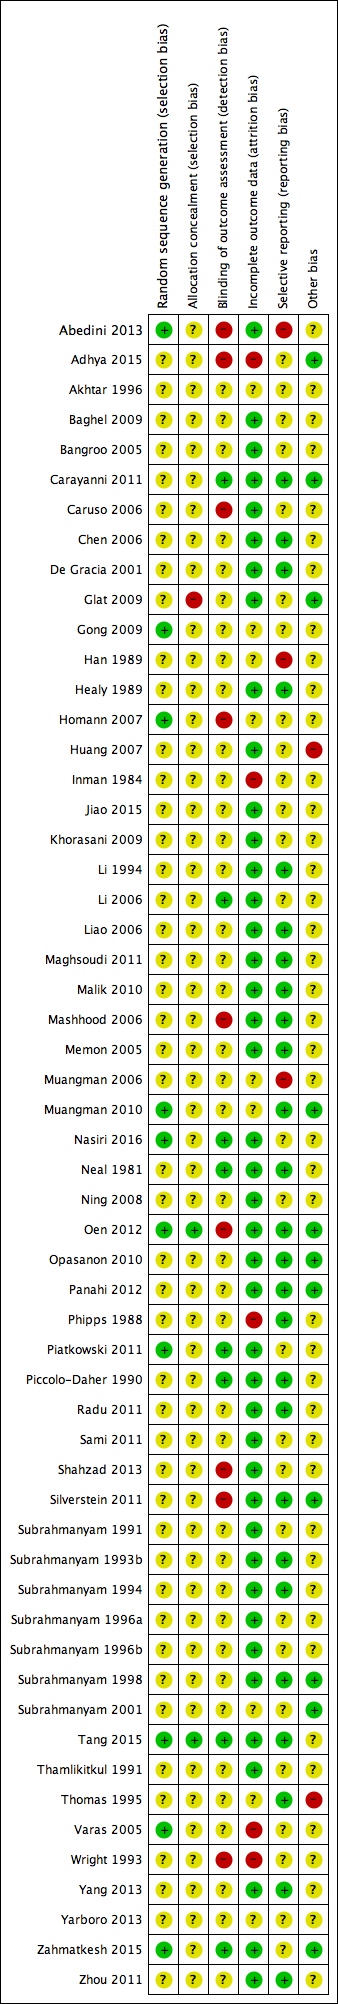
Risk of bias summary: review authors' judgements about each risk of bias item for each included study

Risk of bias graph: review authors' judgements about each risk of bias item presented as percentages across all included studies

Comparison 1 Silver dressings versus topical antibiotics, Outcome 1 Wound healing (hazard ratio).
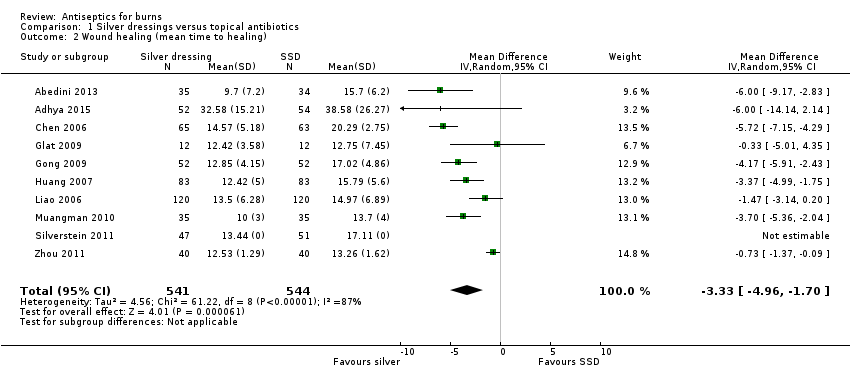
Comparison 1 Silver dressings versus topical antibiotics, Outcome 2 Wound healing (mean time to healing).
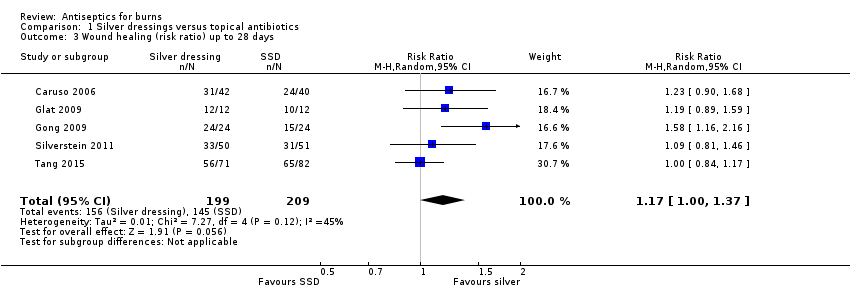
Comparison 1 Silver dressings versus topical antibiotics, Outcome 3 Wound healing (risk ratio) up to 28 days.
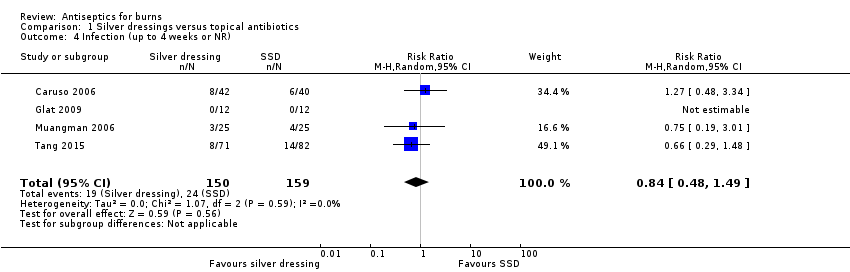
Comparison 1 Silver dressings versus topical antibiotics, Outcome 4 Infection (up to 4 weeks or NR).

Comparison 1 Silver dressings versus topical antibiotics, Outcome 5 Adverse events (14‐28 days).
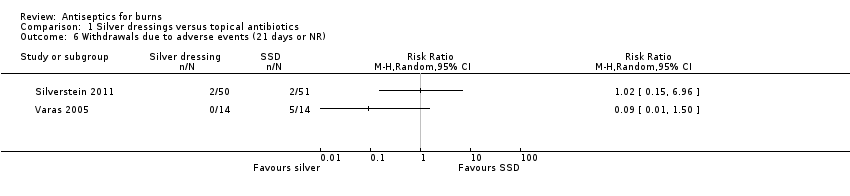
Comparison 1 Silver dressings versus topical antibiotics, Outcome 6 Withdrawals due to adverse events (21 days or NR).
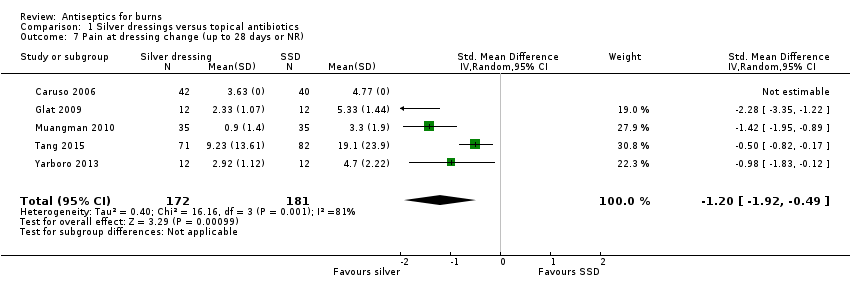
Comparison 1 Silver dressings versus topical antibiotics, Outcome 7 Pain at dressing change (up to 28 days or NR).
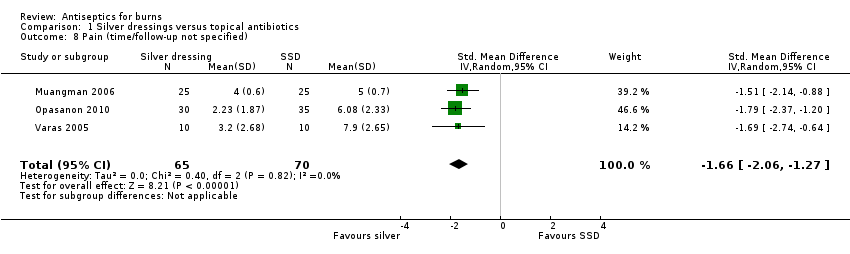
Comparison 1 Silver dressings versus topical antibiotics, Outcome 8 Pain (time/follow‐up not specified).

Comparison 1 Silver dressings versus topical antibiotics, Outcome 9 Mortality (21 days or NR).
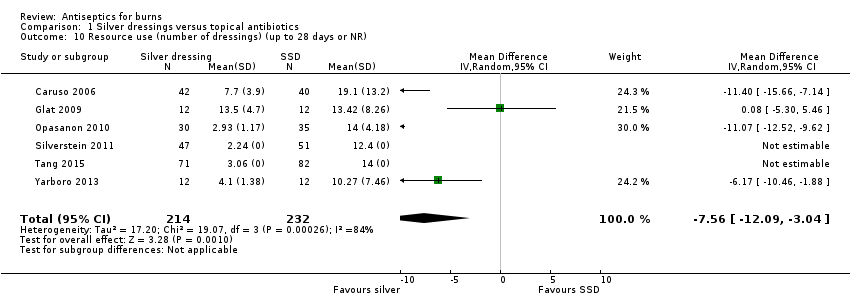
Comparison 1 Silver dressings versus topical antibiotics, Outcome 10 Resource use (number of dressings) (up to 28 days or NR).

Comparison 1 Silver dressings versus topical antibiotics, Outcome 11 Costs (21 days or NR).
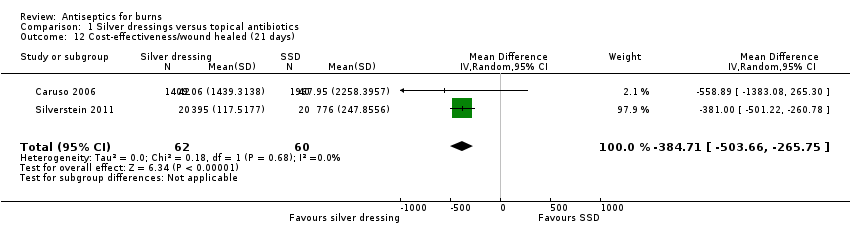
Comparison 1 Silver dressings versus topical antibiotics, Outcome 12 Cost‐effectiveness/wound healed (21 days).

Comparison 2 Honey versus topical antibiotics, Outcome 1 Wound healing (hazard ratio).

Comparison 2 Honey versus topical antibiotics, Outcome 2 Wound healing (risk ratio) (up to 60 days).

Comparison 2 Honey versus topical antibiotics, Outcome 3 Wound healing (mean time to healing).
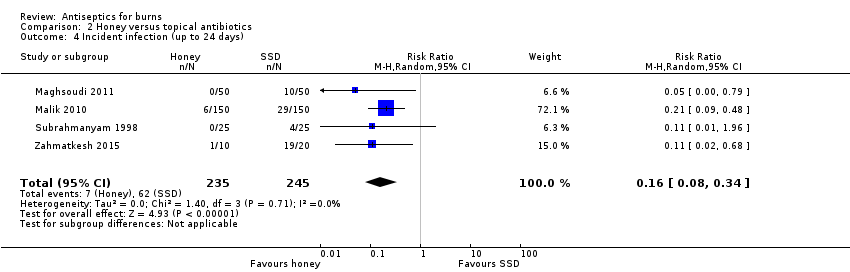
Comparison 2 Honey versus topical antibiotics, Outcome 4 Incident infection (up to 24 days).
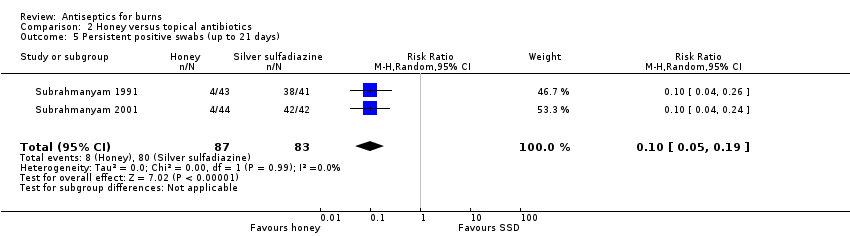
Comparison 2 Honey versus topical antibiotics, Outcome 5 Persistent positive swabs (up to 21 days).

Comparison 2 Honey versus topical antibiotics, Outcome 6 Adverse events (time points between 21 days and 6 weeks).

Comparison 3 Aloe vera vs topical antibiotics, Outcome 1 Wound healing (mean time to healing).

Comparison 3 Aloe vera vs topical antibiotics, Outcome 2 Infection (time points between 14 days and 2 months).
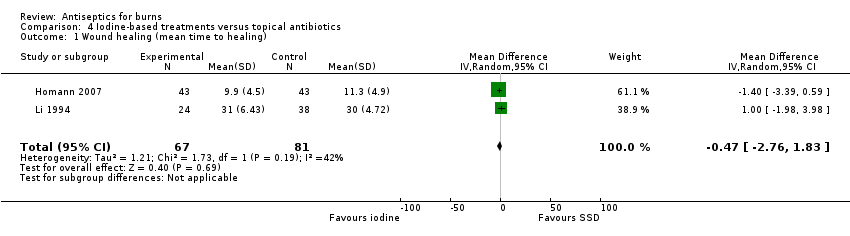
Comparison 4 Iodine‐based treatments versus topical antibiotics, Outcome 1 Wound healing (mean time to healing).

Comparison 5 Silver‐based antiseptics versus non‐antimicrobial, Outcome 1 Wound healing (mean time to healing).
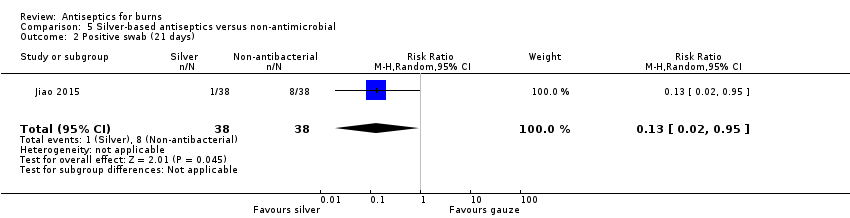
Comparison 5 Silver‐based antiseptics versus non‐antimicrobial, Outcome 2 Positive swab (21 days).
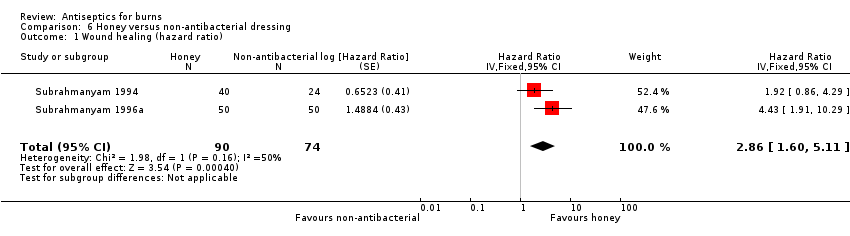
Comparison 6 Honey versus non‐antibacterial dressing, Outcome 1 Wound healing (hazard ratio).

Comparison 6 Honey versus non‐antibacterial dressing, Outcome 2 Wound healing (mean time to healing).
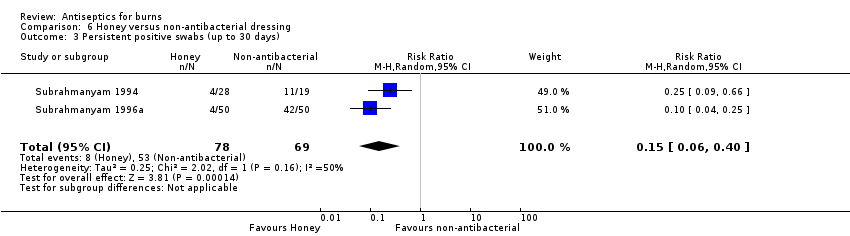
Comparison 6 Honey versus non‐antibacterial dressing, Outcome 3 Persistent positive swabs (up to 30 days).
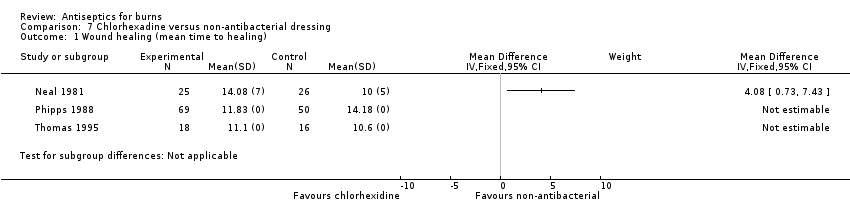
Comparison 7 Chlorhexadine versus non‐antibacterial dressing, Outcome 1 Wound healing (mean time to healing).

Comparison 7 Chlorhexadine versus non‐antibacterial dressing, Outcome 2 Infection (up to 30 days).
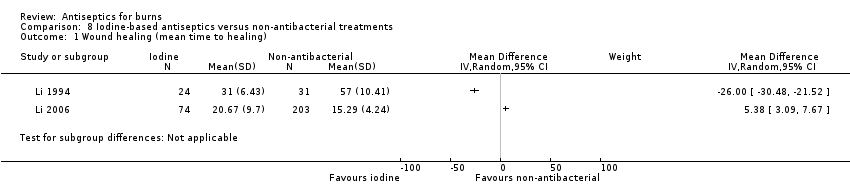
Comparison 8 Iodine‐based antiseptics versus non‐antibacterial treatments, Outcome 1 Wound healing (mean time to healing).

Comparison 8 Iodine‐based antiseptics versus non‐antibacterial treatments, Outcome 2 Costs (duration 18 days +).

Comparison 9 Cerium nitrate versus non antibacterial treatment, Outcome 1 Mortality (short‐term or unclear).
| Silver‐based antiseptics versus topical antibiotics | ||||||
| Patient or population: people with burns Intervention: silver‐based antiseptics (primarily dressings) Setting: hospitals and burn clinics | ||||||
| Outcomes | Anticipated absolute effects* (95% CI) | Relative effect | № of participants | Certainty of the evidence | Comments | |
| Risk with SSD | Risk with silver dressings | |||||
| Wound healing: time to complete healing (time‐to‐event data) | 739 per 1000 | 813 per 1000 (717 to 894) | HR 1.25 | 259 | ⊕⊕⊝⊝ | Only three studies provided sufficient data for an HR; this showed that, on average, there is no clear difference in the 'chance' of healing in burns treated with silver‐based antiseptic dressings compared with SSD. HR calculated using standard methods for two trials |
| Risk difference: 74 more burns healed per 1000 with silver dressings than with SSD (22 fewer to 155 more) | ||||||
| Wound healing (mean time to healing) | The mean time to wound healing was 11.92 days | The mean time to wound healing in the intervention group was 3.33 days shorter (4.96 fewer to 1.70 fewer) | MD ‐3.33 days (‐4.96 to ‐1.70) | 1085 | ⊕⊕⊝⊝ | Silver may, on average, slightly improve mean time to healing compared with SSD |
| Wound healing (number of healing events) | 784 per 1000 | 917 per 1000 (784 to 1000) | RR 1.17 (1.00 to 1.37) | 408 (5 RCTs) | ⊕⊕⊝⊝ | There may be little difference in the number of healing events over short‐term follow‐up (up to 28 days) compared with SSD |
| Risk difference: 133 more burns healed per 1000 with silver dressings than with SSD (0 more to 290 more) | ||||||
| Infection | 151 per 1000 | 127 per 1000 | RR 0.84 | 309 | ⊕⊝⊝⊝ | It is uncertain whether silver‐containing antiseptics increase or reduce the risk of infection compared with use of SSD as evidence is very low certainty |
| Risk difference: 24 fewer participants with adverse events per 1000 with silver dressings than with SSD (78 fewer to 71 more) | ||||||
| Adverse events | 227 per 1000 | 195 per 1000 | RR 0.86 | 440 | ⊕⊕⊝⊝ | There may be little or no difference in the number of adverse events in participants treated with silver dressings compared with SSD |
| Risk difference: 34 fewer participants with adverse events per 1000 with silver dressings than with SSD (86 fewer to 29 more). | ||||||
| *The risk in the intervention group (and its 95% confidence interval) is based on the assumed risk in the comparison group and the relative effect of the intervention (and its 95% CI). | ||||||
| GRADE Working Group grades of evidence | ||||||
| 1Not downgraded for risk of selection bias and detection bias because most participants were in a study at low risk of bias; downgraded twice for serious imprecision due to low numbers of participants and wide confidence intervals. | ||||||
| Honey versus topical antibiotics | ||||||
| Patient or population: people with burns Intervention: honey Setting: hospitals and burn clinics | ||||||
| Outcomes | Anticipated absolute effects* (95% CI) | Relative effect | № of participants | Certainty of the evidence | Comments | |
| Risk with topical antibiotics | Risk with honey | |||||
| Wound healing: time to complete healing (time‐to‐event data): honey versus SSD or mafenide acetate | 641 per 1000 | 919 per 1000 (827 to 973) | HR 2.45 | 580 | ⊕⊕⊕⊝ | Burns treated with honey probably have a greater 'chance' of healing compared with SSD or mafenide acetate. HR calculated using standard methods for all trials |
| Risk difference: 278 more burns healed per 1000 with honey than with topical antibiotics (185 more to 332 more). | ||||||
| Wound healing (mean time to healing): honey versus SSD | The mean time to wound healing was 15.53 days | The mean time to wound healing was 3.79 days fewer (7.15 fewer to 0.43 fewer) | MD ‐3.79 (‐7.15 to ‐0.43) | 712 | ⊕⊝⊝⊝ Very low2 | It is uncertain what the effect of honey is on mean time to wound healing compared with SSD |
| Wound healing (number of healing events): honey versus SSD | 434 per 1000 | 946 per 1000 (499 to 1000) | RR 2.18 (1.15 to 4.13) | 318 (4 RCTs) | ⊕⊕⊝⊝ | There may, on average, be more healing events in burns treated with honey compared with SSD over short‐term follow‐up (maximum 21 days) |
| Risk difference: 512 more burns healed per 1000 with honey than with SSD (65 more to 1358 more) | ||||||
| Incident infection: honey versus SSD or mafenide acetate | 135 per 1000 | 22 per 1000 | RR 0.16 | 480 | ⊕⊝⊝⊝ Very low4 | It is uncertain if fewer burns treated with honey may become infected compared with those treated with SSD or mafenide acetate |
| Risk difference: 113 fewer infections (positive swabs in 3 RCTs) per 1000 with honey compared with topical antibiotics (124 fewer to 89 fewer) | ||||||
| Peristent infection: honey versus SSD | 964 per 1000 | 98 per 1000 (48 to 183) | RR 0.10 (0.05 to 0.19) | 170 (2 RCTs) | ||
| Risk difference: 867 fewer persistently positive swabs per 1000 with honey compared with topical antibiotics (961 to 781) | ||||||
| Adverse events: honey versus SSD | 16 per 1000 | 3 per 1000 | RR 0.20 | 250 | ⊕⊝⊝⊝ | It is uncertain whether fewer participants treated with honey experience adverse events compared with those treated with SSD |
| Risk difference: 13 fewer participants with adverse events per 1000 with honey compared with SSD (16 fewer to 48 more) | ||||||
| *The risk in the intervention group (and its 95% confidence interval) is based on the assumed risk in the comparison group and the relative effect of the intervention (and its 95% CI). | ||||||
| GRADE Working Group grades of evidence | ||||||
| 1Downgraded once for imprecision. A post‐hoc sensitivity analysis excluding a study with an intra‐individual design made no material difference to the analysis. | ||||||
| Aloe Vera versus topical antibiotics | ||||||
| Patient or population: people with burns Intervention: Aloe Vera Setting: hospitals and burn clinics | ||||||
| Outcomes | Anticipated absolute effects* (95% CI) | Relative effect | № of participants | Certainty of the evidence | Comments | |
| Risk with topical antibiotics | Risk with Aloe Vera | |||||
| Wound healing (number of healing events): Aloe Vera versus SSD | 389 per 1000 | 548 per 1000 | RR 1.41 | 38 | ⊕⊕⊝⊝ | It is unclear whether Aloe Vera may alter the number of healing events compared with SSD; confidence intervals are wide, spanning both benefits and harms so clear differences between treatments are not apparent |
| Risk difference: 159 more burns healed per 1000 with Aloe Vera than with SSD (117 fewer to 719 more) | ||||||
| Wound healing (mean time to healing): Aloe Vera versus SSD or framycetin | The mean time to wound healing was 21.25 days | The mean time to wound healing was 7.79 days shorter (17.96 shorter to 2.38 longer) | MD ‐7.79 (‐17.96 to 2.38) | 210 | ⊕⊝⊝⊝ | It is uncertain whether there is a difference in mean time to healing between Aloe Vera and SSD or framycetin. No data were contributed by the trial using framycetin |
| Infection: Aloe Vera versus SSD | 36 per 1000 | 34 per 1000 | RR 0.93 | 221 | ⊕⊝⊝⊝ | It is uncertain whether there is a difference in infection incidence between Aloe Vera and SSD |
| Risk difference: 3 fewer infections per 1000 with Aloe Vera than with SSD (27 fewer to 85 more) | ||||||
| Adverse events | No trial reported evaluable adverse event data for this comparison | |||||
| *The risk in the intervention group (and its 95% confidence interval) is based on the assumed risk in the comparison group and the relative effect of the intervention (and its 95% CI). | ||||||
| GRADE Working Group grades of evidence | ||||||
| 1Downgraded twice for very serious imprecision. | ||||||
| Iodine versus topical antibiotics | ||||||
| Patient or population: people with burns Intervention: iodine‐based treatments Setting: hospitals and burn clinics | ||||||
| Outcomes | Anticipated absolute effects* (95% CI) | Relative effect | № of participants | Certainty of the evidence | Comments | |
| Risk with topical antibiotics | Risk with iodine‐based treatments | |||||
| Wound healing (mean time to healing) | The mean time to wound healing was 20.07 days | The mean time to wound healing in the intervention group was 0.47 days shorter (2.76 shorter to 1.83 longer) | MD ‐0.47 (‐2.76 to 1.83) | 148 | ⊕⊝⊝⊝ | It is uncertain whether there is a difference in mean time to wound healing between iodine‐based antiseptic treatments and SSD |
| Infection | No study reported evaluable data for infection | |||||
| Adverse events | 350 per 1000 | 301 per 1000 | RR 0.86 | 40 | ⊕⊝⊝⊝ | It is uncertain whether there is a difference in the proportion of participants with adverse events between iodine‐based antiseptic treatments and SSD |
| Risk difference: 48 fewer participants with adverse events per 1000 with iodine‐based treatments than with SSD (227 fewer to 385 more) | ||||||
| *The risk in the intervention group (and its 95% confidence interval) is based on the assumed risk in the comparison group and the relative effect of the intervention (and its 95% CI). | ||||||
| GRADE Working Group grades of evidence | ||||||
| 1Downgraded once for detection bias in one trial accounting for 61% of the analysis weight and twice for imprecision due to low participant numbers and confidence intervals that cross the line of no effect; one study also had an intra‐individual design, which may not have been accounted for in the analysis, this is taken account of in the double downgrading for imprecision. | ||||||
| Silver versus non‐antibacterial | ||||||
| Patient or population: people with burns Intervention: silver‐based interventions (dressings) Setting: hospitals and burn clinics | ||||||
| Outcomes | Anticipated absolute effects* (95% CI) | Relative effect | № of participants | Certainty of the evidence | Comments | |
| Risk with non‐antibacterial dressing | Risk with silver dressing | |||||
| Wound healing (number of healing events): silver xenograft vs petroleum gauze | 500 per 1000 | 565 per 1000 | RR 1.13 | 32 | ⊕⊕⊝⊝ | There may be little or no difference between silver xenograft and petroleum gauze |
| Risk difference: 65 more burns healed per 1000 with silver xenograft compared with petroleum gauze (205 fewer to 580 more) | ||||||
| Wound healing (mean time to healing): silver nanoparticle vs Vaseline gauze | The mean time to wound healing was 15.87 days | The mean time to wound healing in the silver nanoparticle group was 3.49 days shorter (4.46 shorter to 2.52 shorter) compared with gauze | MD ‐3.49 (‐4.46 to ‐2.52) | 204 | ⊕⊕⊕⊝ | The mean time to wound healing is probably slightly shorter in the group treated with silver nanoparticle dressing compared with Vaseline gauze |
| Infection | No study reported evaluable data for this comparison | |||||
| Adverse events | No study reported evaluable data for this comparison | |||||
| *The risk in the intervention group (and its 95% confidence interval) is based on the assumed risk in the comparison group and the relative effect of the intervention (and its 95% CI). | ||||||
| GRADE Working Group grades of evidence | ||||||
| 1Downgraded twice for imprecision as fragile confidence intervals cross the line of no effect. | ||||||
| Honey versus non‐antibacterial | ||||||
| Patient or population: people with burns Intervention: honey Setting: hospitals and burn clinics | ||||||
| Outcomes | Anticipated absolute effects* (95% CI) | Relative effect | № of participants | Certainty of the evidence | Comments | |
| Risk with non‐antibacterial dressing | Risk with honey | |||||
| Wound healing: time to complete healing (time‐to‐event data) | 1000 per 1000 | 1000 per 1000 (1000 to 1000) | HR 2.86 | 164 | ⊕⊕⊕⊝ | The 'chance' of healing is probably somewhat greater in participants treated with honey compared with unconventional non‐antibacterial treatments |
| Risk difference: 0 difference burns healed per 1000 with honey compared with non‐antibacterial treatments (0 to 0) | ||||||
| Wound healing (mean time to healing) | The mean time to wound healing was 14.05 days | The mean time to wound healing in the intervention group was 5.32 days shorter (6.30 shorter to 4.34 shorter) | MD ‐5.32 (‐6.30 to ‐4.34) | 1156 | ⊕⊕⊕⊕ | Participants treated with honey, on average, have a shorter mean time to healing compared with those treated with a range of treatments without antibacterial properties, including unconventional treatments |
| Infection (incident) | 370 per 1000 | 174 per 1000 | RR 0.47 | 92 | ⊕⊝⊝⊝ | It is uncertain whether there is a difference in the incidence or persistence of wound infection in participants treated with honey compared with a range of treatments without antimicrobial properties |
| Risk difference: 196 fewer incident infections (persistently positive swabs) per 1000 with honey compared with non‐antibacterial treatments (285 fewer to 7 fewer) | ||||||
| Infection (persistent) | 768 per 1000 | 115 per 1000 | RR 0.15 (0.06 to 0.40) | 147 of 164 randomised (2 RCTs) | ⊕⊝⊝⊝ | |
| Risk difference: 653 fewer persistent infections (persistently positive swabs) per 1000 with honey compared with non‐antibacterial treatments (722 fewer to 461 fewer) | ||||||
| Adverse events | One study reported that there were no events in either intervention group; other studies did not report data that clearly related to the number of participants who experienced adverse events in each group | 239 (3 RCTs) | ⊕⊝⊝⊝ | It is uncertain whether there is a difference in the incidence of adverse effects between participants treated with honey and those treated with a range of alternative non‐antimicrobial therapies | ||
| *The risk in the intervention group (and its 95% confidence interval) is based on the assumed risk in the comparison group and the relative effect of the intervention (and its 95% CI). | ||||||
| GRADE Working Group grades of evidence | ||||||
| 1Downgraded once for imprecision due to low numbers of participants. | ||||||
| Chlorhexidine versus non‐antibacterial | ||||||
| Patient or population: people with burns Intervention: chlorhexidine Setting: hospitals and burn clinics | ||||||
| Outcomes | Anticipated absolute effects* (95% CI) | Relative effect | № of participants | Certainty of the evidence | Comments | |
| Risk with non‐antibacterial dressing | Risk with biguanides | |||||
| Wound healing: time to complete healing (time‐to‐event data): chlorhexidine versus polyurethane | 1000 per 1000 | 1000 per 1000 (1000 to 1000) | HR 0.71 | 51 | ⊕⊕⊝⊝ | There may be some difference in the 'chance' of healing for chlorhexidine compared with polyurethane but CIs span benefit and harm so a clear difference between treatments is not apparent |
| Risk Difference: 0 difference per 1000 for chlorhexidine compared with polyurethane (0 to 0) | ||||||
| Wound healing (mean time to healing): chlorhexidine versus non‐antibacterial | The mean time to wound healing ‐ chlorhexidine versus polyurethane was 10 days | The mean time to wound healing ‐ chlorhexidine versus polyurethane in the intervention group was 4.08 days longer (0.73 longer to 7.43 longer) | MD 4.08 (0.73 to 7.43) | 51 153 participants in 2 RCTs did not have evaluable data | ⊕⊕⊝⊝ | The mean time to wound healing may be slightly longer in burns treated with chlorhexidine compared with polyurethane; data from 2 additional RCTs comparing chlorhexidine with hydrocolloid lacked measures of variance |
| Infection: chlorhexidine versus no antimicrobial/no additional antimicrobial | 179 per 1000 | 184 per 1000 | RR 1.11 (0.54 to 2.27) | 172 | ⊕⊝⊝⊝ | It is uncertain whether there is a difference in the incidence of infection between participants treated with chlorhexidine either alone or in addition to SSD and participants treated with no antimicrobial or SSD alone |
| Risk Difference: 15 more infections per 1000 with chlorhexidine compared with non‐antibacterial treatments (64 fewer to 178 more) | ||||||
| Adverse events: chlorhexidine versus hydrocolloid | 102 per 1000 | 20 per 1000 | RR 0.20 | 98 | ⊕⊝⊝⊝ | It is uncertain whether there is a difference in the number of participants with adverse effects between chlorhexidine and a hydrocolloid dressing |
| Risk Difference: 82 fewer participants with adverse events with chlorhexidine compared with hydrocolloid (100 fewer to 66 more) | ||||||
| *The risk in the intervention group (and its 95% confidence interval) is based on the assumed risk in the comparison group and the relative effect of the intervention (and its 95% CI). | ||||||
| GRADE Working Group grades of evidence | ||||||
| 1Downgraded twice for imprecision due to wide confidence intervals, which cross the line of no effect, and fragility due to small numbers of participants. | ||||||
| Iodine‐based treatments versus non‐antibacterial | ||||||
| Patient or population: people with burns Intervention: iodine‐based treatments Setting: hospitals and burn clinics | ||||||
| Outcomes | Anticipated absolute effects* (95% CI) | Relative effect | № of participants | Certainty of the evidence | Comments | |
| Risk with non‐antibacterial treatments | Risk with iodine‐based treatments | |||||
| Wound healing (number of healing events): iodophor versus hydrogel | 700 per 1000 | 119 per 1000 | RR 0.17 | 120 | ⊕⊕⊝⊝ | There may be a smaller number of healing events at 26 days in participants treated with iodophor compared with those treated with hydrogel |
| Risk difference: 581 fewer wounds healed per 1000 at 14 days with iodophor treatment compared with hydrogel (644 fewer to 462 fewer) | ||||||
| Wound healing (mean time to healing): iodine gauze versus carbon fibre | The mean time to wound healing) ‐ iodine gauze versus carbon fibre was 15.29 days | The mean time to wound healing) ‐ iodine gauze versus carbon fibre in the intervention group was 5.38 days longer (3.09 longer to 7.67 longer) | MD 5.38 (3.09 to 7.67) | 277 | ⊕⊝⊝⊝ | The clinical heterogeneity between these studies, both in terms of interventions and comparators, combined with the wide divergence in effects meant that they could not meaningfully be pooled. It is very uncertain what the effect of iodine compared with non‐antibacterial dressings/topical treatments is on mean time to wound healing |
| Wound healing (mean time to healing): iodophor versus MEBO | The mean time to wound healing) ‐ iodophor versus MEBO was 57 days | The mean time to wound healing) ‐ iodophor versus MEBO in the intervention group was 26 days shorter (30.48 shorter to 21.52 shorter) | MD ‐26.00 (‐30.48 to ‐21.52) | 55 | ||
| Infection: iodine gauze versus MEBO | 58 per 1000 | 75 per 1000 | RR 1.30 | 211 | ⊕⊕⊝⊝ | There may be little or no difference in the incidence of infection in participants treated with iodine gauze compared with those treated with MEBO |
| Risk difference: 17 more infections per 1000 with iodine gauze compared with MEBO (31 fewer to 151 more) | ||||||
| Adverse effects: iodine gauze versus MEBO | 106 per 1000 | 75 per 1000 | RR 0.71 | 211 | ⊕⊕⊝⊝ | There may be little or no difference in the incidence of adverse effects in participants treated with iodine gauze compared with those treated with MEBO |
| Risk difference: 31 fewer participants with adverse events with iodine gauze compared with MEBO (74 fewer to 73 more) | ||||||
| *The risk in the intervention group (and its 95% confidence interval) is based on the assumed risk in the comparison group and the relative effect of the intervention (and its 95% CI). | ||||||
| GRADE Working Group grades of evidence | ||||||
| 1Downgraded twice for imprecision due to wide confidence intervals and fragility due to small numbers of participants and uncertainty about the analysis of an intra‐individual design. | ||||||
| Comparison | Number of studies | Number of participants |
| Antiseptics versus topical antibiotics | ||
| Silver vs SSD | 16 | 1368 |
| Honey vs SSD or mafenide acetate | 11 | 856 |
| Aloe Vera vs SSD or framycetin | 5 | 338 |
| Iodine vs SSD | 2 | 158 |
| Sodium hypochlorite vs SSD | 1 | 20 |
| Chlorhexidine or polyhexanide (biguanides) vs SSD | 2 | 115 |
| Octenidine vs SSD | 1 | 30 |
| Ethacridine lactate (Rivanol) vs SSD | 1 | 115 |
| Merbromin vs zinc sulfadiazine | 1 | 125 |
| Arnebia euchroma vs SSD | 1 | 49 |
| Antiseptics versus alternative antiseptics | ||
| Chlorhexidine vs iodine | 1 | 213 |
| Iodine vs ethacridine lactate | 1 | 115 |
| Antiseptics versus non‐antibacterial | ||
| Silver vs non‐antibacterial | 3 | 299 |
| Honey vs non‐antibacterial | 3 | 256 |
| Chlorhexidine vs non‐antibacterial | 5 | 516 |
| Iodine vs non‐antibacterial | 4 | 663 |
| Ethacridine lactate vs non‐antibacterial | 1 | 115 |
| Cerium nitrate vs non‐antibacterial | 2 | 214 |
| Merbromin vs non‐antibacterial | 1 | 125 |
| SSD: silver sulfadiazine | ||
| Comparison | Study | Number participants /wounds | Duration | Time to wound healing (days) (mean (SD)) | Difference in means (days) (95% CI) | Proportion of wounds healed | Risk ratio (for longest time point) or Hazard Ratio |
| Antiseptic versus topical antibiotic | |||||||
| Silver hydrofibre Silver sulfadiazine (SSD) | Silver 35 SSD 34 | Until healing | Silver 9.7 (7.2) SSD 15.7 (6.2) | ‐6.00 (‐9.17 to ‐2.83) | ‐ | ‐ | |
| Silver hydrofibre Silver sulfadiazine | Silver 42 SSD 40 | 21 days | Median Silver 16 SSD 17 | ‐ | Silver 31 SSD 24 | HR 1.67 (0.76 to 3.65) RR 1.23 (0.60 to 1.68) | |
| Silver hydrofibre Silver sulfadiazine | Silver 35 SSD 35 | NR | Silver 10 (3) SSD 13.7 (4) | ‐3.70 (‐5.36 to ‐2.04) | ‐ | ‐ | |
| Silver hydrogel Silver sulfadiazine | Silver 84 SSD 79 (analysed silver 54, SSD 52) | 4 weeks/until healing | Silver 38.58 (26.27) SSD 32.58 (15.21) | 6.00 (‐2.14 to 14.14) | Deep dermal wounds only reported | ‐ | |
| Silver hydrogel Silver sulfadiazine | Silver 12 SSD 12 | 21 days+ | Silver 12.42 (3.58) SSD 12.75 (7.45) (participants followed up after 21 days when binary data reported) | ‐0.33 (‐5.01 to 4.35) | Silver 12 SSD 10 | HR 1.03 (0.44 to 2.39) RR 1.19 (0.89 to 1.59) | |
| Silver hydrogel Silver sulfadiazine | Silver 52 SSD 52 | 21 days+ | Silver 12.85 (4.15) SSD 17.02 (4.86) (participants followed up after 21 days when binary data reported) | ‐4.17 (‐5.91 to ‐2.43) | Silver 52/52 (day 21) SSD 43/52 (day 21) | RR 1.58 (1.16 to 2.16) | |
| Silver foam Silver sulfadiazine | Silver 50 SSD 51 | 21 days | Silver 13.44 (N = 47) SSD 17.11 (N = 51) Reported as NS | ‐ | 1 week Silver 16 SSD 10 3 weeks Silver 33 SSD 31 | RR 1.09 (0.81 to 1.46) | |
| Silver foam Silver sulfadiazine | Silver 71 SSD 82 | 4 weeks | Silver 56/71 (median 15 days) SSD 65/82 (median 16 days) | ‐ | 28 days Silver 56 SSD 65 | HR 1.22 (0.88 to 1.70) favouring silver RR 1.00 (0.84 to 1.17) | |
| Silver foam Silver sulfadiazine | 24 participants randomised; group allocation unclear | NR | ‐ | ‐ | ‐ | ‐ | |
| Silver foam Silver sulfadiazine | 40 participants; part of each burn randomised to treatments | 14 days | Silver 12.53 (± 1.29) SSD 13.26 (± 1.62) | ‐0.73 (‐1.37 to 0.09) | ‐ | ‐ | |
| Nanocrystalline silver Silver sulfadiazine Vaseline gauze | Silver 65 SSD 63 Vaseline gauze 63 | Until healing | Silver 14.57 (5.18) SSD 20.29 (2.75) Vaseline 18.03 (5.1) | Silver vs SSD ‐5.72 (‐7.15 to ‐4.29) Silver vs Vaseline ‐3.49 (‐4.46 to ‐2.52) | ‐ | ‐ | |
| Nanocrystalline silver Silver sulfadiazine | 98 participants with 166 burns 83 burns in each group | 20 days | Silver 12.42 (5.40) SSD 15.79 (5.60) | ‐3.37 (‐4.49 to ‐1.75) | ‐ | ‐ | |
| Nanocrystalline silver Silver sulfadiazine | Silver 25 SSD 25 | NR | ‐ | ‐ | ‐ | ‐ | |
| Nanocrystalline silver Silver sulfadiazine | 14 participants with 2 burn areas; 14 burn areas in each group | NR | ‐ | ‐ | ‐ | ‐ | |
| Silver nitrate Silver sulfadiazine | 120 participants with 2 burn areas; 120 burn areas in each group | Until healing | Silver 13.5 (6.28) SSD 14.97 (6.89) | ‐1.47 (‐3.14 to 0.20) | ‐ | ‐ | |
| Silver alginate Silver sulfadiazine | Silver 30 SSD 35 | NR | ‐ | ‐ | ‐ | ‐ | |
| Honey Silver sulfadiazine | Honey 37 SSD 41 | NR (2 months' follow‐up) | Honey 18.16 (SD ‐) SSD 32.68 (SD ‐) | ‐ | ‐ | ‐ | |
| Honey Silver sulfadiazine | Honey 32 SSD 32 | 21 days | ‐ | ‐ | Honey 10 days 26 ≥ 14 days 32 SSD ≥ 3 weeks 19 unclear if all healed | RR 1.67 (1.25 to 2.22) | |
| Honey Silver sulfadiazine | 150 participants with 2 burns; 150 burns in each group | 24 days | Honey 13.47 (4.06) SSD 15.62 (4.40) | ‐2.15 (‐3.11 to ‐1.19) | 10 days Honey 30 SSD 13 14 days Honey 122 SSD 80 19 days Honey 140 SSD 90 21 days Honey 142 SSD 111 24 days Honey 142 SSD 121 | HR 2.93 (2.23 to 3.86) | |
| Honey Silver sulfadiazine | Honey 25 SSD 25 | 6 weeks | ‐ | ‐ | 2 weeks Honey 13 SSD 5 4 weeks Honey 25 SSD 15 6 weeks Honey 25 SSD 25 | HR 2.23 (1.19 to 4.19) | |
| Honey Silver sulfadiazine | Honey 40 SSD 40 | 46 days | Honey 15.3 (SD ‐) SSD 20.0 (SD ‐) | ‐ | Honey Day 16: 20 Day 26: 32 Day 30: 40 SSD Day 20: 16 Day 36: 34 Day 46: 40 | HR 3.75 (2.18 to 6.45) | |
| Honey Silver sulfadiazine | Honey 52 SSD 52 | 15 days | Honey 9.4 (2.3) SSD 17.2 (3.2)* *Jull 2015 author contact | ‐7.77 (‐8.84 to ‐6.70) | Honey 87% (42) SSD 10% (5) | RR 8.40 (3.61 to 19.53) | |
| Honey Silver sulfadiazine | Honey 25 SSD 25 | 21 days | Honey 4.92 (3.61) SSD 8.22 (8.31)* *Jull 2015 author contact | ‐3.30 (‐6.85 to 0.25) | Honey 25 SSD 21 | RR 1.19 (0.99 to 1.43) | |
| Honey Silver sulfadiazine | Honey 50 SSD 50 | 21 days | Honey 15.4 (3.2) SSD 17.2 (4.3)* *SD from Jull 2015 author contact | ‐1.80 (‐3.29 to 0.31) | Honey 50 SSD 24 | RR 2.06 (1.55 to 2.75) | |
| Honey Silver sulfadiazine | Honey 25 SSD 25 | 60 days | ‐ | ‐ | Days 5‐10 Honey 14 SSD 3 Days 11‐15 Honey 6 SSD 2 Days 16‐20 Honey 3 SSD 7 Days 21‐30 Honey 1 SSD 8 Days 31‐40 Honey 1 SSD 3 Days 41‐50 Honey 0 SSD 1 Days 51‐60 Honey 0 SSD 1 | HR 2.73 (1.43 to 5.24) | |
| Honey Mafenide acetate | Honey 50 Mafenide acetate 50 | 30 days | ‐ | ‐ | Day 7 Honey 42 Mafenide 36 Day 10 Honey 46 Mafenide 38 Day 15 Honey 48 Mafenide 40 Day 21 Honey 50 Mafenide 42 Day 30 Honey 50 Mafenide 50 | HR 1.38 (0.91 to 2.09) | |
| Honey (olea) Mafenide acetate | Honey 10 Mafenide acetate 20 | 20 days | Development of granulation tissue: median Honey: 12 (range 10.3‐13.6) Madenide: 17 (range 13.3‐20.6) Not all participants developed this | ‐ | Proportion of participants with granulation tissue at day 20 Honey 8/10 Mafenide 16/20 | ‐ | |
| Aloe Vera Silver sulfadiazine | Aloe Vera 30 SSD 30 | 24 days | Aloe Vera 15.9 (2) SSD 18.73 (2.65) | ‐2.85 (‐4.04 to ‐1.66) | ‐ | ‐ | |
| Aloe Vera Silver sulfadiazine | Aloe Vera 60 SSD 60 | 14 days | ‐ | ‐ | ‐ | ‐ | |
| Aloe Vera Silver sulfadiazine | Aloe Vera 25 SSD 25 | Until healing/ 2 months | Aloe Vera 11 (4.18) SSD 24.24 (11.16) | ‐13.24 (‐17.91 to ‐8.57) | ‐ | ‐ | |
| Aloe Vera Silver sulfadiazine | Aloe Vera 20 SSD 18 | 26 days | ‐ | Aloe Vera 55% (11) SSD 39% (7) | RR 1.41 (0.70 to 2.85) | ||
| Aloe Vera Framycetin | Aloe Vera 50 Framycetin:50 | NR | Aloe Vera 18 (SD ‐) Framycetin: 30.9 (SD ‐) | ‐ | ‐ | ‐ | |
| Povidone iodine Silver sulfadiazine | 43 participants each with 2 comparable burns; 43 burns in each group | 21 days | Povidone iodine 9.9 (4.5) SSD 11.3 (4.9) | ‐1.40 (‐3.39 to 0.59) | ‐ | ‐ | |
| Iodophor Moist exposed burn ointment (MEBO) Ethacridine lactate Silver sulfadiazine | Iodophor 24 MEBO 31 Ethacridine lactate 22 SSD 38 | Until healing | MEBO 57 (10.41) Iodophor 31 (6.43) Ethacridine lactate 32 (4.98) SSD 30 (4.72) | Iodophor vs SSD: 1.00 (‐1.95 to 3.98) Ethacridine vs SSD 2.00 (‐0.57 to 4.57) Iodophor vs MEBO ‐26.0 (‐30.48 to ‐21.52) Ethacridine vs MEBO ‐25.00 (‐29.21 to ‐20.79) Iodophor vs ethacridine 2.00 (‐0.57 to 4.57) | ‐ | ‐ | |
| Sodium hypochlorite Silver sulfadiazine | 20 participants with 2 burns (20 burns/group) | 28 days | Sodium hypochlorite 20.0 (2.7) SSD 22.1 (3.0) | ‐2.10 (‐3.87 to 0.33) | ‐ | ‐ | |
| Octenidine Silver sulfadiazine | 30 participants with 2 burn areas; 30 burns in each group | 24 hours | ‐ | ‐ | ‐ | ‐ | |
| Polyhexanide Silver sulfadiazine | Polyhexanide 30 with 38 burns SSD 30 with 34 | NR | Polyhexanide 10 (‐) SSD 10 (‐) | ‐ | ‐ | ‐ | |
| Arnebia euchroma Silver sulfadiazine | 49 participants with 2 burns (49 burns/group) | 36 days | A euchroma 13.9 (5.3) SSD 17.5 (6.9) | ‐3.60 (‐6.41 to ‐1.06) | Day 7 A euchroma 3 SSD 0 Day 10 A euchroma 14 SSD 8 Day 13 A euchroma 24 SSD 13 Day 15 A euchroma 29 SSD 24 Day 20 A euchroma 41 SSD 35 Day 25 A euchroma 42 SSD 38 Day 30 A euchroma 45 SSD 43 Day 36 A euchroma 45 SSD 45 | HR 1.42 (0.91 to 2.21) | |
| Antiseptic versus alternative antiseptic | |||||||
| Iodine Chlorhexidine | Iodine 111 Chlorhexidine 102 | NR | Iodine 9.48 (5.43) Chlorhexidine 11.69 (8.09) | 2.21 (0.34 to 4.08) | ‐ | ‐ | |
| Antiseptic versus non‐antibacterial treatment | |||||||
| Nanocrystalline silver Vaseline gauze | Silver 38 Gauze 38 | 30 days | Silver 8.8 (2.3) Gauze 12.3 (2.8) | ‐3.50 (‐4.65 to 2.35) | ‐ | ‐ | |
| Silver xenograft Petroleum gauze | Silver 16 Gauze 16 | 14 days | Silver 12.9 (1.4) N = 9 Gauze 12.5 (2.7) N = 8 | 0.40 (‐1.68 to 2.48) | Silver 9/16 Gauze 8/16 | RR 1.13 (0.59 to 2.16) | |
| Honey Polyurethane film | Honey 46 Polyurethane 46 | NR | Honey 10.8 (3.93) Polyurethane 15.3 (2.98)* *Jull 2015 author contact for SD | ‐4.50 (‐5.93 to ‐3.07) | ‐ | ‐ | |
| Honey gauze Amniotic membrane | Honey gauze 40 Amniotic 24 | 30 days | Honey 9.4 (2.52) Amniotic 17.5 (6.66)* *Jull 2015 author contact for SD | ‐8.10 (‐10.88 to ‐5.32) | Day 10 Honey 23 Amniotic 4 Day 15 Honey 33 Amniotic 14 Day 20 Honey 38 Amniotic 20 Day 25 Honey 40 Amniotic 21 Day 30 Honey 40 Amniotic 24 | HR 1.80 (1.09 to 2.98) | |
| Honey Potato peel | Honey 50 Potato peel 50 | 21 days | Honey 10.4 (2.2) Potato peel 16.2 (2.3) *Jull 2015 author contact for SSD | ‐5.80 (‐6.88 to ‐4.92) | 7 days Honey 20 Potato peel 4 10 days Honey 36 Potato peel 12 15 days Honey 50 Potato peel 40 21 days Honey 50 Potato peel 50 | HR 2.37 (1.53 to 3.67) | |
| Honey "Conventional dressing" | Honey 450 "Conventional dressing" 450 | NR | Honey: 8.8 (SD 2.1) "Conventional dressing": 13.5 (SD 4.1) *Jull 2015 author contact | ‐4.70 (‐5.13 to ‐4.27) | ‐ | ‐ | |
| Silver sulfadiazine + chlorhexidine Silver sulfadiazine alone | SSD + chlorhexidine 54 assessed SSD only 67 assessed Unclear if additional post‐randomisation exclusions | Until healing (26 days) | ‐ | ‐ | ‐ | ‐ | |
| Chlorhexidine Polyurethane | Chlorhexidine 25 Polyurethane 26 | 30 days | Chlorhexidine 14.08 (7) Polyurethane 10 (5) | 4.08 (0.73 to 7.43) | Chlorhexidine Day 5: 1 Day 10: 8 Day 15: 19 Day 20: 21 Day 25: 22 Day 30: 25 Polyurethane Day 5: 4 Day 10: 17 Day 15: 22 Day 20: 23 Day 25: 23 Day 30: 26 | HR 0.71 (0.39 to 1.29) | |
| Chlorhexidine Hydrocolloid | Chlorhexidine 104 Hydrocolloid 92 | NR | Chlorhexidine 69 analysed 11.83 (‐) Hydrocolloid 50 analysed 14.18 (‐) Not statistically significant | ‐ | ‐ | ‐ | |
| Chlorhexidine tulle‐gras Hydrocolloid Hydrocolloid + SSD | Chlorhexidine tulle‐gras 18 Hydrocolloid 16 Hydrocolloid + SSD 16 | NR | Chlorhexidine 11.1 (‐) Hydrocolloid 10.6 (‐) Hydrocolloid SSD 14.2 (‐) | ‐ | ‐ | ‐ | |
| Chlorhexidine Hydrocolloid | Chlorhexidine 49 Hydrocolloid 49 | NR | Median Chlorhexidine 12 Hydrocolloid 12 P = 0.89; based on 67 participants | ‐ | ‐ | ‐ | |
| Povidone iodine + Bepanthenol Moist exposed burn ointment (MEBO) | Povidone iodine + Bepanthenol 107 MEBO 104 | 18 days | ‐ | ‐ | ‐ | ‐ | |
| Iodine gauze Carbon‐fibre dressing | Iodine gauze 74 Carbon‐fibre dressing 203 | NR | Calculated using method in Cochrane Handbook for Systematic Reviews of Interventions (Higgins 2011c) Iodine 20.67 (9.7) Carbon 15.29 (4.24) | 5.38 (3.09 to 7.67) | ‐ | ‐ | |
| Iodophor gauze Hydrogel | 60 participants with burn wounds; 60 burn areas/group | 14 days | ‐ | ‐ | Day 7 Iodophor 4 Hydrogel 10 Day 14 Iodophor 7 Hydrogel 42 | RR 0.17 (0.08 to 0.34) | |
| Cerium nitrate + silver sulfadiazine Silver sulfadiazine alone | CN + SSD 30 SSD 30 | Until healing/ readiness for grafting | CN + SSD 17.2 (8.3) N = 29 SSD 25.1 (19.4) N = 30 Partial‐thickness areas only; time to graft readiness reported for full‐thickness areas (CN + SSD 13.6 (11.3) SSD 24.6 (11.4)) | ‐ | ‐ | ‐ | |
| Cerium nitrate + silver sulfadiazine Silver sulfadiazine alone | CN + SSD 78 SSD 76 | 21 days | Median (IQR) for participants not requiring surgery CN + SSD 11.0 (7‐15) SSD 9.0 (5.0‐15.75) (13 vs 15 required surgery) | ‐ | ‐ | ‐ | |
| Merbromin Sodium salicylate Zinc sulfadiazine Sodium salicylate + zinc sulfadiazine Collagenase + chloramphenicol | Merbromin 25 Sodium salicylate 25 Zinc sulfadiazine 25 Sodium salicylate + zinc sulfadiazine 25 Collagenase + chloramphenicol 25 | NR | Merbromin 11.32 (3.99) Sodium salicylate 15.00 (8.00) Zinc sulfadiazine 11.08 (4.69) Sodium salicylate + zinc sulfadiazine 14.8 (7.61) Collagenase + chloramphenicol 12.32 (5.92) | Merbromin vs sodium salicylate ‐3.68 (‐7.18 to ‐0.18) Merbromin vs zinc sulfadiazine ‐3.48 (‐6.85 to ‐0.11) | ‐ | ‐ | |
| CN: cerium nitrate; MEBO: moist exposed burn ointment; NR: not reported; NS: not significant; SD: standard deviation; SSD: silver sulfadiazine aChen 2006 assessed the following relevant comparisons between antiseptic (silver) and non‐antibacterial (Vaseline gauze) and between silver and SSD bLi 1994 assessed the following relevant comparisons between two antiseptics (ethacridine lactate and iodophor), between ethacridine lactate and a non‐antibacterial treatment (MEBO) and between iodophor and MEBO. dPiccolo‐Daher 1990 assessed the following relevant comparisons: Merbromin vs sodium salicylate and Merbromin vs zinc sulfadiazine; other comparisons were not relevant to the review | |||||||
| Comparison | Study | Number participants/burns | Duration | Measure reported | Reported data | RR (95% CI) |
| Antiseptic versus topical antibiotic | ||||||
| Silver hydrofibre Silver sulfadiazine | Silver 35 SSD 34 | Until healing | ‐ | ‐ | ‐ | |
| Silver hydrofibre Silver sulfadiazine | Silver 42 SSD 40 | 21 days | Participants with wound infection | Silver 8/42 SSD 6/40 | 1.27 (0.48 to 3.34) | |
| Silver hydrofibre Silver sulfadiazine | Silver 35 SSD 35 | NR | ‐ | ‐ | ‐ | |
| Silver hydrogel Silver sulfadiazine | Silver 84 SSD 79 (analysed silver 54, SSD 52) | 4 weeks/until healing | ‐ | ‐ | ‐ | |
| Silver hydrogel Silver sulfadiazine | Silver 12 SSD 12 | 21 days+ | Participants with wound infection | Silver 0 SSD 0 | ‐ | |
| Silver hydrogel Silver sulfadiazine | Silver 52 SSD 52 | 21 days+ | ‐ | ‐ | ‐ | |
| Silver foam Silver sulfadiazine | Silver 50 SSD 51 | 21 days | ‐ | ‐ | ‐ | |
| Silver foam Silver sulfadiazine | Silver 71 SSD 82 | 4 weeks | Participants with new signs of inflammation | Silver 8/71 SSD 14/82 | 0.66 (0.29 to 1.48) | |
| Silver foam Silver sulfadiazine | 24 participants randomised; group allocation unclear | NR | ‐ | ‐ | ‐ | |
| Silver foam Silver sulfadiazine | 40 participants; part of each burn randomised to treatments | 14 days | ‐ | ‐ | ‐ | |
| Nanocrystalline silver Silver sulfadiazine | Silver 65 SSD 63 Vaseline gauze 63 | Until healing | ‐ | ‐ | ‐ | |
| Nanocrystalline silver Silver sulfadiazine | 98 participants with 166 burns 83 burns in each group | 20 days | Bacterial clearance rates | ‐ | ‐ | |
| Nanocrystalline silver Silver sulfadiazine | Silver 25 SSD 25 | NR | Participants with wound infection | Silver 3/25 SSD 4/25 | 0.75 (0.19 to 3.01) | |
| Nanocrystalline silver Silver sulfadiazine | 14 participants with 2 burn areas; 14 burn areas in each group | NR | ‐ | ‐ | ‐ | |
| Silver nitrate Silver sulfadiazine | 120 participants with 2 burns; 120 burns in each group | Until healing | ‐ | ‐ | ‐ | |
| Silver alginate Silver sulfadiazine | Silver 30 SSD 35 | NR | ‐ | ‐ | ‐ | |
| Honey Silver sulfadiazine | Honey 37 SSD 41 | NR (2 months' follow‐up) | ‐ | ‐ | ‐ | |
| Honey Silver sulfadiazine | Honey 32 SSD 32 | 21 days | ‐ | ‐ | ‐ | |
| Honey Silver sulfadiazine | 150 participants with 2 burns; 150 burns in each group | 24 days | Burns with wound infection | Honey 6/150 SSD 29/150 | 0.21 (0.09 to 0.48) | |
| Honey Silver sulfadiazine | Honey 25 SSD 25 | 6 weeks | Time to achieve negative wound cultures | Honey 3 weeks SSD 5 weeks | ‐ | |
| Honey Silver sulfadiazine | Honey 40 SSD 40 | 46 days | ‐ | ‐ | ‐ | |
| Honey Silver sulfadiazine | Honey 52 SSD 52 | 15 days | Persistent infections (positive cultures) | Honey 4/43 SSD 38/41 | 0.10 (0.04 to 0.26) | |
| Honey Silver sulfadiazine | Honey 25 SSD 25 | 21 days | Participants with wound infection | Honey 0/25 SSD 4/25 | 0.11 (0.01 to 1.96) | |
| Honey Silver sulfadiazine | Honey 50 SSD 50 | 21 days | Persistent infections (positive cultures) | Honey 4/44 SSD 42/42 | 0.10 (0.04 to 0.24) | |
| Honey Silver sulfadiazine | Honey 25 SSD 25 | 42 days | Persistent infections (positive cultures); participants becoming culture negative. Details of isolated organisms | Week 1 Honey 17/20 SSD 11/22 Week 2 Honey 20/20 SSD 16/22 Week 3 Honey 20/20 SSD 19/22 Week 4 Honey 20/20 SSD 21/22 Week 6 Honey 20/20 SSD 22/22 | Not estimable at week 6 | |
| Honey Mafenide acetate | Honey 50 Mafenide acetate 50 | 30 days | New infections Day 7 New infections Day 21 | Honey 2/50 Mafenide 2/50 Honey 0/50 Mafenide 10/50 | 0.05 (0.00 to 0.79) | |
| Honey (olea) Mafenide acetate | Honey 10 Mafenide acetate 20 | 20 days | Infections (positive cultures) Day 7 | Honey 1/10 SSD 19/20 | 0.11 (0.02 to 0.68) | |
| Aloe Vera Silver sulfadiazine | Aloe Vera 30 SSD 30 | 24 days | Participants with wound infection | Aloe Vera 0 SSD 0 | ‐ | |
| Aloe Vera Silver sulfadiazine | Aloe Vera 60 SSD 60 | 14 days | Participants with wound infection | Aloe Vera 1 SSD 0 | 2.95 (0.12 to 70.82) | |
| Aloe Vera Silver sulfadiazine | Aloe Vera 25 SSD 25 | Until healing/ 2 months | Participants with wound infection | Aloe Vera 3 SSD 4 | 0.75 (0.19 to 3.01) | |
| Aloe Vera Silver sulfadiazine | Aloe Vera 20 SSD 18 | 26 days | ‐ | ‐ | ‐ | |
| Aloe Vera Framycetin | Aloe Vera 50 Framycetin 50 | NR | Grade of infection | Lower in Aloe Vera | ‐ | |
| Povidone iodine Silver sulfadiazine | 43 participants each with 2 comparable burns; 43 burns in each group | 21 days | ‐ | ‐ | ‐ | |
| Iodophor Moist exposed burn ointment (MEBO) Ethacridine lactate Silver sulfadiazine | Iodophor 24 MEBO 31 Ethacridine lactate 22 SSD 38 | Until healing | ‐ | ‐ | ‐ | |
| Sodium hypochlorite Silver sulfadiazine | 20 participants with 2 burns (20 burns/group) | 28 days | ‐ | ‐ | ‐ | |
| Octenidine Silver sulfadiazine | 30 participants with 2 burn areas; 30 burns in each group | 24 hours | ‐ | ‐ | ‐ | |
| Polyhexanide Silver sulfadiazine | Polyhexanide 30 with 38 burns SSD 30 with 34 burns | NR | ‐ | ‐ | ‐ | |
| Arnebia euchroma Silver sulfadiazine | 49 participants with 2 burns (49 burns/group) | 36 days | Infection score between 0 and 5; 1 point for each symptom of infection; 45 burns analysed/group | A euchroma 0: 37/45 1: 7/45 2: 1/45 3: 0/45 SSD 0: 31/45 1: 11/45 2: 2/45 3: 1/45 | ‐ | |
| Antispetic versus alternative antiseptic | ||||||
| Iodine Chlorhexidine | Iodine 111 Chlorhexidine 102 | NR | Systemic antibiotics prescribed for clinical/bacteriological signs of infection | Iodine 4/111 Chlorhexidine 4/102 | 1.09 (0.28 to 4.24) | |
| Antispetic versus non‐antibacterial treatment | ||||||
| Nanocrystalline silver Vaseline gauze | Nanocrystalline silver 38 Vaseline gauze 38 | 21 days | "Positive for bacteria" | Silver 1/38 Gauze 8/38 | 0.13 (0.02 to 0.95) | |
| Silver xenograft Petroleum gauze | Silver xenograft 16 Petroleum gauze 16 | 14 days | Rate of infection Bacterial colonisation | "No difference" Details of organisms reported | ‐ | |
| Honey Polyurethane film | Honey 46 Polyurethane film 46 | NR | Infection on day 8 | Honey 8 Polyurethane 17 | 0.47 (0.23 to 0.98) | |
| Honey gauze Amniotic membrane | Honey gauze 40 Amniotic membrane 24 | 30 days | Persistent infection at 7 days | Honey 4/28 Amniotic 11/19 | 0.25 (0.09 to 0.66) | |
| Honey Potato peel | Honey 50 Potato peel 50 | 21 days | Persistent infection at 7 days | Honey 4/40 Potato 42/42 | 0.10 (0.04 to 0.25) | |
| Honey "Conventional dressing" | Honey 450 "Conventional dressing" 450 | NR | ‐ | ‐ | ‐ | |
| Silver sulfadiazine + chlorhexidine Silver sulfadiazine alone | SSD + chlorhexidine 54 assessed SSD 67 assessed Unclear if additional post‐randomisation exclusions | Until healing (26 days) | Infection incidence | Chlorhexidine 10/54 SSD alone 12/67 | 1.03 (0.48 to 2.21) | |
| Chlorhexidine Polyurethane | Chlorhexidine 25 Polyurethane 26 | 30 days | Proven infection | Chlorhexidine 2/25 Polyurethane 1/26 | 2.08 (0.20 to 21.52) | |
| Chlorhexidine Hydrocolloid | Chlorhexidine 104 Hydrocolloid 92 | NR | ‐ | ‐ | ‐ | |
| Chlorhexidine tulle‐gras Hydrocolloid Hydrocolloid + SSD | Chlorhexidine tulle‐gras 18 Hydrocolloid 16 Hydrocolloid + SSD 16 | NR | Percentage of wounds with bacteria and pathogenic bacteria at baseline and post treatment | ‐ | ‐ | |
| Chlorhexidine Hydrocolloid | Chlorhexidine 49 Hydrocolloid 49 | NR | ‐ | ‐ | ‐ | |
| Povidone iodine + Bepanthenol Moist exposed burn ointment (MEBO) | Povidone iodine + Bepanthenol f107 MEBO 104 | 18 days | New infections | Iodine 8/107 MEBO 6/104 | 1.30 (0.47 to 3.61) | |
| Iodine gauze Carbon‐fibre dressing | Iodine gauze 74 Carbon‐fibre dressing 203 | NR | ‐ | ‐ | ‐ | |
| Iodophor gauze/ Hydrogel | 60 participants with burns wounds; 60 burn areas/group | 14 days | Bacterial presence reported | No difference between groups | ‐ | |
| Cerium nitrate + silver sulfadiazine Silver sulfadiazine alone | CN + SSD 30 SSD 30 | Until healing/ readiness for grafting | Bacterial cultures at baseline Resolved New 2/13 Total post‐treatment Sepsis by day 5 Sepsis after day 5 | CN + SSD 17/30 SSD 11/30 CN + SSD 16/17 SSD 8/11 CN + SSD 2/13 SSD 3/19 CN + SSD 3 SSD 6 CN + SSD 1 SSD 1 (both recovered) CN + SSD 0 SSD 3 (1 died) | RR post‐treatment infection 0.50 (0.14 to 1.82) RR Sepsis 0.25 (0.03, 2.11) RR new infection 0.97 (0.19 to 5.04) RR resolution 1.29 (0.88 to 1.89) | |
| Cerium nitrate + silver sulfadiazine Silver sulfadiazine alone | CN +SSD 78 SSD 76 | 21 days | ‐ | ‐ | ‐ | |
| Merbromin Sodium salicylate Zinc sulfadiazine Sodium salicylate + zinc sulfadiazine Collagenase + chloramphenicol | Merbromin 25 Sodium salicylate 25 Zinc sulfadiazine 25 Sodium salicylate + zinc sulfadiazine 25 Collagenase + chloramphenicol 25 | NR | ‐ | ‐ | ‐ | |
| CN: cerium nitrate; MEBO: moist exposed burn ointment; NR: not reported; SSD: silver sulfadiazine aChen 2006 also assessed a relevant comparison between antiseptic (silver) and non‐antibacterial (Vaseline gauze) bLi 1994 also assessed relevant comparisons between two antiseptics (ethacridine lactate and iodophor), between ethacridine lactate and a non‐antibacterial treatment (MEBO) and between iodophor and MEBO. | ||||||
| Study ID | Number participants/burns | Duration | Adverse events | Pain Means (SD) | Mortality | Quality of life | Resource use Means (SD) | Costs: Means (SD) Difference in means (95% CI) |
| Antiseptic versus topical antibiotic | ||||||||
| Silver versus SSD | ||||||||
| Silver hydrofibre 35 SSD 34 | Until healing | ‐ | Doses of fentanyl silver: 3.3 (1.9) SSD 10.3 (4.2) SD extrapolated from graph | ‐ | ‐ | ‐ | Costs of antibiotics, analgesics, dressings, accommodation, nursing/visiting (USD) Silver 26,000 (20,000) SSD 38,000 (30,000) Data extrapolated from graph MD ‐12,000 (‐24,065.99 to 65.99) | |
| Silver hydrofibre 42 SSD 40 | 21 days | All Silver 20 SSD 18 RR 1.06 (0.66 to 1.69) Serious Silver 8 SSD 8 RR 0.95 (0.40 to 2.29) | Participants aged > 4 years (69%) VAS score during dressing changes Silver 3.63 SSD 4.77 P = 0.003 | Silver 1 SSD 0 | Dressing changes/day Silver 0.5 (0.1) SSD 1.2 (0.5) Total dressing changes Silver 7.7 (3.9) SSD 19.1 (13.2) MD ‐11.40 (‐15.66 to ‐7.14) | Cost of nursing time (USD) Silver 14.30 SSD 21.90 Costs of study dressings Silver 684 SSD 398 Cost of all dressings (USD) Silver 845.5 SSD 759.6 Total care Silver 1040 (856.66) SSD 1180 (792.18) MD ‐140 (‐4.96.92 to 216.92) Cost effectiveness /patient healed (USD) Silver 1409.06 (1050.41‐1857.58) SSD 1967.95 (1483.06‐2690.22) MD ‐558.89 (‐1383.08 to 265.30) ICER ‐1019.21 (‐6320.59 to 4054.32) | ||
| Silver hydrofibre 35 SSD 35 | NR | ‐ | Pain during dressing Day 1: Silver 4.1 (2.1) SSD 6.1 (2.3) Day 3 Silver 2.1 ( 1.8) SSD 5.2 (2.1) Day 7 Silver 0.9 (1.4) SSD 3.3 (1.9) MD ‐1.42 (‐1.95 to ‐0.89) | ‐ | ‐ | ‐ | Total cost (USD) Silver 52 (29) SSD 93 (36) MD ‐ 41.00 (‐56.31 to ‐25.69) Hospital cost Silver 43 (28) SSD 57 (SD 25) Travel cost: Silver 9 (4) SSD 36 (SD 14) | |
| Silver hydrogel 84 SSD 79 analysed Silver 54 SSD 52 | 4 weeks/until healing | ‐ | ‐ | ‐ | ‐ | ‐ | ‐ | |
| Silver hydrogel 12 SSD 12 | 21 days+ | Silver 0 SSD 0 | Pain during dressing changes (Wong‐Baker Faces Pain Scale observational pain assessment scale in infants or toddlers) Silver 2.33 (1.07) SSD 5.33 (1.44) ‐2.28 (‐3.35, ‐1.22) | ‐ | ‐ | Number of dressing changes (over 21 days) Silver 13.50 (4.70) SSD 13.42 (8.26) MD 0.08 (‐5.30 to 5.46) | ‐ | |
| Silver hydrogel 52 SSD 52 | 21 days+ | During dressing: Silver no significant damage to granulation SSD damage to granulation | Silver no pain during dressing SSD pain during dressing | ‐ | ‐ | ‐ | ‐ | |
| Silver foam 50 SSD 51 | 21 days | 2 associated withdrawals in each group Other events reported Silver 16 SSD 10 RR 0.75 (0.48, 1.16) | Dressing application (week 1) Silver 19.1 SSD 40.0 During wear silver 22.0 SSD 35.5 Dressing removal: reported as NS | Silver 1 SSD 1 | ‐ | Mean number of dressing changes over 3 weeks (SD NR) Silver 2.24 (N = 47) SSD 12.4 Mean time to discharge Silver 5.62 d SSD 8.31 d | Total costs (USD) Silver 309 (144) SSD 514 (282) Average C‐E Silver 395 (344‐450) SSD 776 (659‐892) ICER ‐1688 Based on 20 participants | |
| Silver foam 71 SSD 82 | 4 weeks | Silver 4 participants with 5 events SSD 7 participants with 7 events RR 0.66 (0.20, 2.16) | Baseline Silver 35.3 (22.4) SSD 42.9 (25.8) Week 4 Before dressing removal silver 6.78 (12.95) SSD 11.0 (17.3) MD ‐4.22 (‐9.03 to 0.59) During dressing removal silver 9.23 (13.61) SSD 19.1 (23.9) After dressing removal silver 9.41 (17.33) SSD 15.8 (19.7) MD ‐6.39 (‐12.26 to ‐0.52) | ‐ | ‐ | Total number of dressing changes silver 3.06 SSD 14.0 Per week silver 1.36 SSD 5.67 SD NR | ‐ | |
| Silver foam SSD 24 participants randomised; group allocation unclear | NR | ‐ | Mean after each treatment Silver 2.92 (1.12) SSD 4.70 (2.22) MD ‐0.98 (‐1.83 to ‐0.12) | ‐ | ‐ | Number of treatments required: Silver 4.10 (1.38) SSD 10.27 (7.46) MD ‐6.17 (‐10.46 to ‐1.88) | ‐ | |
| Silver foam SSD 40 participants; part of each burn randomised to each treatment | 14 days | No serious events | ‐ | ‐ | ‐ | ‐ | ‐ | |
| Chen 2006a (nanoparticle) | Silver nanoparticle) 65 SSD 63 Vaseline gauze 63 | Until healing | ‐ | ‐ | ‐ | ‐ | ‐ | ‐ |
| 98 participants with 166 burns Nanocrystalline silver 83 burns SSD 83 burns | 20 days | No local allergic or systemic symptoms. No side effects related to silver dressing | ‐ | ‐ | ‐ | ‐ | ‐ | |
| Nanocrystalline silver 25 SSD 25 | NR | ‐ | Silver 4 (± 0.6) SSD 5 (± 0.7) MD ‐1.51 (‐2.14 to ‐0.88) | Silver 0 SSD 0 | ‐ | ‐ | ‐ | |
| Nanocrystalline silver SSD 14 participants with 2 burn areas; 14 burn areas/group | NR | Withdrawals due to pain/infection silver 0 SSD 5/10 after 4.8 d (0‐8) | Silver 3.2 (2.68) SSD 7.9 (2.65) Paired data for 10 participants ‐1.69 (‐2.74 to ‐0.64) | ‐ | ‐ | ‐ | ‐ | |
| Silver nitrate SSD 120 participants with 2 burns; 120 burns/ group | Until healing | ‐ | ‐ | ‐ | ‐ | ‐ | ‐ | |
| Silver alginate 30 SSD 35 | NR | ‐ | Silver 2.23 (1.87) SSD 6.08 (2.33) MD ‐1.79 (‐2.37 to ‐1.20) | ‐ | ‐ | Nursing time (min) Silver 8.47 (6.16) SSD 13.29 (4.19) Dressing changes Silver 2.93 (1.17) SSD 14.00 (4.18) MD ‐11.07 (‐12.52 to ‐9.62) | ‐ | |
| Honey versus topical antibiotics | ||||||||
| Honey 37 SSD 41 | NR (2 months' follow‐up) | ‐ | ‐ | ‐ | ‐ | ‐ | ‐ | |
| Honey 32 SSD 32 | 21 days | Contractures or over‐granulation reported in 3 vs 5 cases | Pain reported as "worse" for honey group | ‐ | ‐ | ‐ | ‐ | |
| Honey SSD 150 participants with 2 burns; 150 burns/group | 24 days | ‐ | ‐ | ‐ | ‐ | ‐ | ‐ | |
| Honey 25 SSD 25 | 6 weeks | Honey no allergy or side effects SSD 2 participants irritation/burning (mild) | Pain free 1 week honey 9 SSD 4 2 weeks honey 20 SSD 11 3 weeks honey 25 SSD 18 4 weeks honey 25 SSD 25 | ‐ | ‐ | ‐ | Cost per % of TBSA affected Honey 0.75 Rupees for 5 mL SSD 10 Rupees for 2 g ointment SD NR | |
| Honey 40 SSD 40 | 46 days | ‐ | ‐ | ‐ | ‐ | ‐ | ‐ | |
| Honey 52 SSD 52 | 15 days | ‐ | ‐ | ‐ | ‐ | ‐ | ‐ | |
| Honey 25 SSD 25 | 21 days | SSD 4 participants required skin grafting | ‐ | ‐ | ‐ | ‐ | ‐ | |
| Honey 50 SSD 50 | 21 days | No irritation allergy or other side effects. Need for skin grafting Honey 4 SSD 11 | Subjective relief of pain better in honey group | Hospital stay days Honey 22.0 (1.2) SSD 32.3 (2.0) | ||||
| Honey 25 SSD 25 | 60 days | ‐ | Time to complete relief of pain (mean) Honey 12 days SSD 16.8 days Up to 5 days Honey 9 SSD1 6‐12 days Honey 9 SSD 11 13‐21 days Honey 7 SSD 11 22‐26 days Honey 0 SSD 2 | Amount used per dressing per % burn Honey 5 gm (sic) SSD 2 gm (sic) Based on adult participants | Cost per dressing per % burn Honey 2.40 Rs SSD 4.92 Rs | |||
| Honey 50 Mafenide acetate 50 | 30 days | Honey 0 Mafenide 0 | ‐ | ‐ | ‐ | ‐ | ‐ | |
| Honey (olea) 10 Mafenide acetate 20 | 20 days | Need for surgical debridement Honey 0/10 Mafenide 13/20 | ‐ | ‐ | ‐ | ‐ | ‐ | |
| Aloe Vera versus topical antibiotics | ||||||||
| Aloe Vera 30 SSD 30 | 24 days | ‐ | ‐ | ‐ | ‐ | ‐ | ‐ | |
| Aloe Vera 60 SSD 60 | 14 days | ‐ | Changes from baseline Day 2 Aloe Vera 2.61 (1.55) SSD 1.19 (2.25) Day 7 Aloe Vera 5.13 (2.82) SSD 3.78 (2.83) Day 14 Aloe Vera 5.68 (3.2) SSD 4.54 (2.83) MD 1.14 (0.02 to 2.26) | ‐ | ‐ | ‐ | ‐ | |
| Aloe Vera 25 SSD 25 | Until healing/ 2 months | ‐ | Time to being pain free reported differently for groups | ‐ | ‐ | ‐ | Cost/%TBSA Aloe Vera 2.40 Rs SSD 4.92 Rs SD NR | |
| Aloe Vera 20 SSD 18 | 26 days | ‐ | ‐ | ‐ | ‐ | ‐ | ‐ | |
| Aloe Vera 50 Framycetin 50 | NR | ‐ | ‐ | ‐ | ‐ | ‐ | ‐ | |
| Iodine versus SSD | ||||||||
| Povidone iodine Hydrogel SSD 43 participants each with 2 comparable burns; 43 burns in each group | 21 days | 20 participants with events. 6 systemic and considered unrelated to study interventions Iodine 6 (5 pain) SSD 7 (5 pain) | ‐ | ‐ | ‐ | ‐ | ‐ | |
| MEBO 31 Iodophor 24 Ethacridine lactate 22 SSD 38 | Until healing | ‐ | ‐ | ‐ | ‐ | ‐ | All RMB (Chinese Yuan) MEBO 1836 (542.35) Iodophor 621 (130.83) Ethacridine 598 (125.43) SSD 674 (191.50) Ethacridine vs SSD MD ‐76.00 (‐1.56.34 to 4.34) Iodophor vs Ethacridine MD 23 (‐51.07 to 97.07) Ethacridine vs MEBO MD ‐1238 (‐1435.98 to ‐1040.02) Iodophor vs SSD MD ‐53.00 (‐133.29 to 27.29) Iodophor vs MEBO MD ‐1215 (‐1412.96 to ‐1017.04) | |
| Other antiseptics versus topical antibiotics | ||||||||
| 20 participants with 2 burns (20 burns/group) | 28 days | No serious events in either group. | ‐ | ‐ | ‐ | ‐ | ‐ | |
| Octenidine SSD 30 participants with 2 burn areas; 30 burns in each group | 24 hours | ‐ | Median VAS Octenidine 3 (1‐6) SSD 6 (3‐8) | ‐ | ‐ | ‐ | ‐ | |
| Polyhexanide 30 with 38 burns SSD 30 with 34 burns | NR | ‐ | Graph data Baseline Polyhexanide Change 7.8 Between 1.2 SSD Change 8 Between 3 Day 1 Polyhexanide Change 4.2 Between 0.8 SSD Change 6 Between 2.6 Day 3 Polyhexanide Change 2.2 Between 0.2 SSD Change 5 Between 1.8 Day 5 Polyhexanide Change 1.4 Between 0.1 SSD Change 4 Between 1 Day 7 Polyhexanide Change 0.8 Between 0.1 SSD Change 3 Between 0.8 Day 10 Polyhexanide Change 0.2 Between 0.5 SSD Change 2 Between 0.5 Day 14 Polyhexanide Change 0 Between 0 SSD Change 1.4 Between 0 SD NR | ‐ | ‐ | ‐ | Costs/day (EUR) Materials Polyhexanide 5.14 SSD 6.96 Personnel Polyhexanide 9.63 SSD 9.63 Total Polyhexanide 14.77 SSD 16.59 SD NR | |
| Arnebia euchroma SSD 49 participants with 2 burns; 49 burns in each group | 36 days but up to 10 days for secondary outcomes | Specific complications such as burning, pain, itching, warming , allergic reactions and requiring skin graft. Scores reported for itching and warming. Skin graft risk A euchroma 2.2% (2.2 to 6.7) SSD 6.7% (0.9 to 14.3) | Pain scores reported graphically for days 1, 3, 5 and 10 for minutes 1, 5 and 15 after dressing. Graphs appeared to show overlapping CI but P reported < 0.05 (CI could not be extracted) | ‐ | ‐ | ‐ | ‐ | |
| Antiseptics versus alternative antiseptics | ||||||||
| Iodine 111 Chlorhexidine 102 | NR | ‐ | Pain at rest Iodine (N = 84) 9.18 (15.11) Chlorhexidine (N = 78) 11.44 (14.27) MD 2.26 (‐2.26 to 6.78) Pain on dressing removal Iodine (N = 92) 6.66 (11.06) Chlorhexidine (N = 84) 8.75 (15.84) MD 2.09 (‐2.00 to 6.18) | ‐ | ‐ | Number hospital visits (N unclear) Iodine 2.64 (1.45) Chlorhexidine 3.03 (1.62) MD 0.25 (‐.0.02 to 0.52) | ‐ | |
| Antispetic versus non‐antibacterial treatment | ||||||||
| Nanocrystalline silver 38 Vaseline gauze 38 | 30 days | Scar hyperplasia reported; no other data | ‐ | ‐ | ‐ | ‐ | ‐ | |
| Silver xenograft 16 Petroleum gauze 16 | 14 days | ‐ | ‐ | ‐ | ‐ | ‐ | ‐ | |
| Honey 46 Polyurethane film 46 | NR | Honey 4 noted Polyurethane 6 noted Not clear all events were reported/basis of reported events | ‐ | ‐ | ‐ | ‐ | ‐ | |
| Honey gauze 40 Amniotic membrane 24 | 30 days | Honey 4/40 Amniotic 5/24 Not clear all events were reported/basis of reported events | Numbers with pain evaluated with 4‐point scale None/mild Honey 33/40 Amniotic 13/24 Moderate/severe Honey 7/40 Amniotic 11/24 | ‐ | ‐ | ‐ | ‐ | |
| Honey 50 Potato peel 50 | 21 days | "Allergy or other side effects were not observed in any patient of either group" | "Subjective relief of pain was the same in both groups" | ‐ | ‐ | ‐ | ‐ | |
| Honey 450 "Conventional dressing" 450 | NR | ‐ | ‐ | ‐ | ‐ | ‐ | ‐ | |
| SSD + chlorhexidine 54 assessed SSD only 67 assessed Unclear if additional post‐randomisation exclusions | Until healing (26 days) | ‐ | Pain sufficient to stop treatment Chlorhexidine 1/54 SSD alone 0/67 | Chlorhexidine 3/54 SSD alone 4/67 RR 0.93 (0.22 to 3.98) Infection‐related chlorhexidine 3/54 SSD alone 0/67 | ‐ | ‐ | ‐ | |
| Chlorhexidine 25 Polyurethane 26 | 30 days | ‐ | Qualitative data only (chlorhexidine perceived as more painful) | ‐ | ‐ | ‐ | ‐ | |
| Chlorhexidine 104 Hydrocolloid 92 | NR | ‐ | ‐ | ‐ | ‐ | ‐ | ‐ | |
| Chlorhexidine tulle‐gras 18 Hydrocolloid 16 Hydrocolloid + SSD 16 | NR | ‐ | ‐ | ‐ | ‐ | ‐ | ‐ | |
| Chlorhexidine 49 Hydrocolloid 49 | NR | Chlorhexidine 1 Hydrocolloid 5 Denominator unclear | VAS (summed for each visit) Chlorhexidine (N = 31) Hydrocolloid (N = 36) P = 0.284 | ‐ | ‐ | Number dressings Chlorhexidine 2.8 Hydrocolloid 2.61 SD NR | ‐ | |
| Povidone iodine + Bepanthenol 107 MEBO 104 | 18 days | "Complications" Iodine 8 MEBO 11 RR 1.30 (0.47 to 3.61) | Median pain scores reported graphically. Analgesia requirements also reported | ‐ | ‐ | Reduction of hospital stay (subtracted from a standard length of stay (10 days)) Iodine ‐3.01 (2.02) MEBO ‐3.63 (2.19) MD 0.62 (0.05 to 1.19) | Costs of hospital stay including medicines and examinations and the visits and treatments after discharge 2006 (EUR) Total MEBO 529.66 (172.75) Total iodine 566.21 (151.45) MD 36.55 (‐7.33 to 80.43) ICERs reported per day of hospitalisation and per day of recovery gained. Total/hospitalisation day gained ‐58.95E (‐63.10, ‐55.09) (favours MEBO) | |
| Iodine gauze 74 Superficial 16 Deep 32 Residual 26 Carbon‐fibre dressing 203 Superficial 46 Deep 89 Residual 68 | NR | ‐ | ‐ | ‐ | ‐ | ‐ | ‐ | |
| 60 participants with burn wounds; 60 burn areas/group (Iodophor gauze/ hydrogel) | 14 days | ‐ | Dressing change pain Iodophor 43 wounds caused evident pain (VAS score 3‐6) Hydrogel 37 wounds caused mild pain (VAS 1‐3) | ‐ | ‐ | ‐ | ‐ | |
| Cerium nitrate + SSD 30 SSD 30 | Until healing/ readiness for grafting | ‐ | ‐ | CN + SSD 1/30 SSD 4/30 RR 0.25 (0.03 to 2.11) | ‐ | Days of hospitalisation CN + SSD 23.3 (11.4) SSD 30.7 (22.7) MD ‐7.40 (‐16.49 to 1.69) | ‐ | |
| Cerium nitrate + SSD 78 SSD 76 | 21 days | ‐ | Mean (SEM) CN + SSD 0.6 (0.2) SSD 1.2 (0.4) MD Procedural Mean (SEM) CN + SSD 1.3 (0.3) SSD 1.6 (0.5) MD ‐0.60 (‐0.70 to ‐0.50) | CN SSD 1 SSD 5 RR 0.19 (0.02 to 1.63) | ‐ | ‐ | ‐ | |
| Multiple comparisons Merbromin 25 Sodium salicylate 25 Zinc sulfadiazine 25 Sodium salicylate + zinc sulfadiazine 25 Collagenase + chloramphenicol 25 | NR | ‐ | ‐ | ‐ | ‐ | ‐ | ‐ | |
| C‐E: cost‐effectiveness; CN: cerium nitrate; ICER: incremental cost‐effectiveness ratio; MEBO: moist exposed burn ointment; NR: not reported; NS: not significant; SD: standard deviation; SEM: standard error of mean; SSD: silver sulfadiazine; TBSA: total body surface area; VAS: visual analogue scale aChen 2006 also assessed a relevant comparison between antiseptic (silver) and non‐antibacterial (Vaseline gauze) bLi 1994 also assessed relevant comparisons between two antiseptics (ethacridine lactate and iodophor), between ethacridine lactate and a non‐antibacterial treatment (MEBO) and between iodophor and MEBO. | ||||||||
| Comparison | Number trials & study detail | Number participants | Wound healing evidence | Wound healing: certainty of the evidence | Infection evidence | Infection: certainty of the evidence | Adverse events evidence | Adverse events: certainty of the evidence |
| Sodium hypochlorite versus SSD | 1 trial | Trial N = 20 Intra‐individual design | Mean time to healing MD 2.1 (3.87 to 0.33) | Low (downgraded twice for imprecision) | ‐ | ‐ | ‐ | ‐ |
| Chlorhexidine or polyhexanide (biguanides) versus SSD | 2 trials | Trial N = 110 participants with 126 burns; 106 burns relevant to comparison | ‐ | ‐ | ‐ | ‐ | ||
| Octenidine versus SSD | 1 trial | Trial N = 30 Intra‐individual design | ‐ | ‐ | ‐ | ‐ | ||
| Ethacridine lactate versus SSD | 1 trial | Trial N = 115 Relevant to comparison: 60 | Mean time to healing MD 2.0 (‐0.57 to 4.57) | Low (downgraded twice for imprecision) | ‐ | ‐ | ‐ | ‐ |
| Merbromin versus zinc sulfadiazine | 1 trial | Trial N = 125 Relevant to comparison: 50 | Mean time to healing MD ‐3.48 (‐6.85 to ‐0.11) | Low (downgraded twice for imprecision) | ‐ | ‐ | ‐ | ‐ |
| Arnebia euchroma versus SSD | 1 trial | Trial N = 49 Intra‐individual design | HR 1.42 (0.91 to 2.21) Mean time to healing MD ‐3.60 (95% ‐6.41 to ‐1.06) | Low (downgraded twice for imprecision) | ‐ | ‐ | ‐ | ‐ |
| Chlorhexidine versus Iodine‐based | 1 trial | Trial N = 213 | Mean time to healing MD 2.21 (0.34 to 4.08) | Low (Downgraded once for reporting bias and once for imprecision) | RR 1.09 (0.28 to 4.24) | Very low (downgraded once for risk of reporting bias and twice for imprecision) | ‐ | ‐ |
| Ethacridine lactate versus iodophor | 1 trial | Trial N = 115 Relevant to comparison: 46 | Mean time to healing MD ‐1.0 (‐4.31 to 2.31) | Low (downgraded twice for imprecision) | ‐ | ‐ | ‐ | ‐ |
| Ethacridine lactate versus non‐antibacterial (MEBO) | 1 trial | Trial N = 115 Relevant to comparison: 53 | Mean time to healing MD ‐25.00 (‐29.1 to ‐20.79) | Low (downgraded twice for imprecision) | ‐ | ‐ | ‐ | ‐ |
| Cerium nitrate versus non‐antibacterial | 2 trials Oen 2012 | Trial N = 214 Reporting wound healing: 214 Reporting infection: 60 | No evaluable data | ‐ | RR 0.50 (0.14 to 1.82) | Low (downgraded twice for imprecision) | ‐ | ‐ |
| Merbromin versus sodium salicylate | 1 trial | Trial N = 125 Relevant to comparison: 50 | Mean time to healing MD ‐3.68 (‐7.18 to ‐0.18) | Low (downgraded twice for imprecision) | ‐ | ‐ | ‐ | ‐ |
| HR: hazard ratio; MD: mean difference; N: number; RR: risk ratio | ||||||||
| Outcome or subgroup title | No. of studies | No. of participants | Statistical method | Effect size |
| 1 Wound healing (hazard ratio) Show forest plot | 3 | 259 | Hazard Ratio (Random, 95% CI) | 1.25 [0.94, 1.67] |
| 2 Wound healing (mean time to healing) Show forest plot | 10 | 1085 | Mean Difference (IV, Random, 95% CI) | ‐3.33 [‐4.96, ‐1.70] |
| 3 Wound healing (risk ratio) up to 28 days Show forest plot | 5 | 408 | Risk Ratio (M‐H, Random, 95% CI) | 1.17 [1.00, 1.37] |
| 4 Infection (up to 4 weeks or NR) Show forest plot | 4 | 309 | Risk Ratio (M‐H, Random, 95% CI) | 0.84 [0.48, 1.49] |
| 5 Adverse events (14‐28 days) Show forest plot | 6 | 606 | Risk Ratio (M‐H, Random, 95% CI) | 0.86 [0.63, 1.18] |
| 6 Withdrawals due to adverse events (21 days or NR) Show forest plot | 2 | Risk Ratio (M‐H, Random, 95% CI) | Totals not selected | |
| 7 Pain at dressing change (up to 28 days or NR) Show forest plot | 5 | 353 | Std. Mean Difference (IV, Random, 95% CI) | ‐1.20 [‐1.92, ‐0.49] |
| 8 Pain (time/follow‐up not specified) Show forest plot | 3 | 135 | Std. Mean Difference (IV, Random, 95% CI) | ‐1.66 [‐2.06, ‐1.27] |
| 9 Mortality (21 days or NR) Show forest plot | 3 | 233 | Risk Ratio (M‐H, Random, 95% CI) | 1.59 [0.20, 12.64] |
| 10 Resource use (number of dressings) (up to 28 days or NR) Show forest plot | 6 | 446 | Mean Difference (IV, Random, 95% CI) | ‐7.56 [‐12.09, ‐3.04] |
| 11 Costs (21 days or NR) Show forest plot | 4 | 261 | Mean Difference (IV, Random, 95% CI) | ‐117.18 [‐280.02, 45.67] |
| 12 Cost‐effectiveness/wound healed (21 days) Show forest plot | 2 | 122 | Mean Difference (IV, Random, 95% CI) | ‐384.71 [‐503.66, ‐265.75] |
| Outcome or subgroup title | No. of studies | No. of participants | Statistical method | Effect size |
| 1 Wound healing (hazard ratio) Show forest plot | 5 | 580 | Hazard Ratio (Random, 95% CI) | 2.45 [1.71, 3.52] |
| 2 Wound healing (risk ratio) (up to 60 days) Show forest plot | 6 | 418 | Risk Ratio (M‐H, Random, 95% CI) | 1.65 [0.99, 2.76] |
| 3 Wound healing (mean time to healing) Show forest plot | 6 | 712 | Mean Difference (IV, Random, 95% CI) | ‐3.79 [‐7.15, ‐0.43] |
| 4 Incident infection (up to 24 days) Show forest plot | 4 | 480 | Risk Ratio (M‐H, Random, 95% CI) | 0.16 [0.08, 0.34] |
| 5 Persistent positive swabs (up to 21 days) Show forest plot | 2 | 170 | Risk Ratio (M‐H, Random, 95% CI) | 0.10 [0.05, 0.19] |
| 6 Adverse events (time points between 21 days and 6 weeks) Show forest plot | 3 | 250 | Risk Ratio (M‐H, Random, 95% CI) | 0.2 [0.01, 3.97] |
| Outcome or subgroup title | No. of studies | No. of participants | Statistical method | Effect size |
| 1 Wound healing (mean time to healing) Show forest plot | 3 | 210 | Mean Difference (IV, Random, 95% CI) | ‐7.79 [‐17.96, 2.38] |
| 2 Infection (time points between 14 days and 2 months) Show forest plot | 3 | 221 | Risk Ratio (M‐H, Random, 95% CI) | 0.93 [0.26, 3.34] |
| Outcome or subgroup title | No. of studies | No. of participants | Statistical method | Effect size |
| 1 Wound healing (mean time to healing) Show forest plot | 2 | 148 | Mean Difference (IV, Random, 95% CI) | ‐0.47 [‐2.76, 1.83] |
| Outcome or subgroup title | No. of studies | No. of participants | Statistical method | Effect size |
| 1 Wound healing (mean time to healing) Show forest plot | 2 | 204 | Mean Difference (IV, Random, 95% CI) | ‐3.49 [‐4.46, ‐2.52] |
| 2 Positive swab (21 days) Show forest plot | 1 | 76 | Risk Ratio (M‐H, Random, 95% CI) | 0.13 [0.02, 0.95] |
| Outcome or subgroup title | No. of studies | No. of participants | Statistical method | Effect size |
| 1 Wound healing (hazard ratio) Show forest plot | 2 | 164 | Hazard Ratio (Fixed, 95% CI) | 2.86 [1.60, 5.11] |
| 2 Wound healing (mean time to healing) Show forest plot | 4 | 1156 | Mean Difference (IV, Random, 95% CI) | ‐5.32 [‐6.30, ‐4.34] |
| 3 Persistent positive swabs (up to 30 days) Show forest plot | 2 | 147 | Risk Ratio (M‐H, Random, 95% CI) | 0.15 [0.06, 0.40] |
| Outcome or subgroup title | No. of studies | No. of participants | Statistical method | Effect size |
| 1 Wound healing (mean time to healing) Show forest plot | 3 | Mean Difference (IV, Fixed, 95% CI) | Subtotals only | |
| 2 Infection (up to 30 days) Show forest plot | 2 | 172 | Risk Ratio (M‐H, Random, 95% CI) | 1.11 [0.54, 2.27] |
| Outcome or subgroup title | No. of studies | No. of participants | Statistical method | Effect size |
| 1 Wound healing (mean time to healing) Show forest plot | 2 | Mean Difference (IV, Random, 95% CI) | Subtotals only | |
| 2 Costs (duration 18 days +) Show forest plot | 2 | Mean Difference (IV, Random, 95% CI) | Totals not selected | |
| Outcome or subgroup title | No. of studies | No. of participants | Statistical method | Effect size |
| 1 Mortality (short‐term or unclear) Show forest plot | 2 | 214 | Risk Ratio (M‐H, Random, 95% CI) | 0.22 [0.05, 0.99] |