Hidrato de cloral como sedante para los procedimientos neurodiagnósticos en niños
Resumen
Antecedentes
Las investigaciones neurodiagnósticas pediátricas, incluida la neuroimagen cerebral y la electroencefalografía (EEG), desempeñan una función importante en la evaluación de los trastornos del desarrollo nervioso. La administración de un sedante apropiado es importante para asegurar la finalización exitosa de los procedimientos neurodiagnósticos, en particular en los niños, que generalmente son incapaces de permanecer quietos durante todo el procedimiento.
Objetivos
Evaluar la efectividad y los efectos adversos del hidrato de cloral como un sedante para los procedimientos neurodiagnósticos no invasivos en los niños.
Métodos de búsqueda
Se utilizó la estrategia de búsqueda estándar del Grupo Cochrane de Epilepsia (Cochrane Epilepsy Group). Se hicieron búsquedas en MEDLINE (OVID SP) (1950 hasta julio 2017), en el Registro Cochrane Central de Ensayos Controlados (Cochrane Central Register of Controlled Trials) (CENTRAL) (la Cochrane Library, número 7, 2017), Embase (1980 hasta julio 2017), y en el registro especializado del Grupo Cochrane de Epilepsia (Cochrane Epilepsy Group Specialized Register) (vía CENTRAL), utilizando una combinación de palabras clave y términos médicos MeSH.
Criterios de selección
Se incluyeron ensayos controlados aleatorios que evaluaban el agente hidrato de cloral en comparación con uno o varios sedantes, agentes no farmacológicos, o placebo en niños sometidos a procedimientos neurodiagnósticos no invasivos.
Obtención y análisis de los datos
Dos autores de la revisión, de forma independiente, evaluaron la elegibilidad de los estudios, extrajeron los datos y analizaron el riesgo de sesgo. Los resultados se expresaron en cuanto al cociente de riesgos (CR) para los datos dicotómicos, la diferencia de medias (DM) para los datos continuos, con intervalos de confianza (IC) del 95%.
Resultados principales
Se incluyeron 13 estudios con un total de 2390 niños. Todos los estudios fueron realizados en hospitales que prestaban servicios neurodiagnósticos. La mayoría de los estudios evaluó la proporción del fracaso de la sedación durante el procedimiento neurodiagnóstico, el tiempo para lograr una sedación adecuada y los posibles efectos adversos asociados con el sedante.
La calidad metodológica de los estudios incluidos fue diversa debido a la amplia variación en los perfiles de "Riesgo de sesgo". El cegamiento de los participantes y el personal no se logró en la mayoría de los estudios incluidos, y tres de los 13 estudios estuvieron en alto riesgo de sesgo debido al informe selectivo. La evaluación de la eficacia de los agentes sedantes también tuvo poco poder estadístico, y todas las comparaciones se realizaron en estudios pequeños individuales.
Los niños que recibieron hidrato de cloral oral presentaron un fracaso inferior de la sedación en comparación con la prometazina oral (CR 0,11; IC del 95%: 0,01 a 0,82; un estudio, evidencia de calidad moderada). Los niños que recibieron hidrato de cloral oral presentaron un riesgo mayor de fracaso de la sedación después de una dosis en comparación con los que recibieron pentobarbital intravenoso (CR 4,33; IC del 95%: 1,35 a 13,89; 1 estudio, evidencia de baja calidad), aunque después de dos dosis no hubo evidencia de una diferencia significativa entre los dos grupos (CR 3,00; IC del 95%: 0,33 a 27,46; un estudio, evidencia de muy baja calidad). Los niños que recibieron hidrato de cloral oral parecieron tener más fracaso de la sedación en comparación con la musicoterapia, aunque la calidad de la evidencia fue muy baja para este resultado (CR 17,00; IC del 95%: 2,37 a 122,14; un estudio). Las tasas de fracaso de la sedación fueron similares entre el hidrato de cloral oral, la dexmedetomidina oral, el clorhidrato de hidroxizina oral y el midazolam oral.
Los niños que recibieron hidrato de cloral oral presentaron un tiempo más corto para lograr una sedación adecuada en comparación con los que recibieron dexmedetomidina oral (DM ‐3,86; IC del 95%: ‐5,12 a ‐2,6; un estudio, evidencia de calidad moderada), clorhidrato de hidroxizina oral (DM ‐7,5; IC del 95%: ‐7,85 a ‐7,15; un estudio, evidencia de calidad moderada), prometazina oral (DM ‐12,11; IC del 95%: ‐18,48 a ‐5,74; 1 estudio, evidencia de calidad moderada) y midazolam rectal (DM ‐95,70; IC del 95%: ‐114,51 a ‐76,89; un estudio). Sin embargo, los niños que recibieron hidrato de cloral oral tardaron más para lograr una sedación adecuada en comparación con pentobarbital intravenoso (DM 19; IC del 95%: 16,61 a 21,39; un estudio, evidencia de baja calidad) y midazolam intranasal (DM 12,83; IC del 95%: 7,22 a 18,44; un estudio, evidencia de calidad moderada).
No hubo datos disponibles para evaluar la proporción de niños que lograron la finalización exitosa del procedimiento neurodiagnóstico sin interrupción debido al despertar del niño. La mayoría de los ensayos no evaluó la sedación adecuada según lo medido con escalas validadas específicas, excepto en la comparación del hidrato de cloral versus midazolam intranasal y prometazina oral.
En comparación con dexmedetomidina, el hidrato de cloral se asoció con un riesgo mayor de náuseas y vómitos (CR 12,04; IC del 95%: 1,58 a 91,96). Ningún otro evento adverso se asoció significativamente con el hidrato de cloral (incluido el cambio conductual, la desaturación de oxígeno) aunque hubo un mayor riesgo de eventos adversos generales (CR 7,66; IC del 95%: 1,78 a 32,91; un estudio, evidencia de baja calidad).
Conclusiones de los autores
La calidad de la evidencia para las comparaciones del hidrato de cloral oral versus otros diversos métodos de sedación fue muy variable. El hidrato de cloral oral parece tener una tasa inferior de fracaso de la sedación en comparación con la prometazina oral para los niños sometidos a procedimientos neurodiagnósticos pediátricos. El fracaso de la sedación fue similar para otras comparaciones como la dexmedetomidina oral, el clorhidrato de hidroxizina oral y el midazolam oral. En comparación con el pentobarbital intravenoso y la musicoterapia, el hidrato de cloral oral tuvo una tasa mayor de fracaso de la sedación. Sin embargo, debe observarse que la evidencia para los resultados de las comparaciones del hidrato de cloral oral versus pentobarbital intravenoso y musicoterapia fue de calidad muy baja a baja, por lo tanto, los hallazgos correspondientes deben interpretarse con cuidado.
La investigación adicional debe determinar los efectos del hidrato de cloral oral sobre los resultados clínicos principales como la finalización exitosa de los procedimientos, la necesidad de sedantes adicionales y el grado de sedación medido con escalas validadas, que se evaluaron con poca frecuencia en los estudios incluidos en esta revisión. El perfil de seguridad del hidrato de cloral debe estudiarse aún más, especialmente el riesgo de efectos adversos graves como la bradicardia, la hipotensión y desaturación de oxígeno.
PICO
Resumen en términos sencillos
Efectividad del hidrato de cloral como sedante para los niños sometidos a procedimientos neurodiagnósticos
Pregunta de la revisión
¿En los niños sometidos a procedimientos neurodiagnósticos no invasivos, el hidrato de cloral oral es más efectivo para producir una sedación adecuada y más seguro que otras formas de lograr la sedación?
Antecedentes
Los procedimientos neurodiagnósticos son investigaciones neurológicas no invasivas importantes para los niños con presuntos trastornos neurológicos. Estas investigaciones incluyen la imagenología cerebral y la prueba de la actividad eléctrica cerebral. Para que estas pruebas funcionen con éxito, el niño debe permanecer quieto durante al menos 30 a 45 minutos durante el período de investigación. Se necesitan sedantes para los niños, que generalmente son incapaces de permanecer quietos durante este período.
Fecha de la búsqueda
Se realizó una búsqueda en múltiples bases de datos médicas en julio 2017.
Características de los estudios
Trece estudios con un total de 2390 niños se ajustan a los criterios de inclusión. Todos estos estudios fueron realizados en hospitales que prestaban servicios neurodiagnósticos. La mayoría de los estudios evaluó tres medidas de resultado principales: i) la proporción de niños que fueron sedados sin éxito para el procedimiento neurodiagnóstico, ii) el período de tiempo que tomó la sedación adecuada, y iii) los efectos secundarios asociados con el sedante. La calidad de los estudios incluidos fue variada, de muy baja a alta. La calidad de los estudios fue afectada principalmente debido a que las personas estrechamente involucradas en los ensayos, como los médicos que administraban la sedación o los padres del niño, no fueron cegados al sedante administrado al niño, lo cual podría haber afectado el registro o la interpretación de los resultados.
Resultados clave
Se resumió la evidencia de la efectividad y los efectos perjudiciales de la sedación con hidrato de cloral oral en comparación con otros fármacos sedantes. Se incluyeron 13 estudios con un total de 2390 niños (edad hasta 18 años). Todos los estudios fueron realizados en hospitales que realizaban procedimientos neurodiagnósticos. La revisión indica que el hidrato de cloral oral presenta la misma efectividad que un sedante con una tasa similar de fracaso de la sedación en comparación con dexmedetomidina oral, clorhidrato de hidroxizina oral y midazolam oral; y probablemente es un sedante más efectivo con una tasa inferior de fracaso de la sedación en comparación con la prometazina oral. Aunque la mayoría de los estudios incluidos revelaron que el hidrato de cloral fue seguro y no presentó un aumento de los efectos secundarios en comparación con otros sedantes, un estudio informó un riesgo mayor de efectos adversos en comparación con dexmedetomidina oral.
Calidad de la evidencia
La calidad de la mayor parte de la evidencia fue deficiente debido a las fallas metodológicas en los estudios incluidos y al tamaño de la muestra pequeño de cada estudio. En consecuencia, la confianza en los resultados de los estudios es reducida. El factor principal que afectó la calidad de la evidencia fue la falta de precisión en los cálculos de los resultados, debido a que el rango posible calculado de los efectos fue amplio.
Conclusiones
Aparte del pentobarbital intravenoso y la musicoterapia, el hidrato de cloral oral presenta la misma efectividad o una efectividad mejor que un sedante en comparación con otros sedantes para los niños sometidos a procedimientos neurodiagnósticos no invasivos. En vista de la calidad deficiente de la evidencia, no fue posible establecer ninguna conclusión clara sobre la efectividad ni la seguridad de ningún sedante pediátrico. El perfil de efectos secundarios del hidrato de cloral oral en comparación con otros sedantes debe estudiarse de forma adicional.
Authors' conclusions
Summary of findings
| Chloral hydrate orally (50 mg/kg or 100 mg/kg) compared to dexmedetomidine orally (2 mg/kg or 3 mg/kg) as sedating agents for neurodiagnostic procedures in children | ||||||
| Patient or population: children undergoing neurodiagnostic procedures | ||||||
| Outcomes | Anticipated absolute effects* (95% CI) | Relative effect | № of participants | Quality of the evidence | Comments | |
| Risk with dexmedetomidine | Risk with chloral hydrate | |||||
| Proportion of children who successfully completed neurodiagnostic procedure without interruption by the child awakening | ‐ | ‐ | ‐ | ‐ | ‐ | No study for this comparison assessed this outcome. |
| Proportion of children who required a further dose of either the same sedative agent or the addition of a different sedative agent | ‐ | ‐ | ‐ | ‐ | ‐ | No study for this comparison assessed this outcome. |
| Time to adequate sedation (minutes or as measured by specific validated scales such as the Ramsay Sedation Score) | The mean EEG time onset for adequate sedation (minutes) was 35.2. | The mean EEG time onset for adequate sedation (minutes) in the intervention group was 3.86 minutes shorter (5.12 shorter to 2.6 shorter). | ‐ | 160 | ⊕⊕⊕⊝ | |
| Proportion of children who had sedation failure or inadequate level of sedation | Study population | RR 1.14 | 160 | ⊕⊕⊕⊝ | ||
| 119 per 1000 | 136 per 1000 | |||||
| Sedation duration (minutes) | The mean duration of sedation/sleep was 112.1 minutes3 | The mean EEG sedation/sleep duration in the intervention group was 16.31 minutes longer (9.15 to 23.46 minutes longer) | ‐ | 160 | ⊕⊕⊕⊝ | |
| Number of children with clinical adverse events (any) | Study population | RR 7.66 | 160 | ⊕⊕⊝⊝ | ||
| 24 per 1000 | 182 per 1000 | |||||
| *The risk in the intervention group (and its 95% confidence interval) is based on the assumed risk in the comparison group and the relative effect of the intervention (and its 95% CI). | ||||||
| GRADE Working Group grades of evidence | ||||||
| 1The 95% CI for this estimate ranges from 2.6 to 5.1 minutes of difference, which in terms of length of sedation is wide. Quality of evidence downgraded one level due to risk of bias. | ||||||
| Chloral hydrate orally (75 mg/kg) compared to pentobarbital intravenously (5 mg/kg) as sedating agents for neurodiagnostic procedures in children | ||||||
| Patient or population: children undergoing neurodiagnostic procedures | ||||||
| Outcomes | Anticipated absolute effects* (95% CI) | Relative effect | № of participants | Quality of the evidence | Comments | |
| Risk with pentobarbital | Risk with chloral hydrate | |||||
| Proportion of children who successfully completed neurodiagnostic procedure without interruption by the child awakening | ‐ | ‐ | ‐ | ‐ | ‐ | No study for this comparison assessed this outcome. |
| Proportion of children who required a further dose of either the same sedative agent or the addition of a different sedative agent | ‐ | ‐ | ‐ | ‐ | ‐ | No study for this comparison assessed this outcome. |
| Time to adequate sedation (minutes or as measured by specific validated scales such as the Ramsay Sedation Score) | The mean time to adequate sedation was 9 minutes. | The mean time to adequate sedation in the intervention group was 19 minutes longer (16.61 to 21.39 minutes longer). | ‐ | 70 | ⊕⊕⊝⊝ | |
| Proportion of children who had sedation failure after 1 dose of sedative agent | Study population | RR 4.33 | 70 | ⊕⊕⊝⊝ | ||
| 86 per 1000 | 371 per 1000 | |||||
| Proportion of children who had sedation failure after 2 doses of sedative agent (same or different) | Study population | RR 3.00 | 70 | ⊕⊝⊝⊝ | ||
| 29 per 1000 | 86 per 1000 | |||||
| Non‐interpretable neuroimaging finding | Study population | RR 0.23 | 54 | ⊕⊝⊝⊝ | ||
| 154 per 1000 | 35 per 1000 | |||||
| Number of children with clinical adverse event: oxygen desaturation | Study population | RR 0.67 | 70 | ⊕⊝⊝⊝ | ||
| 171 per 1000 | 115 per 1000 | |||||
| *The risk in the intervention group (and its 95% confidence interval) is based on the assumed risk in the comparison group and the relative effect of the intervention (and its 95% CI). | ||||||
| GRADE Working Group grades of evidence | ||||||
| 1The single included study had unclear risk of bias for allocation concealment and blinding of outcome assessor and high risk of bias for blinding of participants and personnel. Quality of evidence downgraded one level due to risk of bias. | ||||||
| Chloral hydrate orally (100 mg/kg or 75 mg/kg) compared to midazolam (0.2 mg/kg intranasally or 0.5 mg/kg orally) as sedating agents for neurodiagnostic procedures in children | ||||||
| Patient or population: children undergoing neurodiagnostic procedures | ||||||
| Outcomes | Anticipated absolute effects* (95% CI) | Relative effect | № of participants | Quality of the evidence | Comments | |
| Risk with midazolam | Risk with chloral hydrate | |||||
| Proportion of children who successfully completed neurodiagnostic procedure without interruption by the child awakening | ‐ | ‐ | ‐ | ‐ | ‐ | No study for this comparison assessed this outcome. |
| Proportion of children who required a further dose of either the same sedative agent or the addition of a different sedative agent | ‐ | ‐ | ‐ | ‐ | ‐ | No study for this comparison assessed this outcome. |
| Time to adequate sedation (minutes or as measured by specific validated scales such as the Ramsay Sedation Score) | The mean time to adequate sedation was 10.92 minutes (intranasal midazolam). | The mean time to adequate sedation in the intervention group was 12.83 minutes longer (7.22 to 18.44 minutes longer). | ‐ | 60 | ⊕⊕⊕⊝ | |
| Proportion of children with inadequate level of sedation (Ramsay score below 4) | Study population | RR 0.11 | 60 | ⊕⊕⊕⊝ | ||
| 600 per 1000 | 66 per 1000 | |||||
| Proportion of children who had sedation failure after 1 dose of sedative agent | Study population | RR 0.17 | 33 | ⊕⊕⊝⊝ | ||
| 545 per 1000 | 93 per 1000 | |||||
| Sedation duration (minutes) | The mean duration of sedation or sleep was 76 minutes (oral midazolam). | The mean duration of sedation or sleep in the intervention group was 19 minutes longer (3.4 minutes shorter to 41.4 minutes longer). | ‐ | 33 | ⊕⊕⊝⊝ | |
| EEG sedative‐induced artefact | Study population | RR 0.58 | 198 | ⊕⊕⊕⊕ | ||
| 700 per 1000 | 406 per 1000 (308 to 532) | |||||
| Number of children with clinical adverse events (any) | Study population | RR 0.20 | 198 | ⊕⊕⊝⊝ | ||
| 20 per 1000 | 4 per 1000 | |||||
| *The risk in the intervention group (and its 95% confidence interval) is based on the assumed risk in the comparison group and the relative effect of the intervention (and its 95% CI). | ||||||
| GRADE Working Group grades of evidence | ||||||
| 1The 95% CI for this estimate is wide although both ends are on the same direction of effect. Quality of evidence downgraded one level due to imprecision. | ||||||
| Chloral hydrate orally (50 mg/kg) compared to melatonin orally as sedating agents for neurodiagnostic procedures in children | ||||||
| Patient or population: children undergoing neurodiagnostic procedures | ||||||
| Outcomes | Anticipated absolute effects* (95% CI) | Relative effect | № of participants | Quality of the evidence | Comments | |
| Risk with melatonin | Risk with chloral hydrate | |||||
| Proportion of children who successfully completed neurodiagnostic procedure without interruption by the child awakening | ‐ | ‐ | ‐ | ‐ | ‐ | No study for this comparison assessed this outcome. |
| Proportion of children who required a further dose of either the same sedative agent or the addition of a different sedative agent | ‐ | ‐ | ‐ | ‐ | ‐ | No study for this comparison assessed this outcome. |
| Time to adequate sedation (minutes or as measured by specific validated scales such as the Ramsay Sedation Score) | ‐ | ‐ | ‐ | ‐ | ‐ | No study for this comparison assessed this outcome. |
| Proportion of children who had sedation failure or inadequate level of sedation | ‐ | ‐ | ‐ | ‐ | ‐ | No study for this comparison assessed this outcome. |
| EEG sedative‐induced artefact | Study population | RR 0.33 | 348 | ⊕⊕⊝⊝ | ||
| 103 per 1000 | 34 per 1000 | |||||
| Number of children with clinical adverse events (any) | Study population | RR 1.00 | 348 | ⊕⊕⊝⊝ | ||
| 23 per 1000 | 23 per 1000 | |||||
| *The risk in the intervention group (and its 95% confidence interval) is based on the assumed risk in the comparison group and the relative effect of the intervention (and its 95% CI). | ||||||
| GRADE Working Group grades of evidence | ||||||
| 1The single included study was judged to be at unclear risk of bias for random sequence generation, allocation concealment, and blinding of outcome assessors and high risk of bias for blinding of participants and personnel. Quality of evidence downgraded one level due to risk of bias. | ||||||
| Chloral hydrate orally (50 mg/kg + 50 mg/kg) compared to hydroxyzine hydrochloride orally (1 mg/kg + 1 mg/kg) as sedating agents for neurodiagnostic procedures in children | ||||||
| Patient or population: children undergoing neurodiagnostic procedures | ||||||
| Outcomes | Anticipated absolute effects* (95% CI) | Relative effect | № of participants | Quality of the evidence | Comments | |
| Risk with hydroxyzine hydrochloride | Risk with chloral hydrate | |||||
| Proportion of children who successfully completed neurodiagnostic procedure without interruption by the child awakening | ‐ | ‐ | ‐ | ‐ | ‐ | No study for this comparison assessed this outcome. |
| Proportion of children who required a further dose of either the same sedative agent or the addition of a different sedative agent | ‐ | ‐ | ‐ | ‐ | ‐ | No study for this comparison assessed this outcome. |
| TIme to adequate sedation (minutes or as measured by specific validated scales such as the Ramsay Sedation Score) | The time onset to adequate sedation was 23.7 minutes. | The mean time to adequate sedation in the intervention group was 7.5 minutes shorter (7.85 to 7.15 minutes shorter) | ‐ | 282 | ⊕⊕⊕⊝ | |
| Proportion of children who had sedation failure or inadequate level of sedation | Study population | RR 0.33 | 282 | ⊕⊕⊝⊝ | ||
| 85 per 1000 | 28 per 1000 | |||||
| Sedation duration (minutes) | The mean duration of sedation or sleep was 85.1 minutes. | The mean duration of sedation or sleep in the intervention group was 3.1 minutes longer (2.23 to 3.97 minutes longer) | ‐ | 282 | ⊕⊕⊕⊝ | |
| Number of children with clinical adverse event: behavioural change | Study population | RR 1.17 | 282 | ⊕⊕⊝⊝ | ||
| 43 per 1000 | 50 per 1000 | |||||
| Number of children with clinical adverse event: nausea or vomiting | Study population | RR 1.25 | 282 | ⊕⊕⊝⊝ | ||
| 28 per 1000 | 35 per 1000 | |||||
| *The risk in the intervention group (and its 95% confidence interval) is based on the assumed risk in the comparison group and the relative effect of the intervention (and its 95% CI). | ||||||
| GRADE Working Group grades of evidence | ||||||
| 1The single included study was judged to be at unclear risk of bias for random sequence generation, allocation concealment, blinding of participants and personnel, and blinding of outcome assessors. Quality of evidence downgraded one level due to risk of bias. | ||||||
| Chloral hydrate orally (70 mg/kg) compared to promethazine orally (1 mg/kg) as sedating agents for neurodiagnostic procedures in children | ||||||
| Patient or population: children undergoing neurodiagnostic procedures | ||||||
| Outcomes | Anticipated absolute effects* (95% CI) | Relative effect | № of participants | Quality of the evidence | Comments | |
| Risk with promethazine | Risk with chloral hydrate | |||||
| Proportion of children who successfully completed neurodiagnostic procedure without interruption by the child awakening | ‐ | ‐ | ‐ | ‐ | ‐ | No study for this comparison assessed this outcome. |
| Proportion of children who required a further dose of either the same sedative agent or the addition of a different sedative agent | ‐ | ‐ | ‐ | ‐ | ‐ | No study for this comparison assessed this outcome. |
| Time to adequate sedation (minutes or as measured by specific validated scales such as the Ramsay Sedation Score) | The mean time to adequate sedation was 33.84 minutes. | The mean time to adequate sedation in the intervention group was 12.11 minutes shorter (18.48 to 5.74 minutes shorter). | ‐ | 60 | ⊕⊕⊕⊝ | |
| Proportion of children with inadequate level of sedation (Ramsay score below 4) | Study population | RR 0.03 | 60 | ⊕⊕⊝⊝ | ||
| 567 per 1000 | 17 per 1000 | |||||
| Proportion of children who had sedation failure or inadequate level of sedation | Study population | RR 0.11 | 60 | ⊕⊕⊕⊝ | ||
| 300 per 1000 | 33 per 1000 | |||||
| Number of children with clinical adverse event: behavioural change | Study population | RR 0.20 | 60 | ⊕⊕⊕⊝ | ||
| 67 per 1000 | 13 per 1000 | |||||
| Number of children with clinical adverse event: vomiting or nausea | Study population | RR 13.00 | 60 | ⊕⊕⊝⊝ | ||
| 0 per 1000 | 0 per 1000 | |||||
| *The risk in the intervention group (and its 95% confidence interval) is based on the assumed risk in the comparison group and the relative effect of the intervention (and its 95% CI). | ||||||
| GRADE Working Group grades of evidence | ||||||
| 1The 95% CI for this estimate is wide but falls on the same direction of effect. Quality of evidence downgraded one level due to imprecision. | ||||||
| Chloral hydrate oral (60 mg/kg) compared to music therapy as sedating agents for neurodiagnostic procedures in children | ||||||
| Patient or population: children undergoing neurodiagnostic procedures | ||||||
| Outcomes | Anticipated absolute effects* (95% CI) | Relative effect | № of participants | Quality of the evidence | Comments | |
| Risk with music therapy | Risk with chloral hydrate | |||||
| Proportion of children who successfully completed neurodiagnostic procedure without interruption by the child awakening | ‐ | ‐ | ‐ | ‐ | ‐ | No study for this comparison assessed this outcome. |
| Proportion of children who required a further dose of either the same sedative agent or the addition of a different sedative agent | ‐ | ‐ | ‐ | ‐ | ‐ | No study for this comparison assessed this outcome. |
| Time to adequate sedation (minutes or as measured by specific validated scales such as the Ramsay Sedation Score) | The mean EEG time onset for adequate sedation was 23 minutes. | The mean EEG time onset for adequate sedation in the intervention group was 9 minutes more (2.15 fewer to 20.15 more). | ‐ | 58 | ⊕⊝⊝⊝ | |
| Proportion of children who had sedation failure or inadequate level of sedation | Study population | RR 17.00 | 58 | ⊕⊝⊝⊝ | ||
| 29 per 1000 | 500 per 1000 | |||||
| Sedation duration (minutes) | The mean EEG sedation/sleep duration was 66 minutes. | The mean EEG sedation/sleep duration in the intervention group was 160 minutes more (121.07 more to 198.93 more). | ‐ | 58 | ⊕⊝⊝⊝ | |
| Number of children with clinical adverse events (any) | ‐ | ‐ | ‐ | ‐ | ‐ | No study for this comparison assessed this outcome. |
| *The risk in the intervention group (and its 95% confidence interval) is based on the assumed risk in the comparison group and the relative effect of the intervention (and its 95% CI). | ||||||
| GRADE Working Group grades of evidence | ||||||
| 1Very serious concerns regarding the trial methodology led to a judgement of high risk of bias for selection bias (using alternation rather than true randomisation), performance and detection biases (non‐blinding of participants and care personnel as well as outcome assessors), and selective outcome reporting. Quality of evidence downgraded two levels due to risk of bias. | ||||||
Background
Description of the condition
Paediatric neurodevelopmental disorders are collectively a common problem that affect between 5% and 10% of all children (Horridge 2011; Shevell 2003; Shevell 2008). A structured clinical evaluation together with targeted neurodiagnostic investigations of children with possible neurodevelopmental disorders is important to establish the aetiology of the disorder, predict the prognosis, and develop management strategies (Horridge 2011; Shevell 2003; Shevell 2008; Silove 2013).
Paediatric neurodiagnostic (non‐interventional) investigations used in the assessment of children with possible neurodevelopmental disorders include brain neuroimaging and electroencephalography (EEG). Successful completion of neurodiagnostic procedures is challenging in the paediatric age group, as the child is required to be immobile during the procedure. In addition, routine paediatric EEG recording requires recording of a period of sleep. Sleep state EEG recording is important as it increases the yield in detecting interictal epileptiform abnormalities. Achieving spontaneous sleep is not possible in some children despite behavioural intervention (prior sleep deprivation). The use of an appropriate sedative agent in children who are unable to be immobile or do not naturally sleep (for EEG recording), or both, thus plays a pivotal role in ensuring successful completion of the procedure.
Selection of the most appropriate pharmacological and non‐pharmacological agents is an important factor for the success and safety of the neurodiagnostic procedure. Moreover, there are other pharmacological considerations when choosing a sedative agent for paediatric EEG because some sedative agents can suppress abnormal EEG activity or background activity (e.g. anaesthesia), and others can induce background activity changes that may obscure abnormalities (e.g. benzodiazepines and barbiturates).
Children with neurodevelopmental disorders can present with a variety of symptoms including epilepsy, developmental impairment, developmental regression, social communication deficits, and behavioural difficulties. These children will require a structured clinical evaluation with targeted investigations to enable an accurate diagnosis, provide appropriate intervention, and assist in predicting long‐term prognosis.
Neurodiagnostic investigations include EEG and brain neuroimaging. The duration of a standard awake and sleep paediatric EEG recording is approximately 30 to 60 minutes; a routine paediatric brain magnetic resonance imaging (MRI) scan takes approximately 45 to 60 minutes. Routine EEG is an important investigation tool in evaluating children with a clinical history that suggests epilepsy (NICE 2012). The EEG will assist in defining the specific epilepsy syndrome (Pillai 2006). Neuroimaging investigations (particularly brain MRI) are useful in detecting major or minor structural brain abnormalities that may assist in establishing the cause of the child's neurodevelopmental disorder (Battaglia 2003; Rodriguez 2007). Current guidelines advocate that neuroimaging investigations should be considered in those children with an abnormal antenatal or perinatal history, an abnormal neurological examination, a history of focal epilepsy, and in all epilepsies in children under two years of age (Battaglia 2003; NICE 2012; Rodriguez 2007).
Description of the intervention
Sedation is defined as a drug‐induced depression of consciousness, which is a continuum from wakefulness to anaesthesia (Starkey 2011). It assists in reducing anxiety, providing pain control, and minimising movement of the patient when undergoing a procedure. There are different levels of sedation, as defined by the American Society of Anesthesiologists. These include minimal sedation, moderation sedation, and deep sedation (ASA 2007). Moderate sedation involves the technique of administering sedatives to induce a state of depressed level of consciousness while allowing the patient to maintain independent control of their airway and oxygenation by preserving their protective airway reflexes (NICE 2010). Current guidelines recommend that moderate sedation is preferred over deep sedation and general anaesthesia for painless paediatric procedures (NICE 2010).
The ideal sedative agent to achieve moderate sedation should have rapid onset, a moderate duration of action, minimal or no adverse effects, and low cost. At present there is no ideal or first‐line sedative agent. The agents currently available for painless procedures include the following.
-
Chloral hydrate, a non‐opiate and non‐benzodiazepine sedative hypnotic drug.
-
Benzodiazepines, which act via the γ‐aminobutyric acid A receptors.
-
Hydroxyzine, a long‐acting first‐generation H1 antagonist with central nervous system depressant activity and minimal circulatory and depressant activity.
-
Melatonin, a pineal hormone and natural sleep agent that can modulate the circadian rhythm of sleep through action on the suprachiasmatic nucleus in the hypothalamus.
-
Promethazine, an antiemetic and antisialagogue with sedative properties.
-
Dexmedetomidine, a selective alpha2‐adrenoceptor agonist with sedative properties.
In addition, non‐pharmacological approaches such as music therapy have been shown to be beneficial in providing sedation during procedures in adult patients (Bechtold 2009), while there is some evidence that breastfeeding or breast milk helps infants tolerate painful or uncomfortable procedures better by reducing crying and improving infants' physiological responses during the procedures (Shah 2012).
How the intervention might work
Chloral hydrate is a central nervous system depressant and is one of the oldest sedatives (discovered in 1832). It is well absorbed orally as well as rectally and rapidly metabolised into the active metabolite trichloroethanol, which is responsible for its hypnotic and sedative effects. It is one of the most frequently used conscious sedative agents for children undergoing neurodiagnostic procedures including neuroimaging and EEG recording, as it has a good safety profile when used at sedative doses, with little effect on EEG background activity (Malviya 1997). Doses vary from 55 to 100 mg/kg in neonates and children younger than 12 years old, with a maximum dose of 2g (Starkey 2011). Chloral hydrate is absorbed from the gastrointestinal tract and starts to exert its effect within 60 minutes. Adverse reactions occur in 1.7% to 20% of children, with gastrointestinal side effects, particularly vomiting, being the most common (Starkey 2011). There have also been some concerns with regard to respiratory depression, long duration of action, and potential carcinogenicity (Haselkorn 2006; Kao 1999).
Why it is important to do this review
Neurodiagnostic procedures (particularly neuroimaging) in children are important investigative tools and have been increasingly used over the last decade to assess and manage children with neurodevelopmental disorders. However, a significant proportion of children may be unable to complete the procedure due to sedation failure. Sedation failure is a great inconvenience to the child and their family and requires rescheduling of another hospital admission to complete the procedure, often under general anaesthesia (which carries additional associated risks).
Both the National Institute for Health and Care Excellence (NICE) 2010 guideline and the American College of Emergency Physicians 2008 guideline recommend chloral hydrate for moderate sedation during painless procedures in the paediatric population (Mace 2008; NICE 2010). However, neither guideline has suggested the superiority of chloral hydrate over other agents. Some studies have shown that chloral hydrate is unsuccessful in a significant proportion of children, resulting in failure to complete the procedure (Beebe 2000; Malviya 1997). There have been a few randomised controlled trials (RCTs) comparing the efficacy of chloral hydrate with other sedative agents and complementary therapy (e.g. music therapy). However, to date no meta‐analysis of the previously published RCTs has been performed in order to determine superiority among these agents.
The aim of this review was to allow clinicians to take an evidence‐based approach in deciding which sedating agent is best for children undergoing neurodiagnostic procedures. The care of children would improve if both sedation failure rates and adverse effects due to sedation were kept to a minimum.
Objectives
To assess the effectiveness and adverse effects of chloral hydrate as a sedative agent for non‐invasive neurodiagnostic procedures in children.
Methods
Criteria for considering studies for this review
Types of studies
We included randomised or quasi‐randomised trials.
Types of participants
Children (from birth to 18 years old) who underwent non‐invasive neurodiagnostic procedures (including brain neuroimaging and sleep EEG) who required sedation before the procedure.
Types of interventions
Oral or rectal chloral hydrate.
Comparison: other sedative/sleep‐inducing agents (e.g. promethazine, hydroxyzine, melatonin, midazolam, pentobarbital, etomidate, sevoflurane) or complementary therapies (e.g. music therapy), or achieved sleep without a sedative agent, for instance after a milk feed.
Types of outcome measures
Primary outcomes
-
Proportion of children who successfully completed neurodiagnostic procedure without interruption by the child awakening.
-
Proportion of children who required a further dose of either the same sedative agent or the addition of a different sedative agent.
-
Time to adequate sedation (minutes or as measured by specific validated scales such as the Ramsay Sedation Score).
Secondary outcomes
-
Proportion of children who had sedation failure or inadequate level of sedation.
-
Sedation duration
-
Sleep onset latency (time interval for child to fall asleep) pre‐procedure.
-
Yield of EEG findings (expressed either as the rate of abnormal EEG findings or additional EEG artefact findings attributable to the sedative agent, which may prevent interpretation of the EEG) or yield of neuroimaging findings (expressed as the rate of non‐interpretable MRI attributable to motion artefact due to inadequate sedation).
-
Number of children with clinical adverse effects and severe drug side effects (e.g. hypotension, hypoxia, apnoea, laryngospasm, significant vomiting, refractory agitation, bradycardia).
Search methods for identification of studies
Electronic searches
We searched the following databases:
-
Cochrane Epilepsy Group Specialized Register (via Cochrane Central Register of Controlled Trials, searched on 19 July 2017)
-
Cochrane Central Register of Controlled Trials (CENTRAL) (Issue 7, 2017);
-
MEDLINE (PubMed (National Library of Medicine)) (1950 to 19 July 2017);
-
Embase (1980 to 19 July 2017).
We outlined detailed search strategies for the above databases in Appendix 1, Appendix 2, and Appendix 3.
We also searched for ongoing clinical trials and unpublished studies via the following sites:
-
ClinicalTrials.gov (www.clinicaltrials.gov);
-
World Health Organization (WHO) International Clinical Trials Registry Platform (ICTRP) (www.who.int/ictrp/en/).
We did not apply any language restrictions in our searches.
Searching other resources
We searched references cited in relevant studies, Cochrane Reviews, guidelines, review articles, and conference proceedings, including abstracts from the Society for Pediatric Anesthesia and the European Society for Paediatric Anaesthesiology. We also contacted experts in the field if necessary to identify further relevant studies.
Data collection and analysis
Selection of studies
Two review authors (CYF, CGT) independently performed the first round of searching for relevant studies. They then screened the identified studies for inclusion in the analysis with the help of an arbiter (LCO), using the predefined inclusion and exclusion criteria.
We collected information on study design and setting, participant characteristics (including age and the presence of additional co‐ morbidities such as cerebral palsy), study eligibility criteria, details of the intervention(s) given, and the outcomes assessed. We also collected study funding source and any conflicts of interest stated by the investigators.
We accepted published and unpublished studies, both in full article and abstract form, as long as adequate extraction of outcome data was possible. We contacted the authors of unpublished studies and studies available only as abstracts to request further information about the studies, including specific details of the methodologies employed as well as the full outcome data, so as to include them in our meta‐analysis. We only included final data from each study and not data from interim analyses.
Data extraction and management
Two review authors (CYF, CGT) independently extracted relevant data from each included study using a data collection form adapted for this review. We gathered the following information from each study.
-
Study design (RCT, quasi‐RCT, or cluster‐RCT, and the number of arms evaluated)
-
'Risk of bias' items, including the methods used and our 'Risk of bias' judgement (low risk, unclear risk, or high risk)
-
Random sequence generation
-
Allocation concealment
-
Blinding of participants, care personnel, and evaluators
-
Missing data (loss to follow‐up)
-
Risk of selective outcome reporting
-
Other possible sources of bias
-
-
Stratification factors
-
Participant factors
-
Number (total per group)
-
Setting
-
Diagnostic criteria
-
Country
-
Age
-
Sex
-
Underlying diagnoses
-
Indications for neurodiagnostic procedure: whether for diagnostic or monitoring purposes
-
-
Intervention data: route of administration, dosage, and duration of chloral hydrate and comparator medication, and whether chloral hydrate was administered alone or in combination with another medication
-
Follow‐up data
-
Duration of follow‐up period
-
Numbers lost to follow‐up
-
Reasons for loss to follow‐up
-
-
Outcome data, grouped into dichotomous and continuous outcomes, including adverse events
For details of each outcome included in our review (names, definitions, and possible unit of measurement), please refer to Types of outcome measures.
We screened for multiple enrolment by matching the initial number of participants recruited against the total numbers at each step in the study. We contacted the authors of the study for additional information if we were unclear as to important aspects of the trial. Any disagreements were resolved by discussion, leading to a consensus, or by involving an arbiter (LCO) if necessary.
Assessment of risk of bias in included studies
Two authors (CGT, NML) independently assessed risk of bias for each of the included studies and cross‐checked the results of these assessments. A third review author (CYF) discussed and resolved any inconsistencies.
In accordance with Cochrane's tool for assessing risk of bias in RCTs (Higgins 2011), we assessed the following 'Risk of bias' domains:
-
sequence generation;
-
allocation concealment;
-
blinding;
-
incomplete data/attrition bias;
-
selective outcome reporting;
-
other.
Measures of treatment effect
We reported the outcome estimates for categorical data using risk ratios (RRs), risk differences (RDs), and the number needed to treat for an additional beneficial outcome (NNTB) or the number needed to treat for an additional harmful outcome (NNTH). For continuous data, which included time to adequate sedation and duration of sedation, we used mean differences (MDs) with their respective 95% confidence intervals (CIs). If pooled analyses were not possible for reasons such as major discrepancies in study characteristics or outcome reporting as detailed under Assessment of heterogeneity, we reported the results of the studies narratively.
Unit of analysis issues
No cluster‐RCTs were included in this review. Had we included cluster‐RCTs, we would have adopted the following strategy when dealing with such studies.
For cluster‐RCTs (e.g. trials in which the assignment to the intervention or control group was made at the level of the unit or hospital ward), we would have assessed whether adjustment had been made for the effects of clustering in order to account for non‐independence among the participants in a cluster via the use of an appropriate analysis model, such as the generalised estimating equation (GEE) model. If the unit of analysis was not stated in the study, we would have inspected the width of the standard error (SE) or 95% CI of the estimated treatment effects. Had we found an inappropriately small SE or a narrow 95% CI, we would have asked the authors of the study to provide information on the unit of analysis.
If no adjustment was made for the effects of clustering, we would have performed adjustment by multiplying the SEs of the final effect estimates by the square root of the 'design effect', represented by the formula '1 + (M ‐ 1) x ICC', where M is the average cluster size (number of children per cluster) and ICC is the intracluster correlation. We would determine the average cluster size (M) from each trial by dividing the total number of children by the total number of clusters. We would use a relatively large assumed ICC of 0.10, as we considered this to be a realistic estimate based on previous studies about implementation research (Campbell 2001). We would combine the adjusted final effect estimates from each trial with their SEs in meta‐analysis using generic inverse‐variance methods, as stated in the Cochrane Handbook for Systematic Reviews of Interventions (Higgins 2011).
If determination of the unit of analysis was not possible, we would have included the studies concerned in a meta‐analysis using whatever effect estimates were provided by the authors. We would then perform a sensitivity analysis to assess how the overall results were affected by the inclusion of these studies.
For multiple‐arm studies, we would adjust the data by following the methods stated in Chapter 16 of the Cochrane Handbook for Systematic Reviews of Interventions (Higgins 2011). Specifically, if only two arms were relevant, we would only include the relevant arms. If there were more than two relevant arms (e.g. chloral hydrate of two different dosages versus placebo), we would set up separate pair‐wise comparisons, for example higher‐dose chloral hydrate versus placebo (Comparison 1) and lower‐dose chloral hydrate versus placebo (Comparison 2). In such cases, we would not total the number of children in the placebo group to avoid double‐counting.
Dealing with missing data
We determined the dropout rates from each study. We also assessed whether the authors analysed their data according to the intention‐to‐treat principle by comparing the number of children initially randomised and the total number analysed. We considered an absolute dropout rate of 20% or higher as important. We also adopted a 'worst‐case scenario' approach in judging the dropout rate: if we found that the direction of the effect estimate changed with the worst‐case scenario approach, we considered the dropout rate as significant.
If we found a significant dropout rate with no reasonable explanation, we classified the study as having a high risk of attrition bias for the domain incomplete outcome data. If we considered the missing data to be critical to the final estimates in our meta‐analysis, we contacted the authors of the individual studies to request further data.
We planned to perform sensitivity analyses to assess how the overall results were affected by the inclusion of studies with a high risk of attrition bias from incomplete outcome data.
Assessment of heterogeneity
We assessed clinical heterogeneity by comparing the distribution of important participant factors between trials (age, gender, seizure type, duration of epilepsy) and trial factors (clinical setting of the studies, the use of co‐interventions, 'Risk of bias' items including random sequence generation, allocation concealment, blinding, and losses to follow‐up).
For statistical heterogeneity, we first visually inspected the forest plots to see if there was any gross inconsistency in the trial results. We used the I2 statistic to quantify the extent and importance of inconsistency in the results (Higgins 2011). We used the following cutoffs for the reporting of heterogeneity.
-
0% to 40%: heterogeneity might not be important
-
30% to 60%: may represent moderate heterogeneity
-
50% to 90%: may represent substantial heterogeneity
-
75% to 100%: considerable heterogeneity
If we found moderate, substantial, or considerable heterogeneity, we re‐examined the clinical and methodological characteristics of the studies, using the criteria listed above, to determine whether the degree of heterogeneity could be explained by differences in those characteristics, and whether a pooled analysis would be appropriate. If we considered a pooled analysis appropriate, we then performed this analysis using a random‐effects model.
Assessment of reporting biases
Had there been more than 10 studies available for an outcome to enable a meaningful assessment, we would have used a funnel plot to screen for publication bias. If we detected significant asymmetry in the funnel plot, which is suggestive of the possibility of publication bias, we would have further assessed it using Begg's rank correlation and Egger's test and would have included a statement in the Results with a corresponding note of caution in the Discussion.
Data synthesis
We performed meta‐analyses using Review Manager 5 software with a fixed‐effect model (RevMan 5.3), unless there was moderate or high heterogeneity, in which case we used the random‐effects model alongside an exploration of possible causes of heterogeneity, as described in the Assessment of heterogeneity section. Our primary data analyses followed the intention‐to‐treat principle; namely, we used the original number of participants allocated to each study arm as the denominator in subsequent analyses. We expressed our results as RRs, RDs, NNTB, NNTH, and MDs with their respective 95% CIs, as detailed in the Measures of treatment effect section.
Quality of evidence
We used the GRADE approach, as outlined in the GRADE Handbook (Schünemann 2013), to assess the quality of evidence for the most important outcomes across all comparisons, as listed below, whether or not there were data for the outcome.
Prespecified primary outcomes
-
Proportion of children who successfully completed neurodiagnostic procedure without interruption by the child awakening.
-
Proportion of children who required a further dose of either the same sedative agent or the addition of a different sedative agent.
-
Time to adequate sedation (minutes or as measured by specific validated scales such as the Ramsay Sedation Score).
Prespecified secondary outcomes
-
Proportion of children who had sedation failure or inadequate level of sedation.
-
Sedation duration (minutes).
-
Yield of EEG findings, including non‐interpretable EEG or sedative‐induced artefact.
-
Number of children with clinical adverse events (any).
Two review authors independently assessed the quality of the evidence for each of the outcomes listed above. We considered evidence from RCTs as high quality, but downgraded the evidence one level for serious (or two levels for very serious) limitations based upon the following: design (risk of bias), consistency across studies, directness of the evidence, precision of estimates, and presence of publication bias (Guyatt 2008; Schünemann 2013). We used the GRADEpro GDT platform (Gradepro GDT 2015) to create ‘Summary of findings’ tables to report the quality of the evidence.
The GRADE approach results in an assessment of the quality of a body of evidence in one of four grades:
-
High: we are very confident that the true effect lies close to that of the estimate of the effect.
-
Moderate: we are moderately confident in the effect estimate: the true effect is likely to be close to the estimate of the effect, but there is a possibility that it is substantially different.
-
Low: our confidence in the effect estimate is limited: the true effect may be substantially different from the estimate of the effect.
-
Very low: we have very little confidence in the effect estimate: the true effect is likely to be substantially different from the estimate of the effect.
Subgroup analysis and investigation of heterogeneity
We planned to conduct the following subgroup analyses if relevant data were available.
-
Different neurodiagnostic procedures (e.g. brain MRI versus brain computed tomography (CT) versus EEG).
-
Age group of children (e.g. neonates versus older children).
Sensitivity analysis
We planned to perform sensitivity analyses for the primary outcomes and any secondary outcomes for which sufficient numbers of studies were available by evaluating the change in the effect estimates following the exclusion of studies with a high risk of:
-
selection bias (high risk for random sequence generation or allocation concealment, or both);
-
attrition bias (high risk for incomplete outcome data).
Results
Description of studies
Results of the search
We identified 279 records from our search of CENTRAL, MEDLINE and Embase. We identified a further 17 records that appeared to be relevant from our search of ClinicalTrials.gov and the WHO ICTRP. After removing duplicates, 218 records remained, of which 60 articles appeared to be relevant after we inspected the titles. We evaluated the abstracts or full text of the articles, or both, and excluded 45 of the 60 articles. Of the remaining 15 articles, we excluded one, as it was a duplicate publication of an included study, and another article for which we have requested additional information from the authors is awaiting further assessment of its eligibility. We included a total of 13 articles in the review. The flow diagram of the studies from the initial search to the meta‐analysis is shown in Figure 1. Descriptions of all the included studies are provided in the Characteristics of included studies table, and the excluded studies with the reasons for exclusion are given in the Characteristics of excluded studies table.

Study flow diagram.
Included studies
We included 13 RCTs that were conducted in six countries, including Iran (4 studies), Turkey (3 studies), USA (3 studies), and Israel, Chile, and Spain (1 study each). All 13 trials were single‐centre RCTs. The number of children recruited ranged from 40, in D'Agostino 2000, to 582, in Thompson 1982. All studies were conducted on paediatric patients (age up to 18 years old). All studies included children of both sexes.
Five of these trials were sedation trials conducted on neuroimaging studies (2 studies on brain CT, 2 studies on brain MRI, 1 study on brain MRI or CT) (D'Agostino 2000; Fallah 2013; Malviya 2004; Marti‐Bonmati 1995; Thompson 1982); the remaining eight were sedation trials conducted on EEG studies (Ashrafi 2010; Ashrafi 2013; Bektas 2014; Gumus 2015; Loewy 2005; Lopez 1995; Razieh 2013; Sezer 2013).
There were 10 comparisons:
-
oral chloral hydrate (50 mg/kg or 100 mg/kg) versus oral dexmedetomidine (Gumus 2015);
-
oral chloral hydrate (75 mg/kg) versus intravenous pentobarbital (Malviya 2004);
-
oral chloral hydrate (75 mg/kg or 100 mg/kg) versus midazolam (given either orally or intranasally) (Ashrafi 2013; D'Agostino 2000; Fallah 2013);
-
oral chloral hydrate (50 mg/kg) versus oral melatonin (Ashrafi 2010);
-
oral chloral hydrate (60 mg/kg) versus music therapy (Loewy 2005);
-
oral chloral hydrate (50 mg/kg) versus oral hydroxyzine hydrochloride (Sezer 2013);
-
oral chloral hydrate (70 mg/kg) versus oral promethazine (Razieh 2013);
-
rectal chloral hydrate (50 mg/kg) versus rectal midazolam (Lopez 1995);
-
high‐dose oral chloral hydrate (100 mg/kg) versus low‐dose oral chloral hydrate (70 mg/kg) (Marti‐Bonmati 1995);
-
high‐dose oral chloral hydrate (100 mg/kg) versus low‐dose oral chloral hydrate (50 mg/kg) (Gumus 2015).
The initial sedation dose of chloral hydrate used in the studies ranged from 25 mg/kg to 100 mg/kg oral and 50 mg/kg rectal. The type and doses of the sedation agents used varied among the included studies: oral dexmedetomidine 2 or 3 mg/kg (Gumus 2015); intravenous pentobarbital 5 mg/kg (Malviya 2004); midazolam either 0.5 mg/kg orally (Ashrafi 2013; D'Agostino 2000), 0.2 mg/kg intranasally (Fallah 2013), or rectal midazolam 1 mg/kg (Lopez 1995); oral hydroxyzine hydrochloride 1 mg/kg (Bektas 2014; Sezer 2013); oral promethazine 1 mg/kg (Razieh 2013); and intramuscular atropine/meperidine/promethazine/secobarbital (AMPS) cocktail 0.08 mL/kg (Thompson 1982). Two studies compared sedation of high‐dose (100 mg/kg) chloral hydrate versus low‐dose (50 mg/kg or 70 mg/kg) chloral hydrate orally (Gumus 2015; Marti‐Bonmati 1995). No dose of melatonin was stated (Ashrafi 2010), and dosing/intensity was not stated for music therapy (Loewy 2005).
In general, the included studies assessed outcomes of success of sedation based on the following.
-
Time to onset to adequate sedation in minutes in eight studies (Fallah 2013; Gumus 2015; Loewy 2005; Lopez 1995; Malviya 2004; Marti‐Bonmati 1995; Razieh 2013; Sezer 2013).
-
Failure of sedation preventing successful completion of neurodiagnostic investigation in eight studies (D'Agostino 2000; Fallah 2013; Gumus 2015; Loewy 2005; Malviya 2004; Marti‐Bonmati 1995; Razieh 2013; Sezer 2013).
-
Total sedation/sleep duration in six studies (D'Agostino 2000; Gumus 2015; Loewy 2005; Lopez 1995; Marti‐Bonmati 1995; Sezer 2013).
-
Sedative adverse events in nine studies (Ashrafi 2010; Ashrafi 2013; D'Agostino 2000; Fallah 2013; Gumus 2015; Malviya 2004; Marti‐Bonmati 1995; Razieh 2013; Sezer 2013).
-
Uninterpretable neurodiagnostic investigation due to either excessive motion artefact for neuroimaging studies or excessive fast background activity on EEG studies in five studies (Ashrafi 2010; Ashrafi 2013; Lopez 1995; Malviya 2004; Sezer 2013).
Other outcomes assessed included caregiver's satisfaction scale (Razieh 2013), hospital stay post‐sedation (Razieh 2013), and return to normal baseline activity (Malviya 2004).
Excluded studies
We excluded a total of 45 studies based on one or more of the following.
-
Study design or article type (33 studies): the studies were either retrospective or prospective cohort studies, cross‐over study, prospective non‐randomised intervention studies, literature review articles, a questionnaire study, studies with research questions or outcomes that did not match our review, or commentaries.
-
Population (5 studies): the participants in the studies were either children undergoing dental procedures, auditory brainstem response tests, or ophthalmic examination.
-
Intervention (18 studies): the studies either assessed efficacy of chloral hydrate alone or in combination with other sedative agents or efficacy of other sedative agents that were not the intervention of our interest.
-
Outcome (2 studies): the studies reported effects of sedation on EEG results and did not assess the success of sedation.
A description of each study is provided in the Characteristics of excluded studies table.
Risk of bias in included studies
Risk of bias in the included studies varied widely. There was at least one high‐risk domain in eight out of the 13 included studies (Ashrafi 2010; Ashrafi 2013; Bektas 2014; Gumus 2015; Loewy 2005; Lopez 1995; Malviya 2004; Thompson 1982). We judged all of these eight studies to be at high risk for blinding of participants, except Bektas 2014, which we judged to be at unclear risk. Three studies were at low risk in all domains (Fallah 2013; Lopez 1995; Marti‐Bonmati 1995). The proportions of included studies at low, high, and unclear risk of bias in each domain is illustrated in Figure 2; the 'Risk of bias' judgement of each included study in each domain is depicted in Figure 3. We have also provided a detailed description of the risk of bias of each study in the Characteristics of included studies table. Our 'Risk of bias' assessments under each domain are summarised below.

Risk of bias graph: review authors' judgements about each risk of bias item presented as percentages across all included studies.

Risk of bias summary: review authors' judgements about each risk of bias item for each included study.
Allocation
For random sequence generation, we judged seven of the 13 included studies to have low risk of bias (D'Agostino 2000; Fallah 2013; Gumus 2015; Lopez 1995; Malviya 2004; Marti‐Bonmati 1995; Razieh 2013). For allocation concealment, four studies had low risk of bias (D'Agostino 2000; Lopez 1995; Marti‐Bonmati 1995; Razieh 2013). In these studies, the authors clearly stated the method of sequence generation, which involved some form of random number scheme using either computers, random number table, or the toss of a coin. There were also clear statements in the methods that reassured the readers of the independence between sequence generation and allocation. We judged two studies to be at high risk of bias for sequence generation as well as allocation concealment (Loewy 2005; Thompson 1982), as children were allocated following a predictable sequence based on the day of the week they were admitted or via alternating and rotational assignments. Four of the 13 included studies had unclear risk of bias in one or both domains due to insufficient information provided in the articles (Ashrafi 2010; Ashrafi 2013; Bektas 2014; Sezer 2013).
Blinding
For blinding of participants, we judged seven studies to have high risk of bias (Ashrafi 2010; Ashrafi 2013; Bektas 2014; Gumus 2015; Loewy 2005; Malviya 2004; Thompson 1982). In three studies (D'Agostino 2000; Fallah 2013; Marti‐Bonmati 1995), it was stated clearly that blinding of participants was achieved, while in the other three studies (Lopez 1995; Razieh 2013; Sezer 2013), no statements were made regarding the blinding status of the participants. We considered blinding for these three studies to be unlikely because they compared chloral hydrate with another solution of a different appearance/preparation and taste.
Seven studies did not report blinding of outcome assessors (Ashrafi 2010; Ashrafi 2013; Bektas 2014; Gumus 2015; Malviya 2004; Sezer 2013; Thompson 1982), and we judged one study to be at high risk of bias, as the modality of sedation intervention given in this study (oral chloral hydrate versus music therapy via music therapist) was clearly different, making blinding of the outcome assessors not possible (Loewy 2005). In the remaining five studies (D'Agostino 2000; Fallah 2013; Lopez 1995; Marti‐Bonmati 1995; Razieh 2013), it was clearly stated that the outcome assessors were blinded.
Incomplete outcome data
In all studies except two (Lopez 1995; Thompson 1982), all children enrolled appeared to be included in the analysis. Both studies with missing data had a dropout rate of over 20% (22% in Lopez 1995 and 42.3% in Thompson 1982), resulting in a judgement of high risk of bias for this domain. We judged a third study as having high risk in this domain, as the authors did not follow an intention‐to‐treat analysis (Bektas 2014).
Selective reporting
We judged 10 studies as at low risk of bias for this domain (Ashrafi 2010; Ashrafi 2013; D'Agostino 2000; Fallah 2013; Gumus 2015; Lopez 1995; Malviya 2004; Marti‐Bonmati 1995; Razieh 2013; Sezer 2013), and three studies at high risk (Bektas 2014; Loewy 2005; Thompson 1982). The studies at high risk of reporting bias used a different categorical outcome sedation score between both comparison groups (reported sleep score 4 for chloral hydrate group and sleep score 3 for music therapy), making it unsuitable for direct comparison (Loewy 2005), and reported outcomes without sufficient details for a meta‐analysis, for example reporting means without standard deviations (Thompson 1982).
Other potential sources of bias
We did not identify other potential major sources of bias in the included studies.
Effects of interventions
See: Summary of findings for the main comparison Chloral hydrate oral (50 mg/kg or 100 mg/kg) compared to dexmedetomidine oral (2 mg/kg or 3 mg/kg) as sedating agents for neurodiagnostic procedures in children; Summary of findings 2 Chloral hydrate oral (75 mg/kg) compared to pentobarbital intravenous (5 mg/kg) as sedating agents for neurodiagnostic procedures in children; Summary of findings 3 Chloral hydrate oral (100 mg/kg or 75 mg/kg) compared to midazolam (intranasal 0.2 mg/kg or oral 0.5 mg/kg) as sedating agents for neurodiagnostic procedures in children; Summary of findings 4 Chloral hydrate oral (50 mg/kg) compared to melatonin oral as sedating agents for neurodiagnostic procedures in children; Summary of findings 5 Chloral hydrate oral (50 mg/kg + 50 mg/kg) compared to hydroxyzine hydrochloride oral (1 mg/kg + 1 mg/kg) as sedating agents for neurodiagnostic procedures in children; Summary of findings 6 Chloral hydrate oral (70 mg/kg) compared to promethazine oral (1 mg/kg) as sedating agents for neurodiagnostic procedures in children; Summary of findings 7 Chloral hydrate oral (60 mg/kg) compared to music therapy as sedating agents for neurodiagnostic procedures in children
Overall, we carried out 10 comparisons, with variations related to the specific interventions compared in comparison 3 (difference in mode of administration of midazolam, i.e. either intranasal or oral), comparison 7 (difference with non‐drug music therapy), and comparison 9 and 10 (difference between different dosing of chloral hydrate). Four studies were not included in the analysis as the data were skewed (Ashrafi 2010; Ashrafi 2013; Bektas 2014; Thompson 1982). Thompson 1982 had a high dropout rate (42.3%) with no details provided regarding the missing data; Bektas 2014 also had incomplete outcome data, and the study did not follow an intention‐to‐treat analysis. Details of these studies are given in Table 1.
| Comparison | Outcome | Study ID | Effect estimate | P value |
| Chloral hydrate versus melatonin | Sleep onset latency | Median (range) in minutes Chloral hydrate group (35 (10 to 150)), melatonin group (45 (5 to 210)) | 0.113 | |
| Sleep duration | Median (range) in minutes Chloral hydrate group (60 (15 to 240)), melatonin group (30 (15 to 240)) | 0.0001 | ||
| Drowsiness time | Median (range) in minutes Chloral hydrate group (60 (0 to 300)), melatonin group (20 (0 to 300)) | 0.0001 | ||
| Chloral hydrate versus midazolam | Sleep onset latency | Median (range) in minutes Chloral hydrate group (32 (20 to 95)), midazolam group (20 (0 to 300)) | < 0.001 | |
| Sleep duration | Median (range) in minutes Chloral hydrate group (66.5 (56 to 98)), midazolam group (25.5 (12 to 38)) | < 0.001 | ||
| Drowsiness time | Median (range) in minutes Chloral hydrate group (32 (21 to 36)), midazolam group (6 (2 to 9)) | < 0.001 | ||
| Chloral hydrate versus hydroxyzine | Time of sleep | Median (range) in minutes Chloral hydrate group (20 (5 to 120)), hydroxyzine group (30 (5 to 240)) | 0.309 | |
| Excessive fast activity | Percentage Chloral hydrate (24.5%) vs hydroxyzine (11.6%) | 0.02 | ||
| Success in falling asleep | Percentage Chloral hydrate (90.7%) vs hydroxyzine (89.6%) | 0.841 | ||
| Chloral hydrate versus intramuscular AMPS | Time to sedation | Mean (minutes) Chloral hydrate (55) vs AMPS (53) | N/A | |
| Imaging failure | Percentage Chloral hydrate (15%) vs AMPS (12%) | N/A |
AMPS: atropine/meperidine/promethazine/secobarbital
N/A: not applicable
We performed analysis on the remaining 10 studies with a total of 1262 children in the 10 comparisons.
-
Comparison 1: Chloral hydrate oral (50 mg/kg or 100 mg/kg) compared to dexmedetomidine oral (2 mg/kg or 3 mg/kg) (160 children) (Gumus 2015).
-
Comparison 2: Chloral hydrate oral (75 mg/kg) compared to pentobarbital intravenous (5 mg/kg) (70 children) (Malviya 2004).
-
Comparison 3: Chloral hydrate oral (100 mg/kg or 75 mg/kg) compared to midazolam (intranasal 0.2 mg/kg or oral 0.5 mg/kg) (291 children) (Ashrafi 2013; D'Agostino 2000; Fallah 2013).
-
Comparison 4: Chloral hydrate oral (50 mg/kg) compared to melatonin oral (348 children) (Ashrafi 2010).
-
Comparison 5: Chloral hydrate oral (50 mg/kg + 50 mg/kg) compared to hydroxyzine hydrochloride oral (1 mg/kg + 1 mg/kg) (282 children) (Sezer 2013).
-
Comparison 6: Chloral hydrate oral (70 mg/kg) compared to promethazine oral (1 mg/kg) (60 children) (Razieh 2013).
-
Comparison 7: Chloral hydrate oral (60 mg/kg) compared to music therapy (58 children) (Loewy 2005).
-
Comparison 8: Chloral hydrate oral (50 mg/kg) compared to midazolam rectal (1 mg/kg) (59 children) (Lopez 1995).
-
Comparison 9: Chloral hydrate high dose oral (100 mg/kg) compared to chloral hydrate low dose (70 mg/kg) (97 children) (Marti‐Bonmati 1995).
-
Comparison 10: Chloral hydrate high dose oral (100 mg/kg) compared to chloral hydrate low dose (50 mg/kg) (76 children) (Gumus 2015).
Below, we have reported on our outcomes of interest for each comparison.
Comparison 1: Chloral hydrate versus dexmedetomidine
Gumus 2015 was the only study that compared oral chloral hydrate to oral dexmedetomidine, in two different dosing regimens. There were four arms in this study, namely low‐dose chloral hydrate (50 mg/kg), high‐dose chloral hydrate (100 mg/kg), low‐dose dexmedetomidine (2 mg/kg), and high‐dose dexmedetomidine (3 mg/kg). This made two pair‐wise comparisons of comparable dosages possible, thus we formed two separate subgroups in our analysis: one comparing low‐dose chloral hydrate against low‐dose dexmedetomidine, and another comparing high‐dose chloral hydrate against high‐dose dexmedetomidine. The major outcomes under this comparison with the corresponding quality of evidence are displayed in summary of findings Table for the main comparison.
Primary outcomes
Proportion of children who successfully completed neurodiagnostic procedure without interruption by the child awakening
No studies assessed this outcome.
Proportion of children who required a further dose of either the same sedative agent or the addition of a different sedative agent
No studies assessed this outcome.
Time to adequate sedation (minutes or as measured by specific validated scales such as the Ramsay Sedation Score)
Children who received oral chloral hydrate had a significantly shorter mean EEG time onset for adequate sedation compared with children who received oral dexmedetomidine (MD ‐3.86, 95% CI ‐5.12 to ‐2.60; 160 children, moderate‐quality evidence, downgraded one level due to imprecision) (Analysis 1.1). Our subgroup analysis showed that high‐dose oral chloral hydrate (100 mg/kg) achieved a significantly shorter mean onset of sedation of 5.6 minutes compared with high‐dose oral dexmedetomidine, whilst low‐dose oral chloral hydrate (50 mg/kg) achieved a significantly shorter mean onset of sedation of 1.9 minutes compared with low‐dose oral dexmedetomidine. The test of subgroup differences was significant (P = 0.004). No studies assessed the outcome of adequate sedation with validated scales.
Secondary outcomes
Proportion of children who had sedation failure or inadequate level of sedation
There was no significant difference in sedation failure between oral chloral hydrate and oral dexmedetomidine (risk ratio (RR) 1.14, 95% confidence interval (CI) 0.51 to 2.53; 160 children, moderate‐quality evidence, downgraded one level due to imprecision) (Analysis 1.2). There were no significant differences between the high‐ and low‐dose subgroup comparisons.
Sedation duration
The duration of sedation was significantly longer in the oral dexmedetomidine group by 16.3 minutes compared with oral chloral hydrate (mean difference (MD) 16.31, 95% CI 9.15 to 23.46; 160 children, moderate‐quality evidence, downgraded one level due to imprecision) (Analysis 1.3). There were no significant differences between the high‐ and low‐dose subgroup comparisons.
Yield of EEG or neuroimaging findings
No studies assessed this outcome.
Adverse effects (any)
Oral chloral hydrate had significantly more adverse events in total when compared with oral dexmedetomidine (RR 7.66, 95% CI 1.78 to 32.91; 160 children, low‐quality evidence, downgraded two levels due to serious imprecision) (Analysis 1.4). There were no significant differences between the high‐ and low‐dose subgroup comparisons. Regarding individual adverse events, there were no significant differences between the two groups in all adverse events (Analysis 1.5; Analysis 1.6; Analysis 1.7; Analysis 1.9), except for nausea or vomiting, for which children who received oral chloral hydrate were reported to have significantly higher risk compared to children who received oral dexmedetomidine (RR 12.04, 95% CI 1.58 to 91.96, 160 children) (Analysis 1.8). There were no significant differences between the high‐ and low‐dose subgroup comparisons.
Comparison 2: Chloral hydrate versus pentobarbital
Malviya 2004 was the only study that compared oral chloral hydrate to intravenous pentobarbital.The major outcomes under this comparison with the corresponding quality of evidence are displayed in summary of findings Table 2.
Primary outcomes
Proportion of children who successfully completed neurodiagnostic procedure without interruption by the child awakening
No studies assessed this outcome.
Proportion of children who required a further dose of either the same sedative agent or the addition of a different sedative agent
No studies assessed this outcome.
Time to adequate sedation (minutes or as measured by specific validated scales such as the Ramsay Sedation Score)
Children who received oral chloral hydrate had a significantly longer mean time to adequate sedation compared with children who received intravenous pentobarbital (MD 19, 95% CI 16.61 to 21.39; 70 children, low‐quality evidence, downgraded two levels due to risk of bias (one level) and imprecision (one level)) (Analysis 2.1). No studies assessed the outcome of adequate sedation with validated scales. However, there was no significant difference in sedation failure after two doses between the two groups (RR 3.00, 95% CI 0.33 to 27.46; 1 study, very low‐quality evidence, downgraded three levels due to risk of bias (one level) and very serious imprecision (two levels)) (Analysis 2.2).
Secondary outcomes
Proportion of children who had sedation failure or inadequate level of sedation
Oral chloral hydrate had significantly more sedation failure after one dose when compared with intravenous pentobarbital (RR 4.33, 95% CI 1.35 to 13.89; low‐quality evidence, downgraded two levels due to very serious imprecision) (Analysis 2.3).
Sedation duration
No studies assessed this outcome.
Yield of EEG or neuroimaging findings
There was no significant difference in non‐interpretable neuroimaging findings between the two groups (RR 0.23, 95% CI 0.03 to 1.94; 54 children, very low‐quality evidence, downgraded three levels due to risk of bias (one level) and very serious imprecision (two levels)) (Analysis 2.4).
Adverse effects (any)
The study did not evaluate overall adverse effects between the two groups. Regarding individual adverse events, there was no significant difference in oxygen desaturation (RR 0.67, 95% CI 0.21 to 2.16; 70 children, very low‐quality evidence, downgraded three levels due to risk of bias (one level) and serious imprecision (two levels)) (Analysis 2.5), nausea or vomiting, and paradoxical reaction between the two groups (Analysis 2.6; Analysis 2.7). Children who received oral chloral hydrate had a significantly shorter mean time (hours) to return to normal behaviour post‐discharge when compared with intravenous pentobarbital (MD ‐6.0, 95% CI ‐11.43 to ‐0.57; 70 children) (Analysis 2.8).
Comparison 3: Chloral hydrate versus midazolam
Three studies compared oral chloral hydrate to midazolam: Fallah 2013, which used intranasal midazolam, and D'Agostino 2000 and Ashrafi 2013, which used oral midazolam. Data in Ashrafi 2013 were skewed, therefore they were not included in the meta‐analysis. The major outcomes under this comparison with the corresponding quality of evidence are displayed in summary of findings Table 3.
Primary outcomes
Proportion of children who successfully completed neurodiagnostic procedure without interruption by the child awakening
No studies assessed this outcome.
Proportion of children who required a further dose of either the same sedative agent or the addition of a different sedative agent
No studies assessed this outcome.
Time to adequate sedation (minutes or as measured by specific validated scales such as the Ramsay Sedation Score)
Ashrafi 2013 reported that children who received oral chloral hydrate had significantly shorter sleep onset latency, but significantly longer sleep duration and drowsiness time (Table 1). Fallah 2013 reported that children who received oral chloral hydrate took a significantly longer time in minutes to achieve adequate sedation compared with intranasal midazolam (MD 12.83, 95% CI 7.22 to 18.44; 60 children, 1 study, moderate‐quality evidence, downgraded one level due to imprecision) (Analysis 3.1). Children who received oral chloral hydrate appeared to be significantly less likely to suffer from inadequate level of sedation (Ramsay score below 4) compared with intranasal midazolam (RR 0.11, 95% CI 0.03 to 0.44; 60 children, 1 study, moderate‐quality evidence, downgraded one level due to imprecision) (Analysis 3.2).
Secondary outcomes
Proportion of children who had sedation failure or inadequate level of sedation
There was no significant difference for sedation failure after one dose of sedative agent between oral chloral hydrate and oral midazolam (RR 0.17, 95% CI 0.02 to 1.12; 33 children, 1 study, low‐quality evidence, downgraded two levels due to very serious imprecision) (Analysis 3.3).
Sedation duration
D'Agostino 2000 reported that there was no significant difference in the mean duration of sedation between oral chloral hydrate and oral midazolam, with mean time for chloral sedation 19 minutes longer (MD 19, 95% CI ‐3.4 to 41.4; 33 children, 1 study, low‐quality evidence, downgraded two levels due to very serious imprecision) (Analysis 3.4).
Yield of EEG or neuroimaging findings
Ashrafi 2013 reported that children who received oral chloral hydrate were significantly less likely to have sedative‐induced artefact on their EEG recording compared to children who received intranasal midazolam (RR 0.58, 95% CI 0.44 to 0.76; 198 children, high‐quality evidence) (Analysis 3.5).
Adverse effects (any)
There was no statistical significant difference in any adverse effects between oral chloral hydrate and oral midazolam groups (RR 0.20, 95% CI 0.01 to 4.2; 198 children, 1 study, low‐quality evidence, downgraded two levels due to very serious imprecision) (Analysis 3.6).
Comparison 4: Chloral hydrate versus melatonin
Ashrafi 2010 was the only study that compared oral chloral hydrate to oral melatonin, however as the data were skewed, they were not included in the meta‐analysis. The major outcomes under this comparison with the corresponding quality of evidence are displayed in summary of findings Table 4.
Primary outcomes
Proportion of children who successfully completed neurodiagnostic procedure without interruption by the child awakening
No studies assessed this outcome.
Proportion of children who required a further dose of either the same sedative agent or the addition of a different sedative agent
No studies assessed this outcome.
Time to adequate sedation (minutes or as measured by specific validated scales such as the Ramsay Sedation Score)
As data in Ashrafi 2010 were skewed, they were not included in the meta‐analysis. Ashrafi 2010 reported that there was no significant difference between children who received oral chloral hydrate and those who received oral melatonin in sleep onset latency, but children who received oral chloral hydrate had significantly longer sleep duration and drowsiness time (Table 1).No studies assessed the outcome of adequate sedation with validated scales.
Secondary outcomes
Proportion of children who had sedation failure or inadequate level of sedation
No studies assessed this outcome.
Sedation duration
No studies assessed this outcome.
Yield of EEG or neuroimaging findings
The occurrence of EEG sedative drug artefact (increased fast activity and slow dysrhythmia) was significantly less likely in the oral chloral hydrate group compared to the oral melatonin group (RR 0.33, 95% CI 0.14 to 0.82; 348 children, low‐quality evidence, downgraded two levels due to risk of bias (one level) and imprecision (one level)) (Analysis 4.1).
Adverse effects (any)
There was no significant difference in any adverse effects between the two groups (RR 1.00, 95% CI 0.25 to 3.93; 348 children, low‐quality evidence, downgraded two levels due to risk of bias (one level) and imprecision (one level)) (Analysis 4.2).
Comparison 5: Chloral hydrate versus hydroxyzine hydrochloride
Sezer 2013 was the only study that compared oral chloral hydrate to oral hydroxyzine hydrochloride. The major outcomes under this comparison with the corresponding quality of evidence are displayed in summary of findings Table 5.
Primary outcomes
Proportion of children who successfully completed neurodiagnostic procedure without interruption by the child awakening
No studies assessed this outcome.
Proportion of children who required a further dose of either the same sedative agent or the addition of a different sedative agent
No studies assessed this outcome.
Time to Adequate sedation (minutes or as measured by specific validated scales such as the Ramsay Sedation Score)
Children receiving oral chloral hydrate had a significantly shorter mean time to adequate sedation compared with oral hydroxyzine hydrochloride (MD ‐7.5, 95% CI ‐7.85 to ‐7.15; 282 children, moderate‐quality evidence, downgraded one level due to imprecision) (Analysis 5.1). No studies assessed the outcome of adequate sedation using validated scales.
Secondary outcomes
Proportion of children who had sedation failure or inadequate level of sedation
There was no statistically significant difference in risk of sedation failure between the two groups (RR 0.33, 95% CI 0.11 to 1.01; 282 children, low‐quality evidence, downgraded two levels due to risk of bias (one level) and imprecision (one level)) (Analysis 5.2).
Sedation duration
Children receiving oral chloral hydrate had a significantly longer mean sleep duration compared to those receiving oral hydroxyzine hydrochloride (MD 3.1, 95% CI 2.23 to 3.97; 282 children, moderate‐quality evidence, downgraded one level due to imprecision) (Analysis 5.3).
Yield of EEG or neuroimaging findings
There was no significant difference in EEG sedative drug artefact between the two groups (RR 1.33, 95% CI 0.47 to 3.74; 282 children, moderate‐quality evidence, downgraded one level due to imprecision) (Analysis 5.4).
Adverse effects (behavioural change and nausea or vomiting)
There was no significant difference between the two groups for behavioural change (RR 1.17, 95% CI 0.40 to 3.38; 282 children, low‐quality evidence, downgraded two levels due to risk of bias (one level) and imprecision (one level)) (Analysis 5.5), or for nausea or vomiting (RR 1.25, 95% CI 0.34 to 4.56; 282 children, low‐quality evidence, downgraded two levels due to risk of bias (one level) and imprecision (one level)) (Analysis 5.6).
Comparison 6: Chloral hydrate versus promethazine
Razieh 2013 was the only study that compared oral chloral hydrate to oral promethazine. The major outcomes under this comparison with the corresponding quality of evidence are displayed in summary of findings Table 6.
Primary outcomes
Proportion of children who successfully completed neurodiagnostic procedure without interruption by the child awakening
No studies assessed this outcome.
Proportion of children who required a further dose of either the same sedative agent or the addition of a different sedative agent
No studies assessed this outcome.
Time to Adequate sedation (minutes or as measured by specific validated scales such as the Ramsay Sedation Score)
Children in the chloral hydrate group had a significantly shorter mean time to adequate sedation compared with promethazine (MD ‐12.11, 95% CI ‐18.48 to ‐5.74; 60 children, moderate‐quality evidence, downgraded one level due to imprecision) (Analysis 6.1). A significantly lower number of children who received oral chloral hydrate had inadequate level of sedation (Ramsay score below 4) compared with oral promethazine (RR 0.03, 95% CI 0.00 to 0.45; 60 children, low‐quality evidence, downgraded two levels due to very serious imprecision) (Analysis 6.2).
Sedation duration
No studies assessed this outcome.
Secondary outcomes
Proportion of children who had sedation failure or inadequate level of sedation
Children in the oral chloral hydrate group had significantly less sedation failure compared with oral promethazine (RR 0.11, 95% CI 0.01 to 0.82; 60 children, moderate‐quality evidence, downgraded one level due to imprecision) (Analysis 6.3).
Sedation duration
No studies assessed this outcome.
Yield of EEG or neuroimaging findings
No studies assessed this outcome.
Adverse effects (behavioural change and nausea or vomiting)
There was no significant difference between the two groups for behavioural change (RR 0.20, 95% CI 0.01 to 4.00; 60 children, moderate‐quality evidence, downgraded one level due to imprecision) (Analysis 6.4), or for nausea or vomiting (RR 13.00, 95% CI 0.76 to 220.96; 60 children, low‐quality evidence, downgraded two levels due to very serious imprecision) (Analysis 6.5).
Comparison 7: Chloral hydrate versus music therapy
Loewy 2005 was the only study that compared oral chloral hydrate to music therapy. The major outcomes under this comparison with the corresponding quality of evidence are displayed in summary of findings Table 7.
Primary outcomes
Proportion of children who successfully completed neurodiagnostic procedure without interruption by the child awakening
No studies assessed this outcome.
Proportion of children who required a further dose of either the same sedative agent or the addition of a different sedative agent
No studies assessed this outcome.
Time to adequate sedation (minutes or as measured by specific validated scales such as the Ramsay Sedation Score)
There was no difference between the two groups in time to adequate sedation (MD 9.00 minutes, 95% CI ‐2.15 to 20.15; 58 children, very low‐quality evidence, downgraded three levels due to very serious risk of bias (two levels) and imprecision (one level)) (Analysis 7.1). No studies assessed the outcome of adequate sedation with validated scales.
Secondary outcomes
Proportion of children who had sedation failure or inadequate level of sedation
Children who received oral chloral hydrate had significantly higher sedation failure when compared with children who received music therapy (RR 17.00, 95% CI 2.37 to 122.14; 58 children, very low‐quality evidence, downgraded four levels due to very serious risk of bias (two levels) and very serious imprecision (two levels)) (Analysis 7.2).
Sedation duration
The duration of sedation was significantly longer in the oral chloral hydrate group by 160 minutes compared with the music therapy group (MD 160.00, 95% CI 121.07 to 198.93; 58 children, very low‐quality evidence, downgraded three levels due to very serious risk of bias (two levels) and imprecision (one level)) (Analysis 7.3).
Yield of EEG or neuroimaging findings
No studies assessed this outcome.
Adverse effects (any)
No studies assessed this outcome.
Comparison 8: Chloral hydrate versus midazolam
Lopez 1995 was the only study that compared oral chloral hydrate to rectal midazolam.
Primary outcomes
Proportion of children who successfully completed neurodiagnostic procedure without interruption by the child awakening
No studies assessed this outcome.
Proportion of children who required a further dose of either the same sedative agent or the addition of a different sedative agent
No studies assessed this outcome.
Time to adequate sedation (minutes or as measured by specific validated scales such as the Ramsay Sedation Score)
Children receiving oral chloral hydrate had a significantly shorter mean time to adequate sedation (in minutes) compared with rectal midazolam (MD ‐95.70, 95% CI ‐114.51 to ‐76.89; 59 children) (Analysis 8.1). No studies assessed the outcome of adequate sedation with validated scales.
Secondary outcomes
Proportion of children who had sedation failure or inadequate level of sedation
No studies assessed this outcome.
Sedation duration
The duration of sedation (in minutes) was significantly longer in the oral chloral hydrate group compared with the rectal midazolam group (MD 15.10, 95% CI 3.35 to 26.85; 59 children) (Analysis 8.2).
Yield of EEG or neuroimaging findings
There was no significant difference in EEG sedative drug artefact between the two groups (RR 1.25, 95% CI 0.73 to 2.12; 53 children) (Analysis 8.3).
Adverse effects (any)
No studies assessed this outcome.
Comparison 9: Chloral hydrate high dose versus chloral hydrate low dose
Marti‐Bonmati 1995 was the only study that compared high‐dose oral chloral hydrate (100 mg/kg) to low‐dose oral chloral hydrate (70 mg/kg).
Primary outcomes
Proportion of children who successfully completed neurodiagnostic procedure without interruption by the child awakening
No studies assessed this outcome.
Proportion of children who required a further dose of either the same sedative agent or the addition of a different sedative agent
No studies assessed this outcome.
Time to adequate sedation (minutes or as measured by specific validated scales such as the Ramsay Sedation Score)
Children receiving high‐dose oral chloral hydrate had a significantly shorter mean time to adequate sedation (in minutes) compared with those receiving low‐dose oral chloral hydrate (MD ‐7.00, 95% CI ‐7.62 to ‐6.38; 97 children) (Analysis 9.1). No studies assessed the outcome of adequate sedation with validated scales.
Secondary outcomes
Proportion of children who had sedation failure or inadequate level of sedation
There was no significant difference in proportion of children who had sedation failure between the two groups (RR 0.46, 95% CI 0.19 to 1.09; 97 children) (Analysis 9.2).
Sedation duration
The duration of sedation was longer in the high‐dose oral chloral hydrate group by 8 minutes compared with the low‐dose oral chloral hydrate group (MD 8.00, 95% CI 5.81 to 10.19; 97 children) (Analysis 9.3).
Yield of EEG or neuroimaging findings
No studies assessed this outcome.
Adverse effects (any)
There was no significant difference between the two groups for adverse effects (RR 1.06, 95% CI 0.49 to 2.32; 97 children) (Analysis 9.4).
Comparison 10: Chloral hydrate high dose versus chloral hydrate low dose
Gumus 2015 was the only study that compared high‐dose oral chloral hydrate (100 mg/kg) to low‐dose oral chloral hydrate (50 mg/kg).
Primary outcomes
Proportion of children who successfully completed neurodiagnostic procedure without interruption by the child awakening
No studies assessed this outcome.
Proportion of children who required a further dose of either the same sedative agent or the addition of a different sedative agent
No studies assessed this outcome.
Time to adequate sedation (minutes or as measured by specific validated scales such as the Ramsay Sedation Score)
Children receiving high‐dose chloral hydrate had a significantly shorter time to adequate sedation (in minutes) compared with those receiving low‐dose oral chloral hydrate (MD ‐5.10, 95% CI ‐7.05 to ‐3.15; 76 children) (Analysis 10.1). No studies assessed the outcome of adequate sedation with validated scales.
Secondary outcomes
Proportion of children who had sedation failure or inadequate level of sedation
Children receiving high‐dose chloral hydrate were significantly less likely to have sedation failure compared with those receiving low‐dose chloral hydrate (RR 0.23, 95% CI 0.05 to 0.99; 76 children) (Analysis 10.2).
Sedation duration
The duration of sedation (in minutes) was significantly longer in the high‐dose oral chloral hydrate group compared with the low‐dose oral chloral hydrate group (MD 17.80, 95% CI 8.50 to 27.10; 76 children) (Analysis 10.3).
Yield of EEG or neuroimaging findings
No studies assessed this outcome.
Adverse effects (any)
There was no significant difference between the two groups for adverse effects (RR 2.25, 95% CI 0.77 to 6.55; 76 children) (Analysis 10.4).
Discussion
Summary of main results
Apart from oral chloral hydrate, this review identified a variety of sedation agents used for neurodiagnostic procedures, of which the majority were given in an oral preparation (dexmedetomidine, midazolam, melatonin, hydroxyzine hydrochloride, and promethazine). Three studies used non‐oral preparation (intranasal midazolam, rectal midazolam, or intravenous pentobarbital), and one study used a non‐drug therapy (music therapy). Despite a wide variety of agents used, each sedation agent was represented by a very small number of studies, and all were only evaluated by a single study. Our review also identified paediatric participants undergoing neurodiagnostic procedures from all age groups, ranging from birth to 18 years old.
For the primary outcome measure of time to adequate sedation, the efficacy of oral chloral hydrate when compared with other sedative agents was mixed. Four studies showed that oral chloral hydrate had a shorter time to achieve adequate sedation when compared with oral dexmedetomidine, oral hydroxyzine hydrochloride, oral promethazine, or rectal midazolam. On the other hand, another two studies showed that chloral hydrate took a longer time to achieve adequate sedation when compared with intravenous pentobarbital or intranasal midazolam. Children had a shorter time to achieve adequate sedation with a higher dose of oral chloral hydrate compared to a lower dose.
For the secondary outcome of proportion of children who had sedation failure or inadequate level of sedation, oral chloral hydrate appeared to have lower sedation failure when compared with oral promethazine and intranasal midazolam. Chloral hydrate had more sedation failure after one dose when compared with intravenous pentobarbital, but there was no difference after two doses. Another study showed that chloral hydrate appeared to have more sedation failure when compared with music therapy. Sedation failure rates appeared to be similar between oral chloral hydrate and oral dexmedetomidine, oral midazolam, and oral hydroxyzine hydrochloride. Two comparative oral chloral hydrate dosing studies showed oral chloral hydrate 100 mg/kg to have lower sedation failure than oral chloral hydrate 50 mg/kg, and no difference when compared with oral chloral hydrate 70 mg/kg. Most analyses were underpowered with insufficient evidence to enable clear conclusions.
For the secondary outcome of sedation duration, oral chloral hydrate achieved a longer duration of sedation when compared with oral hydroxyzine hydrochloride and music therapy. One study found no difference in duration of sedation between oral chloral hydrate and oral midazolam. Another study showed that oral chloral hydrate had a shorter duration of sedation when compared with oral dexmedetomidine. A higher dose of oral chloral hydrate appeared to achieve longer sedation duration than a lower dose.
Five studies assessed the secondary outcome measure of sedative effect on yield of neurodiagnostic procedure (four studies evaluated yield of EEG procedure, and one study evaluated yield of neuroimaging procedure). Two of the four EEG studies showed that oral chloral hydrate had less sedative artefact when compared with intranasal midazolam or oral melatonin. The other two studies showed no difference in sedative artefact on EEG when compared with oral hydroxyzine hydrochloride and rectal midazolam. In the only study evaluating yield of neuroimaging procedure, no difference was seen between oral chloral hydrate and intravenous pentobarbital.
Eight studies assessed the secondary outcome measure of adverse effects of sedation. Seven of the eight studies showed no difference in adverse effects, while the remaining study found that children receiving oral chloral hydrate had a higher total number of adverse effects compared to those receiving oral dexmedetomidine.
Overall completeness and applicability of evidence
We identified 13 studies that matched our selection criteria in terms of population, sedation intervention, comparison, and outcomes. A total of 2390 children (age range from birth to 18 years old) were assessed. The studies were conducted in Asia, Europe, and the USA from 1982 to 2014. These studies were performed in hospitals that provided neurodiagnostic services. Most of the agents evaluated in comparison with oral chloral hydrate were those commonly used in practice, and the doses of oral chloral hydrate evaluated were commonly used doses. However, there were certain limitations in the completeness of this review. For example, some of the key prespecified outcomes were not assessed in most of the included studies, such as proportion of children who successfully completed neurodiagnostic procedure without interruption by the child awakening and proportion of children who required a further dose of either the same sedative agent or the addition of a different sedative agent.
Quality of the evidence
The evidence for the majority of the outcomes assessed was overall of very low to moderate quality, due to the small number of studies included in each comparison and variable risk of bias of the included studies. The strongest evidence came from studies that compared oral chloral hydrate with either intranasal midazolam, oral midazolam (D'Agostino 2000; Fallah 2013), or oral promethazine (Razieh 2013), for which there were three studies. However, all the comparisons in this review involved small numbers of trials and participants, which in most cases translated to imprecision that required downgrading of the quality of the evidence. Also, in the case of statistically significant difference, an analysis with a small number of trials lessens the reliability of the results due to concerns about the effects of small studies exacerbating the impact of biases (Sterne 2011). A second major limitation in the quality of evidence gathered was related to performance bias, for which six studies had high risk and three had unclear risk. In studies at high risk of performance bias, lack of blinding of the participants or assessors, or both, makes it highly likely that the outcome results were influenced, thus affecting the quality of evidence. Overall, the body of evidence gathered in this review did not allow us to draw a robust conclusion regarding the effectiveness of chloral hydrate as a sedating agent for neurodiagnostic procedures in children.
Potential biases in the review process
We performed a comprehensive search of multiple databases with independent screening, selection, and assessment of eligible studies. However, we were unable to obtain all relevant data; one study is still awaiting assessment despite our contacting the author via email. We excluded some RCTs on the basis of wrong type of outcome measure whereby these studies did not have a direct comparison with another sedative agent. These studies assessed the efficacy of chloral hydrate as a sedative agent using different dosing regimens or with other second‐line sedative agents after failure of first‐line chloral hydrate sedation. In addition, the primary outcome measure of the efficacy of chloral hydrate was made by assessing adequacy of sedation, proportion of sedation failure, and sedation duration as a whole. We did not differentiate efficacy of chloral hydrate according to EEG or neuroimaging procedure. Our failure to adjust for type of neurodiagnostic procedure may also have affected the summary of the results.
Agreements and disagreements with other studies or reviews
There are three reviews on this topic. Meyer and colleagues 2007 is a narrative review discussing the current status of sedation for brief diagnostic procedures in children (Meyer 2007). Mace and colleagues 2008 is a systematic review of the literature between 1976 to 2006 to develop a clinical policy of effective and safe medications for providing procedural sedation in the emergency department (Mace 2008). NICE 2010 is a systematic review of the literature between 1950 to 2010 to develop a clinical guideline offering evidence‐based advice on the care and treatment of children and young people having sedation for therapeutic or diagnostic procedures (NICE 2010).
The findings of our review are broadly in line with the conclusions of these other reviews, which state that oral chloral hydrate is one of the preferred sedative drugs for non‐invasive procedural studies in children with a wide margin of safety (Mace 2008; Meyer 2007; NICE 2010), with a dosing of 50 to 100 mg/kg (Mace 2008). Based on the two comparative oral chloral hydrate studies (Gumus 2015; Marti‐Bonmati 1995), chloral hydrate of 100 mg/kg or 70 mg/kg appeared to be more effective than chloral hydrate 50 mg/kg. Our review differed from the previous reviews in their conclusion that oral chloral hydrate should only be considered in young children either under 3 years old (Meyer 2007), under 15 kg (NICE 2010), or under 2 years old (Mace 2008), with one review stating that this was due to reduced efficacy in older children (Mace 2008). However, the number of paediatric chloral hydrate RCTs prior to 2010 when these three reviews were written was limited; since 2010 there have been seven paediatric chloral hydrate RCTs. The majority of the chloral hydrate RCTs conducted included the whole range of paediatric age group, up to 14 years old, and not just confined to children under 3 years of age (Ashrafi 2013; Bektas 2014; D'Agostino 2000; Fallah 2013; Gumus 2015; Malviya 2004; Razieh 2013; Sezer 2013). Apart from Malviya 2004, all of the studies that included older children showed that oral chloral hydrate was just as effective as or more effective than the comparator sedative agent (Ashrafi 2013; Bektas 2014; D'Agostino 2000; Fallah 2013; Gumus 2015; Razieh 2013; Sezer 2013). None of these studies showed that oral chloral hydrate had a higher adverse effect rate.

Study flow diagram.

Risk of bias graph: review authors' judgements about each risk of bias item presented as percentages across all included studies.

Risk of bias summary: review authors' judgements about each risk of bias item for each included study.

Comparison 1 Chloral hydrate oral (50 mg/kg or 100 mg/kg) versus dexmedetomidine oral (2 mg/kg or 3 mg/kg), Outcome 1 EEG time onset for adequate sedation (minutes).

Comparison 1 Chloral hydrate oral (50 mg/kg or 100 mg/kg) versus dexmedetomidine oral (2 mg/kg or 3 mg/kg), Outcome 2 EEG sedation failure.

Comparison 1 Chloral hydrate oral (50 mg/kg or 100 mg/kg) versus dexmedetomidine oral (2 mg/kg or 3 mg/kg), Outcome 3 EEG sedation / sleep duration (minutes).

Comparison 1 Chloral hydrate oral (50 mg/kg or 100 mg/kg) versus dexmedetomidine oral (2 mg/kg or 3 mg/kg), Outcome 4 EEG sedation adverse event: total.

Comparison 1 Chloral hydrate oral (50 mg/kg or 100 mg/kg) versus dexmedetomidine oral (2 mg/kg or 3 mg/kg), Outcome 5 EEG sedation adverse event: hypotension.

Comparison 1 Chloral hydrate oral (50 mg/kg or 100 mg/kg) versus dexmedetomidine oral (2 mg/kg or 3 mg/kg), Outcome 6 EEG sedation adverse event: bradycardia.

Comparison 1 Chloral hydrate oral (50 mg/kg or 100 mg/kg) versus dexmedetomidine oral (2 mg/kg or 3 mg/kg), Outcome 7 EEG sedation adverse event: behavioural change.

Comparison 1 Chloral hydrate oral (50 mg/kg or 100 mg/kg) versus dexmedetomidine oral (2 mg/kg or 3 mg/kg), Outcome 8 EEG sedation adverse event: nausea or vomiting.

Comparison 1 Chloral hydrate oral (50 mg/kg or 100 mg/kg) versus dexmedetomidine oral (2 mg/kg or 3 mg/kg), Outcome 9 EEG sedation adverse event: oxygen desaturation.

Comparison 2 Chloral hydrate oral (75 mg/kg) versus pentobarbital intravenous (5 mg/kg), Outcome 1 Neuroimaging time onset for adequate sedation (minutes).

Comparison 2 Chloral hydrate oral (75 mg/kg) versus pentobarbital intravenous (5 mg/kg), Outcome 2 Neuroimaging sedation failure after 2 administrations of sedative agent (same or different).

Comparison 2 Chloral hydrate oral (75 mg/kg) versus pentobarbital intravenous (5 mg/kg), Outcome 3 Neuroimaging sedation failure after 1 administration of sedative agent.

Comparison 2 Chloral hydrate oral (75 mg/kg) versus pentobarbital intravenous (5 mg/kg), Outcome 4 Neuroimaging uninterpretable.

Comparison 2 Chloral hydrate oral (75 mg/kg) versus pentobarbital intravenous (5 mg/kg), Outcome 5 Neuroimaging sedation adverse event: oxygen desaturation.

Comparison 2 Chloral hydrate oral (75 mg/kg) versus pentobarbital intravenous (5 mg/kg), Outcome 6 Neuroimaging sedation adverse event: nausea or vomiting.

Comparison 2 Chloral hydrate oral (75 mg/kg) versus pentobarbital intravenous (5 mg/kg), Outcome 7 Neuroimaging sedation adverse event: paradoxical reaction.

Comparison 2 Chloral hydrate oral (75 mg/kg) versus pentobarbital intravenous (5 mg/kg), Outcome 8 Neuroimaging sedation adverse event: return to baseline activity postdischarge.

Comparison 3 Chloral hydrate oral (100 mg/kg or 75 mg/kg) versus midazolam (intranasal 0.2 mg/kg or oral 0.5 mg/kg), Outcome 1 Neuroimaging time onset for adequate sedation (minutes).

Comparison 3 Chloral hydrate oral (100 mg/kg or 75 mg/kg) versus midazolam (intranasal 0.2 mg/kg or oral 0.5 mg/kg), Outcome 2 Neuroimaging inadequate level of sedation achieved (Ramsay score 4).

Comparison 3 Chloral hydrate oral (100 mg/kg or 75 mg/kg) versus midazolam (intranasal 0.2 mg/kg or oral 0.5 mg/kg), Outcome 3 Neuroimaging sedation failure after 1 administration of sedative agent.

Comparison 3 Chloral hydrate oral (100 mg/kg or 75 mg/kg) versus midazolam (intranasal 0.2 mg/kg or oral 0.5 mg/kg), Outcome 4 Neuroimaging sedation / sleep duration (minutes).

Comparison 3 Chloral hydrate oral (100 mg/kg or 75 mg/kg) versus midazolam (intranasal 0.2 mg/kg or oral 0.5 mg/kg), Outcome 5 EEG sedative‐induced artefact.

Comparison 3 Chloral hydrate oral (100 mg/kg or 75 mg/kg) versus midazolam (intranasal 0.2 mg/kg or oral 0.5 mg/kg), Outcome 6 EEG sedation adverse event: total.

Comparison 3 Chloral hydrate oral (100 mg/kg or 75 mg/kg) versus midazolam (intranasal 0.2 mg/kg or oral 0.5 mg/kg), Outcome 7 Neuroimaging adverse event: behavioural change.

Comparison 3 Chloral hydrate oral (100 mg/kg or 75 mg/kg) versus midazolam (intranasal 0.2 mg/kg or oral 0.5 mg/kg), Outcome 8 Neuroimaging adverse event: vomiting.

Comparison 3 Chloral hydrate oral (100 mg/kg or 75 mg/kg) versus midazolam (intranasal 0.2 mg/kg or oral 0.5 mg/kg), Outcome 9 Neuroimaging sedation failure with intranasal midazolam.

Comparison 3 Chloral hydrate oral (100 mg/kg or 75 mg/kg) versus midazolam (intranasal 0.2 mg/kg or oral 0.5 mg/kg), Outcome 10 Neuroimaging sedation failure with oral midazolam.

Comparison 4 Chloral hydrate oral (50 mg/kg) versus melatonin oral, Outcome 1 EEG sedative‐induced artefact.

Comparison 4 Chloral hydrate oral (50 mg/kg) versus melatonin oral, Outcome 2 EEG sedation adverse event: total.

Comparison 5 Chloral hydrate oral (50 mg/kg + 50 mg/kg) versus hydroxyzine hydrochloride oral (1 mg/kg + 1 mg/kg), Outcome 1 EEG time onset for adequate sedation (minutes).

Comparison 5 Chloral hydrate oral (50 mg/kg + 50 mg/kg) versus hydroxyzine hydrochloride oral (1 mg/kg + 1 mg/kg), Outcome 2 EEG sedation failure.

Comparison 5 Chloral hydrate oral (50 mg/kg + 50 mg/kg) versus hydroxyzine hydrochloride oral (1 mg/kg + 1 mg/kg), Outcome 3 EEG sedation / sleep duration (minutes).

Comparison 5 Chloral hydrate oral (50 mg/kg + 50 mg/kg) versus hydroxyzine hydrochloride oral (1 mg/kg + 1 mg/kg), Outcome 4 EEG sedative‐induced artefact.

Comparison 5 Chloral hydrate oral (50 mg/kg + 50 mg/kg) versus hydroxyzine hydrochloride oral (1 mg/kg + 1 mg/kg), Outcome 5 EEG sedation adverse event: behavioural change.

Comparison 5 Chloral hydrate oral (50 mg/kg + 50 mg/kg) versus hydroxyzine hydrochloride oral (1 mg/kg + 1 mg/kg), Outcome 6 EEG sedation adverse event: nausea or vomiting.

Comparison 5 Chloral hydrate oral (50 mg/kg + 50 mg/kg) versus hydroxyzine hydrochloride oral (1 mg/kg + 1 mg/kg), Outcome 7 EEG failure after 1 administration of sedative agent.

Comparison 6 Chloral hydrate oral (70 mg/kg) versus promethazine oral (1 mg/kg), Outcome 1 EEG time for adequate sedation (minutes).

Comparison 6 Chloral hydrate oral (70 mg/kg) versus promethazine oral (1 mg/kg), Outcome 2 EEG inadequate level of EEG sedation achieved (Ramsay score 4).

Comparison 6 Chloral hydrate oral (70 mg/kg) versus promethazine oral (1 mg/kg), Outcome 3 EEG sedation failure.

Comparison 6 Chloral hydrate oral (70 mg/kg) versus promethazine oral (1 mg/kg), Outcome 4 EEG sedation adverse event: behavioural change.

Comparison 6 Chloral hydrate oral (70 mg/kg) versus promethazine oral (1 mg/kg), Outcome 5 EEG sedation adverse event: vomiting or nausea.

Comparison 6 Chloral hydrate oral (70 mg/kg) versus promethazine oral (1 mg/kg), Outcome 6 EEG Ramsay Sedation Score after 1 administration of sedative agent.

Comparison 7 Chloral hydrate oral (60 mg/kg) versus music therapy, Outcome 1 EEG time onset for adequate sedation (minutes).

Comparison 7 Chloral hydrate oral (60 mg/kg) versus music therapy, Outcome 2 EEG sedation failure.

Comparison 7 Chloral hydrate oral (60 mg/kg) versus music therapy, Outcome 3 EEG sedation / sleep duration (minutes).

Comparison 8 Chloral hydrate oral (50 mg/kg) versus midazolam rectal (1 mg/kg), Outcome 1 EEG time onset for adequate sedation (minutes).

Comparison 8 Chloral hydrate oral (50 mg/kg) versus midazolam rectal (1 mg/kg), Outcome 2 EEG sedation/ sleep duration (minutes).
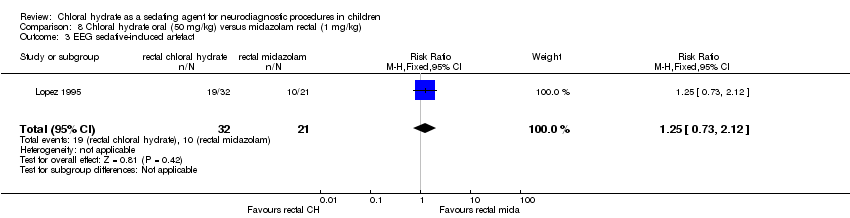
Comparison 8 Chloral hydrate oral (50 mg/kg) versus midazolam rectal (1 mg/kg), Outcome 3 EEG sedative‐induced artefact.

Comparison 9 High‐dose chloral hydrate (100 mg/kg) versus low‐dose chloral hydrate (70 mg/kg), Outcome 1 Neuroimaging time onset for adequate sedation (minutes).

Comparison 9 High‐dose chloral hydrate (100 mg/kg) versus low‐dose chloral hydrate (70 mg/kg), Outcome 2 Neuroimaging sedation failure after 1 administration of sedative agent.

Comparison 9 High‐dose chloral hydrate (100 mg/kg) versus low‐dose chloral hydrate (70 mg/kg), Outcome 3 Neuroimaging sedation / sleep duration (minutes).

Comparison 9 High‐dose chloral hydrate (100 mg/kg) versus low‐dose chloral hydrate (70 mg/kg), Outcome 4 Neuroimaging sedation adverse event: total.

Comparison 10 High‐dose chloral hydrate (100 mg/kg) versus low‐dose chloral hydrate (50 mg/kg), Outcome 1 EEG time onset for adequate sedation (minutes).

Comparison 10 High‐dose chloral hydrate (100 mg/kg) versus low‐dose chloral hydrate (50 mg/kg), Outcome 2 EEG sedation failure.

Comparison 10 High‐dose chloral hydrate (100 mg/kg) versus low‐dose chloral hydrate (50 mg/kg), Outcome 3 EEG sedation/sleep duration (minutes).

Comparison 10 High‐dose chloral hydrate (100 mg/kg) versus low‐dose chloral hydrate (50 mg/kg), Outcome 4 EEG sedation adverse event: total.

Comparison 10 High‐dose chloral hydrate (100 mg/kg) versus low‐dose chloral hydrate (50 mg/kg), Outcome 5 EEG sedation adverse event: behavioural change.

Comparison 10 High‐dose chloral hydrate (100 mg/kg) versus low‐dose chloral hydrate (50 mg/kg), Outcome 6 EEG sedation adverse event: nausea or vomiting.

Comparison 10 High‐dose chloral hydrate (100 mg/kg) versus low‐dose chloral hydrate (50 mg/kg), Outcome 7 EEG sedation adverse event: oxygen desaturation.
| Chloral hydrate orally (50 mg/kg or 100 mg/kg) compared to dexmedetomidine orally (2 mg/kg or 3 mg/kg) as sedating agents for neurodiagnostic procedures in children | ||||||
| Patient or population: children undergoing neurodiagnostic procedures | ||||||
| Outcomes | Anticipated absolute effects* (95% CI) | Relative effect | № of participants | Quality of the evidence | Comments | |
| Risk with dexmedetomidine | Risk with chloral hydrate | |||||
| Proportion of children who successfully completed neurodiagnostic procedure without interruption by the child awakening | ‐ | ‐ | ‐ | ‐ | ‐ | No study for this comparison assessed this outcome. |
| Proportion of children who required a further dose of either the same sedative agent or the addition of a different sedative agent | ‐ | ‐ | ‐ | ‐ | ‐ | No study for this comparison assessed this outcome. |
| Time to adequate sedation (minutes or as measured by specific validated scales such as the Ramsay Sedation Score) | The mean EEG time onset for adequate sedation (minutes) was 35.2. | The mean EEG time onset for adequate sedation (minutes) in the intervention group was 3.86 minutes shorter (5.12 shorter to 2.6 shorter). | ‐ | 160 | ⊕⊕⊕⊝ | |
| Proportion of children who had sedation failure or inadequate level of sedation | Study population | RR 1.14 | 160 | ⊕⊕⊕⊝ | ||
| 119 per 1000 | 136 per 1000 | |||||
| Sedation duration (minutes) | The mean duration of sedation/sleep was 112.1 minutes3 | The mean EEG sedation/sleep duration in the intervention group was 16.31 minutes longer (9.15 to 23.46 minutes longer) | ‐ | 160 | ⊕⊕⊕⊝ | |
| Number of children with clinical adverse events (any) | Study population | RR 7.66 | 160 | ⊕⊕⊝⊝ | ||
| 24 per 1000 | 182 per 1000 | |||||
| *The risk in the intervention group (and its 95% confidence interval) is based on the assumed risk in the comparison group and the relative effect of the intervention (and its 95% CI). | ||||||
| GRADE Working Group grades of evidence | ||||||
| 1The 95% CI for this estimate ranges from 2.6 to 5.1 minutes of difference, which in terms of length of sedation is wide. Quality of evidence downgraded one level due to risk of bias. | ||||||
| Chloral hydrate orally (75 mg/kg) compared to pentobarbital intravenously (5 mg/kg) as sedating agents for neurodiagnostic procedures in children | ||||||
| Patient or population: children undergoing neurodiagnostic procedures | ||||||
| Outcomes | Anticipated absolute effects* (95% CI) | Relative effect | № of participants | Quality of the evidence | Comments | |
| Risk with pentobarbital | Risk with chloral hydrate | |||||
| Proportion of children who successfully completed neurodiagnostic procedure without interruption by the child awakening | ‐ | ‐ | ‐ | ‐ | ‐ | No study for this comparison assessed this outcome. |
| Proportion of children who required a further dose of either the same sedative agent or the addition of a different sedative agent | ‐ | ‐ | ‐ | ‐ | ‐ | No study for this comparison assessed this outcome. |
| Time to adequate sedation (minutes or as measured by specific validated scales such as the Ramsay Sedation Score) | The mean time to adequate sedation was 9 minutes. | The mean time to adequate sedation in the intervention group was 19 minutes longer (16.61 to 21.39 minutes longer). | ‐ | 70 | ⊕⊕⊝⊝ | |
| Proportion of children who had sedation failure after 1 dose of sedative agent | Study population | RR 4.33 | 70 | ⊕⊕⊝⊝ | ||
| 86 per 1000 | 371 per 1000 | |||||
| Proportion of children who had sedation failure after 2 doses of sedative agent (same or different) | Study population | RR 3.00 | 70 | ⊕⊝⊝⊝ | ||
| 29 per 1000 | 86 per 1000 | |||||
| Non‐interpretable neuroimaging finding | Study population | RR 0.23 | 54 | ⊕⊝⊝⊝ | ||
| 154 per 1000 | 35 per 1000 | |||||
| Number of children with clinical adverse event: oxygen desaturation | Study population | RR 0.67 | 70 | ⊕⊝⊝⊝ | ||
| 171 per 1000 | 115 per 1000 | |||||
| *The risk in the intervention group (and its 95% confidence interval) is based on the assumed risk in the comparison group and the relative effect of the intervention (and its 95% CI). | ||||||
| GRADE Working Group grades of evidence | ||||||
| 1The single included study had unclear risk of bias for allocation concealment and blinding of outcome assessor and high risk of bias for blinding of participants and personnel. Quality of evidence downgraded one level due to risk of bias. | ||||||
| Chloral hydrate orally (100 mg/kg or 75 mg/kg) compared to midazolam (0.2 mg/kg intranasally or 0.5 mg/kg orally) as sedating agents for neurodiagnostic procedures in children | ||||||
| Patient or population: children undergoing neurodiagnostic procedures | ||||||
| Outcomes | Anticipated absolute effects* (95% CI) | Relative effect | № of participants | Quality of the evidence | Comments | |
| Risk with midazolam | Risk with chloral hydrate | |||||
| Proportion of children who successfully completed neurodiagnostic procedure without interruption by the child awakening | ‐ | ‐ | ‐ | ‐ | ‐ | No study for this comparison assessed this outcome. |
| Proportion of children who required a further dose of either the same sedative agent or the addition of a different sedative agent | ‐ | ‐ | ‐ | ‐ | ‐ | No study for this comparison assessed this outcome. |
| Time to adequate sedation (minutes or as measured by specific validated scales such as the Ramsay Sedation Score) | The mean time to adequate sedation was 10.92 minutes (intranasal midazolam). | The mean time to adequate sedation in the intervention group was 12.83 minutes longer (7.22 to 18.44 minutes longer). | ‐ | 60 | ⊕⊕⊕⊝ | |
| Proportion of children with inadequate level of sedation (Ramsay score below 4) | Study population | RR 0.11 | 60 | ⊕⊕⊕⊝ | ||
| 600 per 1000 | 66 per 1000 | |||||
| Proportion of children who had sedation failure after 1 dose of sedative agent | Study population | RR 0.17 | 33 | ⊕⊕⊝⊝ | ||
| 545 per 1000 | 93 per 1000 | |||||
| Sedation duration (minutes) | The mean duration of sedation or sleep was 76 minutes (oral midazolam). | The mean duration of sedation or sleep in the intervention group was 19 minutes longer (3.4 minutes shorter to 41.4 minutes longer). | ‐ | 33 | ⊕⊕⊝⊝ | |
| EEG sedative‐induced artefact | Study population | RR 0.58 | 198 | ⊕⊕⊕⊕ | ||
| 700 per 1000 | 406 per 1000 (308 to 532) | |||||
| Number of children with clinical adverse events (any) | Study population | RR 0.20 | 198 | ⊕⊕⊝⊝ | ||
| 20 per 1000 | 4 per 1000 | |||||
| *The risk in the intervention group (and its 95% confidence interval) is based on the assumed risk in the comparison group and the relative effect of the intervention (and its 95% CI). | ||||||
| GRADE Working Group grades of evidence | ||||||
| 1The 95% CI for this estimate is wide although both ends are on the same direction of effect. Quality of evidence downgraded one level due to imprecision. | ||||||
| Chloral hydrate orally (50 mg/kg) compared to melatonin orally as sedating agents for neurodiagnostic procedures in children | ||||||
| Patient or population: children undergoing neurodiagnostic procedures | ||||||
| Outcomes | Anticipated absolute effects* (95% CI) | Relative effect | № of participants | Quality of the evidence | Comments | |
| Risk with melatonin | Risk with chloral hydrate | |||||
| Proportion of children who successfully completed neurodiagnostic procedure without interruption by the child awakening | ‐ | ‐ | ‐ | ‐ | ‐ | No study for this comparison assessed this outcome. |
| Proportion of children who required a further dose of either the same sedative agent or the addition of a different sedative agent | ‐ | ‐ | ‐ | ‐ | ‐ | No study for this comparison assessed this outcome. |
| Time to adequate sedation (minutes or as measured by specific validated scales such as the Ramsay Sedation Score) | ‐ | ‐ | ‐ | ‐ | ‐ | No study for this comparison assessed this outcome. |
| Proportion of children who had sedation failure or inadequate level of sedation | ‐ | ‐ | ‐ | ‐ | ‐ | No study for this comparison assessed this outcome. |
| EEG sedative‐induced artefact | Study population | RR 0.33 | 348 | ⊕⊕⊝⊝ | ||
| 103 per 1000 | 34 per 1000 | |||||
| Number of children with clinical adverse events (any) | Study population | RR 1.00 | 348 | ⊕⊕⊝⊝ | ||
| 23 per 1000 | 23 per 1000 | |||||
| *The risk in the intervention group (and its 95% confidence interval) is based on the assumed risk in the comparison group and the relative effect of the intervention (and its 95% CI). | ||||||
| GRADE Working Group grades of evidence | ||||||
| 1The single included study was judged to be at unclear risk of bias for random sequence generation, allocation concealment, and blinding of outcome assessors and high risk of bias for blinding of participants and personnel. Quality of evidence downgraded one level due to risk of bias. | ||||||
| Chloral hydrate orally (50 mg/kg + 50 mg/kg) compared to hydroxyzine hydrochloride orally (1 mg/kg + 1 mg/kg) as sedating agents for neurodiagnostic procedures in children | ||||||
| Patient or population: children undergoing neurodiagnostic procedures | ||||||
| Outcomes | Anticipated absolute effects* (95% CI) | Relative effect | № of participants | Quality of the evidence | Comments | |
| Risk with hydroxyzine hydrochloride | Risk with chloral hydrate | |||||
| Proportion of children who successfully completed neurodiagnostic procedure without interruption by the child awakening | ‐ | ‐ | ‐ | ‐ | ‐ | No study for this comparison assessed this outcome. |
| Proportion of children who required a further dose of either the same sedative agent or the addition of a different sedative agent | ‐ | ‐ | ‐ | ‐ | ‐ | No study for this comparison assessed this outcome. |
| TIme to adequate sedation (minutes or as measured by specific validated scales such as the Ramsay Sedation Score) | The time onset to adequate sedation was 23.7 minutes. | The mean time to adequate sedation in the intervention group was 7.5 minutes shorter (7.85 to 7.15 minutes shorter) | ‐ | 282 | ⊕⊕⊕⊝ | |
| Proportion of children who had sedation failure or inadequate level of sedation | Study population | RR 0.33 | 282 | ⊕⊕⊝⊝ | ||
| 85 per 1000 | 28 per 1000 | |||||
| Sedation duration (minutes) | The mean duration of sedation or sleep was 85.1 minutes. | The mean duration of sedation or sleep in the intervention group was 3.1 minutes longer (2.23 to 3.97 minutes longer) | ‐ | 282 | ⊕⊕⊕⊝ | |
| Number of children with clinical adverse event: behavioural change | Study population | RR 1.17 | 282 | ⊕⊕⊝⊝ | ||
| 43 per 1000 | 50 per 1000 | |||||
| Number of children with clinical adverse event: nausea or vomiting | Study population | RR 1.25 | 282 | ⊕⊕⊝⊝ | ||
| 28 per 1000 | 35 per 1000 | |||||
| *The risk in the intervention group (and its 95% confidence interval) is based on the assumed risk in the comparison group and the relative effect of the intervention (and its 95% CI). | ||||||
| GRADE Working Group grades of evidence | ||||||
| 1The single included study was judged to be at unclear risk of bias for random sequence generation, allocation concealment, blinding of participants and personnel, and blinding of outcome assessors. Quality of evidence downgraded one level due to risk of bias. | ||||||
| Chloral hydrate orally (70 mg/kg) compared to promethazine orally (1 mg/kg) as sedating agents for neurodiagnostic procedures in children | ||||||
| Patient or population: children undergoing neurodiagnostic procedures | ||||||
| Outcomes | Anticipated absolute effects* (95% CI) | Relative effect | № of participants | Quality of the evidence | Comments | |
| Risk with promethazine | Risk with chloral hydrate | |||||
| Proportion of children who successfully completed neurodiagnostic procedure without interruption by the child awakening | ‐ | ‐ | ‐ | ‐ | ‐ | No study for this comparison assessed this outcome. |
| Proportion of children who required a further dose of either the same sedative agent or the addition of a different sedative agent | ‐ | ‐ | ‐ | ‐ | ‐ | No study for this comparison assessed this outcome. |
| Time to adequate sedation (minutes or as measured by specific validated scales such as the Ramsay Sedation Score) | The mean time to adequate sedation was 33.84 minutes. | The mean time to adequate sedation in the intervention group was 12.11 minutes shorter (18.48 to 5.74 minutes shorter). | ‐ | 60 | ⊕⊕⊕⊝ | |
| Proportion of children with inadequate level of sedation (Ramsay score below 4) | Study population | RR 0.03 | 60 | ⊕⊕⊝⊝ | ||
| 567 per 1000 | 17 per 1000 | |||||
| Proportion of children who had sedation failure or inadequate level of sedation | Study population | RR 0.11 | 60 | ⊕⊕⊕⊝ | ||
| 300 per 1000 | 33 per 1000 | |||||
| Number of children with clinical adverse event: behavioural change | Study population | RR 0.20 | 60 | ⊕⊕⊕⊝ | ||
| 67 per 1000 | 13 per 1000 | |||||
| Number of children with clinical adverse event: vomiting or nausea | Study population | RR 13.00 | 60 | ⊕⊕⊝⊝ | ||
| 0 per 1000 | 0 per 1000 | |||||
| *The risk in the intervention group (and its 95% confidence interval) is based on the assumed risk in the comparison group and the relative effect of the intervention (and its 95% CI). | ||||||
| GRADE Working Group grades of evidence | ||||||
| 1The 95% CI for this estimate is wide but falls on the same direction of effect. Quality of evidence downgraded one level due to imprecision. | ||||||
| Chloral hydrate oral (60 mg/kg) compared to music therapy as sedating agents for neurodiagnostic procedures in children | ||||||
| Patient or population: children undergoing neurodiagnostic procedures | ||||||
| Outcomes | Anticipated absolute effects* (95% CI) | Relative effect | № of participants | Quality of the evidence | Comments | |
| Risk with music therapy | Risk with chloral hydrate | |||||
| Proportion of children who successfully completed neurodiagnostic procedure without interruption by the child awakening | ‐ | ‐ | ‐ | ‐ | ‐ | No study for this comparison assessed this outcome. |
| Proportion of children who required a further dose of either the same sedative agent or the addition of a different sedative agent | ‐ | ‐ | ‐ | ‐ | ‐ | No study for this comparison assessed this outcome. |
| Time to adequate sedation (minutes or as measured by specific validated scales such as the Ramsay Sedation Score) | The mean EEG time onset for adequate sedation was 23 minutes. | The mean EEG time onset for adequate sedation in the intervention group was 9 minutes more (2.15 fewer to 20.15 more). | ‐ | 58 | ⊕⊝⊝⊝ | |
| Proportion of children who had sedation failure or inadequate level of sedation | Study population | RR 17.00 | 58 | ⊕⊝⊝⊝ | ||
| 29 per 1000 | 500 per 1000 | |||||
| Sedation duration (minutes) | The mean EEG sedation/sleep duration was 66 minutes. | The mean EEG sedation/sleep duration in the intervention group was 160 minutes more (121.07 more to 198.93 more). | ‐ | 58 | ⊕⊝⊝⊝ | |
| Number of children with clinical adverse events (any) | ‐ | ‐ | ‐ | ‐ | ‐ | No study for this comparison assessed this outcome. |
| *The risk in the intervention group (and its 95% confidence interval) is based on the assumed risk in the comparison group and the relative effect of the intervention (and its 95% CI). | ||||||
| GRADE Working Group grades of evidence | ||||||
| 1Very serious concerns regarding the trial methodology led to a judgement of high risk of bias for selection bias (using alternation rather than true randomisation), performance and detection biases (non‐blinding of participants and care personnel as well as outcome assessors), and selective outcome reporting. Quality of evidence downgraded two levels due to risk of bias. | ||||||
| Comparison | Outcome | Study ID | Effect estimate | P value |
| Chloral hydrate versus melatonin | Sleep onset latency | Median (range) in minutes Chloral hydrate group (35 (10 to 150)), melatonin group (45 (5 to 210)) | 0.113 | |
| Sleep duration | Median (range) in minutes Chloral hydrate group (60 (15 to 240)), melatonin group (30 (15 to 240)) | 0.0001 | ||
| Drowsiness time | Median (range) in minutes Chloral hydrate group (60 (0 to 300)), melatonin group (20 (0 to 300)) | 0.0001 | ||
| Chloral hydrate versus midazolam | Sleep onset latency | Median (range) in minutes Chloral hydrate group (32 (20 to 95)), midazolam group (20 (0 to 300)) | < 0.001 | |
| Sleep duration | Median (range) in minutes Chloral hydrate group (66.5 (56 to 98)), midazolam group (25.5 (12 to 38)) | < 0.001 | ||
| Drowsiness time | Median (range) in minutes Chloral hydrate group (32 (21 to 36)), midazolam group (6 (2 to 9)) | < 0.001 | ||
| Chloral hydrate versus hydroxyzine | Time of sleep | Median (range) in minutes Chloral hydrate group (20 (5 to 120)), hydroxyzine group (30 (5 to 240)) | 0.309 | |
| Excessive fast activity | Percentage Chloral hydrate (24.5%) vs hydroxyzine (11.6%) | 0.02 | ||
| Success in falling asleep | Percentage Chloral hydrate (90.7%) vs hydroxyzine (89.6%) | 0.841 | ||
| Chloral hydrate versus intramuscular AMPS | Time to sedation | Mean (minutes) Chloral hydrate (55) vs AMPS (53) | N/A | |
| Imaging failure | Percentage Chloral hydrate (15%) vs AMPS (12%) | N/A | ||
| AMPS: atropine/meperidine/promethazine/secobarbital | ||||
| Outcome or subgroup title | No. of studies | No. of participants | Statistical method | Effect size |
| 1 EEG time onset for adequate sedation (minutes) Show forest plot | 1 | 160 | Mean Difference (IV, Fixed, 95% CI) | ‐3.86 [‐5.12, ‐2.60] |
| 1.1 high dose (100 mg/kg chloral hydrate vs 3ug/kg dexmetodimidine | 1 | 82 | Mean Difference (IV, Fixed, 95% CI) | ‐5.60 [‐7.33, ‐3.87] |
| 1.2 low dose (50mg/kg chloral hydrate vs 2ug/kg dexmetodimidine | 1 | 78 | Mean Difference (IV, Fixed, 95% CI) | ‐1.90 [‐3.74, ‐0.06] |
| 2 EEG sedation failure Show forest plot | 1 | 160 | Risk Ratio (M‐H, Fixed, 95% CI) | 1.14 [0.51, 2.53] |
| 2.1 high dose | 1 | 82 | Risk Ratio (M‐H, Fixed, 95% CI) | 0.70 [0.12, 3.97] |
| 2.2 low dose | 1 | 78 | Risk Ratio (M‐H, Fixed, 95% CI) | 1.33 [0.54, 3.32] |
| 3 EEG sedation / sleep duration (minutes) Show forest plot | 1 | 164 | Mean Difference (IV, Fixed, 95% CI) | 16.31 [9.15, 23.46] |
| 3.1 high dose | 1 | 82 | Mean Difference (IV, Fixed, 95% CI) | 21.70 [11.76, 31.64] |
| 3.2 low dose | 1 | 82 | Mean Difference (IV, Fixed, 95% CI) | 10.5 [0.19, 20.81] |
| 4 EEG sedation adverse event: total Show forest plot | 1 | 160 | Risk Ratio (M‐H, Fixed, 95% CI) | 7.66 [1.78, 32.91] |
| 4.1 high dose | 1 | 82 | Risk Ratio (M‐H, Fixed, 95% CI) | 10.5 [1.41, 78.33] |
| 4.2 low dose | 1 | 78 | Risk Ratio (M‐H, Fixed, 95% CI) | 4.67 [0.55, 39.89] |
| 5 EEG sedation adverse event: hypotension Show forest plot | 1 | 160 | Risk Ratio (M‐H, Fixed, 95% CI) | 0.35 [0.01, 8.34] |
| 5.1 high dose | 1 | 82 | Risk Ratio (M‐H, Fixed, 95% CI) | 0.35 [0.01, 8.34] |
| 5.2 low dose | 1 | 78 | Risk Ratio (M‐H, Fixed, 95% CI) | 0.0 [0.0, 0.0] |
| 6 EEG sedation adverse event: bradycardia Show forest plot | 1 | 160 | Risk Ratio (M‐H, Fixed, 95% CI) | 0.39 [0.02, 9.23] |
| 6.1 high dose | 1 | 82 | Risk Ratio (M‐H, Fixed, 95% CI) | 0.0 [0.0, 0.0] |
| 6.2 low dose | 1 | 78 | Risk Ratio (M‐H, Fixed, 95% CI) | 0.39 [0.02, 9.23] |
| 7 EEG sedation adverse event: behavioural change Show forest plot | 1 | 160 | Risk Ratio (M‐H, Fixed, 95% CI) | 5.24 [0.26, 105.97] |
| 7.1 high dose | 1 | 82 | Risk Ratio (M‐H, Fixed, 95% CI) | 5.24 [0.26, 105.97] |
| 7.2 low dose | 1 | 78 | Risk Ratio (M‐H, Fixed, 95% CI) | 0.0 [0.0, 0.0] |
| 8 EEG sedation adverse event: nausea or vomiting Show forest plot | 1 | 160 | Risk Ratio (M‐H, Fixed, 95% CI) | 12.04 [1.58, 91.96] |
| 8.1 high dose | 1 | 82 | Risk Ratio (M‐H, Fixed, 95% CI) | 15.73 [0.93, 266.73] |
| 8.2 low dose | 1 | 78 | Risk Ratio (M‐H, Fixed, 95% CI) | 8.14 [0.43, 152.41] |
| 9 EEG sedation adverse event: oxygen desaturation Show forest plot | 1 | 160 | Risk Ratio (M‐H, Fixed, 95% CI) | 3.31 [0.35, 31.16] |
| 9.1 high dose | 1 | 82 | Risk Ratio (M‐H, Fixed, 95% CI) | 3.15 [0.13, 75.05] |
| 9.2 low dose | 1 | 78 | Risk Ratio (M‐H, Fixed, 95% CI) | 3.49 [0.15, 83.03] |
| Outcome or subgroup title | No. of studies | No. of participants | Statistical method | Effect size |
| 1 Neuroimaging time onset for adequate sedation (minutes) Show forest plot | 1 | 70 | Mean Difference (IV, Fixed, 95% CI) | 19.0 [16.61, 21.39] |
| 2 Neuroimaging sedation failure after 2 administrations of sedative agent (same or different) Show forest plot | 1 | 70 | Risk Ratio (M‐H, Fixed, 95% CI) | 3.0 [0.33, 27.46] |
| 3 Neuroimaging sedation failure after 1 administration of sedative agent Show forest plot | 1 | 70 | Risk Ratio (M‐H, Fixed, 95% CI) | 4.33 [1.35, 13.89] |
| 4 Neuroimaging uninterpretable Show forest plot | 1 | 54 | Risk Ratio (M‐H, Fixed, 95% CI) | 0.23 [0.03, 1.94] |
| 5 Neuroimaging sedation adverse event: oxygen desaturation Show forest plot | 1 | 70 | Risk Ratio (M‐H, Fixed, 95% CI) | 0.67 [0.21, 2.16] |
| 6 Neuroimaging sedation adverse event: nausea or vomiting Show forest plot | 1 | 70 | Risk Ratio (M‐H, Fixed, 95% CI) | 6.0 [0.76, 47.29] |
| 7 Neuroimaging sedation adverse event: paradoxical reaction Show forest plot | 1 | 70 | Risk Ratio (M‐H, Fixed, 95% CI) | 0.09 [0.01, 1.58] |
| 8 Neuroimaging sedation adverse event: return to baseline activity postdischarge Show forest plot | 1 | 70 | Mean Difference (IV, Fixed, 95% CI) | ‐6.0 [‐11.43, ‐0.57] |
| Outcome or subgroup title | No. of studies | No. of participants | Statistical method | Effect size |
| 1 Neuroimaging time onset for adequate sedation (minutes) Show forest plot | 1 | 60 | Mean Difference (IV, Fixed, 95% CI) | 12.83 [7.22, 18.44] |
| 2 Neuroimaging inadequate level of sedation achieved (Ramsay score 4) Show forest plot | 1 | 60 | Risk Ratio (M‐H, Fixed, 95% CI) | 0.11 [0.03, 0.44] |
| 3 Neuroimaging sedation failure after 1 administration of sedative agent Show forest plot | 1 | 33 | Risk Ratio (M‐H, Fixed, 95% CI) | 0.17 [0.02, 1.12] |
| 4 Neuroimaging sedation / sleep duration (minutes) Show forest plot | 1 | 33 | Mean Difference (IV, Fixed, 95% CI) | 19.0 [‐3.40, 41.40] |
| 5 EEG sedative‐induced artefact Show forest plot | 1 | 198 | Risk Ratio (M‐H, Fixed, 95% CI) | 0.58 [0.44, 0.76] |
| 6 EEG sedation adverse event: total Show forest plot | 1 | 198 | Risk Ratio (M‐H, Fixed, 95% CI) | 0.20 [0.01, 4.20] |
| 7 Neuroimaging adverse event: behavioural change Show forest plot | 1 | 60 | Risk Ratio (M‐H, Fixed, 95% CI) | 0.33 [0.01, 7.87] |
| 8 Neuroimaging adverse event: vomiting Show forest plot | 2 | 93 | Risk Ratio (M‐H, Fixed, 95% CI) | 5.29 [0.84, 33.14] |
| 9 Neuroimaging sedation failure with intranasal midazolam Show forest plot | 1 | 60 | Risk Ratio (M‐H, Fixed, 95% CI) | 0.39 [0.19, 0.79] |
| 10 Neuroimaging sedation failure with oral midazolam Show forest plot | 1 | 33 | Risk Ratio (M‐H, Fixed, 95% CI) | 0.08 [0.01, 1.30] |
| Outcome or subgroup title | No. of studies | No. of participants | Statistical method | Effect size |
| 1 EEG sedative‐induced artefact Show forest plot | 1 | 348 | Risk Ratio (M‐H, Fixed, 95% CI) | 0.33 [0.14, 0.82] |
| 2 EEG sedation adverse event: total Show forest plot | 1 | 348 | Risk Ratio (M‐H, Fixed, 95% CI) | 1.0 [0.25, 3.93] |
| Outcome or subgroup title | No. of studies | No. of participants | Statistical method | Effect size |
| 1 EEG time onset for adequate sedation (minutes) Show forest plot | 1 | 282 | Mean Difference (IV, Fixed, 95% CI) | ‐7.5 [‐7.85, ‐7.15] |
| 2 EEG sedation failure Show forest plot | 1 | 282 | Risk Ratio (M‐H, Fixed, 95% CI) | 0.33 [0.11, 1.01] |
| 3 EEG sedation / sleep duration (minutes) Show forest plot | 1 | 282 | Mean Difference (IV, Fixed, 95% CI) | 3.10 [2.23, 3.97] |
| 4 EEG sedative‐induced artefact Show forest plot | 1 | 282 | Risk Ratio (M‐H, Fixed, 95% CI) | 1.33 [0.47, 3.74] |
| 5 EEG sedation adverse event: behavioural change Show forest plot | 1 | 282 | Risk Ratio (M‐H, Fixed, 95% CI) | 1.17 [0.40, 3.38] |
| 6 EEG sedation adverse event: nausea or vomiting Show forest plot | 1 | 282 | Risk Ratio (M‐H, Fixed, 95% CI) | 1.25 [0.34, 4.56] |
| 7 EEG failure after 1 administration of sedative agent Show forest plot | 1 | 282 | Risk Ratio (M‐H, Fixed, 95% CI) | 0.5 [0.18, 1.43] |
| Outcome or subgroup title | No. of studies | No. of participants | Statistical method | Effect size |
| 1 EEG time for adequate sedation (minutes) Show forest plot | 1 | 60 | Mean Difference (IV, Fixed, 95% CI) | ‐12.11 [‐18.48, ‐5.74] |
| 2 EEG inadequate level of EEG sedation achieved (Ramsay score 4) Show forest plot | 1 | 60 | Risk Ratio (M‐H, Fixed, 95% CI) | 0.03 [0.00, 0.45] |
| 3 EEG sedation failure Show forest plot | 1 | 60 | Risk Ratio (M‐H, Fixed, 95% CI) | 0.11 [0.01, 0.82] |
| 4 EEG sedation adverse event: behavioural change Show forest plot | 1 | 60 | Risk Ratio (M‐H, Fixed, 95% CI) | 0.2 [0.01, 4.00] |
| 5 EEG sedation adverse event: vomiting or nausea Show forest plot | 1 | 60 | Risk Ratio (M‐H, Fixed, 95% CI) | 13.0 [0.76, 220.96] |
| 6 EEG Ramsay Sedation Score after 1 administration of sedative agent Show forest plot | 1 | 60 | Mean Difference (IV, Fixed, 95% CI) | 1.53 [1.00, 2.06] |
| Outcome or subgroup title | No. of studies | No. of participants | Statistical method | Effect size |
| 1 EEG time onset for adequate sedation (minutes) Show forest plot | 1 | 58 | Mean Difference (IV, Fixed, 95% CI) | 9.0 [‐2.15, 20.15] |
| 2 EEG sedation failure Show forest plot | 1 | 58 | Risk Ratio (M‐H, Fixed, 95% CI) | 17.0 [2.37, 122.14] |
| 3 EEG sedation / sleep duration (minutes) Show forest plot | 1 | 58 | Mean Difference (IV, Fixed, 95% CI) | 160.0 [121.07, 198.93] |
| Outcome or subgroup title | No. of studies | No. of participants | Statistical method | Effect size |
| 1 EEG time onset for adequate sedation (minutes) Show forest plot | 1 | 59 | Mean Difference (IV, Fixed, 95% CI) | ‐95.7 [‐114.51, ‐76.89] |
| 2 EEG sedation/ sleep duration (minutes) Show forest plot | 1 | 59 | Mean Difference (IV, Fixed, 95% CI) | 15.1 [3.35, 26.85] |
| 3 EEG sedative‐induced artefact Show forest plot | 1 | 53 | Risk Ratio (M‐H, Fixed, 95% CI) | 1.25 [0.73, 2.12] |
| Outcome or subgroup title | No. of studies | No. of participants | Statistical method | Effect size |
| 1 Neuroimaging time onset for adequate sedation (minutes) Show forest plot | 1 | 97 | Mean Difference (IV, Fixed, 95% CI) | ‐7.0 [‐7.62, ‐6.38] |
| 2 Neuroimaging sedation failure after 1 administration of sedative agent Show forest plot | 1 | 97 | Risk Ratio (M‐H, Fixed, 95% CI) | 0.46 [0.19, 1.09] |
| 3 Neuroimaging sedation / sleep duration (minutes) Show forest plot | 1 | 97 | Mean Difference (IV, Fixed, 95% CI) | 8.0 [5.81, 10.19] |
| 4 Neuroimaging sedation adverse event: total Show forest plot | 1 | 97 | Risk Ratio (M‐H, Fixed, 95% CI) | 1.06 [0.49, 2.32] |
| Outcome or subgroup title | No. of studies | No. of participants | Statistical method | Effect size |
| 1 EEG time onset for adequate sedation (minutes) Show forest plot | 1 | 76 | Mean Difference (IV, Fixed, 95% CI) | ‐5.10 [‐7.05, ‐3.15] |
| 2 EEG sedation failure Show forest plot | 1 | 76 | Risk Ratio (M‐H, Fixed, 95% CI) | 0.23 [0.05, 0.99] |
| 3 EEG sedation/sleep duration (minutes) Show forest plot | 1 | 76 | Mean Difference (IV, Fixed, 95% CI) | 17.80 [8.50, 27.10] |
| 4 EEG sedation adverse event: total Show forest plot | 1 | 76 | Risk Ratio (M‐H, Fixed, 95% CI) | 2.25 [0.77, 6.55] |
| 5 EEG sedation adverse event: behavioural change Show forest plot | 1 | 76 | Risk Ratio (M‐H, Fixed, 95% CI) | 4.51 [0.22, 90.96] |
| 6 EEG sedation adverse event: nausea or vomiting Show forest plot | 1 | 76 | Risk Ratio (M‐H, Fixed, 95% CI) | 2.1 [0.59, 7.52] |
| 7 EEG sedation adverse event: oxygen desaturation Show forest plot | 1 | 76 | Risk Ratio (M‐H, Fixed, 95% CI) | 0.9 [0.06, 13.87] |