Genom‐basierter nicht‐invasiver Pränataltest (gNIPT) bei Schwangeren zur Bestimmung von fetalen chromosomalen Aneuploidien
Abstract
Background
Common fetal aneuploidies include Down syndrome (trisomy 21 or T21), Edward syndrome (trisomy 18 or T18), Patau syndrome (trisomy 13 or T13), Turner syndrome (45,X), Klinefelter syndrome (47,XXY), Triple X syndrome (47,XXX) and 47,XYY syndrome (47,XYY). Prenatal screening for fetal aneuploidies is standard care in many countries, but current biochemical and ultrasound tests have high false negative and false positive rates. The discovery of fetal circulating cell‐free DNA (ccfDNA) in maternal blood offers the potential for genomics‐based non‐invasive prenatal testing (gNIPT) as a more accurate screening method. Two approaches used for gNIPT are massively parallel shotgun sequencing (MPSS) and targeted massively parallel sequencing (TMPS).
Objectives
To evaluate and compare the diagnostic accuracy of MPSS and TMPS for gNIPT as a first‐tier test in unselected populations of pregnant women undergoing aneuploidy screening or as a second‐tier test in pregnant women considered to be high risk after first‐tier screening for common fetal aneuploidies. The gNIPT results were confirmed by a reference standard such as fetal karyotype or neonatal clinical examination.
Search methods
We searched 13 databases (including MEDLINE, Embase and Web of Science) from 1 January 2007 to 12 July 2016 without any language, search filter or publication type restrictions. We also screened reference lists of relevant full‐text articles, websites of private prenatal diagnosis companies and conference abstracts.
Selection criteria
Studies could include pregnant women of any age, ethnicity and gestational age with singleton or multifetal pregnancy. The women must have had a screening test for fetal aneuploidy by MPSS or TMPS and a reference standard such as fetal karyotype or medical records from birth.
Data collection and analysis
Two review authors independently carried out study selection, data extraction and quality assessment (using the QUADAS‐2 tool). Where possible, hierarchical models or simpler alternatives were used for meta‐analysis.
Main results
Sixty‐five studies of 86,139 pregnant women (3141 aneuploids and 82,998 euploids) were included. No study was judged to be at low risk of bias across the four domains of the QUADAS‐2 tool but applicability concerns were generally low. Of the 65 studies, 42 enrolled pregnant women at high risk, five recruited an unselected population and 18 recruited cohorts with a mix of prior risk of fetal aneuploidy. Among the 65 studies, 44 evaluated MPSS and 21 evaluated TMPS; of these, five studies also compared gNIPT with a traditional screening test (biochemical, ultrasound or both). Forty‐six out of 65 studies (71%) reported gNIPT assay failure rate, which ranged between 0% and 25% for MPSS, and between 0.8% and 7.5% for TMPS.
In the population of unselected pregnant women, MPSS was evaluated by only one study; the study assessed T21, T18 and T13. TMPS was assessed for T21 in four studies involving unselected cohorts; three of the studies also assessed T18 and 13. In pooled analyses (88 T21 cases, 22 T18 cases, eight T13 cases and 20,649 unaffected pregnancies (non T21, T18 and T13)), the clinical sensitivity (95% confidence interval (CI)) of TMPS was 99.2% (78.2% to 100%), 90.9% (70.0% to 97.7%) and 65.1% (9.16% to 97.2%) for T21, T18 and T13, respectively. The corresponding clinical specificity was above 99.9% for T21, T18 and T13.
In high‐risk populations, MPSS was assessed for T21, T18, T13 and 45,X in 30, 28, 20 and 12 studies, respectively. In pooled analyses (1048 T21 cases, 332 T18 cases, 128 T13 cases and 15,797 unaffected pregnancies), the clinical sensitivity (95% confidence interval (CI)) of MPSS was 99.7% (98.0% to 100%), 97.8% (92.5% to 99.4%), 95.8% (86.1% to 98.9%) and 91.7% (78.3% to 97.1%) for T21, T18, T13 and 45,X, respectively. The corresponding clinical specificities (95% CI) were 99.9% (99.8% to 100%), 99.9% (99.8% to 100%), 99.8% (99.8% to 99.9%) and 99.6% (98.9% to 99.8%). In this risk group, TMPS was assessed for T21, T18, T13 and 45,X in six, five, two and four studies. In pooled analyses (246 T21 cases, 112 T18 cases, 20 T13 cases and 4282 unaffected pregnancies), the clinical sensitivity (95% CI) of TMPS was 99.2% (96.8% to 99.8%), 98.2% (93.1% to 99.6%), 100% (83.9% to 100%) and 92.4% (84.1% to 96.5%) for T21, T18, T13 and 45,X respectively. The clinical specificities were above 100% for T21, T18 and T13 and 99.8% (98.3% to 100%) for 45,X. Indirect comparisons of MPSS and TMPS for T21, T18 and 45,X showed no statistical difference in clinical sensitivity, clinical specificity or both. Due to limited data, comparative meta‐analysis of MPSS and TMPS was not possible for T13.
We were unable to perform meta‐analyses of gNIPT for 47,XXX, 47,XXY and 47,XYY because there were very few or no studies in one or more risk groups.
Authors' conclusions
These results show that MPSS and TMPS perform similarly in terms of clinical sensitivity and specificity for the detection of fetal T31, T18, T13 and sex chromosome aneuploidy (SCA). However, no study compared the two approaches head‐to‐head in the same cohort of patients. The accuracy of gNIPT as a prenatal screening test has been mainly evaluated as a second‐tier screening test to identify pregnancies at very low risk of fetal aneuploidies (T21, T18 and T13), thus avoiding invasive procedures. Genomics‐based non‐invasive prenatal testing methods appear to be sensitive and highly specific for detection of fetal trisomies 21, 18 and 13 in high‐risk populations. There is paucity of data on the accuracy of gNIPT as a first‐tier aneuploidy screening test in a population of unselected pregnant women. With respect to the replacement of invasive tests, the performance of gNIPT observed in this review is not sufficient to replace current invasive diagnostic tests.
We conclude that given the current data on the performance of gNIPT, invasive fetal karyotyping is still the required diagnostic approach to confirm the presence of a chromosomal abnormality prior to making irreversible decisions relative to the pregnancy outcome. However, most of the gNIPT studies were prone to bias, especially in terms of the selection of participants.
Laienverständliche Zusammenfassung
Genauigkeit des Genom‐basierten nicht‐invasiven Pränataltests (gNIPT) zur Erkennung von genetischen Anomalien bei Ungeborenen
Worum geht es?
Wie genau ist der neue Test (Genom‐basierter nicht‐invasiver Pränataltest (gNIPT)), um anhand des im Blut der Mutter gefundenen genetischen Materials (DNA) eines Ungeborenen eine abweichende Anzahl an Chromosomen zu bestimmen? Wir haben die Genauigkeit zur Erkennung des Down‐Syndroms (Trisomie 21), Edward‐Syndroms (Trisomie 18), Patau‐Syndroms (Trisomie 13), Turner‐Syndroms (45,X), Klinefelter‐Syndroms (47, XXY), Triple‐X‐Syndroms (47, XXX) und 47, XYY‐Syndroms untersucht. Zurzeit werden verschiedene Methoden für den gNIPT verwendet. Wir haben MPSS (massively parallel shotgun sequencing), welche die ganze DNA testet, und TMPS (targeted massively parallel sequencing), welche nur bestimmte Teile der DNA testet, untersucht.
Hintergrund
Menschen besitzen 46 Chromosomen (23 Paare). Abweichungen in der Anzahl der Chromosomen können unheilbare genetische Erkrankungen auslösen. Das Vorliegen eines überzähligen Chromosoms nennt sich Trisomie und eine abweichende Anzahl an Geschlechtschromosomen (zu viele oder zu wenige) heißt Geschlechtschromosomenanomalie. Die am häufigsten auftretende Trisomie ist das Down‐Syndrom, das ungefähr eines von 1000 Kindern betrifft. Kinder mit Down‐Syndrom wachsen langsamer, weisen charakteristische Gesichtszüge und eine leichte bis mittlere geistige Behinderung auf, weshalb einige Kinder später spezielle Förderung benötigen. Die Symptome variieren jedoch von mild bis schwerwiegend, sodass einige Kinder ein relativ normales Leben führen können. Andere Formen von Trisomie und Geschlechtschromosomenanomalie rufen unterschiedliche Grade an Behinderung hervor. Die Wahrscheinlichkeit, dass ein Kind davon betroffen ist, ist aber viel geringer.
Derzeitige Tests zur Pränataldiagnostik dieser Erkrankungen benötigen bei positivem Resultat eine Bestätigung, ob das Ungeborene betroffen ist oder nicht. Dazu wird ein invasiver Test wie die Amniozentese durchgeführt. Bei der Amniozentese werden fetale Zellen aus dem Fruchtwasser, welches das Ungeborene umgibt, mithilfe einer dünnen Nadel, die durch die Bauchwand der Mutter eingeführt wird, entnommen. Alternativ kann Gewebe von der Plazenta entnommen werden (Chorionzottenbiopsie). Diese invasiven Tests bergen ein höheres Risiko für Fehl‐ oder Frühgeburten, auch wenn das Ungeborene nicht von Down‐Syndrom betroffen ist. Deshalb werden diese invasiven Tests nur Schwangeren vorgeschlagen, bei denen eine höhere Wahrscheinlichkeit besteht, dass ihr Ungeborenes betroffen sein könnte.
Was wir getan haben
Uns interessierten Studien mit Frauen jeden Alters, jeder Ethnie und in jeder Schwangerschaftswoche, die einzelne Kinder oder Mehrlinge austragen. Wir suchten nach Studien (bis Juli 2016), welche die Genauigkeit des neuen Tests untersuchten.
Ergebnisse
Wir haben 65 Studien mit insgesamt 86.139 Schwangeren mit 3.141 betroffenen Schwangerschaften gefunden. An 42 Studien (65%) nahmen Schwangere mit einem hohen Risiko für Kinder mit einer abweichenden Chromosomenanzahl teil. Achtundvierzig Studien (74%) untersuchten Frauen mit Einlingsschwangerschaften. In 44 Studien (68%) wurde MPS und in 21 Studien (32%) TMPS eingesetzt.
Die Früherkennung mittels gNIPT scheint bei Ungeborenen (Einlinge wie Mehrlinge) genau zu sein, insbesondere bei der Erkennung von Down‐Syndrom, Trisomie 18 und Trisomie 13. Es gab jedoch einige Probleme mit der Art und Weise, wie die Studien durchgeführt wurden; deshalb beurteilen wir unsere Ergebnisse mit Vorsicht. Dies könnte dazu führen, dass es erscheint, der gNIPT würde bessere Resultate erzielen, als es tatsächlich der Fall ist.
Weitere wichtige Informationen, die zu berücksichtigen sind
Die gNIPT‐Methode scheint eine von der Norm abweichende Chromosomenanzahl bei Ungeborenen zuverlässig zu identifizieren. Doch wenn ein gNIPT eine Abweichung von der normalen Chromosomenanzahl feststellt, ist trotzdem ein invasiver Test (z.B. Amniozentese oder Chorionzottenbiopsie) zur Bestätigung notwendig, bevor Entscheidungen in Bezug auf die Schwangerschaft getroffen werden können.
Es ist wichtig, dass Schwangere umfänglich über mögliche Gesundheitsprobleme informiert werden, die für das Kind durch ein zusätzliches Chromosom entstehen könnten. Beispielsweise leiden einige Kinder mit Down‐Syndrom an beträchtlichen Behinderungen, während andere ein relativ normales Leben führen. Die meisten Studien in diesem Review beziehen sich zudem auf Schwangere, deren Ungeborene eine höhere Wahrscheinlichkeit für eine abweichende Chromosomenanzahl besitzen. Daher lassen sich unsere Ergebnisse nicht direkt auf alle Schwangeren übertragen.
Authors' conclusions
Summary of findings
| Summary characteristics of included studies | |
| Review question | What is the diagnostic accuracy of massively parallel shotgun sequencing (MPSS) and targeted massively parallel sequencing (TMPS) using circulating cell‐free DNA (ccfDNA) in maternal blood for the detection of common fetal aneuploidies (T21, T18, T13, 45,X, 47,XXY, 47,XXX and 47,XYY) in pregnant women according to their prior risk of fetal aneuploidy? |
| Importance (rationale) | These new genomics‐based non‐invasive prenatal testing (gNIPT) approach report higher sensitivity and lower false positive rate than traditional screening tests. gNIPT is already advertised and marketed. How gNIPT should be used in clinical practice should be assessed in order to provide a framework for its use. |
| Study design | There were 40 prospective cohort studies, 8 retrospective cohort studies, 16 case‐control studies and 1 prospective and retrospective cohort study. |
| Population | Pregnant women of any age, ethnicity and gestational age, with singleton or multifetal pregnancy who had a screening test for fetal aneuploidy using gNIPT and received a reference standard. 42 studies enrolled pregnant women selected at high risk of fetal aneuploidy, 5 enrolled unselected pregnant women undergoing aneuploidy screening and 18 enrolled pregnant women from a mixed‐risk population of fetal aneuploidy. 48 studies included only women with singleton pregnancy, 5 included only multifetal pregnancies, 4 included either type of pregnancy and 8 did not report type of pregnancy. 10 studies included only women in the first trimester (15 weeks or less), 21 studies included women in the first 2 trimesters (29 weeks or less), 24 studies included women in the 3 trimesters (42 weeks or less) and 10 studies (15%) did not report gestational age. |
| Index tests | gNIPT by MPSS (44 studies) or TMPS (21 studies), including 5 studies that compared a gNIPT with a traditional screening test. 37 studies were industry‐funded or were written by 1 or more authors affiliated with a company who sells gNIPT. 22 studies were not reported to be funded by industry but samples were sequenced and analysed by a commercial laboratory. 3 studies had no links with industry. |
| Target conditions | 36 studies reported results for only autosomes (T21, T18, T13), 4 for only SCA (45,X, 47,XXY, 47,XXX and 47,XYY), and 25 for both autosomes and SCA. |
| Reference standard | Fetal karyotyping performed on cells obtained from chorionic villi sampling, amniotic fluid, placental tissue, a fetus lost by miscarriage or other equivalent and recognised methods on the same materials for autosomes and SCA. If fetal karyotyping was not performed, we used neonatal clinical examination or medical records from birth (for autosomes only). Only 1 reference standard was used for all pregnant women included in 36 studies while multiple reference standards were used in 29 studies. |
| Risk of bias | The QUality Assessment of Diagnostic Accuracy Studies (QUADAS‐2) tool was used to assess the methodological quality of included studies. No study was assessed as being at low risk of bias across all domains. For the patient selection domain, no study was assessed as being at low risk of bias. For the index test, reference standard and flow and timing domains, the risk of bias was low for 94%, 77% and 23% of studies, respectively. |
| Applicability concerns | Applicability was of low concern for all studies in the index test and reference standard domains because the studies matched the review question. In the patient selection domain, 47 (71%) studies were judged to be of low applicability concern because they included pregnant women matching the review question. |
| 45,X: Turner syndrome, 47,XXX: triple X syndrome, 47,XXY: Klinefelter syndrome, MPSS: massively parallel shotgun sequencing, TMPS: targeted massively parallel sequencing, T21: trisomy 21, T18: trisomy 18, T13: trisomy 13. | |
| Performance of gNIPT for detection of T21 | |||||||
| Test strategy | Number of studies | Number of affected pregnancies (Number of unaffected pregnancies)a | Sensitivity % (95% CI) | Specificity % (95% CI) | Median prevalenceb % (range) | Missed cases (FN)c | False positives (FP)d |
| Unselected pregnant women | |||||||
| MPSS | 1 | 8 (1733) | 100 (67.6 to 100) | 100 (99.8 to 100) | 0.46 (0.24 to 5.21) | 0 | 0 |
| TMPS | 4 | 88 (20,679) | 99.2 (78.2 to 100) | 100 (> 99.9 to 100) | 4 | 0 | |
| Traditional screening teste | 1 | 38 (15,803) | 78.9 (63.7 to 88.9) | 94.6 (94.2 to 94.9) | 97 | 5375 | |
| Implications |
| ||||||
| Selected high‐risk pregnant women | |||||||
| MPSS | 30 | 1048 (15,937) | 99.7 (98.0 to 100) | 99.9 (99.8 to 100) | 4.95 (0.44 to 27.66) | 15 | 95 |
| TMPS | 6 | 246 (4380) | 99.2 (96.8 to 99.8) | 100 (99.8 to 100) | 40 | 0 | |
| Difference between MPSS and TMPS | 0.53 (‐0.73 to 1.78) | ‐0.03 (‐0.11 to 0.04) | NA | ||||
| Implications |
| ||||||
| MPSS: massively parallel shotgun sequencing, NA; not applicable, TMPS: targeted massively parallel sequencing, T21: trisomy 21. aUnaffected pregnancies: we included patients with any other aneuploidy than the one under analysis with all euploid cases as "unaffected" pregnancies. bThe median prevalence and range were calculated by using all prospective or retrospective studies for each category considered. cMissed cases per 100,000 tested. FN: false negatives. dFalse positives per 100,000 tested. A false positive result may lead to unnecessary invasive tests depending on choices by the pregnant woman. eTraditional screening tests are first‐trimester combined test, second‐trimester quadruple test, second‐trimester fully integrated test, second‐trimester sequential test or second‐trimester triple test. | |||||||
| Performance of gNIPT for detection of T18 | |||||||
| Test strategy | Number of studies | Number of affected pregnancies (Number of unaffected pregnancies)a | Sensitivity % (95% CI) | Specificity % (95% CI) | Median prevalenceb % (range) | Missed cases (FN)c | False positives (FP)d |
| Unselected pregnant women | |||||||
| MPSS | 1 | 2 (1739) | 100 (34.3 to 100) | 99.9 (99.7 to 100) | 0.11 (0.06 to 0.36) | 0 | 100 |
| TMPS | 3 | 22 (20,553) | 90.9 (70.0 to 97.7) | 100 (99.9 to 100) | 10 | 0 | |
| Traditional screening teste | 1 | 10 (15,831) | 80.0 (49.0 to 94.3) | 99.7 (99.6 to 99.8) | 22 | 300 | |
| Implications |
| ||||||
| Selected high‐risk pregnant women | |||||||
| MPSS | 28 | 332 (16,180) | 97.8 (92.5 to 99.4) | 99.9 (99.8 to 100) | 1.46 (0.22 to 17.02) | 32 | 99 |
| TMPS | 5 | 112 (4010) | 98.2 (93.1 to 99.6) | 100 (99.8 to 100) | 26 | 0 | |
| Difference between MPSS and TMPS | ‐0.41 (‐4.11 to 3.28) | ‐0.06 (‐0.14 to 0.03) | NA | ||||
| Implications |
| ||||||
| MPSS: massively parallel shotgun sequencing, NA: not applicable, TMPS: targeted massively parallel sequencing, T18: trisomy 18. aUnaffected pregnancies: we included patients with any other aneuploidy than the one under analysis with all euploid cases as "unaffected" pregnancies. bThe median prevalence and range were calculated by using all prospective or retrospective studies for each category considered. cMissed cases per 100,000 tested. FN: false negatives. dFalse positives per 100,000 tested. A false positive result may lead to unnecessary invasive tests depending on choices by the pregnant woman. eTraditional screening tests are first‐trimester combined test, second‐trimester quadruple test, second‐trimester fully integrated test, second‐trimester sequential test or second‐trimester triple test. | |||||||
| Performance of gNIPT for detection of T13 | |||||||
| Test strategy | Number of studies | Number of affected pregnancies (Number of unaffected pregnancies)a | Sensitivity % (95% CI) | Specificity % (95% CI) | Median prevalenceb % (range) | Missed cases (FN)c | False positives (FP)d |
| Unselected pregnant women | |||||||
| MPSS | 1 | 1 (1740) | 100 (20.7 to 100) | 100 (99.8 to 100) | 0. 12 (0.01 to 0.52) | 0 | 0 |
| TMPS | 3 | 8 (14,154) | 65.1 (9.16 to 97.2) | 100 (99.9 to 100) | 41 | 0 | |
| Traditional screening teste | 1 | 2 (11,183) | 50.0 (9.45 to 90.5) | 99.7 (99.6 to 99.8) | 59 | 300 | |
| Implications |
| ||||||
| Selected high‐risk pregnant women | |||||||
| MPSS | 20 | 128 (13,810) | 95.8 (86.1 to 98.9) | 99.8 (99.8 to 99.9) | 1.09 (0.04 to 3.54) | 46 | 198 |
| TMPS | 2 | 20 (293) | 100 (83.9 to 100)f | 100 (98.7 to 100)f | 0 | 0 | |
| Implications |
| ||||||
| MPSS: massively parallel shotgun sequencing, NA: not applicable, TMPS: targeted massively parallel sequencing, T13: trisomy 13. aUnaffected pregnancies: we included patients with any other aneuploidy than the one under analysis with all euploid cases as "unaffected" pregnancies. bThe median prevalence and range were calculated by using all prospective or retrospective studies for each category considered. cMissed cases per 100,000 tested. FN: false negatives. dFalse positives per 100,000 tested. A false positive result may lead to unnecessary invasive tests depending on choices by the pregnant woman. eTraditional screening tests are first‐trimester combined test, second‐trimester quadruple test, second‐trimester fully integrated test, second‐trimester sequential test or second‐trimester triple test. fSimple pooling used to obtain summary estimates of sensitivity, specificity or both. | |||||||
| Performance of gNIPT for detection of 45,X | |||||||
| Test strategy | Number of studies | Number of affected pregnancies (Number of unaffected pregnancies)a | Sensitivity % (95% CI) | Specificity % (95% CI) | Median prevalenceb % (range) | Missed cases (FN)c | False positives (FP)d |
| Selected high‐risk pregnant women | |||||||
| MPSS | 12 | 119 (7440) | 91.7 (78.3 to 97.1) | 99.6 (98.9 to 99.8) | 1.04 (0.27 to 18.58) | 86 | 396 |
| TMPS | 4 | 79 (985) | 92.4 (84.1 to 96.5) | 99.8 (98.3 to 100) | 79 | 198 | |
| Difference between MPSS and TMPS | ‐0.74 (‐11.1 to 9.60) | ‐0.23 (‐0.82 to 0.36) | NA | ||||
| Implications |
| ||||||
| 45,X: Turner syndrome, MPSS: massively parallel shotgun sequencing, NA: not applicable, TMPS: targeted massively parallel sequencing. aUnaffected pregnancies: we included patients with any other aneuploidy than the one under analysis with all euploid cases as "unaffected" pregnancies. bThe median prevalence and range were calculated by using all prospective or retrospective studies for each category considered. cMissed cases per 100,000 tested. FN: false negatives. dFalse positives per 100,000 tested. A false positive result may lead to unnecessary invasive tests depending on choices by the pregnant woman. | |||||||
| Performance of gNIPT for detection of autosomes aneuploidies (T21, T18 and T13 combined) | |||||||
| Test strategy | Number of studies | Number of affected pregnancies (Number of unaffected pregnancies)a | Sensitivity % (95% CI) | Specificity % (95% CI) | Median prevalenceb % (range) | Missed cases (FN)c | False positives (FP)d |
| Unselected pregnant women | |||||||
| MPSS | 1 | 11 (1730) | 100 (74.1 to 100) | 99.9 (99.7 to 100) | 0,63 (0.32 to 5.73) | 0 | 99 |
| TMPS | 4 | 118 (20,649) | 94.9 (89.1 to 97.7) | 99.9 (99.8 to 99.9) | 32 | 99 | |
| Traditional screening teste | 4 | 120 (22,247) | NDf | ND | |||
| Implications |
| ||||||
| Selected high‐risk pregnant women | |||||||
| MPSS | 32 | 1508 (15,797) | 98.8 (97.2 to 99.5) | 99.9 (99.7 to 100) | 5.85 (0.67 to 46.81) | 70 | 94 |
| TMPS | 7 | 378 (4282) | 98.9 (97.2 to 99.6) | 99.9 (99.8 to 100) | 64 | 94 | |
| Difference between MPSS and TMPS | ‐0.11 (‐1.58 to 1.35) | ‐0.08 (‐0.22 to 0.07) | NA | ||||
| Implications |
| ||||||
| MPSS: massively parallel shotgun sequencing, NA: not applicable, ND: no data available, TMPS: targeted massively parallel sequencing, T13: trisomy 13, T18: trisomy 18, T21: trisomy 21. aUnaffected pregnancies: we included patients with any other aneuploidy than the one under analysis with all euploid cases as "unaffected" pregnancies. bThe median prevalence and range were calculated by using all prospective or retrospective studies for each category considered. cMissed cases per 100,000 tested. FN: false negatives. dFalse positives per 100,000 tested. A false positive result may lead to unnecessary invasive tests depending on choices by the pregnant woman. eTraditional screening tests are first‐trimester combined test, second‐trimester quadruple test, second‐trimester fully integrated test, second‐trimester sequential test or second‐trimester triple test. fSummary sensitivity and specificity were not obtained for traditional screening tests because the four studies used different cut‐offs to determine test positivity. Three of the four studies compared TMPS and traditional screening tests in the same population (direct comparison). | |||||||
| Performance of gNIPT for detection of sex chromosome aneuploidies (45,X, 47,XXX, 47,XXY and 47,XYY combined) | |||||||
| Test strategy | Number of studies | Number of affected pregnancies (Number of unaffected pregnancies)b | Sensitivity % (95% CI) | Specificity % (95% CI) | Median prevalencec % (range) | Missed cases (FN)d | False positives (FP)e |
| Selected high‐risk pregnant women | |||||||
| MPSS | 12 | 151 (7452) | 91.9 (73.8 to 97.9) | 99.5 (98.8 to 99.8) | 1.53 (0.45 to 18.58) | 124 | 492 |
| TMPS | 4 | 96 (968) | 93.8 (86.8 to 97.2) | 99.6 (98.1 to 99.9) | 95 | 394 | |
| Difference between MPSS and TMPS | ‐1.85 (‐13.3 to 9.60) | ‐0.06 (‐0.82 to 0.71) | NA | ||||
| Implications |
| ||||||
| 45,X: Turner syndrome, 47,XXX: triple X syndrome, 47,XXY: Klinefelter syndrome, MPSS: massively parallel shotgun sequencing, NA: not applicable, ND: no data available, TMPS: targeted massively parallel sequencing aWe did not assess the accuracy of gNIPT individually for 47,XXX, 47,XXY and 47,XYY due to paucity data. bUnaffected pregnancies: we included patients with any other aneuploidy than the one under analysis with all euploid cases as "unaffected" pregnancies. cThe median prevalence and range were calculated by using all prospective or retrospective studies for each category considered. dMissed cases per 100,000 tested. FN: false negatives. eFalse positives per 100,000 tested. A false positive result may lead to unnecessary invasive tests depending on choices by the pregnant woman. | |||||||
Background
Aneuploidies[1] are chromosomal abnormalities characterised by a different (additional or missing) number of chromosomes than the 23 pairs normally present in humans. These chromosomal anomalies are among the most common types of genetic disorders and they represent a significant cause of both childhood and adulthood morbidity or death. In addition, they may lead to perinatal complications (Wellesley 2012; Wu 2013a). The severity of associated symptoms is often variable and typically less severe in mosaic cases (not all cells affected) (Fishler 1991; Modi 2003; Zhu 2013). Although offering prenatal screening for fetal aneuploidies such as Down syndrome is now considered standard of care in routine antenatal care in most upper‐middle and high‐income countries, prenatal screening methods and strategies are evolving. Prenatal screening consists of blood‐based biochemical testing or ultrasound measurements or a combination of both, in addition to maternal age (Alldred 2012). Because of the serious health consequences of various aneuploidies and given their incurable nature, prenatal screening is an option available to pregnant women. An invasive diagnostic test (e.g. amniocentesis) is offered to pregnant women found to be at high risk of fetal aneuploidy after prenatal screening, but there is a procedure‐related risk of miscarriage. The discovery of circulating cell‐free DNA (ccfDNA) in maternal blood has enabled the development of genomics‐based non‐invasive prenatal testing (gNIPT) to analyse the fetal genome. Prenatal screening, and ultimately prenatal diagnosis, provides couples with the information necessary for taking informed decisions (the optimisation of medical intervention and psychological counselling for managing the identified condition or pregnancy termination). The decision to terminate pregnancy among women who received a positive diagnosis of fetal aneuploidy during the prenatal period varies between 86% and 97% (Choi 2012; Irving 2011). Many factors, such as religion, maternal age, gestational age at the time of diagnosis, number of existing children, past history of induced abortion and psychosocial factors (perceived parenting burden/reward, quality of life of a child with a chromosomal abnormality, attitudes toward, and comfort with individuals with disabilities, and support from others) influence women’s decision making following prenatal anomaly detection (Choi 2012).
In this systematic review, we assessed the accuracy of gNIPT for the detection of common fetal aneuploidies in pregnant women according to their prior risk of fetal aneuploidy. More specifically, we evaluated and compared the diagnostic performance of two new next‐generation sequencing approaches (i.e. massively parallel shotgun sequencing (MPSS) and targeted massively parallel sequencing (TMPS)) that have recently been proposed as methods of choice to detect fetal aneuploidies by analysing ccfDNA in maternal plasma. We also made comparisons between MPSS and TMPS or between gNIPT and their combination with other first‐tier screening approaches. gNIPT could be used as a first‐tier test in pregnant women without prior risk (i.e. in unselected pregnant women or the general population) or as a second‐tier test after a positive result for traditional first‐tier screening tests such as biochemical, ultrasound or both markers (with maternal age included in risk assessment) and previous maternal history when possible.
[1] For a glossary of terms, see Appendix 1. For a list of acronyms and abbreviations, see Appendix 2.
Target condition being diagnosed
The target conditions are fetal chromosomal abnormalities diagnosed in pregnant women. The seven target conditions assessed were Down syndrome (trisomy 21 or T21), Edward syndrome (trisomy 18 or T18), Patau syndrome (trisomy 13 or T13), Turner syndrome (45,X), Klinefelter syndrome (47,XXY), Triple X syndrome (47,XXX) and 47,XYY syndrome (47,XYY) (Table 1). The majority of aneuploidies are associated with an extra copy (trisomy) of one chromosome (e.g. three copies of chromosome 21 for T21 instead of two) or a loss of one chromosome (e.g. female 45,X). Chromosomal abnormality is usually caused by a chromosome division failure or a chromosomal translocation. For example, most cases (76.2%) of 45,X karyotype (all cells affected) are caused by paternal chromosome division failure (Uematsu 2002). The most common chromosomal abnormalities are T21 and 45,X, respectively. For T21, the prevalences reported for pregnant women are 0.11% and 0.44% at 25 and 35 years old, respectively at diagnosis procedure (Snijders 1999).
| Target condition | Affected birthsa /100,000 | Clinical features | Prognosis |
| T21 | 140 to 230b,c | Intellectual disability (mild to moderate), neurodevelopmental problems, characteristic dysmorphic features, congenital defects (cardiac (44% to 58%) and gastrointestinal system (4% to 10%)), vision or hearing impairment (38% to 80%) and obstructive sleep apnoea syndrome (57%)d,e | Mean and median life expectancies are estimated to be 51 and 58 years oldf |
| T18 | 59c | Severe intellectual disability and a wide range of significant malformations (cardiac defects, gastrointestinal system defects, renal anomalies, central nervous system defects (apnoea and seizures))d,g | Most affected fetuses die in utero. Median survival has been estimated at 14 days (95% confidence interval (CI) 10 to 20) and 8% (95% CI 4 to 14) reach 1 year of ageh |
| T13 | 23c | Severe intellectual disability, seizures and several dysmorphic features, malformations of the extremities, cardiac defects, renal anomalies, and abdominal wall defectsd,i | Most affected fetuses die in utero. Median survival time has been estimated at 10 days (95% CI 7 to 19) and 8% (95% CI 4 to 14) reach 1 year of ageh |
| 45,X | 30 to 50c,j | Learning disabilities (70%), short stature, congenital heart diseases (30%) and gonadal dysgenesis (90% with amenorrhoea and infertility due to early ovarian failure)k,l | Mortality in 45,X women is 3‐fold higher than in the general population with an average life span of 69 yearsm |
| 47,XXY | 12c | Learning disabilities (> 75%), small testes (> 95%), azoospermia (> 95%), male infertility (91% to 99%), decreased testosterone level (63% to 85%) and gynaecomastia (38% to 75%)l,n | Life expectancy is slightly shorter (approximately 2 years) than euploid menn |
| 47,XXX | 6c | Developmental delays (motor and speech), learning or intellectual disability, attention deficits (25% to 35%), mood disorders (anxiety and depression), tall stature (80% to 89%), clinodactyly (42% to 65%), hypotonia in infancy (55% to 71%), genitourinary malformations and congenital heart defectso | Mortality significantly increased with a median survival age of 70.9 years compare to 81.7 years for euploid femalesp |
| 47,XYY | 3c | Developmental delays (speech, language and motor), attention deficit disorder (52%), tall stature (78%), central adiposity, macrocephaly (33%), hypotonia (63%), clinodactyly (52%), hypertelorism (59%) and testicular enlargement for age (50%) but no increase in genital anomaliesq | Mortality increased with a reduction of life span of 10.3 years compared to euploid menr |
45,X: Turner syndrome, 47,XXX: triple X syndrome, 47,XXY: Klinefelter syndrome, T21: trisomy 21, T18: trisomy 18, T13: trisomy 13.
aIncluding live births, fetal deaths and terminations of pregnancy.
b(Christianson 2006; Parker 2010)
e(Irving 2012; Weijerman 2010)
f(Wu 2013b)
g(Cereda 2012)
h(Wu 2013a)
i(Chen 2009)
k(Karnis 2012; Mazzanti 1998; Sybert 2004)
l(Tyler 2004)
m(Saenger 1996; Schoemaker 2008)
n(Groth 2013)
q(Bardsley 2013; Leggett 2010)
r(Stochholm 2010a).
Clinical characteristics and spectrum of severity are variable among aneuploidies. It has been reported that 50% of 45,X cases are mosaic (Sybert 2004). During the past few decades, caring for children with T21 or sex chromosomal abnormalities and provision of counselling to their family has changed fundamentally. These changes, including medical and surgical advances, specific interventions in the classroom for those with learning disabilities, interventions and support for parents and family members, have helped individuals with T21 live longer and enjoy an improved quality of life (Van Riper 2001). Many health problems associated with T21, 45,X, 47,XXY, 47,XXX and 47,XYY aneuploidies can be treated but fetuses with T18 and T13 are most affected and usually die in utero. The age at diagnosis varies widely depending on the condition. T21, T18 and T13 are generally detected during the perinatal period, while detection of 45,X, 47,XXX and 47,XYY is often delayed, sometimes up to 60 years old (Stochholm 2006; Stochholm 2010a; Tartaglia 2010). Around 10% of fetuses with 47,XXY are diagnosed prenatally and the mean age at diagnosis is in the mid‐30s. Most 47,XXY cases are never diagnosed (Groth 2013; Tyler 2004). The incidence, clinical features and prognosis of the target conditions are summarised in Table 1.
Index test(s)
Genomics‐based non‐invasive prenatal tests are based on the finding that placental cells continuously release detectable amounts of fetal ccfDNA into maternal blood. This fetal ccfDNA originates from normal placental cell death and consists mainly of relatively short fragments of < 300 base pairs (Bianchi 2004; Fan 2010). Proof‐of‐concept studies showed the feasibility of such tests to detect fetal aneuploidy in 2008 (Chiu 2008; Fan 2008).
We assessed these two gNIPT approaches (Figure 1):

Difference between massively parallel shotgun sequencing (MPSS) and targeted massively parallel sequencing (TMPS). Genomics‐based non‐invasive prenatal testing (gNIPT) aims to count the number of copies of DNA fragments from the chromosomes of interest (chromosome 21 (Chrom. 21) in this example) present in circulating cell‐free DNA (ccfDNA) from a pregnant woman, relative to a reference set of chromosomes (Ref. Chrom.). DNA fragments circulating in maternal blood in the case of a euploid (left) and aneuploid (right) pregnancy are illustrated (top). MPSS produces a large number of sequence reads from all chromosomes while TMPS generates a larger proportion of reads from the chromosomes of interest (bottom). In both methods, sequence reads can be used to detect a slight excess of fetal genomic material coming from the chromosome of interest. Figure was created by FR.
-
massively parallel shotgun sequencing (MPSS) which randomly analyses all DNA fragments of a sample; and
-
targeted massively parallel sequencing (TMPS) which targets specific DNA fragments from the chromosomal regions of interest.
The fraction of the total ccfDNA in maternal circulation that is of fetal origin (the fetal fraction) is an important parameter for correctly identifying an aneuploid fetus by gNIPT (Canick 2013). Although the fetal ccfDNA fraction is a relatively small fraction (about 2% to 20%) of all ccfDNA in maternal blood, it can be detected from five weeks of gestation (Birch 2005; Canick 2013; Lo 1997; Lun 2008). Invasive procedures such as amniocentesis, may (Samura 2003) or may not be (Bussani 2011; Vora 2010) associated with a statistically significant increase of ccfDNA in maternal blood, which could affect fetal DNA concentration and affect gNIPT results. Therefore, in the context of clinical studies, maternal blood for gNIPT is usually collected either before or after waiting for a minimum of 24 hours following an invasive test. Indeed, the half‐life of ccfDNA has been estimated to be less than one day (Lo 1999; Yu 2013). On average, euploid multifetal pregnancies have a higher fetal ccfDNA fraction than euploid singleton pregnancies (Attilakos 2011; Canick 2012). There is no reported difference in ccfDNA concentration between monochorionic and dichorionic multifetal pregnancies (Attilakos 2011). However, dichorionic pregnancies complicate gNIPT analysis by the presence of an additional genome (or more in the presence of more than two fetuses) as opposed to the two genomes of mother and fetus present in singleton or monochorionic twin pregnancies.
Next generation sequencing (NGS) applied on DNA extracted from the plasma of pregnant women generates millions of DNA sequences from both maternal and fetal genomes in relative proportion to their original abundance (for technical details see Appendix 3). The data thus produced can be used to detect a slight excess (or loss) of fetal genomic material associated with cases of fetal aneuploidy (Papageorgiou 2012). These NGS technologies have paved the way for the development of gNIPT by alleviating the need for fetal‐specific genetic markers and with potentially better test accuracy than current fetal aneuploidy screening methods.
Currently, gNIPT for the detection of common aneuploidies has been developed by companies in America, Asia and Europe and are commercially available. As part of their marketing material, these companies have published the diagnostic performance of their respective tests on their websites (Table 2). In addition, several research and clinical laboratories have developed in‐house gNIPT.
| Test name (Company, country) | Method | Aneuploidy | Reported sensitivity % (95% CI) | Reported specificity % (95% CI) | Reported false positive rate % |
| Bambni™ Test (Berry Genomics Co. Ltd, China) | MPSS | T21 | 100.0 (ND) | > 99.9 (ND) | < 0.1 |
| T18 | 100.0 (ND) | > 99.9 (ND) | < 0.1 | ||
| T13 | 100.0 (ND) | > 99.9 (ND) | < 0.1 | ||
| 45,X | 100.0 (ND) | 99.8 (ND) | 0.0 | ||
| 47,XXX | 100.0 (ND) | 100.0 (ND) | 0.1 | ||
| 47,XXY | 100.0 (ND) | 100.0 (ND) | 0.0 | ||
| 47,XYY | 100.0 (ND) | 100.0 (ND) | 0.0 | ||
| GENOMOM (Genome Care, Korea) | MPSS | T21, T18 and T13 | 99.0 (ND) | ND | ND |
| SCA | 95.0 (ND) | ND | ND | ||
| Harmony™ prenatal test (Ariosa Diagnostics, Inc., USA) | Oligo TMPS | T21 | > 99.0 (ND) | > 99.9 (ND) | < 0.1 |
| T18 | 97.4 (ND) | > 99.9 (ND) | < 0.1 | ||
| T13 | 93.8 (ND) | > 99.9 (ND) | < 0.1 | ||
| 45,Xb | 96.3 (81.7 to 99.8) | 99.5 (98.1 to 99.9) | 0.5 | ||
| 47,XXXb | 100.0 (ND) | 99.5 (98.1 to 99.9) | 0.5 | ||
| 47,XXYb | 100.0 (61.0 to 100.0) | 100.0 (99.0 to 100.0) | 0.0 | ||
| IONA® test (Premaitha Health plc, UK) | MPSS | T21 | > 99.0 (ND) | > 99.0 (ND) | < 1.0 |
| T18 | > 99.0 (ND) | > 99.0 (ND) | < 1.0 | ||
| T13 | > 99.0 (ND) | > 99.0 (ND) | < 1.0 | ||
| (Laboratoire CERBA, France) | MPSS | T21, T18 and T13 | > 99.8 (ND) | > 99.8 (ND) | < 0.2 |
| MaterniT21™ Plus test (Sequenom Inc., USA) | MPSS | T21 | 99.1 (96.6 to 99.9) | 99.9 (99.7 to 99.9) | 0.1 |
| T18 | > 99.9 (93.9 to 100.0) | 99.6 (99.3 to 99.7) | 0.4 | ||
| T13 | 91.7 (61.0 to 99.0) | 99.7 (98.5 to 99.5) | 0.3 | ||
| combined sex aneuploidies | 96.2 (ND) | 99.7 (ND) | 0.3 | ||
| MomGuard™ (LabGenomics, Korea) | MPSS | T21, T18, T13, 45,X, 47,XXX, 47,XXY, 47,XYY | > 99.0 (ND) | ND | ND |
| NIFTY™ test (Bejing Genomics Institute (BGI), China) | MPSS | T21 | 99.2 (ND) | 100 (ND) | 0 |
| T18 | 98.2 (ND) | 100 (ND) | 0 | ||
| T13 | 100 (ND) | 100 (ND) | 0 | ||
| 45,X | > 99.9 (ND) | > 99.9 (ND) | < 0.1 | ||
| Panorama™ prenatal testc (Natera, Inc., USA) | SNP TMPS | T21 | > 99.9 (ND) | 100 (ND) | 0 |
| T18 | > 96.4 (ND) | > 99.9 (ND) | < 0.1 | ||
| T13 | > 99.9 (ND) | 100 (ND) | 0 | ||
| 45,X | > 92.9 (ND) | > 99.9 (ND) | < 0.1 | ||
| PrenaTest® (LifeCodexx AG, Germany) | MPSS | T21 | 98.7 (ND) | 99.9 (ND) | 0.1 |
| T18 | 100 (ND) | ||||
| T13 | 100 (ND) | ||||
| 45,X | 90.9 (ND) | 98.8 (ND) | 1.2 | ||
| 47,XYY | 100 (ND) | ||||
| Prendia (Genesupport, Switzerland) | MPSS | T21 | 100.0 (88.8 to 100.0) | 100.0 (98.0 to 100.0) | 0.0 |
| T18 | 95.8 (76.8 to 99.7) | 100.0 (97.0 to 100.0) | 0.0 | ||
| T13 | 100.0 (74.6 to 100.0) | 100.0 (98.1 to 100.0) | 0.0 | ||
| 45,X | 100.0 (74.6 to 100.0) | 100.0 (98.1 to 100.0) | 0.0 | ||
| 47,XXX | 100.0 (46.2 to 100.0) | 100.0 (98.2 to 100.0) | 0.0 | ||
| Tranquility (Genoma, Switzerland) | MPSS | T21 | 99.9 (ND) | 99.8 (ND) | 0.2 |
| T18 | 99.9 (ND) | 99.9 (ND) | 0.1 | ||
| T13 | 99.9 (ND) | 99.7 (ND) | 0.3 | ||
| verifi® prenatal test (Illumina, Inc., USA) | MPSS | T21 | 99.5 (98.7 to 99.5) | 99.8 (98.9 to 99.9) | 0.2 |
| T18 | 97.3 (94.2 to 98.2) | 99.7 (99.5 to 99.9) | 0.3 | ||
| T13 | 98.0 (95.6 to 98.9) | 99.8 (99.8 to 99.9) | 0.2 | ||
| 45,X | 95.0 (75.1 to 99.9) | 99.0 (97.6 to 99.7) | 1.0 | ||
| VisibiliT™ (Sequenom Inc., USA) | MPSS | T21 | > 99.0 (80.8 to 100) | > 99.9 (99.5 to 100) | < 0.1 |
| T18 | > 99.0 (65.5 to 100) | > 99.9 (99.5 to 100) | < 0.1 |
45,X: Turner syndrome, 47,XXX: triple X syndrome, 47,XXY: Klinefelter syndrome, T21: trisomy 21, T18: trisomy 18, T13: trisomy 13 CI: confidence interval, MPSS: massively parallel shotgun sequencing, ND: no data available, TMPS: targeted massively parallel sequencing and SNP: single nucleotide polymorphism.
a(Ariosa Diagnostics 2016; BGI 2014; BGI 2016; Berry Genomics 2016; Genoma 2016; Genome Care 2016; Illumina 2014; Illumina 2016; LabGenomics 2016; LifeCodexx 2016; Natera 2016; Genesupport 2016; Premaitha Health plc 2016; Sequenom 2016).
b(Hooks 2014).
cDNA of maternal and paternal origin are needed.
Before taking a personal decision to accept or decline gNIPT, pregnant women should be given information on the screening process, which must include a discussion with a health professional (Gagnon 2010; Legare 2010; Legare 2011; St‐Jacques 2008). Following screening, the results should be explained in the context of the harms and benefits of definitive diagnosis through non directive counselling (Benn 2013b). In their recent guideline, the American College of Obstetricians and Gynecologists (ACOG) recommends that gNIPT should not be used to replace diagnostic testing and that all pregnant women with a positive gNIPT result should have a diagnostic procedure before undertaking any irreversible action such as pregnancy termination. Guidelines also recommend that pregnant women with an unreported, indeterminate or uninterpretable gNIPT result should receive further genetic counselling and be offered comprehensive ultrasound evaluation and diagnostic testing (ACOG #163 2016).
Clinical pathway
Prior test(s)
Prenatal screening for fetal aneuploidy (mostly T21) is part of public health programs in most upper‐middle and high‐income countries and is typically offered to all pregnant women (Benn 2013b; Chitayat 2011). Up to now, screening tests for aneuploidies have relied on blood‐based biochemical testing of placental markers with or without ultrasound imaging to assess for nuchal translucency thickness and other markers of fetal aneuploidy in the first trimester. The age of the pregnant woman is combined with levels of biomarkers and nuchal translucency as predictive markers for T21 in the first or second trimester (Benn 2011; Chitayat 2011; Summers 2007). Table 3 presents the various testing combinations (e.g. sequential, integrated or contingent algorithms) that have been described and are currently in use in prenatal clinics (Alldred 2017b). The screening performance of these algorithms is mostly related to the detection rates of different marker combinations and the accepted level of false positive rates. A large prospective Canadian study of 32,227 pregnant women showed that the detection rate of existing screening strategies for T21 can reach about 88.4%, with a screen‐positive rate of 3.3% when applying the integrated prenatal screening procedure (Okun 2008).
| Screening tests | First trimester (before 14 weeks’ gestation) | Second trimester (14 to 20 weeks’ gestation) |
| Ultrasonography |
|
|
| Combined test |
| NA |
| Triple test | NA |
|
| Quadruple test | NA |
|
| Sequential testb |
|
|
| Contingent testb |
|
|
| Serum integrated testc |
|
|
| Integrated testc |
|
|
Maternal age is often included in the algorithm for prenatal screening tests. AFP: alpha‐fetoprotein, hCG: human chorionic gonadotropin, NA: not applicable, NT: nuchal translucency, PAPP‐A: pregnancy associated plasma protein A and uE3: unconjugated estriol.
a(Gekas 2009; Okun 2008; Wald 2005).
bA test result was available after first‐trimester screening test.
cSingle test result available after second‐trimester screening test.
A woman is classified as screen‐positive if her risk is equal to or exceeds a predetermined threshold following prenatal screening result or due to some other factors such as personal or familial history of aneuploidies or translocations. Although these factors are considered to significantly increase the risk of fetal aneuploidy, the indications for invasive testing may vary between countries. To confirm the presence or absence of fetal aneuploidy in these high‐risk pregnant women, a diagnostic test involving karyotyping by an invasive procedure such as amniocentesis or chorionic villi sampling (CVS) is offered (ACOG #88 2007; Benn 2011; Chitayat 2011). Karyotyping by traditional banding techniques of fetal cells obtained from amniotic fluid or placental tissue has been considered the standard of care for prenatal diagnosis of aneuploidies (ACOG #545 2012; Benn 2013a; ICFMM 2013). Fluorescence in situ hybridisation (FISH) and quantitative fluorescence polymerase chain reaction (QF‐PCR) are appropriate standards of care for pregnant women at increased risk of common fetal aneuploidies based on screening results (Duncan 2011; Langlois 2011; South 2013). Microarray analysis by array comparative genomic hybridisation (aCGH) is recommended in pregnancies with fetal anomalies and it is increasingly replacing karyotyping (ACOG #682 2016).
Five reviews published in the Cochrane Library examined serum, urine, ultrasound or a combination of these tests for T21 screening. For first‐trimester serum tests (Alldred 2015a), the authors concluded that two markers in combination with maternal age, specifically pregnancy associated plasma protein A (PAPP‐A) and free human chorionic gonadotropin (hCG) are significantly better than those involving single markers combined with or without maternal age. For second‐trimester serum tests (Alldred 2012), the authors concluded that two or more markers, with or without inhibin A, in combination with maternal age are significantly more sensitive than one marker alone. Their review also showed that no test combination was superior to the others and therefore it was not possible to recommend a specific test combination. For first‐trimester ultrasound tests alone of in combination with first‐trimester serum tests (Alldred 2017a), the authors concluded that test strategies that combine ultrasound markers with serum markers, especially PAPP‐A and free ßhCG, and maternal age were significantly better than those involving only ultrasound markers (with or without maternal age) except nasal bone. For first‐ and second‐trimester serum tests with and without first‐trimester ultrasound tests (Alldred 2017b), the authors concluded that tests involving first‐trimester ultrasound with first‐ and second‐trimester serum markers in combination with maternal age are significantly better than those without ultrasound, or those evaluating first‐trimester ultrasound in combination with second‐trimester serum markers, without first‐trimester serum markers. For first‐ and second‐trimester urine tests (Alldred 2015b), the authors concluded that second‐trimester ß‐core fragment and oestriol with maternal age are significantly more sensitive than the single marker second‐trimester ß‐core fragment and maternal age. However, there were few studies and the evidence does not support the use of urine tests for T21 screening for the first 24 weeks of pregnancy.
Role of index test(s)
Genomics‐based non‐invasive prenatal testing such as MPSS or TMPS could be offered to pregnant women after a first‐tier screening and before a diagnostic test in order to better identify which pregnant women at increased risk of fetal aneuploidy should be offered further testing (triage) (Figure 2). The use of such NGS‐based approaches has also been suggested as a replacement for current first‐tier screening tests (biochemical, ultrasound or both) or as potential diagnostic tests to replace current diagnostic test (karyotyping of fetal cells from amniocentesis or CVS) (Bianchi 2012).
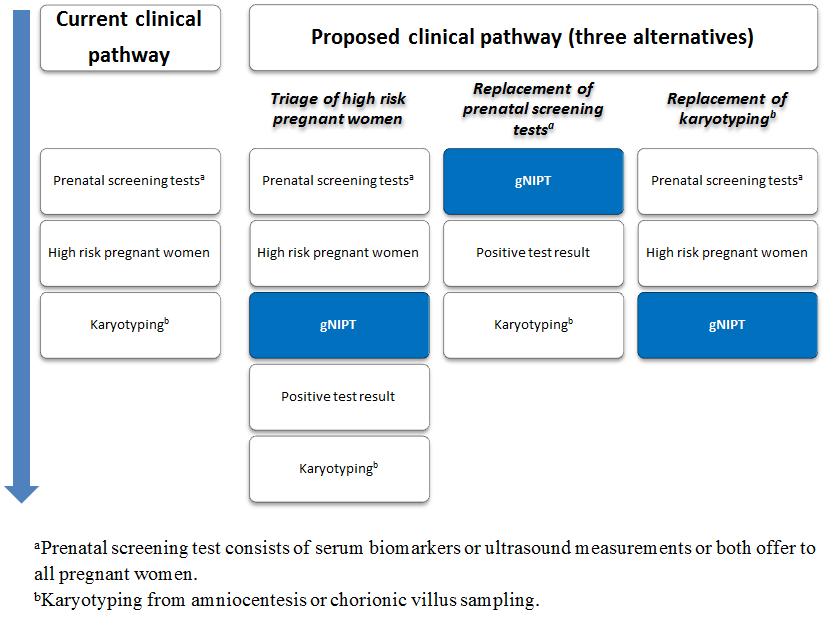
Current clinical pathway and three proposed uses of genomics‐based non‐invasive prenatal testing (gNIPT). Currently (on the left), pregnant women can have a prenatal screening test consisting of biomarkers or ultrasound, or both. For high‐risk pregnant women, an invasive diagnostic test (karyotyping) is offered. In the present review, we propose 3 different clinical pathways. First, gNIPT could be used as a triage test, to decide which pregnant women should receive further testing. Second, gNIPT could be used to replace current prenatal screening tests. Finally, gNIPT could be used to replace current invasive diagnostic tests (if diagnostic performance permits). At any point in a clinical pathway, a pregnant woman may decide not to proceed with other tests (not shown in the figure). Figure was designed by CL, JB, MB and YT.
Rationale
Current screening tests (biochemical, ultrasound or both) have relatively high false positive rates, which may result in undue anxiety for many pregnant women who will be offered an invasive diagnostic procedure. For example, at a prenatal screening risk cut‐off of 1:300, fetal aneuploidy is confirmed by karyotyping in only about 1/34 to 1/14 (3% to 7%) screen‐positive cases (Renshaw 2013; Wald 2005). As a result, many more women will undergo invasive diagnostic testing following positive screening tests than the number carrying a fetus with aneuploidy. In France, each year, about 800,000 pregnant women opt for prenatal T21 biochemical screening, ultrasound measurements or both, and about 24,000 of them (3%) will have karyotype testing (Basset 2013). Invasive testing methods for prenatal diagnosis of aneuploidy identify pregnancies with fetal chromosomal abnormalities, but contribute to an additional procedure‐related fetal loss rate (Wilson 2007). A recent meta‐analysis showed that weighted pooled procedure‐related risks of miscarriage of invasive testing methods before 24 weeks' gestation were 0.11% for amniocentesis and 0.22% for CVS (Akolekar 2015). The risk of miscarriage of normal fetuses associated with such invasive procedures has fostered the development of alternative screening and diagnostic approaches.
The discovery of fetal circulating cells and fetal ccfDNA in maternal blood during pregnancy has enabled the development of non‐invasive methods to analyse the fetal genome (Birch 2005; Lo 1997; Wright 2009). Fetal DNA offers advantages over circulating fetal cells because it is more easily extracted from maternal plasma samples and it disappears within hours after birth (undetectable about one to two days postpartum), as compared to the paucity and persistence of fetal cells in maternal blood over several consecutive pregnancies (up to 27 years) (Wright 2009; Yu 2013). At present, the analysis of ccfDNA by NGS technologies seems to be the most promising alternative gNIPT approach for the detection of fetal aneuploidies from maternal blood. This allows sequencing of tens of millions of these DNA fragments simultaneously, paving the way for the development of a non‐invasive, less psychologically stressful method potentially able of detecting fetal aneuploidies earlier and with better accuracy than current screening programs. As such, NGS technologies have the potential to radically change prenatal screening for fetal aneuploidy. Indeed, a study exploring the impact of gNIPT on prenatal care showed that more pregnant women with positive first‐trimester screening opt for further testing (from 47.2% to 78.8%) than before the introduction of gNIPT, while the rate of invasive diagnostic testing has decreased significantly (from 47.2% to 39.2%). Additionally, fewer pregnant women declined follow‐up testing when gNIPT was an option (from 52.8% to 21.2%) (Chetty 2013). Another study suggested that gNIPT could reduce procedure‐related fetal losses in high‐risk women by up to 88% (O'Leary 2013).
For instance, the new gNIPT approach is reported to detect aneuploidy with high sensitivity to select a subset of pregnant women for an invasive diagnostic procedure and could be performed in high‐risk pregnant women (as a second‐tier test) following a positive screening result (Benn 2013a). The major expected advantage of gNIPT by NGS over current (biochemical, ultrasound or both) screening tests is the significant decrease in false positive results and thus the reduction of invasive procedures and their associated normal fetus losses. Also, it was reported that a reduction of invasive prenatal procedures with the introduction gNIPT has indeed been documented (Chetty 2013; Larion 2014; Tiller 2014). Assessment of how NGS should be used in clinical practice for aneuploidy detection is currently being studied. NGS approaches could also be performed in general obstetrical population (as first‐tier test), in place of current screening algorithms (biochemical, ultrasound or both) (Figure 2). However, the field is moving rapidly. From January to July 2014, around 60 NIPT studies were published in PubMed compared to 70 studies in 2013 and 40 studies in 2012.
Up to now, no comprehensive systematic review including meta‐analyses has analysed and compared the diagnostic accuracy of MPSS and TMPS methods for the detection of fetal aneuploidies, either as a second‐tier test (i.e. in women at increased risk of fetal aneuploidy after current screening procedures) or as a first‐tier test (i.e. in all pregnant women). Benn 2013b published a review on gNIPT focused on providing the information needed by clinicians and public health providers before implementation of this technology in routine clinical practice. However, their review included only T21 and T18. Mersy 2013 published a systematic review on quality and outcome of diagnostic test accuracy studies on non‐invasive detection of fetal T21 only. One updated meta‐analysis (Gil 2015a) pooled all gNIPT methods but did not assess the relative performance of MPSS and TMPS technologies separately. More recently, Taylor‐Phillips 2016 published a meta‐analysis on gNIPT accuracy for major autosomal anomalies (T21, T18 and T13) without sex chromosome aneuploidies (SCAs) assessment and using restrictive inclusion criteria for included publications (e.g. limited to the English language, cohorts of more than 50 pregnant women) and including studies with incomplete follow‐up (pregnant women without reference standard). In the meta‐analysis of Mackie 2017, multifetal pregnancies and case‐control study design were excluded. In the meta‐analysis published by the Haute Autorité de Santé in France (HAS 2015), the accuracy of gNIPT was evaluated for T21 only and included studies with pregnant women selected at high risk of fetal aneuploidy as well as studies with pregnant women unselected for their risk (general population). Only studies published in English were included. The review of Agarwal 2013 described the properties of commercial tests available (e.g. type of gNIPT method, costs, turnaround times and reimbursement), intellectual property, commercialisation, patenting, patenting litigation and licensing landscape of technologies underlying these tests.
Genomics‐based non‐invasive prenatal tests are already advertised and marketed to North‐American, European and Asian healthcare providers. Leading companies are summarised in Table 2. Other entities are trying to make their way into the market (Birmingham Women's NHS; Counsyl; GENDIA; Genesis Genetics; Integrated Genetics; NIPD Genetics; Progenity; Quest Diagnostics; RAVGEN; Xcelom). Some of these assays have yet to be approved by the US Food and Drug Administration. There is significant pressure for increasing their use in clinical practice, but comparative effectiveness and cost‐effectiveness studies, as well as studies of the ethical, legal and social issues are scarce. Furthermore, tools needed for their patient value‐based implementation are not available or have not been validated.
Objectives
To evaluate and compare the diagnostic accuracy of massively parallel shotgun sequencing (MPSS) and targeted massively parallel sequencing (TMPS) using circulating cell‐free DNA (ccfDNA) in maternal blood for the detection of common fetal aneuploidies (T21, T18, T13, 45,X, 47,XXY, 47,XXX and 47,XYY) according to their prior risk of fetal aneuploidy. The genomics‐based non‐invasive prenatal testing (gNIPT) results were confirmed by a reference standard such as fetal karyotype or neonatal clinical examination.
To evaluate the screening performance of MPSS and TMPS as triage tests (a second‐tier screening test) for identifying which pregnant women at increased risk of fetal aneuploidy should be offered further testing, that is, after a first‐tier screening, but before a diagnostic test.
To assess the screening performance of MPSS and TMPS as a first‐tier test in pregnant women without prior risk (i.e. in unselected pregnant women or general population) as a replacement for current offered first‐tier tests (biochemical, ultrasound or both).
To assess the diagnostic performance of MPSS and TMPS as a second‐tier test as potential diagnostic tests to replace current invasive diagnostic tests.
Secondary objectives
To investigate potential sources of heterogeneity that may influence the diagnostic accuracy of MPSS and TMPS such as gestational age at the time of blood collection and type of reference standard used.
Methods
Criteria for considering studies for this review
Types of studies
We included studies that met the following inclusion criteria:
-
randomised studies where pregnant women were randomised to receive one gNIPT (MPSS or TMPS) as well as the reference standard;
-
retrospective and prospective cohort studies where all pregnant women were tested with one or more gNIPT methods and the reference standard (including head‐to‐head studies); and
-
retrospective and prospective case‐control studies comparing one or more of the gNIPT methods with the reference standard.
Although studies with a retrospective or case‐control design are prone to biases, we included such studies because we anticipated a paucity of other study designs. When data were sufficient, we explored the effect of excluding case‐control studies in sensitivity analyses.
We excluded studies for which it was not possible to extract or derive the number of true positives, false positives, false negatives and true negatives.
Participants
We included women of any age, ethnicity and gestational age with a singleton or multifetal (monochorionic and dichorionic) pregnancy.
Index tests
Genomics‐based non‐invasive prenatal tests based on plasma ccfDNA in maternal blood, analysis by either MPSS or TMPS methods.
Target conditions
We considered seven fetal aneuploidies, namely T21, T18, T13, 45,X, 47,XXY, 47,XXX and 47,XYY.
Reference standards
We considered the following test as reference standard: fetal karyotyping performed on cells obtained from chorionic villi sampling (CVS), amniotic fluid, placental tissue, a fetus lost by miscarriage or other equivalent and recognised methods on the same materials. By "fetal karyotyping" we mean traditional banding techniques, spectral karyotyping, fluorescence in situ hybridisation (FISH), array comparative genomic hybridisation (aCGH) or quantitative fluorescence polymerase chain reaction (QF‐PCR). If fetal karyotyping was not performed, we used neonatal clinical examination or medical records from birth as a secondary reference standard for T21, T18 or T13. For sex chromosome aneuploidies (SCA), only fetal karyotype was an appropriate reference standard because newborns usually have a normal phenotype.
Search methods for identification of studies
Electronic searches
We used a sensitive search strategy that included the following three sets of search terms and synonyms:
-
index test (e.g. cell‐free DNA, sequencing, non‐invasive and genetic diagnosis);
-
participants' description (e.g. pregnant women, fetus and prenatal); and
-
target condition (e.g. aneuploidy and chromosome anomalies).
We combined free‐text words and subject headings used within each set with the Boolean operator OR and then combined the three sets using AND. We reviewed publications from 1st January 2007 because MPSS and TMPS were introduced in the literature in 2008 (Chiu 2008; Fan 2008). We did not limit our search by language, search filter or publication type (e.g. journal article, clinical trial, validation study, review and comment).
We applied a comparable search strategy (Appendix 4) with adaptations for each of the following databases:
-
MEDLINE (Ovid) (January 2007 to July 2016);
-
Embase (January 2007 to July 2016);
-
Web of Science (ISI) (January 2007 to July 2016);
-
Cochrane Register of Diagnostic Test Accuracy Studies, Cochrane Library (January 2007 to October 2016);
-
ClinicalTrials.gov (January 2007 to September 2016);
-
European Clinical Trials Register (January 2007 to September 2016);
-
WHO ICTRP (January 2007 to September 2016);
-
The National Technical Information Service (NTIS) (January 2007 to September 2016);
-
OpenGrey (January 2007 to October 2016); and
-
National Guideline Clearing House (January 2007 to September 2016).
Searching other resources
We examined references cited in potentially relevant full‐text papers and those cited in previous reviews by cross‐checking bibliographies. We examined grey literature by searching data available on the websites of private prenatal diagnosis companies (Ariosa Diagnostics 2016; BGI 2016; Berry Genomics 2016; Genoma 2016; Genome Care 2016; Illumina 2016; LabGenomics 2016; LifeCodexx 2016; Natera 2016; Genesupport 2016; Premaitha Health plc 2016; Sequenom 2016) using gNIPT technologies (January 2007 to December 2016). We also searched for conference abstracts and theses in appropriate sources (e.g. TheseNet, Theses Canada Portal) (January 2007 to October 2016).
Data collection and analysis
We used the methods suggested by the Cochrane Diagnostic Test Accuracy Working Group (Deeks 2013). For selection of studies, data extraction and assessment of methodological quality, we conducted a pilot using 20 randomly selected articles to trial our forms in order to ensure criteria were applied consistently.
None of the review authors involved in conducting a gNIPT primary study (FL, FR, SL and YG) took part in the selection of studies, nor in any decisions/analyses related to their own studies. Furthermore, by the final date of data collection, these authors had not published a primary gNIPT study.
Selection of studies
Two review authors (MB and CL) independently identified relevant studies by screening the titles and abstracts of all studies identified by the search strategy. We obtained the full‐text version of all potentially relevant studies and assessed them for inclusion by using a study eligibility table based on prespecified inclusion criteria. The data collection form (Excel® format) for classifying studies during the full‐text assessment is presented in Appendix 5. We considered all comments, statements or errata related to included studies. We excluded studies that did not match the inclusion criteria and we recorded the reason(s) for exclusion. If results from the same study cohort were reported in multiple publications, we considered all the publications and included results from the most relevant and comprehensive publications. We excluded papers with preliminary results whose full published results were available. We resolved any disagreement between assessors (MB and CL) by iteration, discussion and consensus. If required, we consulted a third review author (JB or LN).
Data extraction and management
Two review authors (MB and CL, JB or LN) independently extracted information and data from each included study by using a data extraction form that we developed in Excel® format. We included the following items:
-
study characteristics (e.g. reference details allowing identification of the publication, language and study design);
-
population characteristics (e.g. gestational age, maternal age, ethnicity, total number of pregnant women, number of aneuploid cases, number of euploid cases, recruitment location (country, geographic locations or regions), recruitment period and other relevant tests carried out prior to index test (e.g. ultrasonography, biochemical screening));
-
features of the reference standard (e.g. fetal karyotyping, chromosome analysis or clinical examination);
-
features of the index test (e.g. technical details, commercial or in‐house gNIPT, cutpoint, failure rate, blood sample collection time (before or after reference standard) and first‐tier test or second‐tier test); and
-
data for constructing two‐by‐two tables (number of true positives, false positives, false negatives and true negatives) or summary statistics from which the data were derived. In the two‐by‐two tables, the true negative cases were patients with any other aneuploidy than the one under analysis and all euploid cases were considered unaffected. When data were presented in three‐by‐two tables due to unclassified index test results (defined as grey zone between positive and negative test results), we constructed two‐by‐two tables by considering all unclassified gNIPT results as test positives. This is because in practice such results will lead to further testing and investigation to ensure a case of fetal aneuploidy is not missed.
We cross‐checked all extracted and recorded data and we resolved any disagreement by iteration, discussion and consensus between two review authors (MB and CL, JB or LN). If required, we consulted a third author (JB, LN or CL). We wrote to the study contact author if information was missing or unclear or to clarify potential overlap between publications based on the same dataset to avoid including the same women more than once. If an article presented results including other aneuploidies than the ones under review, we considered only the subset of the cohort with the aneuploidies of interest.
Assessment of methodological quality
We used the revised QUality Assessment of Diagnostic Accuracy Studies (QUADAS‐2) tool for assessment of methodological quality of included studies (Whiting 2011). We tailored the tool to this review question using the operational criteria detailed in Appendix 6 to answer signalling questions and make the overall judgment of risk of bias and applicability concerns for each domain of the tool. We answered each signalling question with a ‘yes’, ‘no’ or ‘unclear’ response for each included study and we recorded the reason for the judgment made. If a study was recorded as ‘yes’ on all signalling questions related to risk of bias, then it was deemed appropriate to have an overall judgment of ‘low risk of bias’. If a study is recorded ‘no’ or ‘unclear’ on one or more signalling questions in a domain, then it was judged as having ‘high or unclear risk of bias’. Judgments about applicability concern were rated as ‘low’, ‘high’ or ‘unclear’ in relation to our review question. ‘Unclear concern’ was used only if insufficient information was available. Two review authors (MB and CL, JB or LN) independently applied the QUADAS‐2 tool to each included study and we resolved any disagreement by iteration, discussion and consensus. If required, we consulted a third review author (JB, LN or CL).
Statistical analysis and data synthesis
The unit of analysis was the pregnant woman irrespective of the type of pregnancy (multifetal or singleton pregnancy). We evaluated the performance of MPSS and TMPS for the detection of each type of aneuploidy under study both individually and globally for any type of aneuploidy (all autosomal aneuploidies combined and all sex chromosomal aneuploidies combined). We distinguished between each of the following groups of pregnant women and performed separate analyses for each subgroup:
-
unselected pregnant women undergoing aneuploidy screening (first‐tier gNIPT, i.e. offered to all pregnant women) and women selected at high risk of fetal aneuploidy (second‐tier gNIPT);
-
women with singleton and multifetal pregnancy because ccfDNA's fetal fraction in multifetal pregnancy is higher than in singleton pregnancy (Attilakos 2011; Canick 2012); and
-
pregnant women who underwent gNIPT during the first trimester (15 weeks or less), the first or second trimester (29 weeks or less) or at any time during pregnancy (42 weeks or less).
For each gNIPT method, we used Review Manager® to produce coupled forest plots of sensitivity and specificity, together with their 95% confidence intervals (CIs). We also plotted study‐specific estimates of sensitivity and specificity in receiver operating characteristic (ROC) space. All gNIPTs are laboratory‐developed tests based on differently calibrated assays with specific cutpoints to classify samples as euploid or aneuploid. There is no consensus on the cutpoints to use in practice. For this reason, we had planned to use a modelling strategy that focuses on the estimation of summary ROC curves (Macaskill 2010; Rutter 2001) and to estimate summary points (summary sensitivity and specificity) if a sufficient number of studies reported common cutpoints. However, given the qualitative nature of the cutpoints, which is highly dependent on each laboratory's developed gNIPT and study populations, it was not possible to identify a common cutpoint. Therefore, we reasoned that this was a special case where we can assume gNIPT results were binary (positive or negative). The rationale was further strengthened by the lack of apparent threshold effect when we examined the studies in ROC space. If a study reported more than one cutpoint, we considered all cutpoints and chose one cutpoint, the most commonly reported across all studies, such that only one pair of sensitivity and specificity from a study was included in meta‐analysis.
Due to limited or absence of threshold effect, there was no requirement to account for correlation between sensitivity and specificity across studies in meta‐analysis. Therefore, we removed the correlation parameter from the bivariate model (Chu 2006), thus simplifying the model to two univariate random‐effects logistic regression models for separate meta‐analyses of sensitivities and specificities (Takwoingi 2015). In cases where there were few studies in the meta‐analysis or a random‐effects analysis failed to converge, we used fixed‐effect logistic regression models. Where all studies in the meta‐analysis reported 100% sensitivity or 100% specificity, these fixed‐effect models fail as the prediction is perfect. Therefore, in such situations we used simple pooling by summing up the numbers of true positives and total cases to compute sensitivity, and the numbers of true negatives and unaffected pregnancies to compute specificity. CIs were obtained using the Wilson method (Newcombe 1998).
We compared the diagnostic accuracy of MPSS and TMPS by first using all available data (indirect comparison). If studies that compared MPSS and TMPS in the same population (head‐to‐head or direct comparison) were available, we had planned a second set of analyses restricted to direct comparisons. Comparative meta‐analyses were done by adding a covariate for test type to random‐effects or fixed‐effect models. We used likelihood ratio tests to assess the statistical significance of differences between tests by comparing models that included covariate terms for test type with models that did not include the terms. If data were available, comparisons between gNIPTs and traditional screening approaches were planned using a similar strategy to that described above. Meta‐analyses were performed using the xtmelogit and blogit functions in the Stata software package (version 13; StataCorp, College Station, Texas 77845, USA). When meta‐analyses of direct comparisons were not possible, we examined individual study results. For each comparative study, we computed differences in sensitivity and specificity, and 95% CIs were calculated for the differences using the Newcombe‐Wilson method without continuity correction (Newcombe 1998).
Investigations of heterogeneity
We examined forest plots of sensitivity and specificity and summary ROC plots for each gNIPT method to visually assess heterogeneity. If sufficient data were available for meta‐regression (by adding a covariate to a logistic regression model to explore its effect on sensitivity and specificity), we had planned to investigate the effect of the following:
-
study population (e.g. ethnicity, gestational age at blood collection); and
-
type of reference standard (i.e. karyotype or mixed reference standard).
However, formal investigations using meta‐regression were not possible due to limited data and little or no heterogeneity in test accuracy.
Sensitivity analyses
We performed sensitivity analyses to assess the effect of excluding case‐control studies and studies with a small number of cases of aneuploidy (less than 10 cases) on the summary estimates of test accuracy.
We had planned to also assess the effect of:
-
studies where pregnant women received an invasive diagnostic test less than one day before blood collection for gNIPT;
-
third trimester gestational age at the moment of blood collection for gNIPT;
-
studies available only as abstracts; and
-
studies at ‘high or unclear risk of bias’ according to the QUADAS‐2 assessment tool.
However, due to lack of data or lack of variability in estimates of sensitivity and specificity, only assessments of the impact of study design and number of cases were performed.
Results
Results of the search
We found a total of 11,912 articles through our electronic searches from January 2007 to October 2016 (see PRISMA study flow diagram in Figure 3). A total of 11,700 articles were identified through databases (941 through MEDLINE, 8381 through Embase, 1986 through Web of Science, 18 through Cochrane Diagnostic Test Accuracy register of studies, 245 through ClinicalTrial.gov, 43 through European Clinical Trials Register, 21 through WHO ICTRP, 34 through NTIS, 19 through OpenGrey and 12 through the National Guideline Clearing House). We found 212 publications through other sources (two articles received from the author, 175 from gNIPT company’s website, 27 from TheseNet and eight from These Canada Portal). After removing 2354 duplicates, two review authors independently screened the titles and abstracts of 9558 publications. Of the 9558 publications, 9209 were deemed irrelevant to our review question. We retrieved the full texts of the remaining 349 articles to assess their eligibility. After resolving disagreement between two or three review authors, 261 articles were excluded (see Characteristics of excluded studies for details) and 63 articles fulfilled our inclusion criteria (see Characteristics of included studies for details). Among these 63 articles, 62 were journal articles and one was a letter to the editor with sufficient information to be included (Jackson 2014). From the 63 articles, two articles presented two studies (two different cohort, two 2x2 tables). At all, we included 65 studies of 86,139 pregnant women (3141 aneuploids and 82,998 euploids). No studies are awaiting classification. We identified 25 ongoing trials through clinical trials databases (see Characteristics of ongoing studies for details). We will consider these trials in future updates.

PRISMA flow diagram for selection of studies from January 2007 to October 2016.
#: number, DTA: diagnostic test accuracy, NTIS: The National Technical Information Service and WHO ICTRP: World Health Organization International Clinical Trials Registry Platform.
Basic features of the included studies
The clinical characteristics of pregnant women and sequencing method were generally well described or referenced. Some studies did not clearly report how patient selection was done and which inclusion and exclusion criteria were applied. Patients’ enrolment flow‐charts, pregnancy outcome flow‐chart and 2 x 2 tables were unclear in many studies. We therefore contacted study authors to clarify unclear information, to obtain missing data or to clarify potential overlap of patients between publications.
We described the characteristics of included studies in Characteristics of included studies table and provided a summary in Table 4. Forty‐two studies (65%) enrolled pregnant women selected at high risk of fetal aneuploidy (Alberti 2015; Ashoor 2012; Benachi 2015; Bianchi 2012; Bianchi 2013; Bijok 2014; Canick 2012; Chen 2011; Ehrich 2011; Hall 2014; Hooks 2014; Hou 2012; Huang 2014; Jeon 2014; Jiang 2012; Johansen 2016; Ke 2015; Kim 2016; Lee 2015; Lefkowitz 2016; Liang 2013; Liu 2012; Mazloom 2013; Nicolaides 2013; Nicolaides 2014a; Norton 2012; Palomaki 2012; Papageorghiou 2016a; Papageorghiou 2016b; Persico 2016; Poon 2016; Porreco 2014; Sehnert 2011; Song 2015; Sparks 2012a; Stumm 2014; Sukhikh 2015; Sung‐Hee 2015; Verweij 2013; Wang 2014; Wang 2015a; Zhang 2016); five studies (8%) enrolled pregnant women without prior risk of fetal aneuploidy (del Mar Gil 2014; Nicolaides 2012; Norton 2015; Quezada 2015; Song 2013); and 18 studies (28%) enrolled pregnant women from a mixed risk cohort of fetal aneuploidy (Ashoor 2013; Bevilacqua 2015; Bianchi 2014a; Chiu 2011; Comas 2015; Fiorentino 2016; Gil 2016; Jackson 2014; Korostelev 2014; Lau 2012; Ma 2016; Pergament 2014; Samango‐Sprouse 2013; Shaw 2014; Tynan 2016; Yao 2014; Zhou 2014a; Zhou 2014b). Mixed‐risk samples included a mixture of selected pregnant women with low, high or no prior risk of fetal aneuploidy. Such samples do not represent the real‐life situation (i.e. using gNIPT as a first‐tier screening test or as a second‐tier test) and so such studies were not used for addressing our research objectives. Nevertheless, as we did not pre‐specify exclusion of such studies, we analysed the data and the results are presented in Appendix 7.
| Study ID | Target condition(s) | Study design and participants | Prior risk | Index test details | Cutpoint | Reference standard | Comparator |
| MPSS | |||||||
| T21 |
| High risk |
| Z score of 3 | Fetal karyotypea | ||
| T21, T18, T13 |
| High risk |
| Z score of 3 for T21; 3.95 for T18 and T13 | Fetal karyotype or neonatal clinical examination | ||
| T21, T18, T13, 45,X, 47,XXX, 47,XXY, 47,XYY |
| High risk |
| Different cutpoints used for autosomes and SCAb | Fetal karyotype | ||
| T21, T18, T13, 45,X |
| High risk |
| Different cutpoints used for autosomes and SCAb | Fetal karyotype | ||
| T21, T18, T13 |
| High, low and without prior risk |
| NCV of 4; resequenced if NCV is between 3 and 4 | Fetal or postnatal karyotype, neonatal clinical examination or medical record from birth | Standard screening (T21 only with mixed cutpoints) which include first‐trimester combined test or a second‐trimester result (quadruple, serum integrated, fully integrated, or sequential). | |
| T21, T18, T13 |
| High risk |
| NR | Fetal karyotype | ||
| T21, T18, T13 |
| High risk |
| Z score of 3 | Fetal karyotype | ||
| T18, T13 |
| High risk |
| Z score of 3 | Fetal karyotype | ||
| T21 |
| Mostly high (> 1/300) and some intermediate risk (between 1/300 and 1/1000) |
| Z score of 3 | Fetal karyotype | ||
| T21 |
| High risk |
| Z score of 2.5 | Fetal karyotype | ||
| T21, T18, T13 |
| Mostly high risk and without prior risk |
| NCV of 4; aneuploidy suspected if NCV is between 3 and 4 | Fetal karyotype or neonatal clinical examination | ||
| T21, T18, T13, 45,X, 47,XXX, 47,XXY, 47,XYY |
| High risk |
| NR | Fetal karyotype | ||
| T21, T18 |
| High risk |
| L score of 1 and t score of 2.5 including warning zone | Fetal karyotype | ||
| T21, T18 |
| High risk |
| Z score of 2.566 for T21; 2.459 for T18. | Fetal karyotype | ||
| T21, T18, T13, 45,X, 47,XXY, 47, XYY |
| High risk |
| Different cutpoints used for autosomes and SCAb | Fetal karyotype | ||
| T21, T18, T13 |
| High risk |
| Z score of 4 (unclassified if Z score is between 3 and 4) and WISECONDOR of 1% | Fetal karyotype | ||
| T21, T18, T13 |
| High risk |
| T score of 3 | Fetal karyotype or newborn outcome | ||
| T21 |
| High risk |
| Z score of 2.10 for Ion Proton™ | Fetal karyotype | ||
| T21, T18, T13, 45,X, 47,XXX, 47,XXY, 47,XYY |
| Mostly high risk |
| Different cutpoints used for autosomes and SCAb | Fetal karyotype | ||
| T21, T18, T13 and SCA (no case found) |
| High risk |
| Z score of 4 (intermediate risk if Z score is between 2.5 and 4) for T21 and T18; 2.8 for T13 (intermediate risk if Z score is between 1.9 and 2.8) | Fetal or neonatal karyotype | ||
| T21, T18, T13, 45,X, 47,XXX, 47,XXY, 47,XYY |
| High risk |
| Different cutpoints used for autosomes and SCAb | Fetal karyotype | ||
| T21, T18, T13, 45,X, 47,XXX, 47,XXY, 47,XYY |
| High risk |
| Different cutpoints used for autosomes and SCAb | Fetal karyotype | ||
| T21, T18, T13, 45,X, 47,XXX, 47,XXY, 47,XYY |
| High risk |
| Z score of 3 | Fetal karyotype | ||
| T21, T18, T13 |
| High and low risk |
| Z score of 3 | Fetal karyotype or postnatal follow‐up | ||
| 45,X, 47,XXX, 47,XXY, 47,XYY |
| High risk |
| Different cutpoints used for the four SCAb | Fetal karyotype | ||
| T21, T18, T13 |
| High risk |
| Z score of 3 for T21; 3.88 for T18; 7.17 for T13 | Fetal karyotype | ||
| T21, T18, T13 |
| High risk |
| Likelihood ratio of 1 and maternal age‐adjusted probability risk score | Fetal karyotype or medical record from birth | ||
| T21, T18, T13 |
| High risk |
| Likelihood ratio of 1 and maternal age‐adjusted probability risk score | Fetal karyotype or medical record from birth | ||
| T21, T18, T13 |
| High risk |
| NR (authors used the same gNIPT than Papageorghiou 2016a) | Fetal karyotype | ||
| T21, T18, T13, 45,X, 47,XXX, 47,XXY, 47,XYY |
| High risk |
| Different cutpoints used for autosomes and SCAb | Fetal karyotype or medical record from birth | ||
| T21, T18, T13, 45,X |
| High risk |
| Different cutpoints used for autosomes and SCAb | Fetal karyotype | ||
| T21, T18, T13, 45,X, 47, XXX, 47,XXY, 47,XYY |
| High and low risk |
| Different cutpoints used for autosomes and SCAb | Fetal karyotype or medical record from birth | ||
| T21, T18, T13, 45,X, 47,XXX, 47, XXY, 47,XYY (SCA data not shown in this review) |
| Without prior risk |
| Z score of 3 | Fetal or postnatal karyotype or medical record from birth | Triple test for T21 and T18 (cutpoint of 1 in 270). | |
| T21, T18, T13, 45,X, 47,XXX, 47,XYY |
| High risk |
| Z score of 3 | Fetal karyotype or neonatal clinical examination or both | ||
| T21, T18, T13 |
| High risk |
| MAD‐based Z score of 3 for T21; 3.2 for T18; 3.9 for T13 | Fetal karyotype | ||
| T21, T18, T13, 45,X |
| High risk |
| T score of 5 for T21 and T18; 4 for T13; 0.04 Chrom. X and 0.04 Chrom. Y for 45,X | Fetal karyotype | ||
| T21, T18, T13, 45,X, 47,XXX, 47,XXY, 47,XYY |
| High risk |
| L score of 1 and t score of 2.5 | Fetal karyotype or medical record from birth | ||
| T21, T18, T13 |
| High and without prior risk |
| risk score of 1% | Fetal karyotype or medical record from birth | ||
| T21, T18, T13, 45,X |
| High risk |
| NR | Fetal or neonatal karyotype or clinical examination at 42 days after birth or both | ||
| T21, T18, T13, 45,X, 47,XXX, 47,XXY, 47,XYY |
| High risk |
| Z score of 3 for T21, T18 and T13; ‐3 for Chrom. X and 3 for Chrom. Y for sex Chrom. classification. | Fetal karyotype or clinical follow‐up to 6 months from birth | ||
| T21, T18, T13 and SCA (SCA data not shown in this review) |
| High, low and without prior risk |
| Different cutpoints used for autosomes and SCAb | Fetal karyotype or clinical follow‐up | ||
| T21, T18, 45,X, 47,XXX (SCA data not shown in this review) |
| High risk |
| Z score of 3 for T21 (no other cutpoint reported) | Fetal or neonatal karyotype or neonatal clinical examination | ||
| T21, T18, T13 |
| High, low and without prior risk |
| L score of 1 and t score of 2.5 | Fetal or neonatal karyotype or birth outcome | ||
| T21, T18, T13 |
| High, low and without prior risk |
| L score of 1 and t score of 2.5 | Fetal or neonatal karyotype or birth outcome | ||
| TMPS | |||||||
| T21, T18 |
| High risk |
| NR (usually Harmony™ prenatal test uses FORTE risk score of 1%) | Fetal karyotype | ||
| T13 |
| High and low risk |
| FORTE risk score of 1% | Fetal karyotype or neonatal clinical examination | ||
| T21, T18, T13 |
| High and without prior risk |
| NR (usually Harmony™ prenatal test uses FORTE risk score of 1%) | Fetal or neonatal karyotype | ||
| T21, T18, T13, 45,X, 47,XXX, 47, XXY, 47,XYY (SCA data not shown in this review) |
| High and without prior risk |
| Harmony™ prenatal test: NR (usually Harmony™ prenatal test uses FORTE risk score of 1%) | Fetal karyotype or neonatal clinical examination | ||
| T21, T18, T13 |
| Without prior risk |
| NR (usually Harmony™ prenatal test uses FORTE risk score of 1%) | Fetal karyotype | ||
| T21, T18, T13 |
| High and intermediate riskc |
| NR (usually Harmony™ prenatal test uses FORTE risk score of 1%) | Fetal or postnatal karyotype or neonatal clinical examination | ||
| T13 |
| High risk |
| NR | Fetal karyotype or genetic testing of cord blood, buccal, saliva or products of conception | ||
| 45,X, 47,XXX, 47, XXY, 47,XYY |
| High risk |
| NR (usually Harmony™ prenatal test uses FORTE risk score of 1%) | Fetal karyotype | ||
| T21, T18, T13 |
| High and low risk |
| NR (usually Harmony™ prenatal test uses FORTE risk score of 1%) | Fetal karyotype or medical record from birth | ||
| T21, T18, T13, 45,X, 47,XXX, 47, XXY, 47,XYY |
| High and without prior risk |
| NR | Fetal karyotype or medical record from birth | ||
| T21, T18 |
| Without prior risk |
| Risk score of 1% | Fetal karyotype or neonatal clinical examination | First‐trimester combined test (cutpoint of 1 in 150). | |
| T21, T18, T13, 45,X, 47,XXX, 47,XXY, 47,XYY |
| High risk |
| NR | Fetal karyotype | ||
| 45,X, 47,XXX, 47,XXY, 47,XYY |
| High risk |
| FORTE risk score of 1% | Fetal karyotype | ||
| T21, T18 |
| High risk |
| FORTE risk score of 1% | Fetal karyotype | ||
| T21, T18, T13 |
| Without prior risk |
| NR (usually Harmony™ prenatal test uses FORTE risk score of 1%) | Fetal or postnatal karyotype, neonatal clinical examination or medical record from birth | First‐trimester combined test (cutpoint of 1 in 270 for T21 and 1 in 150 for T18 and T13). | |
| T21, T18, T13, 45,X |
| High and low risk |
| NR | Fetal karyotype or genetic testing of cord blood, buccal, saliva or products of conception or birth outcome | ||
| T21, T18, 45,X, 47,XXX, 47,XXY, 47,XYY |
| High risk |
| Risk score of 1% | Fetal karyotype | ||
| T21, T18, T13 |
| Without prior risk |
| NR (usually Harmony™ prenatal test uses FORTE risk score of 1%) | Fetal or postnatal karyotype, neonatal clinical examination or medical record from birth | First‐trimester combined test (cutpoint of 1 in 100 for T21). | |
| 45,X, 47,XXX, 47,XXY, 47,XYY |
| High and low risk |
| NR | Fetal karyotype or genetic testing of cord blood, buccal, saliva or products of conception | ||
| T21, T18 |
| High risk |
| NR | Fetal karyotype | ||
| T21 |
| High risk |
| FORTE risk score of 1% | Fetal karyotype | ||
45,X: Turner syndrome, 47,XXX: triple X syndrome, 47,XXY: Klinefelter syndrome, DANSR: digital analysis of selected regions, FF: fetal fraction DNA, FORTE: fetal‐fraction optimised risk of trisomy evaluation, MAD: Median absolute deviation, MPSS: massively parallel shotgun sequencing, NATUS: Next‐generation Aneuploidy Test Using SNPs, NCV: normalised chromosome value, SCA: sex chromosome aneuploidy, SNP: single‐nucleotide polymorphism,TMPS: targeted massively parallel sequencing, T21: trisomy 21, T18: trisomy 18 and T13: trisomy 13.
aFetal karyotype include traditional banding techniques, spectral karyotype, fluorescence in situ hybridisation, array comparative genomic hybridisation or quantitative fluorescence polymerase chain reaction.
bDifferent cutpoints used for autosomes or SCA as follows:
Bianchi 2012: NCV of 4 (aneuploidy suspected if NCV is between 2.5 and 4) for T21, T18, and T13; NCV for Chrom. X of ‐4 and NCV for Chrom. Y of 2.5 for 45,X; NCV for Chrom. X of 4 and NCV for Chrom. Y of 2.5 for 47,XXX; NCV for Chrom. X between ‐2.5 and 2.5 and NCV for Chrom. Y > 33 for 47,XXY; NCV for Chrom. X of ‐4 and NCV for Chrom. Y of 4 for 47,XYY with NCV for Chrom. Y is two times greater than expected NCV Chrom. X.
Bianchi 2013: NCV of 4 (aneuploidy suspected if NCV is between 3 and 4) for T21, T18, and T13; NCV for Chrom. X of ‐3 and NCV for Chrom. Y of 3 for 45,X.
Jiang 2012: t score of 3 and logarithmic LR of 1 for T21, T18 and T13; if female fetus, t score of ‐2.5 for 45,X and 47,XXX; t score of 2.5 combined with estimation of fetal ccfDNA concentration by Chrom. X and Y independently for 47,XXY and 47,XYY.
Lau 2012: Z score of 3 for T21, T18 and T13; if female fetus, Z score for Chrom. X of ‐3 for 45,X; if female fetus, Z score for Chrom. X of 3 for 47,XXX; if male fetus, Z score for Chrom. Y of 3 for 47,XXY.
Lefkowitz 2016: Z score of 3 for T21; Z score of 3.95 for T18 and T13; Z scores for SCA see Mazloom 2013.
Liang 2013: Z score of 3 for T21; 5.91 for T18; 5.72 for T13; ± 2.91 for Chrom. X and ± 3 for Chrom. Y for sex chromosome classification.
Mazloom 2013: Z score of 3.5 for 47,XXX (non‐reportable regions between 2.5 and 3.5); Z score of ‐3.5 for 45,X (non‐reportable regions between ‐2.5 and ‐3.5); Z score of ‐3.5 for 47,XYY with Chrom. Y representation; between ‐3.5 and 3.5 for 47,XXY with Chrom. Y representation.
Porreco 2014: Z score of 3 for T21; Z score of 3,95 for T18 and T13; Z score of 3.5 for 47,XXX (non‐reportable regions between 2.5 and 3.5); Z score of ‐3.5 for 45,X (non‐reportable regions between ‐2.5 and ‐3.5); Z score of ‐3.5 for 47,XYY with Chrom. Y representation; Z score between ‐3.5 and 3.5 for 47,XXY with Chrom. Y representation.
Sehnert 2011: NCV of 4 (unclassified if NCV is between 2.5 and 4) for T21, T18, and T13; NCV for Chrom. Y of ‐2.0 SDs from the mean of male samples and NCV for Chrom. X of ‐3.0 SDs from the mean of female samples for sex chromosome classification.
Shaw 2014: Z score of 3 for T21, T18, and T13; Z score of ‐3 for Chrom. X and 3 for Chrom. Y for sex chromosome classification.
Yao 2014: T score of 2.5 for T21, T18 and T13; if female fetus, T score for Chrom. X of ‐2.5 for 45,X and 2.5 for 47,XXX; if male fetus, T score for Chrom. X of 2.5 combined with estimation of fetal ccfDNA concentration by Chrom. X (expected value of zero) for 47,XXY; if male fetus, T score for Chrom. X of 2.5 and R‐value (the ratio of the fetal DNA fraction estimated by chromosome Y to that estimated by chromosome X) between 1.8 and 2.2 for 47,XYY.
cPregnant women with a first‐trimester combined test selected for their risk of fetal aneuploidy (cutpoint of 1 in 100 for high risk and 1 in 101 to 1 in 2500 for intermediate risk).
The studies assessed MPSS and TMPS using various algorithms and cutpoints. Table 4 describes the specific gNIPT assay used in the included studies. Each assay was developed and validated by the testing laboratory. Among the 65 studies, 44 studies (68%) used a whole genome sequencing method (MPSS) (Alberti 2015; Benachi 2015; Bianchi 2012; Bianchi 2013; Bianchi 2014a; Bijok 2014; Canick 2012; Chen 2011; Chiu 2011; Ehrich 2011; Fiorentino 2016; Hou 2012; Huang 2014; Jeon 2014; Jiang 2012; Johansen 2016; Ke 2015; Kim 2016; Lau 2012; Lee 2015; Lefkowitz 2016; Liang 2013; Liu 2012; Ma 2016; Mazloom 2013; Palomaki 2012; Papageorghiou 2016a; Papageorghiou 2016b; Poon 2016; Porreco 2014; Sehnert 2011; Shaw 2014; Song 2013; Song 2015; Stumm 2014; Sukhikh 2015; Sung‐Hee 2015; Tynan 2016; Wang 2014; Wang 2015a; Yao 2014; Zhang 2016; Zhou 2014a; Zhou 2014b), and 21 (32%) used a targeted method (TMPS) (Ashoor 2012; Ashoor 2013; Bevilacqua 2015; Comas 2015; del Mar Gil 2014; Gil 2016; Hall 2014; Hooks 2014; Jackson 2014; Korostelev 2014; Nicolaides 2012; Nicolaides 2013; Nicolaides 2014a; Norton 2012; Norton 2015; Pergament 2014; Persico 2016; Quezada 2015; Samango‐Sprouse 2013; Sparks 2012a; Verweij 2013). Of the 65 studies, five studies compared gNIPT with traditional screening tests (Bianchi 2014a; Nicolaides 2012; Norton 2015; Quezada 2015; Song 2013). MPSS studies involved 50,864 pregnant women, TMPS studies involved 35,275 pregnant women and traditional screening tests involved 24,279 pregnant women. The most commonly (15 studies) used cutpoint for gNIPT assays was a chromosomal ratio Z score of 3. Thirteen studies used the FORTE risk score, eight studies used a normalised chromosome value (NCV) and 13 studies did not report their cutpoint. The remaining studies used other cutpoints (Table 4). Timing of blood sampling for gNIPT was before invasive procedure in 55 studies, before or more than 24 hours after invasive sampling in four studies (Ashoor 2013; Lefkowitz 2016; Pergament 2014; Samango‐Sprouse 2013), and was not reported in six studies (Bevilacqua 2015; Jiang 2012; Song 2013; Sparks 2012a; Wang 2014; Zhang 2016).
Among all aneuploidies considered, 36 studies (55%) reported analyses only for autosomes, four (6%) for only sex chromosome aneuploidies (SCA) and 25 studies (39%) for both autosomes and SCA. Fifty‐seven studies (82,620 pregnant women) evaluated T21, 50 studies (79,322 pregnant women) evaluated T18, 39 studies (68,958 pregnant women) evaluated T13, 20 studies (10,081 pregnant women) evaluated 45,X, seven studies (6035 pregnant women) evaluated 47,XXX, 12 studies (7609 pregnant women) evaluated 47,XXY and 10 studies (6987 pregnant women) evaluated 47,XYY (Table 4). Among all 65 included studies, there are a total of 2004 T21 cases, 634 T18 cases, 215 T13 cases, 232 45,X cases, 14 47,XXX cases, 25 47,XXY cases and 16 47,XYY cases. All 65 studies used an appropriate reference standard such as fetal or neonatal karyotype, genetic testing, neonatal clinical examination or medical records from birth. In 36 studies (55%), only one reference standard was used while 29 studies (45%) used more than one reference standard (Table 4).
Among the 65 studies, 40 (62%) studies were prospective cohort studies (Ashoor 2013; Bevilacqua 2015; Bianchi 2014a; Bijok 2014; Comas 2015; Fiorentino 2016; Gil 2016; Hou 2012; Huang 2014; Jackson 2014; Jeon 2014; Jiang 2012; Johansen 2016; Ke 2015; Kim 2016; Korostelev 2014; Lau 2012; Lee 2015; Liang 2013; Liu 2012; Mazloom 2013; Nicolaides 2013; Norton 2012; Norton 2015; Pergament 2014; Persico 2016; Porreco 2014; Quezada 2015; Samango‐Sprouse 2013; Shaw 2014; Song 2013; Song 2015; Stumm 2014; Sukhikh 2015; Verweij 2013; Wang 2014; Wang 2015a; Zhang 2016; Zhou 2014a; Zhou 2014b), eight (12%) studies were retrospective cohort studies (Benachi 2015; Bianchi 2013; del Mar Gil 2014; Nicolaides 2012; Sehnert 2011; Sung‐Hee 2015; Tynan 2016; Yao 2014), one (1%) study was a prospective and retrospective cohort study (Ma 2016) and 16 (25%) studies used a case‐control design (Alberti 2015; Ashoor 2012; Bianchi 2012; Canick 2012; Chen 2011; Chiu 2011; Ehrich 2011; Hall 2014; Hooks 2014; Lefkowitz 2016; Nicolaides 2014a; Palomaki 2012; Papageorghiou 2016a; Papageorghiou 2016b; Poon 2016; Sparks 2012a) (Table 4).
Forty‐eight (74%) studies included only singleton pregnancies, while five (8%) studies included only multifetal pregnancies. Four (6%) studies included women with either type of pregnancy and eight (12%) studies did not report the type of pregnancy. Ten (15%) studies included only pregnant women in the first trimester (15 weeks or less), 21 (33%) studies included pregnant women in the first two trimesters (29 weeks or less), 24 studies (37%) included pregnant women in the three trimesters (42 weeks or less) and 10 studies (15%) did not report gestational age. Eighteen studies (28%) had more than 50% Caucasian women in their cohort, 21 studies (32%) had more than 50% Asian women and 26 studies (40%) did not report ethnicity.
Thirty‐seven studies (57%) were industry‐funded or were written by one or more author affiliated with a company who sells gNIPT (Benachi 2015; Bianchi 2012; Bianchi 2013; Bianchi 2014a; Canick 2012; Chen 2011; Chiu 2011; Ehrich 2011; Hall 2014; Hooks 2014; Huang 2014; Jackson 2014; Jiang 2012; Kim 2016; Lau 2012; Lee 2015; Lefkowitz 2016; Ma 2016; Mazloom 2013; Nicolaides 2012; Nicolaides 2013; Norton 2012; Norton 2015; Palomaki 2012; Papageorghiou 2016a; Papageorghiou 2016b; Pergament 2014; Persico 2016; Porreco 2014; Samango‐Sprouse 2013; Sehnert 2011; Shaw 2014; Sparks 2012a; Stumm 2014; Tynan 2016; Verweij 2013; Yao 2014); 22 studies (34%) were not reported to be funded by industry but samples were sequenced and analysed by a commercial laboratory (Ashoor 2012; Ashoor 2013; Bevilacqua 2015; Bijok 2014; Comas 2015; del Mar Gil 2014; Fiorentino 2016; Gil 2016; Hou 2012; Jeon 2014; Ke 2015; Korostelev 2014; Liang 2013; Poon 2016; Quezada 2015; Song 2013; Song 2015; Sung‐Hee 2015; Wang 2014; Wang 2015a; Zhou 2014a; Zhou 2014b); three studies (4.5%) had no link with industry (Alberti 2015; Johansen 2016; Sukhikh 2015); and the funding source was not reported for three studies (4.5%) (Liu 2012; Nicolaides 2014a; Zhang 2016). Table 5 describes the specific gNIPT assay used in the included studies. Of the 65 studies, 61 (94%) used a commercial gNIPT (15 from Ariosa Diagnostics, Inc., 12 from Bejing Genomics Institute, four from Illumina (or Verinata Health), six from Natera, nine from Sequenom and 15 from other companies) (Table 5). It appears that, for three of the commercially available assays, there are nine studies or more adding up to a large number of cases and unaffected cases analysed. Further, only two assays (one TMPS and one MPSS) were used in one of the five studies involving unselected pregnant women and one assay (Ariosa’s Harmony™ test) was used in four of them. Twelve studies (19%) included their entire cohort in the analyses, 36 studies (55%) included between 80% to 99.9%, and 17 studies (26%) included less than 80%. We found 54 (83%) studies where patient exclusions and failed samples were reported (Table 6; Table 7).
| Company | Number of studies | Number of affected/unaffected pregnanciesa | Number of studies with pregnant women without prior risk of fetal aneuploidy | Number of studies with high‐risk pregnant women | Number of studies with mixed riskb cohort |
| Ariosa Diagnostics, Inc. | 15 | 594/32,302 | 4 | 6 | 5 |
| Bejing Genomics Institute (BGI) | 12 | 427/24,724 | 0 | 7 | 5 |
| Sequenom, Inc. | 9 | 904/8486 | 0 | 7 | 2 |
| Berry Genomics Co. Ltd | 6 | 147/3414 | 1 | 4 | 1 |
| Natera, Inc. | 6 | 276/2103 | 0 | 3 | 3 |
| Illumina, Inc. | 4 | 273/2342 | 0 | 3 | 1 |
| In‐house | 3 | 114/442 | 0 | 3 | 0 |
| Premaitha Health plc | 3 | 99/579 | 0 | 3 | 0 |
| Genome Care | 2 | 21/235 | 0 | 2 | 0 |
| CERBA | 1 | 113/745 | 0 | 1 | 0 |
| Genoma | 1 | 105/6977 | 0 | 0 | 1 |
| LabGenomics | 1 | 8/84 | 0 | 1 | 0 |
| LifeCodexx AG | 1 | 55/417 | 0 | 1 | 0 |
| Not reported | 1 | 5/148 | 0 | 1 | 0 |
| Total | 65 | 3141/82,998 | 5 | 42 | 18 |
aWe included pregnancies with any other aneuploidy than the one under analysis with all euploid cases as "unaffected" pregnancies.
bMixed‐risk cohort included a mix of pregnant women without prior risk, low risk or high risk of fetal aneuploidy.
| Study ID | Number of pregnant women enrolled | Reasons for exclusion | Number of women with results for 2 x 2 table analysis |
| 976 |
Total: 793 | 183 | |
| 400 |
| 397 | |
| 2167 |
Total: 218 | 1949 | |
| 900 |
Total: 14 | 886 | |
| 2362 |
Total: 2022 | 340 | |
| 2882 |
Total: 2366 In addition, other samples excluded from 2 x 2 tables for censored complex karyotype:
| 503 (T21) 502 (T18) 501 (T13) 489 (45,X) | |
| 2882 |
| 113 | |
| 2052 |
Total for T21 and T18: 100 | 1952 (T21 and T18) 1914 (T13) | |
| 10 |
| 9 | |
| 4664 |
| 27 | |
| 392 |
| 289 | |
| 824 |
Total: 71 (8‐plex) | 753 (8‐plex) | |
| 333 |
Total: 21 | 312 | |
| 207 |
Total: 15 | 192 | |
| 480 |
Total: 31 | 449 | |
| 7103 |
| 7082 | |
| 11,692 |
Total: 8059 | 3633 | |
| > 1000 |
Total: 936 | 64 | |
| 432 |
| 414 | |
| 308 |
| 205 | |
| 189 | NR | 189 | |
| 1228 |
Total: 67 | 1161 | |
| 155 | NR | 155 | |
| 903 | NR | 903 | |
| 375 |
Total: 202 | 173 | |
| 2340 | NR | 2340 | |
| 101 | NR | 101 | |
| 1968 |
Total: 1283 | 685 | |
| 108 | NR | 108 | |
| 93 |
| 92 | |
| 5321 |
Total: 4155 (autosomes) In addition:
Total: 4177 (SCA) | 1166 (autosomes) | |
| 435 |
Total: 23 | 412 | |
| 153 | NR | 153 | |
| 10,598 |
Total: 19 | 10,579 | |
| 1975 |
| 411 | |
| 2230 |
Total: 281 | 1949 | |
| 242 |
| 229 | |
| 177 |
Total: 5 | 172 | |
| 4002 |
Total: 922 | 3080 | |
| 18,955 |
Total: 3114 | 15,841 | |
| 4876 |
Total: 2905 | 1971 | |
| 442 |
Total: 16 | 426 | |
| 442 |
Total: 431 | 11 | |
| 1064 |
Total: 98 In addition,
| 963 (T21) 964 (T18 and 45,X) 965 (T13) | |
| 259 |
Total: 10 | 249 | |
| 242 |
| 241 | |
| 4170 |
In addition,
| 3322 (T21, T18, T13) 3201 (47,XXY, 47,XYY) | |
| 2905 |
Total: 120 | 2785 | |
| 201 |
Total: 15 | 186 | |
| 1014 |
Total: 967 | 47 | |
| 201 |
| 200 | |
| 1916 |
Total: 175 | 1741 | |
| 213 |
Total: 9 | 204 | |
| 338 |
| 167 | |
| 522 |
Total: 50 | 472 | |
| 200 | NR | 200 | |
| 918 |
Total: 17 | 901 | |
| 1100 |
Total: 52 | 1048 | |
| 595 |
Total: 91 | 504 | |
| 136 | NR | 136 | |
| 917 | NR | 917 | |
| 5950 |
| 5530 | |
| 87 | NR | 87 | |
| 306 |
| 301 | |
| 7705 |
Total: 3755 | 3950 |
ccfDNA: circulating cell‐free DNA, CVS: chorionic villi sampling, GA: gestational age, gNIPT: genomics‐based non‐invasive prenatal testing, NR: not reported by authors.
aSecond time: sample failed the second gNIPT assay.
bFirst time: sample failed the initial gNIPT assay.
cComplex autosome karyotypes are mosaic, triploidies, unbalanced rearrangements with missing or duplicated genetic material.
dOther are copy number variation of the X chromosome is confounded by maternal component and cannot be determined.
| Study ID | Failure rate at first attempt (%) | Repeated testsa (%) | Failure rate of repeated tests (%) | Final failure rate total (%) | Aneuploidb samples (%) | Euploidb samples (%) |
| MPSS | ||||||
| 61/244 (25%) | 0 | NA | 61/244 (25%) | NR | NR | |
| 42/892 (4.7%) | 42 (100%) with second aliquot | 6/42 (14.3%) | 6/892 (0.7%) | 2.7% | 0.4% | |
| 16/519 (3.1%) | 0 | NA | 16/356 (3.1%) | NR | NR | |
| 18/1970 (0.9%) | 0c | NA | T21 and T18: 18/1970 (0.9%) T13: 18/1932 (0.9%) | NR | NR | |
| 1/10 (10.0%) | 0 | NA | 1/10 (10.0%) | 50% | 0% | |
| 11/764 (1.4%) | 0 | NA | 11/764 (1.4%) | NR | NR | |
| 20/467 (4.3%) | 20 (100%) resequenced | 18/20 (90%) | 18/467 (3.9%) | NR | NR | |
| 100/7103 (1.4%) | 79 (79%) with new sampling | 0 (0%) | 21/7103 (0.3%) | 0% | 0.3% | |
| NR | 2 with second aliquot or resequenced were in the grey zone (between affected and unaffected) | NR | 11/184 (6%)d | 5.8% | 6.1% | |
| 1/93 (1.1%) | 0 | NA | 1/93 (1.1%) | NR | NR | |
| Autosomes: 42/1208 (3.5%) SCA: 64/1208 (5.3%) | 0 | NA | Autosomes: 42/1208 (3.5%) SCA: 64/1208 (5.3%) | Autosomes: 3.8% SCA: 29.7% | Autosomes: 3.4% SCA: 4.5% | |
| 12/424 (2.8%) | 0 | NA | 12/424 (2.8%) | NR | NR | |
| 5/10,584 (0.05%) | 0 | NA | 5/10,584 (0.05%) | NR | NR | |
| 21/432 (4.9%) | 0 | NA | 21/432 (4.9%) | 11.8% | 4.3% | |
| 110/1988 (5.5%) | 105 (95.5%) with second aliquot and 5 (4.5%) resequenced | 17/110 (15.5%) | 17/1988 (0.9%) | 1.0% | 0.8% | |
| 5/431 (1.2%) | 0 | NA | 5/431 (1.2%) | NR | NR | |
| 1/242 (0.4%) | 0 | NA | 1/242 (0.4%) | 0% | 0.5% | |
| Autosomes: 108/3430 (3.1%) 45,X and 47,XXX: 152/3430 (4.4%) 47,XXY and 47,XYY: 229/3430 (6.7%) | 0 | NA | Autosomes: 108/3430 (3.1%) 45,X and 47,XXX: 152/3430 (4.4%) 47,XXY and 47,XYY: 229/3430 (6.7%) | NR | NR | |
| 73/1814 (4.0%) | 0 | NA | 73/1814 (4.0%) | 0% | 4.0% | |
| 1/205 (0.5%) | 0 | NA | 1/205 (0.5%) | NR | NR | |
| 32/504 (6.3%) | 0 | NA | 32/504 (6.3%) | 3.5% | 6.7% | |
| 21/908 (2.3%) | 16 (76.2%) with new sampling | 2/16 (12.5%) | 7/908 (0.8%) | NR | NR | |
| 52/1100 (4.7%) | 0 | NA | 52/1100 (4.7%) | 0% | 4.9% | |
| 0 | 0 | NA | 0 | NA | NA | |
| 0 | 0 | NA | 0 | NA | NA | |
| 141/3954 (3.6%) | 141 (100%) with new sampling | 4/141 (2.8%) | 4/3954 (0.1%) | NR | NR | |
| Overall range of final assay failure for MPSS | 0% to 25% | 0% to 50% | 0% to 6.7% | |||
| TMPS | ||||||
| 3/400 (0.8%) | 0 | NA | 3/400 (0.8%) | 0% | 1% | |
| 53/2002 (2.6%) | 0 | NA | 53/2002 (2.6%) | 0% | 2.7% | |
| 29/356 (8.1%) | 26 (90%) with 2nd aliquot | 13/26 (50%) | 16/356 (4.5%) | NR | NR | |
| 9/316 (2.8%) | 6 (67%) with new sampling | 1/6 (16.7%) | 4/316 (1.3%) | NR | NR | |
| 15/207 (7.2%) | 0 | NA | 15/207 (7.2%) | 23% | 6% | |
| 99/3698 (2.8%) | 54 (54,5%) with new sampling | 20/54 (37%) | 65/3698 (1.8%) | NR | NR | |
| 4/68 (5.9%) | 0 | NA | 4/68 (5.9%) | 11.8% | 3.9% | |
| 18/432 (4.2%) | 0 | NA | 18/432 (4.2%) | NR | NR | |
| NR | NR | 14 (NR) | 14/1175 (1.2%) | NR | NR | |
| 100/2049 (4.9%) | 0 | NA | 100/2049 (4.9%) | 9.1% | 4.9% | |
| 13/242 (5.4%) | 0 | NA | 13/242 (5.4%) | 6.3% | 5.2% | |
| 5/177 (2.8%) | 0 | NA | 5/177 (2.8%) | 5.1% | 1.7% | |
| 148/3228 (4.6%) | 0 | NA | 148/3228 (4.6%) | NR | NR | |
| 488/16,329 (3.0%) | 0 | NA | 488/16,329 (3.0%) | 20.6% | 2.9% | |
| T21: 88/1051 (8.4%) T18, 45,X: 87/1052 (8.3%) T13: 86/1053 (8.2%) | 0 | NA | T21: 88/1051 (8.4%) T18, 45,X: 87/1052 (8.3%) T13: 86/1053 (8.2%) | All five chromosomes (n = 85): 15.2% | All five chromosomes (n = 85): 7.1% | |
| 10/259 (3.9%) | 0 | NA | 10/259 (3.9%) | 8.4% | 2.1% | |
| 122e/2838 (4.2%) | 110 (90.1%) with new sampling | 41/110 (37.3%) | 53/2838 (1.9%) | 4.1% | 1.8% | |
| 15/201 (7.5%) | 0 | NA | 15/201 (7.5%) | 6.3% | 7.6% | |
| 51/520 (9.8%) | 51 (100%) with 2nd aliquot | 16/51 (31.4%) | 16/520 (3.1%) NR | NR | NR | |
| Overall range of final assay failure for TMPS | 0.8% to 7.5% | 0% to 23% | 1% to 7.63% | |||
CVS: chorionic villi sampling, FF: fetal fraction DNA, GA: gestational age, NA: not applicable, NR: not reported by authors, QC: quality control.
aRepeated tests included second aliquot (aliquot from first sampling), resequenced (same library) or new sampling.
baneuploid: proportion of failed samples of aneuploid cases out of all aneuploid tested with reference standard and gNIPT result. euploid: proportion of failed samples of euploid cases out of all euploid tested with reference standard and gNIPT result.
cAuthors decided to resequence 12 samples with gNIPT results. They were in the grey zone (between affected and unaffected) and were resequenced in uniplex. All repeated tests were in affected or unaffected zone.
dOnly the final failure rate was reported.The failure rate at first attempt was not reported nor the failure rate of repeated tests.
eAuthor reported 123 failed tests but this number included one sample lost in the mail and so did not undergo the sequencing process.
Summary of excluded studies
We described the excluded studies in the PRISMA flow diagram (Figure 3) as well as in Characteristics of excluded studies. After full‐text assessment, we excluded 261 articles.
Of these 261:
-
93 (36%) studies were not diagnostic test accuracy studies (e.g. implementation study, simulation model, method development, proof‐of‐concept, method without sequencing approach);
-
55 (21%) studies had overlapping samples and were excluded to avoid double counting;
-
54 (21%) studies had incomplete 2 X 2 data or insufficient information to derive a 2 X 2 table;
-
22 (8%) studies had either an inappropriate or no reference standard;
-
8 (3%) studies were identified as reviews or Health Technology Assessment reports;
-
11 (4%) studies had target conditions, methods or sampling schemes other than those specified in our review; and
-
18 (7%) studies were news, letters, comments, notes, replies or editorials without new data.
The 25 ongoing studies are described in Characteristics of ongoing studies.
Methodological quality of included studies
Figure 4 and Figure 5 show the risk of bias and applicability concerns for each included study for MPSS and TMPS, respectively. In Figure 6, the quality assessment results are summarised across all studies.

Risk of bias and applicability concerns summary: review authors' judgements about each domain for each of the studies included for massively parallel shotgun sequencing (MPSS).

Risk of bias and applicability concerns summary: review authors' judgements about each domain for each study included for targeted massively parallel sequencing (TMPS).
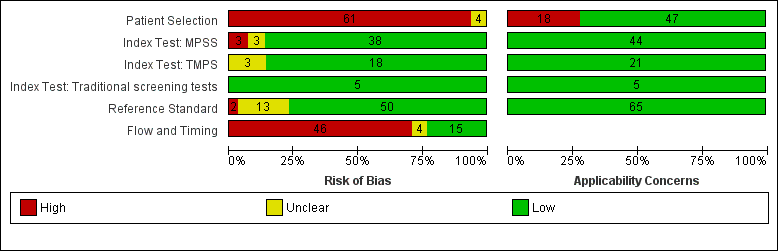
Risk of bias and applicability concerns (all tests included): review authors' judgements about each domains presented as percentages across included studies. MPSS: massively parallel shotgun sequencing, TMPS: targeted massively parallel sequencing.
Risk of bias
No study was assessed as being at low risk of bias across all domains (Figure 4). For the patient selection domain, the 'Risk of bias' judgement was influenced mainly by inappropriate exclusions than the other signalling questions in this domain. Of the 61 studies judged to be at high risk of bias, 57 (93%) had inappropriate exclusions. The exclusions were mainly due to multifetal pregnancy, gestational age limits, and the prior risk of fetal aneuploidy. The remaining four (7%) studies were judged to be at unclear risk of bias (Figure 6).
In the index test domain, the risk of bias was considered to be low in 38 (58%) of the 44 MPSS studies and unclear in three (5%) studies. The remaining three (5%) MPSS studies were judged to be at high risk of bias because the index test was performed knowing the results of the reference standard or the threshold was not pre‐specified. The risk of bias was low in 18 (27%) of the 21 TMPS studies. The remaining three (5%) TMPS studies were judged to be at unclear risk of bias. All five studies that assessed traditional screening approaches were judged to be at low risk of bias for the index test domain (Figure 6).
In the reference standard domain, all studies used a reference standard likely to correctly classify the target condition. We considered 50 (77%) studies to be at low risk of bias because the studies stated that the reference standard results were interpreted without knowledge of the results of the index test. Of the remaining 15 studies, two (3%) studies were at high risk of bias because the reference standard was performed knowing the results of the index test while it was unclear what was done in the other 13 (20%) studies (Figure 6).
For the flow and timing domain, 46 (71%) studies were considered to be at high risk of bias because some pregnant women were excluded from 2 x 2 tables because gNIPT failed during the sequencing process. Fifteen (23%) studies were judged to be at low risk of bias. For the remaining four (6%) studies, information about the appropriate interval between the index test and reference standard was not provided (Figure 6).
Applicability concerns
We judged all studies to be of low applicability concern in the index test and reference standard domains because the studies matched the review question (Figure 4; Figure 6). All studies used a gNIPT method with ccfDNA in maternal blood and appropriate reference standard for the detection of common fetal aneuploidies. In the patient selection domain, 47 (72%) studies included cohort of pregnant women selected at high risk of fetal aneuploidy or cohort of unselected pregnant women and were judged to be of low applicability concern. In the other 18 (28%) studies, the cohorts comprised pregnant women with different prior risk of fetal aneuploidy (mixed risk cohorts). This population did not represent the real‐life situation and those cohorts were judged to be of high applicability concern.
Findings
The characteristics of the studies are summarised in Table 4 and summary of findings Table 1. Results are presented separately for each of the main fetal aneuploidies (T21, T18, T13 and 45,X) and globally for all autosomes or all sex chromosome aneuploidies (SCA) combined (summary of findings Table 2; summary of findings Table 3; summary of findings Table 4; summary of findings Table 5; summary of findings Table 6; summary of findings Table 7). For each aneuploidy, results are presented according to the prior risk of chromosomal abnormality as high risk or unselected population and according to MPSS and TMPS methods. Results from mixed‐risk populations are summarised in Appendix 7. No study directly compared the accuracy of MPSS and TMPS. There were insufficient data to separately consider monochorionic and dichorionic pregnancies and four of the nine studies did not report chorionicity.
1. Trisomy 21 (T21 or Down syndrome)
A total of 57 studies assessed gNIPT for T21 in 2004 affected and 80,616 non T21 pregnancies. Five studies enrolled an unselected population of pregnant women undergoing aneuploidy screening, 36 studies enrolled pregnant women selected at high risk of fetal aneuploidy and 16 studies enrolled pregnant women with various prior risk and no a priori risk of fetal aneuploidy (mixed risk). Of the 57 studies, 41 assessed MPSS and 16 assessed TMPS. The results are summarised in summary of findings Table 2.
a. Unselected population of pregnant women undergoing aneuploidy screening
Five cohort studies evaluated gNIPT in an unselected population of pregnant women undergoing aneuploidy screening. The studies included 22,412 non T21 pregnancies and 96 (0.43%) T21 cases. MPSS was assessed in one study and TMPS was assessed in four studies (Figure 7).
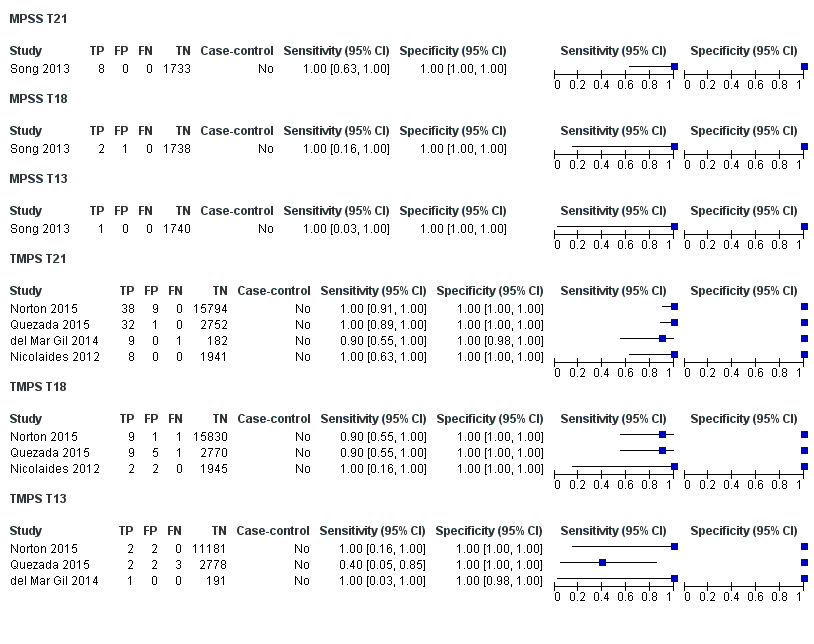
Forest plot of MPSS and TMPS for T21 in unselected pregnant women undergoing aneuploidy screening. FN: false negative, FP: false positive, MPSS: massively parallel shotgun sequencing, TMPS: targeted massively parallel sequencing, TN: true negative and TP: true positive.
i. MPSS
One prospective cohort study included eight T21 cases and 1733 non T21 pregnancies (Song 2013). The sensitivity (95% confidence interval (CI)) of MPSS was 100% (67.6% to 100%) and the specificity (95% CI) was 100% (99.8% to 100%).
ii. TMPS
TMPS was evaluated in four studies comprising 20,679 non T21 pregnancies and 88 T21 cases (del Mar Gil 2014; Nicolaides 2012; Norton 2015; Quezada 2015). The summary sensitivity (95% CI) was 99.2% (78.2% to 100%) and the summary specificity (95% CI) was 100% (> 99.9% to 100%).
iii. Comparative accuracy of MPSS and TMPS
It was not possible to compare the accuracy of MPSS and TMPS in a meta‐analysis because of limited data.
b. Selected population of pregnant women at high risk of fetal aneuploidy
Overall, 36 studies included pregnant women selected at high risk of fetal aneuploidy involving 20,317 non T21 pregnancies and 1294 (6.37%) T21 cases. MPSS was assessed in 30 studies and TMPS in six studies (Figure 8).
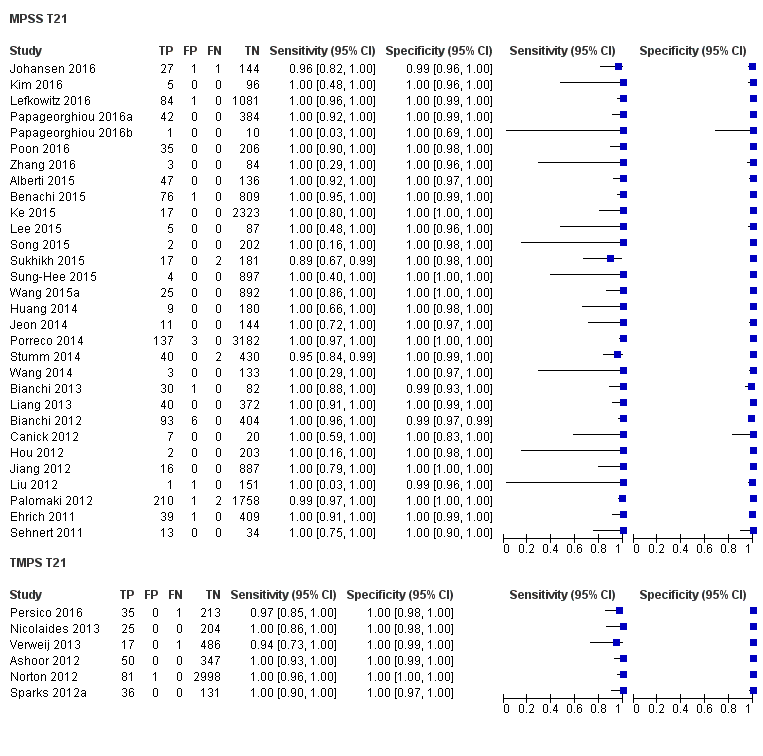
Forest plot of MPSS and TMPS for T21 in pregnant women selected at high risk of fetal aneuploidy. FN: false negative, FP: false positive, MPSS: massively parallel shotgun sequencing, TMPS: targeted massively parallel sequencing, TN: true negative and TP: true positive.
i. MPSS
The 30 MPSS studies included 15,937 non T21 pregnancies and 1048 T21 cases (Alberti 2015; Benachi 2015; Bianchi 2012; Bianchi 2013; Canick 2012; Ehrich 2011; Hou 2012; Huang 2014; Jeon 2014; Jiang 2012; Johansen 2016; Ke 2015; Kim 2016; Lee 2015; Lefkowitz 2016; Liang 2013; Liu 2012; Palomaki 2012; Papageorghiou 2016a; Papageorghiou 2016b; Poon 2016; Porreco 2014; Sehnert 2011; Song 2015; Stumm 2014; Sukhikh 2015; Sung‐Hee 2015; Wang 2014; Wang 2015a; Zhang 2016). The summary sensitivity (95% CI) was 99.7% (98.0% to 100%) and the summary specificity (95% CI) was 99.9% (99.8% to 100%).
ii. TMPS
Six studies evaluated TMPS in 4380 non T21 pregnancies and 246 T21 cases (Ashoor 2012; Nicolaides 2013; Norton 2012; Persico 2016; Sparks 2012a; Verweij 2013). The summary sensitivity (95% CI) was 99.2% (96.8% to 99.8%) and the summary specificity (95% CI) was 100% (99.8% to 100%).
iii. Comparative accuracy of MPSS and TMPS
An indirect comparison of the 30 MPSS and six TMPS studies showed no statistical evidence of a difference in sensitivity or specificity or both (P value = 0.52). The differences in sensitivity and specificity were negligible (summary of findings Table 2).
2. Trisomy 18 (T18)
Fifty studies assessed T18 in 634 cases and 78,688 non T18 pregnancies. Four studies enrolled unselected population of pregnant women undergoing aneuploidy screening, 33 studies enrolled pregnant women selected at high risk of fetal aneuploidy and 13 studies enrolled a cohort with mixed prior risk. Of the 50 studies, 38 evaluated MPSS and 12 evaluated TMPS. The results are summarised in summary of findings Table 3.
a. Unselected population of pregnant women undergoing aneuploidy screening
Four studies, comprising 22,292 non T18 pregnancies and 24 (0.11%) T18 cases, assessed gNIPT for fetal aneuploidy in unselected pregnant women. One study assessed MPSS and three studies assessed TMPS (Figure 7).
i. MPSS
One MPSS study evaluated two T18 cases and 1739 non T18 pregnancies (Song 2013). The sensitivity (95% CI) was 100% (34.3% to 100%) and the specificity (95% CI) was 99.9% (99.7% to 100%).
ii. TMPS
Three studies evaluated TMPS in 20,553 non T18 pregnancies and 22 T18 cases (Nicolaides 2012; Norton 2015; Quezada 2015). The summary sensitivity (95% CI) was 90.9% (70.0% to 97.7%) and the summary specificity (95% CI) was 100% (99.9% to 100%).
iii. Comparative accuracy of MPSS and TMPS
It was not possible to compare the accuracy of MPSS and TMPS in a meta‐analysis because data were sparse.
b. Selected population of pregnant women at high risk of fetal aneuploidy
A total of 33 studies included pregnant women selected at high risk of fetal aneuploidy involving 444 (2.20%) T18 cases and 20,190 non T18 pregnancies. Of these, 28 studies assessed MPSS and five studies assessed TMPS (Figure 9).
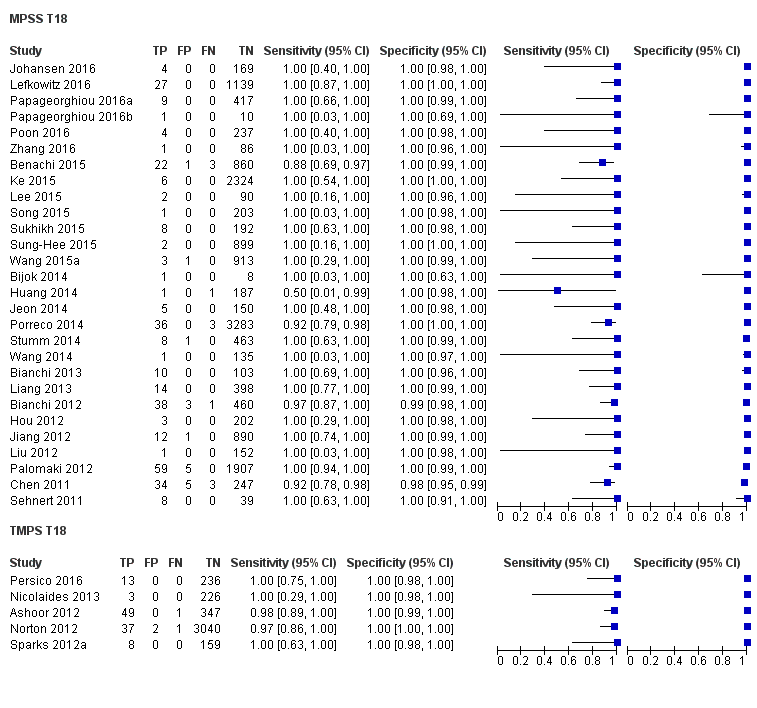
Forest plot of MPSS and TMPS for T18 in pregnant women selected at high risk of fetal aneuploidy. FN: false negative, FP: false positive, MPSS: massively parallel shotgun sequencing, TMPS: targeted massively parallel sequencing, TN: true negative and TP: true positive.
i. MPSS
Twenty‐eight studies evaluated MPSS in 16,180 non T18 pregnancies and 332 T18 cases (Benachi 2015; Bianchi 2012; Bianchi 2013; Bijok 2014; Chen 2011; Hou 2012; Huang 2014; Jeon 2014; Jiang 2012; Johansen 2016; Ke 2015; Lee 2015; Lefkowitz 2016; Liang 2013; Liu 2012; Palomaki 2012; Papageorghiou 2016a; Papageorghiou 2016b; Poon 2016; Porreco 2014; Sehnert 2011; Song 2015; Stumm 2014; Sukhikh 2015; Sung‐Hee 2015; Wang 2014; Wang 2015a; Zhang 2016). The summary sensitivity (95% CI) was 97.8% (92.5% to 99.4%) and the summary specificity (95% CI) was 99.9% (99.8% to 100%).
ii. TMPS
Five studies evaluated TMPS in 4010 non T18 pregnancies and 112 T18 cases (Ashoor 2012; Nicolaides 2013; Norton 2012; Persico 2016; Sparks 2012a). The summary sensitivity (95% CI) was 98.2% (93.1% to 99.6%) and the summary specificity (95% CI) was 100% (99.8% to 100%).
iii. Comparative accuracy of MPSS and TMPS
An indirect comparison of the 28 MPSS and five TMPS studies showed no statistical evidence of a difference in sensitivity, specificity or both (P value = 0.47). The differences in sensitivity and specificity were negligible (summary of findings Table 3).
3. Trisomy 13 (T13)
T13 was assessed in 39 studies comprising 215 affected and 68,743 non T13 pregnancies. Four studies evaluated unselected population of pregnant women undergoing fetal aneuploidy screening, while 22 studies evaluated women at high risk of fetal aneuploidy and 13 studies evaluated mixed prior risk cohorts. Of the 39 studies, 29 assessed MPSS and 10 assessed TMPS. The results are summarised in summary of findings Table 4.
a. Unselected population of pregnant women undergoing aneuploidy screening
Four studies assessed gNIPT for T13 in unselected pregnant women. The studies included 15,894 non T13 pregnancies and nine (0.06%) T13 cases. Three studies evaluated TMPS and one study evaluated MPSS (Figure 7).
i. MPSS
One study evaluated MPSS in one T13 case and 1740 non T13 pregnancies (Song 2013). The sensitivity (95% CI) was 100% (20.7% to 100%) and the specificity (95% CI) was 100% (99.8% to 100%).
ii. TMPS
Three studies evaluated TMPS in 14,154 non T13 pregnancies and eight T13 cases (del Mar Gil 2014; Norton 2015; Quezada 2015). The summary sensitivity (95% CI) was 65.1% (9.2% to 97.2%) and the summary specificity (95% CI) was 100% (99.9% to 100%).
iii. Comparative accuracy of MPSS and TMPS
It was not possible to compare the accuracy of MPSS and TMPS in a meta‐analysis because data were sparse.
b. Selected population of pregnant women at high risk of fetal aneuploidy
A total of 22 studies evaluated pregnant women selected at high risk of fetal aneuploidy. The studies included 14,103 non T13 pregnancies and 148 (1.05%) T13 cases. Twenty studies assessed MPSS and two studies assessed TMPS (Figure 10).

Forest plot of MPSS and TMPS for T13 in pregnant women selected at high risk of fetal aneuploidy. FN: false negative, FP: false positive, MPSS: massively parallel shotgun sequencing, TMPS: targeted massively parallel sequencing, TN: true negative and TP: true positive.
i. MPSS
Twenty studies evaluated MPSS in 13,810 non T13 pregnancies and 128 T13 cases (Benachi 2015; Bianchi 2012; Bianchi 2013; Canick 2012; Chen 2011; Jiang 2012; Johansen 2016; Ke 2015; Lee 2015; Lefkowitz 2016; Liang 2013; Liu 2012; Palomaki 2012; Papageorghiou 2016a; Poon 2016; Porreco 2014; Sehnert 2011; Song 2015; Stumm 2014; Sukhikh 2015). The summary sensitivity (95% CI) was 95.8% (86.1% to 98.9%) and the summary specificity (95% CI) was 99.8% (99.8% to 99.9%).
ii. TMPS
Two studies evaluated TMPS in 293 non T13 pregnancies and 20 T13 cases (Hall 2014; Persico 2016). The summary sensitivity (95% CI) was 100% (83.9% to 100%) and the summary specificity (95% CI) was 100% (98.7% to 100%).
iii. Comparative accuracy of MPSS and TMPS
It was not possible to compare the accuracy of MPSS and TMPS in a meta‐analysis because data were sparse.
4. Turner syndrome (45,X)
Turner syndrome (45,X) was assessed in 20 studies, comprising 232 affected and 9849 non 45,X pregnancies. Among these studies, 16 enrolled pregnant women selected at high risk of fetal aneuploidy and four enrolled a cohort of pregnant women with mixed prior risk. Of the 20 studies, 14 evaluated MPSS and six evaluated TMPS. The results are summarised in summary of findings Table 5.
a. Unselected population of pregnant women undergoing aneuploidy screening
No study assessed 45,X in this population.
b. Selected population of pregnant women at high risk of fetal aneuploidy
Sixteen studies included 198 (2.35%) affected and 8421 non 45,X pregnancies. MPSS and TMPS were assessed by 12 and four studies respectively (Figure 11).

Forest plot of MPSS and TMPS for 45,X in pregnant women selected at high risk of fetal aneuploidy. FN: false negative, FP: false positive, MPSS: massively parallel shotgun sequencing, TMPS: targeted massively parallel sequencing, TN: true negative and TP: true positive.
i. MPSS
Twelve studies evaluated MPSS in 119 affected and 7440 non 45,X pregnancies (Bianchi 2012; Bianchi 2013; Hou 2012; Jiang 2012; Lefkowitz 2016; Liang 2013; Liu 2012; Mazloom 2013; Porreco 2014; Sehnert 2011; Song 2015; Sukhikh 2015). The summary sensitivity (95% CI) was 91.7% (78.3% to 97.1%) and the summary specificity (95% CI) was 99.6% (98.9% to 99.8%).
ii. TMPS
Four studies evaluated TMPS in 79 affected and 985 non 45,X pregnancies (Hooks 2014; Nicolaides 2013; Nicolaides 2014a; Persico 2016). The summary sensitivity (95% CI) was 92.4% (84.1% to 96.5%) and the summary specificity (95% CI) was 99.8% (98.3% to 100%).
iii. Comparative accuracy of MPSS and TMPS
An indirect comparison of the 12 MPSS and four TMPS studies showed no statistical evidence of a difference in sensitivity, specificity or both (P value = 0.40). The differences in sensitivity and specificity were negligible (summary of findings Table 5).
5. Triple X syndrome (47,XXX)
Seven studies assessed 47,XXX, comprising 14 (0.23%) affected and 6021 non 47,XXX pregnancies (Hooks 2014; Lefkowitz 2016; Liang 2013; Mazloom 2013; Nicolaides 2014a; Porreco 2014; Song 2015). The studies enrolled pregnant women selected at high risk of fetal aneuploidy. Five studies evaluated MPSS and two studies evaluated TMPS. (Figure 12; Table 8). We did not perform a separate meta‐analysis for 47,XXX due to sparse data (very few cases or studies, or one or more subgroups had no study).

Forest plot of MPSS and TMPS for 47,XXX, 47,XXY and 47,XYY in pregnant women selected at high risk of fetal aneuploidy. FN: false negative, FP: false positive, MPSS: massively parallel shotgun sequencing, TMPS: targeted massively parallel sequencing, TN: true negative and TP: true positive.
| Test | Number of studies | Number of affected pregnancies | Number of unaffected pregnanciesa | |
| 47,XXX | ||||
| Selected high risk pregnant women | MPSS | 5 | 8 | 5441 |
| TMPS | 2 | 6 | 580 | |
| 47,XXY | ||||
| Selected high risk pregnant women | MPSS | 7 | 14 | 6466 |
| TMPS | 3 | 8 | 827 | |
| 47,XYY | ||||
| Selected high risk pregnant women | MPSS | 7 | 11 | 6418 |
| TMPS | 1 | 3 | 169 | |
aUnaffected pregnancies: we included pregnancies with any other aneuploidy than the one under analysis with all euploid cases as "unnon affected".
6. Klinefelter syndrome (47,XXY)
Twelve studies assessed 47,XXY in 25 (0.33%) affected and 7584 non 47,XXY pregnancies (Hooks 2014; Hou 2012; Jiang 2012; Lau 2012; Lefkowitz 2016; Liang 2013; Mazloom 2013; Nicolaides 2014a; Persico 2016; Porreco 2014; Samango‐Sprouse 2013; Song 2015). Ten studies enrolled pregnant women selected at high risk of fetal aneuploidy (Figure 12; Table 8) and two studies enrolled pregnant women with mixed risk (See Finding section 11). No study assessed 47,XXY in an unselected population of pregnant women undergoing aneuploidy screening. Eight studies assessed MPSS and four studies assessed TMPS. We did not perform a separate meta‐analysis for 47,XXY due to sparse data (very few cases or studies, or one or more subgroups had no study).
7. 47,XYY
Ten studies assessed 47,XYY in 16 (0.23%) affected and 6971 non 47,XYY pregnancies (Hou 2012; Jiang 2012; Lefkowitz 2016; Liang 2013; Liu 2012; Mazloom 2013; Nicolaides 2014a; Porreco 2014; Samango‐Sprouse 2013; Shaw 2014). Eight studies enrolled pregnant women selected at high risk of fetal aneuploidy (Figure 12; Table 8) and two studies enrolled pregnant women with mixed risk (See Finding section 11). Eight studies used MPSS and two studies used TMPS. We did not perform a separate meta‐analysis for 47,XXX due to sparse data (very few cases or studies, or one or more subgroups had no study).
8. All autosomes combined
Autosomal aneuploidies were assessed in 61 studies. The studies included 84,954 pregnant women of which 2853 were T21, T18 or T13 pregnancies and 82,073 were unaffected. Among these 61 studies, 43 assessed MPSS and 18 assessed TMPS. Of the 61 studies, five enrolled unselected pregnant women, 39 enrolled high‐risk pregnant women and 17 enrolled a cohort of mixed prior risk. The results are summarised in summary of findings Table 6. The results for mixed risk cohorts are summarised in Appendix 7.
a. Unselected population of pregnant women undergoing aneuploidy screening
Five studies assessed 129 (0.58%) affected and 22,379 unaffected (non T21, T18 and T13) pregnancies. Of the five studies, one study assessed MPSS and four studies assessed TMPS (Figure 13).

Forest plot of MPSS and TMPS for autosomes (T21, T18 and T13 combined) in unselected pregnant women undergoing aneuploidy screening. FN: false negative, FP: false positive, MPSS: massively parallel shotgun sequencing, TMPS: targeted massively parallel sequencing, TN: true negative and TP: true positive.
i. MPSS
Only one study assessed MPSS (Song 2013). The study evaluated 1730 unaffected (non T21, T18 and T13) pregnancies and 11 cases in women with singleton pregnancy. The sensitivity (95% CI) was 100% (74.1% to 100%) and the specificity (95% CI) was 99.9% (99.7% to 100%).
ii. TMPS
Four studies assessed TMPS in 20,649 unaffected (non T21, T18 and T13) pregnancies and 118 cases (del Mar Gil 2014; Nicolaides 2012; Norton 2015; Quezada 2015). Of the four studies, three studies included only women with singleton pregnancy and the remaining study included only women with multifetal pregnancy (Table 9). Based on the four studies, the summary sensitivity (95% CI) was 94.9% (89.1% to 97.7%) and the summary specificity (95% CI) was 99.9% (99.8% to 99.9%).
| Test subgroups | Number of studies | Number of affected pregnancies | Number of unaffected pregnanciesa | Sensitivityb % (95% CI) | Specificityb % (95% CI) | |
| Pregnancy type | ||||||
| Autosomes (T21, T18 and T13 combined), unselected population | ||||||
| MPSS | singleton | 1 | 11 | 1730 | 100 (74.1 to 100) | 99.9 (99.7 to 100) |
| TMPS | singleton | 3 | 107 | 20,468 | 95.5 (87.4 to 98.4) | 99.9 (99.8 to 100) |
| multifetal | 1 | 11 | 181 | 90.9 (62.3 to 98.4) | 100 (97.9 to 100) | |
| Autosomes (T21, T18 and T13 combined), selected high‐risk population | ||||||
| MPSS | singleton | 19 | 1087 | 11,180 | 98.3 (97.3 to 98.9) | 99.6 (99.5 to 99.7) |
| multifetal | 3 | 21 | 206 | 95.2 (72.9 to 99.3) | 100 (98.2 to 100)c | |
| TMPS | singleton | 7 | 378 | 4282 | 98.9 (97.2 to 99.6) | 99.9 (99.8 to 100) |
| SCA (45,X, 47,XXX, 47,XXY and 47,XYY combined), selected high‐risk population | ||||||
| MPSS | singleton | 7 | 101 | 4690 | 88.3 (52.9 to 98.1) | 99.3 (97.5 to 99.8) |
| TMPS | 4 | 96 | 968 | 93.8 (86.8 to 97.2) | 99.6 (98.1 to 99.9) | |
| Gestational age | ||||||
| Autosomes (T21, T18 and T13 combined), unselected population | ||||||
| MPSS | ≤29 weeks | 1 | 11 | 1730 | 100 (74.1 to 100) | 99.9 (99.7 to 100) |
| TMPS | ≤15 weeks | 4 | 118 | 20,649 | 94.9 (89.1 to 97.7) | 99.9 (99.8 to 99.9) |
| Autosomes (T21, T18 and T13 combined), selected high‐risk population | ||||||
| MPSS | ≤15 weeks | 3 | 49 | 532 | 100 (92.7 to 100)c | 100 (99.3 to 100)c |
| ≤29 weeks | 12 | 594 | 4605 | 98.3 (96.9 to 99.1) | 99.3 (99.0 to 99.5) | |
| ≤42 weeks | 13 | 729 | 7831 | 98.9 (95.0 to 99.8) | 99.9 (99.8 to 99.9) | |
| TMPS | ≤15 weeks | 2 | 128 | 498 | 99.2 (95.7 to 99.9)c | 100 (99.2 to 100)c |
| ≤29 weeks | 2 | 33 | 535 | 97.0 (84.7 to 99.5)c | 100 (99.3 to 100)c | |
| ≤42 weeks | 2 | 163 | 3084 | 99.4 (95.8 to 99.9) | 99.9 (99.7 to 100) | |
| SCA (45,X, 47,XXX, 47,XXY and 47,XYY combined), selected high‐risk population | ||||||
| MPSS | ≤15 weeks | 1 | 2 | 202 | 0.00 (0.00 to 65.8) | 99.5 (97.2 to 99.9) |
| ≤29 weeks | 5 | 58 | 996 | 86.5 (63.1 to 96.0) | 95.1 (93.5 to 96.3) | |
| ≤42 weeks | 5 | 89 | 6103 | 95.8 (80.3 to 99.2) | 99.6 (99.4 to 99.7) | |
| TMPS | ≤15 weeks | 2 | 58 | 343 | 93.1 (83.0 to 97.4) | 99.7 (98.0 to 100) |
| ≤42 weeks | 1 | 34 | 380 | 97.1 (85.1 to 99.5) | 98.9 (97.3 to 99.6) | |
45,X: Turner syndrome, 47,XXX: triple X syndrome, 47,XXY: Klinefelter syndrome, T21: trisomy 21, T18: trisomy 18, T13: trisomy 13 CI: confidence interval, MPSS: massively parallel shotgun sequencing, SCA: sex chromosome aneuploidies, TMPS: targeted massively parallel sequencing.
aWe included pregnancies with any other aneuploidy than the one under analysis with all euploid cases as "unaffected" pregnancies.
bFor two or more studies, the sensitivities and specificities are the summary estimates obtained from meta‐analysis.
cSimple pooling used to obtain summary estimates of sensitivity, specificity or both.
iii. Comparative accuracy of MPSS and TMPS
It was not possible to compare the accuracy of MPSS and TMPS in a meta‐analysis due to limited data.
b. Selected population of pregnant women at high risk of fetal aneuploidy
A total of 39 studies included 1886 (9.39%) affected and 20,079 unaffected (non T21, T18 and T13) pregnancies. Of the 39 studies, 32 assessed MPSS and seven assessed TMPS (Figure 14).

Forest plot of MPSS and TMPS for autosomes (T21, T18 and T13) in pregnant women selected at high risk of fetal aneuploidy. FN: false negative, FP: false positive, MPSS: massively parallel shotgun sequencing, TMPS: targeted massively parallel sequencing, TN: true negative and TP: true positive.
i. MPSS
Thirty‐two MPSS studies evaluated 15,797 unaffected (non T21, T18 and T13) pregnancies and 1508 cases (Alberti 2015; Benachi 2015; Bianchi 2012; Bianchi 2013; Bijok 2014; Canick 2012; Chen 2011; Ehrich 2011; Hou 2012; Huang 2014; Jeon 2014; Jiang 2012; Johansen 2016; Ke 2015; Kim 2016; Lee 2015; Lefkowitz 2016; Liang 2013; Liu 2012; Palomaki 2012; Papageorghiou 2016a; Papageorghiou 2016b; Poon 2016; Porreco 2014; Sehnert 2011; Song 2015; Stumm 2014; Sukhikh 2015; Sung‐Hee 2015; Wang 2014; Wang 2015a; Zhang 2016). Of the 32 studies, 19 evaluated only singleton pregnancies, three evaluated only multifetal pregnancies, three evaluated singleton and multifetal pregnancies, and the remaining seven studies did not report type of pregnancy. Based on the 32 studies, the summary sensitivity (95% CI) was 98.8% (97.2% to 99.5%) and the summary specificity (95% CI) was 99.9% (99.7% to 100%). Results are presented separately for singleton and multifetal pregnancy studies in Table 9. The sensitivity tends to be lower in multifetal pregnancies but there are no enough studies in this subgroup to compare MPSS performance according to pregnancy type.
ii. TMPS
Seven TMPS studies evaluated 378 cases and 4282 unaffected (non T21, T18 and T13) pregnancies in women with singleton pregnancy (Ashoor 2012; Hall 2014; Nicolaides 2013; Norton 2012; Persico 2016; Sparks 2012a; Verweij 2013). The summary sensitivity (95% CI) was 98.9 (97.2% to 99.6%) and the summary specificity (95% CI) was 99.9% (99.8% to 100%) (Table 9).
iii. Comparative accuracy of MPSS and TMPS
An indirect comparison of the 32 MPSS and seven TMPS studies showed no statistical evidence of a difference in sensitivity, specificity or both (P value = 0.11). The differences in sensitivity and specificity were negligible (summary of findings Table 6).
9. All sex chromosome aneuploidies (SCA) combined
The sex chromosome aneuploidies (45,X, 47,XXX, 47,XXY and 47,XYY) were considered together as one target condition. SCA was assessed in 20 studies, comprising 286 affected cases and 9839 non SCA pregnancies. MPSS and TMPS were assessed by 14 and six studies, respectively. Among the 20 studies, 16 enrolled pregnant women selected at high risk of fetal aneuploidy and four enrolled a cohort of pregnant women with mixed prior risk. The results are summarised in summary of findings Table 7. The results for mixed risk cohorts are summarised in Appendix 7.
a. Unselected population of pregnant women undergoing aneuploidy screening
No study assessed SCA in an unselected population of pregnant women.
b. Selected population of pregnant women at high risk of fetal aneuploidy
Sixteen studies involving 247 (2.93%) affected and 8420 non SCA pregnancies were included. MPSS and TMPS were assessed by 12 and four studies respectively (Figure 15).

Forest plot of MPSS and TMPS for SCA (45,X, 47,XXX, 47,XXY and 47,XYY combined) in pregnant women selected at high risk of fetal aneuploidy. FN: false negative, FP: false positive, MPSS: massively parallel shotgun sequencing, TMPS: targeted massively parallel sequencing, TN: true negative and TP: true positive.
i. MPSS
Twelve MPSS studies evaluated 151 affected and 7452 non SCA pregnancies (Bianchi 2012; Bianchi 2013; Hou 2012; Jiang 2012; Lefkowitz 2016; Liang 2013; Liu 2012; Mazloom 2013; Porreco 2014; Sehnert 2011; Song 2015; Sukhikh 2015). Of the 12 studies, seven included only women with singleton pregnancy, one evaluated singleton and multifetal pregnancies, and the remaining four studies did not report type of pregnancy. Results are presented separately for singleton and multifetal pregnancy studies in Table 9. Based on all 12 studies, the summary sensitivity (95% CI) was 91.9% (73.8% to 97.9%) and the summary specificity (95% CI) was 99.5% (98.8% to 99.8%).
ii. TMPS
Four TMPS studies evaluated 96 affected and 968 non SCA pregnancies in women with singleton pregnancy (Hooks 2014; Nicolaides 2013; Nicolaides 2014a; Persico 2016). The summary sensitivity (95% CI) was 93.8% (86.8% to 97.2%) and the summary specificity (95% CI) was 99.6% (98.1% to 99.9%).
iii. Comparative accuracy of MPSS and TMPS
An indirect comparison of the 12 MPSS and four TMPS studies showed no statistical evidence of a difference in sensitivity, specificity or both (P value = 0.41). The differences in sensitivity and specificity were negligible (summary of findings Table 7).
10. gNIPT approach (MPSS or TMPS) against traditional screening tests
Five studies directly compared a gNIPT approach (MPSS or TMPS) and traditional screening tests for autosomal aneuploidies by using cohorts of pregnant women who were tested by both methods. Three studies compared TMPS and traditional screening tests, and two studies compared MPSS and traditional screening tests. The results are summarised in summary of findings Table 2, summary of findings Table 3, summary of findings Table 4 and summary of findings Table 6.
a. Unselected population of pregnant women undergoing aneuploidy screening
Only one study that compared TMPS and a traditional screening test evaluated T21, T18 and T13 individually in an unselected population of pregnant women undergoing aneuploidy screening (Norton 2015). This study evaluated 38, 10 and two cases of T21, T18 and T13, respectively and 15,803, 15,831 and 11,183 non T21, T18 and T13, respectively (Figure 16). Direct comparisons between gNIPT and traditional screening tests were not possible because there was only one study but authors observed eight, two and one cases of T21, T18 and T13 respectively missed by traditional screening test and only one T18 case missed by TMPS.
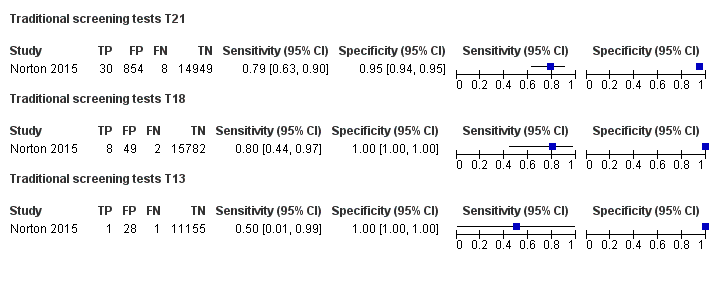
Forest plot of traditional screening tests for T21, T18 and T13 in unselected pregnant women undergoing aneuploidy screening. FN: false negative, FP: false positive, MPSS: massively parallel shotgun sequencing, TMPS: targeted massively parallel sequencing, TN: true negative and TP: true positive.
Four studies compared a gNIPT approach with a traditional screening test for autosomal aneuploidies (T21, T18 and T13 combined) in 22,367 unselected pregnant women (Figure 17). Three studies (Nicolaides 2012; Norton 2015; Quezada 2015) compared TMPS and first‐trimester combined test (Figure 18), and one study (Song 2013) compared MPSS and a second‐trimester triple test. The three TMPS studies had similar characteristics. Meta‐analyses of direct comparisons between gNIPT and traditional screening tests were not possible because traditional screening tests used different cutpoints and there were very few studies to enable estimation of summary sensitivity and specificity at specific cutpoints. Individual study results are presented in Table 10. Overall, 16 aneuploid cases were missed by traditional screening test and only five cases were missed by gNIPT approach. While specificity was consistently higher for TMPS than traditional screening tests, sensitivity was not consistently higher as shown in Figure 18.

Forest plot of traditional screening tests for autosomes (T21, T18 and T13 combined) in unselected pregnant women undergoing aneuploidy screening. FN: false negative, FP: false positive, TN: true negative and TP: true positive.

Forest plot of comparative studies of TMPS and traditional screening tests for autosomes (T21, T18 and T13 combined) in unselected pregnant women undergoing aneuploidy screening. FN: false negative, FP: false positive, TN: true negative and TP: true positive.
| Study | Sensitivity (true positives/cases) % | Difference % (95% CI) | Specificity (true negatives/unaffecteda) % | Difference % (95% CI) | ||
| MPSS | Traditional screening tests | MPSS | Traditional screening tests | |||
| 100 (11/11) | 54.6 (6/11) | 45.5 (10.0 to 72.0) | 99.9 (1729/1730) | 86.0 (1487/1730) | 14.0 (12.4 to 15.7) | |
| TMPS | Traditional screening tests | TMPS | Traditional screening tests | |||
| 100 (10/10) | 100 (10/10) | 0.00 (‐27.8 to 27.8) | 99.9 (1937/1939) | 95.5 (1852/1939) | 4.38 (3.51 to 5.40) | |
| 98.0 (49/50) | 78.0 (39/50) | 20.0 (7.44 to 33.3) | 99.9 (15,779/15,791) | 94.1 (14,860/15,791) | 5.82 (5.46 to 6.20) | |
| 91.5 (43/47) | 100 (49/49) | ‐8.51 (‐19.9 to 0.40) | 99.7 (2730/2738) | 95.6 (2663/2787) | 4.16 (3.40 to 5.00) | |
CI: confidence interval, MPSS: massively parallel shotgun sequencing, TMPS: targeted massively parallel sequencing.
aWe included pregnancies with any other aneuploidy than the one under analysis with all euploid cases as "unaffected" pregnancies.
b. Mixed‐risk cohort of fetal aneuploidy
One study compared MPSS and traditional screening test for autosomal aneuploidies (T21, T18 and T13 combined) in a cohort with mixed prior risk of fetal aneuploidy including 1908 non T21, T18 and T31 pregnancies and four cases of autosomal aneuploidy (Bianchi 2014a). Traditional screening tests included first‐trimester combined test or a second‐trimester result (quadruple, serum integrated, fully integrated or sequential) (Figure 19). Overall, 80 unaffected pregnancies were detected as affected by traditional screening test against 12 for TMPS.

Forest plot of traditional screening tests for autosomes (T21, T18 and T13 combined) in pregnant women with mixed prior risk of fetal aneuploidy. FN: false negative, FP: false positive, MPSS: massively parallel shotgun sequencing, TMPS: targeted massively parallel sequencing, TN: true negative and TP: true positive.
11. Pregnant women with mixed prior risk of fetal aneuploidy
Summary sensitivities and specificities for cohorts of pregnant women with mixed prior risk of fetal aneuploidy are presented in Appendix 7. For autosomal aneuploidies, 17 studies included 838 cases and 39,615 unaffected (non T21, T18 and T13) pregnancies. Of the 17 studies, 10 assessed MPSS and seven assessed TMPS (Figure 20). For T21, 16 studies included 614 cases (1.6%) and 37,887 non T21 pregnancies. Of the 16 studies, 10 assessed MPSS and six assessed TMPS. For T18, 13 studies included 166 cases (0.5%) and 36,206 non T18 pregnancies. Of the 13 studies, nine assessed MPSS and four assessed TMPS. For T13, 13 studies included 58 cases (0.1%) and 38,746 non T13 pregnancies. Eight of the 13 studies assessed MPSS and the other five assessed TMPS (Figure 21). For SCA, four studies included 39 cases and 1419 non SCA pregnancies; two of the studies assessed MPSS and the other two assessed TMPS (Figure 22). For 45,X, four studies included 34 cases (2.4%) and 1424 non 45,X pregnancies. Of the four studies, two studies assessed MPSS and two studies assessed TMPS. For 47,XXY, two studies (one of MPSS and one of TMPS) included three cases (1%) and 291 non 47,XXY pregnancies. For 47,XYY, two studies included two cases (0.5%) and 384 non 47,XYY pregnancies; one study assessed MPSS and the other study assessed TMPS. No study assessed gNIPT for 47,XXX in cohorts of pregnant women with mixed prior risk of fetal aneuploidy (Figure 23).

Forest plot of MPSS and TMPS for autosomes (T21, T18 and T13 combined) in pregnant women with mixed prior risk of fetal aneuploidy. FN: false negative, FP: false positive, MPSS: massively parallel shotgun sequencing, TMPS: targeted massively parallel sequencing, TN: true negative and TP: true positive.

Forest plot of MPSS and TMPS for T21, T18 or T13 in pregnant women with mixed prior risk of fetal aneuploidy. FN: false negative, FP: false positive, MPSS: massively parallel shotgun sequencing, TMPS: targeted massively parallel sequencing, TN: true negative and TP: true positive.
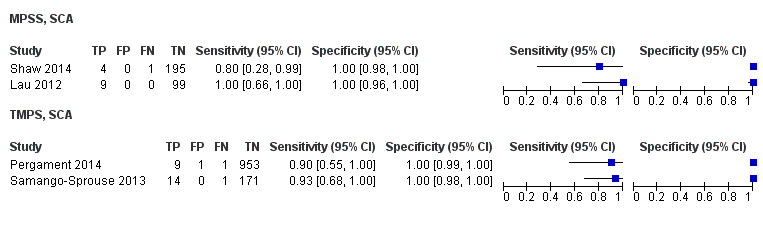
Forest plot of MPSS and TMPS for SCA (45,X, 47,XXX, 47,XXY and 47,XYY combined) in pregnant women with mixed prior risk of fetal aneuploidy. FN: false negative, FP: false positive, MPSS: massively parallel shotgun sequencing, TMPS: targeted massively parallel sequencing, TN: true negative and TP: true positive.

Forest plot of MPSS and TMPS for 45,X, 47,XXY or 47,XYY in pregnant women with mixed prior risk of fetal aneuploidy. FN: false negative, FP: false positive, MPSS: massively parallel shotgun sequencing, TMPS: targeted massively parallel sequencing, TN: true negative and TP: true positive.
12. Failure rates
Table 7 shows the non‐negligible failure rate of gNIPT reported in the studies. gNIPT assay failure rate was reported in 46 out of 65 (71%) studies. The largest failure rate (25%) was observed in a study that used its own developed MPSS assay (Alberti 2015). The main reasons for assay failure included low amount of ccfDNA, low fetal fraction DNA and failure of sample to pass quality control. The failure rate ranged between 0% and 25% for MPSS and between 0.8% and 7.5% for TMPS. The number of aneuploid and euploid cases in failed samples was reported in 23 of 46 (50%) studies. Among these 23 studies, there were 1064 euploid cases and 79 aneuploid cases among 1143 failed samples. The failure rate among aneuploid cases, ranged between 0% and 50% for MPSS and between 0% and 23% for TMPS. The failure rate among euploid cases ranged between 0% and 6.7% for MPSS and between 1% and 7.6% for TMPS.
Investigation of heterogeneity
We planned to evaluate the effect of potential sources of heterogeneity such as type of reference standard and ethnicity. However, formal investigations using meta‐regression were not possible due to limited data and little or no heterogeneity in the sensitivities and specificities. Most studies (55%) used karyotyping while the remaining 29 studies (45%) used multiple reference standards. Ethnicity was not reported by 26 (40%) studies while the population in 21 (32%) studies was more than 50% Asian and in 18 (28%) studies the population was more than 50% Caucasian. In Appendix 8, the number of studies, affected and unaffected pregnancies are shown according to the gNIPT approach and prior risk of fetal aneuploidy. We also planned to assess gNIPT performance according to gestational age and gNIPT approach for autosomes and SCA aneuploidies. The accuracy of gNIPT appears to be high in all gestational age groups.
Sensitivity analyses
We did not perform sensitivity analyses to assess the effect of the interval between blood collection for gNIPT and fluid collection for reference standard because most studies had an acceptable interval between sample collection for index test and reference standard. Due to lack of data or lack of variability in estimates of sensitivity and specificity, analyses of the effect of high or unclear risk of bias according to the QUADAS‐2 domains were not done. We performed sensitivity analyses using data from all autosomes combined and all SCA combined in order to have enough studies to assess the impact of study design and number of cases. The results are presented in Table 11. Excluding case‐control studies or studies with less than 10 aneuploid cases had little or no impact on our findings.
| Test | Number of studies | Number of affected pregnancies | Number of unaffected pregnanciesa | Summary sensitivity % (95% CI) | Summary specificity % (95% CI) | P valueb |
| Case‐control studies excluded | ||||||
| Autosomes (T21, T18 and T13 combined), selected high‐risk population | ||||||
| MPSS | 22 | 696 | 11,293 | 98.3 (95.1 to 99.4) | 99.9 (99.8 to 100) | 0.72 |
| TMPS | 4 | 219 | 3,813 | 98.6 (95.8 to 99.6) | 99.9 (99.8 to 100) | |
| SCA (45,X, 47,XXX, 47,XXY and 47,XYY combined), selected high‐risk population | ||||||
| MPSS | 10 | 98 | 5,872 | 91.9 (73.8 to 97.9) | 99.5 (98.8 to 99.8) | 0.41 |
| TMPS | 2 | 6 | 472 | 93.8 (86.8 to 97.2) | 99.6 (98.1 to 99.9) | |
| Exclusion of studies with less than 10 pregnancies with aneuploidy | ||||||
| Autosomes (T21, T18 and T13 combined), selected high‐risk population | ||||||
| MPSS | 21 | 1458 | 13,921 | 98.7 (96.8 to 99.4) | 99.8 (99.5 to 100) | 0.07 |
| TMPS | 7 | 378 | 4,282 | 98.9 (97.2 to 99.6) | 99.9 (99.8 to 100) | |
| SCA (45,X, 47,XXX, 47,XXY and 47,XYY combined), selected high‐risk population | ||||||
| MPSS | 6 | 130 | 5,761 | 94.5 (80.6 to 98.6) | 99.4 (97.6 to 99.8) | 0.28 |
| TMPS | 2 | 90 | 496 | 94.4 (87.3 to 97.7) | 99.0 (97.6 to 99.6) | |
45,X: Turner syndrome, 47,XXX: triple X syndrome, 47,XXY: Klinefelter syndrome, T21: trisomy 21, T18: trisomy 18, T13: trisomy 13 CI: confidence interval, MPSS: massively parallel shotgun sequencing, SCA: sex chromosome aneuploidies, TMPS: targeted massively parallel sequencing.
aWe included pregnancies with any other aneuploidy than the one under analysis with all euploid cases as "unaffected" pregnancies.
bThe P value indicates the statistical significance of the difference in model fit and was obtained from likelihood ratio tests comparing models with and without a covariate for test type.
Discussion
Summary of main results
This review included data from 65 studies of 86,139 pregnant women (including 3141 aneuploids) tested by genomics‐based non‐invasive prenatal testing (gNIPT) and a reference standard. The gNIPT method used circulating cell‐free DNA (ccfDNA) in maternal blood for the detection of common fetal aneuploidies (T21, T18, T13, 45,X, 47,XXY, 47,XXX and 47,XYY). The number of gNIPT studies in unselected populations was limited (five studies), but 42 studies in high‐risk cohorts provided data for various meta‐analyses. Few (14%) studies included more than 100 aneuploid cases. Importantly, in almost all studies, the risk of bias was generally high with respect to patient selection as well as flow and timing. Some women can spontaneously lose their pregnancy after enrolment into a study. However, none of the studies reported such events. Since women with spontaneous abortions are likely to be lost to follow‐up, we believe that any risk of bias has been captured in the quality assessment of studies. Blood samples for gNIPT were mainly taken just before the invasive test (reference standard) and so pregnancies were unlikely to terminate naturally between the gNIPT and the reference standard. Across all studies, applicability concerns were low in the index test and reference standard domains.
These results show that massively parallel shotgun sequencing (MPSS) and targeted massively parallel sequencing (TMPS) perform similarly in terms of clinical sensitivity and specificity for the detection of fetal T21, T18, T13 and sex chromosome aneuploidy (SCA). However, no study compared the two approaches head‐to‐head in the same cohort of patients.
In high‐risk pregnancies, gNIPT methods (MPSS and TMPS) were highly accurate for detection of any of the three major trisomies (T21, T18 and T13) with sensitivities from 95.8% to 99.7% depending on specific trisomies and specificities above 99%. There were no statistically significant differences in accuracy between MPSS and TMPS.
In unselected cohorts of pregnant women, only one study evaluated MPSS. Based on meta‐analytic findings for each trisomy, TMPS appeared to be accurate for the detection of T21, with lower accuracy for T18 and T13. When compared to traditional prenatal screening tests, only four studies were identified (three for TMPS and one for MPSS). Genomics‐based non‐invasive prenatal testing showed greater specificity for T21 and T18 than traditional screening tests, while inconsistent results were observed for sensitivity. The inconsistency may be due to different cutpoints for traditional screening tests though one would expect that to also affect specificity. Given the small number of studies, the differences may be due to chance or there may be other differences between the studies that were not apparent.
With respect to the replacement of invasive tests, the performance of gNIPT observed in this review is not sufficient to replace current invasive diagnostic tests.
We also compared the diagnostic test accuracy of MPSS and TMPS for all three autosomes combined because gNIPT is being clinically proposed as one test during prenatal follow‐up to detect any of the three conditions. Under this scenario, in high‐risk pregnancies of fetal aneuploidy, there was no statistically significant difference in diagnostic accuracy between MPSS and TMPS. In unselected cohorts of pregnant women, a test comparison was not possible due to limited data.
There was paucity of data for each SCA. In high‐risk cohorts, all SCAs combined gave a pooled sensitivity (95% CI) and specificity (95% CI) of 91.9% (73.8% to 97.9%) and 99.5% (98.8% to 99.8%) from 12 MPSS studies. The pooled sensitivity (95% CI) and specificity (95% CI) were 93.8% (86.8% to 97.2%) and 99.6% (98.1% to 99.9%) from four TMPS studies. SCAs are considered “incidental” findings of current aneuploidy screening programs. It should be noted that SCAs are not of interest for prenatal screening since they do not lead to any intervention prior to birth.
The failure rate associated with gNIPT, which is higher than the current failure rate of traditional screening tests which is close to zero, is worrying and may be a source of bias. Futhermore, the large heterogeneity between laboratory‐developed assays in their protocol details and observed failure rates highlight the fact that each laboratory providing gNIPT services should determine its own failure rate and inform healthcare professionals ordering the test about this important test characteristic. Failed samples were excluded from the analyses in the studies. This systematic review found a slightly larger failure rate for TMPS than the MPSS approach. This was also reported by Yaron 2016. We also found that the proportion of failed samples for aneuploid samples was higher than the proportion of failed samples for euploid samples. If these failed samples were included in the summary statistics, the diagnostic performance of gNIPT would be lower.
Comparison with other systematic reviews with meta analysis
At the time of writing, there are four published systematic reviews with meta‐analyses of gNIPT (Gil 2015a; HAS 2015; Mackie 2017; Taylor‐Phillips 2016). Although these meta‐analyses had different criteria for including studies and analyses, they reported similar sensitivities and specificities to our findings.
As reported by Gil 2015a, the detection rate of gNIPT for autosomes was between 91.0% to 99.2% and specificity above 99.9% in singleton pregnancies. The detection rate for 45,X and SCA other than 45,X was 90.3% and 93.0%, respectively with specificity above 99.8% in singleton pregnancies. The results from HAS 2015 group for T21 were respectively 98.0% and 99.9% for sensitivity and specificity. Regarding Mackie 2017, the sensitivity was between 90.6% to 99.4% and specificity above 99.9% for autosomes. For 45,X, the sensitivity and specificity was 92.9% and 99.9%, respectively. They also pointed out that failed results were poorly reported across studies. Finally, Taylor‐Phillips 2016 reported sensitivity between 97.4% to 99.3% for autosomes and specificity of 99.9%.
This is the first Cochrane diagnostic test accuracy (DTA) review on gNIPT. There are five published Cochrane DTA reviews on prenatal screening tests (Alldred 2012; Alldred 2015; Alldred 2015a; Alldred 2017a; Alldred 2017b). The suite of reviews addressed traditional biochemical, ultrasound and urine markers for Down syndrome screening (Alldred 2010) and none of the other fetal aneuploidies considered in this review were evaluated in this suite. In the first of the three reviews, Alldred and colleagues evaluated second‐trimester serum markers and found that double and triple test combinations (involving alpha‐fetoprotein, human chorionic gonadotropin (hCG) (free and total) or unconjugated estriol) significantly outperformed individual markers, detecting six to seven out of every 10 Down syndrome pregnancies at a 5% false positive rate (Alldred 2012). The second review evaluated first‐trimester serum markers and found that a test strategy involving maternal age, PAPP‐A and free ßhCG significantly outperformed individual markers, detecting about seven out of every 10 Down’s syndrome pregnancies at a 5% false positive rate (Alldred 2015a). The third review evaluated urine markers and concluded there was a paucity of evidence to support the use of urine testing for Down syndrome screening (Alldred 2015b). The fourth review evaluated first‐trimester ultrasound tests alone or in combination with first‐trimester serum tests and found that a combination of ultrasound and serum markers (especially PAPP‐A and free ßhCG) and maternal age can detect about nine of 10 T21 affected pregnancies for a fixed 5% false positive rate (Alldred 2017a). The fifth review evaluated first‐ and second‐trimester serum tests with and without first‐trimester ultrasound tests and found that a combination of first‐trimester ultrasound with first‐ and second‐trimester serum markers with maternal age are significantly better than those without ultrasound or those evaluating first‐trimester ultrasound in combination with second‐trimester serum markers, without first‐trimester serum markers (the authors cannot make recommendations about a specific strategy) (Alldred 2017b).
Strengths and weaknesses of the review
Strengths
The review methodology was transparent with the full protocol published in the Cochrane Library (1 July 2015) and in PROSPERO (11 November 2015). The review evaluated the screening and diagnostic accuracy of gNIPT by MPSS and TMPS for seven common aneuploidies with no restriction imposed on population characteristics such as maternal age, gestational age, aneuploidy risk, number of fetuses and ethnicity. We performed a comprehensive search with no language restriction and we included studies in the languages used by various authors in the field, including Chinese, Bulgarian, Russian, Polish, Korean and Spanish. Study selection, data extraction and quality assessment were independently performed by two review authors. We contacted authors to clarify data and to avoid duplication of data as a result of overlapping populations.
We evaluated the performance of the two major gNIPT methods (MPSS and TMPS which included digital analysis of selected regions (DANSR) and single nucleotide polymorphism (SNP)‐based method) and included data on traditional screening tests when compared to gNIPT.
We collected and reported data on excluded and failed samples and presented the failure rate at first attempt, the number of repeated tests and the final failure rate for each study. When it was possible, we also reported separate failure rates among aneuploid and euploid cases. Where possible, we performed subgroups analyses to investigate heterogeneity, and also performed sensitivity analyses to assess the robustness of these findings.
Weaknesses
Fetal karyotyping is the reference standard for establishing a diagnosis of fetal aneuploidy. This is an invasive procedure with some risk for the fetus and the pregnant woman. Many pregnant women included in the studies, especially those involving unselected cohorts, were not tested by karyotyping. Rather, clinical examination of the newborn or medical records from birth were used as a secondary reference standard. We are aware that these secondary reference standards are not as accurate as fetal karyotype and some cases may have been missed.
Studies rarely reported the qualification of the person conducting the neonatal clinical examination at birth. Such examination is expected to be more reliable if it was made by a paediatrician or a geneticist. Ideally, this examination should be done a few months after birth because the phenotypic characteristics of aneuploidies are more apparent than at birth (Devlin 2004).
Genomics‐based non‐invasive prenatal testing assays are laboratory‐developed tests that are not standardised in their methods, sequencing platforms, sequencing data manipulation, measures used or cut‐offs for interpretation. Each assay was developed and validated by the testing laboratory and each laboratory has a different method. Usually detailed information about the assays were not available. As shown in Table 5, 15, different gNIPT assays were used in the studies included in this review. Thus, they may differ in various aspects and show different analytical and clinical validity. We have grouped them accordingly to the type of assay used (targeted versus shotgun), but there are also differences within each of these two subgroups that we were not able to account for, given the small number of studies published on most of these different assays. Thirteen of the assays were used only in studies of high‐risk pregnancies or mixed cohorts. Only a few gNIPT assays were used in a significant number of studies. Thus, caution should be used before generalising the diagnostic accuracy observed in this category of patients to all gNIPT assays. This limits the generalisability of these findings and we cannot infer that all gNIPT assays will show the same performance.
Applicability of findings to the review question
These findings suggest that gNIPT has high sensitivity and specificity for detection of fetal aneuploidies in high‐risk pregnancies. Performance varied depending on the type of aneuploidy. There was limited evidence of the performance of gNIPT in unselected cohorts of pregnant women. Most studies involved either high‐risk pregnancies or mixed populations where it was not possible to differentiate between high‐risk pregnancies and unselected pregnant women. Thus, more studies are needed in the general population of pregnant women before firm conclusions can be made about the sensitivity of gNIPT as a first‐tier screening test. The two major types of gNIPT method (MPSS and TMPS) appear to have comparable performance, but there are many different gNIPT assays for each approach. For many of these assays, very little data have been published about their diagnostic accuracy. Additionally, performance in the cohorts studied may not reflect performance in other populations owing to differences in fetal fraction distribution because of, for example, differences in mean body mass index or gestational age. Importantly, summary sensitivities and specificities derived from cohort data can be very different from the probability associated with any particular patient sample to be positive or negative depending on the sample’s specific fetal fraction. Thus, summary sensitivity, specificity and associated predictive values of an assay cannot be used as a straightforward measure of the probability of a specific patient’s sample to be affected given a positive or negative result. This underscores the importance, before clinically offering a laboratory developed gNIPT assay, that it is fully validated according to recognised best practice clinical laboratory molecular diagnostics guidelines. Finally, the methodological quality of studies was generally poor with high risk of bias, especially in terms of patient selection and flow and timing.
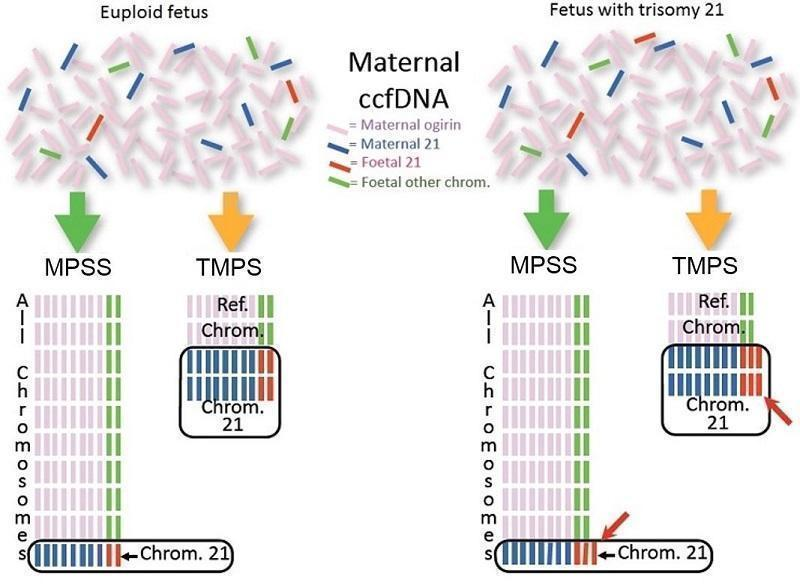
Difference between massively parallel shotgun sequencing (MPSS) and targeted massively parallel sequencing (TMPS). Genomics‐based non‐invasive prenatal testing (gNIPT) aims to count the number of copies of DNA fragments from the chromosomes of interest (chromosome 21 (Chrom. 21) in this example) present in circulating cell‐free DNA (ccfDNA) from a pregnant woman, relative to a reference set of chromosomes (Ref. Chrom.). DNA fragments circulating in maternal blood in the case of a euploid (left) and aneuploid (right) pregnancy are illustrated (top). MPSS produces a large number of sequence reads from all chromosomes while TMPS generates a larger proportion of reads from the chromosomes of interest (bottom). In both methods, sequence reads can be used to detect a slight excess of fetal genomic material coming from the chromosome of interest. Figure was created by FR.

Current clinical pathway and three proposed uses of genomics‐based non‐invasive prenatal testing (gNIPT). Currently (on the left), pregnant women can have a prenatal screening test consisting of biomarkers or ultrasound, or both. For high‐risk pregnant women, an invasive diagnostic test (karyotyping) is offered. In the present review, we propose 3 different clinical pathways. First, gNIPT could be used as a triage test, to decide which pregnant women should receive further testing. Second, gNIPT could be used to replace current prenatal screening tests. Finally, gNIPT could be used to replace current invasive diagnostic tests (if diagnostic performance permits). At any point in a clinical pathway, a pregnant woman may decide not to proceed with other tests (not shown in the figure). Figure was designed by CL, JB, MB and YT.

PRISMA flow diagram for selection of studies from January 2007 to October 2016.
#: number, DTA: diagnostic test accuracy, NTIS: The National Technical Information Service and WHO ICTRP: World Health Organization International Clinical Trials Registry Platform.

Risk of bias and applicability concerns summary: review authors' judgements about each domain for each of the studies included for massively parallel shotgun sequencing (MPSS).
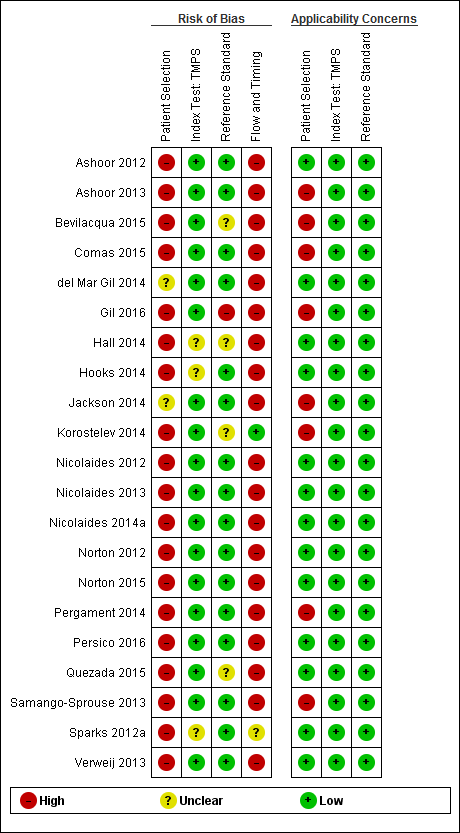
Risk of bias and applicability concerns summary: review authors' judgements about each domain for each study included for targeted massively parallel sequencing (TMPS).

Risk of bias and applicability concerns (all tests included): review authors' judgements about each domains presented as percentages across included studies. MPSS: massively parallel shotgun sequencing, TMPS: targeted massively parallel sequencing.

Forest plot of MPSS and TMPS for T21 in unselected pregnant women undergoing aneuploidy screening. FN: false negative, FP: false positive, MPSS: massively parallel shotgun sequencing, TMPS: targeted massively parallel sequencing, TN: true negative and TP: true positive.

Forest plot of MPSS and TMPS for T21 in pregnant women selected at high risk of fetal aneuploidy. FN: false negative, FP: false positive, MPSS: massively parallel shotgun sequencing, TMPS: targeted massively parallel sequencing, TN: true negative and TP: true positive.

Forest plot of MPSS and TMPS for T18 in pregnant women selected at high risk of fetal aneuploidy. FN: false negative, FP: false positive, MPSS: massively parallel shotgun sequencing, TMPS: targeted massively parallel sequencing, TN: true negative and TP: true positive.

Forest plot of MPSS and TMPS for T13 in pregnant women selected at high risk of fetal aneuploidy. FN: false negative, FP: false positive, MPSS: massively parallel shotgun sequencing, TMPS: targeted massively parallel sequencing, TN: true negative and TP: true positive.

Forest plot of MPSS and TMPS for 45,X in pregnant women selected at high risk of fetal aneuploidy. FN: false negative, FP: false positive, MPSS: massively parallel shotgun sequencing, TMPS: targeted massively parallel sequencing, TN: true negative and TP: true positive.

Forest plot of MPSS and TMPS for 47,XXX, 47,XXY and 47,XYY in pregnant women selected at high risk of fetal aneuploidy. FN: false negative, FP: false positive, MPSS: massively parallel shotgun sequencing, TMPS: targeted massively parallel sequencing, TN: true negative and TP: true positive.

Forest plot of MPSS and TMPS for autosomes (T21, T18 and T13 combined) in unselected pregnant women undergoing aneuploidy screening. FN: false negative, FP: false positive, MPSS: massively parallel shotgun sequencing, TMPS: targeted massively parallel sequencing, TN: true negative and TP: true positive.

Forest plot of MPSS and TMPS for autosomes (T21, T18 and T13) in pregnant women selected at high risk of fetal aneuploidy. FN: false negative, FP: false positive, MPSS: massively parallel shotgun sequencing, TMPS: targeted massively parallel sequencing, TN: true negative and TP: true positive.

Forest plot of MPSS and TMPS for SCA (45,X, 47,XXX, 47,XXY and 47,XYY combined) in pregnant women selected at high risk of fetal aneuploidy. FN: false negative, FP: false positive, MPSS: massively parallel shotgun sequencing, TMPS: targeted massively parallel sequencing, TN: true negative and TP: true positive.

Forest plot of traditional screening tests for T21, T18 and T13 in unselected pregnant women undergoing aneuploidy screening. FN: false negative, FP: false positive, MPSS: massively parallel shotgun sequencing, TMPS: targeted massively parallel sequencing, TN: true negative and TP: true positive.
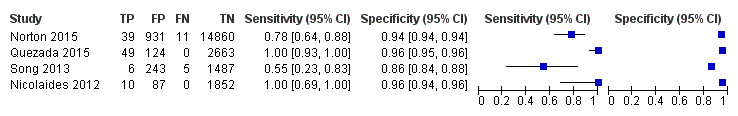
Forest plot of traditional screening tests for autosomes (T21, T18 and T13 combined) in unselected pregnant women undergoing aneuploidy screening. FN: false negative, FP: false positive, TN: true negative and TP: true positive.
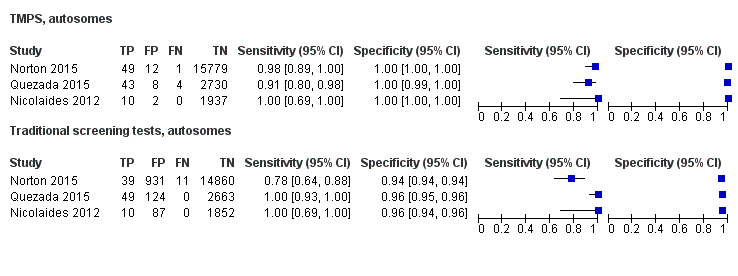
Forest plot of comparative studies of TMPS and traditional screening tests for autosomes (T21, T18 and T13 combined) in unselected pregnant women undergoing aneuploidy screening. FN: false negative, FP: false positive, TN: true negative and TP: true positive.
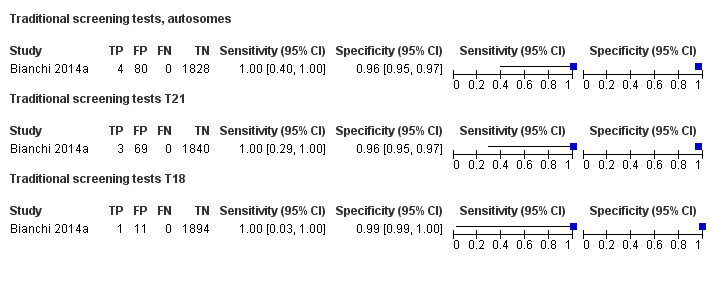
Forest plot of traditional screening tests for autosomes (T21, T18 and T13 combined) in pregnant women with mixed prior risk of fetal aneuploidy. FN: false negative, FP: false positive, MPSS: massively parallel shotgun sequencing, TMPS: targeted massively parallel sequencing, TN: true negative and TP: true positive.

Forest plot of MPSS and TMPS for autosomes (T21, T18 and T13 combined) in pregnant women with mixed prior risk of fetal aneuploidy. FN: false negative, FP: false positive, MPSS: massively parallel shotgun sequencing, TMPS: targeted massively parallel sequencing, TN: true negative and TP: true positive.
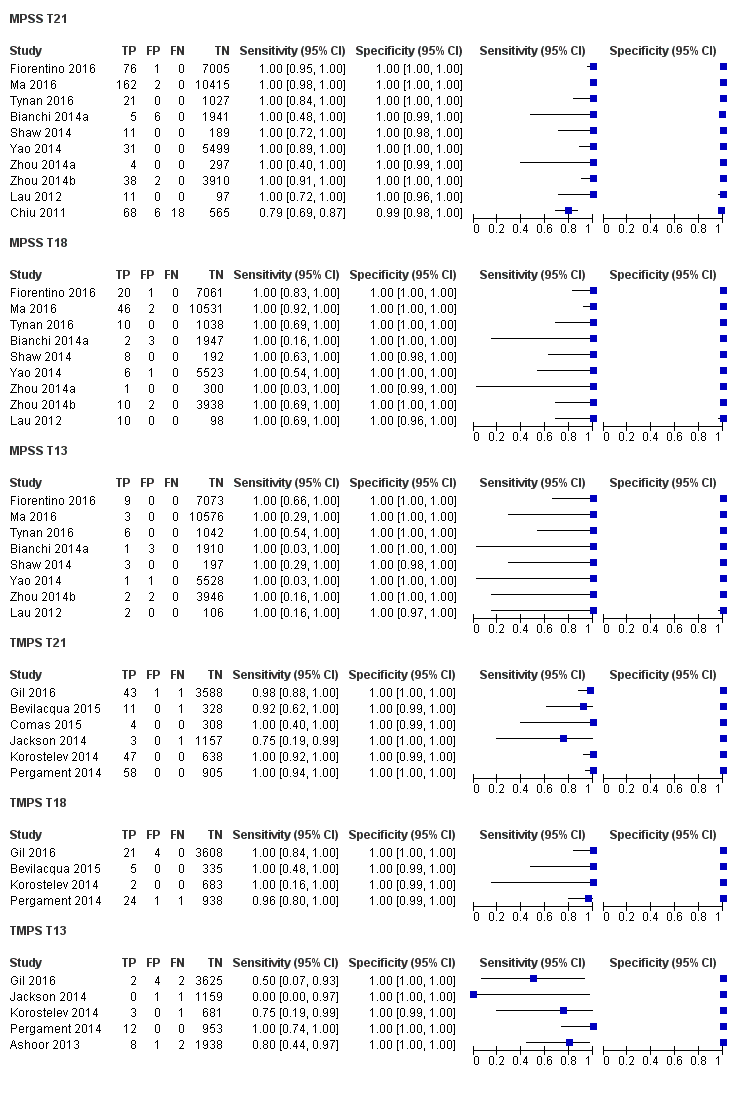
Forest plot of MPSS and TMPS for T21, T18 or T13 in pregnant women with mixed prior risk of fetal aneuploidy. FN: false negative, FP: false positive, MPSS: massively parallel shotgun sequencing, TMPS: targeted massively parallel sequencing, TN: true negative and TP: true positive.

Forest plot of MPSS and TMPS for SCA (45,X, 47,XXX, 47,XXY and 47,XYY combined) in pregnant women with mixed prior risk of fetal aneuploidy. FN: false negative, FP: false positive, MPSS: massively parallel shotgun sequencing, TMPS: targeted massively parallel sequencing, TN: true negative and TP: true positive.
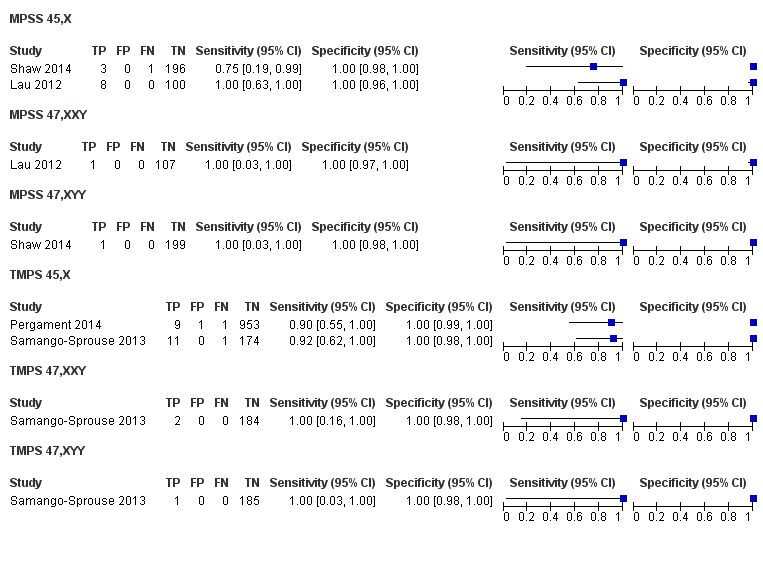
Forest plot of MPSS and TMPS for 45,X, 47,XXY or 47,XYY in pregnant women with mixed prior risk of fetal aneuploidy. FN: false negative, FP: false positive, MPSS: massively parallel shotgun sequencing, TMPS: targeted massively parallel sequencing, TN: true negative and TP: true positive.

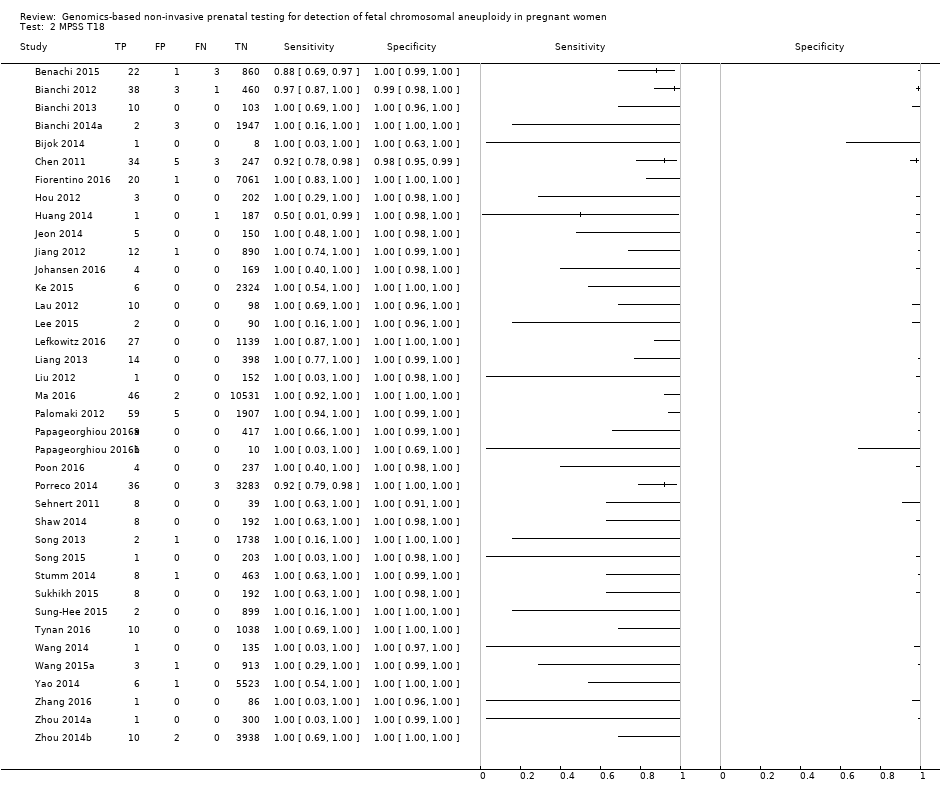
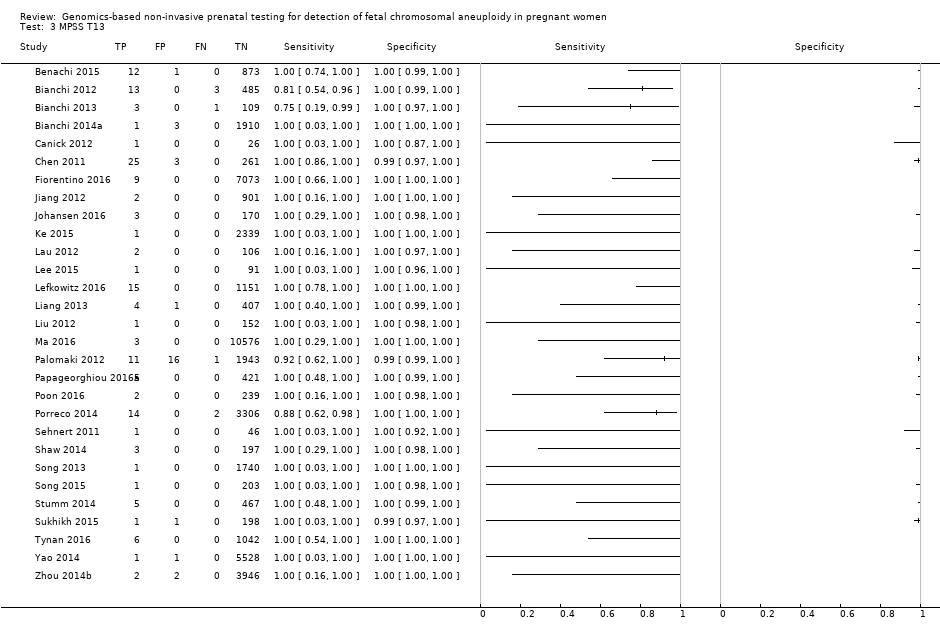

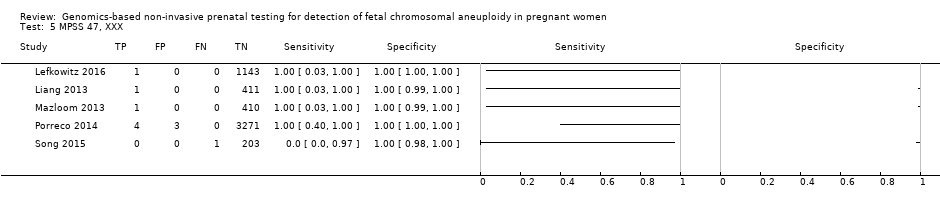
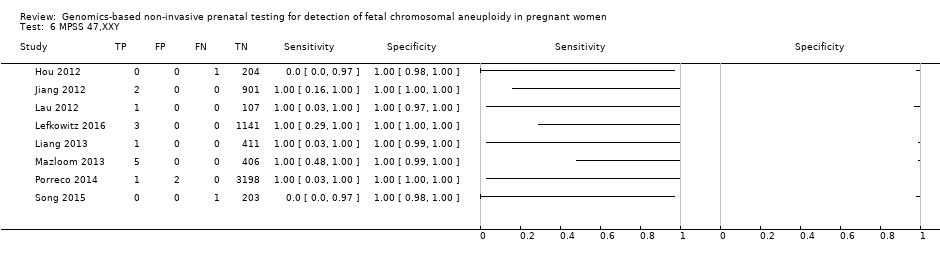


MPSS all 7 aneuploidies.
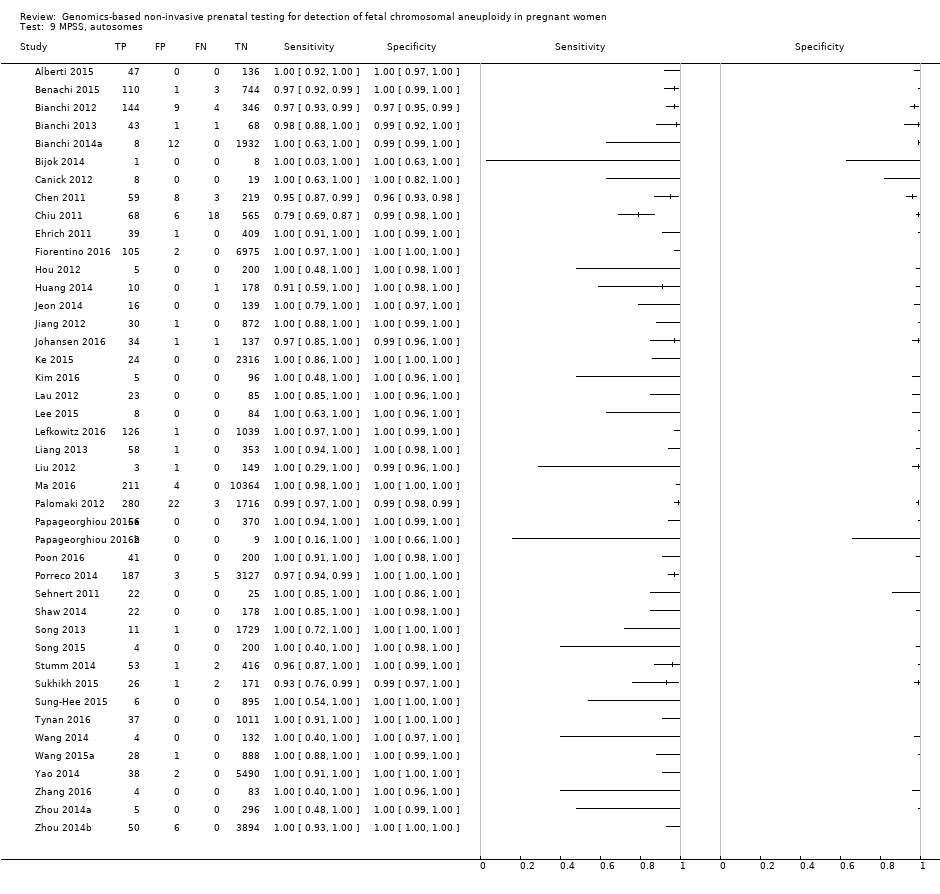
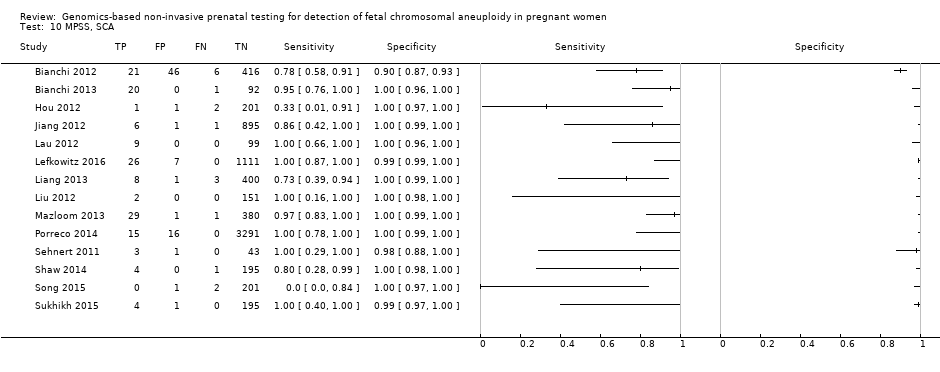


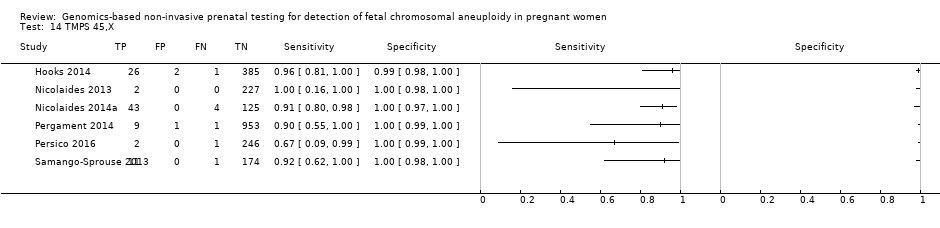

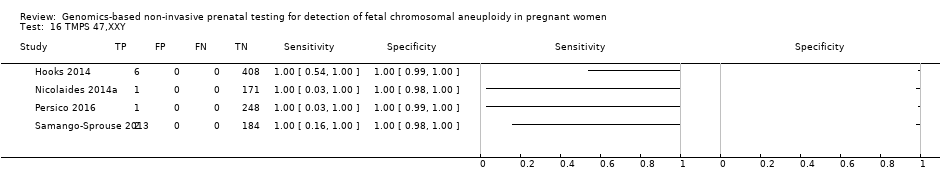
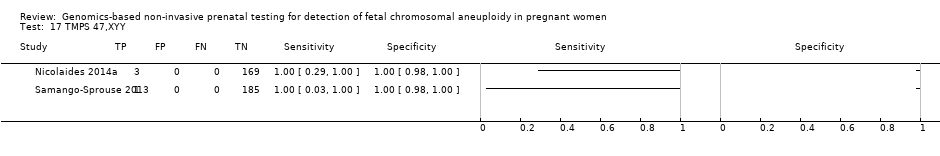

TMPS all 7 aneuploidies.
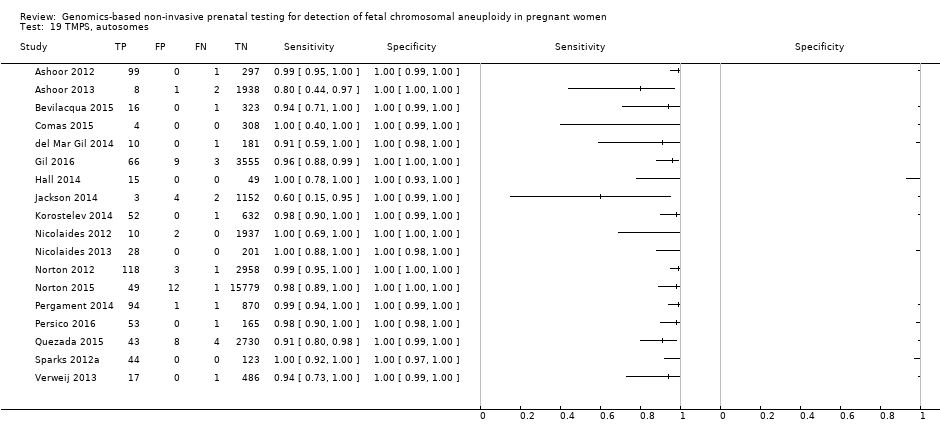


Traditional screening tests, autosomes.
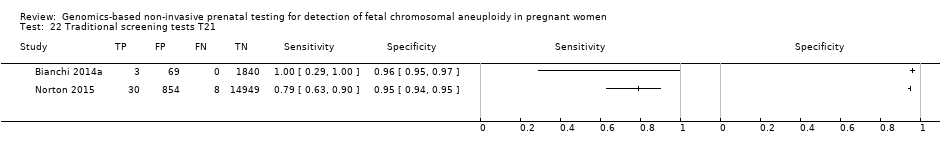
Traditional screening tests T21.
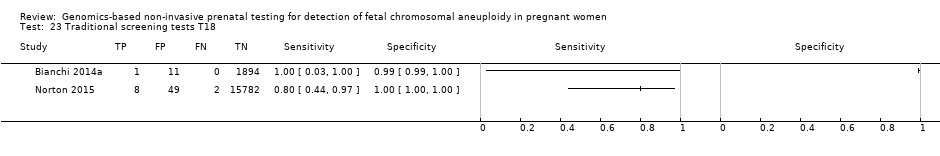
Traditional screening tests T18.
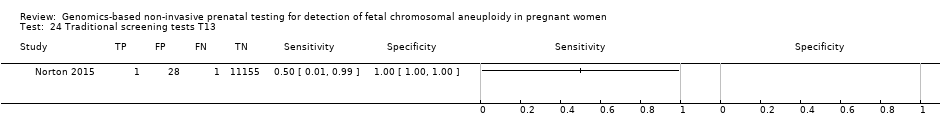
Traditional screening tests T13.
| Summary characteristics of included studies | |
| Review question | What is the diagnostic accuracy of massively parallel shotgun sequencing (MPSS) and targeted massively parallel sequencing (TMPS) using circulating cell‐free DNA (ccfDNA) in maternal blood for the detection of common fetal aneuploidies (T21, T18, T13, 45,X, 47,XXY, 47,XXX and 47,XYY) in pregnant women according to their prior risk of fetal aneuploidy? |
| Importance (rationale) | These new genomics‐based non‐invasive prenatal testing (gNIPT) approach report higher sensitivity and lower false positive rate than traditional screening tests. gNIPT is already advertised and marketed. How gNIPT should be used in clinical practice should be assessed in order to provide a framework for its use. |
| Study design | There were 40 prospective cohort studies, 8 retrospective cohort studies, 16 case‐control studies and 1 prospective and retrospective cohort study. |
| Population | Pregnant women of any age, ethnicity and gestational age, with singleton or multifetal pregnancy who had a screening test for fetal aneuploidy using gNIPT and received a reference standard. 42 studies enrolled pregnant women selected at high risk of fetal aneuploidy, 5 enrolled unselected pregnant women undergoing aneuploidy screening and 18 enrolled pregnant women from a mixed‐risk population of fetal aneuploidy. 48 studies included only women with singleton pregnancy, 5 included only multifetal pregnancies, 4 included either type of pregnancy and 8 did not report type of pregnancy. 10 studies included only women in the first trimester (15 weeks or less), 21 studies included women in the first 2 trimesters (29 weeks or less), 24 studies included women in the 3 trimesters (42 weeks or less) and 10 studies (15%) did not report gestational age. |
| Index tests | gNIPT by MPSS (44 studies) or TMPS (21 studies), including 5 studies that compared a gNIPT with a traditional screening test. 37 studies were industry‐funded or were written by 1 or more authors affiliated with a company who sells gNIPT. 22 studies were not reported to be funded by industry but samples were sequenced and analysed by a commercial laboratory. 3 studies had no links with industry. |
| Target conditions | 36 studies reported results for only autosomes (T21, T18, T13), 4 for only SCA (45,X, 47,XXY, 47,XXX and 47,XYY), and 25 for both autosomes and SCA. |
| Reference standard | Fetal karyotyping performed on cells obtained from chorionic villi sampling, amniotic fluid, placental tissue, a fetus lost by miscarriage or other equivalent and recognised methods on the same materials for autosomes and SCA. If fetal karyotyping was not performed, we used neonatal clinical examination or medical records from birth (for autosomes only). Only 1 reference standard was used for all pregnant women included in 36 studies while multiple reference standards were used in 29 studies. |
| Risk of bias | The QUality Assessment of Diagnostic Accuracy Studies (QUADAS‐2) tool was used to assess the methodological quality of included studies. No study was assessed as being at low risk of bias across all domains. For the patient selection domain, no study was assessed as being at low risk of bias. For the index test, reference standard and flow and timing domains, the risk of bias was low for 94%, 77% and 23% of studies, respectively. |
| Applicability concerns | Applicability was of low concern for all studies in the index test and reference standard domains because the studies matched the review question. In the patient selection domain, 47 (71%) studies were judged to be of low applicability concern because they included pregnant women matching the review question. |
| 45,X: Turner syndrome, 47,XXX: triple X syndrome, 47,XXY: Klinefelter syndrome, MPSS: massively parallel shotgun sequencing, TMPS: targeted massively parallel sequencing, T21: trisomy 21, T18: trisomy 18, T13: trisomy 13. | |
| Performance of gNIPT for detection of T21 | |||||||
| Test strategy | Number of studies | Number of affected pregnancies (Number of unaffected pregnancies)a | Sensitivity % (95% CI) | Specificity % (95% CI) | Median prevalenceb % (range) | Missed cases (FN)c | False positives (FP)d |
| Unselected pregnant women | |||||||
| MPSS | 1 | 8 (1733) | 100 (67.6 to 100) | 100 (99.8 to 100) | 0.46 (0.24 to 5.21) | 0 | 0 |
| TMPS | 4 | 88 (20,679) | 99.2 (78.2 to 100) | 100 (> 99.9 to 100) | 4 | 0 | |
| Traditional screening teste | 1 | 38 (15,803) | 78.9 (63.7 to 88.9) | 94.6 (94.2 to 94.9) | 97 | 5375 | |
| Implications |
| ||||||
| Selected high‐risk pregnant women | |||||||
| MPSS | 30 | 1048 (15,937) | 99.7 (98.0 to 100) | 99.9 (99.8 to 100) | 4.95 (0.44 to 27.66) | 15 | 95 |
| TMPS | 6 | 246 (4380) | 99.2 (96.8 to 99.8) | 100 (99.8 to 100) | 40 | 0 | |
| Difference between MPSS and TMPS | 0.53 (‐0.73 to 1.78) | ‐0.03 (‐0.11 to 0.04) | NA | ||||
| Implications |
| ||||||
| MPSS: massively parallel shotgun sequencing, NA; not applicable, TMPS: targeted massively parallel sequencing, T21: trisomy 21. aUnaffected pregnancies: we included patients with any other aneuploidy than the one under analysis with all euploid cases as "unaffected" pregnancies. bThe median prevalence and range were calculated by using all prospective or retrospective studies for each category considered. cMissed cases per 100,000 tested. FN: false negatives. dFalse positives per 100,000 tested. A false positive result may lead to unnecessary invasive tests depending on choices by the pregnant woman. eTraditional screening tests are first‐trimester combined test, second‐trimester quadruple test, second‐trimester fully integrated test, second‐trimester sequential test or second‐trimester triple test. | |||||||
| Performance of gNIPT for detection of T18 | |||||||
| Test strategy | Number of studies | Number of affected pregnancies (Number of unaffected pregnancies)a | Sensitivity % (95% CI) | Specificity % (95% CI) | Median prevalenceb % (range) | Missed cases (FN)c | False positives (FP)d |
| Unselected pregnant women | |||||||
| MPSS | 1 | 2 (1739) | 100 (34.3 to 100) | 99.9 (99.7 to 100) | 0.11 (0.06 to 0.36) | 0 | 100 |
| TMPS | 3 | 22 (20,553) | 90.9 (70.0 to 97.7) | 100 (99.9 to 100) | 10 | 0 | |
| Traditional screening teste | 1 | 10 (15,831) | 80.0 (49.0 to 94.3) | 99.7 (99.6 to 99.8) | 22 | 300 | |
| Implications |
| ||||||
| Selected high‐risk pregnant women | |||||||
| MPSS | 28 | 332 (16,180) | 97.8 (92.5 to 99.4) | 99.9 (99.8 to 100) | 1.46 (0.22 to 17.02) | 32 | 99 |
| TMPS | 5 | 112 (4010) | 98.2 (93.1 to 99.6) | 100 (99.8 to 100) | 26 | 0 | |
| Difference between MPSS and TMPS | ‐0.41 (‐4.11 to 3.28) | ‐0.06 (‐0.14 to 0.03) | NA | ||||
| Implications |
| ||||||
| MPSS: massively parallel shotgun sequencing, NA: not applicable, TMPS: targeted massively parallel sequencing, T18: trisomy 18. aUnaffected pregnancies: we included patients with any other aneuploidy than the one under analysis with all euploid cases as "unaffected" pregnancies. bThe median prevalence and range were calculated by using all prospective or retrospective studies for each category considered. cMissed cases per 100,000 tested. FN: false negatives. dFalse positives per 100,000 tested. A false positive result may lead to unnecessary invasive tests depending on choices by the pregnant woman. eTraditional screening tests are first‐trimester combined test, second‐trimester quadruple test, second‐trimester fully integrated test, second‐trimester sequential test or second‐trimester triple test. | |||||||
| Performance of gNIPT for detection of T13 | |||||||
| Test strategy | Number of studies | Number of affected pregnancies (Number of unaffected pregnancies)a | Sensitivity % (95% CI) | Specificity % (95% CI) | Median prevalenceb % (range) | Missed cases (FN)c | False positives (FP)d |
| Unselected pregnant women | |||||||
| MPSS | 1 | 1 (1740) | 100 (20.7 to 100) | 100 (99.8 to 100) | 0. 12 (0.01 to 0.52) | 0 | 0 |
| TMPS | 3 | 8 (14,154) | 65.1 (9.16 to 97.2) | 100 (99.9 to 100) | 41 | 0 | |
| Traditional screening teste | 1 | 2 (11,183) | 50.0 (9.45 to 90.5) | 99.7 (99.6 to 99.8) | 59 | 300 | |
| Implications |
| ||||||
| Selected high‐risk pregnant women | |||||||
| MPSS | 20 | 128 (13,810) | 95.8 (86.1 to 98.9) | 99.8 (99.8 to 99.9) | 1.09 (0.04 to 3.54) | 46 | 198 |
| TMPS | 2 | 20 (293) | 100 (83.9 to 100)f | 100 (98.7 to 100)f | 0 | 0 | |
| Implications |
| ||||||
| MPSS: massively parallel shotgun sequencing, NA: not applicable, TMPS: targeted massively parallel sequencing, T13: trisomy 13. aUnaffected pregnancies: we included patients with any other aneuploidy than the one under analysis with all euploid cases as "unaffected" pregnancies. bThe median prevalence and range were calculated by using all prospective or retrospective studies for each category considered. cMissed cases per 100,000 tested. FN: false negatives. dFalse positives per 100,000 tested. A false positive result may lead to unnecessary invasive tests depending on choices by the pregnant woman. eTraditional screening tests are first‐trimester combined test, second‐trimester quadruple test, second‐trimester fully integrated test, second‐trimester sequential test or second‐trimester triple test. fSimple pooling used to obtain summary estimates of sensitivity, specificity or both. | |||||||
| Performance of gNIPT for detection of 45,X | |||||||
| Test strategy | Number of studies | Number of affected pregnancies (Number of unaffected pregnancies)a | Sensitivity % (95% CI) | Specificity % (95% CI) | Median prevalenceb % (range) | Missed cases (FN)c | False positives (FP)d |
| Selected high‐risk pregnant women | |||||||
| MPSS | 12 | 119 (7440) | 91.7 (78.3 to 97.1) | 99.6 (98.9 to 99.8) | 1.04 (0.27 to 18.58) | 86 | 396 |
| TMPS | 4 | 79 (985) | 92.4 (84.1 to 96.5) | 99.8 (98.3 to 100) | 79 | 198 | |
| Difference between MPSS and TMPS | ‐0.74 (‐11.1 to 9.60) | ‐0.23 (‐0.82 to 0.36) | NA | ||||
| Implications |
| ||||||
| 45,X: Turner syndrome, MPSS: massively parallel shotgun sequencing, NA: not applicable, TMPS: targeted massively parallel sequencing. aUnaffected pregnancies: we included patients with any other aneuploidy than the one under analysis with all euploid cases as "unaffected" pregnancies. bThe median prevalence and range were calculated by using all prospective or retrospective studies for each category considered. cMissed cases per 100,000 tested. FN: false negatives. dFalse positives per 100,000 tested. A false positive result may lead to unnecessary invasive tests depending on choices by the pregnant woman. | |||||||
| Performance of gNIPT for detection of autosomes aneuploidies (T21, T18 and T13 combined) | |||||||
| Test strategy | Number of studies | Number of affected pregnancies (Number of unaffected pregnancies)a | Sensitivity % (95% CI) | Specificity % (95% CI) | Median prevalenceb % (range) | Missed cases (FN)c | False positives (FP)d |
| Unselected pregnant women | |||||||
| MPSS | 1 | 11 (1730) | 100 (74.1 to 100) | 99.9 (99.7 to 100) | 0,63 (0.32 to 5.73) | 0 | 99 |
| TMPS | 4 | 118 (20,649) | 94.9 (89.1 to 97.7) | 99.9 (99.8 to 99.9) | 32 | 99 | |
| Traditional screening teste | 4 | 120 (22,247) | NDf | ND | |||
| Implications |
| ||||||
| Selected high‐risk pregnant women | |||||||
| MPSS | 32 | 1508 (15,797) | 98.8 (97.2 to 99.5) | 99.9 (99.7 to 100) | 5.85 (0.67 to 46.81) | 70 | 94 |
| TMPS | 7 | 378 (4282) | 98.9 (97.2 to 99.6) | 99.9 (99.8 to 100) | 64 | 94 | |
| Difference between MPSS and TMPS | ‐0.11 (‐1.58 to 1.35) | ‐0.08 (‐0.22 to 0.07) | NA | ||||
| Implications |
| ||||||
| MPSS: massively parallel shotgun sequencing, NA: not applicable, ND: no data available, TMPS: targeted massively parallel sequencing, T13: trisomy 13, T18: trisomy 18, T21: trisomy 21. aUnaffected pregnancies: we included patients with any other aneuploidy than the one under analysis with all euploid cases as "unaffected" pregnancies. bThe median prevalence and range were calculated by using all prospective or retrospective studies for each category considered. cMissed cases per 100,000 tested. FN: false negatives. dFalse positives per 100,000 tested. A false positive result may lead to unnecessary invasive tests depending on choices by the pregnant woman. eTraditional screening tests are first‐trimester combined test, second‐trimester quadruple test, second‐trimester fully integrated test, second‐trimester sequential test or second‐trimester triple test. fSummary sensitivity and specificity were not obtained for traditional screening tests because the four studies used different cut‐offs to determine test positivity. Three of the four studies compared TMPS and traditional screening tests in the same population (direct comparison). | |||||||
| Performance of gNIPT for detection of sex chromosome aneuploidies (45,X, 47,XXX, 47,XXY and 47,XYY combined) | |||||||
| Test strategy | Number of studies | Number of affected pregnancies (Number of unaffected pregnancies)b | Sensitivity % (95% CI) | Specificity % (95% CI) | Median prevalencec % (range) | Missed cases (FN)d | False positives (FP)e |
| Selected high‐risk pregnant women | |||||||
| MPSS | 12 | 151 (7452) | 91.9 (73.8 to 97.9) | 99.5 (98.8 to 99.8) | 1.53 (0.45 to 18.58) | 124 | 492 |
| TMPS | 4 | 96 (968) | 93.8 (86.8 to 97.2) | 99.6 (98.1 to 99.9) | 95 | 394 | |
| Difference between MPSS and TMPS | ‐1.85 (‐13.3 to 9.60) | ‐0.06 (‐0.82 to 0.71) | NA | ||||
| Implications |
| ||||||
| 45,X: Turner syndrome, 47,XXX: triple X syndrome, 47,XXY: Klinefelter syndrome, MPSS: massively parallel shotgun sequencing, NA: not applicable, ND: no data available, TMPS: targeted massively parallel sequencing aWe did not assess the accuracy of gNIPT individually for 47,XXX, 47,XXY and 47,XYY due to paucity data. bUnaffected pregnancies: we included patients with any other aneuploidy than the one under analysis with all euploid cases as "unaffected" pregnancies. cThe median prevalence and range were calculated by using all prospective or retrospective studies for each category considered. dMissed cases per 100,000 tested. FN: false negatives. eFalse positives per 100,000 tested. A false positive result may lead to unnecessary invasive tests depending on choices by the pregnant woman. | |||||||
| Target condition | Affected birthsa /100,000 | Clinical features | Prognosis |
| T21 | 140 to 230b,c | Intellectual disability (mild to moderate), neurodevelopmental problems, characteristic dysmorphic features, congenital defects (cardiac (44% to 58%) and gastrointestinal system (4% to 10%)), vision or hearing impairment (38% to 80%) and obstructive sleep apnoea syndrome (57%)d,e | Mean and median life expectancies are estimated to be 51 and 58 years oldf |
| T18 | 59c | Severe intellectual disability and a wide range of significant malformations (cardiac defects, gastrointestinal system defects, renal anomalies, central nervous system defects (apnoea and seizures))d,g | Most affected fetuses die in utero. Median survival has been estimated at 14 days (95% confidence interval (CI) 10 to 20) and 8% (95% CI 4 to 14) reach 1 year of ageh |
| T13 | 23c | Severe intellectual disability, seizures and several dysmorphic features, malformations of the extremities, cardiac defects, renal anomalies, and abdominal wall defectsd,i | Most affected fetuses die in utero. Median survival time has been estimated at 10 days (95% CI 7 to 19) and 8% (95% CI 4 to 14) reach 1 year of ageh |
| 45,X | 30 to 50c,j | Learning disabilities (70%), short stature, congenital heart diseases (30%) and gonadal dysgenesis (90% with amenorrhoea and infertility due to early ovarian failure)k,l | Mortality in 45,X women is 3‐fold higher than in the general population with an average life span of 69 yearsm |
| 47,XXY | 12c | Learning disabilities (> 75%), small testes (> 95%), azoospermia (> 95%), male infertility (91% to 99%), decreased testosterone level (63% to 85%) and gynaecomastia (38% to 75%)l,n | Life expectancy is slightly shorter (approximately 2 years) than euploid menn |
| 47,XXX | 6c | Developmental delays (motor and speech), learning or intellectual disability, attention deficits (25% to 35%), mood disorders (anxiety and depression), tall stature (80% to 89%), clinodactyly (42% to 65%), hypotonia in infancy (55% to 71%), genitourinary malformations and congenital heart defectso | Mortality significantly increased with a median survival age of 70.9 years compare to 81.7 years for euploid femalesp |
| 47,XYY | 3c | Developmental delays (speech, language and motor), attention deficit disorder (52%), tall stature (78%), central adiposity, macrocephaly (33%), hypotonia (63%), clinodactyly (52%), hypertelorism (59%) and testicular enlargement for age (50%) but no increase in genital anomaliesq | Mortality increased with a reduction of life span of 10.3 years compared to euploid menr |
| 45,X: Turner syndrome, 47,XXX: triple X syndrome, 47,XXY: Klinefelter syndrome, T21: trisomy 21, T18: trisomy 18, T13: trisomy 13. aIncluding live births, fetal deaths and terminations of pregnancy. b(Christianson 2006; Parker 2010) e(Irving 2012; Weijerman 2010) f(Wu 2013b) g(Cereda 2012) h(Wu 2013a) i(Chen 2009) k(Karnis 2012; Mazzanti 1998; Sybert 2004) l(Tyler 2004) m(Saenger 1996; Schoemaker 2008) n(Groth 2013) q(Bardsley 2013; Leggett 2010) r(Stochholm 2010a). | |||
| Test name (Company, country) | Method | Aneuploidy | Reported sensitivity % (95% CI) | Reported specificity % (95% CI) | Reported false positive rate % |
| Bambni™ Test (Berry Genomics Co. Ltd, China) | MPSS | T21 | 100.0 (ND) | > 99.9 (ND) | < 0.1 |
| T18 | 100.0 (ND) | > 99.9 (ND) | < 0.1 | ||
| T13 | 100.0 (ND) | > 99.9 (ND) | < 0.1 | ||
| 45,X | 100.0 (ND) | 99.8 (ND) | 0.0 | ||
| 47,XXX | 100.0 (ND) | 100.0 (ND) | 0.1 | ||
| 47,XXY | 100.0 (ND) | 100.0 (ND) | 0.0 | ||
| 47,XYY | 100.0 (ND) | 100.0 (ND) | 0.0 | ||
| GENOMOM (Genome Care, Korea) | MPSS | T21, T18 and T13 | 99.0 (ND) | ND | ND |
| SCA | 95.0 (ND) | ND | ND | ||
| Harmony™ prenatal test (Ariosa Diagnostics, Inc., USA) | Oligo TMPS | T21 | > 99.0 (ND) | > 99.9 (ND) | < 0.1 |
| T18 | 97.4 (ND) | > 99.9 (ND) | < 0.1 | ||
| T13 | 93.8 (ND) | > 99.9 (ND) | < 0.1 | ||
| 45,Xb | 96.3 (81.7 to 99.8) | 99.5 (98.1 to 99.9) | 0.5 | ||
| 47,XXXb | 100.0 (ND) | 99.5 (98.1 to 99.9) | 0.5 | ||
| 47,XXYb | 100.0 (61.0 to 100.0) | 100.0 (99.0 to 100.0) | 0.0 | ||
| IONA® test (Premaitha Health plc, UK) | MPSS | T21 | > 99.0 (ND) | > 99.0 (ND) | < 1.0 |
| T18 | > 99.0 (ND) | > 99.0 (ND) | < 1.0 | ||
| T13 | > 99.0 (ND) | > 99.0 (ND) | < 1.0 | ||
| (Laboratoire CERBA, France) | MPSS | T21, T18 and T13 | > 99.8 (ND) | > 99.8 (ND) | < 0.2 |
| MaterniT21™ Plus test (Sequenom Inc., USA) | MPSS | T21 | 99.1 (96.6 to 99.9) | 99.9 (99.7 to 99.9) | 0.1 |
| T18 | > 99.9 (93.9 to 100.0) | 99.6 (99.3 to 99.7) | 0.4 | ||
| T13 | 91.7 (61.0 to 99.0) | 99.7 (98.5 to 99.5) | 0.3 | ||
| combined sex aneuploidies | 96.2 (ND) | 99.7 (ND) | 0.3 | ||
| MomGuard™ (LabGenomics, Korea) | MPSS | T21, T18, T13, 45,X, 47,XXX, 47,XXY, 47,XYY | > 99.0 (ND) | ND | ND |
| NIFTY™ test (Bejing Genomics Institute (BGI), China) | MPSS | T21 | 99.2 (ND) | 100 (ND) | 0 |
| T18 | 98.2 (ND) | 100 (ND) | 0 | ||
| T13 | 100 (ND) | 100 (ND) | 0 | ||
| 45,X | > 99.9 (ND) | > 99.9 (ND) | < 0.1 | ||
| Panorama™ prenatal testc (Natera, Inc., USA) | SNP TMPS | T21 | > 99.9 (ND) | 100 (ND) | 0 |
| T18 | > 96.4 (ND) | > 99.9 (ND) | < 0.1 | ||
| T13 | > 99.9 (ND) | 100 (ND) | 0 | ||
| 45,X | > 92.9 (ND) | > 99.9 (ND) | < 0.1 | ||
| PrenaTest® (LifeCodexx AG, Germany) | MPSS | T21 | 98.7 (ND) | 99.9 (ND) | 0.1 |
| T18 | 100 (ND) | ||||
| T13 | 100 (ND) | ||||
| 45,X | 90.9 (ND) | 98.8 (ND) | 1.2 | ||
| 47,XYY | 100 (ND) | ||||
| Prendia (Genesupport, Switzerland) | MPSS | T21 | 100.0 (88.8 to 100.0) | 100.0 (98.0 to 100.0) | 0.0 |
| T18 | 95.8 (76.8 to 99.7) | 100.0 (97.0 to 100.0) | 0.0 | ||
| T13 | 100.0 (74.6 to 100.0) | 100.0 (98.1 to 100.0) | 0.0 | ||
| 45,X | 100.0 (74.6 to 100.0) | 100.0 (98.1 to 100.0) | 0.0 | ||
| 47,XXX | 100.0 (46.2 to 100.0) | 100.0 (98.2 to 100.0) | 0.0 | ||
| Tranquility (Genoma, Switzerland) | MPSS | T21 | 99.9 (ND) | 99.8 (ND) | 0.2 |
| T18 | 99.9 (ND) | 99.9 (ND) | 0.1 | ||
| T13 | 99.9 (ND) | 99.7 (ND) | 0.3 | ||
| verifi® prenatal test (Illumina, Inc., USA) | MPSS | T21 | 99.5 (98.7 to 99.5) | 99.8 (98.9 to 99.9) | 0.2 |
| T18 | 97.3 (94.2 to 98.2) | 99.7 (99.5 to 99.9) | 0.3 | ||
| T13 | 98.0 (95.6 to 98.9) | 99.8 (99.8 to 99.9) | 0.2 | ||
| 45,X | 95.0 (75.1 to 99.9) | 99.0 (97.6 to 99.7) | 1.0 | ||
| VisibiliT™ (Sequenom Inc., USA) | MPSS | T21 | > 99.0 (80.8 to 100) | > 99.9 (99.5 to 100) | < 0.1 |
| T18 | > 99.0 (65.5 to 100) | > 99.9 (99.5 to 100) | < 0.1 | ||
| 45,X: Turner syndrome, 47,XXX: triple X syndrome, 47,XXY: Klinefelter syndrome, T21: trisomy 21, T18: trisomy 18, T13: trisomy 13 CI: confidence interval, MPSS: massively parallel shotgun sequencing, ND: no data available, TMPS: targeted massively parallel sequencing and SNP: single nucleotide polymorphism. a(Ariosa Diagnostics 2016; BGI 2014; BGI 2016; Berry Genomics 2016; Genoma 2016; Genome Care 2016; Illumina 2014; Illumina 2016; LabGenomics 2016; LifeCodexx 2016; Natera 2016; Genesupport 2016; Premaitha Health plc 2016; Sequenom 2016). b(Hooks 2014). cDNA of maternal and paternal origin are needed. | |||||
| Screening tests | First trimester (before 14 weeks’ gestation) | Second trimester (14 to 20 weeks’ gestation) |
| Ultrasonography |
|
|
| Combined test |
| NA |
| Triple test | NA |
|
| Quadruple test | NA |
|
| Sequential testb |
|
|
| Contingent testb |
|
|
| Serum integrated testc |
|
|
| Integrated testc |
|
|
| Maternal age is often included in the algorithm for prenatal screening tests. AFP: alpha‐fetoprotein, hCG: human chorionic gonadotropin, NA: not applicable, NT: nuchal translucency, PAPP‐A: pregnancy associated plasma protein A and uE3: unconjugated estriol. a(Gekas 2009; Okun 2008; Wald 2005). | ||
| Study ID | Target condition(s) | Study design and participants | Prior risk | Index test details | Cutpoint | Reference standard | Comparator |
| MPSS | |||||||
| T21 |
| High risk |
| Z score of 3 | Fetal karyotypea | ||
| T21, T18, T13 |
| High risk |
| Z score of 3 for T21; 3.95 for T18 and T13 | Fetal karyotype or neonatal clinical examination | ||
| T21, T18, T13, 45,X, 47,XXX, 47,XXY, 47,XYY |
| High risk |
| Different cutpoints used for autosomes and SCAb | Fetal karyotype | ||
| T21, T18, T13, 45,X |
| High risk |
| Different cutpoints used for autosomes and SCAb | Fetal karyotype | ||
| T21, T18, T13 |
| High, low and without prior risk |
| NCV of 4; resequenced if NCV is between 3 and 4 | Fetal or postnatal karyotype, neonatal clinical examination or medical record from birth | Standard screening (T21 only with mixed cutpoints) which include first‐trimester combined test or a second‐trimester result (quadruple, serum integrated, fully integrated, or sequential). | |
| T21, T18, T13 |
| High risk |
| NR | Fetal karyotype | ||
| T21, T18, T13 |
| High risk |
| Z score of 3 | Fetal karyotype | ||
| T18, T13 |
| High risk |
| Z score of 3 | Fetal karyotype | ||
| T21 |
| Mostly high (> 1/300) and some intermediate risk (between 1/300 and 1/1000) |
| Z score of 3 | Fetal karyotype | ||
| T21 |
| High risk |
| Z score of 2.5 | Fetal karyotype | ||
| T21, T18, T13 |
| Mostly high risk and without prior risk |
| NCV of 4; aneuploidy suspected if NCV is between 3 and 4 | Fetal karyotype or neonatal clinical examination | ||
| T21, T18, T13, 45,X, 47,XXX, 47,XXY, 47,XYY |
| High risk |
| NR | Fetal karyotype | ||
| T21, T18 |
| High risk |
| L score of 1 and t score of 2.5 including warning zone | Fetal karyotype | ||
| T21, T18 |
| High risk |
| Z score of 2.566 for T21; 2.459 for T18. | Fetal karyotype | ||
| T21, T18, T13, 45,X, 47,XXY, 47, XYY |
| High risk |
| Different cutpoints used for autosomes and SCAb | Fetal karyotype | ||
| T21, T18, T13 |
| High risk |
| Z score of 4 (unclassified if Z score is between 3 and 4) and WISECONDOR of 1% | Fetal karyotype | ||
| T21, T18, T13 |
| High risk |
| T score of 3 | Fetal karyotype or newborn outcome | ||
| T21 |
| High risk |
| Z score of 2.10 for Ion Proton™ | Fetal karyotype | ||
| T21, T18, T13, 45,X, 47,XXX, 47,XXY, 47,XYY |
| Mostly high risk |
| Different cutpoints used for autosomes and SCAb | Fetal karyotype | ||
| T21, T18, T13 and SCA (no case found) |
| High risk |
| Z score of 4 (intermediate risk if Z score is between 2.5 and 4) for T21 and T18; 2.8 for T13 (intermediate risk if Z score is between 1.9 and 2.8) | Fetal or neonatal karyotype | ||
| T21, T18, T13, 45,X, 47,XXX, 47,XXY, 47,XYY |
| High risk |
| Different cutpoints used for autosomes and SCAb | Fetal karyotype | ||
| T21, T18, T13, 45,X, 47,XXX, 47,XXY, 47,XYY |
| High risk |
| Different cutpoints used for autosomes and SCAb | Fetal karyotype | ||
| T21, T18, T13, 45,X, 47,XXX, 47,XXY, 47,XYY |
| High risk |
| Z score of 3 | Fetal karyotype | ||
| T21, T18, T13 |
| High and low risk |
| Z score of 3 | Fetal karyotype or postnatal follow‐up | ||
| 45,X, 47,XXX, 47,XXY, 47,XYY |
| High risk |
| Different cutpoints used for the four SCAb | Fetal karyotype | ||
| T21, T18, T13 |
| High risk |
| Z score of 3 for T21; 3.88 for T18; 7.17 for T13 | Fetal karyotype | ||
| T21, T18, T13 |
| High risk |
| Likelihood ratio of 1 and maternal age‐adjusted probability risk score | Fetal karyotype or medical record from birth | ||
| T21, T18, T13 |
| High risk |
| Likelihood ratio of 1 and maternal age‐adjusted probability risk score | Fetal karyotype or medical record from birth | ||
| T21, T18, T13 |
| High risk |
| NR (authors used the same gNIPT than Papageorghiou 2016a) | Fetal karyotype | ||
| T21, T18, T13, 45,X, 47,XXX, 47,XXY, 47,XYY |
| High risk |
| Different cutpoints used for autosomes and SCAb | Fetal karyotype or medical record from birth | ||
| T21, T18, T13, 45,X |
| High risk |
| Different cutpoints used for autosomes and SCAb | Fetal karyotype | ||
| T21, T18, T13, 45,X, 47, XXX, 47,XXY, 47,XYY |
| High and low risk |
| Different cutpoints used for autosomes and SCAb | Fetal karyotype or medical record from birth | ||
| T21, T18, T13, 45,X, 47,XXX, 47, XXY, 47,XYY (SCA data not shown in this review) |
| Without prior risk |
| Z score of 3 | Fetal or postnatal karyotype or medical record from birth | Triple test for T21 and T18 (cutpoint of 1 in 270). | |
| T21, T18, T13, 45,X, 47,XXX, 47,XYY |
| High risk |
| Z score of 3 | Fetal karyotype or neonatal clinical examination or both | ||
| T21, T18, T13 |
| High risk |
| MAD‐based Z score of 3 for T21; 3.2 for T18; 3.9 for T13 | Fetal karyotype | ||
| T21, T18, T13, 45,X |
| High risk |
| T score of 5 for T21 and T18; 4 for T13; 0.04 Chrom. X and 0.04 Chrom. Y for 45,X | Fetal karyotype | ||
| T21, T18, T13, 45,X, 47,XXX, 47,XXY, 47,XYY |
| High risk |
| L score of 1 and t score of 2.5 | Fetal karyotype or medical record from birth | ||
| T21, T18, T13 |
| High and without prior risk |
| risk score of 1% | Fetal karyotype or medical record from birth | ||
| T21, T18, T13, 45,X |
| High risk |
| NR | Fetal or neonatal karyotype or clinical examination at 42 days after birth or both | ||
| T21, T18, T13, 45,X, 47,XXX, 47,XXY, 47,XYY |
| High risk |
| Z score of 3 for T21, T18 and T13; ‐3 for Chrom. X and 3 for Chrom. Y for sex Chrom. classification. | Fetal karyotype or clinical follow‐up to 6 months from birth | ||
| T21, T18, T13 and SCA (SCA data not shown in this review) |
| High, low and without prior risk |
| Different cutpoints used for autosomes and SCAb | Fetal karyotype or clinical follow‐up | ||
| T21, T18, 45,X, 47,XXX (SCA data not shown in this review) |
| High risk |
| Z score of 3 for T21 (no other cutpoint reported) | Fetal or neonatal karyotype or neonatal clinical examination | ||
| T21, T18, T13 |
| High, low and without prior risk |
| L score of 1 and t score of 2.5 | Fetal or neonatal karyotype or birth outcome | ||
| T21, T18, T13 |
| High, low and without prior risk |
| L score of 1 and t score of 2.5 | Fetal or neonatal karyotype or birth outcome | ||
| TMPS | |||||||
| T21, T18 |
| High risk |
| NR (usually Harmony™ prenatal test uses FORTE risk score of 1%) | Fetal karyotype | ||
| T13 |
| High and low risk |
| FORTE risk score of 1% | Fetal karyotype or neonatal clinical examination | ||
| T21, T18, T13 |
| High and without prior risk |
| NR (usually Harmony™ prenatal test uses FORTE risk score of 1%) | Fetal or neonatal karyotype | ||
| T21, T18, T13, 45,X, 47,XXX, 47, XXY, 47,XYY (SCA data not shown in this review) |
| High and without prior risk |
| Harmony™ prenatal test: NR (usually Harmony™ prenatal test uses FORTE risk score of 1%) | Fetal karyotype or neonatal clinical examination | ||
| T21, T18, T13 |
| Without prior risk |
| NR (usually Harmony™ prenatal test uses FORTE risk score of 1%) | Fetal karyotype | ||
| T21, T18, T13 |
| High and intermediate riskc |
| NR (usually Harmony™ prenatal test uses FORTE risk score of 1%) | Fetal or postnatal karyotype or neonatal clinical examination | ||
| T13 |
| High risk |
| NR | Fetal karyotype or genetic testing of cord blood, buccal, saliva or products of conception | ||
| 45,X, 47,XXX, 47, XXY, 47,XYY |
| High risk |
| NR (usually Harmony™ prenatal test uses FORTE risk score of 1%) | Fetal karyotype | ||
| T21, T18, T13 |
| High and low risk |
| NR (usually Harmony™ prenatal test uses FORTE risk score of 1%) | Fetal karyotype or medical record from birth | ||
| T21, T18, T13, 45,X, 47,XXX, 47, XXY, 47,XYY |
| High and without prior risk |
| NR | Fetal karyotype or medical record from birth | ||
| T21, T18 |
| Without prior risk |
| Risk score of 1% | Fetal karyotype or neonatal clinical examination | First‐trimester combined test (cutpoint of 1 in 150). | |
| T21, T18, T13, 45,X, 47,XXX, 47,XXY, 47,XYY |
| High risk |
| NR | Fetal karyotype | ||
| 45,X, 47,XXX, 47,XXY, 47,XYY |
| High risk |
| FORTE risk score of 1% | Fetal karyotype | ||
| T21, T18 |
| High risk |
| FORTE risk score of 1% | Fetal karyotype | ||
| T21, T18, T13 |
| Without prior risk |
| NR (usually Harmony™ prenatal test uses FORTE risk score of 1%) | Fetal or postnatal karyotype, neonatal clinical examination or medical record from birth | First‐trimester combined test (cutpoint of 1 in 270 for T21 and 1 in 150 for T18 and T13). | |
| T21, T18, T13, 45,X |
| High and low risk |
| NR | Fetal karyotype or genetic testing of cord blood, buccal, saliva or products of conception or birth outcome | ||
| T21, T18, 45,X, 47,XXX, 47,XXY, 47,XYY |
| High risk |
| Risk score of 1% | Fetal karyotype | ||
| T21, T18, T13 |
| Without prior risk |
| NR (usually Harmony™ prenatal test uses FORTE risk score of 1%) | Fetal or postnatal karyotype, neonatal clinical examination or medical record from birth | First‐trimester combined test (cutpoint of 1 in 100 for T21). | |
| 45,X, 47,XXX, 47,XXY, 47,XYY |
| High and low risk |
| NR | Fetal karyotype or genetic testing of cord blood, buccal, saliva or products of conception | ||
| T21, T18 |
| High risk |
| NR | Fetal karyotype | ||
| T21 |
| High risk |
| FORTE risk score of 1% | Fetal karyotype | ||
| 45,X: Turner syndrome, 47,XXX: triple X syndrome, 47,XXY: Klinefelter syndrome, DANSR: digital analysis of selected regions, FF: fetal fraction DNA, FORTE: fetal‐fraction optimised risk of trisomy evaluation, MAD: Median absolute deviation, MPSS: massively parallel shotgun sequencing, NATUS: Next‐generation Aneuploidy Test Using SNPs, NCV: normalised chromosome value, SCA: sex chromosome aneuploidy, SNP: single‐nucleotide polymorphism,TMPS: targeted massively parallel sequencing, T21: trisomy 21, T18: trisomy 18 and T13: trisomy 13. aFetal karyotype include traditional banding techniques, spectral karyotype, fluorescence in situ hybridisation, array comparative genomic hybridisation or quantitative fluorescence polymerase chain reaction. bDifferent cutpoints used for autosomes or SCA as follows: Bianchi 2012: NCV of 4 (aneuploidy suspected if NCV is between 2.5 and 4) for T21, T18, and T13; NCV for Chrom. X of ‐4 and NCV for Chrom. Y of 2.5 for 45,X; NCV for Chrom. X of 4 and NCV for Chrom. Y of 2.5 for 47,XXX; NCV for Chrom. X between ‐2.5 and 2.5 and NCV for Chrom. Y > 33 for 47,XXY; NCV for Chrom. X of ‐4 and NCV for Chrom. Y of 4 for 47,XYY with NCV for Chrom. Y is two times greater than expected NCV Chrom. X. Bianchi 2013: NCV of 4 (aneuploidy suspected if NCV is between 3 and 4) for T21, T18, and T13; NCV for Chrom. X of ‐3 and NCV for Chrom. Y of 3 for 45,X. Jiang 2012: t score of 3 and logarithmic LR of 1 for T21, T18 and T13; if female fetus, t score of ‐2.5 for 45,X and 47,XXX; t score of 2.5 combined with estimation of fetal ccfDNA concentration by Chrom. X and Y independently for 47,XXY and 47,XYY. Lau 2012: Z score of 3 for T21, T18 and T13; if female fetus, Z score for Chrom. X of ‐3 for 45,X; if female fetus, Z score for Chrom. X of 3 for 47,XXX; if male fetus, Z score for Chrom. Y of 3 for 47,XXY. Lefkowitz 2016: Z score of 3 for T21; Z score of 3.95 for T18 and T13; Z scores for SCA see Mazloom 2013. Liang 2013: Z score of 3 for T21; 5.91 for T18; 5.72 for T13; ± 2.91 for Chrom. X and ± 3 for Chrom. Y for sex chromosome classification. Mazloom 2013: Z score of 3.5 for 47,XXX (non‐reportable regions between 2.5 and 3.5); Z score of ‐3.5 for 45,X (non‐reportable regions between ‐2.5 and ‐3.5); Z score of ‐3.5 for 47,XYY with Chrom. Y representation; between ‐3.5 and 3.5 for 47,XXY with Chrom. Y representation. Porreco 2014: Z score of 3 for T21; Z score of 3,95 for T18 and T13; Z score of 3.5 for 47,XXX (non‐reportable regions between 2.5 and 3.5); Z score of ‐3.5 for 45,X (non‐reportable regions between ‐2.5 and ‐3.5); Z score of ‐3.5 for 47,XYY with Chrom. Y representation; Z score between ‐3.5 and 3.5 for 47,XXY with Chrom. Y representation. Sehnert 2011: NCV of 4 (unclassified if NCV is between 2.5 and 4) for T21, T18, and T13; NCV for Chrom. Y of ‐2.0 SDs from the mean of male samples and NCV for Chrom. X of ‐3.0 SDs from the mean of female samples for sex chromosome classification. Shaw 2014: Z score of 3 for T21, T18, and T13; Z score of ‐3 for Chrom. X and 3 for Chrom. Y for sex chromosome classification. Yao 2014: T score of 2.5 for T21, T18 and T13; if female fetus, T score for Chrom. X of ‐2.5 for 45,X and 2.5 for 47,XXX; if male fetus, T score for Chrom. X of 2.5 combined with estimation of fetal ccfDNA concentration by Chrom. X (expected value of zero) for 47,XXY; if male fetus, T score for Chrom. X of 2.5 and R‐value (the ratio of the fetal DNA fraction estimated by chromosome Y to that estimated by chromosome X) between 1.8 and 2.2 for 47,XYY. cPregnant women with a first‐trimester combined test selected for their risk of fetal aneuploidy (cutpoint of 1 in 100 for high risk and 1 in 101 to 1 in 2500 for intermediate risk). | |||||||
| Company | Number of studies | Number of affected/unaffected pregnanciesa | Number of studies with pregnant women without prior risk of fetal aneuploidy | Number of studies with high‐risk pregnant women | Number of studies with mixed riskb cohort |
| Ariosa Diagnostics, Inc. | 15 | 594/32,302 | 4 | 6 | 5 |
| Bejing Genomics Institute (BGI) | 12 | 427/24,724 | 0 | 7 | 5 |
| Sequenom, Inc. | 9 | 904/8486 | 0 | 7 | 2 |
| Berry Genomics Co. Ltd | 6 | 147/3414 | 1 | 4 | 1 |
| Natera, Inc. | 6 | 276/2103 | 0 | 3 | 3 |
| Illumina, Inc. | 4 | 273/2342 | 0 | 3 | 1 |
| In‐house | 3 | 114/442 | 0 | 3 | 0 |
| Premaitha Health plc | 3 | 99/579 | 0 | 3 | 0 |
| Genome Care | 2 | 21/235 | 0 | 2 | 0 |
| CERBA | 1 | 113/745 | 0 | 1 | 0 |
| Genoma | 1 | 105/6977 | 0 | 0 | 1 |
| LabGenomics | 1 | 8/84 | 0 | 1 | 0 |
| LifeCodexx AG | 1 | 55/417 | 0 | 1 | 0 |
| Not reported | 1 | 5/148 | 0 | 1 | 0 |
| Total | 65 | 3141/82,998 | 5 | 42 | 18 |
| aWe included pregnancies with any other aneuploidy than the one under analysis with all euploid cases as "unaffected" pregnancies. bMixed‐risk cohort included a mix of pregnant women without prior risk, low risk or high risk of fetal aneuploidy. | |||||
| Study ID | Number of pregnant women enrolled | Reasons for exclusion | Number of women with results for 2 x 2 table analysis |
| 976 |
Total: 793 | 183 | |
| 400 |
| 397 | |
| 2167 |
Total: 218 | 1949 | |
| 900 |
Total: 14 | 886 | |
| 2362 |
Total: 2022 | 340 | |
| 2882 |
Total: 2366 In addition, other samples excluded from 2 x 2 tables for censored complex karyotype:
| 503 (T21) 502 (T18) 501 (T13) 489 (45,X) | |
| 2882 |
| 113 | |
| 2052 |
Total for T21 and T18: 100 | 1952 (T21 and T18) 1914 (T13) | |
| 10 |
| 9 | |
| 4664 |
| 27 | |
| 392 |
| 289 | |
| 824 |
Total: 71 (8‐plex) | 753 (8‐plex) | |
| 333 |
Total: 21 | 312 | |
| 207 |
Total: 15 | 192 | |
| 480 |
Total: 31 | 449 | |
| 7103 |
| 7082 | |
| 11,692 |
Total: 8059 | 3633 | |
| > 1000 |
Total: 936 | 64 | |
| 432 |
| 414 | |
| 308 |
| 205 | |
| 189 | NR | 189 | |
| 1228 |
Total: 67 | 1161 | |
| 155 | NR | 155 | |
| 903 | NR | 903 | |
| 375 |
Total: 202 | 173 | |
| 2340 | NR | 2340 | |
| 101 | NR | 101 | |
| 1968 |
Total: 1283 | 685 | |
| 108 | NR | 108 | |
| 93 |
| 92 | |
| 5321 |
Total: 4155 (autosomes) In addition:
Total: 4177 (SCA) | 1166 (autosomes) | |
| 435 |
Total: 23 | 412 | |
| 153 | NR | 153 | |
| 10,598 |
Total: 19 | 10,579 | |
| 1975 |
| 411 | |
| 2230 |
Total: 281 | 1949 | |
| 242 |
| 229 | |
| 177 |
Total: 5 | 172 | |
| 4002 |
Total: 922 | 3080 | |
| 18,955 |
Total: 3114 | 15,841 | |
| 4876 |
Total: 2905 | 1971 | |
| 442 |
Total: 16 | 426 | |
| 442 |
Total: 431 | 11 | |
| 1064 |
Total: 98 In addition,
| 963 (T21) 964 (T18 and 45,X) 965 (T13) | |
| 259 |
Total: 10 | 249 | |
| 242 |
| 241 | |
| 4170 |
In addition,
| 3322 (T21, T18, T13) 3201 (47,XXY, 47,XYY) | |
| 2905 |
Total: 120 | 2785 | |
| 201 |
Total: 15 | 186 | |
| 1014 |
Total: 967 | 47 | |
| 201 |
| 200 | |
| 1916 |
Total: 175 | 1741 | |
| 213 |
Total: 9 | 204 | |
| 338 |
| 167 | |
| 522 |
Total: 50 | 472 | |
| 200 | NR | 200 | |
| 918 |
Total: 17 | 901 | |
| 1100 |
Total: 52 | 1048 | |
| 595 |
Total: 91 | 504 | |
| 136 | NR | 136 | |
| 917 | NR | 917 | |
| 5950 |
| 5530 | |
| 87 | NR | 87 | |
| 306 |
| 301 | |
| 7705 |
Total: 3755 | 3950 | |
| ccfDNA: circulating cell‐free DNA, CVS: chorionic villi sampling, GA: gestational age, gNIPT: genomics‐based non‐invasive prenatal testing, NR: not reported by authors. aSecond time: sample failed the second gNIPT assay. bFirst time: sample failed the initial gNIPT assay. | |||
| Study ID | Failure rate at first attempt (%) | Repeated testsa (%) | Failure rate of repeated tests (%) | Final failure rate total (%) | Aneuploidb samples (%) | Euploidb samples (%) |
| MPSS | ||||||
| 61/244 (25%) | 0 | NA | 61/244 (25%) | NR | NR | |
| 42/892 (4.7%) | 42 (100%) with second aliquot | 6/42 (14.3%) | 6/892 (0.7%) | 2.7% | 0.4% | |
| 16/519 (3.1%) | 0 | NA | 16/356 (3.1%) | NR | NR | |
| 18/1970 (0.9%) | 0c | NA | T21 and T18: 18/1970 (0.9%) T13: 18/1932 (0.9%) | NR | NR | |
| 1/10 (10.0%) | 0 | NA | 1/10 (10.0%) | 50% | 0% | |
| 11/764 (1.4%) | 0 | NA | 11/764 (1.4%) | NR | NR | |
| 20/467 (4.3%) | 20 (100%) resequenced | 18/20 (90%) | 18/467 (3.9%) | NR | NR | |
| 100/7103 (1.4%) | 79 (79%) with new sampling | 0 (0%) | 21/7103 (0.3%) | 0% | 0.3% | |
| NR | 2 with second aliquot or resequenced were in the grey zone (between affected and unaffected) | NR | 11/184 (6%)d | 5.8% | 6.1% | |
| 1/93 (1.1%) | 0 | NA | 1/93 (1.1%) | NR | NR | |
| Autosomes: 42/1208 (3.5%) SCA: 64/1208 (5.3%) | 0 | NA | Autosomes: 42/1208 (3.5%) SCA: 64/1208 (5.3%) | Autosomes: 3.8% SCA: 29.7% | Autosomes: 3.4% SCA: 4.5% | |
| 12/424 (2.8%) | 0 | NA | 12/424 (2.8%) | NR | NR | |
| 5/10,584 (0.05%) | 0 | NA | 5/10,584 (0.05%) | NR | NR | |
| 21/432 (4.9%) | 0 | NA | 21/432 (4.9%) | 11.8% | 4.3% | |
| 110/1988 (5.5%) | 105 (95.5%) with second aliquot and 5 (4.5%) resequenced | 17/110 (15.5%) | 17/1988 (0.9%) | 1.0% | 0.8% | |
| 5/431 (1.2%) | 0 | NA | 5/431 (1.2%) | NR | NR | |
| 1/242 (0.4%) | 0 | NA | 1/242 (0.4%) | 0% | 0.5% | |
| Autosomes: 108/3430 (3.1%) 45,X and 47,XXX: 152/3430 (4.4%) 47,XXY and 47,XYY: 229/3430 (6.7%) | 0 | NA | Autosomes: 108/3430 (3.1%) 45,X and 47,XXX: 152/3430 (4.4%) 47,XXY and 47,XYY: 229/3430 (6.7%) | NR | NR | |
| 73/1814 (4.0%) | 0 | NA | 73/1814 (4.0%) | 0% | 4.0% | |
| 1/205 (0.5%) | 0 | NA | 1/205 (0.5%) | NR | NR | |
| 32/504 (6.3%) | 0 | NA | 32/504 (6.3%) | 3.5% | 6.7% | |
| 21/908 (2.3%) | 16 (76.2%) with new sampling | 2/16 (12.5%) | 7/908 (0.8%) | NR | NR | |
| 52/1100 (4.7%) | 0 | NA | 52/1100 (4.7%) | 0% | 4.9% | |
| 0 | 0 | NA | 0 | NA | NA | |
| 0 | 0 | NA | 0 | NA | NA | |
| 141/3954 (3.6%) | 141 (100%) with new sampling | 4/141 (2.8%) | 4/3954 (0.1%) | NR | NR | |
| Overall range of final assay failure for MPSS | 0% to 25% | 0% to 50% | 0% to 6.7% | |||
| TMPS | ||||||
| 3/400 (0.8%) | 0 | NA | 3/400 (0.8%) | 0% | 1% | |
| 53/2002 (2.6%) | 0 | NA | 53/2002 (2.6%) | 0% | 2.7% | |
| 29/356 (8.1%) | 26 (90%) with 2nd aliquot | 13/26 (50%) | 16/356 (4.5%) | NR | NR | |
| 9/316 (2.8%) | 6 (67%) with new sampling | 1/6 (16.7%) | 4/316 (1.3%) | NR | NR | |
| 15/207 (7.2%) | 0 | NA | 15/207 (7.2%) | 23% | 6% | |
| 99/3698 (2.8%) | 54 (54,5%) with new sampling | 20/54 (37%) | 65/3698 (1.8%) | NR | NR | |
| 4/68 (5.9%) | 0 | NA | 4/68 (5.9%) | 11.8% | 3.9% | |
| 18/432 (4.2%) | 0 | NA | 18/432 (4.2%) | NR | NR | |
| NR | NR | 14 (NR) | 14/1175 (1.2%) | NR | NR | |
| 100/2049 (4.9%) | 0 | NA | 100/2049 (4.9%) | 9.1% | 4.9% | |
| 13/242 (5.4%) | 0 | NA | 13/242 (5.4%) | 6.3% | 5.2% | |
| 5/177 (2.8%) | 0 | NA | 5/177 (2.8%) | 5.1% | 1.7% | |
| 148/3228 (4.6%) | 0 | NA | 148/3228 (4.6%) | NR | NR | |
| 488/16,329 (3.0%) | 0 | NA | 488/16,329 (3.0%) | 20.6% | 2.9% | |
| T21: 88/1051 (8.4%) T18, 45,X: 87/1052 (8.3%) T13: 86/1053 (8.2%) | 0 | NA | T21: 88/1051 (8.4%) T18, 45,X: 87/1052 (8.3%) T13: 86/1053 (8.2%) | All five chromosomes (n = 85): 15.2% | All five chromosomes (n = 85): 7.1% | |
| 10/259 (3.9%) | 0 | NA | 10/259 (3.9%) | 8.4% | 2.1% | |
| 122e/2838 (4.2%) | 110 (90.1%) with new sampling | 41/110 (37.3%) | 53/2838 (1.9%) | 4.1% | 1.8% | |
| 15/201 (7.5%) | 0 | NA | 15/201 (7.5%) | 6.3% | 7.6% | |
| 51/520 (9.8%) | 51 (100%) with 2nd aliquot | 16/51 (31.4%) | 16/520 (3.1%) NR | NR | NR | |
| Overall range of final assay failure for TMPS | 0.8% to 7.5% | 0% to 23% | 1% to 7.63% | |||
| CVS: chorionic villi sampling, FF: fetal fraction DNA, GA: gestational age, NA: not applicable, NR: not reported by authors, QC: quality control. baneuploid: proportion of failed samples of aneuploid cases out of all aneuploid tested with reference standard and gNIPT result. euploid: proportion of failed samples of euploid cases out of all euploid tested with reference standard and gNIPT result. cAuthors decided to resequence 12 samples with gNIPT results. They were in the grey zone (between affected and unaffected) and were resequenced in uniplex. All repeated tests were in affected or unaffected zone. dOnly the final failure rate was reported.The failure rate at first attempt was not reported nor the failure rate of repeated tests. eAuthor reported 123 failed tests but this number included one sample lost in the mail and so did not undergo the sequencing process. | ||||||
| Test | Number of studies | Number of affected pregnancies | Number of unaffected pregnanciesa | |
| 47,XXX | ||||
| Selected high risk pregnant women | MPSS | 5 | 8 | 5441 |
| TMPS | 2 | 6 | 580 | |
| 47,XXY | ||||
| Selected high risk pregnant women | MPSS | 7 | 14 | 6466 |
| TMPS | 3 | 8 | 827 | |
| 47,XYY | ||||
| Selected high risk pregnant women | MPSS | 7 | 11 | 6418 |
| TMPS | 1 | 3 | 169 | |
| aUnaffected pregnancies: we included pregnancies with any other aneuploidy than the one under analysis with all euploid cases as "unnon affected". | ||||
| Test subgroups | Number of studies | Number of affected pregnancies | Number of unaffected pregnanciesa | Sensitivityb % (95% CI) | Specificityb % (95% CI) | |
| Pregnancy type | ||||||
| Autosomes (T21, T18 and T13 combined), unselected population | ||||||
| MPSS | singleton | 1 | 11 | 1730 | 100 (74.1 to 100) | 99.9 (99.7 to 100) |
| TMPS | singleton | 3 | 107 | 20,468 | 95.5 (87.4 to 98.4) | 99.9 (99.8 to 100) |
| multifetal | 1 | 11 | 181 | 90.9 (62.3 to 98.4) | 100 (97.9 to 100) | |
| Autosomes (T21, T18 and T13 combined), selected high‐risk population | ||||||
| MPSS | singleton | 19 | 1087 | 11,180 | 98.3 (97.3 to 98.9) | 99.6 (99.5 to 99.7) |
| multifetal | 3 | 21 | 206 | 95.2 (72.9 to 99.3) | 100 (98.2 to 100)c | |
| TMPS | singleton | 7 | 378 | 4282 | 98.9 (97.2 to 99.6) | 99.9 (99.8 to 100) |
| SCA (45,X, 47,XXX, 47,XXY and 47,XYY combined), selected high‐risk population | ||||||
| MPSS | singleton | 7 | 101 | 4690 | 88.3 (52.9 to 98.1) | 99.3 (97.5 to 99.8) |
| TMPS | 4 | 96 | 968 | 93.8 (86.8 to 97.2) | 99.6 (98.1 to 99.9) | |
| Gestational age | ||||||
| Autosomes (T21, T18 and T13 combined), unselected population | ||||||
| MPSS | ≤29 weeks | 1 | 11 | 1730 | 100 (74.1 to 100) | 99.9 (99.7 to 100) |
| TMPS | ≤15 weeks | 4 | 118 | 20,649 | 94.9 (89.1 to 97.7) | 99.9 (99.8 to 99.9) |
| Autosomes (T21, T18 and T13 combined), selected high‐risk population | ||||||
| MPSS | ≤15 weeks | 3 | 49 | 532 | 100 (92.7 to 100)c | 100 (99.3 to 100)c |
| ≤29 weeks | 12 | 594 | 4605 | 98.3 (96.9 to 99.1) | 99.3 (99.0 to 99.5) | |
| ≤42 weeks | 13 | 729 | 7831 | 98.9 (95.0 to 99.8) | 99.9 (99.8 to 99.9) | |
| TMPS | ≤15 weeks | 2 | 128 | 498 | 99.2 (95.7 to 99.9)c | 100 (99.2 to 100)c |
| ≤29 weeks | 2 | 33 | 535 | 97.0 (84.7 to 99.5)c | 100 (99.3 to 100)c | |
| ≤42 weeks | 2 | 163 | 3084 | 99.4 (95.8 to 99.9) | 99.9 (99.7 to 100) | |
| SCA (45,X, 47,XXX, 47,XXY and 47,XYY combined), selected high‐risk population | ||||||
| MPSS | ≤15 weeks | 1 | 2 | 202 | 0.00 (0.00 to 65.8) | 99.5 (97.2 to 99.9) |
| ≤29 weeks | 5 | 58 | 996 | 86.5 (63.1 to 96.0) | 95.1 (93.5 to 96.3) | |
| ≤42 weeks | 5 | 89 | 6103 | 95.8 (80.3 to 99.2) | 99.6 (99.4 to 99.7) | |
| TMPS | ≤15 weeks | 2 | 58 | 343 | 93.1 (83.0 to 97.4) | 99.7 (98.0 to 100) |
| ≤42 weeks | 1 | 34 | 380 | 97.1 (85.1 to 99.5) | 98.9 (97.3 to 99.6) | |
| 45,X: Turner syndrome, 47,XXX: triple X syndrome, 47,XXY: Klinefelter syndrome, T21: trisomy 21, T18: trisomy 18, T13: trisomy 13 CI: confidence interval, MPSS: massively parallel shotgun sequencing, SCA: sex chromosome aneuploidies, TMPS: targeted massively parallel sequencing. aWe included pregnancies with any other aneuploidy than the one under analysis with all euploid cases as "unaffected" pregnancies. bFor two or more studies, the sensitivities and specificities are the summary estimates obtained from meta‐analysis. cSimple pooling used to obtain summary estimates of sensitivity, specificity or both. | ||||||
| Study | Sensitivity (true positives/cases) % | Difference % (95% CI) | Specificity (true negatives/unaffecteda) % | Difference % (95% CI) | ||
| MPSS | Traditional screening tests | MPSS | Traditional screening tests | |||
| 100 (11/11) | 54.6 (6/11) | 45.5 (10.0 to 72.0) | 99.9 (1729/1730) | 86.0 (1487/1730) | 14.0 (12.4 to 15.7) | |
| TMPS | Traditional screening tests | TMPS | Traditional screening tests | |||
| 100 (10/10) | 100 (10/10) | 0.00 (‐27.8 to 27.8) | 99.9 (1937/1939) | 95.5 (1852/1939) | 4.38 (3.51 to 5.40) | |
| 98.0 (49/50) | 78.0 (39/50) | 20.0 (7.44 to 33.3) | 99.9 (15,779/15,791) | 94.1 (14,860/15,791) | 5.82 (5.46 to 6.20) | |
| 91.5 (43/47) | 100 (49/49) | ‐8.51 (‐19.9 to 0.40) | 99.7 (2730/2738) | 95.6 (2663/2787) | 4.16 (3.40 to 5.00) | |
| CI: confidence interval, MPSS: massively parallel shotgun sequencing, TMPS: targeted massively parallel sequencing. aWe included pregnancies with any other aneuploidy than the one under analysis with all euploid cases as "unaffected" pregnancies. | ||||||
| Test | Number of studies | Number of affected pregnancies | Number of unaffected pregnanciesa | Summary sensitivity % (95% CI) | Summary specificity % (95% CI) | P valueb |
| Case‐control studies excluded | ||||||
| Autosomes (T21, T18 and T13 combined), selected high‐risk population | ||||||
| MPSS | 22 | 696 | 11,293 | 98.3 (95.1 to 99.4) | 99.9 (99.8 to 100) | 0.72 |
| TMPS | 4 | 219 | 3,813 | 98.6 (95.8 to 99.6) | 99.9 (99.8 to 100) | |
| SCA (45,X, 47,XXX, 47,XXY and 47,XYY combined), selected high‐risk population | ||||||
| MPSS | 10 | 98 | 5,872 | 91.9 (73.8 to 97.9) | 99.5 (98.8 to 99.8) | 0.41 |
| TMPS | 2 | 6 | 472 | 93.8 (86.8 to 97.2) | 99.6 (98.1 to 99.9) | |
| Exclusion of studies with less than 10 pregnancies with aneuploidy | ||||||
| Autosomes (T21, T18 and T13 combined), selected high‐risk population | ||||||
| MPSS | 21 | 1458 | 13,921 | 98.7 (96.8 to 99.4) | 99.8 (99.5 to 100) | 0.07 |
| TMPS | 7 | 378 | 4,282 | 98.9 (97.2 to 99.6) | 99.9 (99.8 to 100) | |
| SCA (45,X, 47,XXX, 47,XXY and 47,XYY combined), selected high‐risk population | ||||||
| MPSS | 6 | 130 | 5,761 | 94.5 (80.6 to 98.6) | 99.4 (97.6 to 99.8) | 0.28 |
| TMPS | 2 | 90 | 496 | 94.4 (87.3 to 97.7) | 99.0 (97.6 to 99.6) | |
| 45,X: Turner syndrome, 47,XXX: triple X syndrome, 47,XXY: Klinefelter syndrome, T21: trisomy 21, T18: trisomy 18, T13: trisomy 13 CI: confidence interval, MPSS: massively parallel shotgun sequencing, SCA: sex chromosome aneuploidies, TMPS: targeted massively parallel sequencing. aWe included pregnancies with any other aneuploidy than the one under analysis with all euploid cases as "unaffected" pregnancies. bThe P value indicates the statistical significance of the difference in model fit and was obtained from likelihood ratio tests comparing models with and without a covariate for test type. | ||||||
| Test | No. of studies | No. of participants |
| 1 MPSS T21 Show forest plot | 41 | 50133 |
| 2 MPSS T18 Show forest plot | 38 | 49003 |
| 3 MPSS T13 Show forest plot | 29 | 46090 |
| 4 MPSS 45,X Show forest plot | 14 | 7867 |
| 5 MPSS 47, XXX Show forest plot | 5 | 5449 |
| 6 MPSS 47,XXY Show forest plot | 8 | 6588 |
| 7 MPSS 47,XYY Show forest plot | 8 | 6629 |
| 8 MPSS all 7 aneuploidies Show forest plot | 44 | 50864 |
| 9 MPSS, autosomes Show forest plot | 43 | 50453 |
| 10 MPSS, SCA Show forest plot | 14 | 7911 |
| 11 TMPS T21 Show forest plot | 16 | 32487 |
| 12 TMPS T18 Show forest plot | 12 | 30319 |
| 13 TMPS T13 Show forest plot | 10 | 22868 |
| 14 TMPS 45,X Show forest plot | 6 | 2214 |
| 15 TMPS 47,XXX Show forest plot | 2 | 586 |
| 16 TMPS 47,XXY Show forest plot | 4 | 1021 |
| 17 TMPS 47,XYY Show forest plot | 2 | 358 |
| 18 TMPS all 7 aneuploidies Show forest plot | 21 | 35275 |
| 19 TMPS, autosomes Show forest plot | 18 | 34473 |
| 20 TMPS, SCA Show forest plot | 6 | 2214 |
| 21 Traditional screening tests, autosomes Show forest plot | 5 | 24279 |
| 22 Traditional screening tests T21 Show forest plot | 2 | 17753 |
| 23 Traditional screening tests T18 Show forest plot | 2 | 17747 |
| 24 Traditional screening tests T13 Show forest plot | 1 | 11185 |